Page 1
CONSUMERS’ INFORMATION SEARCH
WHEN MAKING INVESTMENT DECISIONS
by
QIHUA LIN
(Under the direction of Jinkook Lee)
ABSTRACT
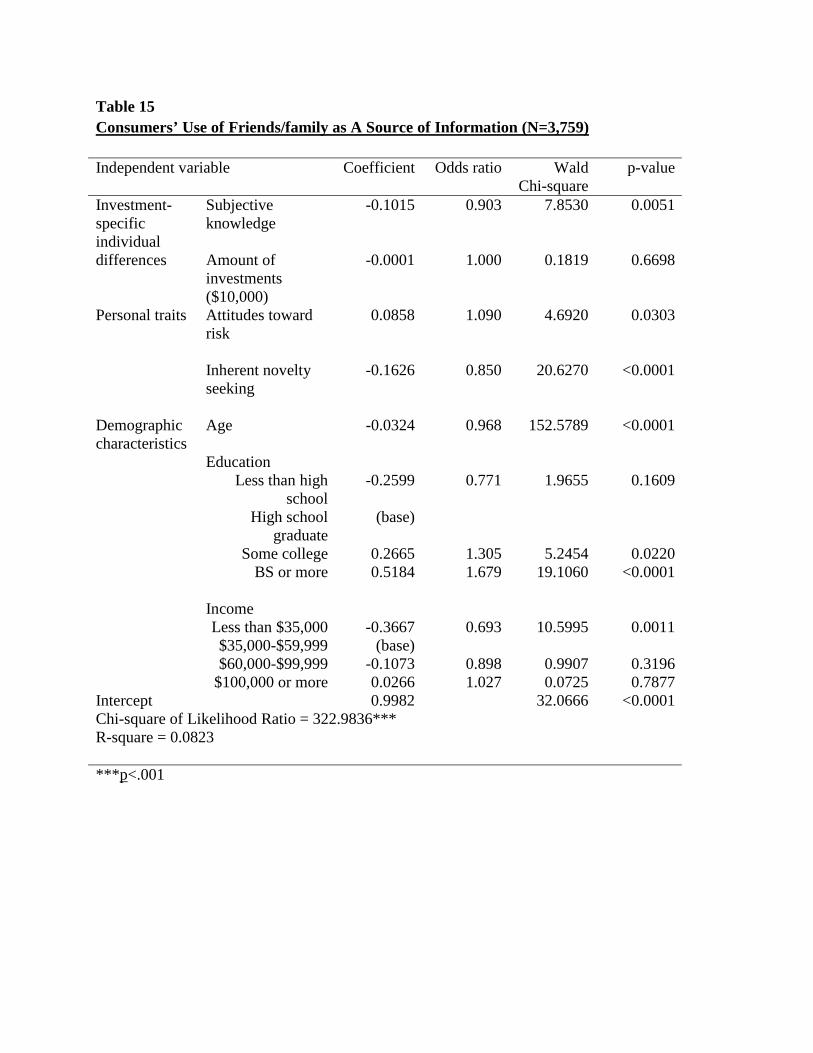
Investment decisions are decisions about future consumption as well as the purchase of intangible goods, which involve both high uncertainty and high perceived risk. Based on the literature on consumers’ information search, this study proposes that the extent of consumers’ information search is influenced by investment-specific individual differences (subjective knowledge, the amount of investment and perceived risk), personal traits (attitudes toward risk and inherent novelty seeking) and demographic characteristics (age, education and income). Consumers’ use of information sources is also investigated; the sources include literature, media, the Internet, friends/family and professional financial services providers. Using data from 2000-01 MacroMonitor, supporting empirical evidence is found for all of the proposed determinants’ impacts on consumers’ information search except education. Subjective knowledge and income are also found to significantly and differently influence consumers’ use of each of the information sources.
INDEX WORDS: Investment decisions, Information search, Information sources,
Financial investment, Consumer decision making
Page 2
CONSUMERS’ INFORMATION SEARCH
WHEN MAKING INVESTMENT DECISIONS
by
QIHUA LIN
B. E. C., Renmin University of China, China, 1999
A Thesis Submitted to the Graduate Faculty of The University of Georgia in Partial
Fulfillment of the Requirements for the Degree
MASTER OF SCIENCE
ATHENS, GEORGIA
2002
Page 3
2002
Qihua Lin
All Rights Reserved
Page 4
CONSUMERS’ INFORMATION SEARCH
WHEN MAKING INVESTMENT DECISIONS
by
QIHUA LIN
Approved:
Major Professor: Jinkook Lee
Committee: Brenda Cude Joan Koonce
Electronic Version Approved:
Gordhan L. Patel Dean of the Graduate School The University of Georgia May 2002
Page 5
iv
ACKNOWLEDGEMENTS
I would like to express my sincerest appreciation to Dr. Jinkook Lee for serving as
my major professor. Dr. Lee’s advice, encouragement and support helped me complete
not only this research project but also the whole master program. She is a role model of
professorship. My sincere gratitude is extended to Dr. Brenda Cude, who provides so
many invaluable suggestions and so much support to this project. My special thanks also
go to Dr. Joan Koonce, who generously shares her expertise in investments and time
throughout this process.
I would like to thank my parents for always encouraging me to do my best. I also owe
a special thank to my husband, Yinghao Li, who is a constant source of love and
inspiration. Without his support, I would not have completed this program.
Page 6
v
TABLE OF CONTENTS
Page
ACKNOLEDGMENTS ..................................................................................................... iv
CHAPTER
1 INTRODUCTION ..............................................................................................1
2 LITERATURE REVIEW ...................................................................................7
Investment Decisions: The Nature of Decision-Making ................................7
Theoretical Frameworks ...............................................................................11
3 A MODEL OF INFORMATION SEARCH WHEN MAKING INVESTMENT
DECISIONS.....................................................................................................20
Hypotheses Development ............................................................................25
4 METHODS .......................................................................................................38
Data ...............................................................................................................38
Measurement.................................................................................................40
Analysis.........................................................................................................48
5 RESULTS .........................................................................................................51
Factor Analysis .............................................................................................51
Descriptive Analysis .....................................................................................52
Correlation Analysis .....................................................................................60
Multiple Regression Analysis .......................................................................61
Logistic Regression Analysis........................................................................63
Page 7
vi
6 DISCUSSION...................................................................................................69
7 CONCLUSIONS AND IMPLICATIONS........................................................80
REFERENCES ..................................................................................................................87
TABLES ........................................................................................................................103
FIGURE ........................................................................................................................127
Page 8
1
CHAPTER 1
INTRODUCTION
With the sustained prosperity of the U.S. economy, the investment1 market has grown
dramatically during the past decade. The Dow Jones Index started at around 60 points in
1900 and reached 3,000 points by 1992 (Ley, 1996). The index rose from 3,000 points to
10,000 points during 1992-2000. As a result, the investment service industry has
experienced a phenomenal explosion. By the end of 1997, there were a total of 19,869
securities brokerages with the annual sales of $72,756.5 million and 7,807 investment
advice establishments with the annual sales of $9,398 million (US Bureau of Census,
1997).
Consumers engage in investment activities by purchasing financial products, such as
certificates of deposits (CDs), stocks, bonds, and mutual funds, directly from the
producers of the investment products or indirectly through intermediaries such as brokers
and financial planners. As a product, investments have distinct characteristics compared
to tangible goods. First, investment products are intangible goods. They cannot be felt,
touched, or tasted as can tangible goods. The value of the investment is the embedded
right of reaping the subsequent benefits, instead of the tangible media that investors
physically hold as proof of their ownership of the investment products (e.g. paper
certificates). In other words, consumers purchase investment products to earn investment
income derived from these products, such as interest, dividends and/or capital gains.
1 In this study, investments refer to financial assets (CDs, stocks, bonds, mutual funds), not real assets, such as real estate, collectibles, etc.
Page 9
2
Also, unlike tangible goods, the performance of investment products actually depends on
the performance of the parties that produce the investment products, such as the company
who issues the stocks, which is further affected by micro- as well as macro-economic
factors.
When making investment decisions, investors tend to find a balance between the
predicted investment income and the predicted risk of losses, both of which can be
actually realized only when return is received or loss takes place. When making new
investment decisions, new predictions have to be made rather than just relying on past
experience. Therefore, compared to other types of goods, investment products have more
credence characteristics about which consumers are uncertain even after the purchase.
The value of certain types of investment products is always subject to change because
there are many types of risk, such as purchasing power risk, interest rate risk, business
risk, financial risk and market risk. The change in the values of the investments is
dramatic sometimes. The risk of loss in the investment markets may be larger than in
tangible goods markets.
The decision-making for investment products can be described within the framework
of consumer purchase decision-making, which is depicted as a series of steps that include
problem recognition, information search, evaluation of alternatives, purchase decision,
and post-purchase behavior (Schmidt & Spreng, 1996). Under this framework,
information search is one of the critical elements of consumer decision-making
(Malhotra, 1983; Moore & Lehmann, 1980; Newman, 1977). Information plays an
essential role in purchasing decisions, especially for investment products. Benefits of
searching for information could be getting products with higher benefits per dollar spent
Page 10
3
or increased satisfaction with the products and/or decisions (Bettman, 1979; Punj &
Staelin, 1983). Searching for information also reduces risk, a major benefit of
information search noted by Bennett and Harrel (1975).
Consumers might engage in more search activities before making investment
decisions than they do before purchasing other goods. Previous researchers provided two
different reasons. First, consumers tend to engage in more extensive search activities
when purchasing products that carry more risks (Beatty & Smith, 1987; Capon & Burke,
1980; Cunningham, 1967b; Moore & Lehmann, 1980; Srinivasan, 1987). Second, time
spent on information search tends to be higher for search than for experience goods and
for credence than for search goods (Mitra, Reiss & Capella, 1999). Since investment
decisions are high risk and have high credence characteristics, consumers are expected to
engage in extensive search activities when making investment decisions.
Consumers may get information from a variety of information sources, including
books, journals, the Internet, friends/relatives, expert investors, persons at the workplace
or professional financial advisors. Some consumers tend to collect their own information
through books, journals, the Internet and/or personal acquaintances, while others are
more likely to rely on intermediaries to obtain information. For example, those who have
full-service stock brokerage accounts tend to obtain information by asking advice or
questions from their brokers.
Even though numerous studies have investigated consumer information search
behavior, the literature, in general, seems to have developed without much distinction
between intangible goods and tangible goods. Most studies have empirically investigated
tangible goods, but few have focused on intangible goods, such as credit (Chang &
Page 11
4
Hanna, 1992; Lee & Hogarth, 2000a, 2000b). Therefore, our understanding of consumer
information search regarding investments is very limited both conceptually and
empirically. Two questions are unanswered. One is whether consumers’ information
search behavior when making investment decisions is similar to that when purchasing
tangible goods. Another is whether consumers’ information search behavior when
making investment decisions is affected by the same factors that influence information
search when the purchase is tangible goods.
The purpose of this study is to better understand the nature of investment decisions as
well as consumers’ information search behavior when making investment decisions.
Specifically, this study will identify the factors that will affect consumers’ information
search for investments and the factors that will affect consumers’ choice of information
sources. Empirically the relationships between these factors and consumers’ information
search behavior will be investigated using data from 2000-01 MacroMonitor, which is a
comprehensive database of consumer attitudes, behaviors and motivations in terms of
financial products.
This study is based on Schmidt and Spreng’s (1996) model, which incorporated three
major theoretical streams of consumer information search literature: the economics
approach, the psychological/motivation approach, and the consumer information
processing approach, as noted by Srinivasan (1990). According to Schmidt and Spreng
(1996), consumers’ motivation and ability to search, as well as the costs and the benefits
of searching for information, are mediators between the antecedents and consumers’
information search.
Page 12
5
Based on a review of the literature on consumer information search, the following
factors are identified as influencing consumers’ information search: investment-specific
individual differences, personal traits, and demographic characteristics. Specifically,
investment-specific individual differences include individuals’ subjective knowledge,
perceived risk and the dollar amount of investments. Personal traits include inherent
novelty seeking and attitudes toward risk. Consumers’ demographic characteristics
include age, education, and income level. Consumers’ choice of information sources is
expected to be affected by their subjective knowledge and income level.
On the basis of Schmidt and Spreng’s (1996) model, consumers’ information search
behavior when making investment decisions depends on their motivation to search and
their ability to search, both of which are further affected by the above antecedents. The
perceived costs and benefits of search are hypothesized to determine a consumer’s
motivation to search, while ability to search is influenced by a consumer’s subjective
knowledge, education, and age. Furthermore, investment-specific individual differences
(i.e. subjective knowledge, perceived risk and the amount of investment) and personal
traits (i.e. inherent novelty seeking and attitudes toward risk) are expected to affect a
consumer’s perceived benefits of search for information. A consumer’s subjective
knowledge and income level are proposed to exert influence on his/her perceived costs of
search.
A set of hypotheses is developed based on the literature and empirically examined
using data from 2000-01 MacroMonitor. However, because of the unavailability of data
in the secondary dataset for the variables motivation to search, ability to search,
perceived benefits, perceived costs and perceived risk, hypotheses associated with these
Page 13
6
variables are not included in the empirical analysis. Therefore, the theoretical mechanism
between consumers’ information search and the antecedents through mediators remains
conceptual.
By identifying the factors influencing consumer information search behavior when
making investment decisions, this study will contribute to the limited literature on
consumer information search for intangible goods, especially for investment products.
This study also recognizes the difference among information sources and investigates the
factors that influence investors’ choice of different information sources. The findings of
this study will also provide insights for marketers of investment products and services.
They could find their target clients and better meet their customers’ needs by
understanding consumers’ characteristics and how they search for information about
investments. Finally, consumer educators and financial planners and counselors could get
insights on how to help consumers with their investment decision-making.
Page 14
7
CHAPTER 2
LITERATURE REVIEW
This chapter consists of a review of the literature on investment decisions and
consumer information search. It starts with a discussion of the nature of investment
decision-making. Then, theoretical frameworks are developed from the review of
different conceptual approaches to consumer information search. Three major paradigms
of consumer information search are introduced. A model of information search when
making investment decisions is developed based on the literature review and presented
with a set of hypotheses in the following chapter.
Investment Decisions: The Nature of Decision-Making
Future consumption
According to economic utility theory, an individual’s investment decision is viewed
as a choice of the tradeoffs between immediate consumption and deferred consumption
(Neumann & Morgenstern, 1947). Nagy and Obenberger (1994) stated that investment
decisions are made on the basis of a comparison of the benefits derived from immediate
consumption versus the benefits yielded by investments. Immediate consumption refers
to the process by which consumers purchase goods and services today to meet their
various needs, and benefit or satisfaction is derived directly from the consuming process.
The benefits of deferred consumption are the returns to the investment products that
consumers purchase.
Page 15
8
The difference between the utility functions for investment products and other goods
results in a difference between the decision-making processes for investments and for
other goods and services. When searching for a good or service, consumers tend to
compare the good or service with their needs and preferences. For example, a consumer
buys coffee in order to meet his/her need for a beverage and will choose a brand that is
consistent with his/her taste. On the other hand, the choice of an investment is dependent
upon the expected volume of the monetary returns. The money returns of the investments
cannot yield direct utility to consumers unless consumers spend the money to consume
goods and services.
Intangibility
Intangibility is one of the traditional cues that differentiate services from goods. Hill
(1999) argued that this distinction between goods and services is erroneous and confusing
and should be replaced by a new taxonomy consisting of tangible goods, intangible goods
and services. As entities of economic value, goods have the following characteristics:
they exist independently of their producers and consumers, their ownership rights can be
established, they are exchangeable, and production and trading of goods can be
conducted at different times and locations. On the other hand, the production and
consumption of services cannot be separated, and the production of services must be done
with the agreement, cooperation and participation of the purchasers.
Furthermore, Hill (1999) maintained a distinction between tangible goods and
intangible goods. Intangible goods have all of the economic characteristics of goods,
which distinguish them from services even though services also have intangible qualities.
Page 16
9
While compared to tangible goods, intangible goods are entities that exist non-physically
and have to be recorded and stored on physical media.
Investment products should be classified as goods, not services. Investment products
possess all of the characteristics of goods. They have economic value, which is measured
by market prices. The investor obtains exclusive ownership rights of investment products
once he/she purchases the products and the investment products are independent entities
that can be exchanged among investors at different places and times.
Furthermore, investment products are intangible goods. What investors purchase is
the ownership rights to reap the investment return, which cannot be seen, felt, tasted or
touched in the same manner that tangible goods can be sensed. The certificates of
investment that investors physically hold are just the medium that records and stores the
rights.
Uncertainty
Keynes (1976) noted that uncertainty about the future return of some investments is
inevitable, since the utility of a trader’s commitment depends on unknown states of the
environment in the financial markets. Fishburn (1988) stated that decision-making under
uncertainty refers to decisions, which yield outcomes related to uncertain events with
unknown probability. The values of investment products are dependent upon many future
events (Arrow, 1988) with unknown probability in advance; investors will not be certain
about the actual results until they sell the investment products. To make decisions,
investors have to form expectations about the unknown realization of market outcomes
(Strassl, 1986). Research has demonstrated that investors often base investment decisions
on the products’ prior performance (Moore, Kurtzberg, Fox, & Bazerman, 1999; Sirri &
Page 17
10
Tufano, 1998). However, research on whether an investment’s historical performance can
predict its future performance has reached contradictory conclusions (Sirri & Tufano,
1998). Moreover, in a hypothetical experience, Moore et al. (1999) found that most
participants consistently overestimated both the future and past performances of their
investments.
Perceived risk
Perceived risk represents consumers’ uncertainty about the purchase decisions and the
consequences of unfavorable purchases (Bettman, 1973; Cunningham, 1967a; Derbaix,
1983; Mitra, Reiss, & Capela, 1999; Schiffman, 1972). In the literature, the types of risks
perceived by consumers are: financial risk, performance risk, physical risk, social risk
and psychological risk (Jacoby & Kaplan, 1972; Kaplan, Jacoby, & Szybillo, 1974).
When purchasing investment products, consumers may bear greater risk than when
buying other goods. First, the financial risk in terms of investments has two dimensions.
The investment generally involves a relatively large amount of money. According to the
Survey of Consumer Finances, the total value of households’ stockholdings was about
35% of the households’ total assets and almost equal to the total value of residential
property at the end of 1998 (Bertaut & Starr-McCluer, 2000). The consequence of a
“bad” investment will cost the investor a lot. Meanwhile, the financial risk should also
take into account the opportunity cost, which includes the return to an alternative
investment as well as the time and money involved with the investment.
Second, the performance of investment products actually refers to the performance of
the producers of the investment products. Investing is well known as a risky activity,
because the value of the investments is always changing along with the performance and
Page 18
11
prospective of the economic institution, which is further influenced by micro-economic
factors inside and macro-economic factors outside. Keeble (2001) suggested that without
help to make and carry out a significant investment decision most people would make
such decisions in the dark because they “do not have the time, training, talent and
temperament to do their own investing” (p.123). Sirri and Tufano (1998) also suggested
that most retail investors lacked formal training and that few investors had up-to-date
information about the potential investment.
Third, for most investors, if an investment ends up in a loss, they must endure a large
amount of social and psychological pressure. The social risk tends to be greater for a
significant investment. A significant investment loss could result in the loss of social
status. Psychologically, investors often worry about the risks associated with the
investment and must deal with the frustration of a loss.
Theoretical Frameworks
Srinivasan (1990) noted that there are three major theoretical streams in the literature
of consumer information search: the economic, the psychological and the information
processing approach. In this section, each of the approaches is introduced, and previous
research devoted to integrating the different approaches is discussed.
Economic approach
The economic approach attempts to understand why consumers engage in information
search activities in terms of the costs and benefits of search. This framework has been
prevalent in the information search literature since Stigler’s (1961) seminal article on the
economics of information. Utility maximization and imperfect information are two
important assumptions in the economics of information theory. According to Stigler,
Page 19
12
rational consumers always try to maximize utility; however, it is impossible for them to
know about all of the prices at a given time due to constant changes in market prices.
Thus, consumers tend to search among various sellers for a favorable price in a market
with price dispersion.
Theoretically, increased search results in diminishing returns, which is indicated by a
reduced expected minimum price. Therefore, the optimal amount of search that a
consumer will engage in is determined by the marginal cost of search and the marginal
return of search. The basic idea of the economics of information search remains intact
even though Stigler’s model has been refined in different dimensions by a number of
researchers (Butters, 1977; Kohn & Shavell, 1974; Ratchford, 1982; Rothschild, 1973;
Salop, 1976; Stiglitz, 1979; Telser, 1973; Weitzman, 1979).
The fundamental implication of the economic perspective is that search for
information is negatively related to the costs of search and positively related to the
benefits of search. The trade-off between the costs and benefits of search helps one to
understand differences in consumers’ information behavior by its parsimony and intuitive
appeal (Srinivasan, 1990).
Gutman (1982) and Olshavsky and Wymer (1995) defined the benefits of search as
outcomes that increase one’s utility or provide value by facilitating achievement of a
higher level of goals or values. The benefits of search could be obtaining products with
lower prices or better style/appearance or higher quality, or increased satisfaction with
the products and/or decisions (Bettman, 1979; Punj & Staelin, 1983). Another major
benefit of search for information is the reduction of risk (Bauer, 1960; Bennett & Harrel,
1975; Howard & Sheth, 1969). Studies have found a positive relationship between
Page 20
13
perceived benefits of search and search activities (Duncan & Olshavsky, 1982; Srinivasan
& Ratchford, 1991). For investments, the benefits of search for information include
purchasing products with lower costs and/or with better appreciation potential that enable
a higher potential return, a reduction in the risk, increased satisfaction with the decision
and accumulation of investment knowledge that contributes to one’s stored knowledge.
As proposed by Schmidt and Spreng (1996), perceived benefits will positively affect the
motivation to search.
The construct of cost of search refers to what consumers must sacrifice to obtain and
process information (Bloom, 1989; Russo, 1988; Russo & Leclerc, 1991; Sepstrup 1980),
including direct costs and indirect costs. The direct costs of search are the monetary
expenditure, time sacrifice, physical effort and psychological sacrifice (Bettman, 1979).
The indirect cost is the opportunity cost or the expected utility of the alternative use of
time. Many costs are associated with search for investment decisions. For example, do-it-
yourself investors must purchase informational materials and spend a lot of time
observing market changes, while consumers who are customers of financial advisors
must pay for the services they obtain.
Perceived costs of search will negatively affect the motivation to search (Bettman,
1979; Farley, 1964; Stigler, 1961). Empirically, Punj and Staelin (1983) as well as
Srinivasan (1986) found that information search decreased with increased costs. In this
study, consumers’ subjective knowledge and income levels are identified to affect their
perceived costs of search and therefore their information search behavior.
Page 21
14
Psychological approach
The psychological approach was dominant in the literature of marketing and
consumer behavior, especially in empirical research in the 1970s and 1980s. From a
psychological perspective, determinants of consumers’ information search behavior have
been identified, including individual characteristics (e.g., personality traits), types of
product (e.g., durable versus non-durable goods), and task-related variables (e.g.,
importance of product and time pressure). The psychological approach is rooted in
Howard and Sheth’s (1969) motivational approach, which posited that attention, which is
regulated by the stimulus ambiguity-arousal relationship, is the motivational basis of
search. A buyer uses attention as the first source of control to meet the information
requirements within the limitation of the stimuli to which he/she is exposed. He/she will
be motivated to engage in overt search, that is, the second method of control, when the
first source is not adequate. Stimulus ambiguity elicits arousal, which activates external
search until a buyer obtains necessary information to make a decision.
Thus, motivation is the key component in the psychological paradigm. Motivation is
the desire to expend effort on a task, influencing both the direction and intensity of the
behavior (Bettman, 1979). According to Simon (1967), motivation is the mechanism that
governs the movement from one state to a desired end state. Within this motivation
context, Engel, Kollat and Blackwell (1972) conceptualized information search as a part
of the decision process, which moves a consumer from the problem recognition state to
the decision-making state. Schiffman and Kanuk (1983) suggested that motivation is the
result of a state of tension produced by unfilled needs and that it acts as a driving force
that impels a person to action. They noted that motivation can either be positive or
Page 22
15
negative, representing a driving force toward or away from a state of conditions. In this
tradition, researchers viewed motivation as the driving force for consumers to engage in
search activities (Burnkrant, 1976; Hansen, 1972; Howard, 1977; Howard & Sheth, 1969;
Nicosia, 1966).
Motivation can stem from multiple directions. First, motivation can come from one’s
goal-orientation, which differentiates optimizers from satisfiers (Srinivasan, 1990; Swan,
1969; Wright, 1975). The “conservation utility” (Srinivasan, 1990, p. 171), a switch-point
at which a consumer decides whether or not to continue searching, is higher for
optimizers than for satisfiers. Thus, an optimizer tends to do a more thorough search than
a satisfier.
Second, motivation can come from a consumer’s involvement with a particular
product, which implies perceived importance (Bloch & Richins, 1983). Greater
involvement with a product indicates greater motivation to search for information related
to that particular product (Beatty & Smith, 1987; Schmidt & Spreng, 1996).
Howard (1977) suggested that epistemic pleasure and willingness to subject oneself
to cognitive strain also influence motivation. That is, motivation is rooted in the
relationship between stimulus ambiguity and arousal, and the tolerance for ambiguity
varies across individuals.
Furthermore, perceived benefits and costs of information search, the two major
components in the economics approach, also provide motivation for search (Srinivasan,
1987, 1990; Schmidt & Spreng, 1996). In this sense, the psychological paradigm is a
more general approach, because it seeks to understand the varieties in consumers’
information search behavior beyond the cost-benefit analysis but still incorporates the
Page 23
16
economic perspective. An advantage of the combination of the psychological and
economic perspectives is that “the behavioral theory can be given an economic
interpretation, and the economic theory be enriched by relating it to empirical findings in
the behavioral literature” (Moorthy, Ratchford & Talukdar, 1997, p. 264).
Schmidt and Spreng (1996) defined motivation as the desire to expend effort on
information collection and procession, involving both direction and intensity. This study
conceptualized motivation as the desire to expend effort in gathering and processing
information for investment products, which affects what types of external sources
investors use and how much they search (the extent of search). Note that the motivation
to search refers to the positive direction, which means an action toward information
search.
Information processing approach
The information processing approach has evolved from the psychological viewpoint,
but focuses exclusively on the role of memory and the limitation in human information
processing capacity (Bettman, 1979; Schmidt & Spreng, 1996; Srinivasan, 1990;
Sternthal & Craig, 1982). Using this approach, information search is divided into internal
search and external search. External search is “the degree of attention, perception and
effort directed toward obtaining environmental data or information related to the specific
purchase under consideration” (Beatty & Smith, 1987, p. 85). Internal search refers to the
process by which a consumer recalls what has already been stored in the memory
(Schmidt & Spreng, 1996).
While Bettman (1979) posited that an internal search is usually performed initially,
followed by external search if there is insufficient information in memory to make a
Page 24
17
decision, Srinivasan (1990) suggested that internal and external search may be
intertwined. A consumer may perform internal search first, jump to external search when
encountering a lack of information or a conflict, but will resume the internal search again.
This alternation process will continue until sufficient information is obtained to make a
decision.
In the information processing literature, ability to search is a determinant of
consumers’ information search (Bettman, 1979; Bettman & Park, 1980; Petty &
Cacioppo, 1986). Schmidt and Spreng (1996) defined perceived ability to search as “the
perceived cognitive capacity of searching for and processing information” (p. 248). They
specified that the ability to search involves cognitive processing ability, knowledge of
how to search for information and knowledge of where to search for information (Brucks,
1985; MacInnis, Moorman, and Jaworski, 1991). In this study, consumers’ perceived
ability to search refers to consumers’ ability to choose appropriate information sources,
their ability to gather useful information and their ability to understand and remember the
information.
In the literature, prior knowledge, experience and familiarity have been
conceptualized, which imply one’s ability to search for information. Prior information
stored in the memory has an effect on external search by the allocation of attentional
capacity to the information (Lynch & Srull, 1982) and by the cognitive effort of
processing new information (Johnson & Russo, 1984; Srinivasan, 1990).
According to Bettman and Park (1980), the extent of information search depends on
one’s motivation and one’s ability to search and higher ability induces increased
information search activities. Empirically, consumers’ ability is positively related to
Page 25
18
information search (Srinivasan, 1987). In purchasing televisions, the perceived ability to
judge products and brands had a positive effect on consumers’ information search
(Duncan and Olshavsky, 1982). In this study, one’s subjective knowledge, educational
attainment and age are believed to influence one’s ability to search.
The information processing capacity constraints inherent in humans is the other
emphasis of the information-processing viewpoint. Miller (1956) stated that “the span of
absolute judgment and the span of immediate memory impose severe limitations on the
amount of information that we are able to receive, process and remember” (p. 85). It is
not realistic or tenable for an individual to process an unlimited amount of information
(Wilkie, 1972). Bettman (1979) suggested that the limited capacity has to be allocated,
and that simplifying heuristics have to be used to reduce the amount of information
processed. Therefore, the information processing limitations provide at least a partial
explanation for individual differences in external information search (Srinivasan, 1990).
In sum, the three approaches contribute to our understanding of the varieties in
consumers’ information search behavior from different perspectives. The approaches are
complementary rather than competing. However, a majority of the previous studies on
information search were conducted on the basis of one or even two approaches. A notable
exception is Schmidt and Spreng (1996), who proposed a comprehensive model of
information search that incorporated all three approaches.
In Schmidt and Spreng’s (1996) model, information search is determined by
motivation and perceived ability to search, and perceived benefits and costs are proposed
to affect motivation to search. They defined motivation, perceived ability to search and
perceived benefits and costs as follows. Motivation to search referred to the desire to
Page 26
19
expend effort to collect and process information. Perceived ability to search was defined
as the perceived cognitive capability of searching for and processing information, which
involves processing ability as well as knowledge about how and where to search for
information (Brucks, 1985; MacInnis, Moorman, & Jaworski, 1991). Perceived benefits
of search were defined as the increased utility or values that could facilitate achievement
of higher-level goals or values (Gutman, 1982; Olshavsky & Wymer, 1995). Perceived
costs included perceived money expenditure, time, physical effort and psychological
sacrifice as stated by Bettman (1979).
Schmidt and Spreng’s (1996) model extended previous literature by bringing together
the economic approach, the psychological approach and the information processing
approach. Furthermore, their model allowed some variables, such as knowledge, to exert
multiple effects on information search through different mediators. This approach
increases our understanding of the effects of the variables exerting multiple effects.
Page 27
20
CHAPTER 3
A MODEL OF INFORMATION SEARCH WHEN MAKING INVESTMENT
DECISIONS
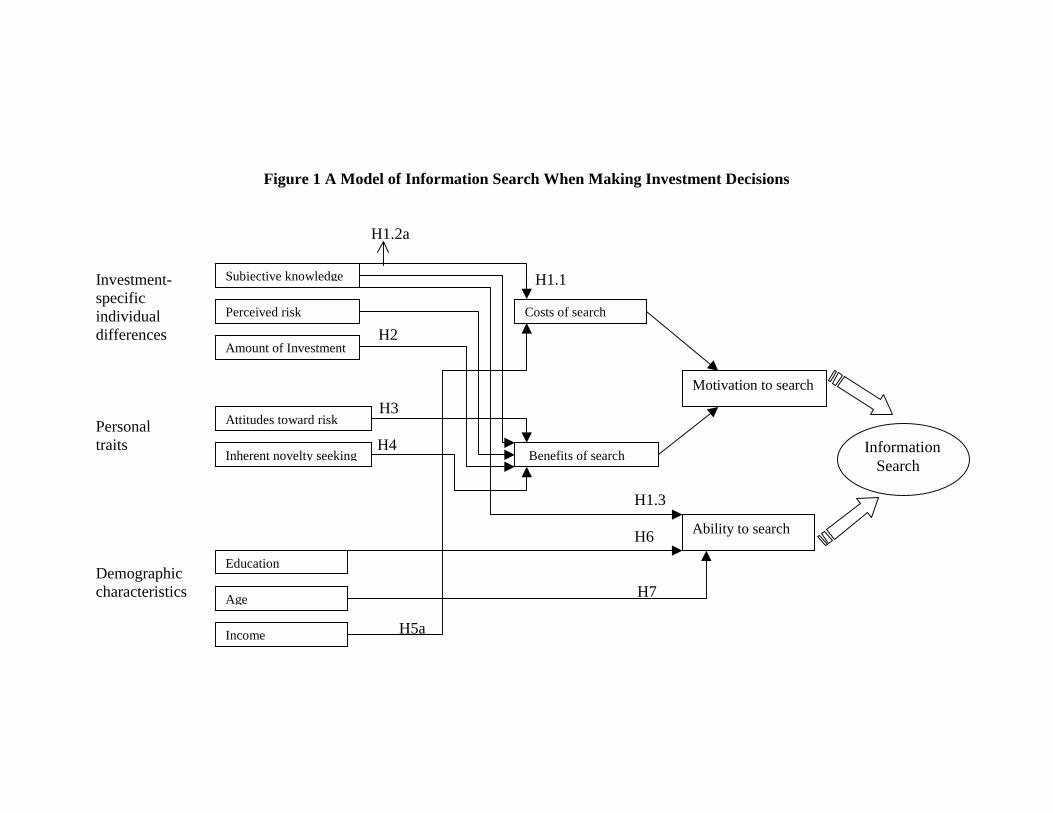
Based on Schmidt and Spreng’s (1996) model, this study establishes a model of
consumer information search for investment products (Figure 1). The model proposes
that consumers’ information search for investment products is influenced by investment-
specific individual differences, personal traits and demographic characteristics. In
particular, investment-specific individual differences are consumers’ subjective
knowledge of investments, perceived risk, and the amount of the investments. Personal
traits include consumers’ inherent novelty seeking and their attitudes toward investment
risk. Demographic characteristics are age, education and income. Conceptually, the
effects of the above antecedents on consumers’ information search are mediated by
consumers’ perceived benefits and costs of search and their motivation and ability to
search. The hypothesized relationships of these variables will be discussed in detail in the
following section on hypothesis development.
Consumer information search behavior can be described in terms of three
fundamental behaviors: from which sources consumers search information, how much
information consumers search, and how consumers search for information. In the
literature, the three aspects are generally conceptualized as consumer information search
sources, extent, and strategies/patterns. This study investigates consumers’ information
Page 28
21
search behavior in terms of the extent of information search and the information sources
used.
Extent of information search
Among the three fundamental questions about consumer information search behavior,
the extent of information search receives the most attention in the literature. Most of the
previous search literature defined search as “the degree of attention, perception, and
effort directed toward obtaining environmental data or information related to the specific
purchase under consideration” (Beatty and Smith, 1987, p. 85). However, Schmidt and
Spreng (1996) argued that information obtained independent of a specific imminent
purchase, defined as “ongoing search” by Bloch, Sherrell, & Ridgway (1986, p. 120),
should also be included to form a more comprehensive model. Ongoing search is
different from prepurchase search, which refers to information search activities and
processing that facilitate decision-making about a specific purchase (Kelly, 1968). These
two types of search are differentiated on the basis of the purposes of the search - whether
or not the search will lead to a purchase decision.
Even though the differentiation is conceptually useful, it is very difficult in practice
(Bloch, Sherrell, & Ridgway, 1986). For example, an outside observer is not able to
distinguish the activities involved in these two types of search. Moreover, rather than a
specific purchase consideration, hedonic value may be a major goal of the shopping
behavior for some consumers (Babin, Darden, & Griffin, 1994). The information that a
consumer accumulated in previous search could greatly affect his/her future information
search behavior through the role of knowledge.
Page 29
22
With regard to investment products, a sophisticated investor typically tracks an
investment product for quite a long time, accumulating a lot of information before
making a purchase decision. The search activity is a prolonged process instead of a
temporary action. Therefore, it is hard to distinguish ongoing search from prepurchase
search for investments. Therefore, in this study, the extent of search is defined as the
degree of attention, perception, and effort direct toward obtaining information associated
with investment products and investment markets, regardless of whether the search is
related to a purchase consideration.
Sources of information
As discussed earlier, sources of information can be categorized as internal and
external (Beales, Mazis, Salop, & Staelin, 1981; Moore & Lehmann, 1980). Internal
sources refer to a consumer’s memory where information that was accumulated from
previous searches, experience with the products or passively acquired information during
daily routine has been stored and from which it can be retrieved (Archibald, Haulman &
Moody, 1983; Beales, Mazis, Salop, & Staelin, 1981; Punj & Staelin, 1983). External
sources include salespersons, friends and relatives, expert consumers, books, magazines,
newspapers, TV advertisements, radio programs, government and independent rating
agencies and in-store displays. Search from internal sources is the so-called “internal
search” (Beales, Mazis, Salop, & Staelin, 1981; Beatty & Smith, 1987; Bettman, 1979;
Moore & Lehmann, 1980), which is difficult to directly investigate (Moore & Lehmann,
1980; Nisbett & Wilson, 1977). Thus, this study will focus on consumer search for
information from external sources.
Page 30
23
Substantial research has attempted to categorize external information sources. It
appears that the classification of information sources is made on the basis of where the
information comes from and/or who provides the information. Claxton, Fry and Portis
(1974) divided external sources into in-store and out-of-store sources. According to
Capon and Lutz (1979), external sources include independent (e.g. various agencies and
levels of government, independent rating agencies and organizations that certify the
quality of products), commercial (e.g. manufacturers, retailers and trade associations),
and consumer-oriented (e.g. friends, relatives, and neighbors) information sources.
Beales, Mazis, Salop, & Staelin (1981) categorized external sources as neutral sources,
seller-controlled sources and direct inspection. At the same time, Kiel and Layton’s
(1981) classification includes retail, media and personal. Beatty and Smith (1987)
expanded Kiel and Layton’s classification to include neutral sources. Most recently,
Schmidt and Spreng (1996) divided information sources into five groups: marketer-
controlled (e.g., personal selling, advertising, product information on package, product
brochures), reseller information (e.g., catalogs by reseller, information charts and
consultants), third party, personal and direct inspection.
It is important to note that most of the previous studies on sources of information are
related to information search for tangible goods. With respect to investment products,
information sources and its classification need more attention. Most importantly, in
addition to the traditional sources, such as books, TV, radio, friends/relatives, sales
persons, and third parties, the Internet and professional financial services providers are
prevalent sources of investment information.
Page 31
24
A number of researchers have documented the significance of personal sources in
diffusing market information and influencing consumer choices (Childers & Rao, 1992;
Higie, Feick, & Price, 1987; Price, Feick, & Higie, 1987). Research has demonstrated
that consumers frequently name information from personal sources in describing their
search efforts and identify it as particularly influential in consumer decision-making (Kiel
& Layton, 1981; Murray, 1991; Newman, 1977; Price & Feick, 1984; Yale & Gilly,
1995). Personal sources include professional financial services providers (brokers,
financial planners, and other professionals), friends/relatives, experienced investors, and
third party agents. Among the personal sources, there is a fundamental difference
between professional financial services providers and other personal sources. Consumers
must pay for the advice they obtain from financial professionals either by fees or
commissions that are typically high while advice from other personal sources has no
monetary cost. The usefulness of the information from various sources may vary. For
example, information from a financial professional may be objective and up-to-date,
while information from friends and family may be obsolete, and information from
experienced investors may be biased (Morgan, 1988). On the other hand, friends and
relatives may provide advice on products more suitable for a consumer because they tend
to know his/her preference better than others. Another difference between financial
services providers and other personal sources is that the latter may be more time-
consuming to use than the former. Thus, it is important to differentiate professional
financial services providers from other personal sources of information. Interpersonal
communication is believed to convey richer information than written communication
because interpersonal conversation involves direct communication between
Page 32
25
communicating parties and many visual cues. Therefore, this study also maintains the
distinction between personal sources and impersonal sources.
Impersonal sources include written material (e.g. books, brochures, reports,
magazines), media (e.g. TV, radio programs), and the Internet. The Internet has been
identified as the "latest super-diffusion technology" because of its dramatic growth and
global scope as a communication medium (Dickson, 2000; Ratchford, Lee & Talukdar,
2001). It has become a very important source of information for consumers because the
Internet has many distinct advantages. A huge amount of information is widely available
on the Internet, and the information is updated frequently and quickly. Search from the
Internet is fast and costless. The cost of search from the Internet is less than searching in
the store (Lal & Sarvary, 1999). Thus, this study classifies impersonal sources as written
material, media and the Internet. On the other hand, impersonal sources are somewhat
similar to each other for investment products as there are strict regulations on information
disclosure and investors tend to search for information from impersonal sources
independent of the influence of other people. In sum, in this study the sources of
information that are used during external search are classified into five categories:
literature, media, the Internet, friends/family and professional financial services
providers.
Hypotheses Development
This study incorporates the economic, psychological and information processing
approaches and proposes that consumers’ information search for investment products is
influenced by investment-specific individual differences, personal traits and demographic
characteristics.
Page 33
26
Subjective knowledge
As discussed earlier, an individual’s memory acts as an internal source of information
from which prior knowledge can be retrieved and used in the external search. Beatty and
Smith (1987) defined product class knowledge as “the individual’s perceived knowledge
and understanding of products within a particular product class and it includes experience
with the product” (p. 88). They found a negative relationship between consumers’
product class knowledge and the total search effort across product categories.
In studying consumer information search behavior for new automobiles, Punj and
Staelin (1983) distinguished prior knowledge into two components: directly relevant
knowledge and general knowledge that could facilitate comprehending new information.
The authors found that directly relevant knowledge decreased the consumer’s
benefit/need for external search. Ratchford (2001) treated consumer knowledge as human
capital, which affects information search activities in different ways. He suggested that
consumers’ prior knowledge about product attributes and prices of alternatives could still
be used and led to reduced search; instead consumers may adopt other strategies, such as
brand loyalty, to make purchasing decisions.
While product knowledge was often treated as a single construct in past studies,
recent research has differentiated between objective knowledge and subjective
knowledge (Brucks, 1985; Park, Mothersbaugh & Feick, 1994; Schmidt & Spreng, 1996;
Spreng & Olshavsky, 1990). Specifically, objective knowledge is defined as what
consumers actually know about a product, while subjective knowledge refers to a
consumer’s self-assessment of his/her knowledge about a product. The two concepts are
highly related but different (Brucks, 1985). It is subjective knowledge rather than
Page 34
27
objective that is the basis of consumers’ decisions. Presumably, if a consumer could
accurately assess the product knowledge he/she has, there is no need to distinguish
between objective and subjective knowledge, because the effects are the same. However,
high levels of calibration (matching between subjective knowledge and objective
knowledge) are achieved rarely while the norm is moderate levels of calibration with
some degree of systematic bias (Alba & Hutchinson, 2000). Therefore, it is realistic to
maintain a distinction between objective and subjective knowledge.
In the literature, product-related experience has been used as another way to
operationalize prior knowledge, although this approach has been criticized by some
researchers (Brucks, 1985; Spreng and Olshavsky, 1990). Specified as a distinct
construct, experience has a more strong effect on subjective knowledge than on objective
knowledge (Park, Mothersbaugh, & Feick, 1994). Consistent with Schmidt and Spreng’s
(1996) model, this study will not specify experience as a distinct construct. Instead, the
effect of experience on information search is assumed to be indirect through its effect on
objective and subjective knowledge. Since only consumers’ subjective knowledge is
hypothesized in this study to influence information search for investments, a consumer’s
prior experience is assumed to influence his/her self-assessment about knowledge in
investments and further affect information search behavior.
Confidence and subjective knowledge are also very closely related constructs. Brucks
(1985) suggested that subjective knowledge often includes both knowledge and
confidence in the adequacy of one’s knowledge level. Duncan and Olshavsky (1982)
indicated that a high level of subjective knowledge means that the consumer has
confidence in his/her ability to search for information. Therefore, a consumer’s subjective
Page 35
28
knowledge also reflects his/her confidence level in his/her investment knowledge to
conduct investing.
This study focuses on subjective knowledge, because it is believed that a consumer’s
decision about whether more information is needed is based on his/her self-assessment of
knowledge instead of objective knowledge itself. According to Johnson and Russo
(1984), more information will not be acquired when a consumer believes that he/she
knows a lot about a product and has enough knowledge to make a decision. Brucks
(1985) found that increased subjective knowledge led to a decreased usage of
salespersons’ recommendations. Urbany, Dickson and Wilkie (1989) found that
consumers with a high level of subjective knowledge regarding which brand to buy
searched less. It appears that an increase in subjective knowledge reduces the perceived
return from search. A consumer’s knowledge consists of the product-class (i.e.
investment products) knowledge and the knowledge of how to make investment
transactions. Therefore, the following hypothesis will be examined:
H1.1: Consumers with a higher level of subjective knowledge engage in less external
search for information about investments than those with a lower level of
subjective knowledge about investments.
On the other hand, Schmidt and Spreng (1996) proposed that a consumer’s self-
assessment of one’s knowledge would affect one’s perceived costs of search since the
search will seem easier if he/she thinks himself/herself to be knowledgeable. Knowledge
reduces cognitive processing costs and facilitates search in that only important or
diagnostic information will be processed (Alba & Hutchinson, 1987; Bettman & Park,
1980; Brucks, 1985; Johnson & Russo, 1984). Ratchford (2001) suggested that the cost of
Page 36
29
search will be reduced by learning how to search, which he described as “skill capital”,
accumulated in past search experience; as a result of the reduced costs, the extent of
current search will increase. In addition, one of the main reasons that consumers choose
professional services providers over other information sources may be that consumers are
not confident with their own knowledge and ability to process new information and make
investment transactions (i.e. buy stocks, bonds, or mutual funds). As their subjective
knowledge increases, it would be expected that consumers would be more likely to search
independently through the literature, the media and the Internet, all sources that have
lower money costs than professional services. Consequently, the following hypotheses
are developed as:
H1.2a: Consumers with a higher level of subjective knowledge engage in a higher
extent of search for information about investment products than those with a
lower level of subjective knowledge.
H1.2b: Consumers with a higher level of subjective knowledge are more likely to
search for information about investment products from literature than those
with a lower level of subjective knowledge.
H1.2c: Consumers with a higher level of subjective knowledge are more likely to
search for information about investment products from media than those with
a lower level of subjective knowledge.
H1.2d: Consumers with a higher level of subjective knowledge are more likely to
search for information about investment products from the Internet than those
with a lower level of subjective knowledge.
Page 37
30
H1.2e: Consumers with a higher level of subjective knowledge are less likely to
search for information about investment products from friends or family
members than those with a lower level of subjective knowledge.
H1.2f: Consumers with a higher level of subjective knowledge are less likely to
search for information about investment products from professional services
providers than those with a lower level of subjective knowledge.
Brucks (1985) suggested that subjective knowledge includes both knowledge and
confidence in the adequacy of one’s knowledge level. According to Chase and Simon
(1973), a high level of knowledge indicates a well-developed knowledge structure as well
as the ability to comprehend and organize information easily. Consequently, a consumer
with a higher level of knowledge will process new information easier than the one with a
lower level of knowledge. Duncan and Olshavsky (1982) noted that high subjective
knowledge indicates confidence in one’s ability to perform product-related tasks,
including information search. Therefore, it is proposed that a consumer with a high level
of subjective knowledge possesses confidence in his/her knowledge and ability to
conduct investment activities. The following hypothesis will be examined:
H1.3: Consumers with a higher level of subjective knowledge engage in more
information search for investment products than those with a lower level of
subjective knowledge.
Perceived risk
Similar to subjective knowledge, perceived risk is the consumer’s assessment of the
level of risk he/she faces in making the purchase decision. It includes multiple
components: performance risk, financial risk, social risk, physical risk, and psychological
Page 38
31
risk (Jacoby & Kaplan, 1972; Kaplan, Jacoby, & Szybillo, 1974). Investing has long been
known as risky and complicated due to its distinct characteristics, as discussed earlier.
Bauer (1960) first described information search as a strategy of risk reduction in the
face of risk. According to Cox (1967), “amount and nature of perceived risk will define
consumers’ information needs, and consumers will seek out sources, types, and amounts
of information that seem most likely to satisfy their particular information needs” (p.
604). Bauer (1960) and Bennett and Harrel (1975) as well as Howard and Sheth (1969)
also found that reduction of risk is a major benefit of information search. In the literature,
there is a consensus, both conceptually and empirically, that a higher level of perceived
risk in a prepurchase context increases consumers’ propensity to seek information about a
product or service (Dowling and Staelin, 1994). This is because the greater the
uncertainty about the payoffs from alternatives, the greater the returns to search
(Srinivasan and Ratchford, 1991).
Among different types of information sources, word-of-mouth and other personal
sources of information have been viewed as more effective means of reducing risk than
other sources (Arndt, 1967; Cunningham, 1967b; Cox, 1967; Lutz & Reilly, 1973; Mitra,
Reiss & Capella, 1999; Murray, 1991). Consumers are more likely to seek information
through direct observation and experience for high-risk products or services (Lutz &
Reilly, 1973). According to Mitra Reiss and Capella (1999), consumers always prefer
personal information sources to impersonal sources when faced with the higher risk
inherent in credence services compared to experience and search services. Previous
studies also found that personal sources are rated as the most important source of
information especially when the consumer perceives high risk (Arndt, 1967, 1968;
Page 39
32
Cunningham, 1964; Lutz & Reilly, 1973; Perry & Hamm, 1969; Roselius, 1971).
However, as discussed earlier, due to the unavailability of data related to perceived risk,
no hypothesis was developed and empirically tested in this study, calling for a future
study.
Amount of investments
Past research has found that consumers engage in more search when purchasing
goods with higher prices than when prices are lower (Schmidt & Spreng, 1996). There is
a positive relationship between prices and search activities across a variety of products,
including automobiles (Kiel & Layton, 1981), appliances (Newman & Staelin, 1973) and
apparel (Dommermuth, 1965). Udell (1966) found that consumers visit more stores when
purchasing more expensive goods.
In terms of investment products, the amount of the investments is proposed to be a
more appropriate variable than the unit price. An investment typically is considered as a
whole product that consists of multiple units, so that consumers are more likely to see the
amount of the investments as the price for the product rather than the unit price.
Therefore,
H2: The larger the amount of the investments, the greater the extent of consumers’
search for information about investment products is.
Attitudes toward risk
Attitudes toward risk and perceived risk are related, but distinct constructs. Attitudes
toward risks refer to a consumer’s risk preference, indicating how risk-averse or risk-
taking a consumer is, while the perceived risk is the assessment of the risk for a particular
decision that one faces. The construct of attitudes toward risk is similar to the concept of
Page 40
33
acceptable risk, which is incorporated in Dowling and Staelin’s (1994) model. They
differentiated between product-category risk and product-specific risk and developed a
model with an emphasis on product-specific risk. Specifically, the relationship between
perceived risk and the use of extra risk-reducing strategies is moderated by acceptable
risk. Only normal risk-reducing activities will be undertaken when the acceptable risk is
higher than the level of specific risk, while a higher level of specific risk compared to
acceptable risk will induce extra risk-reducing activities.
A more liberal attitude toward risk indicates a higher acceptable level of risk.
Presumably, a higher level of acceptable risk will decrease the use of extra risk-reduction
activities as long as the perceived risk is lower than the acceptable level. Moreover, in the
face of the same risk associated with a particular purchase situation, a consumer with a
more conservative attitude toward risk will tend to perceive a higher risk level than a
consumer with a more liberal attitude toward risk. The hypothesis regarding the attitudes
toward risk is proposed as follows:
H3: Consumers with more liberal attitudes toward risk engage in less search activities
for information about investment products than those with more conservative
attitudes toward risk.
Inherent novelty seeking
The underlying notion of the construct of inherent novelty seeking is that an
individual is motivated to seek out novel information through some internal drive (Acker
& McReynolds, 1967; Cattell, 1975; Farley & Farley, 1967). Hirschman (1980) defined
inherent novelty seeking as a desire to seek out new and different information and
inherent innovativeness as the willingness to adopt new products. These two constructs
Page 41
34
are conceptually close if the concept of products is defined more broadly to include ideas,
services and goods. Through active information search from different sources, not only
can investors find alternative investment products, but they also can accumulate
information through “ongoing search” (Bloch, Sherrell & Ridgway, 1986) that can be
used in future information search activities. The following hypothesis is posited:
H4: A more innovative consumer engages in more search activities for information
about investments because of greater perceived benefits of search.
Income
An important aspect of the cost of search is opportunity cost, which is defined as the
expected utility of an alternative use of the time spent in searching for information. Feick,
Herrmann and Warland (1986) noted that the marginal wage is the appropriate measure
of the opportunity cost. However, the marginal wage is difficult to measure. Since a
higher wage rate is generally associated with higher income, income can be used as a
proxy for wage. Therefore, it could be posited that a higher income increases the cost of
search and discourages search activities.
Marvel (1976) found that income negatively affected search for information about
gasoline prices. However, Katona and Mueller (1954) as well as Andreasen and
Ratchford (1976) found an inverted-U-shape relationship between income and external
search; that is, for the households with income above the median, information seeking
declines as incomes increase, but information seeking did not increase for low-income
households. Many other empirical findings confirmed a curvilinear relationship between
income and information search including studies by Carlson and Gieseke (1983),
Ratchford (1988) and Morgan (1988). One might expect lower-income individuals to
Page 42
35
engage in more information search since their opportunity costs are lower than those of
individuals with higher income. On the other hand, they may have a lower level of
knowledge and consumers with less ability to understand difficult materials therefore
may not ask as many questions as consumers with higher incomes (Miyake & Norman,
1979). So the following hypothesis will be examined:
H5a: Consumers with higher income levels engage in less search activities for
information about investment products than those with lower income levels.
Furthermore, searching for information from impersonal sources, such as books and
the Internet, or from such personal sources as friends/relatives and experienced
consumers, generally requires more time and effort than obtaining information from
financial services. Thus, the opportunity cost tends to be higher for people with higher
incomes than for those with lower incomes. Therefore,
H5b: Consumers with higher income levels are less likely to search for information
about investment products from literature than those with lower income levels.
H5c: Consumers with higher income levels are less likely to search for information
about investment products from media than those with lower income levels.
H5d: Consumers with higher income levels are less likely to search for information
about investment products from the Internet than those with lower income
levels.
H5e: Consumers with higher income levels are less likely to search for information
about investment products from friends or family members than those with
lower income levels.
Page 43
36
H5f: Consumers with higher income levels are more likely to search for information
about investment products from professional services providers than those with
lower income levels.
Education
The basic finding in the literature is that a higher level of education leads to increased
search activity (Andreasen & Ratchford, 1976; Claxton, Fry & Portis, 1974; Hempel,
1969; Newman & Staelin, 1972; Schaninger & Sciglimpaglia, 1981). Udell (1966) found
that people with higher levels of education visited more stores when shopping for
appliances than did people with lower levels of education. Engel, Kollat and Blackwell
(1973) stated that consumers with a higher level of education were more likely to engage
in extended decision-making than consumers with a lower level of education. Kiel and
Layton (1981) concluded that several measures of information search for automobile
purchases strongly related to consumers’ education levels. Schmidt and Spreng (1996)
proposed that more education leads to more information search by increasing one’s
ability to identify, locate and assimilate relevant information. Moreover, people with
higher education levels have more knowledge in general. Those who received business-
related education will have more general knowledge relevant to investments. Thus,
higher education attainment will increase one’s subjective knowledge level. Based on the
literature, the following hypothesis are developed:
H6: Consumers with higher educational attainment engage in more information
search about investment products than those with lower education attainment.
Page 44
37
Age
Past research has identified age as an influential factor in consumer information
search. After reviewing the literature on age differences and information processing,
Phillips and Sternthal (1977) concluded that older consumers were likely to process less
information than younger consumers because they were less able to process large
amounts of information; however, older consumers were more capable of distinguishing
between relevant and irrelevant information. Research has also indicated that older adults
remember less product-related information than younger adults (Cole, 1983; Stephens,
1982; Stephens & Warrens, 1984; Ziethaml, 1982). Lehmann and Moore (1980) found in
a longitudinal study that consumers’ information search activities declined as they
became older. Schaninger and Sciglimpaglia (1981) found that a consumer’s age
negatively affected the extent of their search for information. More recently, Cole and
Balasubramanian (1993) found the intensity and accuracy of searching for information
decreased for older consumers. Therefore, the effect of age is posited as follows:
H7: Older consumers engage in less information search for investment products than
younger investors.
Page 45
38
CHAPTER 4
METHODS
Data
Data from the 2000-01 MacroMonitor are used in this study. MacroMonitor is a
comprehensive database of consumer attitudes, behaviors and motivations in terms of
financial products, conducted by the Consumer Finance Decision section of SRI
Consulting Corporation every other year since 1978. The population of interest in this
survey was the total population of financial decision-makers of households in the United
States. The 2000-01 MacroMonitor consisted of survey responses from 3,759 financial
decision-makers nationwide. More information about MacroMonitor can be found at
http://future.sri.com/CFD/proposals/2000proposal.pdf.
The participants were recruited via a random-digit-dialing (RDD) sampling frame.
The researchers called both listed and unlisted telephone numbers to improve the
representativeness of the sample. The sampling method of the survey was a probability
sampling method, specifically, a multistage random sampling with two steps. In the first
step, a sample of telephone exchanges was selected using stratified disproportionate
random sampling. Telephone exchanges where households tend to have higher incomes
and assets were oversampled based on the summary statistics of the exchanges. The
second step was to select a sample of telephone numbers of households within each
telephone exchange using a simple random sampling method. As a result, there were
3,759 respondents in the final survey, of which more than 1,400 households included
Page 46
39
respondents with high incomes or assets, i.e. the households had more than $100,000
annual income or had more than $500,000 total assets, excluding their primary residence.
The purpose of this disproportionate sampling was to provide a larger sample of affluent
households and owners of low-incidence products for analysis than would otherwise be
true. Oversampled households were weighted back to represent their correct proportion in
the population. The information from telephone solicitation attempts was used to create
overall parameters for weighting. National and regional parameters came from the most
recent U.S. Census Bureau Current Population Survey.
The researchers made a telephone solicitation first and then sent the questionnaire to
people who agreed to participate in the survey. Along with the questionnaire was a letter
with instructions, an 800 telephone number for any question, a $5.00 incentive, and a
postage-paid return envelope. The respondents were promised an additional $5.00 for
returning the completed questionnaire and an optional confidential analysis of their
responses compared with those of households in the same age, income and life-stage
group. Due to the mix-mode methodology, i.e., telephone solicitation attempts followed
by mail-and-return questionnaire, and especially the confidential analysis of participants’
responses option, the survey achieved a return rate relatively higher than either mail-
questionnaire survey or telephone methodologies individually.
Among the households selected and contacted, around 7,500 households agreed to
participate via telephone calls, and 49% returned their questionnaires. The real response
rate was the ratio of the number of respondents returning completed questionnaires to the
number of financial decision-makers in the households that the researchers initially
successfully contacted. Sample attrition of households in the survey was attributed to two
Page 47
40
major factors. One was that there was no one at home after repeated phone calls. Another
was that the financial decision-makers in the households were never found even though
someone else answered the phone.
This study used all the responses from the sample in the 2000-01 MacroMonitor to
investigate U.S. consumers’ information search behavior for investments. To some
extent, the probability sampling method and a relatively high return rate ensures that the
sample represents the population of interest well and that the results are generalizable to
all households in the United States. This contributes to the external validity of this study.
However, there is still a problem regarding the sample representativeness because the
random-digit-dialing method left out consumers in households that do not have a phone.
Households without a phone have traditionally been those with very low incomes and
assets who tend to purchase few financial products and engage in little search for
information. The exclusion of these households from the sample is not random and limits
the external validity of this study in terms of generalizing the results to all households in
the United States. Nevertheless, since only consumers with higher incomes are likely to
be highly interested in investing and searching for information about investments, the
limitation to the external validity of this study is not expected to be severe. The results of
this study can be generalized to all U.S. households with telephones.
Measurement
Dependent variable
The extent of consumers’ information search for investments is the overarching
dependent variable in this study, and it is conceptualized as the effort that a consumer
devotes to search for information. In the literature, extent of information search has
Page 48
41
received a great deal of attention as researchers have attempted to answer the
fundamental question of how much consumers search for information. However, there
are conceptual and definitional problems with understanding external information search
(Srinivasan, 1990).
Several studies offered different definitions of the amount of external search for
information (Bettman, 1979; Engel, Kollat & Miniard, 1986; Hansen, 1972; Howard &
Sheth, 1969; Nicosia, 1966). Many researchers have used the number of stores visited as
the measurement of the extent of consumers’ search for information (Carlson & Gieseke,
1983; Claxton, Fry & Portis, 1975; Duncan & Olshavsky, 1982; Kiel & Layton, 1981;
Newman & Lockeman, 1975; Newman & Staelin, 1972; Punj & Staelin, 1983; Srinivasan
& Ratchford, 1991; Urbany, 1986; Urbany, Dickson & Wilkie, 1989; Westbrook &
Fornell, 1979). Alternatively, a variety of measures of time was used in some studies:
time spent at store (Kiel & Layton, 1981; Newman & Lockeman, 1975; Punj & Staelin,
1983), duration of search time (Kiel & Layton, 1981; Newman & Staelin, 1971; Ozanne,
Brucks & Grewal, 1992) and deliberation time (Claxton, Fry & Portis, 1974; Kiel &
Layton, 1981; Midgley, 1983). In addition, measures of the extent of information search
also include the number of brands examined, the number of models examined, the
number of product characteristics considered and the number and types of information
sources consulted. Typically, each of these measurements is a single item measure.
Srinivasan (1990) argued that single measures of external search do not accurately and
adequately describe the true degree or amount of external information search because, for
example, the number of stores visited focuses on the inter-store search but neglects intra-
Page 49
42
store search. In addition, consumers’ experience or satisfaction with previous purchases
will significantly influence the number of alternatives examined.
Attempts have been made to find a more comprehensive measure of total information
search. Some researchers have developed an index by assigning weights to different
search efforts (Duncan & Olshavsky, 1982; Newman & Lockeman, 1975; Newman &
Staelin, 1972). Another composite measure is the number of various search activities
engaged in, which counts all the external sources of information used (Claxton, Fry &
Portis, 1974; Duncan & Olshavsky, 1982; Punj & Staelin, 1983; Srinivasan & Ratchford,
1991).
On the other hand, Chaudhuri (2000) employed a 4-item 7-point agree/disagree scale
to measure consumers’ information search for a variety of products. The items included:
“I would search for more information before buying this product”, “I would like to read
more about this product”, “I would ask the opinions of others about this product”, and “I
would shop around before buying this product”.
Following Chaudhuri’s (2000) approach, this study measures the extent of
consumers’ information search based on their responses to the following questions: “How
often do you or anyone in your household receive advice before making major household
investment decisions?”, “I prefer to consult a specialist when making financial
decisions”, “I like to discuss my financial options before making a decision about them”
and “Using my financial institution as a sounding board for ideas about my finances is
important to me”. The responses to the first item, “How often do you or anyone in your
household receive advice before making major household investment decisions?”, ranged
from “always (1)”, “sometimes (2)”, “rarely (3)”, to “never (4)”. The responses to the
Page 50
43
other items were coded on a 4-point Likert-type scale ranging from “mostly agree (1)” to
“mostly disagree (4)”. The responses were recoded as needed to assign a higher score to a
consumer with more search for information. An exploratory factor analysis was run to
uncover the underlying common factor of these four items and to examine the internal
consistency of this measure. Once the reliability of the measure was established, a factor
score was used as the extent of information search variable.
Consumers’ choice of information sources was another set of dependent variables in
this study. The respondents were asked if they searched for information about
investments from each of a variety of sources in the last 12 months. As discussed earlier,
this study classified the sources into five categories: literature (i.e., books, consumer
magazines, other magazines, newspaper articles, financial newsletters, and
brochures/written materials), media (i.e., radio programs, broadcast TV programs,
educational TV programs, cable TV programs, radio advertisements, TV advertisements,
daily newspaper or magazine advertisements, financial newspaper or magazine
advertisements), the Internet, friends/relatives and professional financial services
providers (i.e., financial institution personnel, financial advisors).
Independent variables
The independent variables in this study include: investment-specific individual
differences, personal traits and demographic characteristics. The following variables were
identified as investment-specific individual differences: consumers’ subjective
knowledge about investments, consumers’ perceived risk and the amount of the
investments.
Page 51
44
Subjective knowledge was defined as consumers’ self-assessment of the adequacy of
their knowledge about investment products and their knowledge of how to invest. Brucks
(1985) measured an individual’s subjective knowledge about sewing machines and cars
by using a two-item seven-point semantic differential scale. The first item asked the
respondents to rate their knowledge of sewing machines as compared to the average
women’s knowledge with one equal to the least knowledgeable and seven meaning the
most knowledgeable. The second item asked respondents to describe their familiarity
with sewing machines with one referring to not at all familiar and seven meaning
extremely familiar.
Similarly, Srinivasan’s (1987) measured respondents’ subjective knowledge by the
following three questions. First, the respondents were asked about their opinions on the
following statement: “Compared to the average person, I know a lot about cars.” The
response was recorded on a seven-point Likert-type scale ranging from “strongly disagree
(1)” to “strongly agree (7)”.
The second question asked the respondents to use a seven-point semantic differential
scale to respond to the following statement: “Please rate your knowledge of cars,
compared to the average buyer.” The scale was anchored at the lower end by “one of the
least knowledgeable (1)” and at the upper end by “one of most knowledgeable (7)”.
The third question was also a seven-point semantic differential scale, asking the
respondents to “circle one of the numbers below to describe your familiarity with cars.”
The anchors of this scale were “not at all familiar (1)” and “extremely familiar (7)”.
Multiple items were used to decrease the consistency bias by eliciting responses through
Likert-type and semantic differential scales (Srinivasan, 1987). The score for the variable
Page 52
45
of subjective knowledge was the additive sum of the numbers of the three items circled
by the respondents.
Following Srinivasan’s (1987) measurement, a set of questions was asked to uncover
consumers’ subjective knowledge about investments in this study. The questions
included: “I sometimes feel stupid when I ask questions about financial matters”; “My
household knows how to choose the financial products and services that are best for us”;
“I consider myself a sophisticated investor”; “I need help selecting savings and
investment products that are best suited to meet my financial goals”; “I feel qualified to
make my own investment decisions”; and “I do not need advice on investment options”.
Each response was coded on a 4-point Likert-type scale ranging from “mostly agree (1)”
to “mostly disagree (4)”. The responses to all of the items, except “I need help selecting
savings and investment products that are best suited to meet my financial goals”, were
recoded to ensure that higher scores would be associated with consumers’ higher levels
of subjective knowledge about investments. The reliability of this measure was examined
using Cronbach’s alpha, and each item-to-total correlation was examined to establish the
internal consistency.
The amount of the investments was measured as the total dollar amount of the
respondents’ financial assets, which are total assets minus the value of business, home,
other real estate, tangible assets, and owned vehicles.
Consumers’ attitudes toward risk and their inherent novelty seeking were identified as
personal traits. Attitudes toward risk indicate the risk preference of an individual. Arrow
(1965) derived relative (proportional) risk aversion as the measure of attitudes toward
risk. A greater proportion of wealth in the form of risky assets as wealth increased
Page 53
46
indicates a decreasing relative risk aversion. Based on this conceptualization, Cohn,
Lewellen, Lease, and Schlarbaum (1975) and Friend and Blume (1975) empirically
investigated the relative risk aversion using different definitions of wealth. Siegel and
Hoban (1982) reviewed these two studies and concluded that the ratio of risky assets to
net wealth including housing was a better measurement of the relative risk aversion. This
operation has been broadly used in recent studies (Bakshi & Chen, 1994; Morin &
Suarez, 1983; Schooley & Worden, 1996; Wang & Hanna, 1997).
Attitudinal scale is another type of measurement used to evaluate an individual’s risk
preference. Moorthy, Ratchford and Talukdar (1997) adopted a four-item seven-point
Likert scale to measure a consumer’s attitude toward the risk of making a wrong brand or
dealer choice. For example, respondents were asked about their response to the statement:
“When I buy a car, it is not a big deal if I buy the wrong model by mistake”. Hawley and
Fujii (1994) divided an individual’s preference for financial risk into four levels: not
willing to take any financial risk; willing to take average financial risks expecting to earn
average returns; willing to take above-average financial risks expecting to earn above-
average returns; willing to take substantial financial risk expecting to earn substantial
returns.
An attitudinal scale was adopted in this study to measure respondents’ attitudes
toward risk. First, respondents were asked where they would prefer to put most of their
household’s savings and investments. Their responses ranged from 1 (a very low return
with a very low risk of loss) to 5 (a very high return with a very high risk of loss).
Second, respondents were asked about their opinions on a set of four statements: “It’s
very important to me to have both a guaranteed interest rate and a federal insurance on
Page 54
47
my savings”, “I am willing to accept some risk of losing money if an investment is likely
to come out ahead of inflation in the long run”, “It is wise to put some portion of savings
in uninsured investments to get a high yield”, and “I am willing to take substantial risks
to realize substantial financial gains from investments”. Responses to these four
statements were measured on a four-point Likert-type scale, ranging from “mostly agree
(1)” to “mostly disagree (4)”. To give a higher score to respondents who were more risk-
liberal, the responses to the last three items, “I am willing to accept some risk of losing
money if an investment is likely to come out ahead of inflation in the long run”, “It is
wise to put some portion of savings in uninsured investments to get a high yield”, and “I
am willing to take substantial risks to realize substantial financial gains from
investments”, were recoded.
Inherent novelty seeking is defined as the desire to adopt new products and/or seek
out new and different information. To measure respondents’ inherent novelty seeking,
Hirschman (1980) suggested that questions about an individual’s willingness to seek
information that is new and different should be asked, and the questions should include
both generalized/abstract questions (e.g., “How willing are you to seek out novel
information?” or “Do you search for new and different?”) and specific/concrete questions
related to broad consumption domains (e.g., “How willing are you to try new fashion” or
“Do you look for new foods to eat?”).
A set of questions was asked to uncover respondents’ inherent novelty seeking in this
study. The questions included: “I enjoy learning about different investment
opportunities”, and “I am unlikely to try a new financial service until someone I know
recommends it”. The responses were coded on a four-point Liket-type scale (1=mostly
Page 55
48
agree, 2=somewhat agree, 3=somewhat disagree, 4=mostly disagree). To ensure that a
higher score indicated a higher level of inherent novelty seeking, the first item was
recoded.
Investors’ age, educational attainment and income level were the demographic
characteristics included in this study. The respondents were asked to report their year of
birth. Age was calculated by subtracting the year of birth from 2000. The respondents’
education attainment was a categorical variable. The categories were less than high
school, high school degree, some college or technical school, and college degree or more.
The respondents’ income level was recorded as the dollar amount of total before-tax
household income.
Analysis
First, factor analysis was conducted including all twelve of the items related to the
three constructs subjective knowledge, attitudes toward risk and inherent novelty seeking.
Orthogonal factors were obtained using the principal component method with varimax
rotation. The resulting factors scores were used as independent variables in hypotheses
testing. Another exploratory factor analysis was employed to uncover the underlying
common factor of the four items intended to measure consumers’ extent of information
search. Then the internal consistency of this measure was examined.
Second, descriptive analyses were employed to provide the demographic profile of all
of the households, of the groups of respondents engaging in various extents of
information search, and of the groups of respondents who seek information from different
types of information sources. Descriptive statistics provided information about the
distribution of respondents’ investment-specific individual differences, personal traits and
Page 56
49
demographic characteristics. Means, medians and standard deviations were presented for
the continuous variables and frequencies and percentages were presented for categorical
variables. It should be noted that the descriptive statistics were generated on weighted
data since the sample consisted of a greater proportion of affluent households than the
actual proportion they represent in the population.
Third, the hypotheses related to the extent of information search were examined using
multiple regression analysis. The independent variables included investment-specific
individual differences, personal traits and demographic characteristics. The ratio level
measurement of the dependent variable, consumers’ extent of information search,
justified the choice of multiple regression. The test statistic, t value, tested the individual
null hypotheses that each individual independent variable had no statistically significant
effect on consumers’ extent of information search. As a measure of association,
unstandardized regression coefficients were used to interpret the direction and magnitude
of the effects of the independent variables on dependent variable that were statistically
significant. The F-value were used to test the overall null hypothesis that the set of
independent variables explained no variability in consumers’ extent of information search
for investments.
Last, logistic analysis was used to investigate the effects of potential determinants on
consumers’ choice of a certain source of information. A set of logistic regressions was
run to estimate the probability of whether or not a consumer will use literature, media, the
internet, friends/family, or professional financial services providers when making a
investment decision. The dependent variable in this regression was the general logit,
which was the probability of belonging to category 1 (using a certain source) over
Page 57
50
category 2 (not using a certain source). In this step, correlation coefficients among the
independent variables were examined to ensure a lack of multicollinearity. Wald’s Chi-
square was the test statistic for the individual null hypotheses that each independent
variable had no statistically significant effect on the choice of a certain information
source. The direction of the significant relationships was indicated by the unstandardized
logistic regression coefficients. The odds ratios were used to determine the magnitudes
and directions of the relationships. R-square measured the improvement in predictive
efficacy of the research model over the null model. The probability of choices of certain
information sources was forecast by predicted probability.
Page 58
51
CHAPTER 5
RESULTS
Factor Analysis
Table 2 presents the results of the factor analysis of the independent variables that are
measured by multiple items. Three factors emerged, using principle factor analysis.
Factor 1 represented consumers’ attitudes toward risk. A positive score indicated a liberal
attitude toward risk and a negative score indicated a conservative attitude toward risk.
Factor 2 reflected a consumer’s subjective knowledge. Consumers with a higher level of
self-assessed knowledge about investments had a positive score, while those with a lower
level of self-assessed knowledge about investment had a negative score. Factor 3
reflected a consumer’s inherent novelty seeking. Consumers with a positive score were
more inherently innovative, while those with a negative score were less inherently
innovative.
Factor loading scores are indicated by the bold face numbers. The eigenvalues, which
were 3.26, 1.90 and 1.06, respectively, suggested a three-factor solution. The factors
explained 27.14%, 15.81% and 8.80%, respectively, of the variance for a total of 51.75%.
However, two items had cross loadings on different factors. The item, “I consider myself
a sophisticated investor”, was expected to measure the construct of subjective knowledge,
but was also related to the factor attitudes toward risk. Another item, “It’s very important
to me to have both a guaranteed interest rate and federal insurance on my savings”
reflected both one’s attitudes toward risk and one’s inherent novelty seeking. Also, the
Page 59
52
item, “I enjoy learning about different investment opportunities” loaded on the factor
attitudes toward risk instead of inherent novelty seeking. Even though it was unexpected,
the results were not surprising because these three factors are related to some extent. A
consumer with a higher level of subjective knowledge may be more willing to accept
risk, i.e. have a liberal attitude toward risk, because they may perceive greater ability to
handle the risk. Similarly, the more inherently innovative a consumer is, the more risk
he/she is willing to take since a higher return is associated with higher risk investment.
Results of the factor analysis of the dependent variable, extent of information search,
are presented in Table 3. There were four items intended to measure the extent of
consumers’ information search. The bold face numbers indicate the factor loading scores.
All of the four items were significantly related to this construct since all the factor
loadings are above .60. The variance explained by this factor is 1.97, about one-half of
the total variance. The factor score resulting from the factor analysis was used in the
following descriptive and regression analysis. A consumer engaging in less (more)
information search would expect to receive a lower (higher) score.
Descriptive Analysis
Table 1 shows the demographic profile of the sample used in this study. There were a
total of 3,759 households in this dataset, representing all households in the United States.
The average amount invested was about $124,000 for all of the households. The greatest
proportion (40.2%) of the households invested less than $10,000, with relatively equal
proportions investing in each of the four other categories. On average, the respondents
were 49 years old. In terms of distribution, the greatest proportions were 35 to 44 years
old (23.1%), 65 or older (21.1%), 45 to 54 years old (20.1%), or 25 to 34 years old
Page 60
53
(18.4%). Only 3.9% were 18 to 24 years old. The respondents were somewhat equally
distributed across the levels of education. Respondents with less than high school
education accounted for 18.5% of the sample, those with a high school education
accounted for 28.4%, those with some college education accounted for 26.9% and those
with bachelor’s degree or higher accounted for 26.2%. The average income for the
sample was about $51,300. The largest proportion (45.0%) of the households earned less
than $35,000 annually. About one-fourth (25.1%) had incomes between $35,000 and
$59,999, while 18.5% had incomes between $60,000 and $99,999. Only 11.3% of the
households had annual incomes above $100,000.
Households were divided into quartiles based on extent of their information search.
Households were also differentiated by their choice of each of the five information
sources: using literature, media, the Internet, friends or family members, and professional
financial services providers. Table 3 presents some simple statistics concerning the extent
of respondents’ information search and their choice of information sources. Considering
the extent of information search, about three-fifths (61%) of households preferred to
consult a specialist when making financial decisions; more than 80% of households
reported that they liked to discuss their financial options before making a decision. One-
half of respondents thought it is important to use their financial institution as a sounding
board, while at least 50% seek advice before making major household financial decisions.
Regarding usage of the information sources, most households searched for information
from literature (44.9%), followed by from friends or family members (35.7%), media
(32.9%), the Internet (19.1%), and professional financial services providers (16.8%).
Page 61
54
The extent of information search
Table 4 presents descriptive statistics of households in each of the quartiles based on
extent of information search. The descriptive statistics are investment-specific individual
differences, personal traits and demographic characteristics. The four groups were
significantly different in each of the above characteristics.
There was a significant difference in self-assessed investment knowledge adequacy,
i.e., subjective knowledge, among the groups of households who engage in different
amounts of information search (p< 0.0001). On average, the most passive searchers
(those in the lowest quartile) had the highest level of subjective knowledge while the
most active searchers (those in the highest quartile) had the lowest level of subjective
knowledge.
Only a marginal difference existed in the average amount of investments among the
four groups of households (p=0.0899). However, the distribution across groups was
significantly different (p< 0.0001). For example, compared to active information
searchers (i.e., households in the third and fourth quartile of information search extent), a
greater proportion of passive information searchers (i.e., households in the lowest and
second quartile of information search extent) had investments less than $10,000. In
contrast, the most passive searchers were less likely to invest more than $200,000 than
the most active searchers (11.4% vs. 18.8%).
The four groups of households also differed in terms of attitudes toward risk and
inherent novelty seeking (p<0.0001 and p<0.0001, respectively). The most passive
searchers were households with the most conservative attitude toward risk. These
households were, however, the most inherently innovative.
Page 62
55
In terms of demographic characteristics, significant differences were found across the
four groups of households in their age and education. Consumers who searched the least
(49.8 years old on average) and those who search the most (49.8 years old on average)
were slightly older than the consumers in the middle two quartiles (48.2 years old and
48.1 years old on average, respectively) (p<0.0001). More than one-half (52.7%) of the
most passive information searchers (in the lowest quartile) and 47.9% of the moderately
passive searchers (in the second quartile) had at most high school education. On the other
hand, 56.7% of the moderately active searchers (in the third quartile) and 56.7% of the
most active searchers (in the fourth quartile) had at least some college education. The
average income was not different among the groups (p=0.4601), but there was a
significant difference in the distribution. Consumers in households who earned less than
$35,000 comprised 49.8% of the most passive searchers and 49.0% of the moderately
passive searchers, but only 39.5% of the moderately active searchers and 42.6% of the
most active searchers.
Users of literature vs. non-users
Households were also grouped according to whether or not they chose a certain
source of information: literature, media, the Internet, friends/family and professional
services. Table 5 presents descriptive statistics of users and non-users of literature as an
information source. Among the 3,759 households, 2,271 households searched for
information from literature, i.e., books, consumer magazines, other magazines,
newspaper articles, financial newsletters and brochures/written materials. Non-users
totaled 1,488 households. Users and non-users were significantly different in investment-
specific individual differences, attitudes toward risk and demographic characteristics.
Page 63
56
On average, literature users had a higher level of subjective knowledge about
investments than non-users (p<0.0001). The average amount of investments was much
higher for literature users ($201,882) than non-users ($60,860). Specifically, only 28.7%
of the literature users invested less than $10,000, while 50.9% of non-users had
investments totaling less than $10,000. In contrast, nearly 40% of literature users had
more than $100,000 in investment assets compared to only about 15% of non-users.
Users of literature were more risk liberal than literature non-users (p< 0.0001). But
inherent novelty seeking was not significantly different between users and non-users.
There was a marginally significant difference between the ages of literature users and
non-users (46.5 and 51.1 years old, respectively) (p=0.1030). A greater proportion of
literature users were less than 55 years old (72.4%) while 40.1% of non-users were older
than 55 years old. Literature users also had more education than non-users. About 70% of
literature users had at least some college education, while about 60% of non-users had
only a high school education or less. Literature users earned more than non-users
(p<0.0001). The average income was $66,483 for literature users, and only $39,041 for
non-users.
Users of media vs. non-users
Table 6 presents descriptive statistics about households seeking information from
media. Media users accounted for 1,598 households, while 2,161 households were non-
users. Similar to the findings for literature users and non-users, media users and non-
users differed in investment-specific individual differences, attitudes toward risk and
demographic characteristics.
Page 64
57
The level of subjective knowledge about investments was higher for media users than
non-users (p<0.0001). On average, media users had more investment assets than non-
users ($194,303 versus $89,465). Nearly one-fourth (23.2%) of media users invested
more than $200,000, compared to about one-tenth of non-users. Media users were more
risk liberal than non-users (p<0.0001). No difference existed between media users and
non-users in terms of inherent novelty seeking (p=0.9350). The distribution of
households by age was very similar among media users and non-users. However, on
average, media users are slightly younger than non-users (47.8 years old vs. 49.6 years
old) (p<0.0001). About 65.3% of media users had at least some college education, while
more than half (52.8%) of non-users did not have any college education. While the
average income was not significantly different between media users and non-users, the
distribution was significantly different (p<0.0001). Particularly, a greater percentage
(48.7%) of non-users had an income less than $35,000, compared to 37.6% of users. In
addition, 17.8% of media users, about twice the proportion of non-users, had incomes
higher than $100,000.
Users of the Internet vs. non-users
Descriptive statistics of both Internet users and non-users are presented in Table 7.
There were 1,054 respondents who searched for information from the Internet. The
Internet users differed from non-users in terms of their investment-specific individual
differences, personal traits and demographic characteristics.
Internet users, on average, had a higher level of subjective knowledge than non-users
(p<0.0001). The amount of their investments was also higher for the Internet users than
for non-users (p=0.0036). On average, Internet users’ total investments were more than
Page 65
58
twice the total mean for non-users ($219,172 vs. $101,504). In terms of distribution, more
than one-half (54.1%) of Internet users invested more than $50,000, while a majority
(67.6%) of Internet non-users invested less than $50,000. Internet users had more liberal
attitudes toward risk (p<0.0001) and were more inherently innovative than non-users
(p<0.0001). On average, Internet users were over 10 years younger than non-users (40.8
years old vs. 50.9 years old) (p=0.0036). Only 12.8% of the Internet users were older than
55 years, while 39.7% of Internet non-users were older than 55 years. Internet users were
also better educated (p<0.0001). More than four-fifths (80.7%) of Internet users had at
least some college education while more than one-half (53.4%) of non-users had only a
high school education or less. Particularly, among Internet users, more than one-half
(50.4%) had a bachelor’s degree or higher, almost two and a half times the proportion
among non-users. The distribution of income was significantly different (p<0.0001) even
though the average income was not statistically different (p=0.1466) between Internet
users and non-users. Internet users were somewhat evenly distributed across the four
income groups. On the other hand, a majority (50.19%) of Internet non-users were low-
income households with annual incomes less than $35,000. More than three-quarters
(75.63%) of non-users earned less than $60,000 annually.
Users of friends/family vs. non-users
Among the 3,759 respondents, 39.8% (1,496) of the respondents obtained investment
information from friends or family members (i.e. friends/family users) and 2,263
respondents did not (i.e. friends/family non-users). Table 8 presents the descriptive
statistics for these two groups. They were significantly different in investment-specific
individual differences, inherent novelty seeking and demographic characteristics.
Page 66
59
On average, those who obtained information from friends/family were less
knowledgeable about investments (p<0.0001) and less inherently innovative (p=0.0003)
than those who did not obtain information from this source. The average amount of
investments was $134,407 for those who obtained information from friends/family,
$16,418 more than those who did not obtain information from this source. More than
one-half (50.6%) of friends/family users had more than $25,000 in total investments. In
contrast, more than one-half (55.0%) of friends/family non-users invested less than
$25,000, typically less than $10,000. There was no significant difference in attitudes
toward risk between those who consulted friends/family and those who did not
(p=0.9760). Users were much younger, better-educated and earned more than the non-
users. A majority (59.0%) of users were under 45 years old, while a majority (62.2%) of
non-users were older than 45 years old. Nearly two- thirds (66.1%) of users had at least
some college education, while more than one-half (54.0%) of non-users had at most a
high school education. Also, users tended to earn more than non-users (p=0.0432).
Almost one-half (49.8%) of non-users earned less than $35,000, while only 36.6% of
users belonged to this group.
Users of professional financial services providers vs. non-users
Among the 3,759 households, only 25.3% (952 respondents) used professional
services for investment information and 2,807 households did not. Demographic statistics
for these two groups are presented in Table 9. These two groups were significantly
different on each of the characteristics investigated.
Compared to non-users, users tended to have a lower level of subjective knowledge
but held a much higher amount of investments. On average, professional services users
Page 67
60
invested about 2.8 times as much as non-users ($268,442 vs. $94,854). Over one-half
(50.6%) of users had investments totaling over $100,000, compared to only about one-
fifth (19.8%) of the non-users. Moreover, a little less than three-fifths (58.12%) of non-
users possessed investments totaling less than $25,000. The two groups also differed in
personal traits. Professional services users were much more risk liberal and less
inherently innovative than non-users. The two groups were significantly different in
terms of demographic characteristics. In general, users tended to be older, better-educated
and have higher incomes than non-users. Among users, 43.5% had a bachelor’s degree or
higher and another 30.1% had some college education. Over one-half (51%) of non-users
had only a high school education or less. Professional services users earned $26,141 more
than non-users on average. Over one-fifth (20.9%) of users were high-income households
with annual incomes of more than $100,000, while almost one-half (49.6%) of non-users
had an annual income of less than $35,000.
Correlation Analysis
Interdependencies between independent variables can cause a multicollinearity
problem and make the results of multiple and logistic regression analyses unreliable.
Thus, correlation analysis was employed to examine the interdependencies among the
independent variables. Results of the correlation analysis are presented in Table 10. The
correlations between the continuous variables were relatively weak. All but two of the
coefficients were less than 0.30. The correlation between inherent novelty seeking and
attitudes toward risk was 0.36. Of greater concern, however, was the high correlation
(0.55) between the total amount of investments and income. To avoid multicollinearity,
income was employed as a set of binary variables in the regression analysis.
Page 68
61
Multiple Regression Analysis
The relationship between the extent of consumers’ information search and their
investment-specific individual differences, personal traits and demographic
characteristics was examined using multiple regression analysis. The results were
presented in Table 11. The dependent variable, extent of consumers’ information search,
was a continuous variable with the factor score ranging from –1 to 1. Each hypothesis
regarding the effect of each individual independent variable on consumers’ information
search was tested in ceteris paribus condition.
Investment-specific individual differences significantly affected the extent of
consumers’ information search. Subjective knowledge was significantly (t= -21.45,
p<0.0001), and negatively related to the extent of information search. The coefficient of –
0.3175 indicates that, compared to consumers with an average level of subjective
knowledge, a consumer with the highest level of subjective knowledge will decrease
his/her extent of information search by 31.75%. The total amount of investments was also
a significant predictor of the extent of information search (t=3.49, p<0.0001). The
unstandardized regression coefficient was 0.000434. If the respondent has investments
that total $10,000 more than other respondents, that consumer would be expected to
increase his/her extent of information by 0.434%.
Personal traits were also predictors of the extent of consumers’ information search.
The effect of attitudes toward risk on the extent of consumers’ information search was
statistically significant (t=12.30, p<0.0001). The unstandardized regression coefficient
for attitudes toward risk was 0.1964, which indicates that consumers who are risk liberal
would engage in information search that would be 19.64% higher than those who are risk
Page 69
62
neutral. The extent of consumers’ information search was also significantly but
negatively influenced by their inherent novelty seeking (t=-22.11, p<0.0001). The
coefficient of -0.3184 indicates that the extent of information search is 31.84% lower for
the most inherently innovative consumers than for average consumers.
Among the demographic characteristics, only age (t=4.00, p<0.0001) and income (t=-
2.78, p=0.0055) could be used to predict the extent of consumers’ information search.
Age was positively related to the extent of consumers’ information search. A one-year
increase in age will result in an increase in information search of 0.41%. There was a
significant difference between the extent of information search for households with
incomes less than $35,000 and those with incomes ranging from $35,000 to $59,999. The
extent of information search for households with incomes less than $35,000 was only
about 87% of that for households with incomes between $35,000 and $59,999. The extent
of information search among households who earned more than $60,000 was not
significantly different, relative to information search of households earning between
$35,000 and $59,999.
The null hypothesis that the set of seven variables would not explain any of the
variance in the extent of consumers’ information search was rejected (F=112.63,
p<0.0001). The R-square for the whole model was 0.2485, indicating that investment-
pecific individual differences, personal traits and demographic characteristics explained
about 25% of the variability in the extent of consumers’ information search. After
adjusting for the number of variables in the model and the sample size, the adjusted R-
square is 0.2463.
Page 70
63
Logistic Regression Analysis
Whether or not consumers will choose a certain source of information is another
question of interest in this study. The information sources included literature, media, the
Internet, friends/family and professional services. Thus, five models were established and
logistic regression analyses were conducted to examine each model for each information
source using SAS PROC LOGISTIC procedure. The dependent variable in each model
was the log odds ratio, ln (P1/P2), where P1/P2 was the probability of using a certain
source of information over the probability of not using that source of information. The
factors that were expected to influence consumers’ choice of a certain information source
were their subjective knowledge of investments and their income; the other variables
served as control variables. The results of the logistic regression analyses are presented in
Table 12 to Table 16.
Literature
Table 12 shows the results of the estimated logistic regression model concerning
consumers’ choice of literature as an information source. Consumers’ subjective
knowledge was significantly related to the log odds of consumers’ choice of literature
with a Wald χ2 of 27.17 (p<0.0001). Consumers with a higher level of subjective
knowledge were more likely to seek information from literature than those with a lower
level of subjective knowledge (the factor score ranges from –1 to 1). Specifically, the
odds of choosing literature as an information source for consumers who perceived
themselves as the most knowledgeable were about one and a quarter as large as they were
for those who perceived themselves to have average knowledge (the odds ratio=1.232).
There was also a significant relationship between consumers’ income and their choice of
Page 71
64
literature as an information source. Compared to households with incomes ranging from
$35,000 to $59,999, both households who earned less than $35,000 and households who
earned $60,000 to $99,999 were less likely to search for information from literature
(Wald χ2=46.30, p<0.0001; Wald χ2=7.12, p=0.0076, respectively). High-income
households who earned more than $100,000 were marginally more likely to search for
information from literature (Wald χ2=3.52, p=0.0605).
The model was a good fit with a Chi-square of 841.24 (p<0.0001). The whole model
had a significant predictive efficacy for the log odds of consumers’ use of literature as an
information source. Specifically, the independent variables as a whole improved the
predictive efficacy of the model by 20.05% over the null model.
Media
The results of the estimated logistic model for consumers’ use of media as an
information source are showed in Table 13. Subjective knowledge was significantly and
positively related to the log odds of consumers’ use of media as an information source
(Wald χ2= 40.74, p<0.0001). The odds ratio was 1.263. Consumers with the highest level
of subjective knowledge had odds of choosing media about one and one-fourth as large as
those of consumers with an average level of subjective knowledge. Households with
incomes less than $35,000 were less likely to search for information from media than
households with incomes of $35,000 to $59,999 (Wald χ2=8.17, p=0.0043). The log odds
of searching for information from media for low-income households with incomes less
than $35,000 were a little less than three-fourths as large as they were for households
with incomes of $35,000 to $59,999. Similarly, households with incomes of $60,000 to
$99,999 were less likely to search for information from media than households with
Page 72
65
incomes of $35,000 to $59,999 (Wald χ2=5.12, p=0.0237). Their odds of seeking
information from media were about four-fifths as large as they were for households with
incomes of $35,000 to $59,999. No difference in the likelihood of searching from media
was found between households with incomes between $35,000 to $59,999 and those with
incomes above $100,000. The Chi-square of 371.05 was significant at 0.001 level for this
model. All of the independent variables as a whole improved the predictive efficacy in
consumers’ choice of media as an information source by 9.4%.
The Internet
Table 13 presents the results of the logistic regression analysis for usage of the
Internet as an information source. A significant and positive relationship was found
between one’s subjective knowledge and his/her log odds of using the Internet for
information (Wald χ2=75.76, p<0.0001). The odds for consumers who perceived
themselves to be the most knowledgeable were nearly one and one-half as large as they
were for consumers who had an average level of subjective knowledge. An increase in
subjective knowledge increased one’s likelihood of seeking information from the
Internet. Both households who earned less than $35,000 annually and those who earned
between $60,000 to $99,999 were less likely to search for information from the Internet
(Wald χ2=51.66, p<0.0001; Wald χ2=10.54, p=0.0012) than households who earned
between $35,000 to $59,999. The odds of using the Internet for information for
households with incomes less than $35,000 and for households with incomes between
$60,000 to $99,999 were only about one-third and two-thirds as large as they were for
households with incomes of $35,000 to $59,999. However, the likelihood of seeking
information from the Internet was the same for households who earned more than
Page 73
66
$100,000 as for households who earned $35,000 to $59,999. A good fit of the model was
indicated by the highly significant Chi-square of 918.45 (P<0.0001). The predictive
efficacy was improved by 21.68% over the null model (R-square=0.2168).
Friends/family
In Table 15 are the logistic regression results with respect to consumers’ seeking
information from friends or family members. These results were somewhat different from
those for consumers’ choice of literature, media or the Internet as information sources.
Subjective knowledge negatively affected the log odds of consumers’ choice of
friends/family as an information source (Wald χ2=7.85, p=0.0051). The odds of seeking
information from friends or family members for consumers who had the highest level of
subjective knowledge were about 90% as large as they were for consumers who had an
average level of subjective knowledge. Among groups with different income levels, only
those who earned less than $35,000 had a decreased likelihood of seeking information
from friends or family members (Wald χ2=10.60, p=0.0011). The odds of consumers’ use
of friends/family as an information source for households with incomes less than $35,000
was about 70% as large as it was for households with incomes of $35,000 to $59,999.
Households who earned above $60,000 did not demonstrate differences in their
likelihood of seeking information from friends and family members (Wald χ2=0.99,
p=0.3196; Wald χ2=0.0725, p=0.7877, respectively). The Chi-square for this model was
322.98 and the improvement in the predictive efficacy over the null model was about
8.23% (R-square=0.0823).
Page 74
67
Professional financial services providers
Table 16 presents the results of the logistic regression analysis of consumers’ use of
professional services as a source of information. Subjective knowledge exerted a negative
effect on the log odds of consumers’ use of professional services as a source of
information (Wald χ2=13.39, p=0.0003). Increases in one’s subjective knowledge would
decrease his/her likelihood of seeking information from professional services. The odds
of consumers’ use of professional services for consumers with the highest level of
subjective knowledge were about 86% as large as they were for consumers with an
average level of subjective knowledge. Again, the results showed that low-income
households who earned less than $35,000 annually were less likely to turn to professional
services providers for information than households who earned $35,000 to $59,999. Their
odds of seeking information from professional services were only 42% as large as those
for households with incomes of $35,000 to $59,999. The likelihood of seeking
information from professional services providers was the same for all households with
incomes above $35,000. This model also produced a significant Chi-square of 356.36 and
improved the predictive efficacy of consumers’ choice of professional services by 9.04%
(R-square=0.0904).
In addition to subjective knowledge and income, there were five other variables
included in each model. While they served as control variables in this study, some of the
results are worthy of discussion here. The amount invested had a significant effect only in
the model regarding the choice of literature as an information source. In contrast,
attitudes toward risk was a significant predictor in all of the five models and the
coefficients were all positive. In other words, more liberal attitudes toward risk tended to
Page 75
68
increase the likelihood of seeking information from all sources. Consumers’ inherent
novelty seeking also influenced their use of information sources. A positive relationship
was found in the case of the Internet and a negative for use of friends/family and
professional financial services providers. Age also played a significant role in predicting
the odds of consumers’ choice of use of the Internet, friends/family and professional
services. In general, older consumers were less likely to seek information from the
Internet and friends/family but more likely to seek information from professional services
providers than younger consumers. The effects of education were similar in all five
models; compared to high school graduates, consumers who had at least some college
education were more likely to search for information from all five sources. Consumers
with less than a high school education differed from high school graduates only in terms
of using literature and professional financial services as information sources.
Page 76
69
CHAPTER 6
DISCUSSION
This study investigated the factors that influenced the extent of consumers’
information search and their use of certain types of information sources (i.e., literature,
media, the Internet, friends/family and professional services providers) when making
investment decisions. Investment-specific individual differences (i.e., subjective
knowledge, perceived risk and the amount of investment), personal traits (i.e., attitudes
toward risk and inherent novelty seeking) and demographic characteristics (i.e., age,
education and income) were expected to affect the extent of consumers’ information
search. The effects were expected to be mediated by benefits of search, costs of search,
motivation to search and ability to search. However, because measures of the mediators
(i.e. benefits of search, costs of search, motivation to search and ability to search) were
unavailable in the MacroMonitor, the secondary dataset used in this research, the
analyses could not include examination of these mediators.
Multiple regression was employed in the analysis of the extent of consumers’
information search. Hypotheses testing were based on the directions and magnitudes of
the parameters estimated from the regression analyses. A summary of the hypotheses
tests is shown in Table 17. Among the investment-specific individual differences, both
subjective knowledge and the amount of investment impacted the extent of consumers’
information search.
Page 77
70
The multiple regression analysis showed that the extent of consumers’ information
search was negatively associated with their subjective knowledge about investment
products. However, the effect of subjective knowledge on information search needs a
more in-depth analysis. As discussed earlier, subjective knowledge has multiple effects
on the extent of consumers’ information search, with the effects mediated by benefits of
search, cost of search and ability to search, respectively. The different mediators affect
search in different ways. Specifically, increased subjective knowledge decreases
information search by lowering perceived benefits from search (H1.1); increased
subjective knowledge increases information search by lowering perceived costs of search
and increasing perceived ability to search (H1.2a and H1.3). Since the first effect is
negative while the last two effects are positive, the total effect of subjective knowledge
depends on the relative magnitude of the opposite effects. Because the mediators were
not measured, these effects of subjective knowledge could not be tested separately.
Therefore, it was the total effect of subjective knowledge that was examined in the
analysis. Nevertheless, the analysis still generated meaningful results. Since consumers’
subjective knowledge was found to negatively affect the extent of consumers’
information search, it suggests that the negative effect outweighs the positive effects of
subjective knowledge on consumers’ extent of information search. Thus, hypothesis 1.1
was supported. Consumers with a higher level of subjective knowledge were less
motivated to search and actually engaged in less search than those with a lower level of
subjective knowledge.
As expected, the total amount invested had a positive impact on consumers’
information search. Consumers with more money in investments, as expected, engaged in
Page 78
71
more search activities for information (H2 supported). When the investment is larger, it
may be more important and thus the consumer is likely to be more involved. However,
the effect was relatively small; a $1,000,000 difference in the amount invested will only
resulted in a 0.4% difference in the extent of information search. This result may suggest
that even though the amount invested differed among households, the importance of the
investment depends on the amount invested relative to that household’s wealth or
income. If so using only the amount invested may make households appear similar in
information search behavior when they may not be. As an individual’s investments
increase over time, the extent of information search may not increase or may not increase
proportionately to the increase in investments if information search was thorough before
making the initial investment decision. Thus, one’s future investment decisions may rely
largely on one’s previous knowledge unless there is a dramatic increase in the amount
invested.
Personal traits were also significantly related to the extent of one’s information
search. However, the results were opposite of the hypothesized direction. Consumers who
were more accepting of risk engaged in more search for information than those who were
more risk averse (H3 not supported). This result was further confirmed in the descriptive
analysis reported in Table 4. The factor scores of attitudes toward risk for active
information searchers were higher (i.e., a more liberal attitude toward risk) than the
scores for passive searchers. A plausible explanation would be that a consumer who has a
more liberal attitude toward risk is not only more willing to take substantial risk but also
expects a higher return than a consumer who has a more conservative attitude toward
risk. Consumers who are willing to take substantial risk for high returns may engage in
Page 79
72
more search activities in an attempt to reduce the risk (Bauer, 1960; Bennett & Harrel,
1975; Howard & Sheth, 1969). In contrast, risk-averse consumers tend to purchase
investment products that have lower risk and also a lower return. The benefits to search
for information about low-risk, low-return investment products are not as great as for
high-risk, high-return products.
The effect of inherent novelty seeking on consumers’ information search was
significant and negative (H4 not supported). This result was, however, contrary to what
was hypothesized. One possible explanation is the weakness of the measurement of
inherent novelty seeking in this study. As noted in the results of the factor analysis (Table
2), the inherent novelty seeking factor did not have large factor loadings and there was a
cross loading with the factor on attitudes toward risk. Therefore, the result concerning the
effect of inherent novelty seeking is not robust and future investigation of this variable is
necessary.
Among the demographic characteristics, income and age had significant impacts on
the extent of consumers’ information search. In addition, it should be noted that the
difference between consumers who did not complete high school and those who did was
marginally significant (p value=0.06). No difference was found among respondents with
other levels of educational attainment (H6 not supported). Compared to high school
graduates, consumers with less than a high school education searched less, perhaps as a
result of their lower levels of knowledge and greater difficulty in understanding materials
related to investment products.
Income was a significant predictor of the extent of consumers’ information search.
Yet, its effect was not in the direction hypothesized. Increases in income were expected
Page 80
73
to decrease one’s information search. Instead, the results indicated that low-income
consumers (i.e., those with household incomes less than $35,000) searched less than
consumers with household incomes between $35,000 and $59,999, while no difference in
the extent of information search was found among the consumers with household
incomes higher than $35,000 (H5a not supported). These results were also reflected in the
descriptive statistics in Table 4. Nearly one-half of those who are in the lowest (49.81%)
or second (48.99%) quartile of the extent of information search were consumers in
households with incomes below $35,000. Previous studies had suggested either a linear
relationship (Marvel, 1976) or an inverted-U-shape relationship (Andreasen & Ratchford,
1976; Carlson & Gieseke, 1983; Morgan, 1988; Ratchford, 1988) between income and
consumers’ extent of information search. Despite a lower opportunity cost, perhaps low-
income consumers engaged in little search. Note that a majority (52.68%) of the most
passive information searchers had no more than a high school education.
Age was another significant demographic characteristic that was expected to predict
the extent of consumers’ information search. Older consumers searched more for
information than younger consumers. The largest percentage of consumers in the group
of most active information searchers (who were in the fourth quartile of the extent of
information search in Table 4) was those who were at least 55 years old. This is also
contrary to the hypothesized direction (H7 not supported). The positive effect was not
very robust since 10 years difference in age only resulted in a 4.1% difference in the
extent of search. Interestingly, the descriptive analysis in Table 4 revealed that the most
passive information searchers were almost as old as the most active searchers on average,
and both were older than the moderate passive and active searchers.
Page 81
74
As discussed earlier, even though consumers may exhibit a similar effort in overall
search for information, they may vary in their choice of information sources. In this
study, the sources were grouped into five categories: literature, media, the Internet,
friends/family and professional financial services providers. Consumers’ subjective
knowledge and income were expected to influence their decisions of whether to use each
of the types of information sources. The results are summarized in Table 18 in Appendix
A, along with the results associated with total amount invested, attitudes toward risk,
inherent novelty seeking, age and education. Each served as control variables and may
provide additional insights for future studies.
Both subjective knowledge and income had a significant effect on consumers’
likelihood of using literature as an information source. Relative to consumers with a
lower level of subjective knowledge, those with a higher level of subjective knowledge
were more likely to search for information from literature, such as books and consumer
magazines (H1.2b supported). Perhaps they think of themselves as more capable of
understanding and taking advantage of the information conveyed in literature. A
relatively low cost associated with search from this source could be another important
reason that consumers choose literature.
The likelihood of searching from literature was expected to decrease as income
increased. Compared to consumers with household incomes between $35,000 and
$59,999, the likelihood of searching information from literature decreased for consumers
with household incomes between $60,000 and $99,999 as expected (H1.6b supported in
this case), while it increased for consumers with household incomes higher than $100,000
and decreased for consumers with household incomes less than $35,000 (H5b not
Page 82
75
supported). In other words, the relationship between income and the likelihood of
searching for information from literature was cubic rather than linear. A higher
opportunity cost may be a major reason that consumers with household incomes between
$60,000 and $99,999 were less likely to use literature as information source. For
consumers with household incomes less than $35,000, books or magazines are relatively
more expensive than for other households with higher incomes. In addition, it is possible
to assume that their lower levels of education may overtake the benefits of their low
opportunity cost and therefore discourage them from using this source of information. In
contrast, the higher educational level of those with incomes higher than $100,000 may
make them more efficient in getting information from literature, and this advantage may
overshadow the disadvantage of a higher opportunity cost. The likelihood of using
literature was only marginally different (p=0.0605) between consumers with household
incomes between $35,000 and $59,999 and those with household incomes higher than
$100,000. The analysis also showed that those with more education were more likely to
search for information from literature, which suggests education improve one's efficiency
of search for information from literature.
Concerning consumers’ use of media as an information source, subjective knowledge
and income were significant predictors. Consumers who perceived they had a higher
level of knowledge were more likely to seek information from media (H1.2c supported).
Similar to those who seek information from literature, consumers with a higher level of
subjective knowledge believed they were better able to understand the professional terms
and information distributed by the media. Media is a good choice also because the
information is widely available and practically free. The primary cost to consumers is
Page 83
76
time spent looking for the specific media and/or specific information. Compared to
consumers with household incomes between $35,000 and $59,999, consumers whose
household incomes were less than $35,000 and those whose household incomes were
between $60,000 and $99,999 were less likely to search for information from media,
while consumers whose household incomes were $100,000 or more were equally likely
to search from media (H5c partially supported). This result is similar to the one for
literature as an information source.
Both subjective knowledge and income had a significant impact on consumers’
search from the Internet. Consumers who think of themselves as more knowledgeable
were more likely to search from the Internet (H1.2d supported). Perhaps they believe
their previous knowledge could help them with searching and understanding the
information. They are more likely to know that there is information about investment on
the Internet. Low-income consumers in households with incomes less than $35,000 were
much less likely to use the Internet for information than those with incomes between
$35,000 and $59,999. According to a recent report from U.S. General Accounting office
(2001), the median income for households that have no access to either DSL or cable
modem was about $28,000. A generally low level of computer literacy and the
unavailability of Internet access to many low-income consumers mean they are less likely
to use the Internet. Consumers with household incomes between $60,000 and $99,999
were also less likely to search for information on the Internet than those with household
incomes between $35,000 and $59,999. The effect of a high opportunity cost may
outweigh any advantages associated with households with incomes between $60,000 and
$99,999, such as greater access to the Internet. Interestingly, there was no difference in
Page 84
77
the likelihood of using the Internet for information between consumers in households that
earned $100,000 or more and those in households that earned $35,000 to $59,999.
Perhaps the greater efficiency of households with incomes of $100,000 or more leads to
greater perceived benefits from search for information, compared to consumers with
household incomes of $35,000 to $59,999. The greater benefits of the search could justify
the higher opportunity cost. Therefore, the negative effect of income on consumers’ use
of the Internet was present only when income increased from the level of $35,000-
$59,999 to the level of $60,000-$99,999 (H5d partially supported).
The likelihood of seeking investment information from friends or family members
was associated with one’s subjective knowledge and income. Different from the findings
of use of literature, media or the Internet, increased subjective knowledge decreased
one’s likelihood of seeking information from friends and/or family members (H1.2e
supported). Friends and family members tend to provide advice about which investment
products to buy rather than information about the quality of an investment product.
Furthermore, their advice may often be biased or obsolete. Thus, consumers with higher
levels of subjective knowledge are less likely to seek advice from friends or family
members. The analysis found that consumers with household incomes in the three
categories above $35,000 were equally likely to search for information from friends
and/or family members (H5e not supported in this case). However, consumers in
households earning less than $35,000 were less likely to seek information from friends or
family members than consumers with household incomes between $35,000 and $59,999
(H5e supported in this case). One’s friends or family members usually are similar in
terms of socioeconomic status. Thus advice about investments from lower-income
Page 85
78
consumers’ peers may neither be very available, reliable, nor helpful. Moreover, as
discussed earlier, lower-income consumers engaged in less overall search than consumers
with household incomes between $35,000 and $59,999. Thus, it appears the investment
information that a lower-income consumers’ friends and/or family members might
provide would be limited. These results also suggest that opportunity cost was almost
negligible when obtaining information from friends and/or family members perhaps
because the search process is usually not independent but often involved in daily social
activities.
As for professional financial service providers as an information source, subjective
knowledge and income significantly affected one’s likelihood of using this source.
Consumers with a higher level of subjective knowledge were less likely to use
professional financial services providers (H1.2f supported). This result is logical since
consumers who are confident with their own knowledge may not need professional
advice, which is often expensive. Instead, other relatively cheaper sources, such as
literature, media and the Internet, would be good alternatives to the expensive
professional services. Lower-income consumers in households that earned less than
$35,000 were less likely to seek information from professional services providers than
consumers with household incomes between $35,000 and $59,999 (H5f supported in this
case). The relatively high cost associated with professional financial services may prevent
low-income consumers from using this source of information. The relatively small
amounts invested by lower-income consumers make the potential benefits from using
professional services less likely to equal or exceed the corresponding costs. No
significant difference was found among the three groups of consumers with household
Page 86
79
incomes above $35,000 (H5f not supported in this case). This is surprising since not only
do financial services become more affordable as income increases but opportunity cost of
searching for information also increases. There may be two plausible reasons for this
result. First, there may be some interaction effects between income and other factors,
such as education, knowledge and involvement, on consumers’ use of professional
services. In other words, the effect of income on the likelihood of using professional
financial services may depend on levels of other factors. Second, there are various types
of professional services providers, such as full services brokers and discount brokers.
Difference would be observed on consumers’ likelihood of using each of different types
of services even though the overall likelihood of using professional financial services is
not different. Future studies in terms of seeking information from professional services
providers are warranted.
Page 87
80
CHAPTER 7
CONCLUSIONS AND IMPLICATIONS
The major purpose of this study was to better understand consumers’ information
search behavior when making investment decisions. Based on the economic,
psychological and information processing approaches in the area of consumer
information search, a conceptual model was established to investigate consumers’ extent
of information search. Using data from 2000-01 MacroMonitor, this study empirically
investigated the factors that influence the extent of consumers’ information search and
their use of information sources when searching for an intangible good - investments.
Along with the literature on the nature of investment decisions and consumer information
search, the results of this study contribute to the understanding of the two fundamental
information search issues: how much and from what sources consumers search for
information about investment products.
A majority of U.S. households actively searched for information when making their
investment decisions. The analysis suggested that investment-specific individual
differences (i.e., one’s subjective knowledge and amount invested), personal traits (i.e.,
attitudes toward risk and inherent novelty seeking) and demographic characteristics (i.e.,
age and income) are useful predictors of consumers’ extent of information search.
Active information searchers tended to be those who were not as confident in their
own knowledge about investments and those who possessed larger amounts of
investment assets. Among the most active information searchers, nearly two-fifths
Page 88
81
(38.6%) had total investments greater than $100,000; the majority of those had
investments greater than $200,000. Active searchers were also more willing to take risks
but were not necessarily inherent novelty seeking. They accepted higher risks and also
expected higher returns associated with these investment products, but not because of
their inherent innovativeness. Active searchers tended to be older. However, the term
“older” is relative. The average age for the most active searchers was 49.8 years old.
Active searchers also tended to have household incomes above $35,000; however, one’s
educational level was not predictive of the extent of his/her extent of information search
for investment products.
It should be noted that attitudes toward risk and age were significant predictors of the
extent of consumers’ information search, but the relationship was not consistent with the
findings of previous studies of other goods. Consumers’ information search behavior for
investment products appears to be different from their search behavior for tangible
products. Therefore, results from previous studies on search for information about
tangible products may not be applicable to consumers’ information search for investment
products.
Consumers can choose to obtain information from a variety of sources, such as
literature, media, the Internet, friends/family and professional services providers. Each is
different in terms of the value of the information as well as the costs. Whether to use a
particular information source depends on consumers’ characteristics, as shown by the
results of this study.
A consumer’s subjective knowledge influenced his/her use of information sources.
Literature, media and the Internet were more likely to be chosen as an information source
Page 89
82
by consumers who considered themselves more knowledgeable, while friends/family and
professional services providers were less likely to be used.
Consumers possessing different amounts of investments were equally likely to use
media, the Internet, friends/family or professional financial services except literature as
an information source. Consumers with larger amounts of investment assets were more
likely to search for information from literature.
Attitudes toward risk was a significant predictor of consumers’ use of information
sources when making investment decisions. Consumers with a more liberal attitude
toward risk were more likely to seek information from any type of information sources,
which may suggest that information from all sources will be helpful in reducing the risk
associated with investing.
Consumers’ use of information sources also depended on their inherent novelty
seeking. Consumers who were more inherently innovative had no special preference for
information from literature or the media, but were more likely to use the Internet and less
likely to use friends/family and professional financial services providers.
One’s age was also a predictor of his/her use of information sources. Consumers of
all ages were equally likely to seek information from literature and media. Consumers
who obtained information from the Internet tended to be younger. However, younger was
middle-aged in this sample since the average age for the Internet users was 40.8 years
old. Consumers who obtained advice from friends/family also tended to be relatively
younger (43.53 years old on average). Consumers who searched for information from
professional financial services providers tended to be older, but only by a few years. On
average, consumers using professional financial services were 50.2 years old.
Page 90
83
Consumers with different levels of educational attainment used different information
sources when they made investment decisions. Literature and professional financial
services providers were less likely to be used by consumers with less than a high school
education. Education did not influence use of information from media, the Internet and
friends/family. Compared to consumers with a high school education, those who had at
least some college education were more likely to use each of the information sources.
Income level also influenced the information sources an individual used to make
investment decisions. Relative to consumers whose household incomes were between
$35,000 and $59,999, households earning less than $35,000 were less likely to use any of
the information sources; consumers whose households earned between $69,999 and
$99,999 were less likely to use literature, media and the Internet but were not different in
obtaining advice from friends/family or professional financial services providers. Those
whose household incomes were above $100,000 were more likely to choose literature as
an information source but equally likely to search for information from media, the
Internet, friends/family and professional financial services providers.
This study provides insights for marketers of investment products or services. First, in
a marketing campaign, it is important to differentiate active searchers from passive
searchers and to develop different strategies for reaching different types of searchers.
Those selling investment products should target consumers who actively search for
information. Such consumers are those with a lower level of subjective knowledge, a
larger amount invested, who are willing to take substantial risks for higher returns, are
around 48 to 50 years old and whose annual household income is at least $35,000.
Marketers should aim to provide plenty of information relevant to these consumers to
Page 91
84
persuade them to make purchase decisions. Furthermore, as consumers have many
choices of information sources, marketers should also take into account the target clients’
characteristics when choosing the information channels to disseminate information. For
example, marketers of high-risk, high-return investment products should focus on those
consumers with a liberal attitude toward risk and provide information through various
information sources since risk-taking consumers are likely to search from all information
sources. The most effective way to market an investment product designed for older
investors is through professional financial service providers rather than through literature,
media or the Internet advertising.
Marketers of literature, such as books and financial magazines, should focus on those
consumers who are not so confident in their own knowledge but have a liberal attitude
toward risk, and those who have both a high household income and a large amount
invested. The information conveyed in literature could be relatively sophisticated since
most of the searchers would have at least some college education. Media programs that
distribute investment information will likely find their primary audience to be those
consumers who consider themselves more knowledgeable and more risk-taking and who
are better educated. The focus of Internet information providers, such as online services
providers, should be consumers who have a higher level of subjective knowledge, a
liberal attitude toward risk and a higher level of inherent novelty seeking;
demographically, the target audience is younger and better educated. Consumers whose
households earned less than $35,000 or those who earned between $60,000 and $99,999
should not be considered by Internet information providers as target clients. Professional
Page 92
85
financial services providers should particularly target consumers who have lower levels
of subjective knowledge, who are more risk-taking, older, and better educated.
The results of this study are also meaningful to consumer educators, financial
planners and counselors. The most important implication would be the fact that it is very
necessary to teach consumers to accurately assess their own knowledge about
investments since the extent of information search will decrease as subjective knowledge
increases. Especially, overconfidence with their own knowledge will make themselves
underestimate the importance of information search and potentially make risky
investment decisions without sufficient information. Many older consumers were among
the most passive information searchers. Consumer educators and financial planners
should help these consumers to recognize their shortcomings and encourage them to
accurately assess the costs and benefits of searching for information before making
investment decisions. It is also a responsibility of consumer educators to help those
consumers who have a lower level of knowledge about investment products by
identifying reliable sources of information and improving consumers’ information search
skills.
This study also has implications for future research. First, the area of research about
consumers’ information search behavior for intangible goods (e.g., investment products)
needs more attention because the findings of this study suggest that what we have learned
about information search for tangible goods is not directly applicable to information
search for investment products.
Without the measurements of the mediators in this study, the proposed model related
to consumers’ extent of information search for investment products remains conceptual.
Page 93
86
The mechanism between the antecedents and information search would be better
understood if the effects of the mediators were empirically demonstrated. In particular,
the multiple effects of subjective knowledge on consumers’ extent of information search
through different mediators could be illustrated.
Also, improvement in measurement is needed, especially for inherent novelty
seeking. A more comprehensive model needs to be estimated including, variables
unavailable in this research, such as perceived risk. In addition, it is suggested that future
researchers examine the interactions among influential factors since some surprising
nonlinear relationships between independent variables and dependent variables were
found in this analysis.
Finally, as a preliminary effort, this study only examined consumers’ likelihood of
choosing a certain type of information sources. Considering the interaction effects among
information sources (Lee & Hogarth, 2000c), further study needs to consider the effect of
using a particular information source on a consumer’s use of other sources of
information. Comparing the relative importance of various information sources would
further contribute to the understanding of information search behavior.
Page 94
87
REFERENCES
Acker, M., & McReynolds, P. (1967). The need for novelty: A comparison of six
instruments. Psychological Record, 17, 177-182.
Alba, J. W., & Hutchinson, J. W. (1987). Dimensions of consumer expertise. Journal
of Consumer Research, 13, 411-454.
Alba, J. W., & Hutchinson, J. W. (2000). Knowledge calibration: What consumers
know and what they think they know. Journal of Consumer Research, 27, 123-156.
Andreasen, A. R., & Ratchford, B. T. (1976). Factors affecting consumers’ use of
information sources. Journal of Business Research, 4, 197-212.
Archibald, R. B., Haulman, C. A., & Moody, C. E. (1983). Quality, price,
advertising, and published quality ratings. Journal of Consumer Research, 9, 347-356.
Arndt, J. (1967). Word of mouth advertising and information communication. In
D.F. Cox (Ed.), Risk-taking and information handling in consumer behavior (pp. 189-
239). Boston: Boston University Press.
Arndt, J. (1968). A test of the two-step flow in diffusion of a new product.
Journalism Quarterly, 45, 457-465.
Arrow, K. J. (1965). Aspects of the theory of risk bearing. Helsinki: Yrjo Jahnsson
Foundation.
Arrow, K. J. (1988). Behavior under uncertainty and its implication for policy. In E.
B. David, H. Raiffa, & A. Tversky (Eds.) Decision making: Descriptive, normative, and
prescriptive interactions (pp. 497-507). New York: Cambridge University Press.
Page 95
88
Babin, B. J., Darden, W. R., & Griffin, M. (1994). Work and/or fun: Measuring
hedonic and utilitarian shopping value. Journal of Consumer Research, 20, 644-656.
Bakshi, G. S., & Chen, Z. (1994). Baby boom, population aging and capital markets.
Journal of Business, 67, 165-202.
Bauer, R. A. (1960). Consumer behavior as risk taking. In R. S. Hancock (Ed.),
Dynamic marketing for a changing world (pp. 389-398). Chicago: American Marketing
Association.
Beales, H., Mazis, M. B., Salop, S. C., & Satelin, R. (1981). Consumer search and
public policy. Journal of Consumer Research, 8, 11-22.
Beatty, S. E., & Smith, S. M. (1987). External search effort: An investigation across
several product categories. Journal of Consumer Research, 14, 83-95.
Bennett, P. D., & Harrell, G. D. (1975). The role of confidence in understanding and
predicting buyers’ attitudes and purchase intentions. Journal of Consumer Research, 2,
110-117.
Bertaut, C. C., & Starr-McCluer, M. (2000). Household portfolios in the United
States. Federal Reserve Board Finance and Economics Discussion Paper 2000-26.
Bettman, J. R. (1979). An information processing theory of consumer choice.
Reading, MA: Addison-Wesley Publishing Company.
Bettman, J. R., & Park, C. W. (1980). Effects of prior knowledge and experience and
phase of the choice process on consumer decision processes: A protocol analysis. Journal
of Consumer Research, 7, 234-248.
Bloch, P. H., & Richins, M. L. (1983). A theoretical model for the study of product
importance perception. Journal of Marketing, 47(3), 69-81.
Page 96
89
Bloch, P. H., Sherrell, D. L., & Ridgway, N. M. (1986). Consumer search: An
extended framework. Journal of Consumer Research, 13, 119-126.
Bloom, P. N. (1989). A decision model for prioritizing and addressing consumer
information problems. Journal of Public Policy and Marketing, 8, 161-180.
Brucks, M. (1985). The effect of product class knowledge on information search
behavior. Journal of Consumer Research, 12, 1-16.
Burnkrant, R. E. (1976). A motivational model of information processing intensity.
Journal of Consumer Research, 3, 21-30.
Butters, G. R. (1977). Equilibrium distribution of sales and advertising prices. Review
of Economic Studies, 44, 465-491.
Capon, N., & Burke, M. (1980). Individual, product class, and task-related factors in
consumer information processing. Journal of Consumer Research, 7, 314-326.
Capon, N., & Lutz, R. J. (1979). A model and methodology for the development of
consumer information program. Journal of Marketing, 43(1), 58-67.
Carlson, J. A., & Gieseke, R. J. (1983). Price search in a product market. Journal of
Consumer Research, 9, 357-365.
Cattell, R. B. (1975). Personality and motivation: Structure and measurement. New
York: Harcourt, Brace & World, Inc.
Chang, Y. R., & Hanna, S. (1992). Consumer credit search behavior. Journal of
Consumer Studies and Home Economics, 16, 207-227.
Chaudhuri, A. (2000). A macro analysis of the relationship of product involvement
and information search: The role of risk. Journal of Marketing Theory and Practice, 8(1),
1-14.
Page 97
90
Chase, W. G., & Simon, H. A. (1973). Perception in chess. Cognitive Psychology, 4,
55-81.
Childers, T. L., & Rao, A. R. (1992). The influence of familial and peer-based
reference groups on consumer decisions. Journal of Consumer Research, 19, 198-211.
Claxton, J. D., Fry, J. N., & Portis, B. (1974). A taxonomy of prepurchase
information gathering patterns. Journal of Consumer Research, 1(3), 35-42.
Cohn, R. A., Lewellen, W. G., Lease, R. C., & Schlarbaum, G. G. (1975). Individual
investor risk aversion and investment portfolio composition. Journal of Finance, 30, 605-
620.
Cole, C. A. (1983). Elderly consumers’ responses to advertising: Processing
deficiencies versus production deficiencies. Unpublished doctoral dissertation. University
of Wisconsin, Madison.
Cole, C. A., & Balasubramanian, S. K. (1993). Age differences in consumers’ search
for information: Public policy implications. Journal of Consumer Research, 20, 157-169.
Cox, D. F. (1967). The influence of cognitive needs and styles on information
handling in making product evaluations. In D. F. Cox (Ed.), Risk taking and information
handling in consumer behavior (pp. 370-392). Boston: Harvard University Press.
Cunningham, S. M. (1964). Perceived risk as a factor in product-oriented word-of-
mouth behavior: A first step. In L. G. Smith (Ed.), Reflections on progress in marketing
Proceedings of the 1964 Educators Conference, (pp. 229-238). Chicago: American
Marketing Association.
Page 98
91
Cunningham, S. M. (1967a). The major dimensions of perceived risk. In D. F. Cox
(Ed.) Risk taking and information handling in consumer behavior (pp. 82-111). Boston:
Harvard University.
Cunningham, S. M. (1967b). Perceived risk as a factor in informal consumer
communications. In D. F. Cox (Ed.) Risk taking and information handling in consumer
behavior (pp. 265-288). Boston: Harvard University.
Derbaix, C. (1983). Perceived risk and risk relievers: An empirical investigation.
Journal of Economic Psychology, 3, 19-38.
Dickson, P. R. (2000). Understanding the trade winds: The global evolution of
production, consumption and the Internet. Journal of Consumer Research, 27, 115-121.
Dommermuth, W. P. (1965). The shopping matrix and marketing strategy. Journal of
Marketing Research, 2, 128-132.
Dowling, G. R., & Staelin, R. (1994). A model of perceived risk and intend risk-
handling activity. Journal of Consumer Research, 21, 119-134.
Duncan, C. P., & Olshavsky, R. W. (1982). External search: The role of consumer
beliefs. Journal of Marketing Research, 19, 32-43.
Engel, J. F., Kollat, T. D., & Blackwell, R. D. (1972). Consumer behavior. Hinsdale,
IL: The Dryden Press.
Engel, J. F., Kollat, T. D., & Blackwell, R. D. (1973). Consumer behavior. New
York: Holt, Rinehart and Winston.
Engel, J. F., Kollat, T. D., & Miniard, P. W. (1986). Consumer behavior. New York:
CBS College Publishing.
Page 99
92
Farley, J. U. (1964). Brand loyalty and the economics of information. Journal of
Business, 37, 370-381.
Farley, F., & Farley, S. V. (1967). Extroversion and stimulus-seeking motivation.
Journal of Consulting Psychology, 31, 215-216.
Feick, L. F., Herrmann, R. O., & Warland, R. H. (1986). Search for nutrition
information: A probit analysis of the use of different information sources. Journal of
Consumer Affairs, 20, 173-192.
Fishburn, P. C. (1988). Normative theories of decision making under risk and under
uncertainty. In E. B. David, H. Raiffa, & A. Tversky (Eds.), Decision making:
Descriptive, normative, and prescriptive interactions (pp. 78-98). New York: Cambridge
University Press.
Friend, I., & Blume, M. E. (1975). The demand for risky assets. The American
Economic Review, 65, 900-922.
Gutman, J. (1982). A means-end chain model based on consumer categorization
processes. Journal of Marketing, 46(2), 60-72.
Hansen, F. (1972). Consumer choice behavior: A cognitive theory. New York: The
Free Press.
Hawley, C. B., & Fujii, E. T. (1994). An empirical analysis of preferences for
financial risk: Further evidence on the Friedman-Savage model. Journal of Post
Keynesian Economics, 16, 197-204.
Hempel, D. J. (1969). Search behavior and information utilization in the home
buying process. In P.R. McDonald (Ed.), Marketing involvement in society and the
economy (pp. 241-249). Chicago: American Marketing Association.
Page 100
93
Higie, R. A., Feick, L. F., & Price, L. L. (1987). Types and amount of word-of-
mouth communications about retailers. Journal of Retailing, 63, 260-278.
Hill, P. (1999). Tangibles, intangibles and services: A new taxonomy for the
classification of output. The Canadian Journal of Economics, 32, 426-446.
Hirschman, E. C. (1980). Innovativeness, novelty seeking, and consumer creativity.
Journal of Consumer Research, 7, 283-295.
Howard, A. J. (1977). Consumer behavior: Application of theory. New York:
McGraw-Hill Book Company.
Howard, A. J., & Sheth, J. N. (1969). The theory of buyer behavior. New York: John
Wiley & Sons, Inc.
Jacoby, J., & Kaplan, L. B. (1972). The components of perceived risk. In M.
Venkatesan (Ed.), Proceedings of the third annual conference of the Association for
Consumer Research (pp. 382-393). College Park, MD: Association for Consumer
Research.
Johnson, E. L., & Russo, J. E. (1984). Product familiarity and learning new
information. Journal of Consumer Research, 11, 542-550.
Kaplan, L. B., Szybillo, G., & Jacoby, J. (1974). Components of perceived risk in
product purchase: A cross-validation. Journal of Applied Psychology, 59, 287-291.
Katona, G., & Mueller, E. (1954). A study of purchasing decisions. In L. Clark (Ed.),
The dynamics of consumer reaction, consumer behavior (pp. 10-22). New York: New
York University Press.
Keeble, J. B. (2001). Do-it-yourself investing: Do-it-yourselfers will always make up
a very small part of the market. Financial Planning, 31, 123-124.
Page 101
94
Kelly, R. F. (1968). The search component of the consumer decision process: A
theoretical examination. In M. A. King (Ed.), Marketing and the new science of planning
(pp. 271-274). Chicago: American Marketing Association.
Keynes, J. M. (1976). The general theory of employment, interest and money. New
York: Harcourt, Brace & World.
Kiel, G. C., & Layton, R. A. (1981). Dimensions of consumer information seeking
behavior. Journal of Marketing Research, 18, 233-239.
Kohn, M. G., & Shavell, S. (1974). The theory of search. Journal of Economic
Theory, 9, 93-123.
Lal, R., & Sarvary, M. (1999). When and how is the Internet likely to decrease price
competition. Marketing Science, 18(4), 485-503.
Lee, J., & Hogarth, J. M. (2000a). Relationship among information search activities
when shopping for a credit card. Journal of Consumer Affairs, 34, 330-360.
Lee, J., & Hogarth, J. M. (2000b). Shopping for a credit card: The search for
information. Consumer Interests Annual, 46, 115-120.
Lee, J., & Hogarth, J. M. (2000c). Consumer information search for home mortgages:
Who, what, how much, and what else? Financial Services Review, 9, 277-293.
Lehmann, D. R., & Moore, W. L. (1980). Validity of information display boards: An
assessment using longitudinal data. Journal of Marketing Research, 17, 450-459.
Ley, E. (1996). On the peculiar distribution of the U.S. stock indices. The American
Statistician, 50, [on-line]. Available: http://lib.stat.cmu.edu/datasets/djdc0093.
Page 102
95
Lutz, R. J., & Reilly, P. L. (1973). An exploration of the effects of perceived social
and performance risk on consumer information acquisition. Advances in Consumer
Research, 1, 393-405.
Lynch, J. G., & Srull, T. K. (1982). Memory and attentional factors in consumer
choice: Concepts and research methods. Journal of Consumer Research, 9, 18-37.
MacInnis, D. J., Moorman, C., & Jaworski, B. J. (1991). Enhancing and measuring
consumers’ motivation, opportunity, and ability to process brand information from ads.
Journal of Marketing, 55(4), 32-53.
Malhotra, N. K. (1983). On individual differences in search behavior for a
nondurable. Journal of Consumer Research, 10, 125-131.
Marvel, H. P. (1976). The economics of information and retail gasoline price
behavior: An empirical analysis. Journal of Political Economy, 84, 1033-1060.
Midgley, D. F. (1983). Patterns of interpersonal information seeking for the purchase
of a symbolic product. Journal of Marketing Research, 20, 74-83.
Miller, G. A. (1956). The magical number seven, plus or minus two: Some limits on
our capacity for processing information. Psychological Review, 63, 81-97.
Mitra, K., Reiss, M. C., & Capella, L. M. (1999). An examination of perceived risk,
information search and behavior intentions in search, experience and credence services.
Journal of Services Marketing, 13, 208-228.
Miyake, N., & Norman, D. A. (1979). To ask a question, one must know enough to
know what is not known. Journal of Verbal Learning and Verbal Behavior, 18, 357-364.
Page 103
96
Moore, D. A., Kurtzberg, T. R., Fox, C. R., & Bazerman, M. H. (1999). Positive
illusions and forecasting errors in mutual fund investment decisions. Organizational
Behavior and Human Decision Processes, 79, 95-114.
Moore, W. L., & Lehmann, D. R. (1980). Individual differences in search behavior
for a nondurable. Journal of Consumer Research, 7, 296-307.
Moorthy, S., Ratchford, B. T., & Talukdar, D. (1997). Consumer information search
revisited: Theory and empirical analysis. Journal of Consumer Research, 23, 263-277.
Morgan, J. N. (1988). Consumer choice is more than search. In E. S. Maynes (Ed.),
The frontier of research in the consumer interest (pp. 277-306). Columbia, MO:
American Council on Consumer Interests.
Morin, R. A., & Suarez, A. F. (1983). Risk aversion revisited. Journal of Finance, 38,
1201-1216.
Murray, K. B. (1991). A test of services marketing theory: Consumer information
acquisition activities. Journal of Marketing, 55(1), 10-25.
Nagy, R. A., & Obenberger, R. W. (1994). Factors influencing individual investor
behavior. Financial Analysts Journal, 50(4), 63-68.
Neumann, J. V., & Morgenstern, O. (1947). Theory of games and economic
behavior. Princeton: Princeton University Press.
Newman, J. W. (1977). Consumer external search: Amount and determinants. In J. N.
Sheth & P. D. Bennett (Eds.), Consumer and industrial buying behavior (pp. 79-84). New
York: Elseiver North-Holland Inc.
Newman, J. W., & Lockeman, B. D. (1975). Measuring prepurchase information
seeking. Journal of Consumer Research, 2, 216-222.
Page 104
97
Newman, J. W., & Staelin, R. (1971). Multivariate analysis of differences in buyer
decision time. Journal of Marketing Research, 8, 192-198.
Newman, J. W., & Staelin, R. (1972). Prepurchase information seeking for new cars
and major household appliances. Journal of Marketing Research, 9, 249-257.
Newman, J. W., & Staelin, R. (1973). Information sources of durable goods. Journal
of Advertising Research, 13(2), 19-29.
Nicosia, M. F. (1966). Consumer decision processes. Englewood Cliffs, NJ: Prentice-
Hall Inc.
Nisbett, R. C., & Wilson, T. D. (1977). Telling more than we can know: Verbal
reports on mental processes. Psychological Review, 84, 231-259.
Olshavsky, R. W., & Wymer, W. (1995). The desire for new information from
external sources. In S. Mackenzie & R. Stayman (Eds.), Proceedings of the Society for
Consumer Psychology (pp. 17-27). Bloomington, IN: Printmaster.
Ozanne, J. L., Brucks, M., & Grewal, D. (1992). A study of information search
behavior during the categorization of new products. Journal of Consumer Research, 18,
452-463.
Park, C. W., Mothersbaugh, D. L., & Feick, L. (1994). Consumer knowledge
assessment. Journal of Consumer Research, 21, 71-82.
Perry, M., & Hamm, B. C. (1969). Canonical analysis of relations between
socioeconomic risk and personal influence in purchase decision. Journal of Marketing
Research, 6, 351-354.
Page 105
98
Petty, R. E., & Cacioppo, J. T. (1986). The elaboration likelihood model of
persuasion. In L. Berkowitz (Ed.), Advances in experimental social psychology, 19 (pp.
123-205). Orlando, FL: Academic Press.
Phillips, L. W., & Sternthal, B. (1977). Age differences in information processing: A
perspective on the aged consumers. Journal of Marketing Research, 14, 444-457.
Price, L. L., & Feick, L. F. (1983). The role of interpersonal sources in external
search: An informational perspective. Advances in Consumer Research, 11, 250-255.
Price, L. L., Feick, L. F., & Higie, R. A. (1987). Information sensitive consumers and
market information. Journal of Consumer Affairs, 21, 328-341.
Punj, G. N., & Staelin, R. (1983). A model of consumer information search behavior
for new automobiles. Journal of Consumer Research, 9, 366-380.
Ratchford, B. T. (1982). Cost-benefit models for explaining consumer choice and
information seeking behavior. Management Science, 28, 197-212.
Ratchford, B. T. (1988). The economics of information: The views of a marketing
economist. In E. S. Maynes (Ed.), The frontier of research in the consumer interest (pp.
265-269). Columbia, MO: American Council on Consumer Interests.
Ratchford, B. T. (2001). The economics of consumer knowledge. Journal of
Consumer Research, 27, 397-411.
Ratchford, B. T., Lee, M., & Talukdar D. (2002). The impact of the Internet on
information search for automobiles. Unpublished manuscript.
Roselius, T. (1971). Consumer rankings of risk reduction methods. Journal of
Marketing, 35(1), 56-61.
Page 106
99
Rothschild, M. (1973). Models of market organization with imperfect information: A
survey. Journal of Political Economy, 81, 1283-1308.
Russo, J. E. (1988). Information processing from the consumer’s perspective. In E.
S. Maynes (Ed.), The frontier of research in the consumer interest (pp. 185-218).
Columbia, MO: American Council on Consumer Interests.
Russo, J. E., & Leclerc, F. (1991). Characteristics of successful product information
programs. Journal of Social Issues, 47(1), 73-92.
Salop, S. (1976). Information and monopolistic competition. The American
Economic Review, 66, 240-245.
Schaninger, C. M., & Sciglimpaglia, D. (1981). The influence of cognitive
personality traits and demographics on consumer information acquisition. Journal of
Consumer Research, 8, 208-216.
Schiffman, L. G. (1972). Perceived risk in new product trial by elderly consumers.
Journal of Marketing Research, 9, 106-108.
Schiffman, L. G., & Kanuk, L. L. (1983). Consumer behavior. Englewood Cliffs, NJ:
Prentice-Hall, Inc.
Schmidt, J. B., & Spreng, R. A. (1996). A proposed model of external consumer
information search. Journal of the Academy of Marketing Science, 24, 246-256.
Schooley, D. K., & Worden, D. D. (1996). Risk aversion measures: Comparing
attitudes and asset allocation. Financial Services Review, 5, 87-99.
Sepstrup, P. (1980). Consumption of mass communication: On construction of a
model on information consumption behavior. In J. Sheth (Ed.), Research in marketing, 3
(pp.105-142). Greenwich, CT: JAI Press.
Page 107
100
Siegel, F. W., & Hoban, J. P. (1982). Relative risk aversion revisited. Review of
Economics and Statistics, 64, 481-487.
Simon, H. A. (1967). Motivational and emotional controls of cognition.
Psychological Review, 74, 29-39.
Sirri, E. R., & Tufano, P. (1998). Costly search and mutual fund flows. Journal of
Finance, 53, 1589-1622.
Spreng, R. A., & Olshavsky, R. W. (1990). The impact of standard of comparison and
knowledge domain on the measurement of subjective knowledge. In A. Parasuraman &
W. Bearden (Eds.), Proceedings of the American Marketing Association Summer
Educators’ Conference (pp. 44-48). Chicago: American Marketing Association.
Srinivasan, N. (1986). A path analytic model of external search for information for
new automobiles. Advances in Consumer Research, 14, 319-322.
Srinivasan, N. (1987). A casual model of external search for durables: A particular
investigation in the case of new automobiles. Unpublished doctoral dissertation, State
University of New York.
Srinivasan, N. (1990). Pre-purchase external search for information. In V. E.
Zeithaml (Ed.), Review of marketing (pp. 153-189). Chicago: American Marketing
Association.
Srinivasan, N., & Ratchford, B. T. (1991). An empirical test of a model of external
search for automobiles. Journal of Consumer Research, 18, 233-242.
Stephens, N. (1982). The effectiveness of time-compressed television advertisements
with older adults. Journal of Advertising, 11(4), 48-55.
Page 108
101
Stephens, N., & Warrens, R. (1984). Advertising frequency requirements for older
adults. Journal of Advertising Research, 23(5), 23-32.
Sternthal, B., & Craig, S. C. (1982). Consumer behavior: An information processing
perspective. Englewood Cliffs, NJ: Prentice-Hall Inc.
Stigler, G. J. (1961). The economics of information. Journal of Political Economy,
69, 213-255.
Stiglitz, J. E. (1979). Equilibrium in product markets with imperfect information. The
American Economic Review, 69, 339-345.
Strassl, W. (1986). Keynes on expectations and uncertainty: Rational expectations
equilibria with asymmetric information. Bulletin of Economic Research, 38, 137-159.
Swan, J. E. (1969). Experimental analysis of predecision information seeking. Journal
of Marketing Research, 6, 192-197.
Telser, L. G. (1973). Searching for the lowest price. The American Economic
Review, 63, 40-49.
Udell, J. G. (1966). Prepurchase behavior of buyers of small electrical appliances.
Journal of Marketing, 30, 50-52.
United States Bureau of Census (1997). 1997 Economic Census [on-line]. Available:
http://www.census.gov/epcd/www/97EC52.htm.
United States General Accounting Office (2001). Characteristics and choices of
Internet users [on-line]. Available: http://www.gao.gov/new.items/d01345.pdf
Urbany, J. E. (1986). An experimental examination of the economics of information.
Journal of Consumer Research, 13, 257-271.
Page 109
102
Urbany, J. E., Dickson, P. R., & Wilkie, W. L. (1989). Buyer uncertainty and
information search. Journal of Consumer Research, 16, 208-215.
Wang, H., & Hanna, S. (1997). Does risk tolerance decrease with age? Financial
Counseling and Planning, 8, 27-31.
Weitzman, M. L. (1979). Optimal search for the best alternative. Econometrica, 47,
641-654.
Westbrook, R. A., & Fornell, C. (1979). Patterns of information source usage among
durable goods buyers. Journal of Marketing Research, 16, 303-312.
Wilkie,W. L. (1972). How consumers use product information. Washington:
National Science Foundation.
Wright, P. (1975). Consumer choice strategies: Simplifying vs. optimizing. Journal of
Marketing Research, 12, 60-67.
Yale, L. J., & Gilly, M. C. (1995). Dyadic perceptions in personal source information
search. Journal of Business Research, 32, 225-237.
Zeithaml, V. A. (1982). Consumer response to in-store price information environment
environments. Journal of Consumer Research, 8, 357-369.
Page 111
Table 1 Descriptive Profile of Sample Demographic Characteristics All Households
(n=3,759) Amount of investment
Less than $10,000 40.18% $10,000-$24,999 12.17% $25,000-$49,999 10.46% $50,000-$99,999 11.58%
$100,000-$199,999 10.47% $200,000 or more 14.52%
Mean $123,848 Median $20,000 Std dev $429,353
Age 18-24 3.91% 25-34 18.37% 35-44 23.08% 45-54 20.12% 55-64 13.45%
65 or older 21.07% Mean 49.01
Median 47.00 Education
Less than high school 18.49% High school graduate 28.37%
Some college 26.93% BS or more 26.21%
Income Less than $35,000 45.04% $35,000-$59,999 25.10% $60,000-$99,999 18.54%
$100,000 or more 11.32% Mean $51,298
Median $36,390 Std dev $90,062
Page 112
Table 2 Results of Factor Analysis Using Varimax Rotation: Attitudes toward Risk, Subjective Knowledge, and Inherent Novelty Seeking Attitudes
toward risk Subjective knowledge
Inherent novelty seeking
Final community
B5_13 My household knows how to choose the financial products and services that are best for us.
0.1066 0.6622 -0.3206 0.553
E4_11 I consider myself a sophisticated investor. 0.4565 0.5967 -0.0472 0.567 E4_19 I need help selecting savings and investment products that are best suited to meet my financial goals.
-0.0928 0.6540 0.3828 0.583
N3_2 I feel qualified to make my own investment decisions. 0.1865 0.7476 0.1072 0.605 N3_11 I do not need advice on investment options. -0.1479 0.6314 0.2145 0.466 E3 Where would you prefer to put most of your household’s savings and investments on a 5-point scale? 1-a very low return with a very low risk of loss 5-a very high return with a very high risk of loss
0.6625 -0.0419 0.2683 0.513
E4_1 It’s very important to me to have both a guaranteed interest rate and federal insurance on my savings.
0.4001 0.0844 0.5116 0.429
E4_2 I am willing to accept some risk of losing money if an investment is likely to come out ahead of inflation in the long run.
0.7341 -0.0202 0.0043 0.539
E4_5 It is wise to put some portion of savings in uninsured investments to get a high yield.
0.6692 0.0004 0.0818 0.455
E4_7 I am willing to take substantial risks to realize substantial financial gains from investments.
0.7162 0.1122 0.1803 0.558
B5_1 I am unlikely to try new financial service until someone I know recommends it.
0.0762 0.0961 0.6857 0.485
N3_4 I enjoy learning about different investment opportunities. 0.5871 0.2885 -0.1725 0.458 Eigen-value 3.2569 1.8968 1.0564 6.2101 Variance explained 2.7342 2.2940 1.1819 Variance explained (%) 27.14% 15.81% 8.80% 51.75%
Page 113
Table 3 Extent of Information Search and Use of Information Sources (N=3,759)
Extent of Information Search1 Mostly Agree
Somewhat Agree
Somewhat Disagree
Mostly Disagree
All Factor Loading
Final communality
N3_1 I prefer to consult a specialist when making financial decisions.
18.23% 42.81% 28.16% 10.81% 100% 0.76745 0.5890
N3_7 I like to discuss my financial options before making a decision about them.
35.41% 47.62% 11.86% 5.12% 100% 0.71988 0.5182
N3_14 Using my financial institution as a sounding board is important to me.
10.26% 39.74% 33.69% 16.31% 100% 0.69156 0.4783
Always Some-times Rarely Never N4 How often do you or anyone in your household receive advice before making major household investment decisions?
14.41% 37.13% 17.87% 20.85% 100%2 0.62023 0.3847
Variance explained by the factor = 1.97 Use of Information Sources Weighted Percentage Unweighted Frequency
Used Literature 44.90% 2,271 Used Media 32.94% 1,598
Used the Internet 19.11% 1,054 Used Friends/Family 35.73% 1,496
Used Professional Services 16.84% 952 Footnote 1. Weighted percentages are reported. 2. The sum of the percentage does not add up to 100% due to the following responses: don’t know (7.49%) and unspecified (2.24%).
Page 114
Table 4 Descriptive Statistics: Extent of Information Search
Extent of Information Search Independent Variables Lowest
Quartile Second
Quartile Third
Quartile Fourth
Quartile (n=988) (n=716) (n=1,109) (n=946) Investment-specific individual differences
Subjective knowledge Mean 0.149 -0.062 -0.209 -0.381
Median 0.182 0.015 -0.194 -0.408 Std dev 0.982 0.870 0.892 0.964
T-statistic 100.61 (p-value) (<0.0001)
Amount of investments Less than $10,000 46.63% 45.83% 35.12% 36.47% $10,000-$24,999 10.56% 11.98% 13.62% 12.53% $25,000-$49,999 11.25% 9.80% 12.68% 7.41% $50,000-$99,999 11.31% 9.62% 12.03% 12.98%
$100,000-$199,999 8.89% 9.33% 11.72% 11.81% $200,000 or more 11.36% 13.45% 14.83% 18.80%
100% 100% 100% 100% Chi-square 53.34
(p-value) (<0.0001) Mean $98,986 $110,356 $121,521 $167,565
Median $12,700 $12,640 $26,000 $27,125 Std dev $335,782 $454,741 $447,707 $479,342
T-statistic 2.17 (p-value) (0.0899)
Personal traits Attitudes toward risk
Mean -0.578 -0.321 -0.103 -0.032 Median -0.555 -0.293 -0.059 -0.048 Std dev 1.064 0.933 0.840 0.956
T-statistic 51.29 (p-value) (<0.0001)
Inherent novelty seeking
Mean 0.299 -0.008 -0.095 -0.479 Median 0.212 -0.040 -0.161 -0.520 Std dev 0.984 0.959 0.843 0.969
T-statistic 132.24 (p-value) (< 0.0001)
Page 115
Extent of Information Search Independent Variables Lowest
Quartile Second
Quartile Third
Quartile Fourth
Quartile (n=988) (n=716) (n=1,109) (n=946) Demographic characteristics
Age 18-24 3.03% 5.31% 2.35% 5.65% 25-34 16.98% 19.83% 20.00% 16.91% 35-44 24.77% 22.15% 26.41% 17.86% 45-54 19.06% 19.56% 20.50% 21.41% 55-64 12.90% 13.72% 12.04% 15.55%
65 or older 23.27% 19.43% 18.69% 22.62% 100% 100% 100% 100%
Chi-square 76.27 (p-value) (<0.0001)
Mean 49.82 48.17 48.13 49.76 Median 47.00 46.00 45.00 50.00 Std dev 16.41 16.90 16.11 16.90
T-statistic 12.21 (p-value) (<0.0001)
Education Less than high school 20.38% 19.49% 16.12% 18.21% High school graduate 32.30% 28.41% 27.18% 25.05%
Some college 26.92% 26.21% 26.36% 28.27% BS or more 20.40% 25.98% 30.33% 28.47%
100% 100% 100% 100% Chi-square 19.82
(p-value) (0.0191) Income
Less than $35,000 49.81% 48.99% 39.51% 42.64% $35,000-$59,999 23.51% 21.24% 26.53% 28.49% $60,000-$99,999 16.12% 18.47% 22.10% 17.26%
$100,000 or more 10.55% 11.30% 11.86% 11.60% 100% 100% 100% 100%
Chi-square 40.43 (p-value) (<0.0001)
Mean $48,228 $50,317 $55,536 $50,745 Median $34,800 $35,000 $45,000 $36,000 Std dev $60,161 $55,958 $36,719 $70,543
T-statistic 0.86 (p-value) (0.4601)
Page 116
Table 5 Descriptive Statistics: Consumers' Use of Literature As an Information Source Independent variables Users Non-users (n=2,271) (n=1,488) Investment-specific individual differences Subjective knowledge
Mean -0.097 -0.133 Median 0.061 -0.161 Std dev 0.934 0.968
T-statistic 17.83 (p-value) (< 0.0001)
Amount of investments Less than $10,000 28.72% 50.85% $10,000-$24,999 10.69% 13.38% $25,000-$49,999 8.86% 11.76% $50,000-$99,999 13.79% 9.78%
$100,000-$199,999 14.19% 7.43% $200,000 or more 23.74% 7.00%
100% 100% Chi-square 553.69
(p-value) (<0.0001) Mean $201,882 $60,860
Median $53,000 $9,500. Std dev $592,874 $201,341
T-statistic 34.85 (p-value) (<0.0001)
Personal traits Attitudes toward risk
Mean 0.097 -0.529 Median 0.105 -0.461 Std dev 0.928 0.935
T-statistic 123.3187.70 (p-value) (< 0.0001)
Inherent novelty seeking Mean -0.082 -0.037
Median -0.102 -0.153 Std dev 0.974 0.983
T-statistic 0.03 (p-value) (0.8644)
Page 117
Independent variables Users Non-users (n=2,271) (n=1,488) Demographic characteristics Age
18-24 5.22% 2.83% 25-34 19.98% 17.07% 35-44 25.05% 21.48% 45-54 22.13% 18.49% 55-64 12.40% 14.30%
65 or older 15.22% 25.83% 100% 100%
Chi-square 26.68 (p-value) (<0.0001)
Mean 46.45 51.07 Median 44.00 49.00 Std dev 15.51 17.09
T-statistic 2.66 (p-value) 0.1030
Education Less than high school 8.55% 26.58% High school graduate 21.40% 34.05%
Some college 30.37% 24.12% BS or more 39.67% 15.25%
100% 100% Chi-square 457.18
(p-value) (<0.0001) Income
Less than $35,000 31.13% 56.37% $35,000-$59,999 26.14% 24.26% $60,000-$99,999 24.17% 13.95%
$100,000 or more 18.56% 5.42% 100% 100%
Chi-square 510.37 (p-value) (<0.0001)
Mean $66,483 $39,041 Median $50,000 $30,000 Std dev $126,626 $37,142
T-statistic 22.68 (p-value) (<0.0001)
Page 118
Table 6 Descriptive Statistics: Consumers’ Use of Media as an Information Source Independent variables Users Non-users (n=1,598) (n=2,161) Investment-specific individual differences Subjective knowledge
Mean -0.043 -0.156 Median -0.015 -0.162 Std dev 0.968 0.943
T-statistic 28.57 (p-value) (<0.0001)
Amount of investments Less than $10,000 34.36% 43.97% $10,000-$24,999 10.25% 13.11% $25,000-$49,999 8.64% 11.35% $50,000-$99,999 11.66% 11.54%
$100,000-$199,999 11.90% 9.76% $200,000 or more 23.19% 10.26%
100% 100% Chi-square 238.07
(p-value) (<0.0001) Mean $194,303 $89,465
Median $39,700 $15,700 Std dev $577,985 $328,140
T-statistic 8.86 (p-value) (0.0029)
Personal traits Attitudes toward risk
Mean 0.006 -0.373 Median 0.044 -0.294 Std dev 0.977 0.961
T-statistic 15.67 (p-value) (< 0.0001)
Inherent novelty seeking Mean -0.066 -0.052
Median -0.123 -0.137 Std dev 0.976 0.980
T-statistic 0.01 (p-value) (0.9350)
Page 119
Independent variables Users Non-users (n=1,598) (n=2,161) Demographic characteristics Age
18-24 4.79% 3.47% 25-34 17.94% 18.59% 35-44 25.34% 21.97% 45-54 21.02% 19.68% 55-64 13.25% 13.54%
65 or older 17.67% 22.74% 100% 100%
Chi-square 8.18 (p-value) 0.1466
Mean 47.82 49.59 Median 46.00 48.00 Std dev 16.21 16.70
T-statistic 24.79 (p-value) (<0.0001)
Education Less than high school 13.33% 21.02% High school graduate 21.37% 31.81%
Some college 29.30% 25.76% BS or more 36.00% 21.41%
100% 100% Chi-square 159.86
(p-value) (<0.0001) Income
Less than $35,000 37.58% 48.70% $35,000-$59,999 22.20% 26.53% $60,000-$99,999 22.45% 16.62%
$100,000 or more 17.77% 8.15% 100% 100%
Chi-square 175.07 (p-value) (<0.0001)
Mean $63,072 $45,553 Median $45,050 $35,000 Std dev $110,502 $77,524
T-statistic 1.72 (p-value) (0.1900)
Page 120
Table 7 Descriptive Statistics: Consumers’ Use of the Internet As an Information Source Independent variables Users Non-users (n=1,054) (n=2,705) Investment-specific individual differences Subjective knowledge
Mean -0.040 -0.137 Median -0.005 -0.149 Std dev 0.964 0.949
T-statistic 45.85 (p-value) (< 0.0001)
Amount of investments Less than $10,000 22.74% 45.08% $10,000-$24,999 11.68% 12.29% $25,000-$49,999 11.52% 10.21% $50,000-$99,999 15.87% 10.57%
$100,000-$199,999 12.47% 9.99% $200,000 or more 25.72% 11.87%
100% 100% Chi-square 198.10
(p-value) (<0.0001) Mean $219,172 $101,504
Median $55,000 $15,000 Std dev $641,850 $358,278
T-statistic 8.47 (p-value) (0.0036)
Personal traits Attitudes toward risk
Mean 0.278 -0.372 Median 0.285 -0.297 Std dev 0.926 0.954
T-statistic 185.61 (p-value) (<0.0001)
Inherent novelty seeking Mean 0.138 -0.103
Median 0.140 -0.187 Std dev 0.916 0.988
T-statistic 137.93 (p-value) (<0.0001)
Page 121
Independent variables Users Non-users (n=1,054) (n=2,705) Demographic characteristics Age
18-24 6.95% 3.19% 25-34 27.29% 16.27% 35-44 32.74% 20.80% 45-54 20.26% 20.09% 55-64 9.32% 14.42%
65 or older 3.44% 25.23% 100% 100%
Chi-square 8.47 (p-value) (0.0036)
Mean 40.76 50.94 Median 39.00 49.00 Std dev 11.83 16.91
T-statistic 80.89 (p-value) (<0.0001)
Education Less than high school 5.18% 21.63% High school graduate 14.08% 31.75%
Some college 30.32% 26.12% BS or more 50.42% 20.49%
100% 100% Chi-square 290.06
(p-value) (<0.0001) Income
Less than $35,000 23.22% 50.19% $35,000-$59,999 23.70% 25.44% $60,000-$99,999 29.08% 16.05%
$100,000 or more 24.00% 8.32% 100% 100%
Chi-square 339.46 (p-value) (<0.0001)
Mean 74,709 45,811 Median 61,200 34,269 Std dev 72,082 92,930
T-statistic 2.11 (p-value) (0.1466)
Page 122
Table 8 Descriptive Statistics: Consumers’ Use of Friends/family As an Information Source Independent variables Users Non-users (n=1,496) (n=2,263) Investment-specific individual differences Subjective knowledge
Mean -0.246 -0.048 Median -0.223 -0.039 Std dev 0.918 0.964
T-statistic 64.28 (p-value) (<0.0001)
Amount of investments Less than $10,000 36.02% 43.47% $10,000-$24,999 13.34% 11.52% $25,000-$49,999 9.66% 10.90% $50,000-$99,999 12.64% 10.99%
$100,000-$199,999 12.51% 9.33% $200,000 or more 15.82% 13.79%
100% 100% Chi-square 27.05
(p-value) (<0.0001) Mean $134,407 $117,989
Median $25,300 $16,800 Std dev $443,052 $421,449
T-statistic 17.99 (p-value) (<0.0001)
Personal traits Attitudes toward risk
Mean -0.010 -0.382 Median -0.026 -0.300 Std dev 0.914 0.994
T-statistic 0.00 (p-value) (0.9760)
Inherent novelty seeking Mean -0.119 -0.023
Median -0.179 -0.097 Std dev 0.926 1.006
T-statistic 13.13 (p-value) (0.0003)
Page 123
Independent variables Users Non-users (n=1,496) (n=2,263) Demographic characteristics Age
18-24 5.80% 2.85% 25-34 24.96% 14.72% 35-44 28.22% 20.22% 45-54 20.26% 20.05% 55-64 10.51% 15.08%
65 or older 10.26% 27.08% 100% 100%
Chi-square 189.53 (p-value) (<0.0001)
Mean 43.53 52.04 Median 42.00 51.00 Std dev 14.62 16.79
T-statistic 177.01 (p-value) (<0.0001)
Education Less than high school 10.76% 22.78% High school graduate 23.19% 31.25%
Some college 29.35% 25.28% BS or more 36.70% 20.38%
100% 100% Chi-square 85.60
(p-value) (<0.0001) Income
Less than $35,000 36.56% 49.75% $35,000-$59,999 26.49% 24.33% $60,000-$99,999 22.10% 16.57%
$100,000 or more 14.85% 9.35% 100% 100%
Chi-square 53.65 (p-value) (<0.0001)
Mean $57,442 $47,889 Median $45,000 $34,883 Std dev $100,606 $83,445
T-statistic 4.09 (p-value) (0.0432)
Page 124
Table 9 Descriptive Statistics: Consumers’ Use of Professional Financial Services Providers As an Information Source Independent variables Users Non-users (n=952) (n=2,807) Investment-specific individual differences Subjective knowledge
Mean -0.146 -0.113 Median -0.168 -0.100 Std dev 0.936 0.956
T-statistic 5.22 (p-value) (0.0224)
Amount of investments Less than $10,000 15.09% 46.02% $10,000-$24,999 12.53% 12.10% $25,000-$49,999 7.65% 11.03% $50,000-$99,999 14.15% 11.06%
$100,000-$199,999 19.86% 8.57% $200,000 or more 30.72% 11.24%
100% 100% Chi-square 293.84
(p-value) (<0.0001) Mean $268,442 $94,854
Median $100,508 $12,864 Std dev $740,363 $326,142
T-statistic 24.68 (p-value) (<0.0001)
Personal traits Attitudes toward risk
Mean 0.184 -0.336 Median 0.251 -0.264 Std dev 0.922 0.971
T-statistic 57.68 (p-value) (<0.0001)
Inherent novelty seeking Mean -0.114 -0.046
Median -0.094 -0.143 Std dev 0.940 0.986
T-statistic 8.18 (p-value) (0.0043)
Page 125
Independent variables Users Non-users (n=952) (n=2,807) Demographic characteristics Age
18-24 3.29% 4.03% 25-34 17.89% 18.47% 35-44 18.41% 24.03% 45-54 19.10% 20.33% 55-64 18.60% 12.40%
65 or older 22.71% 20.74% 100% 100%
Chi-square 41.52 (p-value) (<0.0001)
Mean 50.21 48.76 Median 50.00 46.00 Std dev 16.13 16.63
T-statistic 39.95 (p-value) (<0.0001)
Education Less than high school 6.26% 20.96% High school graduate 20.12% 30.05%
Some college 30.13% 26.28% BS or more 43.49% 22.71%
100% 100% Chi-square 150.34
(p-value) (<0.0001) Income
Less than $35,000 22.72% 49.55% $35,000-$59,999 30.42% 24.03% $60,000-$99,999 25.93% 17.05%
$100,000 or more 20.93% 9.37% 100% 100%
Chi-square 172.13 (p-value) (<0.0001)
Mean $73,073 $46,932 Median $55,000 $35,000 Std dev $177,574 $57,453
T-statistic 14.12 (p-value) (0.0002)
Page 126
Table 10 Correlation Coefficients among the Independent Variables Subjective
knowledge Amount of investment
Attitudes toward risk
Inherent novelty seeking
Age Income
Subjective knowledge 1.0000 (0.0000)
0.19440 (< .0001)
0.22850 (< .0001)
0.28691 (< .0001)
0.15998 (< .0001)
0.14042 (< .0001)
Amount of investments 1.0000 (0.0000)
0.18122 (< .0001)
0.12410 (< .0001)
0.16130 (< .0001)
0.54852 (< .0001)
Attitudes toward risk 1.0000 (0.0000)
0.36047 (< .0001)
-0.14901 (< .0001)
0.15623 (< .0001)
Inherent novelty seeking 1.0000 (0.0000)
-0.09623 (< .0001)
0.08298 (< .0001)
Age 1.0000 (0.0000)
0.03748 (0.0216)
Income 1.0000 (0.0000)
Page 127
Table 11 Results of Multiple Regression Analysis (N=3,759) Independent Variable Coefficient Standard
error t-value
Subjective knowledge -0.3157 0.0147 -21.45***
Investment-specific individual differences
Amount of investments 4.3437E-4 1.2463E-4 3.49***
($10,000) Personal traits Attitudes toward risk 0.1964 0.0160 12.30***
Inherent novelty seeking -0.3184 0.0144 -22.11***
Demographic characteristics
Age 0.0041 0.0010 4.00***
Education Less than high school -0.1239 0.0662 -1.87 High school graduate (base) Some college 0.0489 0.0460 1.06 BS or more 0.0421 0.0474 0.89
Income Less than $35,000 -0.1262 0.0454 -2.78** $35,000-$59,999 (base) $60,000-$99,999 6.4085E-4 0.0444 0.01 $100,000 or more -0.0614 0.0413 -1.48
Intercept -0.2008 0.0709 -2.83 F=112.63*** R2 = 0.2485
Adjusted-R2 = 0.2463 *** p < .001 **p < .01 *p<.05
Page 128
Table 12 Consumers’ Use of Literature as A Source of Information (N=3,759) Independent variable Coefficient Odds ratio Wald
Chi-square p-value
Subjective knowledge
0.2084 1.232 27.1711 <0.0001
Investment-specific individual differences Amount of
investments 0.0027 1.003 9.2892 0.0023
($10,000) Personal traits Attitudes toward
risk 0.4832 1.621 121.9635 <0.0001
Inherent novelty
seeking -0.0087 0.991 0.0507 0.8219
Age -0.0040 0.996 2.1548 0.1421 Demographic
characteristics Education
Less than high school
-0.3804 0.684 4.6635 0.0308
High school graduate
(base)
Some college 0.4448 1.560 15.3930 <0.0001 BS or more 0.8229 2.277 49.0547 <0.0001 Income Less than $35,000 -0.7705 0.463 46.3014 <0.0001
$35,000-$59,999 (base) $60,000-$99,999 -0.2948 0.745 7.1173 0.0076 $100,000 or more 0.2135 1.238 3.5228 0.0605
Intercept 0.3058 2.8880 0.0892 Chi-square of Likelihood Ratio = 841.2444*** R-square = 0.2005
***p<.001
Page 129
Table 13 Consumers’ Use of Media as A Source of Information (N=3,759) Independent variable Coefficient Odds ratio Wald
Chi-square p-value
Subjective knowledge
0.2332 1.263 40.7359 <0.0001
Investment-specific individual differences Amount of
investments 0.0006 1.001 2.4157 0.1201
($10,000) Personal traits Attitudes toward
risk 0.3934 1.482 95.7807 <0.0001
Inherent novelty
seeking 0.0095 1.010 0.0720 0.7885
Age 0.0021 1.002 0.7115 0.3989 Demographic
characteristics Education
Less than high school
-0.0813 0.922 0.2105 0.6464
High school graduate
(base)
Some college 0.3024 1.353 6.6455 0.0099 BS or more 0.4871 1.628 16.8331 <0.0001 Income Less than $35,000 -0.3197 0.726 8.1698 0.0043
$35,000-$59,999 (base) $60,000-$99,999 -0.2429 0.784 5.1166 0.0237 $100,000 or more 0.0530 1.054 0.2912 0.5894
Intercept -0.6866 14.6293 0.0001 Chi-square of Likelihood Ratio = 371.0505*** R-square = 0.0940
***p<.001
Page 130
Table 14 Consumers’ Use of the Internet as A Source of Information (N=3,759) Independent variable Coefficient Odds ratio Wald
Chi-square p-value
Subjective knowledge
0.3835 1.467 75.7614 <0.0001
Investment-specific individual differences Amount of
investments 0.0002 1.000 0.5505 0.4581
($10,000) Personal traits Attitudes toward
risk 0.4870 1.627 99.4970 < .0001
Inherent novelty
seeking 0.2254 1.253 28.3360 < .0001
Age -0.0488 0.952 200.9028 <0.0001 Demographic
characteristics Education
Less than high school
-0.2326 0.792 0.5186 0.4715
High school graduate
(base)
Some college 0.6267 1.871 14.4779 0.0001 BS or more 0.9470 2.578 34.0933 <0.0001 Income Less than $35,000 -1.0885 0.337 51.6562 <0.0001
$35,000-$59,999 (base) $60,000-$99,999 -0.4183 0.658 10.5350 0.0012 $100,000 or more 0.1412 1.152 1.7046 0.1917
Intercept 0.8541 14.0898 0.0002 Chi-square of Likelihood Ratio = 918.4520*** R-square = 0.2168
***p<.001
Page 131
Table 15 Consumers’ Use of Friends/family as A Source of Information (N=3,759) Independent variable Coefficient Odds ratio Wald
Chi-square p-value
Subjective knowledge
-0.1015 0.903 7.8530 0.0051
Investment-specific individual differences Amount of
investments -0.0001 1.000 0.1819 0.6698
($10,000) Personal traits Attitudes toward
risk 0.0858 1.090 4.6920 0.0303
Inherent novelty
seeking -0.1626 0.850 20.6270 <0.0001
Age -0.0324 0.968 152.5789 <0.0001 Demographic
characteristics Education
Less than high school
-0.2599 0.771 1.9655 0.1609
High school graduate
(base)
Some college 0.2665 1.305 5.2454 0.0220 BS or more 0.5184 1.679 19.1060 <0.0001 Income Less than $35,000 -0.3667 0.693 10.5995 0.0011
$35,000-$59,999 (base) $60,000-$99,999 -0.1073 0.898 0.9907 0.3196 $100,000 or more 0.0266 1.027 0.0725 0.7877
Intercept 0.9982 32.0666 <0.0001 Chi-square of Likelihood Ratio = 322.9836*** R-square = 0.0823
***p<.001
Page 132
Table 16 Consumers’ Use of Professional Financial Service Providers as A Source of Information (N=3,759) Independent variable Coefficient Odds ratio Wald
Chi-square p-value
Subjective knowledge
-0.1497 0.861 13.3855 0.0003
Investment- specific individual differences Amount of
investments 0.0005 1.000 2.4964 0.1141
($10,000) Personal traits Attitudes toward
risk 0.3213 1.379 48.3065 <0.0001
Inherent novelty
seeking -0.1283 0.880 10.1406 0.0015
Age 0.0197 1.020 45.1258 <0.0001 Demographic
characteristics Education
Less than high school
-0.5928 0.553 4.6209 0.0316
High school graduate
(base)
Some college 0.4392 1.552 8.6793 0.0032 BS or more 0.6634 1.941 20.2077 <0.0001 Income Less than $35,000 -0.8678 0.420 37.8166 < 0.0001
$35,000-$59,999 (base) $60,000-$99,999 -0.1741 0.840 2.1296 0.1445 $100,000 or more -0.0025 0.997 0.0006 0.9806
Intercept -2.4394 128.6169 <0.0001 Chi-square of Likelihood Ratio = 356.3646*** R-square = 0.0904
***p<.001
Page 133
Table 17 Summary of Hypotheses Testing Dependent variable Hypothesis Result
H1.1 Subjective knowledge (-) Supported Consumers’ extent of information search H1.2a Subjective knowledge (+) Not tested
H1.3 Subjective knowledge (+) Not tested
H2 The amount of investment (+) Supported
H3 Attitude toward risk (risk loving) (-) Not supported
H4 Inherent novelty seeking (+) Not supported
H5a Income (-) Not supported
H6 Education (+) Not supported
H7 Age (-) Not supported
Use of literature H1.2b Subjective knowledge (+) Supported
H5b Income (-) Partially supported
Use of media H1.2c Subjective knowledge (+) Supported
H5c Income (-) Partially supported
Use of the Internet H1.2d Subjective knowledge (+) Supported
H5d Income (-) Partially supported
Use of friends/family H1.2e Subjective knowledge (+) Not supported
H5e Income (-) Partially supported
H1.2f Subjective knowledge (-) Supported Use of professional financial service providers H5f Income (+) Partially
supported
Page 134
Table 18 Summary of Logistic Regression Results
Independent variable Use of literature
Use of media
Use of the Internet
Use of friends/family
Use of professional
services Subjective knowledge + + + - - Investment-
specific individual differences
Amount of investment ($10,000)
+ n.s. n.s. n.s. n.s.
Personal traits Attitudes toward risk + + + + + Inherent novelty seeking n.s. n.s. + - -
Age n.s. n.s. - - + Demographic characteristics Education
Less than high school - n.s. n.s. n.s. - High school graduate (base) (base) (base) (base) (base) Some college + + + + + BS or more + + + + + Income Less than $35,000 - - - - -
$35,000-$59,999 (base) (base) (base) (base) (base) $60,000-$99,999 - - - n.s. n.s. $100,000 or more + a n.s. n.s. n.s. n.s.
Note 1. “+” indicates a positive relationship between the independent variable and the dependent variable at p=0.05 level. 2. “-” indicates a negative relationship between the independent variable and the dependent variable at p=0.05 level. 3. “n.s.” indicates there is no significant relationship between the independent variable and the dependent variable.
Footnote a: This effect is marginally significant (p=0.06).
Page 136
Figure 1 A Model of Information Search When Making Investment Decisions
H1.2a
Investment- H1.1 specific individual differences H2 H3 Personal traits H4 H1.3 H6 Demographic characteristics H7
H5a
Subjective knowledge
Perceived risk
Amount of Investment
Attitudes toward risk
Inherent novelty seeking
Education
Age
Income
Costs of search
Benefits of search
Motivation to search
Ability to search
Information Search