Annu. Rev. Energy Environ. 1998. 23:107–22 CONSUMPTION OF MATERIALS IN THE UNITED STATES, 1900–1995 * Grecia Matos US Geological Survey, Reston, Virginia 20192; e-mail: [email protected]Lorie Wagner US Geological Survey, Denver, Colorado 80225-0046; e-mail: [email protected]KEY WORDS: materials use, intensity of use ABSTRACT The flows of nonfood and nonfuel materials through the economy have signif- icant impact on our lives and the world around us. Growing populations and economies demand more goods, services, and infrastructure. Since the beginning of the twentieth century, the types of materials consumed in the United States have significantly changed. In 1900, on a per-weight basis, almost half of the materials consumed were from renewable resources, such as wood, fibers, and agricultural products, the rest being derived from nonrenewable resources. By 1995, the con- sumption of renewable resources had declined dramatically, to only 8% of total consumption. During this century, the quantity of materials consumed has grown, from 161 million metric tons in 1900 to 2.8 billion metric tons by 1995, an equiv- alent of 10 metric tons per person per year. Of all the materials consumed during this century, more than half were consumed in the last 25 years. This paper exam- ines the general historical shifts in materials consumption and presents an analysis of different measurements of materials use and the significance of their trends. CONTENTS INTRODUCTION ........................................................... 108 TRENDS IN CONSUMPTION OF RAW MATERIALS ............................. 109 Consumption Trends in the United States, 1900–1995 ............................ 109 Consumption Trends in the World, 1970–1995 .................................. 113 CONSUMPTION MEASUREMENTS ........................................... 115 Weight and Volume Comparisons ............................................ 115 INTENSITY OF MATERIALS USE ............................................. 116 * The US Government has the right to retain a nonexclusive, royalty-free license in and to any copyright covering this paper. 107 Annu. Rev. Energy. Environ. 1998.23:107-122. Downloaded from www.annualreviews.org by Lomonosov Moscow State University on 01/29/14. For personal use only.
Transcript
P1: PSA/ARY P2: PSA/PLB QC: PSA
September 30, 1998 13:54 Annual Reviews AR064-04
Annu. Rev. Energy Environ. 1998. 23:107–22
CONSUMPTION OF MATERIALSIN THE UNITED STATES, 1900–1995∗
Grecia MatosUS Geological Survey, Reston, Virginia 20192; e-mail: [email protected]
The flows of nonfood and nonfuel materials through the economy have signif-icant impact on our lives and the world around us. Growing populations andeconomies demand more goods, services, and infrastructure. Since the beginningof the twentieth century, the types of materials consumed in the United States havesignificantly changed. In 1900, on a per-weight basis, almost half of the materialsconsumed were from renewable resources, such as wood, fibers, and agriculturalproducts, the rest being derived from nonrenewable resources. By 1995, the con-sumption of renewable resources had declined dramatically, to only 8% of totalconsumption. During this century, the quantity of materials consumed has grown,from 161 million metric tons in 1900 to 2.8 billion metric tons by 1995, an equiv-alent of 10 metric tons per person per year. Of all the materials consumed duringthis century, more than half were consumed in the last 25 years. This paper exam-ines the general historical shifts in materials consumption and presents an analysisof different measurements of materials use and the significance of their trends.
Food, fuel, and materials are the three broad categories of commodities utilizedin the economy to support the needs of society. This paper examines materi-als, a category that includes fibers, plastics, feedstock, metals, paper, cement,and sand and gravel. It also includes resources that supply our basic needs forproducing food, clothing, shelter, transportation, and infrastructure and thatmaintain and improve our standard of living. Excluded are materials such asmine tailings from metal production; overburden (material overlying a min-eral deposit) removed to access mineral ores; earth and stone excavated for theconstruction of dams, highways, and buildings (1); and the materials containedwithin finished products imported to or exported from the United States (2).
Materials are derived from resources that are classified as either renewableor nonrenewable. Renewable resources are those that regenerate themselves,such as agricultural, forestry, fishery, and wildlife products. If the rate they areconsumed becomes so great that it drives the resource to exhaustion, however,these renewable resources can become nonrenewable. Nonrenewable resourcesare those that are formed over long periods of geologic time. They include metals(primary and recycle), minerals, and organic materials. In this paper, food, fuel,water, and air are not taken into account.
This paper is an overview of materials consumption in the United Statesfrom 1900 to 1995 as measured at the input-to-manufacturing stage. It includesa discussion of the changes in the preferences of consumers and industry fordifferent materials and presents different measurements of consumption (weightand volume) as indicators of intensity of use (see below). As used in this paper,materials consumption is defined as the apparent consumption of raw materials.This equals domestic primary and secondary (recycled) production plus importsminus exports of raw material.
The data collection and analyses presented in this paper provide thefollowing:
1. Information for materials flow analysis of the US economy, from extractionthrough processing, manufacturing, dissipation (quantity of the material re-leased directly to the environment, where no attempt to recapture the materialis made or where it is not practical), recycling, and ultimate disposition.
2. Information to help both the public and private sectors gain understandingabout the use of materials in the economy, and about the ultimate dispositionof materials into the environment.
Ann
u. R
ev. E
nerg
y. E
nvir
on. 1
998.
23:1
07-1
22. D
ownl
oade
d fr
om w
ww
.ann
ualr
evie
ws.
org
by L
omon
osov
Mos
cow
Sta
te U
nive
rsity
on
01/2
9/14
. For
per
sona
l use
onl
y.
P1: PSA/ARY P2: PSA/PLB QC: PSA
September 30, 1998 13:54 Annual Reviews AR064-04
MATERIALS CONSUMPTION 109
3. An overview of shifting patterns in materials use in the United States andthroughout the world. Identification of these patterns provides a frameworkfor identifying future national and global materials requirements and for un-derstanding the long-term issues of resource supply-and-waste management.
TRENDS IN CONSUMPTION OF RAW MATERIALS
The US government has been tracking the use of materials since the 1880s.The data gathered by the US Geological Survey, the former US Bureau ofMines, and other agencies provide a historical perspective on the changingpatterns of materials consumption and are used to illustrate the long-term trendsin materials use (3). The raw materials consumed in the United States havegrown substantially since the beginning of the century. These changes reflectalterations in public demand, population growth, and industrialization.
Potential impacts on the environment are related to the physical flows thattake place within a finite ecosystem. In this chapter, major emphasis is placednot on monetary value but physical data, i.e. weight and/or volume measures[the purpose of the analysis may make one more relevant than the other—such as analyses involving space issues, e.g. landfill disposal, where volumemeasurements may be more relevant than weight (4)].
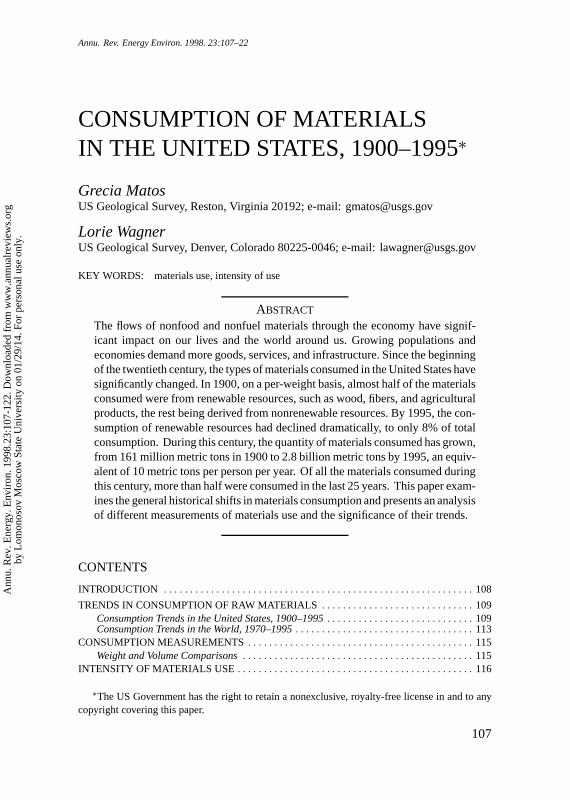
Consumption Trends in the United States, 1900–1995The consumption profiles of renewable (agriculture, wood products, and pri-mary paper) and nonrenewable (nonrenewable organic, primary metals, indus-trial minerals, and construction) materials are illustrated in Figure 1. Reusable,or recyclable, resources (recycled metals and paper) are also included. This fig-ure also reflects the consumption pattern of materials associated with major eco-nomic and military events, including the depression of the 1930s, World War I,World War II, the post-World War II boom, the energy crunch of the 1970s,and the recession of the 1980s. At the beginning of the twentieth century, eachperson consumed per year approximately 2 metric tons of materials; by 1995,that amount had increased to 10 metric tons, a fivefold increase.
Construction materials include crushed stone and construction sand andgravel (natural aggregates). It does not include materials such as gypsum forwallboard, copper for plumbing, wood or steel for construction frames, or as-phalt for roads. Natural aggregates are a major basic raw material used by theconstruction, agriculture, and other industries (6). On the basis of weight, con-struction materials dwarf all other materials combined. They have—throughoutthe century—been the most dominant of all types of materials used, representingas much as three quarters (by weight) of consumed renewable and nonrenewableresources annually.
Ann
u. R
ev. E
nerg
y. E
nvir
on. 1
998.
23:1
07-1
22. D
ownl
oade
d fr
om w
ww
.ann
ualr
evie
ws.
org
by L
omon
osov
Mos
cow
Sta
te U
nive
rsity
on
01/2
9/14
. For
per
sona
l use
onl
y.
P1: PSA/ARY P2: PSA/PLB QC: PSA
September 30, 1998 13:54 Annual Reviews AR064-04
110 MATOS & WAGNER
Figure 1 Measurement of the amount of raw materials consumed in the United States. WWI,World War I; WWII, World War II (5).
Consumption of construction materials greatly increased as a result of infras-tructure growth (especially the interstate highway system) after World War II.In recent decades, construction materials have been used mainly in the widen-ing and rebuilding of roads damaged from weather and heavier traffic loads andin construction of bridges, ramps, and buildings (6).
The amount of recycled aggregates (crushed cement concrete) is not includedin Figure 1. The sparse data available indicate that use of recycled aggregateshas been increasing, especially in the 1990s. As the recycling of constructionand demolition debris increases, aggregate producers are starting to recycleconcrete and asphalt. Because much recycling of aggregates occurs in situ athighway construction sites without going through a market transaction, precisedata are not available.
An evident, major shift in US consumption is the increased use of nonre-newable resources (Figure 2). At the beginning of the twentieth century, about41% (by weight) of the materials consumed domestically were renewable; by1995, only 8% were renewable.
In the early twentieth century, the US economy moved rapidly from an agri-cultural to an industrial base. In the 1950s and 1960s, it began a shift towarda service economy. This trend has caused a change in the mix of materials
Ann
u. R
ev. E
nerg
y. E
nvir
on. 1
998.
23:1
07-1
22. D
ownl
oade
d fr
om w
ww
.ann
ualr
evie
ws.
org
by L
omon
osov
Mos
cow
Sta
te U
nive
rsity
on
01/2
9/14
. For
per
sona
l use
onl
y.
P1: PSA/ARY P2: PSA/PLB QC: PSA
September 30, 1998 13:54 Annual Reviews AR064-04
MATERIALS CONSUMPTION 111
Figure 2 Measurement of the amount of renewable and nonrenewable materials consumed in theUnited States.
consumed and has provided more-extensive processing, miniaturization, so-phisticated technology, electrification, computerization, automation, and high-speed transport. At the same time, increased transportation and new technolo-gies have led to increases in energy consumption (7).
Figure 3, which excludes construction materials, illustrates trends in theother categories. Industrial minerals account for a large component of materialsconsumption, almost equivalent, on a per-weight basis, to all of the remainingmaterials. Industrial minerals include cement for ready-mix concrete; potashand phosphate for fertilizer; gypsum for drywall and plaster; fluorspar for acid;soda ash for glass and chemicals; and sulfur, asbestos, abrasives, and variousother minerals for use in chemicals and industry. The proportion of industrialminerals to total materials consumption used in the economy increased untilabout 1960 and has been roughly constant since.
Materials derived from agriculture (such as cotton, wool, and tobacco), fish-ery products (such as fish meal), and wildlife (primarily fur) are so light inweight that they represent only a small part of the total materials consumed by
Ann
u. R
ev. E
nerg
y. E
nvir
on. 1
998.
23:1
07-1
22. D
ownl
oade
d fr
om w
ww
.ann
ualr
evie
ws.
org
by L
omon
osov
Mos
cow
Sta
te U
nive
rsity
on
01/2
9/14
. For
per
sona
l use
onl
y.
P1: PSA/ARY P2: PSA/PLB QC: PSA
September 30, 1998 13:54 Annual Reviews AR064-04
112 MATOS & WAGNER
Figure 3 Measurement of the amount of raw materials (excluding crushed stone and constructionsand and gravel) consumed in the United States.
weight (4). In 1900, the United States used 3 million metric tons of agriculturalmaterial; by 1995, it used more than 6 million metric tons.
Consumption of paper (as a primary product) showed a slight increase from1960 through 1995. Prior to 1960, the consumption of paper was included inthe wood products category. Consumption of wood products (lumber, plywood,and veneer) remained essentially unchanged throughout the same period, thusrepresenting about 6% of the total materials used.
Nonrenewable organic material is today a major component of materialsconsumption. The category emerged gradually in the early part of the century,accounting for approximately 2 million metric tons in 1900. It has subsequentlyundergone rapid growth, to 131 million metric tons in 1995. The use of nonre-newable organic material has increased as a result of the development of newproducts and markets and material replacements in established markets. In someapplications, synthetic fibers have replaced natural fibers, plastics have replacedwood, and synthetic oils have replaced natural oils. These replacements werethe result of more-desirable properties or cost advantages. Nonrenewable or-ganic material used in the production of asphalt, plastics, feedstock, syntheticrubber, fibers, and petrochemicals exceeded 130 million metric tons in 1995.
Ann
u. R
ev. E
nerg
y. E
nvir
on. 1
998.
23:1
07-1
22. D
ownl
oade
d fr
om w
ww
.ann
ualr
evie
ws.
org
by L
omon
osov
Mos
cow
Sta
te U
nive
rsity
on
01/2
9/14
. For
per
sona
l use
onl
y.
P1: PSA/ARY P2: PSA/PLB QC: PSA
September 30, 1998 13:54 Annual Reviews AR064-04
MATERIALS CONSUMPTION 113
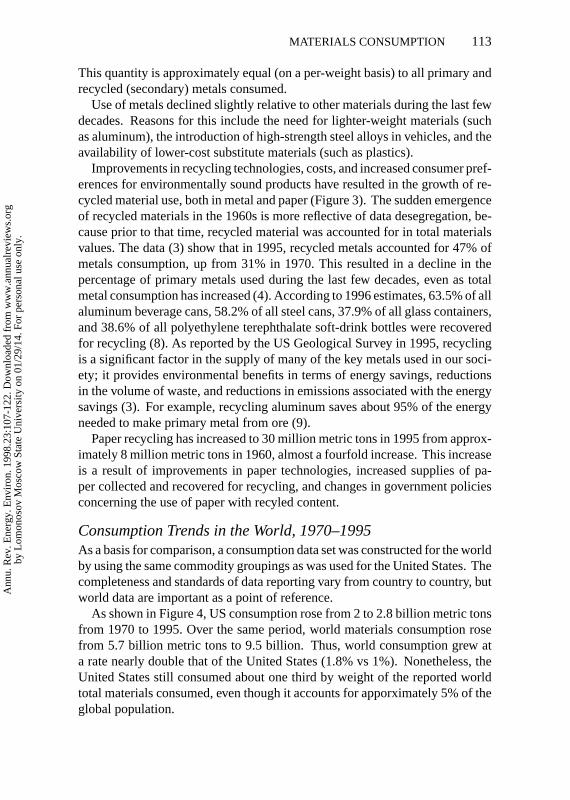
This quantity is approximately equal (on a per-weight basis) to all primary andrecycled (secondary) metals consumed.
Use of metals declined slightly relative to other materials during the last fewdecades. Reasons for this include the need for lighter-weight materials (suchas aluminum), the introduction of high-strength steel alloys in vehicles, and theavailability of lower-cost substitute materials (such as plastics).
Improvements in recycling technologies, costs, and increased consumer pref-erences for environmentally sound products have resulted in the growth of re-cycled material use, both in metal and paper (Figure 3). The sudden emergenceof recycled materials in the 1960s is more reflective of data desegregation, be-cause prior to that time, recycled material was accounted for in total materialsvalues. The data (3) show that in 1995, recycled metals accounted for 47% ofmetals consumption, up from 31% in 1970. This resulted in a decline in thepercentage of primary metals used during the last few decades, even as totalmetal consumption has increased (4). According to 1996 estimates, 63.5% of allaluminum beverage cans, 58.2% of all steel cans, 37.9% of all glass containers,and 38.6% of all polyethylene terephthalate soft-drink bottles were recoveredfor recycling (8). As reported by the US Geological Survey in 1995, recyclingis a significant factor in the supply of many of the key metals used in our soci-ety; it provides environmental benefits in terms of energy savings, reductionsin the volume of waste, and reductions in emissions associated with the energysavings (3). For example, recycling aluminum saves about 95% of the energyneeded to make primary metal from ore (9).
Paper recycling has increased to 30 million metric tons in 1995 from approx-imately 8 million metric tons in 1960, almost a fourfold increase. This increaseis a result of improvements in paper technologies, increased supplies of pa-per collected and recovered for recycling, and changes in government policiesconcerning the use of paper with recyled content.
Consumption Trends in the World, 1970–1995As a basis for comparison, a consumption data set was constructed for the worldby using the same commodity groupings as was used for the United States. Thecompleteness and standards of data reporting vary from country to country, butworld data are important as a point of reference.
As shown in Figure 4, US consumption rose from 2 to 2.8 billion metric tonsfrom 1970 to 1995. Over the same period, world materials consumption rosefrom 5.7 billion metric tons to 9.5 billion. Thus, world consumption grew ata rate nearly double that of the United States (1.8% vs 1%). Nonetheless, theUnited States still consumed about one third by weight of the reported worldtotal materials consumed, even though it accounts for apporximately 5% of theglobal population.
Ann
u. R
ev. E
nerg
y. E
nvir
on. 1
998.
23:1
07-1
22. D
ownl
oade
d fr
om w
ww
.ann
ualr
evie
ws.
org
by L
omon
osov
Mos
cow
Sta
te U
nive
rsity
on
01/2
9/14
. For
per
sona
l use
onl
y.
P1: PSA/ARY P2: PSA/PLB QC: PSA
September 30, 1998 13:54 Annual Reviews AR064-04
114 MATOS & WAGNER
Figure 4 Measurement of the amount of materials consumed in the United States and the world(10).
The increased US and world consumption levels raise issues related to re-source adequacy and the impact on the ecosystem. Further work is needed inthis area to provide a holistic approach to global issues in material consumption.
For many countries, the existing data are not as comprehensive as that fromthe United States. To provide a comparative analysis on a per-capita basis,further work to account for data not reported by some countries and informalactivities not accounted statistically is essential.
Although the United States consumes a lot of material, future shortages arenot necessarily inevitable, for several reasons. Advances in technology andmanagement increase efficient materials use, reducing the need for resources.There is also greater efficiency in materials extraction. Recycling and materi-als substitution are also occurring. Not every nation will necessarily repeat theAmerican pattern of development. The lessons learned about efficient mate-rials use in industrialized nations like the United States, if taught and appliedin developing countries, could usher in more efficient global consumption ofmaterials. The sooner industrialized nations develop better technologies to usematerials more efficiently and diffuse this knowledge, the less we risk futureglobal materials scarcity.
Ann
u. R
ev. E
nerg
y. E
nvir
on. 1
998.
23:1
07-1
22. D
ownl
oade
d fr
om w
ww
.ann
ualr
evie
ws.
org
by L
omon
osov
Mos
cow
Sta
te U
nive
rsity
on
01/2
9/14
. For
per
sona
l use
onl
y.
P1: PSA/ARY P2: PSA/PLB QC: PSA
September 30, 1998 13:54 Annual Reviews AR064-04
MATERIALS CONSUMPTION 115
CONSUMPTION MEASUREMENTS
Different measurements—such as weight, volume, or value—provide differentperspectives on consumption. Depending on the purpose of the analysis, oneform of measurement may be preferable, although a comprehensive analysisthat encompasses all perspectives may be more appropriate.
Historically, mineral feedstocks have been valued by weight; agriculturaland fishery products by weight and volume; forest products by volume; andorganic fuels by weight, volume, and energy content. The data presented in thispaper have been standardized in terms of weight and volume. An accountingof consumption trends in monetary terms would be valuable, but data for thecommodity groupings were not available.
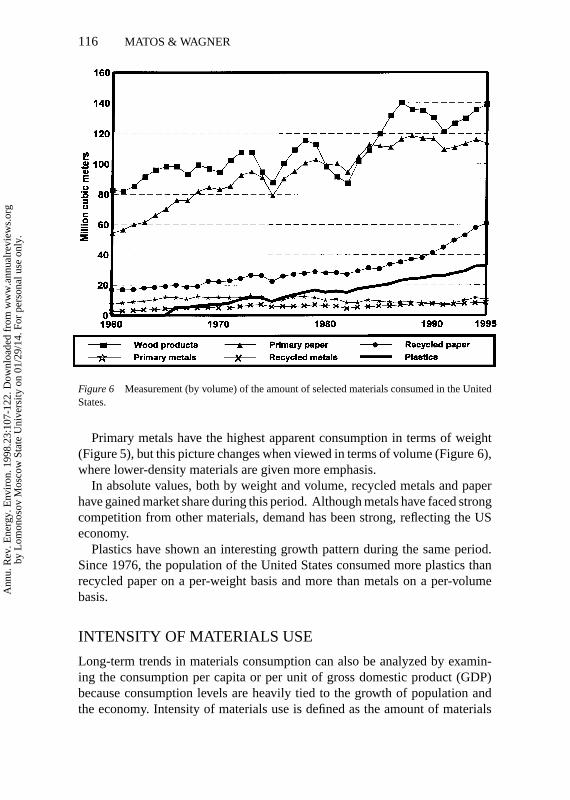
Weight and Volume ComparisonsA group of commodity categories were selected for analyses over the period1960 through 1995. As shown in Figures 5 and 6, the commodity groupings arewood products (lumber, plywood, veneer, and other forestry products), primarypaper, recycled paper, primary metals, recycled metals, and plastics.
Figure 5 Measurement (by weight) of the amount of selected materials consumed in the UnitedStates.
Ann
u. R
ev. E
nerg
y. E
nvir
on. 1
998.
23:1
07-1
22. D
ownl
oade
d fr
om w
ww
.ann
ualr
evie
ws.
org
by L
omon
osov
Mos
cow
Sta
te U
nive
rsity
on
01/2
9/14
. For
per
sona
l use
onl
y.
P1: PSA/ARY P2: PSA/PLB QC: PSA
September 30, 1998 13:54 Annual Reviews AR064-04
116 MATOS & WAGNER
Figure 6 Measurement (by volume) of the amount of selected materials consumed in the UnitedStates.
Primary metals have the highest apparent consumption in terms of weight(Figure 5), but this picture changes when viewed in terms of volume (Figure 6),where lower-density materials are given more emphasis.
In absolute values, both by weight and volume, recycled metals and paperhave gained market share during this period. Although metals have faced strongcompetition from other materials, demand has been strong, reflecting the USeconomy.
Plastics have shown an interesting growth pattern during the same period.Since 1976, the population of the United States consumed more plastics thanrecycled paper on a per-weight basis and more than metals on a per-volumebasis.
INTENSITY OF MATERIALS USE
Long-term trends in materials consumption can also be analyzed by examin-ing the consumption per capita or per unit of gross domestic product (GDP)because consumption levels are heavily tied to the growth of population andthe economy. Intensity of materials use is defined as the amount of materials
Ann
u. R
ev. E
nerg
y. E
nvir
on. 1
998.
23:1
07-1
22. D
ownl
oade
d fr
om w
ww
.ann
ualr
evie
ws.
org
by L
omon
osov
Mos
cow
Sta
te U
nive
rsity
on
01/2
9/14
. For
per
sona
l use
onl
y.
P1: PSA/ARY P2: PSA/PLB QC: PSA
September 30, 1998 13:54 Annual Reviews AR064-04
MATERIALS CONSUMPTION 117
used per year with respect to population or economic output, often measuredas total GDP. Intensity of use measures may help gauge developmental status,economic growth, and environmental quality, which is determined by an effi-cient use of natural resources that minimizes depletion and reduces pollution(11).
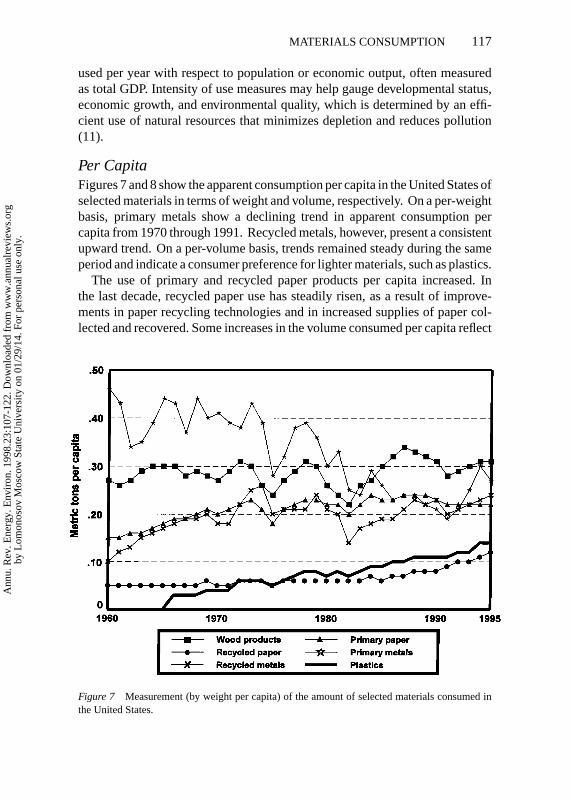
Per CapitaFigures 7 and 8 show the apparent consumption per capita in the United States ofselected materials in terms of weight and volume, respectively. On a per-weightbasis, primary metals show a declining trend in apparent consumption percapita from 1970 through 1991. Recycled metals, however, present a consistentupward trend. On a per-volume basis, trends remained steady during the sameperiod and indicate a consumer preference for lighter materials, such as plastics.
The use of primary and recycled paper products per capita increased. Inthe last decade, recycled paper use has steadily risen, as a result of improve-ments in paper recycling technologies and in increased supplies of paper col-lected and recovered. Some increases in the volume consumed per capita reflect
Figure 7 Measurement (by weight per capita) of the amount of selected materials consumed inthe United States.
Ann
u. R
ev. E
nerg
y. E
nvir
on. 1
998.
23:1
07-1
22. D
ownl
oade
d fr
om w
ww
.ann
ualr
evie
ws.
org
by L
omon
osov
Mos
cow
Sta
te U
nive
rsity
on
01/2
9/14
. For
per
sona
l use
onl
y.
P1: PSA/ARY P2: PSA/PLB QC: PSA
September 30, 1998 13:54 Annual Reviews AR064-04
118 MATOS & WAGNER
Figure 8 Measurement (by volume per capita) of the amount of selected materials consumed inthe United States.
increases in the velocity of consumption of goods (the frequency with whichmaterials are used and discarded or expended in a year). This velocity increaseswhen consumers replace durable goods such as automobiles or appliances morefrequently or when they consume disposable products instead of longer-livedsubstitutes.
Plastics consumption per capita shows an upward trend, mainly owing to thedevelopment of new products and markets and material substitution in estab-lished markets. In fact, in many cases, plastics have become the material ofchoice, displacing metals, paper, leather, glass, and wood in a range of commonproducts (12).
Per Unit of Gross Domestic ProductWhen the trends of the apparent consumption of materials per unit of GDPare analyzed on a per-weight and per-volume bases, a slightly different trendemerges (Figures 9 and 10). On the basis of a per-ton unit of GDP, slightlymore recycled (metals and paper) products were consumed in the economyper unit of GDP in 1995 than in 1960. Consequently, primary metals and
Ann
u. R
ev. E
nerg
y. E
nvir
on. 1
998.
23:1
07-1
22. D
ownl
oade
d fr
om w
ww
.ann
ualr
evie
ws.
org
by L
omon
osov
Mos
cow
Sta
te U
nive
rsity
on
01/2
9/14
. For
per
sona
l use
onl
y.
P1: PSA/ARY P2: PSA/PLB QC: PSA
September 30, 1998 13:54 Annual Reviews AR064-04
MATERIALS CONSUMPTION 119
Figure 9 Measurement [by weight per unit of gross domestic products (GDP)] of the amount ofselected materials consumed in the United States.
paper declined. The recycled products contribute to the overall supply of met-als and paper, thereby reducing the demands on virgin metals and woodproducts.
Plastics show an upward trend in terms of weight and volume per unit ofGDP. This reflects the increasing role that plastics play in the economy.
The data from the analysis of materials consumption neither confirm nordeny the notion that the economy is in the process of dematerialization or isless material intensive. They do, however, indicate that increases in consump-tion and changes in the composition of materials have been significant, espe-cially for low-density materials. Furthermore, taking into account that quan-tities of post-consumer waste will increase as population and GDP increase,new technologies will be required, and consumer preferences may have tochange.
Environmental impacts can be mitigated to the extent that flows of materi-als are reduced by more-efficient product design, which will result in sourcereduction to the waste stream or to where waste materials are recovered andrecycled. Reducing the amount of materials used per unit of population or GDP
Ann
u. R
ev. E
nerg
y. E
nvir
on. 1
998.
23:1
07-1
22. D
ownl
oade
d fr
om w
ww
.ann
ualr
evie
ws.
org
by L
omon
osov
Mos
cow
Sta
te U
nive
rsity
on
01/2
9/14
. For
per
sona
l use
onl
y.
P1: PSA/ARY P2: PSA/PLB QC: PSA
September 30, 1998 13:54 Annual Reviews AR064-04
120 MATOS & WAGNER
Figure 10 Measurement [by volume per unit of gross domestic products (GDP)] of the amountof selected materials consumed in the United States.
can contribute to the alleviation of environmental stress and to greater economicand industrial productivity.
CONCLUSIONS
As shown by the data presented in this chapter, consumption of raw materials inthe United States has increased dramatically throughout the twentieth centuryand has changed its composition substantially. The data underscore the need tounderstand better our natural resources so that adequate supplies of materialswill be available to meet future demands, improve efficiency of materials use,and limit negative impacts from the ultimate disposition of materials. There isalso a need to analyze materials use from all perspectives.
Further efforts are needed to develop consistent standardized information foraccounting of resources and the impact of resource use on the environment, theeconomy, and, ultimately, the human population. The US government has along history of tracking the flow of materials through the economy. The basicdata-collection and data-analysis functions provided by federal agencies are keyelements to the understanding of materials use and shifts in materials productionand demand. It is crucial for future studies that academia, policy makers, and
Ann
u. R
ev. E
nerg
y. E
nvir
on. 1
998.
23:1
07-1
22. D
ownl
oade
d fr
om w
ww
.ann
ualr
evie
ws.
org
by L
omon
osov
Mos
cow
Sta
te U
nive
rsity
on
01/2
9/14
. For
per
sona
l use
onl
y.
P1: PSA/ARY P2: PSA/PLB QC: PSA
September 30, 1998 13:54 Annual Reviews AR064-04
MATERIALS CONSUMPTION 121
business people have ready access to a consistent set of statistics on materialextraction, use, disposal, and recycling/reuse.
In addition, understanding the flows of materials and monitoring materi-als consumption trends provide the information to assist the United States indetermining how it can satisfy its material needs at acceptable economic andenvironmental costs. This is an important function because materials, as well asfood and energy, support the US economy. The shifts in materials use during thelast 95 years have created a number of questions about the long-range impactsof these trends in the domestic economy, the international marketplace, and theenvironment.
As we approach the twenty-first century, we have challenges to face. Using amaterials flow approach to materials usage can lead to improvements in productdesign, to technological innovation that increases the efficiency of resource use,to better waste-management practices, and to more-effective policies. Further-more, the awareness of materials choices and consumption behavior can helpus avoid activities that degrade the environment and encourage activities thatconserve ecosystems for the future.
Two basic issues need to be addressed: potential scarcity (the continuedavailability of material resources both regionally and globally) and the environ-mental impacts of the extraction, processing, use, and disposal of this material.This will require (a) monitoring changes in domestic consumption levels andthe reciprocal changes needed to support these levels by the ecosystem and theeconomy, (b) analyzing the factors that are causing changes in current and futuredemand for materials, and (c) supporting effective policy alternatives, such asgovernment procurement policies and labeling about environmental effects.
ACKNOWLEDGMENTS
We are indebted to Donald G. Rogich, formerly with the US Bureau of Mines,for his insightful ideas and to Iddo Wernick, Columbia Earth Institute, andThomas Gunther, US Department of the Interior, for their comments and review.
Visit the Annual Reviews home pageathttp://www.AnnualReviews.org
Literature Cited
1. Adriaanse A, Bringezu S, Hammond A,Moriguchi Y, Rodenburg E, et al. 1997.Resource Flows: The Material Basis ofIndustrial Economies. Washington, DC:World Resour. Inst.
2. Biviano M, Sullivan D, Wagner L. 1997.Materials flow studies, total materialsconsumption—an estimation methodology
and example using lead. Presented at 8thInt. Symp. Raw Mater., Fed. Inst. Geosci.Nat. Resour., Hannover, Ger.
3. US Geol. Surv. 1965.Mineral CommoditySummaries and Mineral Yearbooks. Wash-ington, DC: US Gov. Print. Off.
4. Rogich DG. 1993. Material use, eco-nomic growth, and the environment.
Ann
u. R
ev. E
nerg
y. E
nvir
on. 1
998.
23:1
07-1
22. D
ownl
oade
d fr
om w
ww
.ann
ualr
evie
ws.
org
by L
omon
osov
Mos
cow
Sta
te U
nive
rsity
on
01/2
9/14
. For
per
sona
l use
onl
y.
P1: PSA/ARY P2: PSA/PLB QC: PSA
September 30, 1998 13:54 Annual Reviews AR064-04
122 MATOS & WAGNER
Nonrenew. Resour. 5(4):197–2105. Sources: US Dep. Agric., US For. Serv.,
US Int. Trade Comm., US Dep. Commer.,US Dep. Energy, US Bur. Mines, US Geol.Surv., Resour. Future, Nat. Resour. Com-mod., Century Stat., Stat. Abstr. US, Am.For. Pap. Assoc.
6. US Geol. Surv. 1997.Natural Aggre-gates Foundation of America’s Future. FactSheet FS 144–97. Reston, VA: US Geol.Surv.
7. Radcliffe V, Fischman L, Schantz R Jr.1981.Materials Requirements and Econo-mic Growth: A Comparison of Consump-tion Patterns in Industrialized Countries.US Bur. Mines Rep., contract JO177118,Resour. Future, Washington, DC: US Bur.Mines
8. Powell J. 1997. How are we doing? Thestatus of materials recovery.Resour. Re-cycl.7:34
9. Wilburn D, Wagner L. 1993.AluminumAvailability and Supply, A Minerals Avail-ability Appraisal., US Bur. Mines, IC 9371,p. 93. Washington, DC: US Bur. Mines
10. Sources: UN Ind. Commod. Stat. Yearb.1967, 1976, 1985, 1994. New York:UN; FAOSTAT∗PC, FAO, New York: UN;Commodity Balance Statistics, UNIDO,New York: UN
11. Wernick IK, Ausubel JH. 1995. Nationalmaterials flows and the environment.Annu.Rev. Energy Environ.20:463–92
12. US Bur. Mines. 1991. Materials shiftsin the new society.New Mat. Soc.2:1–15