8- 1 Chapter Six The Normal Probability Distribution GOALS : When you have completed this chapter, you will be able to: •List the cha r acteri s tics of the normal probability distribution. •Define and calculate z values. •Determine the probability an observation will lie between two points using the standard normal distribution. •Determine the probability an observation will be above or below a given value using the standard normal distribution. •
Transcript
8- 1
Chapter Six
The Normal Probability DistributionGOALS : When you have completed this chapter, you will be able to:
•List the characteristics of the normal probability distribution.
•Define and calculate z values.
•Determine the probability an observation will lie between two
pointsusing the standard normal distribution.
•Determine the probability an observation will be above or below a given value using the standard normal distribution.
•Compare two or more observations that are on different probability distributions.
8- 2
Characteristics of a Normal Probability Distribution
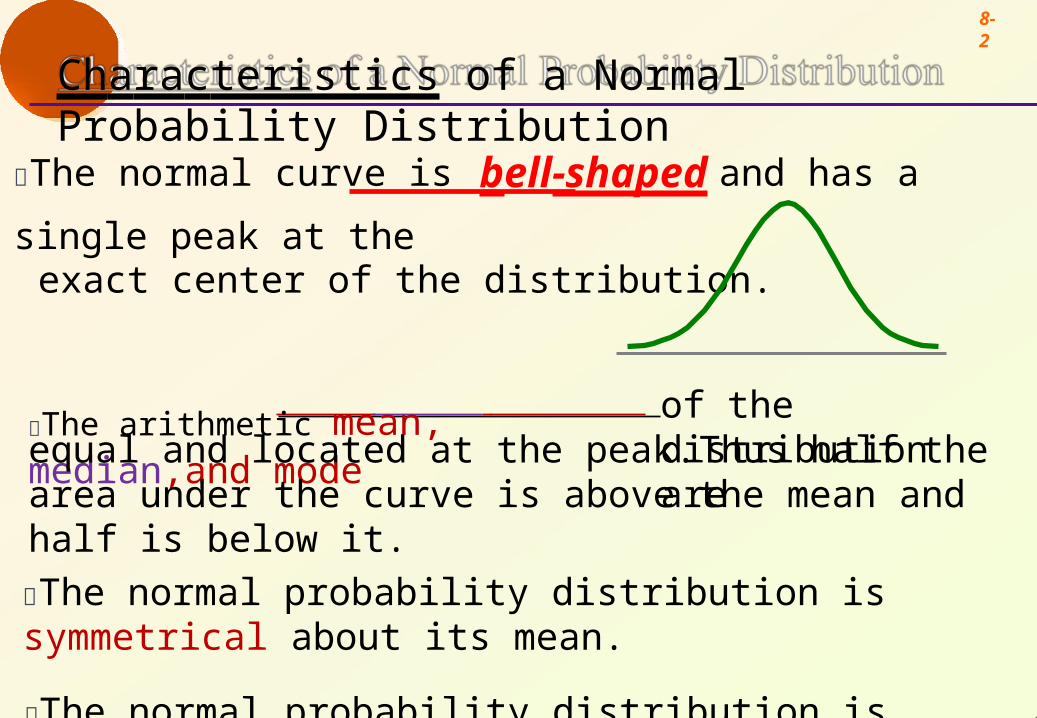
The normal curve is bell-shaped and has a single peak at theexact center of the distribution.
The arithmetic mean, median,and mode of the distribution areequal and located at the peak. Thus half the area under the curve is above the mean and half is below it.
The normal probability distribution is symmetrical about its mean.
The normal probability distribution is asymptotic.That is the curve gets closer and closer to the X-axis but never actually touches it.
8- 3
- 5
0 4
0 3
0 2
x (f
0 1
0
a
.
.
.
.
.
x
l i : ,
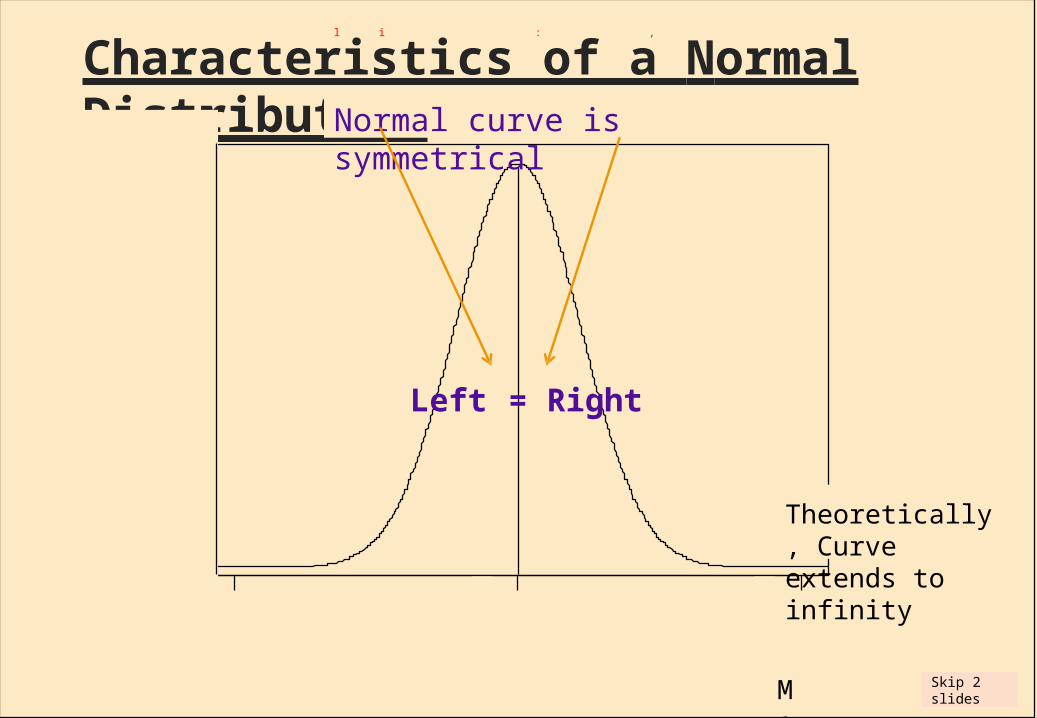
Characteristics of a Normal Distribution
Left = Right
Theoretically, Curve extends to infinity
Mean,
median
&
mode are equal
Normal curve is symmetrical
Skip 2 slides
8- 4
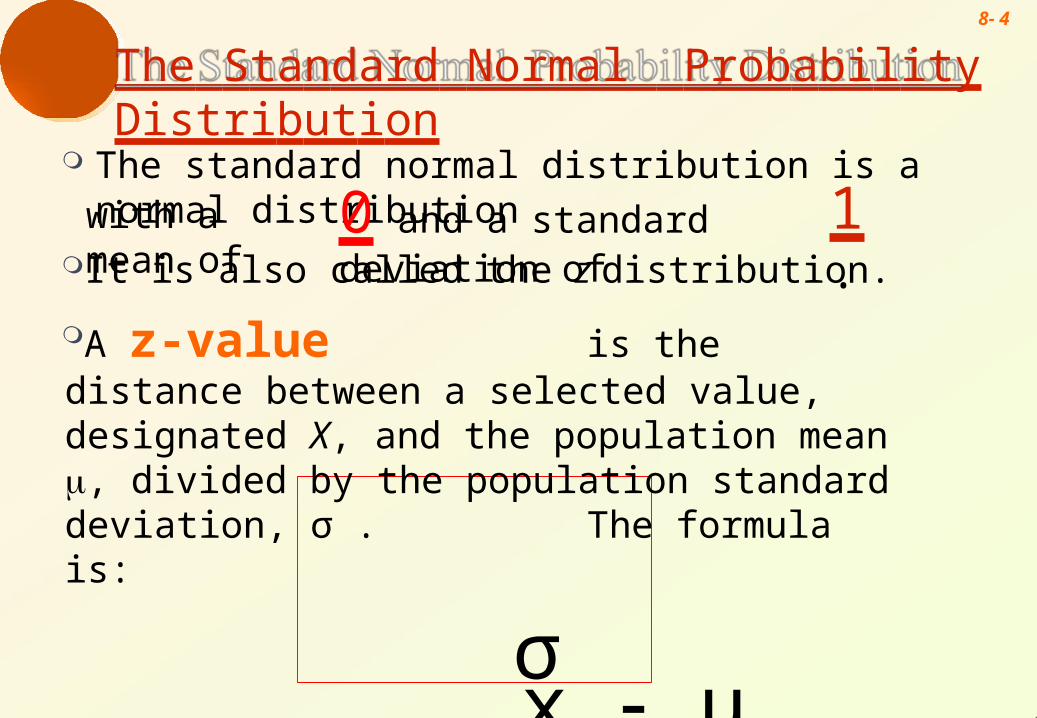
The Standard Normal Probability Distribution
The standard normal distribution is a normal distributionwith a mean of 0 and a standard deviation of
It is also called the z distribution.
A z-value is the distance between a selected value, designated X, and the population mean , divided by the population standard deviation, σ . The formula is:
z x μ σ
1.
8- 5
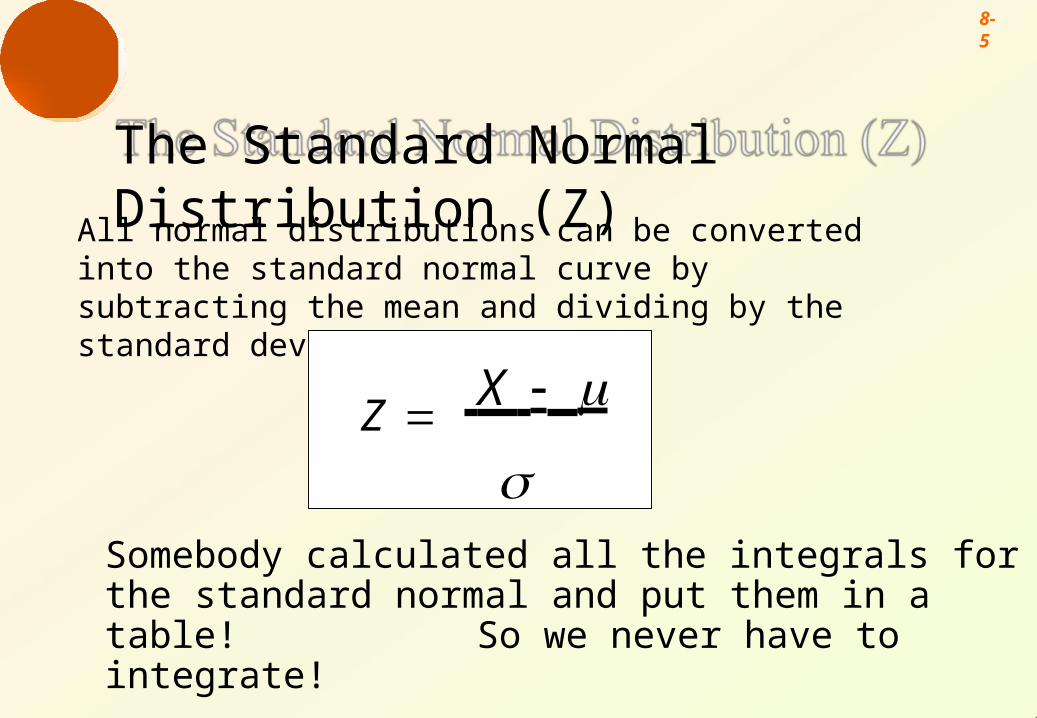
The Standard Normal Distribution (Z)
All normal distributions can be converted into the standard normal curve by subtracting the mean and dividing by the standard deviation:
Z X
Somebody calculated all the integrals for the standard normal and put them in a table! So we never have to integrate!
Even better, computers now do all the integration.
8- 6
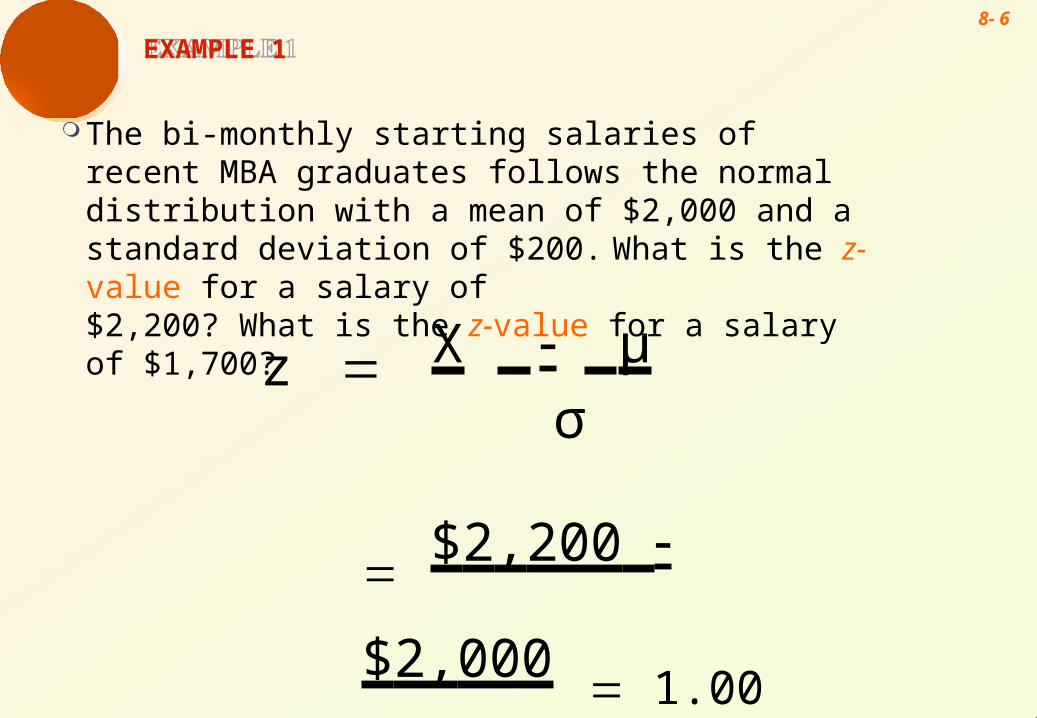
EXAMPLE 1
The bi-monthly starting salaries of recent MBA graduates follows the normal distribution with a mean of $2,000 and a standard deviation of $200. What is the z-value for a salary of$2,200? What is the z-value for a salary of $1,700?
$2,200 $2,000 1.00
$200
X μ
σz
8- 7
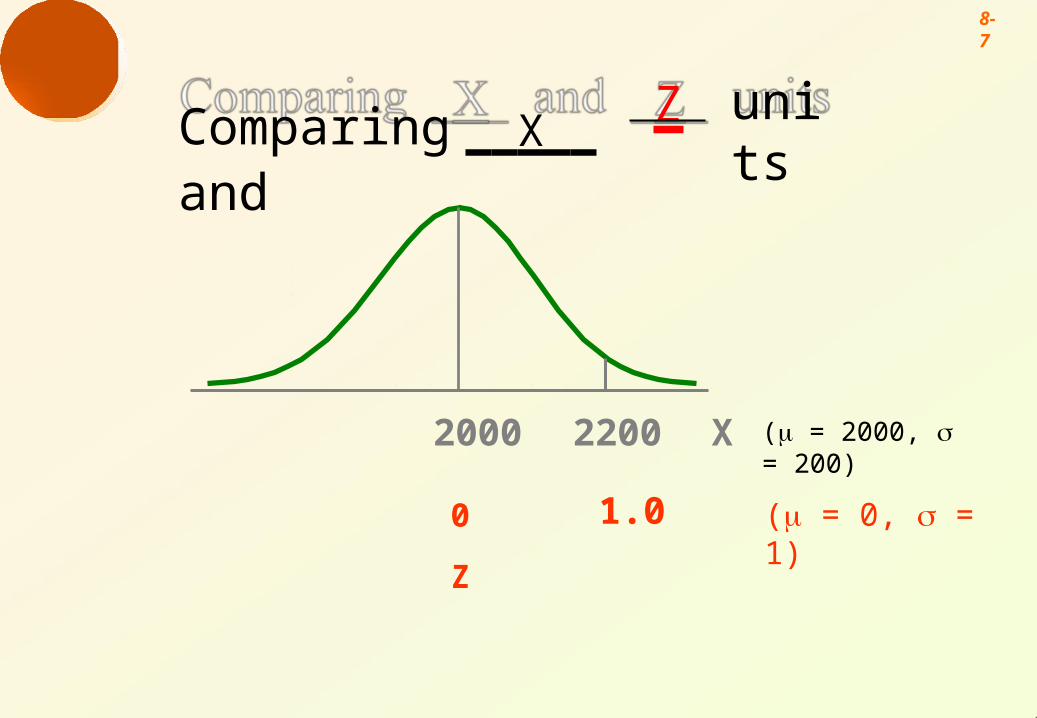
units
2000 2200 X
0 1.0
Z
( = 2000, = 200)
( = 0, = 1)
ZComparing X and
8- 8
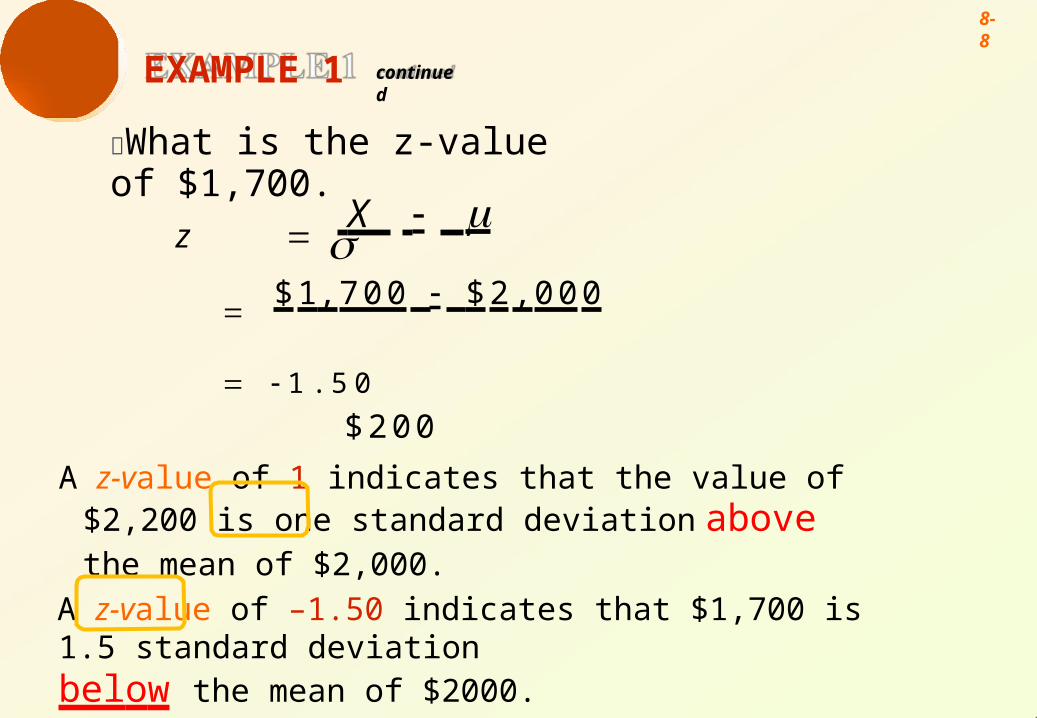
EXAMPLE 1 continued
A z-value of 1 indicates that the value of $2,200 is one standard deviation above the mean of $2,000.
A z-value of –1.50 indicates that $1,700 is 1.5 standard deviationbelow the mean of $2000.
What is the z-value of $1,700.z X
$ 1,7 0 0 $ 2 ,0 0 0 1 .5 0
$ 2 0 0
8- 9
Areas Under the Normal Curve
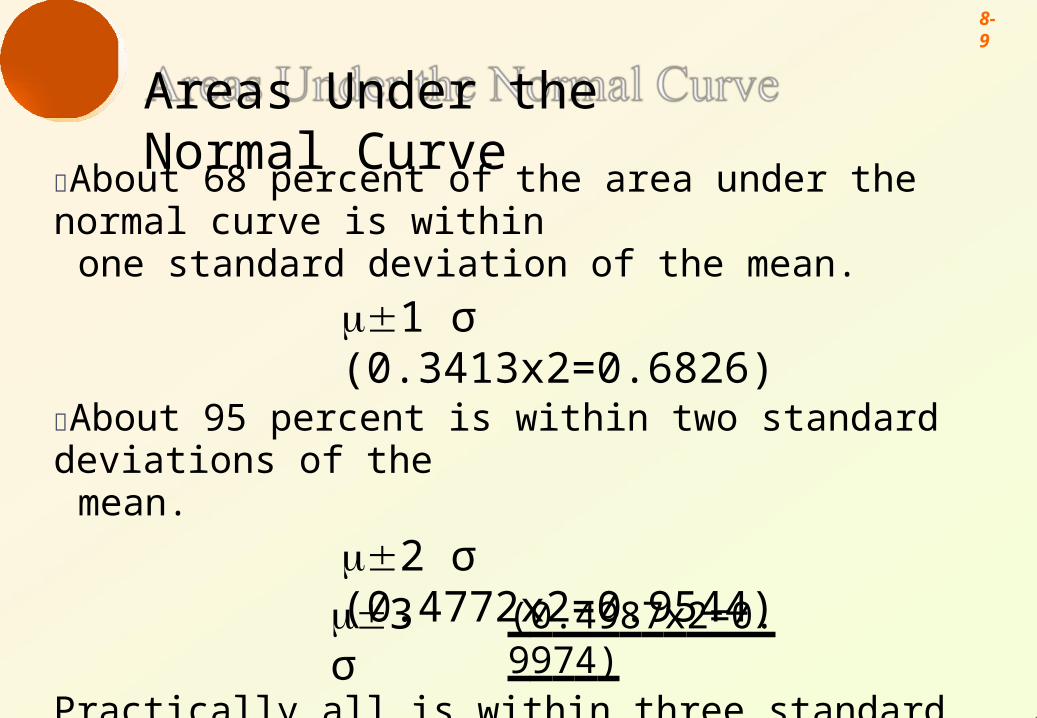
About 68 percent of the area under the normal curve is withinone standard deviation of the mean.
1 σ(0.3413x2=0.6826)
About 95 percent is within two standard deviations of themean.
2 σ(0.4772x2=0.9544)
Practically all is within three standard deviations of the mean.3 σ (0.4987x2=0.9974)
8- 10
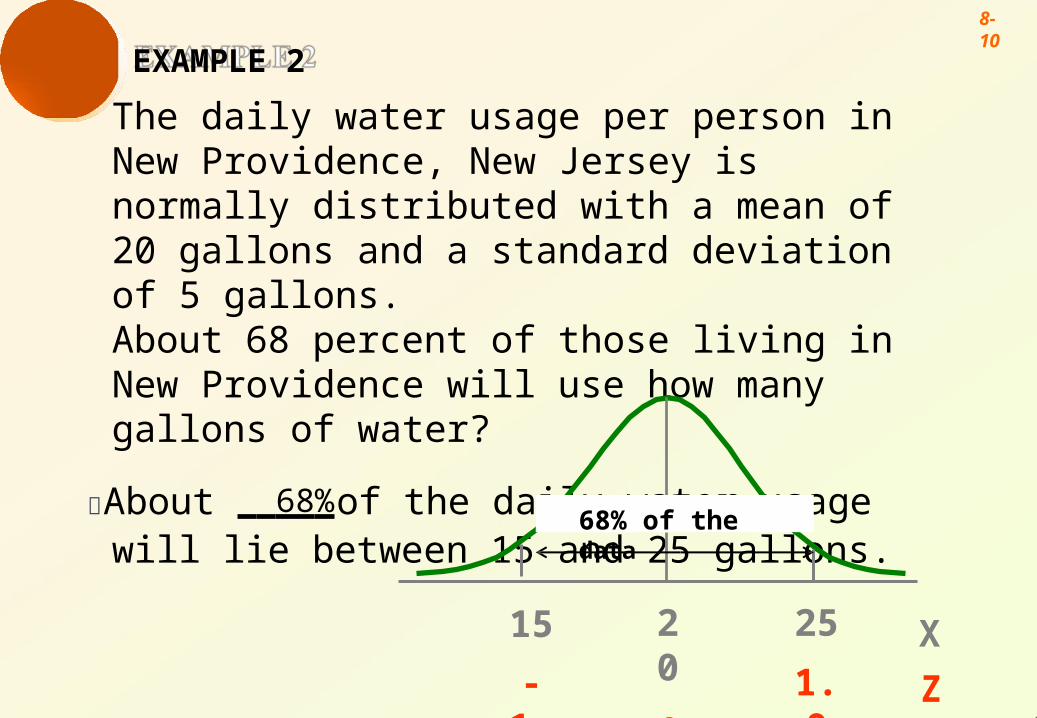
EXAMPLE 2
The daily water usage per person in New Providence, New Jersey is normally distributed with a mean of 20 gallons and a standard deviation of 5 gallons.About 68 percent of those living in New Providence will use how many gallons of water?
About 68%of the daily water usage will lie between 15 and 25 gallons.
X
Z
20
0
25
1.0
15
-1.0
68% of the data
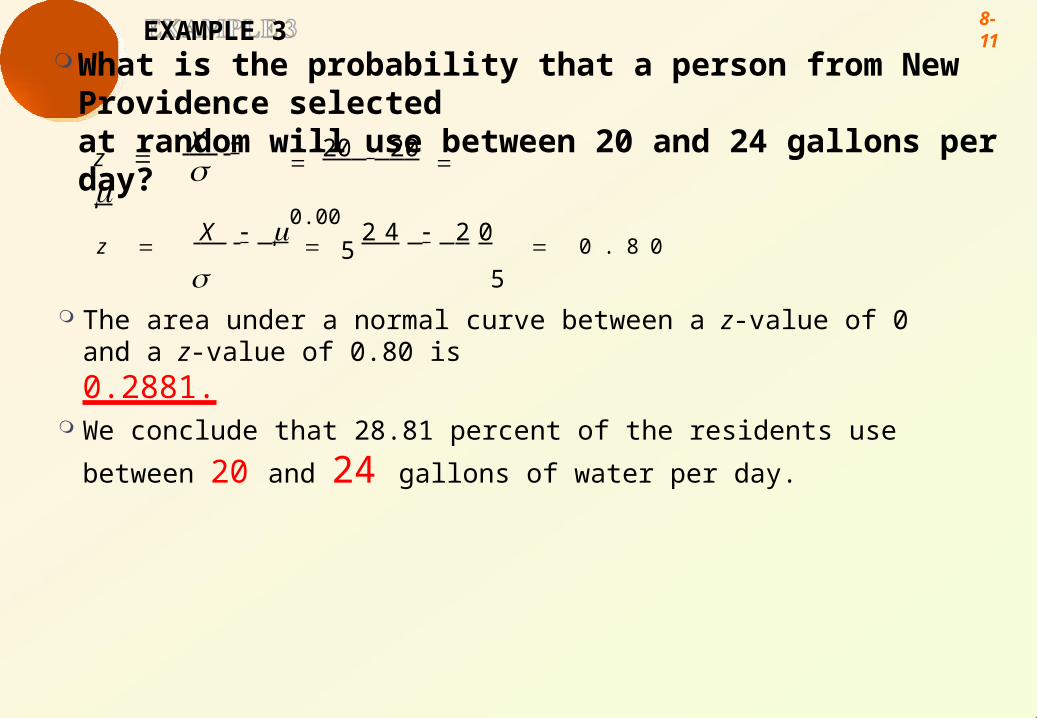
8- 11EXAMPLE 3
What is the probability that a person from New Providence selectedat random will use between 20 and 24 gallons per day?
z X
z X
2 4 2 0
0 . 8 0
5
The area under a normal curve between a z-value of 0 and a z-value of 0.80 is
0.2881. We conclude that 28.81 percent of the residents use between 20 and 24 gallons
of water per day.
20 20
0.00
5
8- 12
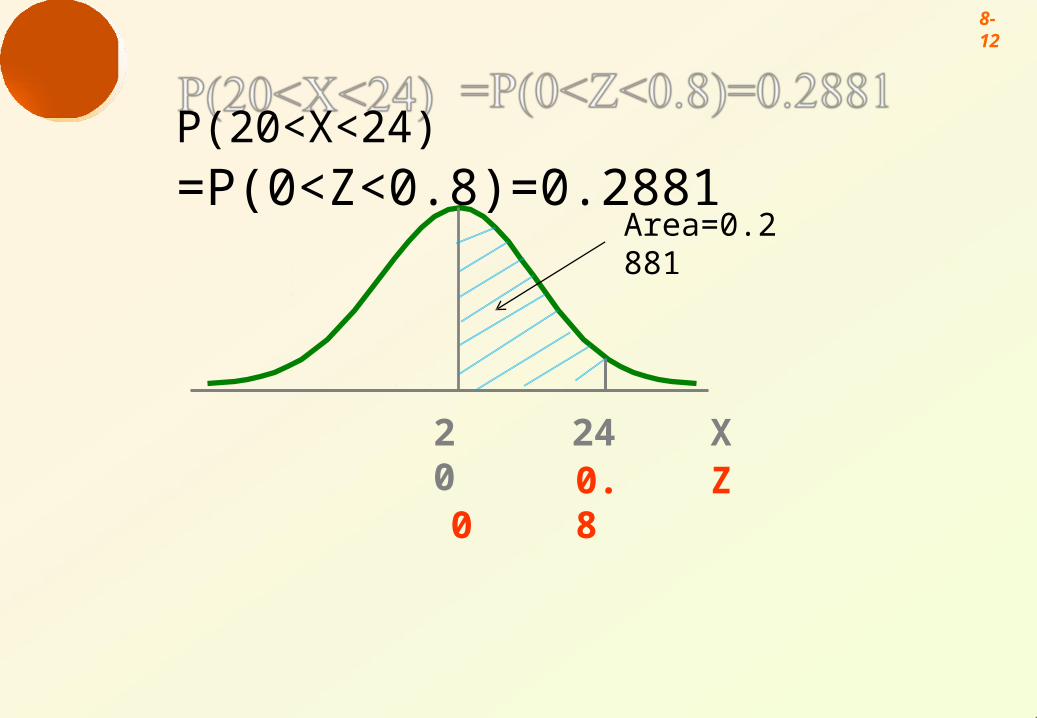
P(20<X<24)
=P(0<Z<0.8)=0.2881
XZ
200
240.8
Area=0.2881
8- 13
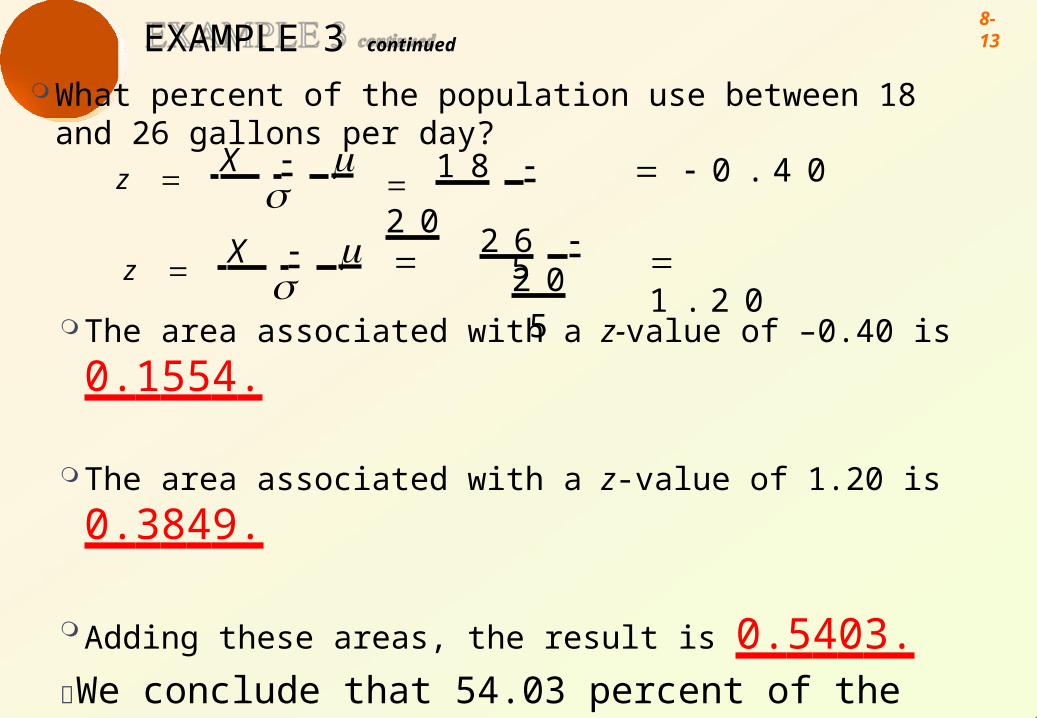
EXAMPLE 3 continued
What percent of the population use between 18 and 26 gallons per day?
0 . 4 0 1 8 2 0
5
z X
1 . 2 02 6 2 0
5z
X
The area associated with a z-value of –0.40 is 0.1554.
The area associated with a z-value of 1.20 is 0.3849.
Adding these areas, the result is 0.5403.We conclude that 54.03 percent of the residents use between
18 and 26 gallons of water per day.
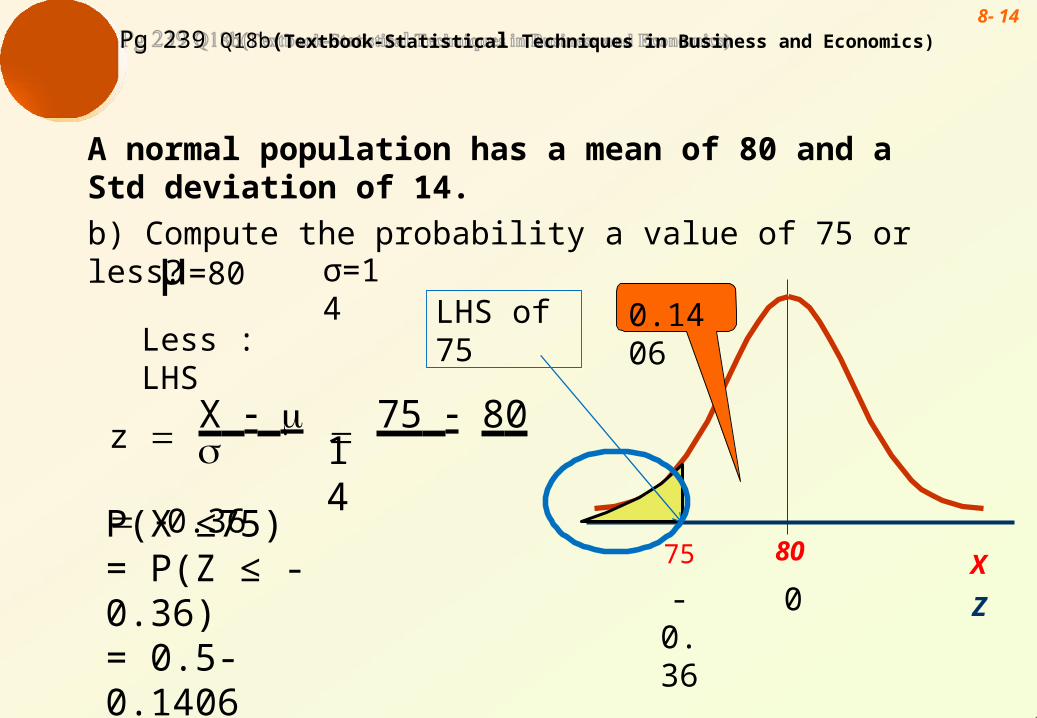
8- 14Pg 239 Q18b(Textbook-Statistical Techniques in Business and Economics)
A normal population has a mean of 80 and a Std deviation of 14.
b) Compute the probability a value of 75 or less?
80 X
Z
75
-0.36
μ=80
Less : LHS
σ=14
z X 75 80 0.3614
P(X ≤75)= P(Z ≤ -0.36)= 0.5-0.1406= 0.3594
0.1406LHS of 75
0
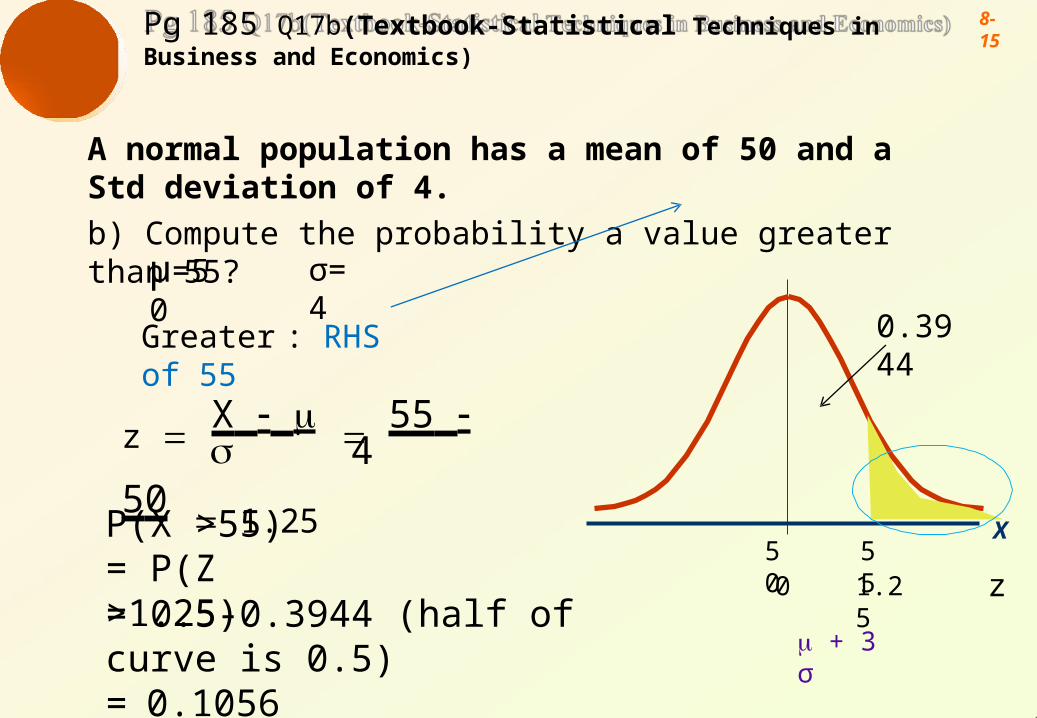
8- 15Pg 185 Q17b(Textbook-Statistical Techniques in Business and Economics)
A normal population has a mean of 50 and a Std deviation of 4.
b) Compute the probability a value greater than 55?
50 55X
µ=50 σ=4
Greater : RHS of 55
z X 55 50 1.254
P(X >55)= P(Z >1.25)= 0.5-0.3944 (half of curve is 0.5)= 0.1056
0.3944
0 1.25 z
+ 3 σ
Pg 185 Q17a(Textbook-Statistical Techniques in Business and Econom8i-
c1s6)
A normal population has a mean of 50 and a std deviation of 4.
a) Compute the probability a value between 44 and 55?
µ =50 σ=4
z X
44 50 1 .5
4
50x
55
z X 55 50 1.25
4
P(44<X <55)= P(-1.5<Z<1.25)= 0.4332+0.3944=0.8276
44
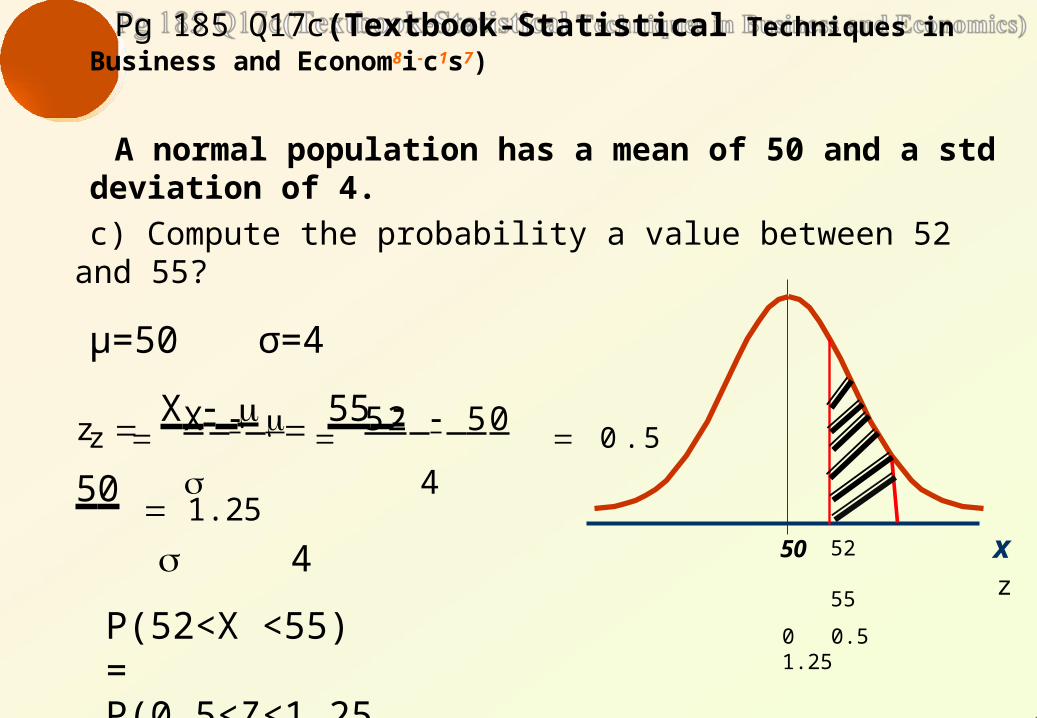
Pg 185 Q17c(Textbook-Statistical Techniques in Business and Econom8i-
c1s7)
A normal population has a mean of 50 and a std deviation of 4.
c) Compute the probability a value between 52 and 55?
μ=50 σ=4
z X
52 50 0 .5
4
50 xz
z X 55 50 1.25
4
P(52<X <55)= P(0.5<Z<1.25)=0.3944- 0.1915=0.2029
52
55
0 0.5 1.25
8- 18
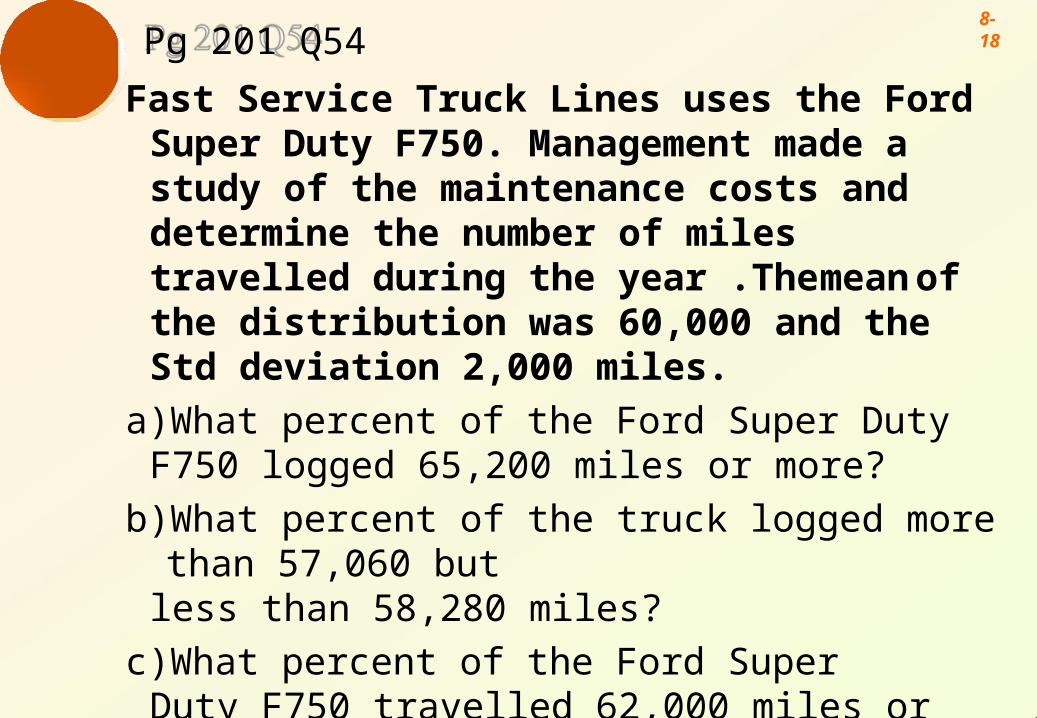
Pg 201 Q54
Fast Service Truck Lines uses the Ford Super Duty F750. Management made a study of the maintenance costs and determine the number of miles travelled during the year .The mean of the distribution was 60,000 and the Std deviation 2,000 miles.
a)What percent of the Ford Super Duty F750 logged 65,200 miles or more?
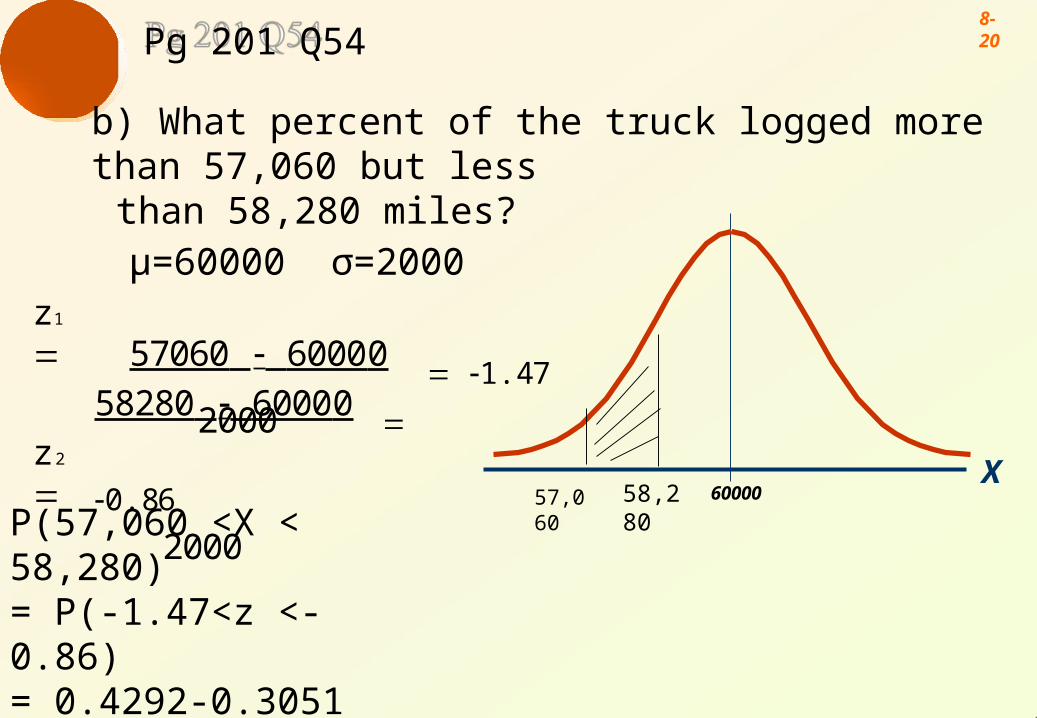
b) What percent of the truck logged more than 57,060 butless than 58,280 miles?
c)What percent of the Ford Super Duty F750 travelled 62,000 miles or less during the year?
d)Is it reasonable to conclude that the trucks were drivenmore than 70,000 miles?
8- 19
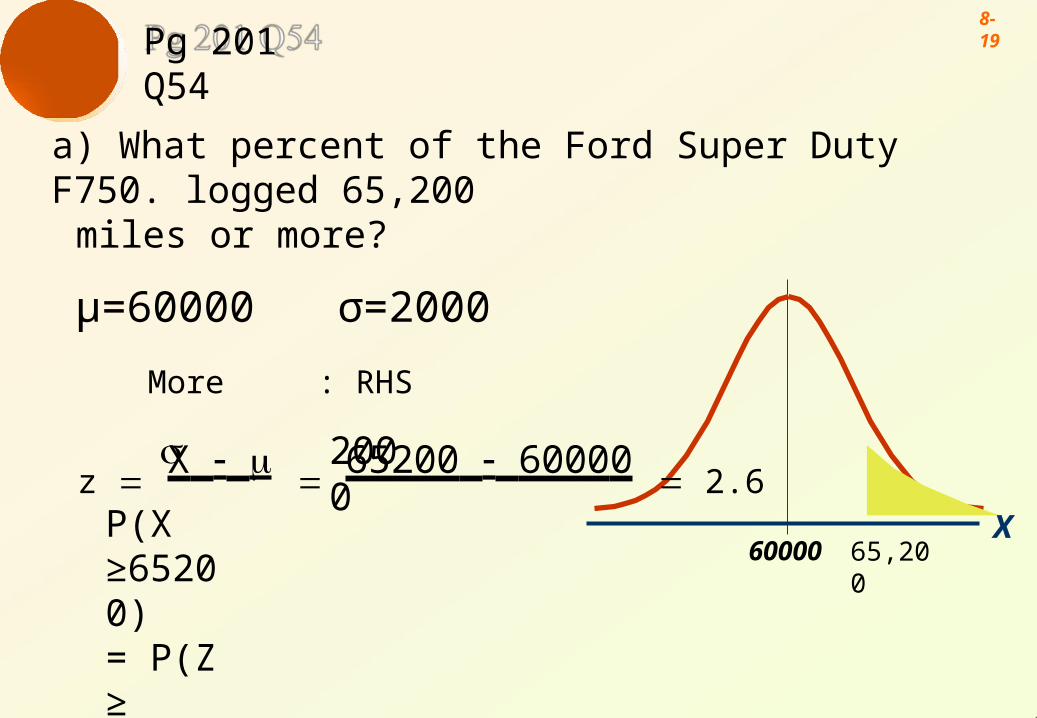
Pg 201 Q54
60000 65,200
a) What percent of the Ford Super Duty F750. logged 65,200miles or more?
μ=60000 σ=2000
More : RHS
z X 65200 60000 2.6
X
2000
P(X ≥65200)= P(Z ≥ 2.6)= 0.5-0.4953=0.0047
8- 20
Pg 201 Q54
b) What percent of the truck logged more than 57,060 but lessthan 58,280 miles?μ=60000 σ=2000
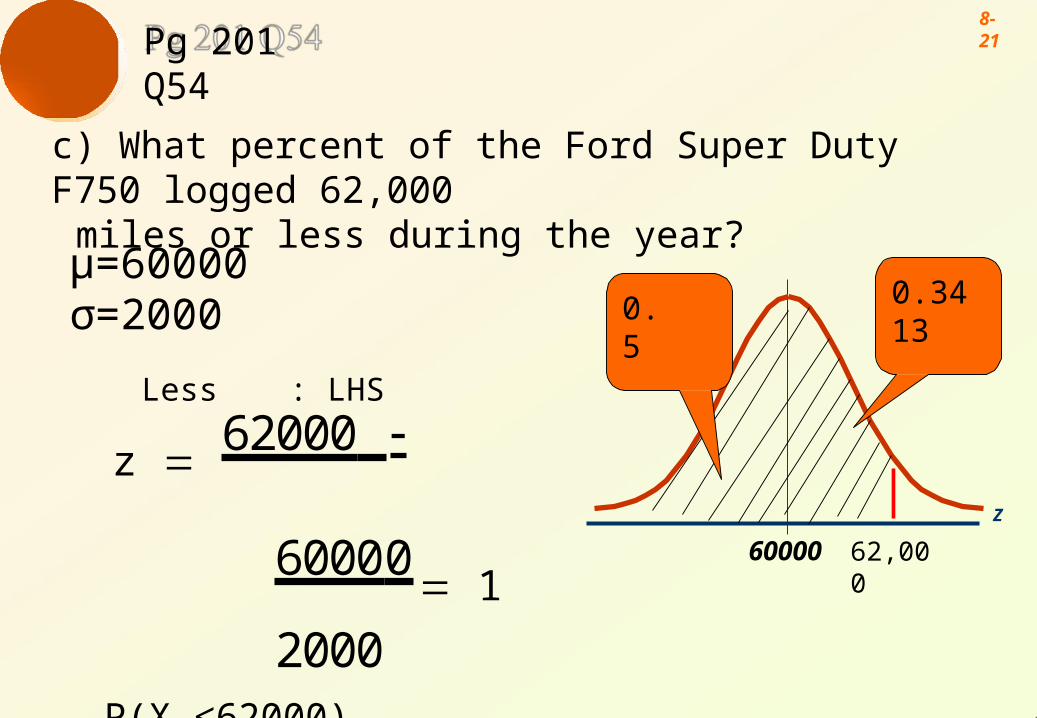
c) What percent of the Ford Super Duty F750 logged 62,000miles or less during the year?
μ=60000σ=2000
Less : LHS
60000
Z
62,000
z 62000 60000 1
2000P(X ≤62000)= P(Z ≤1)= 0.5+0.3413=0.8413
0.34130.5
8- 22
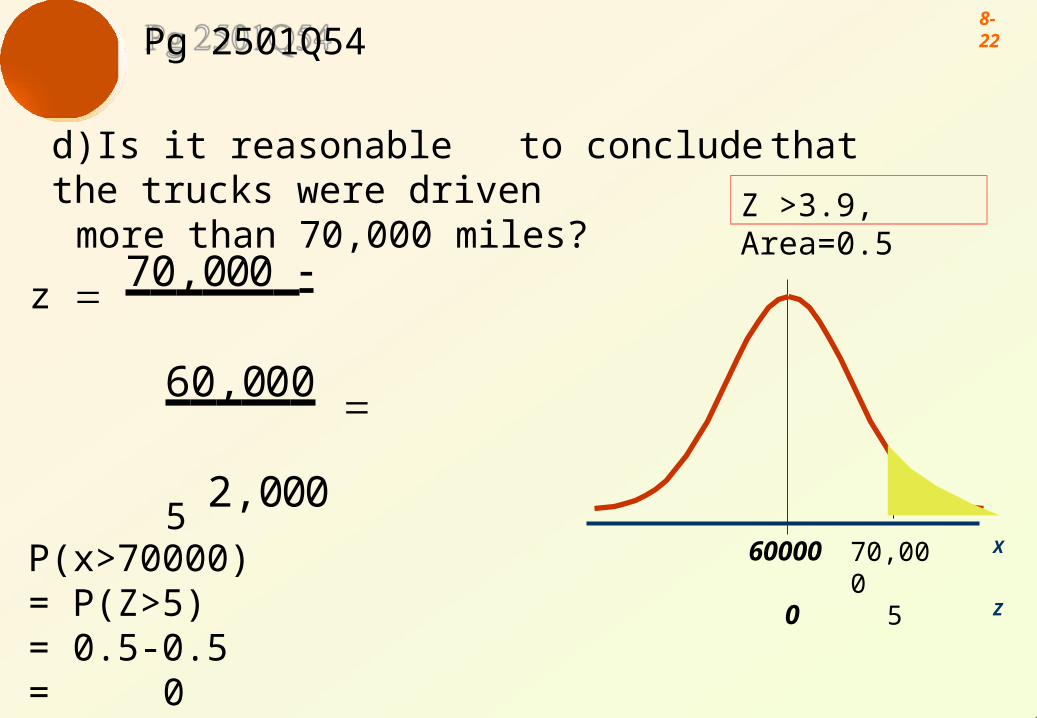
Pg 2501Q54
d)Is it reasonable to conclude that the trucks were drivenmore than 70,000 miles?
60000
0
X
Z
70,000
5
z 70,000 60,000
5 2,000
P(x>70000)= P(Z>5)= 0.5-0.5= 0
No, it is not reasonable to conclude that the trucks were driven more than 70,000 miles?
Z >3.9,Area=0.5
8- 23
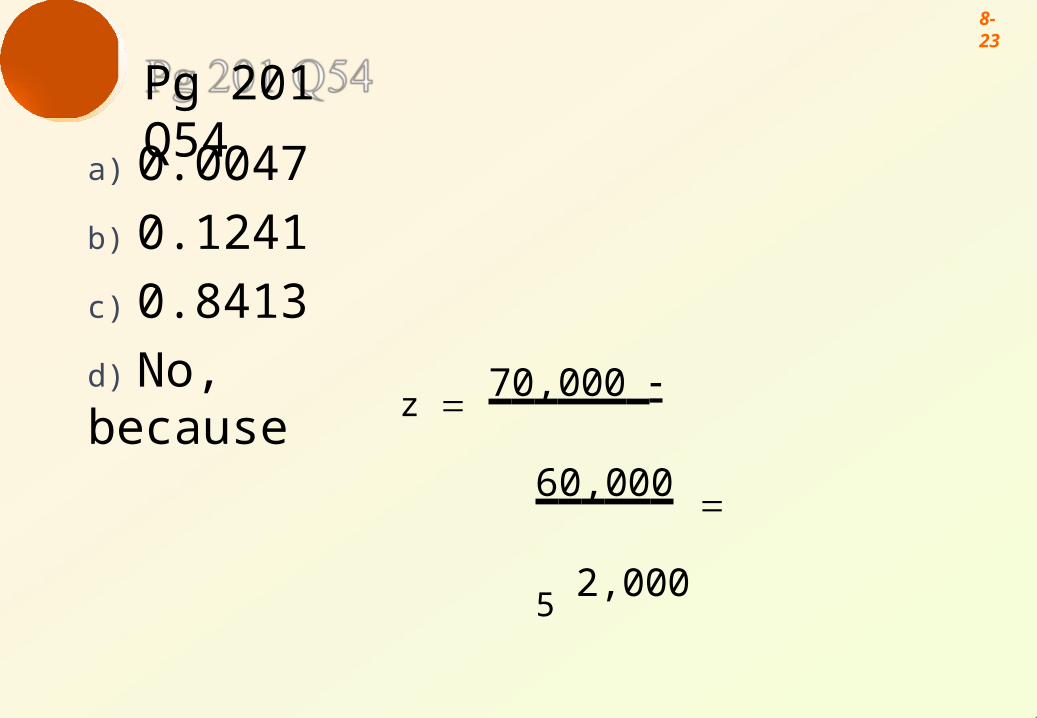
Pg 201 Q54
a) 0.0047
b) 0.1241
c) 0.8413
d) No, becausez 70,000 60,000 5
2,000
8- 24
EXAMPLE 4 Pg 202 Q 66 (Textbook-Statistical Techniques in Business
and Economics) The price of shares of Bank of Florida at the end of trading
each day for the last year followed the normal distribution. Assume there were 240 trading days in the year. The mean price was $42 per share and the standard deviation was$2.25 per share.
a) What percent of the days was the price over $45.00? How many days would you estimate?
b) What percent of the days was the price between $38.00 and
$40.00? c) What was the stock’s price on the highest 15% of days?
8- 25
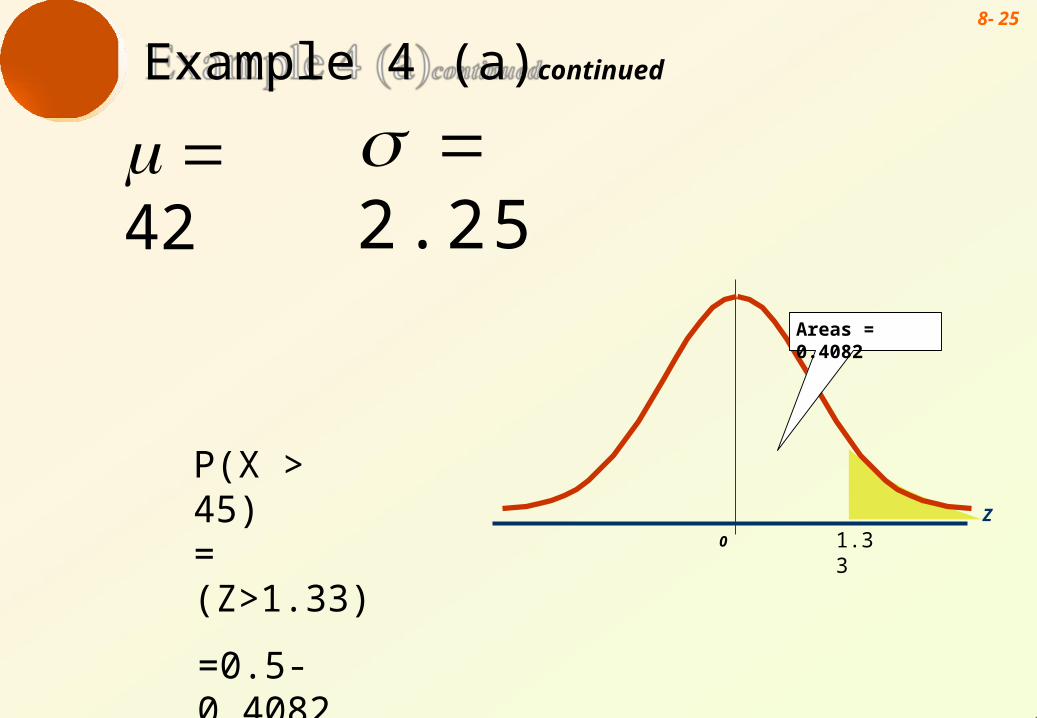
Example 4 (a)continued
2.25 42
P(X > 45)= (Z>1.33)
=0.5-0.4082=0.0918
0
Z
1.33
Areas = 0.4082
8- 26
Example 4 (b)continued
2.25 42
P(38<X< 40)= P(-1.78<z<-0.89)
=0.4625-0.3133=0.1492
8- 27
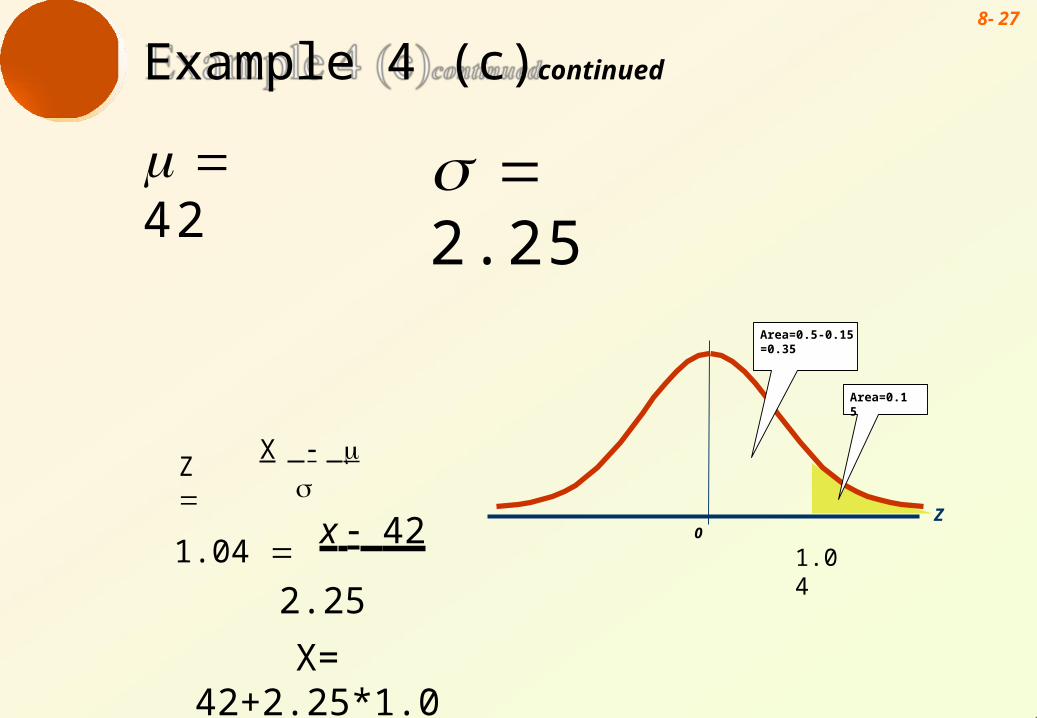
Example 4 (c)continued
2.25 42
0Z
Area=0.5-0.15=0.35
Area=0.15
1.04 x 42
2.25
X= 42+2.25*1.04= $44.34
X
Z
1.04
8- 28
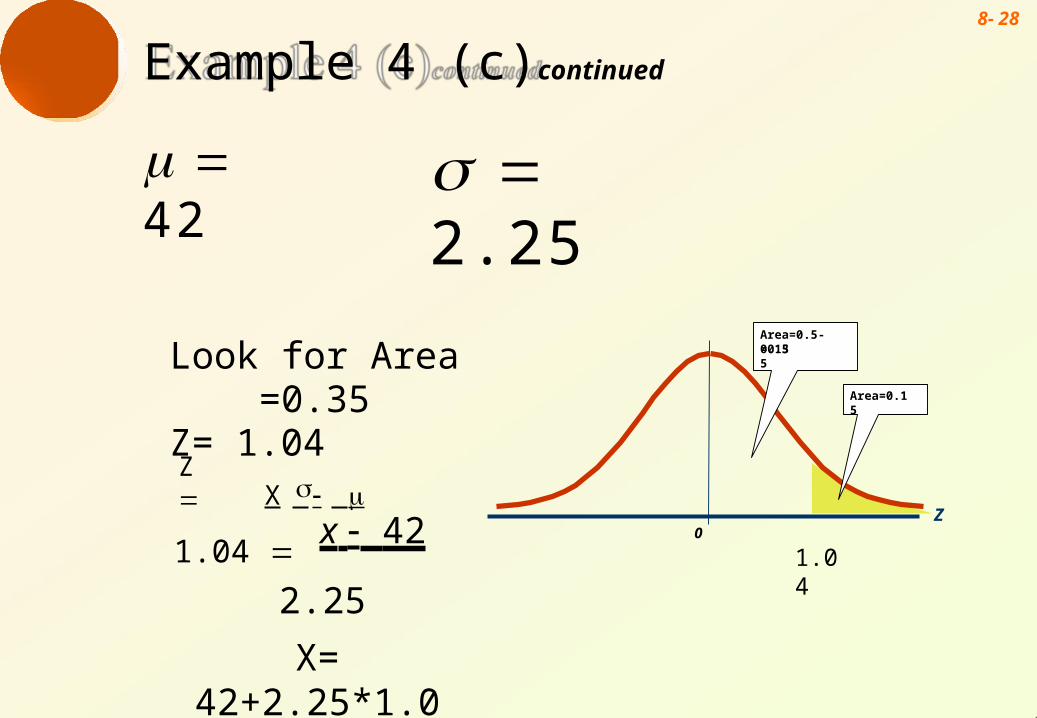
Example 4 (c)continued
2.25 42
Look for Area =0.35Z= 1.04
X
0Z
Area=0.15
Area=0.5-0.15=0.35
1.04 x 42
2.25
X= 42+2.25*1.04= $44.34
Z
1.04
8- 29
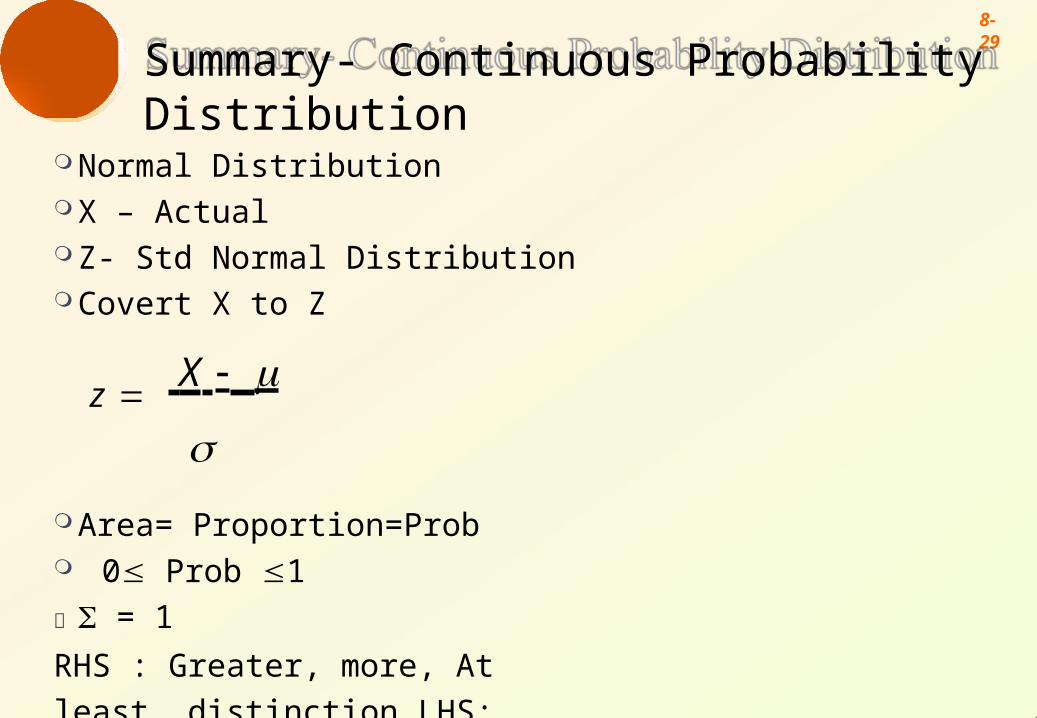
Summary- Continuous Probability Distribution
Normal Distribution X – Actual Z- Std Normal Distribution Covert X to Z