66
Publication date: 19 December 2017 Contact: Anthony Mungall Team: RIIO Electricity Transmission Tel: 0141 331 6010 Email: [email protected]

Publication
date:
19 December
2017
Contact: Anthony Mungall
Team: RIIO Electricity Transmission
Tel: 0141 331 6010
Email: [email protected]

2
Contents
Executive Summary …………………………………………………………………………………………………………. 3
1. Introduction and context .................................................................... 5
2. Financial information .......................................................................... 8 Total controllable expenditure (totex) ................................................................... 8 Customer bill impact ......................................................................................... 12 Return on Regulatory Equity (RoRE) ................................................................... 13
3. Outputs, incentives and innovation .................................................. 15 Outputs, measures and performance .................................................................. 15 Incentives ....................................................................................................... 18 Network Innovation Allowance (NIA) .................................................................. 18 Network Innovation Competition (NIC) ............................................................... 19 Innovation Rollout Mechanism (IRM) .................................................................. 19
4. Eight-year totex performance drivers ............................................... 20 TO performance insights ................................................................................... 23
5. SO Performance ............................................................................... 27
Appendix 1: SHET & SPT view of totex (company view) ........................................ 31 Appendix 2: NGET TO view of totex (company view) ........................................... 48 Appendix 3: Ofgem assessment of NGET TO totex (post-true up) ........................... 58
Associated documents
Price Control Documents:
RIIO-T1: Final Proposals for NGGT and NGET - Overview
RIIO-T1: Final Proposals for NGGT and NGET – Outputs, incentives and innovation
RIIO-T1: Final Proposals for NGET and NGGT – Cost assessment and uncertainty
RIIO-T1: Final proposals for SP Transmission Ltd and Scottish Hydro Electricity
Transmission
Transmission networks own reports on their performance:
NGET: http://www.talkingnetworkstx.com/general-performance.aspx
SHE Transmission: https://www.ssen-transmission.co.uk/media/2294/transmission-
annual-performance-report-2016-17.pdf
SPT:
https://www.spenergynetworks.co.uk/pages/transmission_annual_performance_reports.
aspx
Other documents:
National Grid’s deferral of RIIO-ET1 allowances
https://www.ofgem.gov.uk/publications-and-updates/modifications-et1-gtd1-pcfms-
account-london-medium-pressure-refund-and-national-grid-voluntary-allowance-deferral
Mid-period review parallel work decision
https://www.ofgem.gov.uk/publications-and-updates/mpr-parallel-work-decision

3
Executive Summary
RIIO-ET1 is the first electricity transmission price control that utilises the RIIO (Revenue
= Incentives + Innovation + Outputs) price control model. This report outlines our key
findings of onshore electricity transmission sector performance under each of these
areas for both the transmission owner (TO) businesses and the system operator (SO).
Performance against annual output targets
All TOs performed well against the agreed output targets in 2016-17. All have met or
exceeded the annual targets set against five of the six output categories, namely:
safety; reliability; availability; customer satisfaction; and environmental. Based on
current information, only SHE Transmission will be penalised for not meeting their
agreed target for reducing leakage of SF6 gas in the environmental output category.
The sixth output category is ‘connections and wider works’. It has two elements related
to the installation of new assets on the network to accommodate changes in electricity
generation and demand (‘load’). One element relates to the process of offering terms for
connection to new users. All licensees are meeting their requirements to provide offers
(where requested) in a timely manner.
The second element relates to providing network capacity to accommodate changes in
generation and demand. As the output is heavily influenced by the scale of change in
customer-driven activity, the expected output is based on the ‘baseline’ assumptions set
at the start of RIIO-ET1 and then adjusted with actual outturn.
For NGET TO, the required output is expected to be significantly lower than the original
baseline due to the reduction in the number and size of customer connections expected
across the period. SHE Transmission is forecasting to meet and exceed its baseline
levels, whereas SPT is currently expecting to fall short against its baseline expectations
in relation to new generation connection (‘sole use’). All three TOs indicate that whether
the actual outputs are near, over or under the baseline level, their delivery are likely to
be different from the project portfolio in their original business plans.
Eight-year expenditure performance and drivers
Total expenditure (totex) performance is presented across the entire price control period
and combines ‘actual’ performance to date and the current company forecasts for the
remainder of the eight-year period.
All of the TOs are currently expecting to underspend relative to their expected
allowances, with forecast underspends ranging between 4% and 12% across RIIO-ET1.1
We have identified the factors that are contributing to the companies’ totex underspend.
We acknowledge that some of the forecast underspend is driven by the companies
reporting a significant change in working practices and new ways of managing
processes. We also note that an element of underspend will be driven by factors outside
of the TOs’ control, for example, the TOs have benefitted from a slower growth in input
prices than anticipated relative to the RPI inflation index.
1 The figures are based upon the TOs’ published values.

4
At a company level, NGET (TO) is currently expecting to achieve significant underspend
(over £1 billion, or 20% below forecast allowance) across the entire RIIO-ET1 period as
a result of the net effect of re-scheduling of work and change in its intervention
strategies to monitor, maintain and replace existing assets (‘non-load’). On the load side
of the business, a forecast underspend (c.£280 million, or 7%) is largely driven by
changes in its portfolio of investment relative to the original business plan for the
baseline and adjustment around it.
SHE Transmission’s expected totex underspend (c. £180 million, or 6% below forecast
totex allowance) is largely driven by the costs incurred in the delivery of the three
Strategic Wider Works projects being lower than the original allowance – primarily the
result of project delivery efficiencies reported by the company. It currently expects these
savings to offset the overspend anticipated on non-load activities across the eight-year
price control period (c.£100 million, or 33% above non-load allowances).
SPT’s current forecast of totex underspend (c.£80 million, or 4% below forecast totex
allowance) is driven by three main factors. First, there have been changes in the scope
of works necessary to connect new generators to its network and increased capacity
across some routes are no longer needed. Second, contracting techniques, particularly
on large-scale projects. Thirdly, re-profiling of investment to manage network access
and outage issues has led SPT to substitute equivalent asset types and volumes and to
reduce its forecast spend.
NGET, in its role as SO, is currently expecting totex savings of £47 million (4% below
forecast totex allowance) across the RIIO-ET1 period driven by an underspend in the
area of controllable operational costs (c.£40 million). This is largely due to the expected
expenditure increase over the next four years - reflecting enhancements to the SO’s role
- being lower than the forecast level of allowance over the same period.
Financial performance
The financial performance is presented using the Rate of Regulatory Return on Equity
(RoRE) measure. Based on our own assessment of the value of TOs’ forecast totex
performance at the end of the eight-year period, we have calculated a current RoRE
range between 9.3% and 10.1%.
Customer bill impact
The financial and output performance of TOs affects the Allowed Revenue that they can
collect through customer bills. The performance in 2016-17 will impact on Allowed
Revenue, and therefore customer bills, in 2018-19. We estimate that the average GB
customer will pay c.£37 per annum (nominal prices) to cover electricity transmission
network costs in 2018-19.

5
1. Introduction and context
1.1. The electricity transmission network in Great Britain (GB) consists of the high
voltage electricity wires and cables, which convey electricity from power stations to local
distribution networks and large-scale customers directly connected to the system.
1.2. Owners of the networks have obligations including ensuring that they are able to
provide an economic and efficient service to parties who wish to connect onto their
network. This means having in place necessary new infrastructure or refurbish existing
infrastructure appropriately to ensure its network is capable of transporting electricity at
all times.
1.3. Three activities are crucial in providing a robust network: minimising the impact of
construction activities to accommodate new generation and demand (to avoid
unnecessary interruptions), good management of existing assets (to reduce the
likelihood of failure) and, when there is a loss of supply, to ensure supplies are restored
as quickly as possible. The challenge is to do this safely, effectively and at lowest cost to
consumers.
1.4. The TOs are natural regional monopolies. To ensure value for money for consumers,
we regulate TOs through periodic controls. Among other things, this determines the
amount of revenue that TOs are able to earn from network users (through the charges
users pay) and stipulates the level of performance we expect TOs to deliver. It also sets
the framework for the capital investment they are able to make in maintaining and
developing the networks. There are three onshore providers of electricity transmission
services.
Company Network Ref.
used in report
National Grid Electricity
Transmission
England & Wales
NGET
Scottish
Hydro Electric
Transmission
North of Scotland and Scottish island
groups
SHET
ScottishPower
Transmission
South of Scotland
SPT

6
RIIO framework
1.5. To set our price controls we use the RIIO (Revenue = Incentives + Innovation +
Outputs) framework. The current electricity transmission price control lasts for an eight-
year period from April 2013 until March 2021.
1.6. At the start of the price control, we set the ‘baseline’ allowance that would
determine the revenue that TOs can earn. The value of this allowance was based on
knowledge of projects that were deemed fairly certain to proceed at the time of
settlement. There are outputs associated with baseline allowances that TOs must deliver
either on an annual or eight-year basis. The outputs are intended to capture the things
most valued and needed by consumers.
1.7. Three main categories of allowances were set in the RIIO-ET1 price control:
Ex-ante (upfront and fixed) allowance. This reflects areas of work where there
was an established customer-driven need for the delivery of pre-agreed outputs
(or works not linked to specific outputs because of their unique nature).
Allowances driven by ‘uncertainty mechanisms’. In some areas (like connecting to
the electricity system), the future costs to be incurred and outputs to be delivered
over the current RIIO period were uncertain and expected to evolve. To reflect
this uncertainty allowances flex year-on-year, depending on TOs’ performance
against targets. The parameters of these mechanisms were agreed upfront.
Where there is significant uncertainty with some investment projects, the
individual schemes are subject to a within-period determination by the Authority.
The most notable example is the Strategic Wider Works (SWW) process.
Annual reporting
1.8. Each year we report on how the onshore electricity transmission owners (TOs) have
performed against the outputs and allowances set for the RIIO-ET1 price control. This is
part of our annual process of monitoring network companies, and holding them to
account for the money they spend and collect from consumer bills.
1.9. In July of each year, each TO must submit information to us that outlines the actual
costs they have incurred up to 31 March of that year and forecast costs to the end of
RIIO-ET1. They also provide a written commentary with further detail, including reasons
for differences between costs, allowances and forecasts.
1.10. We analyse this information and examine any variation in TO performance against
their annual and eight-year output targets. We also meet with the companies to discuss
technical and financial aspects of their submissions.

7
1.11. This report outlines the company view of their eight-year performance against
their price control obligations and incentives using data and supporting information
provided by the companies.
1.12. The following chapters provide more detail:
Chapter 2: Financial information – explains the financial aspects of
performance; allowed revenue, RoRE and the impact on consumer bills.
Chapter 3: Outputs, incentives and innovation – explains how the TOs have
performed against their output commitments over the fourth year of the RIIO-
ET1 period. It also indicates the incentive payments earned by the licensees in
respect of their performance levels and presents an overview of TOs’ expenditure
in relation to the various innovation incentives.
Chapter 4: Eight year TO totex performance - outlines the current eight-year
view of TO totex as compared with the current company view of forecast totex
allowances (adjusted for MPR and voluntary deferral where appropriate). The
totex values are not adjusted for the current forecast “true up”2 of allowances.
Chapter 5: SO performance – provides information regarding the performance
and costs incurred by the SO.
Appendices – appendix 1 provides more detail on the current forecast company
view of SHET and SPT. Appendix 2 provides more detail on the current company
forecast of NGET TO. Appendix 3 summarises our assessment of totex values
upon which our RoRE analysis is based on.
1.13. Unless otherwise stated, all financial values in this report are in 2016-17 prices.
2 The original business plan included forecasts of the contributions expected to be received from customers
with connections to single users. The net expenditure for these connections is funded directly by the customer and any income received by the TO is not treated as part of the allowed revenue permitted to be recovered through network charges. Final Proposals clarified that the position would be “trued up” at the end of RIIO-ET1. Our “true up” reflects the removal of actual “excluded services” income from total allowed revenue, and the expectation that the monies received by TOs through customer contributions will be paid back.

8
2. Financial information
Chapter Summary
This chapter explains how we determine the annual allowed revenue of each TO that can
be collected through network charges. It also contains an analysis of how expenditure by
the TOs impacts on customer bills.
Introduction
2.1. For each network company we report:
their total controllable expenditure (totex3) on maintaining and improving GB’s
electricity transmission network infrastructure
their Allowed Revenue for these activities4
the impact of Allowed Revenue on customer bills
an estimate of the associated return on regulatory equity (RoRE) for investing in
the electricity transmission network.
Total controllable expenditure (totex)
2.2. For each year of the price control, network companies are required to report their
actual totex, explaining their performance compared to the allowed totex and in relation
to their agreed outputs annually.5 They are also required to forecast their totex
performance to the end of the price control.
2.3. As totex refers to total controllable expenditure, it comprises both capital
expenditure (capex) and operational expenditure (opex). Therefore, network companies
are incentivised to deliver outputs based on total whole life costs, rather than being
driven to preferring either opex or capex.6 This better incentivises them to select the
best overall solutions for customers.
Actual and forecast expenditure
2.4. Table 1 details the cumulative company view of totex expenditure for each network
company to date (the first four years of the price control) and the current forecast across
the remainder of the price control period.
3 Includes only controllable costs, excluding uncontrollable costs such as business rates, and licence fees. 4 Allowed revenues are recovered from users of the transmission network through charges levied and collected by NGET in its role as SO on behalf of all TOs. 5 For RIIO-ET1 the reporting requirements have been consolidated in Standard Condition B15. 6 Historically capex solutions have been preferred, as the cost was capitalised and increased their regulatory asset value (RAV). Under the Totex approach, when a company spends money on a solution, the same percentage is capitalised irrespective of whether that solution involves opex or capex. This means that companies are more likely to use the overall cost-effective solution.

9
2.5. To date, all three TOs underspent against their totex allowances over the first four
years of the RIIO-ET1 price control. The cumulative four-year allowance across all TOs
was £9,868 million, and actual expenditure was £7,679 million; an underspend of
£2,189 million, or 22%.
2.6. The NGET SO has a cumulative out-performance of 3% relative to its allowed totex
across the first four years of the price control (£604 million).
2.7. The cumulative TO allowed totex over the entire price control (after the company’s
expectation of future revisions) is expected to be £17.5 billion. It is currently forecast
that after all revisions the TOs will underspend by £1.67 billion (10%). The NGET SO is
equivalently forecasting a total underspend of 4% relative to its allowed totex value
across the RIIO-ET1 price control.
2.8. The values of allowed totex within our current financial model will differ from the
network companies’ published values.7 This is because the published values reflect the
outcome of the revisions to the allowed totex at the end of the eight-year price control
period. The value of the revisions reflect forecasts of its performance for the remainder
of the price control (2017-18 to 2020-21) based on their expectations. This includes
estimates of volume driver allowances and expenditure as well as within period
determinations (not yet approved). The financial model is not calibrated to be ‘forward
looking’ in this way.8
Table 1: Company forecast of final allowed totex and expenditure9
£m 2016-17 Prices Cumulative to date 2013-14 to 2016-17
Eight-year forecast: 2013-2021
Allowed Totex
Actual Difference Allowed Totex
Actual + Forecast
Difference
£m £m £m % £m £m £m %
NGET TO 6,286 4,900 -1,386 -22% 12,119 10,684 -1,435 -12%
SPT 1,407 1,250 -157 -11% 2,177 2,095 -82 -4%
SHE Transmission 2,175 1,530 -646 -30% 3,225 3,044 -181 -6%
TO Total 7,679 9,868 -2,189 -22% 17,520 15,364 -1,673 -10%
NGET SO 604 585 -19 -3% 1,336 1,288 -47 -4%
2.9. Further detail on the TO forecast position across the RIIO-ET1 period is set out in
chapter 4. Chapter 5 provides more detail on the SO expenditure against allowances for
specific cost categories.
7 The values also differ from our own assessment of the company submissions set out in appendix 3. 8 Another source of difference will be small scale ‘backward looking’ adjustments for outputs incentive payments, innovation funding and other costs such as differences between previous years’ Allowed Revenue and the actual amount that has been collected. 9 Totex values are not adjusted for our current forecast “true up” to remove the gap between the allowance for excluded services income and the costs. The figures do include the impact of the MPR decision and voluntary deferral by National Grid (£480m in 2009-10 prices).

10
Totex Incentive Mechanism (TIM)
2.10. Network companies are incentivised to outperform their totex allowance. Through
the TIM any underspend compared to the allowed totex is shared between the network
company and its customers. Therefore, efficient spending leads to better returns for
investors and lower network charges for customers. The totex incentive rate (TIR) is
symmetrical for any overspends: a network company is exposed to any shortfall and the
remainder is passed onto customers by increasing allowances to be recovered through
network charges.
2.11. Table 2 sets out the values of allowed totex within the current financial model that
are driving the allowed revenue calculations for each company. The combined allowed
totex for the TOs in the reporting year 2016-17 is currently £2,573 million. Actual
expenditure was £1,924 million; an underspend of £649 million or 25% (note that this is
the figure before the application of the efficiency incentive rate).
Table 2: Pre-tax Totex in 2016-17
NGET
£m 2016-17 Prices TO SO SHET SPT TOTAL excl SO
Allowed Totex 1,698 144 694 181 2,573 Actual Totex 1,116 162 462 346 1,924
Overspend / underspend -582 19 -232 165 -649
TIR 10 53.11% 53.11% 50.00% 50.00% Allowed Totex after TIR11 1,389 154 578 264 2,231
Allowed revenue
2.12. Allowed Revenue is the total amount of money that TOs can collect from customers
through Transmission Network Use of System Charges (TNUoS). It is ultimately paid for
by customers through their electricity bills. Actual totex and the TIM are two of the
factors that impact on the Allowed Revenue a TO can collect.
2.13. The process of reaching final Allowed Revenue was explained in detail in last year’s
annual report.12
2.14. Each year we calculate the Allowed Revenue that each TO can earn on its
regulated business. To calculate the Allowed Revenue the ex ante forecast Opening Base
10 This is the proportion of underspend / overspend the consumer receives (after accounting for tax). 11 The allowed Totex after TIR is not wholly remunerated in the year it occurs. A minority of the expenditure is funded immediately through the Fast Money part of Base Revenue. The majority is added to the company Regulatory Asset Value (RAV), which is paid out over a period that is reflective of the average lifetime of long-term network assets (multiple decades). 12 Appendix 1 of the 2015-16 report explains the Allowed Revenue process and Appendix 4 provides definitions
of financial terms - https://www.ofgem.gov.uk/publications-and-updates/riio-electricity-transmission-annual-report-2015-16
11
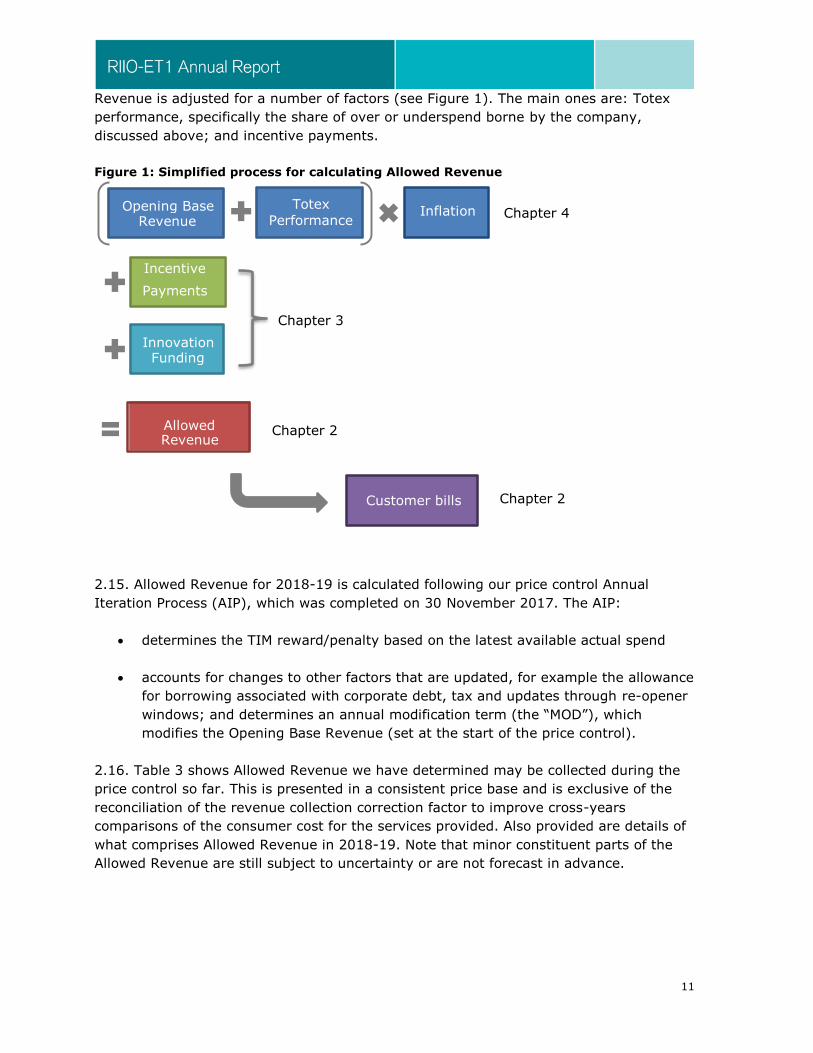
Revenue is adjusted for a number of factors (see Figure 1). The main ones are: Totex
performance, specifically the share of over or underspend borne by the company,
discussed above; and incentive payments.
Figure 1: Simplified process for calculating Allowed Revenue
2.15. Allowed Revenue for 2018-19 is calculated following our price control Annual
Iteration Process (AIP), which was completed on 30 November 2017. The AIP:
determines the TIM reward/penalty based on the latest available actual spend
accounts for changes to other factors that are updated, for example the allowance
for borrowing associated with corporate debt, tax and updates through re-opener
windows; and determines an annual modification term (the “MOD”), which
modifies the Opening Base Revenue (set at the start of the price control).
2.16. Table 3 shows Allowed Revenue we have determined may be collected during the
price control so far. This is presented in a consistent price base and is exclusive of the
reconciliation of the revenue collection correction factor to improve cross-years
comparisons of the consumer cost for the services provided. Also provided are details of
what comprises Allowed Revenue in 2018-19. Note that minor constituent parts of the
Allowed Revenue are still subject to uncertainty or are not forecast in advance.
Inflation
Incentive
Payments
Opening Base Revenue
Totex
Performance
Other
Innovation Funding
Pre -
Other
control
Factor Allowed Revenue
Customer bills
Chapter 4
Chapter 2
Chapter 2
Chapter 3

12
Table 3: Allowed Revenue
NGET TO SHET SPT
Allowed Revenue (exc. Revenue collection correction)
£m 2009/10 Prices
2013/14 1,372 152 246 2014/15 1,464 192 276 2015/16 1,427 283 257 2016/17 1,411 270 252 2017/18 1,303 229 272 2018/19 1,291 244 275
2018-19 Allowed Revenue £m nominal prices Opening Base Revenue 2,088 158 333 MOD -408 102 -5 Non controllable Costs 3 -17 -3 Incentive Payments 10 0 6 Innovation Funding 14 1 2 TIRG - 78 31
Correction Factors Revenue collection -55 4 -1 Inflation forecast true-up -8 -2 -1
Corrected Allowed Revenue 1,643 324 361
Customer bill impact
2.17. We have used assumptions consistent with those that underpin our Supplier Cost
Index (SCI)13,14 to provide an estimate of the cost to typical domestic energy bills due to
Allowed Revenues for each region of GB.
2.18. Actual customer costs are sensitive to geographic region, meter type, consumption
volume and the timing and duration of contracts. Our methodology is based on typical
domestic consumption values (the median domestic consumer in GB). Individual
consumer costs may differ significantly from these values. We report costs on an
annualised basis using our latest assumptions15. The values we are reporting use our
published typical domestic consumption values16.
2.19. We estimate that the typical GB domestic customer will pay £37 in nominal terms
in 2018-19 for electricity transmission costs.
13 SCI: https://www.ofgem.gov.uk/data-portal/retail-market-indicators 14 SCI Method: https://www.ofgem.gov.uk/publications-and-updates/supplier-cost-index-methodology 15 We used the January 2017 version of our Supplier Cost Index model. Note that the SCI uses a consistent view of a typical consumer for all years, in recent years this consumption has been reducing. This and future trends in consumption are not accounted for by this analysis. 16 https://www.ofgem.gov.uk/gas/retail-market/monitoring-data-and-statistics/typical-domestic-consumption-values

13
2.20. Charges differ considerably depending on the region that a consumer resides in.
For a typical consumer 2018-19 charges are expected to range from £20 in South
Scotland and up to £46 in the South East and South West. Bill estimates are reported in
Table 4.
Table 4: Regional estimates of typical GB consumer cost to meet Allowed Revenue
£ nominal prices per typical domestic customer
Year Apr-13 Apr-14 Apr-15 Apr-16 Apr-17 Apr-18
GB customer count weighted average: 23 27 32 38 38 37
Region
North West 22 25 29 34 36 35 North East 18 22 26 40 35 29 Yorkshire 21 25 31 39 35 35 Midlands 24 28 33 38 39 40 East Midlands 24 27 31 38 38 37 South Wales 22 25 31 38 34 33 South West 27 31 34 41 45 45 London 27 30 36 39 33 36 South East 27 31 35 40 45 46 East Anglia 25 28 33 38 42 43 South Scotland 14 18 22 37 25 20 Merseyside and N Wales 23 26 35 40 40 36 North Scotland 9 13 20 35 37 34 Southern 28 32 36 38 42 43
Return on Regulatory Equity (RoRE)
2.21. We assess the overall financial performance of network companies using RoRE.
RoRE is calculated post-tax and its estimation includes the use of certain regulatory
assumptions, such as the assumed gearing ratio of the companies, to ensure
comparability across the sector. To eliminate phasing impacts over the course of the
price control, we use a mix of actual and forecast performance to calculate eight-year
average returns. These returns may not equal the actual returns seen by shareholders.
2.22. For the TIM component of RoRE, we have used our own assessment of eight-year
spend, based on information provided by the companies for the entire control period. We
have included the company forecast impact of the excluded services income “true-up”
which will occur at the end of RIIO-ET1, our Mid-Period Review decision and NGET’s
voluntary deferral. Tables A3.1, A3.2 and A3.3 in appendix 3 summarise the allowed
totex and expenditure values for each network company used in our calculation.
2.23. Our RoRE should be compared to the cost of equity allowed at the start of the price
control. For Electricity Transmission, the cost of equity was set at 7.0%.
2.24. Returns are predominately driven by all TOs forecasting underspends through the
TIM. A large portion of SHET’s and SPT’s return comes from the Transmission

14
Investment in Renewable Generation (TIRG) mechanism17, where specified projects were
incentivised at a higher pre-tax cost of capital, compared to current levels. All TOs have
also gained through the incentive mechanisms.
2.25. The RAV-weighted RoRE across the sector is 9.49%, see figure 2 below.
Figure 2: RAV-weighted RoRE across the ET sector
2.26. There are a number of factors which are not reflected in our RoRE calculations, but
which may impact the return realised by shareholders. We have not included the
potential end-of-period clawbacks for under delivery on Network Output Measures
(NOMs). The methodologies for these are still under development. Our RoRE analysis
also excludes companies’ actual debt costs relative to our regulatory assumptions,
innovation funding, legacy assumptions from prior control periods and un-funded
pension deficits. We may include some of these items in the future as we continue to
develop our RoRE methodology.
2.27. Finally, we apply an arithmetic mean to calculate our 8-year average RoRE, rather
than applying a geometric mean or weighted mean. While other averaging
methodologies may better represent a long-term investment in a single company, our
approach is consistent with how we informed our judgement on return on equity. For our
RIIO-ET1 cost of capital decisions, we used the Capital Asset Pricing Model (CAPM)
framework, which expresses the cost of capital as the amount needed to attract
investment from a diversified investor that invests every year. The arithmetic average
more accurately reflects this, and we are not considering a project return from a long-
term investment in one particular company.
17 Excluding TIRG Revenue reduces our assessment of NGET’s return to 9.26%, our assessment of SHET’s return to 9.85% and our assessment of SPT’s return to 9.79%.
Cost of Equity+IQI, 7.32%
Underspend against allowed Totex, 1.29%
Rewards from other incentives, 0.62%
Other, 0.26%
RoRE9.49%

15
3. Outputs, incentives and innovation
Chapter Summary
This chapter examines TO actual performance in meeting their output commitments over
the fourth year of the RIIO-ET1 period. This chapter also presents an overview of TOs’
expenditure in relation to the various innovation incentives.
Outputs and measures of performance
3.1. RIIO-ET1 was set as an outputs-based price control. On output delivery, our
assessment is against expectations set out in the licence and/or detailed in the Final
Proposals (FP) document, including:
targets which have associated rewards/penalty through incentives
targets (and associated allowances) which adjust automatically with changing needs
other expectations against which we hold TOs and SO to account.
3.2. The following seven outputs form the cornerstone of the RIIO price control
framework18:
i. safety
ii. reliability
iii. availability
iv. environmental
v. customer satisfaction
vi. timely connections
vii. connection works and wider works
3.3. In this chapter, we focus on those outputs which are financially incentivised through
rewards and/or penalties. We finish the chapter with an overview of TOs’ expenditure in
relation to the various innovation incentives over the RIIO-ET1 period.
3.4. Table 5 below provides an overview of output performance across all categories.
Where outputs have multiple metrics, we present some quantifiable measures for
illustration.
18 Further detail of the outputs framework in RIIO-ET1 is available on the Ofgem website in the link: RIIO-ET1: Final Proposals for NGGT and NGET – Outputs, incentives and innovation

16
Table 5: Outputs and measures of performance
White: no financial incentive
Green: on target / ahead of target
Orange: partially missing target
Red: substantially missing target
Output requirement RIIO measure TO’s Performance
i Safety
Comply with Health & Safety Executive (HSE) law
To meet all safety legislation requirements.
All met
ii Reliability
Minimise how much electricity is lost to our customers because of failures of the assets on the network
Work is ongoing to develop the NOMs common methodology.
Targets19 NGET: less than 316 MWh
SPT: less than 225 MWh SHET: less than 120 MWh
On target
iii Availability
Implement the Network Access Policy20 Implement and maintain policy. All met
iv Environmental benefits
Minimise SF6 greenhouse gas emissions Reward/penalty based on the non-traded
carbon price for carbon equivalent emissions.
Limits NGET: 12,241.5 tCO2e
SPT: 707.4 tCO2e SHET: 252.5 tCO2e21
SPT & NGET: below limits.
SHET: exceeded the limit by 0.1%.22
Environmental Discretionary Reward (EDR)
Annual funding of up to £4m will be available in each scheme year.
Performance band:
SPT: Leadership NGET: Proactive SHET: Proactive
Financial reward
SPT: £4 million NGET: None SHET: None
Publish annual progress on Business Carbon Footprint23 and Transmission Losses
No financial incentive
All met
v Customer satisfaction
Customer Satisfaction Survey (NGET only) and Stakeholder Satisfaction Survey
Targets
NGET Customer 6.9/10 NGET Stakeholder 7.4/10 SPT Stakeholder 7.4/10 SHET Stakeholder 7.4/10
Score out of 10
NGET: 7.41 NGET: 7.66 SPT: 7.9 SHET: 8.7
Stakeholder engagement discretionary reward
Neutral point at 4.0/10; higher
scores reflect positively on the licensees engagement strategy.
Score out of 10
NGET: 7.0 SPT: 6.25 SHET: 5.4
19 These target values are applicable in each of the eight years of RIIO-ET1. 20 In June 2015 the Authority approved a single common NAP for Scotland, applicable to both SPT and SHE Transmission, and a separate NAP for England and Wales, capturing NGET’s functions of SO and TO. 21 The target for SF6 leakage increases as the number of assets on the network using SF6 increases. 22 Although SHET has failed to reduce leakage rates to the pre-agreed annual limit, the reduction is a marked improvement on the previous year performance (exceeded limit by 22%). 23 Total BCF (tonnes per CO2 equivalent) in 2016-17: 2,384,362, Total BCF in 2015-16: 2,911,307 Total BCF in 2014-15: 3,151,539.

17
vi Timely connections
Send customer offers within 90 days The timely meeting of existing licence
requirements in relation to delivering new generation connections & local demand connections.
Financial incentives apply to Scottish TOs only; no direct
financial incentive on NGET as it is the contractual interface with all customers.
All new or modified offers provided to
customers within the 90 days.
vii Connection works
NGET (TO): Connection of new generation
Construction of new overhead line (OHL) to accommodate new customers
Baseline target: 33.7GW24
Current T1 forecast: 10.5GW
Baseline target: 215km OHL Current T1 forecast: 41km OHL
These measures are
subject to company specific volume driver mechanisms. Further detail is provided in the
appendices.
NGET (TO): Construction of new super
grid transformers (SGT) Construction of new OHL to accommodate
new customers.
Baseline target: 72 SGT
Current T1 forecast: 52 SGT
Baseline target: 27km OHL
Current T1 forecast: 5km OHL
NGET (TO): Incremental Wider Works (IWW) to strengthen specific boundaries
Baseline target of 23.05GW by the end of T1.
Current T1 forecast: 9.97GW
SPT: New generation connections (MW) Baseline threshold: 2503MW Current T1 forecast: 1634MW
SPT is currently expecting the mechanism to clawback revenue as
a result of missing the target.
SPT: New network capacity (MVa) Baseline threshold: 1073MVa Current T1 forecast: 3332MVa
SHET: New generation connections (MW) Baseline threshold: 1168MW Current T1 forecast: 1862MW
SHET: New network capacity (MVa) Baseline threshold: 1006MVa Current T1 forecast: 2518MVa
Timely delivery standards for Baseline
Wider Works (BWW) and Strategic Wider Works (SWW) BWW and SWW outputs specified in SpC 6I.
SPT: The Western HVDC undersea cable link is forecast to be delivered to a revised completion date. This is a joint venture with NGET. SHET: Of the three approved SWW
projects, two have been delivered ahead of schedule. The third, Caithness Moray, is on schedule to complete in 2018. NGET (TO): All BWW projects have
been delivered, except for WHVDC.
Three SWW projects are currently forecast to incur cost over the RIIO-ET1 period.25
Further detail is provided in the appendices.
24 There has been a 23.2GW reduction against the baseline set by Ofgem, which was based on an energy outlook premised on the 2012 Gone Green scenario. 25 The connection of the planned Hinkley Point C nuclear power station, the North West Coast Connnection at Moorside and Horizon nuclear at Wylfa.

18
Incentives
3.5. Table 6 below summarises the indicative revenue rewards and penalties
accumulated to date over the first four years of RIIO-ET1 for the output incentive
mechanisms with an associated annual revenue reward or penalty. There is a two year
lag between a TO incurring a reward or penalty and the adjustment to its allowed
revenue.
Table 6: Output incentive mechanisms – indicative cumulative revenue rewards and penalties for 2013-1726
Cumulative reward or penalty
(£m, 2016/17 prices) NGET SHET SPT Total
Total all mechanisms 74.4 13.6 29.5 117.4
3.6. So far, based on current indicative information taken from our price control model,
the TOs have earned £117m of incentive payments for exceeding targets during the first
four years of the control period.
Innovation
3.7. The RIIO innovation mechanisms encourage TOs to make innovation central to the
transition to a low carbon economy.27
Network Innovation Allowance (NIA)
3.8. The NIA was established as part of the RIIO-ET1 price control. It is designed to fund
smaller scale research, development and demonstration projects. The NIA provides each
licensee with an allowance to spend on innovation projects in line with the NIA
Governance Document.28 This year all licensees have registered further NIA projects.
Details on all the registered NIA projects can be found by following the footnote link.29
26 Figures are based on indicative estimates derived from our price control model and there will be differences with the values reported via the annual revenue returns provided by each company. 27 Changes to the NIA and NIC governance arrangements will be applied next year https://www.ofgem.gov.uk/publications-and-updates/network-innovation-review-our-policy-decision 28The NIA Governance Document can be found here: https://www.ofgem.gov.uk/publications-and-updates/version-30-network-innovation-allowance-governance-documents 29 http://www.smarternetworks.org/

19
Table 7 – Company activity under the NIA
Actual allowance claimed for the year
(£m, nominal prices)
Company
Total number of projects since
2013 13-14 14-15 15-16
16-17
NGET30
173 6.1 9.1 8.8 6.1
SPT31
36 0.6 0.7 0.8 1.1
SHET32
2733 1.2 1.3 1.1 1.2
Network Innovation Competition (NIC)
3.9. The NIC is an annual competition open to both electricity transmission and
distribution companies. It provides funding to a small number of large-scale innovation
projects. If successful, these projects should bring a wide variety of financial and
environmental benefits.
3.10. In 2016, two electricity transmission projects were selected by us to receive a total
of £23.6 million of funding. Further information on these projects is in our funding
brochure34 and the companies’ full submissions published on our website35.
Table 8 –Projects selected for funding in the 2015 NIC
Project Title Lead company NIC funding awarded (£m)
Total project costs (£m)*
Project end date
TDI 2.0 NGET 8.0 9.6 2019
Phoenix SPT 15.6 19.9 2021
*Includes other contributions e.g. from project partners or the network company shareholders.
Innovation Rollout Mechanism (IRM)
3.11. The purpose of the IRM is to facilitate the rollout of proven innovations, which will
provide long-term value for money to consumers, in advance of the next price control
period. To qualify, rollouts must deliver carbon and/or environmental benefits and must
not provide a commercial return for the licensee within the price control period. The next
window for transmission licensees to apply for IRM funding opens in May 2018.
30 NGET’s Annual Summary of NIA Activity is available here 31 SPT’s Annual Summary of NIA Activity is available here 32 SHE Transmission’s Annual Summary of NIA Activity is available here 33 SHE Transmission do not have a cap on their annual NIA allowance – they have a cap on their allowance for the whole price control period. Their spending against the cap will be reviewed by us at the end of T1. 34 https://www.ofgem.gov.uk/publications-and-updates/2016-network-innovation-competitions-brochure 35 https://www.ofgem.gov.uk/network-regulation-riio-model/network-innovation/electricity-network-innovation-competition

20
4. Eight-year totex performance drivers
Chapter summary
This chapter compares the TOs’ forecast totex for the whole price control with the TOs’
current view of the adjusted totex allowance. It also outlines our views on what is
responsible for driving the current forecast of totex for each TO across RIIO-ET1.
Introduction
4.1. This chapter considers the TOs’ forecasts of total expenditure across the eight-year
control period, against the TOs’ current view of adjusted totex allowance. Further details
on the main components of totex: load related capital expenditure (LRE) and non-load
related capital expenditure (NLRE), non-operational capital expenditure and operating
costs (opex) can be found in the appendices to this document.
4.2. The TOs have revised their forecasts of allowances to reflect their own view of the
operation of uncertainty mechanisms, the current levels of outputs and their current
forecast of future outputs in the remaining RIIO-ET1 period.36
4.3. The totex values summarised in this chapter are not adjusted for the current
forecast “true up” of allowances37, to remove the gap between the allowance for
excluded services income and the associated costs. The figures in this chapter are
adjusted to reflect the impact of the Mid-Period Review (MPR) decision and the reported
value of the voluntary deferral by National Grid (unless stated otherwise).38
4.4. We conclude the chapter with a summary of our high-level analysis of the drivers of
the differential between the TOs’ forecast total expenditure and their allowances.
RIIO-ET1
4.5. TOs are incentivised to outperform the RIIO-ET1 allowances as they retain a share
of any underspend. However, the scale of underspend is currently higher than
anticipated.
36 TO adjustments, reflect changing circumstances. For example, downward adjustments may reflect a current view that certain outputs are no longer required or the licence target will not be met in the eight-year period. 37 The original business plan included forecasts of the contributions expected to be received from customers with connections to single users. The net expenditure for these connections is funded directly by the customer and any income received by the TO is not treated as part of the allowed revenue permitted to be recovered through network charges. Final Proposals clarified that the position would be “trued up” at the end of RIIO-ET1. This will reflect the removal of actual income from total allowed revenue, and the expectation that the monies received by TOs through customer contributions will be paid back. For the avoidance of doubt, the approach applied in our assessment is a snapshot based on current information, the parameters of the actual “true up” to be applied is the subject of ongoing discussion between Ofgem and the network companies. 38 For the avoidance of doubt, the values do not reflect SSEN’s recent announcement. http://sse.com/media/485986/SSE-Interims-17_18.pdf
21
4.6. Based on the information provided to us through the 2016-17 regulatory reporting
pack the TOs currently expect to receive £17.5 billion over the entire RIIO-ET1 period.
This represents actual totex for 2013-17 plus a four-year forecast spend for 2017-21.
4.7. All TOs currently anticipate an underspend across the price control period (ranging
between 4% and 12%). The combined value of total expenditure for the TOs across the
period is currently forecast to be £15.8 billion; a cumulative forecast underspend of 10%
(£1.7 billion). The variance between the TO’s current view of costs and allowance across
the entire RIIO-ET1 period is due to the following factors.
The impact of National Grid’s voluntary deferral and the MPR decision, reducing
the size of the eight-year totex allowance relative to position reported in 2015-16.
On the load-related (LR) side, as we move deeper into the T1 period, the range of
volume driver mechanisms take effect by automatically flexing allowances to
reflect the level of outputs required.39
Also on the LR side, changes in the portfolio of investment relative to the original
baseline plan and the TOs’ response to the level of change is an important driver
of costs being less than forecast allowance. In the majority of cases, the actual
unit cost currently delivering outputs in the RIIO-ET1 period is seen to be lower
than the unit cost adjustment for delivering an additional unit of the relevant
output. Lower costs (below UCA) are mainly driven by reductions in the size of
the connection, delays to projects beyond the end of the eight-year period, or
where sufficient capacity or space at existing site exists. Based on current
information, all TO’s are expecting LR spend across RIIO-ET1 to be lower than the
forecast level of adjusted allowances which were set on the basis of the portfolio
of projects in the original business plans.
On the non-load related (NLR) side, there has been considerable change in the
timing, working practices and internal processes to monitor, maintain and replace
existing assets applied by some companies. Much of this has been caused by their
understanding of asset condition levels (relative to the business plan stage) and
changes in external circumstances.
o For NGET TO, revised understanding of asset conditioning has driven some
of the forecast reductions in spend. Other drivers of the forecast reduction
include some work being deferred (eg. some tunnel projects), the
extension of asset lives40 and a more targeted asset replacement
approach41.
39 For example, SPT is currently expecting to fall short of its new generation connection originally anticipated (2,503MW) and currently expects the mechanism to ‘claw back’ allowance. In some instances, funding can also be triggered by events defined in the licence. 40 For example, NGET reports some OHL conductor lives that could safely be extended. 41 For example, NGET TO’s has redesigned its refurbishment techniques to identify and replace parts that become obsolete whilst bay infrastructure and complex plant wiring is retained.

22
o For SHET the opposite holds true: revised understanding of asset
conditioning has triggered additional requirements due to asset condition
being worse than expected. As a result, SHET currently forecasts a
cumulative overspend against allowance of c.£100 million across RIIO-
ET1.
o For SPT, asset condition re-assessment is not a primary driver for
expected cost reductions. The main reason for lower costs in delivery of
non-load projects is the change to SPT’s working practices associated with
the procurement and management of capital delivery.
4.8. Table 9 summarises the current forecast performance position of each TO across the
entire price control period. For comparison, the table provides our own assessment of
the performance position. More detail on our assessment is available in the appendices.
Table 9: Totex expenditure vs adjusted allowed totex (£m)
2016-17 prices
Current RIIO-ET1 company forecast totex view (company adjustments applied) †
Our RIIO-ET1 forecast totex view (pre true-up)42
Allowance Expenditure Difference Allowance Expenditure Difference
£m % £m %
NGET (TO) 12,119 10,684 -1,435 -12% 10,982 9,744 -1,238 -11%
SPT 2,177 2,095 -82 -4% 2,176 2,091 -85 -4%
SHET 3,225 3,044 -181 -6% 3,155 2,977 -178 -6%
Total 17,520 15,823 -1,698 -10% 16,313 14,812 -1,501 -9%
† The figures are based upon the TOs’ published values. Actual Totex here has not been modified by underspend/overspend TIR.
4.9. We have focussed our analysis on working towards understanding drivers of
forecast underspend and whether we consider them to be attributable to the following
three factors:
Efficiency: reflecting genuine improvements in how things are being done,
resulting from eg innovation and more efficient working practices.
External factors: windfall gains or losses achieved by external factors outside of
the control of network companies.
Provision in the price control settlement: assumptions made within the RIIO-
ET1 settlement that have varied against the actual position.
42 Totex values deduct the TOs’ current forecasts of costs and allowances we deem to be uncertain, including construction costs associated with the development of unapproved SWW projects and the licence term TPWW (NGET only). Totex values are not adjusted for our current forecast true-up but do include the impact of the MPR decision and voluntary deferral by National Grid.

23
4.10. We have been engaging with the TOs to understand their view of key cost drivers.
Our views in the next section are based on our discussions with the TOs, and our current
view on information submitted by them.
Input price changes (or Real Price Effects)
4.11. As previously highlighted, all TOs are forecasting an underspend over the eight
year RIIO-ET1 period against their view of allowed Totex. The TOs highlighted
operational and delivery improvements and technical innovation leading to cost savings.
Changes in input prices are also a driver for some of the underspend.
4.12. In our Final Proposals (FPs) we acknowledged that several key inputs (labour,
material equipment/plant) do not necessarily change in line with RPI and will not match
main components of network companies’ costs. To account for this differential between
the economy-wide RPI inflation index and inflation on inputs, we provided an ex-ante
allowance based on the Real Price Effects (RPEs) forecast.
4.13. The RPE values were different for each TO. It was then left to the network
companies to manage any actual above inflation input price fluctuations. At this point in
the RIIO-ET1 control period, the level of inflation has been below the level of the
historical indices used when setting the ex-ante allowance. The current forecast view is
that in total the RPE’s will not reach the levels that were forecast in any of the TO’s
business plans, or in Ofgem’s own forecast at the FP stage.
4.14. Based on current information, we estimate that TOs have benefitted from slower
than expected growth in input prices by c. £800 million43 (the counterfactual is full
indexation of RPEs). We place this under the drivers of “external factors” due to lower
than expected inflation.
TO performance insights
4.15. In this section we outline some of the key cost drivers outlined by each of the TOs.
SHET
4.16. SHET is currently forecasting to spend just over £3 billion by the end of RIIO-ET1.
This represents 94% of forecast totex allowances. This totex underspend (c.£180
million) is driven by savings in load-related expenditure (LRE) which outweighs the
expected overspend in both non-load related expenditure (NLRE) and non-operational
capex across the RIIO-ET1 period.
43 This calculation is the cumulative difference between the level of ex ante allowance in the FPs and the level of allowance that would be established if we were to base this on the TO’s updated view of RPEs (a ‘perfect hindsight’ approach); c.£480m for NGET, c.£110m for SPT and c.£210m for SHET. This analysis takes no account of the contracting strategies applied by each TO or the impact of internal efficiency measures.

24
4.17. Controllable opex spend is currently expected to be on a par with the forecast
allowance across RIIO-ET1.
4.18. LRE is currently forecast to be c.£300 million lower than forecast allowance.
Approximately half of this underspend is directly related to expenditure on the SWW
projects (capex lower than allowance by c.£140 million). This is due to phasing and
project delivery efficiency savings realised on the Beauly-Mossford and Kintyre-
Hunterston projects and anticipated savings on the ongoing Caithness Moray project.
The remaining forecast LRE underspend is primarily delays in and/or cancellations to a
number of connections and the associated reinforcement works.
4.19. On the non-load side of the business, SHET is forecasting an overspend against
allowance of c.£100 million across the RIIO-ET1 period. The main reason for this
overspend is that SHET now have better information on asset condition, particularly in
relation to some large OHL schemes. These schemes now require major upgrades or
complete rebuild in contrast to the scope of requirements set out in the business plan
(which envisaged a simple like-for-like conductor replacement). Non-load investment has
also been impacted by the delays and cancellations in the LR programme.
SPT
4.20. SPT is currently forecasting to spend close to £2.1 billion by the end of RIIO-ET1.
This represents 96% of forecast totex allowances. This totex underspend (c.£80 million)
is driven by savings in both LRE and NLRE which outweigh the expected overspend in
controllable opex across the RIIO-ET1 period.
4.21. SPT currently expects expenditure on LR activities across RIIO-ET1 to be lower
than forecast allowance by c.£60 million. This is attributable to several factors including
those beyond SPT’s control (ie. changes in customer-driven circumstance) and the
impact on the associated infrastructure works required to facilitate increases and
changes in demand and generation. This underspend also reflects the impact of the MPR
decision which confirmed that a subset of works currently being progressed by SPT to
deliver connection solutions is not suitable for funding through the pre-agreed
mechanism.44
4.22. An important driver of net forecast underspend on the load side of the business is
SPT’s approach to the management of its capital delivery process. SPT has moved away
from a ‘turnkey’ approach towards greater use of ‘in-house’ design and capital delivery
management expertise. This has led to engagement with a broader base of contractors
and a more competitive procurement process. This ‘disaggregated’ model is estimated
by SPT to account for approximately half of the potential savings on the LR side.
44 More information on this can be found in the MPR decision document.

25
4.23. A key example highlighting the positive impact of its approach to design and
tendering of the works is the Series and Shunt Compensation project45. SPT reports that
its approach enabled the procurement of a solution which required the installation of
equipment at fewer sites and enabled it to deliver the required output at a lower cost
(c.£43m, or 42%, below allowance).
4.24. On the non-load side of the business, SPT is forecasting an underspend of about
10% (c.£80 million). This underspend is reported by SPT to primarily be the result of a
disaggregated investment model and the timing of supplier engagement (after our
decision to fast-track) in the case of its overhead line (OHL) modernisation work.
4.25. A secondary driver impacting non-load investment is the level of customer-driven
changes to its load-related programme, which are driving consequential changes in the
assets requiring replacement through non-load work programmes. There are two factors
that contribute to this aspect of non-load investment.
The scope of work has changed. In some cases, SPT’s asset condition
assessment has highlighted that the replacement of some conductors can be
deferred, reducing the scope of replacement works.
Decisions to re-profile investment driven by the evolving picture of
generation connections and the ongoing challenges associated with obtaining the
necessary consents.
NGET (TO)
4.26. NGET TO is currently forecasting to spend £10.7 billion by the end of RIIO-ET1.
This represents 88% of forecast totex allowances. This totex underspend (c.£1.4 billion,
or 12%) is driven by savings across LRE, NLRE and controllable opex across the RIIO-
ET1 period. These figures include the impact of the MPR decision and the reported value
of the voluntary deferral by National Grid.46
4.27. NGET estimates that LRE is lower than forecast allowance by c.£280 million. This
cost reduction is due to several factors, summarised below.
New connection projects which have a unit cost lower than the level to which the
mechanism was originally calibrated.
Refinements to reduce the scope of works to facilitate transmission connections.
An example is the Kings Lynn B connection where an optimised substation design
45 Boundary B6 is the boundary between SPT in southern Scotland and the NGET system in the north of England. The reinforcement of the boundary is being realised by the completion of two complimentary projects: (a) Series and Shunt Compensation; and (b) East-West 400kV Upgrade. 46 Excluding the value of the voluntary deferral from NGET’s forecast allowance from our analysis (ie. not deducting c£590m from the forecast eight-year allowance value) increases the level of totex underspend to c.£2billion, or 16%, against the adjusted allowance across RIIO-ET1.

26
avoided expenditure on additional bays and circuit breakers (estimated £25m
savings).
The change in the number and location of connections have led the energy
background to evolve in a different way to that originally anticipated. In some
cases, this has led to an increase to the boundary capacity provided by
investments, the majority of which were not included in the design of the RIIO-
ET1 arrangements. For example, the Fleet-Lovedean reconductoring project was
not included in the baseline because it required other reinforcements to be
undertaken first. However, higher than expected levels of new interconnectors
and generation has changed this. This work provides 1780MW for a cost of £38m.
Targeting of critical elements of capital projects to provide an uplift in
transmission capability more quickly. For example, NGET progressed one element
of the proposed Eastern HVDC link in its own right - a ‘turn-in’ at Hawthorn Pit -
to provide 1650MW boundary capacity and a saving of c. £130m.
4.28. On the non-load side of the business, NGET explains that the level of underspend
(£1.1 billion47) is the direct result of developments in its intervention and asset condition
strategies. The range of factors driving this cost reduction include the following.
Revised understanding of asset condition through introducing developments
in IT and internal asset management processes. For example, NGET explains that
it now better understands the deterioration of its transformers, and subsequent
refinements to the replacement plan, coupled with a bulk procurement strategy,
drive an estimated c.£260 million of efficiencies.
Changing asset intervention plans. An example is in the area of protection
equipment. NGET describes an approach, in which it targets replacement of
higher-risk, life-expired components (eg fault detection relays), while retaining
lower risk, reliable infrastructure (eg fixed wiring). NGET estimates that such
strategies will deliver c.£170 million of savings compared to forecast allowances.
Delivering work in different ways that are significantly different to the
working practice and processes underpinning the original business plan.
This area involves targeted efforts to reduce the scope of delivery and methods of
working to reduce time and cost (ie minimise outages). An example is NGET’s
targeted bay replacement approach. NGET estimates that, in this example, a
saving of c.£80 million has been achieved by moving away from the “traditional”
approach (replacement of the entire bay including the switchgear). This and other
similar strategies are estimated to reduce costs - due to material reductions in
the scope of work envisaged in the original settlement - by over £200 million
across the RIIO-ET1 period.
47 £1.5 billion pre-voluntary deferral.

27
5. SO Performance
Chapter summary
This chapter evaluates RIIO-ET1 forecast expenditure for NGET in its role as SO against
the costs allowed to deliver the associated outputs across the eight-year RIIO-T1 period.
Introduction
5.1. NGET is the designated electricity System Operator (SO) responsible for day-to-day
system operation, including balancing supply and demand and constraint management.
To do this, NGET buys and sells electricity and procures associated services. The costs
NGET incur are recovered from users of the system via Balancing Services Use of System
charges.
5.2. There are various costs that NGET incurs as SO, which it recovers as revenue. The
RIIO-ET1 price control for NGET SO includes allowances for capex (primarily related to
investment in IT systems) and opex (covering the ongoing costs of running the business,
including support for IT systems).
5.3. All SO cost allowances for system balancing are determined via a separate process
outside the RIIO-ET1 mechanism. The main incentive is the Balancing Services Incentive
Scheme, which incentivises NGET (SO) to take action to operate the GB electricity
transmission system.
Forecast totex performance
5.4. The figure below shows NGET SO’s current totex forecast over the course of the
RIIO-ET1 price control period against its adjusted totex allowances.
Figure 3: Actual and forecast expenditure vs SO forecast allowance

28
5.5. NGET SO is currently forecasting to spend close to £1.29 billion by the end of RIIO-
ET1. This represents 96% of forecast totex allowances (£1.33 billion). The totex
underspend (£47 million) is primarily driven by savings in controllable opex across the
RIIO-ET1 period.
5.6. NGET SO forecast allowances include the provision resulting from the MPR (£21
million). It also includes forecast allowances in relation to incremental costs associated
with data centres and cyber security48, the SO Legal Separation Programme (LSP)49 and
Future of the SO (FRSO). The allowance categorisation applied by NGET SO for the LSP
and FRSO work is summarised in the table below.
Table 10: Categorisation of additional allowance
£m, 16-17 prices Forecast allowance RIIO-ET1
TOTAL LSP FRSO
Non-operational capex 15 12 27
Opex 43 n/a 43
TOTAL 58 12 70
5.7. The SO has two major cost categories: non-operational capex and controllable opex.
5.8. NGET SO has forecast controllable opex spend of c.£880 million for the eight years,
which is c.£40 million lower (5%) than adjusted allowances across the price control
period. NGET SO reports that the main reason for this underspend is lower information
system (IS) support costs and fewer IS projects going ahead than forecast at the
business plan stage. This decrease in eight-year expenditure is partially offset by
additional spend associated with establishing the future role of the SO and legal
separation of the SO not foreseen at the start of RIIO-ET1.
5.9. The total opex forecast includes spend of c.£50m over the next four years on the
LSP. This incorporates a one-off opex cost up to 2019 associated with implementing the
separation of c.£35 million and two years of enduring incremental costs for the
remainder of the RIIO-ET1 period. These costs were not forecast in the previous years’
RRP submissions. We note that NGET is of the view that the IS implications of separation
can be achieved through re-configuration of the existing systems (with additional
controls to ensure appropriate access), rather than the implementation of new or
duplicate systems.
5.10. An additional £12 million of cost is forecast to be incurred in relation to underlying
controllable opex. The main driver for this is an increase in direct opex costs of
48 National grid has signalled that a submission will be made within the May 2018 re-opener window. This is
dependent on the finalisation of the BEIS mandate under Special Condition 7D. 49 This is work to legally separate the Electricity SO and TO businesses of National Grid. This program is considering how the new SO entity will operate within the group structure (eg. deliver sufficient property separation and changes to NGs’ Enterprise Resource Planning system), as well as detailed planning for all industry changes to codes and licences.

29
approximately £2 million per annum due to additional cost pressures eg. additional
resourcing.
5.11. NGET SO is currently forecasting to underspend by £5 million (1%) against its
non-operational capex allowances of £415 million across the RIIO-ET1 period. This
forecast is higher than the previous forecast due to the inclusion of additional forecast
costs associated with LSP and higher expected costs for the data centre project and the
emerging cyber security threat.
5.12. The drivers of capital expenditure across the RIIO-ET1 period are targeted at
maintaining and improving the security and resilience of the network. The key
investments include the following.
The replacement for the Critical National Infrastructure Balancing
Mechanism system. This is intended to improve power system security by
introducing modern hardware to a resilient design and software that will improve
economic optimisation of the scheduling and despatch processes. As noted above,
NGET SO currently anticipates incurring costs of c.£70 million across RIIO-ET1.
We note that the project has taken longer to complete than originally planned and
we will continue to monitor progress and costs in this area.
The development of an improved integrated electricity management
system. A more flexible and integrated system to meet the evolving
requirements of a larger and more complex network. The new iEMS is currently
undergoing the final stages of testing with the expectation that the programme
will close in 2017/18. NGET currently anticipates incurring costs of c.£35 million
across RIIO-ET1.

30
Appendices
Index
Appendix Name of Appendix Page Number
1 SHET & SPT view of totex (company view) 31
2 NGET TO view of totex (company view) 48
3 Ofgem assessment of NGET TO totex (post
true up) 58

31
Appendix 1: SHET & SPT view of totex (company view)
A1.1. In their Original Business Plan (OBP), SHET and SPT presented a ‘best view’
position of all the costs they expected to incur in continuing to look after assets and the
impact of plans to grow the network to accommodate new customers between April 2013
and March 2022.
A1.2. We decided to ‘fast track’ both Scottish TOs. This meant that we set their ex-ante
allowances on the basis of their business plan, including their view of real price effect’s
(RPEs).
A1.3. The ‘best view’ position was not fully funded with ex-ante allowances as part of the
RIIO-ET1 settlement. Instead, we included a combination of ex-ante allowances and
allowances that would be released through “uncertainty mechanisms” (UMs). The agreed
UMs automatically increase the level of allowance to cover additional costs incurred or
flex downward in response to lower volumes below an agreed threshold. The parameters
of such mechanisms were agreed upfront.
A1.4. The ‘automatic’ UM approach was not suitable to all aspects of the OBP; there was
significant uncertainty associated with some large-scale investment projects. To deal
with these in RIIO-ET1, we put in place the Strategic Wider Works (SWW) process for
the approval of future major investments that we had decided not to fund up-front and
which where not captured by the volume drivers. The SWW process allows us to consider
the need for and the funding of these projects during the price control period, so that
delivery of these outputs can be brought forward in a timely manner.50
A1.5. The table below illustrates how SPT and SHET’s current view of the totex allowance
position across the eight-year RIIO-ET1 period has evolved. This includes forecasts of
performance for the remainder of the price control (2017-18 to 2020-21) based on their
expectations of the adjustments to volume driver allowances and expenditure.
A1.6. There are broadly four types of allowed expenditure category:
Load-related: investment on the network to accommodate changes in the level
or pattern of electricity generation and demand.
Non-Load related: mainly capital investment on replacement and prevention
maintenance (refurbishment) to keep assets in good condition, but also other
50 To date, only SHET has been granted approval for project funding under the SWW mechanism. Three projects have received funding; Beauly Mossford, Kintyre Hunterston and Caithness Moray.

32
capital expenditure directly related to maintaining a reliable network, such as
investments to improve flood defences.
Non-operational capex: expenditure on equipment not directly related to
transmission operations, for example, IT capital expenditure.
Controllable operational costs (opex): this is day-to-day spending on
activities required to maintain and operate the transmission networks.
Table A1.1: Current view of T1 allowed totex51: SPT & SHET
£m 2009-10 Prices
Cost category SHET SPT
Load related Current forecast of T1 allowances 2,161† 952††
Non-load related Current forecast of T1 allowances 259††† 656
Non-op capex Current forecast of T1 allowances 7 7
Opex Current forecast of T1 allowances 198 157
T1 TOTEX TOTAL (forecast) 2625 1,772
† This figure includes the value of capital contributions assumed at settlement and forecast compensation for wayleaves; it does not include the impact of the “true up” and Related Party Margins. †† This figure includes the value of capital contributions assumed at settlement; it does not include the impact of the “true up” and Related Party Margins. ††† includes VISTA.
Load related expenditure
A1.7. The current forecast of LRE across the eight-year price control period for SPT and
SHET is summarised in tables A1.2 & A1.3 below. Alongside SWW, there are a further
six main categories of load related expenditure applicable to SHET.
Local enabling entry/exit sole use (excluded services). This includes
expenditure on assets that are covered by connection charges. The net
expenditure for these connections (deducting any customer contributions) is
funded directly by the customer over the life of the asset52.
Local enabling shared use infrastructure: expenditure triggered by individual
projects (generation or demand) that provides assets or reinforcements that are
shared by several users of the transmission network (MVa).
Local enabling sole use infrastructure. This is expenditure triggered because
of generation/load growth. It includes expenditure on assets that connect a single
user to the transmission network (MW).
51 Values include RPEs but exclude the value of approved projects under the Transmission Investment Incentive (TII) or Transmission Investment for Renewable Generation (TIRG) mechanisms. 52 The connection charging methodology allows users to pay upfront capital contributions as well as annual charges for their connection over the lifetime of the asset. SHET’s OBP did not consider the upfront contribution method of payment (ie assumed a zero value for potential customer contributions in this area).

33
OFTO and Shetland connections: expenditure associated with facilitating the
connection of potential offshore transmission projects to the onshore network and
the proposed construction of an undersea link to Shetland.
Wider Works: transmission reinforcement works (not local enabling works)
associated with reinforcing the integrated network.
Table A1.2: SHET’s current view of T1 LRE vs allowance (pre true-up)
£m 2009-10 Prices
Cost Pre true-up Allowed Totex
Expenditure Performance
“Excluded services” (LR1 & LR2)
Costs 119
Customer contributions53 -31
Current forecast 229 88
Sole use (LR5 & LR6) Current forecast 308 320
Shared use (LR7 & LR8)
Current forecast
242 310
Ex ante (LR3) Current forecast 7 12
OFTO (LR3) Current forecast 31 20
Shetland Current forecast 31 754
Other capital contributions -34
Baseline Wider
Works & pre
construction (LR13)
Current forecast
Customer contributions
139
-2
Current forecast 151 137
SWW (LR18) Current forecast 1155 104255
TSS (LR22) 56 Current forecast 2 2
Wayleaves Current forecast 6 6
Other Current forecast 0 3
Published RRP values (small rounding differences may exist)
2,161 1,911 -250 (12%)
A1.8. The reporting template is identical for both SPT and SHET, but differences apply in
the reporting categorisation applicable to specific network reinforcement works. As a
result, SPT is currently reporting no expenditure under categories LR3 or LR11 but is
instead reporting expenditure under LR13 (six schemes to increase the transfer
53 Relates to “customer choice” design under the network – for example, developers who have opted for an underground cable option rather than a cheaper OHL solution. As such, developers fund this differential. The cost of this solution is included with SHET’s infrastructure forecast but is ultimately offset by this income so that the wider GB users do not get impacted by this cost. 54 The OBP included an allowance (£30m) for a demand scheme on Shetland that has since terminated. Expenditure in this category relates to three reactor investments on the mainland. 55 This relates to the capex element only. 56 Investment on the network driven by the SO entitled “Transmission System Support”.

34
capability across the B6 boundary) and LR15 (progress on specific Grid Supply Point
reinforcement projects).
Table A1.3: SPT’s current view of T1 LRE vs allowance (pre true–up)
† Series and shunt compensation works on the B6 boundary; these costs are excluded from LR21.
A1.9. The next sections provide further summary detail on performance under each cost
category.
Transmission connection assets
A1.10. Both Scottish TOs are forecasting incurring costs attributable to the connection of
new generation and demand users below the forecast level of allowance. This takes into
account income received from customers choosing to pay upfront capital contributions
(rather than as revenue).
A1.11. The differential is primarily due to the reduction in the number of schemes
anticipated to progress to connection. SHET report that around two thirds of OBP
schemes have not progressed during the RIIO-ET1 period. Reasons include customer
termination, deferrals to RIIO-ET2 and decisions to connect at a lower voltage. For
projects that have been delivered to date, the companies indicate that refinements in
scope and construction (reducing the footprint of the project) and improvements in
contracting strategies, in some instances, have delivered the project for lower costs than
57 This relates to costs incurred in relation to pre-construction works. 58 Differences in expenditure are related to the treatment of Innovation Roll Out Mechanism costs.
£m 2009-10 Prices
Cost Pre True-up
Allowed Totex Expenditure Performance
Connection (LR1 & LR2)
Costs
100
Customer contributions -45
Current forecast 50 54
Sole use (LR9 & LR10)
Costs 67
Customer contributions -12
Current forecast 33 55
Shared use (LR11 & LR12) Current forecast 258 277
GSP reinforcement (LR13) Current forecast
57
45
MSCDN (LR15)† Current forecast 15 7
SWW (LR20)57 Current forecast 22 20
BWW (LR21) Current forecast 513 428
TSS (LR22) Current forecast 1 2
Other 3 13
Published RRP values 58 (small rounding errors may exist)
952 901 -50 (5%)

35
forecast. While there may be instances where higher costs have been incurred (due to
delays) these do not outweigh the cost reductions.
Generation connection volume drivers
A1.12. There is a two stage approach to the funding of some load related elements; an
upfront allowance to deliver a specified threshold capacity based on the best estimate of
projects most certain to proceed at the time, augmented by a volume driver, designed to
flex the allowance in accordance with the actual outturn demand and consequential
system-wide requirements.
A1.13. Two mechanisms apply to the costs of connecting new electricity generation
sources (SpC 6F); the costs of connecting sole use assets (MW) and the costs of
associated infrastructure (network capacity, MVa).59 The sections below summarise the
current forecast position of SHET then SPT under each mechanism across RIIO-ET1.
SHET
A1.14. Under SHET’s baseline RIIO-ET1 package, it will seek to connect 1168MW of new
generation that includes sole-use infrastructure elements. The baseline package provided
an allowance of £98.8 million associated with the delivery of “typical” generation
connections that have a unit cost of less than £150k/MW. Delivery of capacity in excess
of the licence target (and ‘atypical’ connections with a unit cost greater than £150k/MW)
will trigger additional allowances via the volume driver mechanism.
A1.15. The baseline package also provided SHET with a level of funding for the
construction of shared-use infrastructure (£83 million) associated with the delivery of
‘typical’ schemes which have a unit cost of less than £83k/MW. Delivery of capacity in
excess of the licence target (and ‘atypical’ connections with a unit cost greater than
£183k/MW) will trigger additional allowances via the volume driver mechanism.
A1.16. In terms of the sole use mechanism, SHET currently forecasts underspending by
£37 million60 the current estimate of allowance it expects to receive across RIIO-ET1.
A1.17. Overall expenditure under the shared use infrastructure mechanism is currently
forecast to be £254 million65. This forecast level of expenditure is £43 million (15%)
59 “Sole Use‟ distinguishes between assets, which are for the use of a single customer (covered by transmission connection charges) and from assets, which are shared by other users of the transmission network (covered by transmission network use of system charges). 60 Taking into account of the value of customer contributions and excluding expenditure on schemes where the output is anticipated to be delivered in T2.

36
below the funding SHET expects to receive across RIIO-ET1 taking into account the
current estimate of customer contributions.
A1.18. The reasons for the differential is linked to the way that the parameters of the
automatic funding mechanism were initially set up. The ex ante allowance and unit costs
in each element of the volume driver mechanism were agreed as part of the settlement
based on the best information (on projects deemed most certain to proceed) available at
the time. The initial schemes were not funded explicitly, but rather were used as the
illustrative of the likely types of investment required during the period.
A1.19. The initial list of projects has changed. Currently, of the original 21 developments
identified in the sole-use mechanism, only six have proceeded (or are forecast to
proceed) to construction within T1. The remainder have terminated, delayed or
connected at lower voltage. In the shared use mechanism, of the eight schemes initially
making up the ‘basket’ of representative investment likely to proceed, only two remain.
One investment is now meeting the required outputs for both a load and non-load
business case. (Fort Augustus to Fort William is incorporating increased network capacity
to accommodate new renewable generation located across Moray). Another scheme has
been recategorised from shared use to sole use.
SPT
A1.20. Under SPT’s baseline RIIO-ET1 package it will seek to connect 2.5GW of new
generation that includes sole-use elements within the RIIO-ET1 period. A baseline
allowance of £93 million (including RPEs) was set to deliver this threshold target. A
volume driver applies to the costs of sole use generation connections delivered by SPT
during RIIO-ET1 in excess of the threshold.
A1.21. The baseline package also provided SPT with a level of funding for the
construction of new shared-use infrastructure for generation connection works. SPT’s
baseline package contains an output target to deliver 1073MVA of capacity. An allowance
of £147 million (including RPEs) was set to enable SPT to deliver this capacity. A volume
driver is applicable for the delivery of shared-use connections infrastructure that exceeds
the capacity threshold.
A1.22. SPT is currently expecting to connect 1.63GW of generation requiring sole-use
elements across RIIO-ET1, at a cost of £67 million. This is below the baseline target
level, so SPT anticipates a clawback of c.£53 million allowance through the operation of
the volume driver mechanism (on the basis that the output target was set on the final
year of the price control). As a result, SPT currently anticipates expenditure will be
greater than allowance by c.£27m.

37
A1.23. In terms of the shared use mechanism, SPT is currently forecasting expenditure
of £121m to deliver the target of 1073MVa; an underspend of £27 million against the
baseline allowance.
A1.24. Under the shared-use mechanism the differential is largely attributable to
changes to the initial list of projects as time has progressed. Currently, of the original
ten developments identified in the shared-use mechanism, nine have changed capacity
and the other scheme terminated. SPT currently anticipates that it will over-deliver on
shared-use infrastructure outputs (2259MVa above baseline) and expects expenditure to
exceed allowance by c.£45m.
Baseline wider works connections61
A1.25. Reinforcement works on the wider transmission system to accommodate existing
and future generation and demand as projected in the TOs’ business plans are known as
Baseline Wider Works (BWW) outputs. BWW outputs (and Incremental) are measured in
terms of the additional transfer capacity across system boundaries.62
A1.26. The electricity transmission licence sets out each reinforcement project, the
boundary it will affect and the amount of additional transmission transfer capability (MW)
agreed as part of the BWW output.
SHET
A1.27. SHET’s electricity transmission licence sets out two BWW reinforcement schemes
to provide additional boundary transfer capability in the north of Scotland. Both schemes
(Beauly Blackhillock Kintore and the Beauly – Mossford substation)63 were delivered in
line with licence requirements during 2015-16.
A1.28. Across RIIO-ET1, SHET reports totex expenditure of £59 million in the delivery of
the relevant BWW outputs. This is approximately £7 million below total allowance across
the price control (see table below).
Table A1.4: SHET BWW forecast
2016-17 prices Allowance Expenditure Performance
TOTAL 65 59 -7 Positive numbers in the performance column indicate overspend; negative numbers indicate underspend
61 These are set out in Special Condition 6I of each licence. 62 A system boundary splits the transmission network into two parts across which the capability to transfer electrical power can be assessed. For the avoidance of doubt, system boundaries are not network ownership boundaries and each TO’s network could contain multiple system boundaries. 63 The outputs associated with the Beauly-Dounreay and Beauly Mossford schemes were delivered in the previous price control and are not specified as a Baseline Wider Works scheme in special condition 6I. SHET reports the additional expenditure associated with each legacy scheme against LR13. The Beauly Mossford substation on its own does not provide a boundary increase, but is a sub component of b10 and is defined as a BWW project as it does provide further reinforcement to the wider system.

38
SPT
A1.29. SPT’s electricity transmission licence details five BWW reinforcement schemes in
the south of Scotland.
A1.30. SPT has delivered one BWW output through the energisation of the subsea cable
link between Hunterston and Kintyre. The delivery plan of the other BWW outputs has
been delayed due to uncertainty on timing of renewable generation and planning
considerations.
A1.31. SPT currently expects fully to deliver two BWW outputs: the East-West upgrade
(voltage uprating from 275kV to 400kV) and the Series and Shunt Compensation
projects (installation of series capacitor units) during T1. Of the remaining two BWW
schemes specified in SPT’s electricity transmission licence:
the Western HVDC link has a revised completion date of 2017-18 (delayed from
2016-17), and
voltage support at Kilmarnock-South (K-S) is not anticipated to be delivered.
SPT’s review of its network in that area has led it to substitute the baseline
output to install shunt reactive compensation equipment at several sites including
K-S (to be delivered in 2020).64
A1.32. Across RIIO-ET1, SPT currently anticipates a totex expenditure of £535 million in
the delivery of the relevant BWW outputs. This is approximately £87 million below SPT’s
current forecast of total allowance across the price control. This is summarised in the
table below.
Table A1.5: SPT BWW forecast
Scheme name £m, 2016-17 prices (excl RPEs)
Allowance
Expenditure
Performance Net position K-S project
only
Scottish series and shunt compensation
104 60 -43
East - West Upgrade 68 70 2
Western HVDC 407 356 -51
Hunterston Kintyre link 24 29 6
Kilmarnock South (not a ‘live’ project) 19 8 -11 0.3 Kilmarnock South Substitute 0 11 11
TOTAL 622 535 -87 Positive numbers in the performance column indicate overspend; negative numbers indicate underspend
64 Our MPR decision made the following statement “our decision is to consider the output delivered if SPT
manages voltage in a manner that delivers the greatest consumer value.”

39
A1.33. SPT explains that this expected level of outperformance (£87 million) is largely
the result of efficiencies in the programme of upgrade work – Series and Shunt
compensation projects and Western HVDC account for c.£94m of expected underspend.
A1.34. Alongside the specific BWW projects, SPT is incurring cost by installing shunt
compensation units (‘MSCDN’)65. The current forecast for these works is £8 million
across the eight-year period against an allowance of £18 million. SPT explains that all
savings have been achieved through the tendering and site management process.
A1.35. A final category in the area of ‘wider works’ includes the cost of pre-construction
works incurred in relation to specific non-baseline projects. These projects are identified
in special condition 3L of SPT’s electricity licence and have a corresponding total T1
allowance of £26 million. The current forecast expenditure in this category is £25 million.
Ex-ante infrastructure
SHET
A1.36. SHET’s baseline plan included the development of a single investment for new
demand on the island of Shetland. An allowance of £38 million was agreed at the start of
RIIO-ET1. The scheme has now been cancelled. SHET is currently reporting the costs
incurred in three new reactor schemes against this allowance. The overall forecast is £8
million against an allowance of £38 million.
A1.37. LR3 provides for the recovery of costs associated with four potential offshore
transmission connections. An allowance of £38m was agreed at settlement, based on
SHET’s best view of the likelihood of investment. Currently, SHET has confirmed that two
projects are currently not included in its best view projection. As in other areas, the
scope of works associated with the remaining projects is now substantially different, due
to changes in customers’ requirements and the NOA process. An underspend of £13m is
currently expected across the RIIO period.
Strategic wider works
A1.38. In 2013-14 we approved three projects proposed by SHET: Kintyre-Hunterston
(KH), Beauly-Mossford (BM) and Caithness-Moray (CM). Two projects (KH and BM) were
successfully energised during 2015/16, ahead of schedule. SHET reports that it spent
84% of the allowance for the KH project and 86% of the allowance for the BM project.
The main driver of underspend in relation to both projects was the ability of SHET’s
project team to deliver the project with reduced resource , improved burial techniques
for cables, favourable weather, and productive relationships with landowners enabling
access to sites.
65 This work is categorised as ‘Wider Works not subject to an Uncertainty Mechanism’ in the RRP.

40
A1.39. SHET currently forecasts an outperformance of below c.£140 million in relation to
all three SWW projects across the RIIO-ET1 period. It is recognised that the CM project
is still under construction with remaining risks still to be managed.
A1.40. NGET and SPT currently do not have any approved SWW schemes.
Non-operational capex
SHET
A1.41. For SHET, non-operational capital expenditure is comparatively small, with a total
allowance of £9 million across the RIIO-ET1 price control period.
A1.42. SHET is forecasting £32 million of costs in this area across the eight-year period;
approximately £23 million above forecast allowance.
A1.43. SHET explains that the bulk of the additional costs it expects to incur in this
category relate to its IT Transformation Project - a large programme of work to upgrade
and replace the whole IT system environment of SHET and two Distribution Businesses.
The programme of work has been now been confirmed and the initial implementation of
the new work and asset management systems will occur during 2017/18, with additional
phases and costs in 2018/19, as the full functionality of the system is implemented.
A1.44. The cost of the Transformation Project is being split between the three networks,
based on the requirements and utilisation of each system. We will continue to monitor
delivery and the TO’s share of project costs (and efficiencies) over the remaining T1
period. We expect this Transformation Project to drive enhancements to the efficiency of
future inspection and maintenance programmes and the overall regulatory reporting
process. We expect SHET to demonstrate the benefits of this work in the coming years.
A1.45. The reasons for the overspend is that the extent and scale of the IT
transformation (including networks mobility technology and equipment to front line staff
and cyber security enhancements) was not envisaged at the time of business plan
submission. The business plan assumed a small scale replacement of one of its systems
(ENMAC). The development of the IT ‘roadmap’ occurred following the agreement of the
business plan.
SPT
A1.46. For SPT, non-operational capital expenditure is a minor element of their activities
with a total allowance of £9 million across the RIIO-ET1 price control period. SPT is
forecasting £14 million of costs in this area across the eight-year period. A total
overspend of £5 million is currently forecast.

41
A1.47. Forecast expenditure has increased, relative to the original business plan
estimates, due to an increased number of IT projects (under the £1 million reporting
threshold). The main project is a new Network Asset Management System. As with
SHET, we expect the IT developments to drive efficiency improvements in future
inspection and maintenance programmes and in the regulatory reporting process more
generally.
Opex
A1.48. Opex is the costs attributable to the activities required to maintain and operate
the transmission networks.
SHET
A1.49. The overall RIIO-ET1 operating cost forecast is £239 million, against an adjusted
allowance of £242 million; a small underspend of £3 million. The main drivers of cost are
a forecast rise in vegetation management, faults, and property through the price control
as SHET’s network grows and complexity increases (in line with allowances).
A1.50. We recognise that the vast majority of spend for SHET is in relation to capex,
with only 8% deemed as controllable opex.
SPT
A1.51. Operating cost has a total forecast value of £259 million across the RIIO-ET1
price control period, which is £66 million higher than forecast allowance over the eight-
year period (£193 million). As in previous years, the main driver for this is the change to
accounting measurement made after the RIIO-ET1 bid, which led to a change in the
allocation of indirect costs between capex and opex. The primary impact is on Business
Support costs which appear to be adverse to allowance (c.£90 million). However, there
will be a corresponding reduction in total capex project costs (lower by c.£60-£65 million
over the RIIO-ET1 period).
A1.52. We recognise that the vast majority of spend for SPT is in relation to capex, with
only 12% deemed as controllable opex.
Non-Load related expenditure
A1.53. Non-load related (NLR) capex is capital investment made by a TO to maintain its
existing network. This investment relates mainly to replacement and refurbishment of
assets but also includes other capital expenditure directly and indirectly related to
maintaining a reliable network, such as investments to improve flood defences.

42
A1.54. NLR allowances are split into Asset Replacement Capex and Other Capex.
However, our analysis considers these as a single category and compares actual and
revised forecast expenditure against original allowances.
A1.55. For each TO over-spend or under-spend against allowances may be attributable
to a combinations of factors. We have tried to identify and estimate the impact of as
many of these as possible. In order to aid understanding of the reasons for over-spends
and under-spends, when we have been able to do so, we have separated them into five
broad categories. These categories are explained below. It should be noted that the
values we provide are based on the information we currently have available and are
therefore our best estimates at this stage. They are intended to give an indication of the
magnitude of the factors that contribute to over-spend or underspend and in some cases
are based on assumptions, which we would hope to improve as we we progress to the
end of RIIO-T1. It should also be noted that in some cases, where we indicate year-on-
year changes, that the value of the changes are to some extent driven by refinement in
our assessment methodologies or updated data for the prior year.
Work volume changes: changes in the total quantity of outputs for a given
asset type that a company expects to deliver during the eight years of RIIO-
ET1. In estimating the cost impact of work volume changes we calculated unit
costs of carrying out the work implied by the companies’ allowances (for each
asset type) and assumed that the unit cost does not change over the course of
the price control. The impact of any unit cost changes are reflected in the
second category, ‘work cost changes’.
Work cost changes: changes to the cost of delivering like-for-like outputs.
Decreases or increases in this category could be attributable to efficiencies /
inefficiencies on the part of a company, or scope changes (eg. special
engineering difficulties) or be due to external factors such as input price changes
(as discussed in chapter 4), or a combination of the above.
Work type changes: changes in the type of work used to deliver an output or
desired benefit. For example if a company had been previously expecting to
replace an asset and now discovers that the asset is no longer required and can
be decommissioned, then the associated cost savings would fall within this
category.
Work schedule changes. Costs are included in this category if:
a. at the time of the RIIO-ET1 business plan an output was planned for
delivery either in TPCR4 or RIIO-ET2,
b. there are changes to the timing of delivery but these timing changes do
not impact RIIO-ET1 output volumes, or

43
c. timing changes impact RIIO-ET1 expenditure. For example, if a TO was
forecasting to start replacing underground cables in RIIO-ET1 but to
deliver the final outputs RIIO-ET2, and if replacement is subsequently
delayed and no expenditure is incurred in RIIO-ET1 then the associated
cost savings will be included in this category.
Other factors: a balancing category and will include the impact of
miscellaneous factors that do not fall into one of the above categories.
SHET
A1.56. SHET is forecasting an overall RIIO-ET1 overspend (of £106 million) against
forecast allowance over the entire price control period.
A1.57. The expected profile across the eight-year period is illustrated in Figure A1.1
below and shows that SHET is forecasting to significantly increase expenditure over the
remainder of RIIO-ET1. This contrasts with a cumulative underspend of £20 million in
the first half of RIIO-ET1 and is expected, according to SHET’s forecasts, to result in an
overall overspend of £106 million over RIIO-ET1. The expenditure profiling change is
driven to a large extent by delays and scope changes on a number of projects, including
Fort William to Fort Augustus (FW-FA), Inverarary to Taynuilt (I-T) and Inveraray to Port
Ann (I –PA) overhead line schemes (see paragraph A1.58 below).
Figure A1.1: Actual and forecast expenditure vs TO forecast NLR allowance

44
Table: A1.6: Factors contributing to RIIO-ET1 forecast position 2016RRP vs 2017RRP
Overspend/Underspend Category 2015/1666 2016/17 Year on Year
Change
RIIO-T1 Allowance 256.8 256.8 -
Ch
an
ges
Work volume changes +4.7 +5.2 +0.4
Work cost changes -53.3 +67.3 +120.5
Work type changes -18.1 -0.2 +17.9
Work schedule change
Other +88.8 +33.8 -55.0
Forecast Expenditure 278.9 362.8 +83.9
Total RIIO-T1 Overspend, £m 2016/17 Prices +22.1 +106.0 +83.9
A1.58. Consistent with last year’s report, we have attempted to categorise67 the reasons
and the estimated costs associated with SHET’s overall actual and forecast overspend in
the above table. We have also provided more specific analysis on the drivers for the year
on year increase in overspend (£84 million).
Work volume changes and Work cost changes
A1.59. We estimate the total impact of volume changes and associated work cost
changes over RIIO-ET1 at £121 million. This estimate includes costs associated with
replacing or refurbishing assets on which SHET claims it will achieve NOMs over-delivery.
The bulk of the increase is due to expansion in scope for a number of large OHL
schemes, specifically the FA-FW, I-T and I-PA schemes (total: £109 million). These
schemes now require major upgrades or complete offline rebuild in contrast to the scope
of requirements originally set out in the OBP (simple like-for-like conductor
replacement).
A1.60. Additionally, nine reactors have been replaced or are planned for replacement
due to an unforeseen type issue which has led to a number of early life failures. The
cost of these reactor replacements is estimated at £11 million against no allowance for
reactors. SHET is exploring options for recovery of those costs from the manufacturer.
We therefore may see reversal of all or some of the costs associated with these specific
reactor replacements in future regulatory reports.
Work type changes
A1.61. In last year’s annual report we stated that SHET had identified savings by
replacing only the conductor or the fittings on some OHL circuits where allowances
assumed that both the conductor and the fittings would be replaced. This year’s forecast
costs have increased due to three like-for-like reconductoring schemes (FA-FW, I-T, and
66 Some of the figures may not reconcile with last year’s report due to updated assessment approaches or the
use of updated or new data. 67 Refer to Appendix 4: Non-Load related Expenditure: Overspend and Underspend categories for definitions of
the each of the categories.

45
I-PA) that now require either major upgrades (i.e. increase of circuit capacity) or
complete offline rebuild (i.e. replacement of conductors, fittings, and towers).
A1.62. SHET attributes the variance in the scope of activities that underpin the current
T1 overspend to improvements in its asset management strategy and processes since
the start of RIIO. Developments in asset recording as well as the implementation of a
new IT platform and network management system have led to a more accurate asset
catalogue and improvements in the quality of inspection and condition data from field-
based staff. This, in some cases, has provided SHET with more accurate information on
the condition of some assets, some of which have been found to be in worse condition
than anticipated. This has driven SHET to extend the scope and scale of activities
relative to its OBP.
A1.63. The cost of refubishment (in relation to OHL schemes I-T and I-PA) will require
additional work to remedy residual problems (lack of earth wire and the need to
establish sufficient ground clearances) to enable activity to be undertaken. This,
according to SHET, means that a new build is the optimal solution in these cases.
SPT
A1.64. SPT is forecasting an overall RIIO-ET1 underspend (£80 million) against forecast
allowance over the entire price control period.
A1.65. The expected profile across the eight-year period is illustrated in Figure A1.2
below and shows that SPT is forecasting to retain a relatively steady expenditure profile
over the remainder of RIIO-ET1.
Figure A1.2: Actual and forecast expenditure vs TO forecast NLR allowance: SPT

46
A1.66. The following section presents our analysis of the main factors that our analysis
suggests are driving the forecast value of NLR RIIO-ET1 underspend (£80 million).
Table A1.7: Factors contributing to RIIO-ET1 forecast position 2016RRP vs 2017RRP
Overspend/Underspend Category 2015/1668 2016/17 Year on Year
Change
RIIO-T1 Allowance 790.5 790.5 -
Ch
an
ges
Work volume changes +198.6 +316.1 +117.5
Work cost changes -626.2 -723.3 -97.1
Work type changes -0.2 -1.0 -0.8
Work schedule change +95.1 +133.5 +38.4
Other +244.4 +194.7 -49.8
Forecast Expenditure 702.3 710.5 +8.2
Total RIIO-T1 Overspend, £m 2016/17 Prices -88.3 -80.0 +8.2
Work volume changes
A1.67. Revised condition assessments have led to increased volumes of transformers
requiring replacement and a consequent £3 million increase in expenditure.
A1.68. Changes in load related programme have meant consequential changes for assets
requiring replacement through NLR programmes. This has led to net increased
requirement for NLR OHL work and decrease in circuit breakers. The net cost increase
associated with this load related interaction is estimated at £103 million.
A1.69. Last year’s forecasts included costs of £36 million related to replacement of the
Kincardine-Currie (XD/XK/XM/XN) OHL routes69. During 2016/17, asset condition
assessment highlighted that the replacement of the power carrying phase conductors is
not necessary. SPT has therefore revised the project scope to include only replacement
of existing earth-wires, insulators, fittings, and in some cases elements of tower
steelwork replacement. This has reduced the forecast expenditure, which is now
estimated at £7 million. This scheme is still in development (especially for the power
carrying phase conductors) and SPT have indicated that the forecasts are likely to be
revised in the 2017/18 RRP.
Work cost changes
A1.70. Changes in unit cost for replacement and refurbishment have led to a forecast
saving of £723 million. All lead asset categories have decreased unit costs except for
transformers, with overhead lines contributing the largest proportion of the savings with
£622 million in total estimated savings over RIIO-ET1.
68 Some of the figures may not reconcile with last year’s report due to updated assessment approaches or the
use of updated or new data. 69 SPT treated the Kincardine-Currie OHL routes as Non-Load Related Works (SpC6H), and they were excluded from NOMs targets up to and during 2016 RRP. During MPR, SPT identified that these routes were part of the original NOMs targets under SpC2M, and the schemes for these OHL routes are now treated as NOMs schemes.

47
A1.71. SPT has increased the volume of its OHL replacement work since last year, and
the unit cost of the work has come down. Despite the unit cost reduction, the substantial
volume increase has led to an overall increased spend on OHL replacement over RIIO-
ET1 compared to last year’s forecasts.
Work schedule changes
A1.72. Projects that were due for delivery in the previous price control period but
delayed to RIIO-ET1, due to consenting or operational issues, add £17 million to RIIO-
ET1 costs. These include Bonnybridge 132kV switchgear replacement, Neilston to
Windyhill OHL modernisation, and Kaimes to Whitehouse 275kV cable replacement
schemes.
A1.73. Furthermore, SPT had no forecast expenditure for Non-Rechargeable Diversions
(NRD)70 in its OBP, due to the expected infrequent nature of NRD claims. However, the
upturn in commercial and residential construction has led to an increase of those claims
since 2015/16, which are estimated at £20.3 million over the RIIO-ET1 period.
70 The raising or rerouting of a circuit on third party land can potentially lead to a claim from the landowner to be compensated for loss of land value associated with these works. In circumstances where the landowner terminates the wayleave agreement, seeks for enhanced payments for the electrical equipment, etc., the compensation cost will fall on the network company. This is known as a non-rechargeable diversion.

48
Appendix 2: NGET TO view of totex (company view)
A2.1. In this appendix we present some high level analysis of the drivers of the variation
of NGET TOs’ totex from their allowances from the price control agreement and assesses
the TOs’ performance on capital delivery against the TOs’ view of adjusted allowance.
The latter view is based on the baseline allowances, but with the changes applied
through operation of the uncertainty mechanisms to reflect the current levels of outputs
and the company’s current forecast of future outputs in the remaining RIIO-ET1 period.
Table A2.1: NGET TO current view of T1 totex vs allowance (pre true-up)
£m, 2009-10 Prices Cost
Forecast allowance
Actual & forecast
Expenditure
Performance
Load related ‘Best View’ (OBP 2012) 7,499 Baseline Final Proposals 4,860 Opening allowance 2016-17 (including MPR and voluntary deferral)
4,693
Additional Direct Funding (2016 AIP) -604 TO view of UM adjustments -834
Current T1 forecast 3,255 3,021 -234 (7%)
Non Load
related
Baseline Final Proposals 4,659 Additional Direct Funding +120 Voluntary deferral -350 TO view of UM adjustments +244
Current T1 forecast 4,673 3,73271 -941 (20%)
Non-op capex Current forecast of T1 Non-op capex related
allowances 148
226
78 (53%)
Opex Baseline Final Proposals 1,624 Additional Direct Funding +167 TO view of UM adjustments 0
Current T1 forecast 1791 1,721 -70 (4%)
Published RRP values (small rounding errors may exist)
986772 8,700 -1,167 (12%)
LR figures do not include the impact of the “true up” and exclude Related Party Margins.
71 This value includes an adjustment to account for the costs of the Deeside off-grid substation following clarification from NGET of an error in reporting on it. 72 £9,387m excluding the value of the voluntary deferral.

49
Load-related expenditure
A2.2. LR capex is the investment on the network to accommodate changes in the level
or pattern of electricity generation and demand. For NGET, this is split further into a
number of funding mechanisms, the largest of which are for (i) connecting new
electricity generation sources73, (ii) connecting new demand sources74, and (iii)
incremental ‘wider works’ which are associated reinforcements that facilitate these
connections whilst maintaining network integrity75. There are also mechanisms with
provisions for undergrounding cables and for mitigating works on the electricity
distribution systems (special licence condition 6K).
A2.3. In setting the load related elements of NGET TO’s price control, we used a baseline
allowance to reflect its business plan expectation of c.£4.5 billion of varying costs - that
are able to flex depending on outputs actually required through various volume driver
mechanisms - and c.£1.4 billion of non-variant costs - for works that are deemed to be
needed but mostly without directly measurable output76. Both allowances were set based
on a list of projects proposed by NGET in its original business plan.
A2.4. NGET TO’s current view of the total load-related allowance across the RIIO-ET1
period is £3,255 million (£3,997 million in 16-17 prices). Further detail on NGET TO’s
current forecast of the main categories of LR expenditure across the entirety of the
eight-year price control period is summarised below.
Baseline Wider Works
A2.5. NGET’s electricity transmission licence details four reinforcement projects that
were defined as Baseline Wider Works (BWW) schemes. It has delivered the required
BWW output in three schemes in accordance with the delivery date specified in the
licence and the associated ex-ante allowance has been released.
A2.6. The fourth BWW scheme is the Western HVDC (WHDVC) undersea cable link. This
is a £1 billion link between Scotland and Wales, jointly developed by NGET and SPT, that
will increase the capacity of the transmission system. The link was due to be delivered in
2016/17. The project has encountered technical problems with the cable manufacture
process and the output is forecast to be delivered to a revised completion date within the
73 Local enabling (entry to the system) - Generation Connection volume driver (special licence condition 6F). 74 Local enabling (exit from the system) – Local Demand Volume driver (special licence condition 6L). 75 Incremental wider work (special licence condition 6J). We measure outputs in terms of increases in the electricity transfer capability across system boundaries. Baseline Wider Works (special licence condition 6I) also contains details of scheduled delivery dates associated with specific projects that we hold the TOs to account for. Ex-ante allowances were set based on the delivery profile. The delivered boundary capacity of each ‘baseline’ wider work project is linked to the framework in special condition 6J. 76 Only a small proportion of the non-variant allowance was explicitly specified as outputs in their own right in order to maintain flexibility of the sources of load expansion.

50
2017-18 financial year. This delay has been the subject of debate in the MPR parallel
work.77
A2.7. NGET TO’s current view is that a small over-spend will be achieved over the RIIO-
ET1 period for all four schemes.
Table A2.2: NGET TO BWW forecast (inc WHVDC)
£m, 2016-17 prices Allowance Expenditure Performance
TOTAL 908 913 5 Positive numbers in the performance column indicate overspend; negative numbers indicate underspend
A2.8. NGET TO currently estimates incurring significant costs (c.£460 million) in the
construction of three potential SWW projects. The costs will be subject to a within period
assessment by us and the TO will only receive funding for efficiently incurred costs. The
current estimates of construction and pre-construction costs are summarised in the table
below.
Table A2.3: NGET TO SWW forecast
£m, 2016-17 prices Allowance Expenditure
Construction 45778 457
Pre-construction 5679 139
TOTAL 513 596
Local Generation Connections (Entry)
A2.9. An allowance was originally set on the basis of a baseline of 33GW of new
generation connecting over the RIIO-ET1 period.80
A2.10. Changes in the numbers of customers connecting to NGET’s network drive a
reduction in the associated allowance through the volume driver mechanism. NGET’s
current view is that the mechanism will reduce their allowance from c.£1.2bn to c.£0.4bn
across the price control.
A2.11. As a result, NGET is currently forecasting to overspend against the adjusted totex
allowance for entry connections across RIIO-ET1 by £161m.
77 https://www.ofgem.gov.uk/system/files/docs/2017/07/mpr_parallel_work_decision-v3.pdf 78 To overcome the uncertainty around the actual amount and timing of certain categories of expenditure over the price control period, the network companies agreed to populate the reporting pack by assuming a neutral performance. This means that the level of indicative allowance set by the company is the same as the level of forecast costs expects to incur. 79 Licence special condition 3L: Pre-construction Engineering Outputs for prospective Strategic Wider Works. 80 Licence special condition 6F, table 1.

51
A2.12. NGET’s electricity licence also requires it to report annually on the number of
kilometres of overhead line (OHL) installed. The baseline expected 215.4km to be built
across the price control (associated with the baseline forecast of 33GW). NGET currently
expects a significant reduction in the length of OHL to be commissioned across RIIO-ET1
from 215km to 41.4km (to be commissioned in 2020/21). The reduction in new OHL
(route/circuit) is largely the result of a delay of works associated with delayed generation
projects.
Table A2.4: NGET TO Generation connections
£m, 2016-17 prices Allowance Expenditure Performance
TOTAL 537 698 161 (30%)
Local Demand Connections (Exit)
A2.13. NGET has seen a significant fall in terms of demand connections, reducing the
number of supergrid transformers (SGTs) required across RIIO-ET1 from 72 to 52. This
has been matched by a reduction in the length of OHL to provide local demand
connections, from a length of 27km to 5.42km across RIIO-ET1 (all of which was
commissioned by the end of 2015-16). NGET anticipates no new cable routes across
RIIO-ET1 which is consistent with the business plan and forecast position.
A2.14. Overall expenditure is currently forecast by NGET to be £277m across the price
control. NGET forecasts that the operation of the uncertainty mechanism will reduce its
allowance by £228m to adjust for outputs in the RIIO-ET1 period that are no longer
anticipated to be required by customers. NGET currently anticipates an overspend of
21%, or £49m, relative to NGET’s forecast totex allowance across RIIO-ET1.
Table A2.5: NGET TO Demand connections
£m, 2016-17 prices Allowance Expenditure Performance
TOTAL 228 277 49 (21%)
Incremental wider works81
A2.15. Incremental Wider Works (IWW) are transmission infrastructure works that
deliver an increase in boundary transfer capability which NGET determines is required, in
line with the implementation of its Network Development Policy (NDP).
A2.16. Baseline allowances were set on the basis of NGET’s expected delivery of 23.1GW
of boundary reinforcements over the RIIO-ET1 period. NGET is now forecasting a
substantial fall in its IWW delivery against its baseline levels due to a fall in generation
and demand connections. NGET’s latest forecast is that only GW 9.9GW of boundary
reinforcements will be required across the price control.
81 Detailed in Special Condition 6J of NGET’s licence.

52
A2.17. NGET anticipates that the licence mechanism will substantially reduce baseline
allowances across the RIIO-ET1 period to take account of the outputs that are no longer
required due to changes in customer requirements. As a result, NGET is currently
forecasting to spend 40% below NGET’s updated view of the RIIO-ET1 allowance of
£899m.
A2.18. We will continue to work with NGET to keep under review both its forecasts and
the implications these have through the revenue adjustment mechanisms in the licence.
Table A2.6: NGET TO Incremental Wider Works (excl TPWW82)
£m, 2016-17 prices Allowance Expenditure Performance
TOTAL 899 541 -358 (40%)
Undergrounding and DNO mitigation works83
A2.19. In its RIIO-ET1 business plan NGET TO was forecasting to start replacing
underground cables in RIIO-ET1. This work has subsequently been delayed and currently
only a fraction of original level of expenditure has been incurred in RIIO-ET1.
A2.20. NGET TO currently anticipate delivering 5.7km of underground cable (due to be
commissioned in 2023/24) as part of providing the second Pentir - Trawsfynydd circuit.
Similar to last year, there is practically zero DNO mitigation work currently incurring
cost.
Table A2.7: NGET TO Underground cables and DNO mitigation
£m, 2016-17 prices Allowance Expenditure Performance
TOTAL 46 22 -24 (52%)
Non-variant
A2.21. Non-variant allowances reflect envisaged general system reinforcement to
facilitate the achievement of specific outputs, but were mostly not associated with the
delivery of directly measureable outputs in their own right (such as MW).
A2.22. NGET TO is currently expecting to underspend against its forecast view of
allowance across the entire RIIO-ET1 period.84 This category includes the load related
element of the voluntary deferral (£160 million) and the impact of the MPR decision on
NGET TO (£47 million).
82 NGET TO currently expects a T1 allowance of £27m in relation to TPWW and a spend of £2m. 83 Detailed in Special Condition 6K of NGET’s licence. 84 Once the true-up is taken into account, NGET TO is currently expecting an overspend of c£100m.

53
Table A2.8 NGET TO Non-variant costs85
£m, 2016-17 prices Allowance Expenditure Performance
TOTAL 896 800 -96 (10%)
Non-load related expenditure A2.23. Non-load related (NLR) capex is capital investment made by a TO to maintain its
existing network. This investment relates mainly to replacement and refurbishment of
assets but also includes other capital expenditure directly and indirectly related to
maintaining a reliable network, such as investments to improve flood defences.
A2.24. NLR allowances are split into Asset Replacement Capex and Other Capex.
However, our analysis considers these as a single category and compares actual and
revised forecast expenditure against original allowances.
A2.25. For each TO over-spend or under-spend against allowances may be attributable
to a combinations of factors. We have tried to identify and estimate the impact of as
many of these as possible. In order to aid understanding of the reasons for over-spends
and under-spends, when we have been able to do so, we have separated them into five
broad categories. These categories are explained below. It should be noted that the
values we provide are based on the information we currently have available and are
therefore our best estimates at this stage. They are intended to give an indication of the
magnitude of the factors that contribute to over-spend or underspend and in some cases
are based on assumptions, which we would hope to improve as we we progress to the
end of RIIO-T1. It should also be noted that in some cases, where we indicate year-on-
year changes, that the value of the changes are to some extent driven by refinement in
our assessment methodologies or updated data for the prior year.
Work volume changes: changes in the total quantity of outputs for a given
asset type that a company expects to deliver during the eight years of RIIO-
ET1. In estimating the cost impact of work volume changes we calculated unit
costs of carrying out the work implied by the companies’ allowances (for each
asset type) and assumed that the unit cost does not change over the course of
the price control. The impact of any unit cost changes are reflected in the
second category, ‘work cost changes’.
Work cost changes: changes to the cost of delivering like-for-like outputs.
Decreases or increases in this category could be attributable to efficiencies /
inefficiencies on the part of a company or be due to external factors such as
input price changes (as discussed in chapter 4), or a combination of both.
85 In addition to the values in tables A2.1, A2.2, A2.3 and A2.4

54
Work type changes: changes in the type of work used to deliver an output or
desired benefit. For example if a company had been previously expecting to
replace an asset and now discovers that the asset is no longer required and can
be decommissioned, then the associated cost savings would fall within this
category.
Work schedule changes. Costs are included in this category if:
at the time of the RIIO-ET1 business plan an output was planned for delivery
either in TPCR4 or RIIO-T2,
there are changes to the timing of delivery but these timing changes do not
impact RIIO-ET1 output volumes, or
timing changes impact RIIO-ET1 expenditure. For example, if a TO was
forecasting to start replacing underground cables in RIIO-ET1 but to deliver
the final outputs RIIO-T2, and if replacement is subsequently delayed and no
expenditure is incurred in RIIO-ET1 then the associated cost savings will be
included in this category.
Other factors: a balancing category and will include the impact of
miscellaneous factors that do not fall into one of the above categories.
A2.26. In order to provide a like-for-like comparison between original regulatory
agreement and current forecasts and to enable more accurate trend analysis, this
section compares NGET’s spend against its original allowances (i.e. before the voluntary
deferral of £430m of NLR allowances are excluded). On this basis NGET TO is currently
forecasting a 28% (£1.57 billion) underspend over the entire RIIO period, which is a
£411m further reduction of spend compared to last year.
A2.27. As in last year’s report, we have made adjustments to the non-load related, non-
operational capex and opex cost categories to remove the impact of costs that we have
not yet agreed86 or we think are outside the scope of RIIO-ET1. We have not adopted
the allowance recategorisations in the NLR category proposed by NGET87.
A2.28. The expected profile across the eight-year period is highlighted in the chart below
and indicates that NGET TO is forecasting to significantly increase expenditure over the
remainder of RIIO-ET1.
86 For example, assumptions of recovery for spend through allowances that will be the subject of a claim in a future reopener window. 87 Optel & BT21 allowances recategorised from Asset Replacement Capex to Non Operational Capex, and Metering, Protection and Control, substation Other, Cable Tunnels and other non load related allowances recategorised from Asset replacement Capex to Other capex.

55
Figure A2.1: Actual and forecast expenditure vs TO forecast NLR allowance88
A2.29.The following section presents our analysis of the main factors that our analysis
suggests are driving the forecast value of NLR RIIO-ET1 underspend (£1.57bn), applying
the same categorisation described in paragraph A1.54.
Table A2.9: Factors contributing to RIIO-ET1 forecast position 2016RRP vs 2017RRP
Overspend/Underspend Category 2015/1689 2016/17 Year on Year
Change
RIIO-T1 Allowance 5,721.5 5,721.5 -
Cha
ng
es
Work volume changes -23.1 -264.0 -241.0
Work cost changes -745.6 -499.2 +246.4
Work type changes -173.8 -201.8 -27.9
Work schedule change -336.7 -441.8 -105.1
Other +118.3 -165.8 -284.1
Forecast Expenditure 4,560.6 4,149.0 -411.7
Total RIIO-T1 Overspend, £m 2016/17 Prices -1,160.9 -1,572.5 -411.7
A2.30. In alignment with last year’s report, we have attempted to categorise the reasons
and accompanying estimates associated with NGET’s overall actual and forecast
underspend in the table above. We have also provided more specific analysis of the
drivers for the year on year increase in underspend (£411.7m).
Year on Year increase in underspend
A2.31. Our current estimates of the main reasons for the further £411m reduction in
spend since last year are as follows:
88 The TO forecast adjusted allowance figures for the chat are excluding the £430m of deferred NLR allowances 89 Some of the figures may not reconcile with last year’s report due to updated assessment approaches or the
use of updated or new data.

56
£40m of savings due to reuse of existing infrastructure ranging from concrete
foundations in switchgear and transformer bays to replacement of only the
obsolete parts of protection and control systems
£260m of saving predominantly from the deferral of interventions beyond RIIO-
ET1 due to revised view of condition including transformers, switchgear, OHL
conductors and fittings as well as underground cables and tunnels
£31m of savings from unit cost reductions on all lead asset categories except for
reactors and circuit breakers
£24m of savings from an increase in the volume of tower steelwork to be painted
instead of being replaced
£181m of savings from the proposed use of alternative routes on the Dinorwig-
Pentir underground cable tunnel route and use of an existing tunnel instead of
building a new one on the Beddington-Rowdown underground cable route
£179m increase in actual and forecast spend including on schemes in London
power Tunnels project, earlier start on tunnelling on the Hurst-Newcross-
Wimbledon underground cable route, delays due to poor weather and site access
issues on OHL as well as an overall increase in spend on substation other and
other TO non-lead asset categories.
Other savings, which may in part be attributable to revised project management or
contracting strategies
A2.32. The following sections detail the main drivers of the overall actual and forecast
underspend for the eight years of RIIO-ET1 along the categories in the above table.
Work volume changes
A2.33. Revised condition assessments of lead asset has led to a total forecast saving of
£356m. These savings are attributable mainly to OHL (£80m saving) and to
Transformers (37 unit reduction with £180m saving).
A2.34. Interaction with LR plan (where some assets which were expected to be replaced
as part of a subsequently cancelled LR scheme now require replacement under NLR and
conversely, replacement of other assets that were previously within NLR plan fall into
scope of LR work) accounts for an increase in spend of £48m but a reduction of £14m
compared to last year.
A2.35. As was the case last year deferral and scope changes to the CT/VTs has saved
£41m. Of this total saving £11m has been confirmed to be part of NGET’s voluntary
allowance deferral.
Work cost changes
A2.36. The £499m underspend in this category is attributable to unit cost reductions for
all lead asset categories with the exception of reactors. This is largely related to the real
price effects discussed in Chapter 4, as well as some changes in the TO’s procurement
approach.

57
Work type changes
A2.37. We reported last year on savings that NGET has achieved through the use of
enhanced paint coating system as an alternative to replacing tower steelwork. The
savings attributable directly to the use of enhanced paint coating system (£198m) have
not changed significantly. However, we are seeing significant changes in forecast
volumes of tower steelwork replacement (30% decrease) for a cost increase of £3.7m.
This equates to an overall 52% unit cost increase for tower steelwork replacement. NGET
explains that the unit cost increase is due to improved forecasting as associated costs
have become more certain on routes where condition assessments have identified a
lower volume of steelwork in need of replacement. The unit cost increase is most
pronounced in the final two years of RIIO-ET1. Since last year’s report, forecasts for the
final two years of RIIO-ET1 have steel work replacement reducing from 2,275 tonnes to
793 tonnes with costs increasing from £25m to £39m (c. 340% unit cost increase). This
may be partly attributable to expenditure on schemes where the steelwork volumes will
be delivered in RIIO-ET2. We intend to ask NGET to provide further explanation and/or
a cost benefit analysis to support the higher unit cost investments on these schemes.
A2.38. NGET reported in its supporting narrative last year that 22 transformers and
three reactors would be decommissioned instead of replaced with an associated saving
of £118m. It has subsequently confirmed that this was an error and the correct figure for
number of transformer decommissioning is 10. The revised NLR saving for both
transformers and reactors is approximately half of what was reported last year. We
estimate the revised decommissioning costs (reported under opex) to be approximately
£2m.
Work schedule changes
A2.39. NGET’s NLR allowances included approximately £1,008m of allowances to cover
RIIO-ET1 expenditure on schemes expected to deliver final outputs in RIIO-T2. There are
therefore no RIIO-ET1 outputs to which these allowances can be linked. A number of
these schemes have subsequently been either cancelled or fully deferred beyond
RIIO-ET1. Current estimate of the value of cost savings attributable to these deferrals is
£290m. The bulk of these savings are on underground cable and cable tunnel schemes
(e.g. £217m on two UC/Tunnels schemes: Tottenham-Redbridge and Dinorwig-Pentir).

58
Non-operational capex A2.40. The latest forecast for Non Operational capex over the RIIO-ET1 period is £232m
which is higher than the allowances of £182m. The forecast overspend across the entire
RIIO-ET1 period is £50m (27%).90
A2.41. Expenditure in this category is largely driven by IT investments to facilitate
ongoing business and performance improvement (£174m). The majority of the IT
investment is driven by the ‘Technology Change Roadmap’91 programme. This
accounted for 41% (£48m) of all IT costs incurred to date (£116m) and is forecast to
account for 24% (£14m) of ongoing IT costs over the remaining T1 period (£58m). We
will continue to monitor progress in the delivery of IT systems to determine the level of
outturn costs incurred and identify the scale of efficiencies being realised.
Opex
A2.42. The overall RIIO-ET1 operating cost forecast is £2,113m, against an adjusted
allowance of £1,994m: an overspend of £119m (6%). The main driver for this is higher
pension costs, higher business support costs - as a consequence of the ETO growing in
size relative to other business areas - and the result of a review of allocations between
ESO and ETO resulting in much of the SO allocation moving to the TO.
90 The expenditure excludes cost associated with work to renew the OPTEL network and the BT21 Mitigation
project. The associated expenditure has been deducted from the category of non-operational capex and
classified as non-load related. 91 This programme delivers the data and technology changes required to enable the successful implementation of the Asset, Maintenance Planning & Delivery transformation project within NGET TO.

59
Appendix 3: Ofgem assessment of NGET TO totex (post true-up)
A3.1. As noted in chapter 4, there is significant uncertainty with some investment
included in the price control information received from the TOs. The most notable
example is the Strategic Wider Works (SWW) process for the approval of future major
investments that were neither in the baseline nor captured by the volume drivers. These
schemes are subject to a within-period determination by the Authority.92
A3.2. To overcome the uncertainty around the actual amount and timing of certain
categories of expenditure over the price control period, the network companies agreed to
populate the reporting pack by assuming a neutral performance. This means that the
level of indicative allowance reported by the company is the same as the level of forecast
costs expects to incur.
A3.3. It is therefore possible to remove the impact of costs that we have not yet
assessed or agreed from the performance analysis.
A3.4. Further adjustments can also be made to exclude expenditure in areas where we
think it is unlikely that the conditions required to trigger the additional allowances will be
met and/or where funding is likely to be available through another route (e.g. NOMs).
A3.5. The text below provides a high level explanation of the adjustments made to NGET
TO’s reporting information. It is important to note that by removing such costs from our
analysis we are not indicating that the company values submitted as part of the
reporting pack are not an accurate forecast of the required activities or suggest that the
activities they are associated with are inefficient. The adjustments have been made only
to reflect the uncertain nature of these costs and the associated within period
assessment that has yet to take place or has not yet concluded. It also seeks to provide
an additional level of transparency and understanding of drivers of the current forecast
of under- and over-spend across the RIIO-ET1 period.
Load related category: uncertain costs
A3.6. We have made adjustments to the totex allowance and expenditure values to
remove the impact of works that have not yet been assessed or the assessment has to
be concluded in two areas: (i) construction costs associated with SWW projects ‘not yet
92 The costs will be subject to a within period assessment and the TO will only receive funding for efficiently incurred costs. This is of particular relevance to NGET TO as it currently estimates incurring significant costs (c.£460m) in the construction of three potential SWW projects.

60
approved’, and (ii) the licence term TPWW (this licence term is applicable to NGET TO
only).
A3.7. In terms of TPWW, NGET has submitted a claim for the Hackney - Tottenham -
Waltham Cross uprating scheme. This project is detailed along with the other baseline
schemes in Special Condition 6J. In November 2013 the National Development Plan
(NDP) analysis signalled the investment is not now in consumers’ interest to proceed and
the investment has been delayed indefinitely. NGET is currently seeking to recover the
costs of works incurred as a result of the output not being delivered. The total TPWW
claim is currently £27m. This claim is currently being analysed to understand if it was
efficiently incurred as well as whether it is reusable to deliver a different output.
Non-load related category
A3.8. We have made further adjustments under the costs categories of non-load related,
non-operational capex and opex to remove the impact of costs that we have not yet
agreed or we think are outside the scope of RIIO-ET1.
A3.9. The adjustments made in the category of non-load related expenditure reflect our
general analytical approach that considers Asset Replacement Capex and Other Capex
together.
A3.10. We have not adopted the allowance recategorisations in the NLR category
proposed by NGET as part of a ‘re-stated’ submission. However, we have moved the
associated expenditure from Non-operational capex to Other Capex and removed the
impact of the capex spend and forecast costs for visual impact projects (Other capex).
NGET’s NLR expenditure has also been adjusted to reflect other exceptional items
associated with specific legal costs.
A3.11. Minor adjustments have been made to the submissions of SPT and SHET – these
are detailed in table A3.2 and A3.3, respectively (and for completeness).
A3.12. The impact on NGET TO’s allowed totex and expenditure is highlighted in the
table below. The values presented are adjusted to reflect the current estimated impact
of the end of period (i.e. post “true up”). For the avoidance of doubt, the approach
applied in our assessment is a snapshot based on current information and is not a
conclusion on the form and scope of the end of period “true up”. Separate discussions
will continue between Ofgem and the network companies on the parameters of the “true
up” to be applied at the end of the RIIO-ET1 period.

61
Table A3.1: eight-year position post our assessment of “True up” – NGET TO
Category (£m, 16-17 prices) Forecast allowance Forecast
expenditure Performance
T1 Load related 3,318 3,251 -67
T1 NLR Load related 5,292 4,149 -1,143
T1 Non operational capex 181 232 50
T1 controllable opex 1,994 2,113 119
TOTEX 10,785 9,744 -1041 (-10%)
Table A3.2: eight-year position post our assessment of “True up” - SPT
Category (£m, 16-17 prices) Forecast allowance Forecast
expenditure Performance
T1 Load related 1,177 1,108 -69
T1 NLR Load related 805 710 -95
T1 Non operational capex 9 14 5
T1 controllable opex 192 259 67
TOTEX 2,183 2,091 -93 (4%)
Table A3.3: eight-year position post our assessment of “True up” - SHET
Category (£m, 16-17 prices) Forecast allowance Forecast
expenditure Performance
T1 Load related 2,488 2,343 -145
T1 NLR Load related 257 363 106
T1 Non operational capex 9 32 23
T1 controllable opex 242 239 -3
TOTEX 2,996 2,977 -19 (-1%)
Phasing of investment
A3.13. This section provides further insight into NGET TO’s current expectations of the
phasing of LR expenditure and expectations of the provision of allowance over the eight-
year price control period and beyond.
A3.14. Our analysis is presented for information only and the values discussed are not
reflected in the adjustments that form the basis of assessment of RoRE summarised in
chapter 2.
Expenditure on schemes that will deliver outputs up to 31 March 2023
A3.15. NGET’s Final Proposals document acknowledged that NGET TO may incur costs to
deliver outputs beyond RIIO-ET1 in advance of funding. The parameters of the RIIO-ET1
revenue drivers applicable to NGET TO were developed to allow NGET TO to trigger an
allowance adjustment towards the end of the price control period for outputs delivered in
the first two years of RIIO-ET2 only (2021/22 and 2022/23, referred to as ‘T1+2’).

62
A3.16. The reporting information provided by NGET TO reflects their current
expectations of the level of allowance adjustment to take account of the costs incurred
(actual and forecast) in the delivery of outputs in the T1+2 timescales.
A3.17. Based on the current information, NGET TO is currently expecting to incur a cost
of £142m (09-10 prices) linked to the developments of schemes within T1+2 timescales.
NGET TO is currently expecting a corresponding allowance of £472m across the range of
revenue drivers linked to the delivery of expected outputs over this two year period.
Expenditure on schemes that will deliver outputs beyond 31 March 2023
A3.18. We are aware that NGET TO is incurring (or is projecting to incur) significant
costs on schemes that are forecast to complete far into the next price control period. No
funding allowances were included in the T1 settlement for expenditure linked to the
development of schemes that are currently expected to complete beyond March 2023.
A3.19. These projects are expected to deliver outputs (eg. connecting additional
generation) and would, if completed during T1+2 timescales, have resulted in an
adjustment via the applicable revenue driver mechanism to take account for this
additional spend. However, since the outputs are yet to be delivered, and no framework
exists to provide funding, there is no commensurate change in allowance.
A3.20. Based on the current information, NGET TO is currently expecting to incur costs
of approximately £370m (09-10 prices) in the delivery of outputs beyond March 2023. It
is not appropriate for this to be categorised as “overspend”. As such, we have isolated it
within our analysis, see table 3.4.
Table A3.4: Phasing of forecast expenditure and allowance – NGET TO
2009-10 prices
Current RIIO-ET1 company forecast totex view (company adjustments applied)
T1 only T1+2
Beyond March 2023
All. Exp. Diff. All. Exp. Diff. All. Exp. Diff.
£m % £m % £m %
Total 772 786 +15 +2 472 142 -331 -70 0
376
376
100
A3.21. It is important to note that by identifying the phasing of expenditure and
expectations of the corresponding allowance provision in the T1 and T1+2 periods we
are not indicating that the values submitted are not an accurate forecast of the required
activities. Equally, our analysis does not suggest that the activities they are associated
with are inefficient. The table only serves to highlight that NGET TO is incurring capex on
the delivery of outputs that are intended to be delivered beyond March 2023 and there is
currently no framework to provide a commensurate increase in allowance.

63
A3.22. NGET TO’s RIIO framework contains revenue drivers where the parameters of the
mechanism include a provision to fund NGET TO for works required in RIIO-ET1 for
delivery in RIIO-ET1+2 timescales. These are listed below.
Generation connections volume driver (special condition 6F)
Demand connections volume driver (special condition 6L)
Wider works volume driver (special condition 6I)
A3.23. The next section provides further detail on each revenue driver mechanism that
includes provision for allowances within T1+2 timescales.93
Generation connections
A3.24. NGET TO currently expects a total allowance value of £318m to deliver close to
10GW of new generating capacity across the RIIO-ET1 period and a further 10GW
capacity in the first two years of the RIIO-ET2 period.94 The total forecast expenditure
across this ten-year period is currently £565m (including de minimus), see table A3.5.
Table A3.5: Generation connection; allowance and expenditure analysis
2009/10 price base Output (GW)
Allowance
(£m)
Forecast Expenditure
(£m)
over (+)/ underspend (-)
(£m)
2013-2021 10.5 12595 286 161
T1+2 10.4 200 95 -105
Total 21 32596 381 57
Beyond 2023 N/A97 0 162 162
Other N/A 0 22 22
Total N/A 325 565 240
A3.25. Our assessment indicates that approximately two-thirds (£200m) of the forecast
allowance is related to schemes expected to deliver outputs within 2022/23 or 2023/24
(the T1+2 period). Based on current information, NGET currently anticipates incurring
close to £100m of expenditure on schemes linked to the delivery of these outputs.
A3.26. The remainder of the forecast allowance (£125m) relates to activity on schemes
expected to deliver outputs within the eight-year price control period (2013-2021). NGET
TO currently expects to incur £286m of costs to complete these projects and deliver the
93 Special condition 6K also has similar provisions but is not considered further due to the very low levels of expenditure currently forecast. 94 This also includes delivery of 44 circuit kms of overhead line over the ten-year period. 95 This allowance does not fully reflect the full cost of the delivery of 10GW. It excludes expenditure incurred prior to the start of RIIO. 96 £318.4 excluding licence term “TPG” 97 NGET anticipates delivery of a further 39GW beyond 2023. However, the expenditure reported is only reflecting the expenditure incurred until March 2023.

64
associated capacity. This expenditure is primarily driven by the connection of large,
capital intensive investment projects located in offshore waters.
A3.27. We estimate that £162m of forecast expenditure is related to schemes delivering
outputs beyond 2023, for which there is currently no allowance.
Wider Works (including baseline wider works projects but excluding WHVDC)
A3.28 NGET TO currently expects a total allowance value of £768m (including the
completion of three Baseline Wider Works projects) to enable additional transfer capacity
of 10GW by the end of RIIO-ET1 and a further 6.7 within the first two years of the RIIO-
ET2 period. The total forecast expenditure across the RIIO-ET1 and the T1+2 period is
£581m (including de minimus).
Table A3.6: IWW and baseline WW; allowance and expenditure analysis
2009-10 price base output (GW)
allowance
(£m)
expenditure
(£m)
over/
underspend
(£m)
RIIO-1 10.0 499 337 -162
RIIO-1 +2 6.7 269 47 -222
Total 17 768 383 -385
Beyond 2023 N/A98 0 182 182
Other N/A 0 16 1699
Total N/A 768 581 -187
A3.29. Our assessment indicates that approximately one third (£269m) of the forecast
allowance is linked to schemes delivering outputs within the T1+2 period, while only
£47m of costs is expected to be incurred in the delivery of these outputs.
A3.30. The remainder of the forecast allowance (£499m) relates to activity on schemes
expected to deliver outputs within the current eight-year price control period (2013-
2021). NGET TO currently expects to incur £337m of costs to complete these projects
and deliver the associated increase in transfer capability.
A3.31. A total expenditure of £182m was reported by NGET in relation to the delivery of
outputs that do not currently have any funding provision.
98 NGET anticipates delivery of a further 22GW beyond March 2023. However, the expenditure reported in the table is only reflecting the expenditure incurred until 31 March 2023. 99 Terminated schemes (TPWW) (Hackney Tottenham) and other schemes subject to potential TPWW currently account for an expenditure of ~16m.

65
Demand connections
A3.32. NGET TO currently expects a total allowance value of £152m across the RIIO-ET1
period and in the first two years of the RIIO-ET2 period.100 The total forecast expenditure
across this ten-year period is currently £164m (including de minimus), see table A3.7.
Table A3.7: demand connections - allowance and expenditure analysis
2009-10 prices allowance (£m) expenditure (£m)
over / underspend
(£m)
RIIO-1 148 164 16
RIIO-1 +2 4 0 -4
Total 152 164 12
Beyond 2023 0 32 32
Other 0 0 0
Total 152 195 44
A3.33. Based on the current information available, NGET TO currently expects to incur
£32m in relation to the delivery of outputs beyond March 2023, for which there is
currently no allowance.
Areas of further work
A3.34. While it is appropriate to provide an allowance in RIIO-ET1 for the delivery of
such outputs, there are some drawbacks to this. Firstly there is a risk that the allowance
does not adequately reflect the actual outputs being delivered. The unforeseen level of
change in the energy background since the beginning of RIIO-ET1 indicates the potential
level of variability between now and the first two years of RIIO-ET2. As a result the
outputs reflected in the allowances provided could differ from those that will actually be
delivered.
A3.35. Secondly should a project identified by NGET TO connect earlier than envisaged
(ie. not in T1+2 timescales as originally envisaged but within the eight-year RIIO-ET1
period), there is currently scope for allowances to be provided twice for the delivery of
the same output. There is a need to develop the reporting structures to ensure that
information is accurately reported and to examine the licence framework to ensure it is
appropriately calibrated.
A3.36. We will be taking forward discussions with NGET on how these risks can be
mitigated, including any potential clarifications to the licence to ensure that allowances
always reflect the most up to date information. The arrangements will adhere to the
central RIIO principle; allowances will only reflect efficient investment for the customer-
driven outputs delivered.
100 This also includes delivery of five circuit kms of overhead line over the ten-year period.

66
[blank page]


