116
Pressures and barriers to industry performance BANKWEST CURTIN ECONOMICS CENTRE Focus on Western Australia Report Series, No. 4 July 2015 THE COSTS OF DOING BUSINESS IN WA

business.curtin.edu.au/bcec Pressures and barriers to industry performance
BANKWEST CURTIN ECONOMICS CENTRE
Focus on Western Australia Report Series, No. 4July 2015
Bankwest Curtin Economics CentreTel: +61 8 9266 2873Email: [email protected]
© Curtin University of Technology 2015Curtin University is a trademark of Curtin University of TechnologyCRICOS Provider Code 00301JADV079953
Contact
ThE COSTS Of DOINg BUSINESS IN WA
About the Centre Disclaimer
While every effort has been made to ensure the accuracy of this document, the uncertain nature of economic data, forecasting and analysis means that the centre, Curtin University and/or Bankwest are unable to make any warranties in relation to the information contained herein. Any person who relies on the information contained in this document does so at their own risk. The centre, Curtin University, Bankwest, and/or their employees and agents disclaim liability for any loss or damage, which may arise as a consequence of any person relying on the information contained in this document. Except where liability under any statute cannot be excluded, the centre, Curtin University, Bankwest and/or their advisors, employees and officers do not accept any liability (whether under contract, tort or otherwise) for any resulting loss or damage suffered by the reader or by any other person.
The views in this publication are those of the authors and do not represent the views of Curtin University and/or Bankwest or any of their affiliates. This publication is provided as general information only and does not consider anyone’s specific objectives, situation or needs. Neither the authors nor the centre accept any duty of care or liability to anyone regarding this publication or any loss suffered in connection with the use of this publication or any of its content.
Authorised Use
© Bankwest Curtin Economics Centre, July 2015Bankwest Curtin Economics Centre Focus on Western Australia Report SeriesISBN: 978-1-925083-30-9
This report was written by: Rebecca Cassells, Alan Duncan, grace gao and Yashar Tarverdi from the Bankwest Curtin Economics Centre at Curtin Business School.
It can be cited as: Cassells R, Duncan A, gao g and Tarverdi Y (2015). ‘The Costs of DoingBusiness in WA’, Bankwest Curtin Economics Centre, Focus on Western Australia Report Series, Issue #4, July 2015.
This publication contains confidential and proprietary information of the Bankwest Curtin Economics Centre. All of the material in this publication is for your exclusive use and may not be otherwise used or modified for, or by, any other person or sold to orotherwise provided in whole or in part to any other person or entity without the prior written consent of the Bankwest Curtin Economics Centre.
A standard hard copy of, or electronic subscription to, this publication entitles employees of the same organisation and same physical location as the subscriber to the use of its contents for internal reporting purposes only. Multiple user licenses are available for organisations with more than one location.
The Bankwest Curtin Economics Centre is an independent economic and social research organisation located within the Curtin Business School at Curtin University. The centre was established in 2012 through the generous support from Bankwest (a division of the Commonwealth Bank of Australia), with a core mission to examine the key economic and social policy issues that contribute to the sustainability of Western Australia and the wellbeing of WA households.
The Bankwest Curtin Economics Centre is the first research organisation of its kind in Western Australia, and draws great strength and credibility from its partnership with Bankwest, Curtin University and the Western Australian government.
The centre brings a unique philosophy to research on the major economic issues facing the state. By bringing together experts from the research, policy and business communities at all stages of the process – from framing and conceptualising research questions, through theconduct of research, to the communication and implementation of research findings – we ensure that our research is relevant, fit for purpose, and makes a genuine difference to the lives of Australians, both in WA and nationally.
The centre is able to capitalise on Curtin University’s reputation for excellence in economic modelling, forecasting, public policy research, trade and industrial economics and spatial sciences. Centre researchers have specific expertise in economic forecasting, quantitative modelling, micro-data analysis and economic and social policy evaluation. The centre also derives great value from its close association with experts from the corporate, business, public and not-for-profit sectors.

Contents
The CosTs of Doing Business in WA Pressures and barriers to industry performance
i
List of figures ii
List of tables iv
foreword vi
executive summary Key Findings
viivii
introduction 1
WA business profile Size
IndustryChanges over timeBusiness entries and exitsCost structure
589
111315
Business perceptions 17
Labour costs Introduction
Wage costs over timeRelative labour costs in WA
25262733
Tax costs on companiesTaxes on businesses in WAPayroll taxThe costs to WA businesses of payroll taxHave payroll tax costs increased over time?
3536373840
CapitalCapital components and growthBarriers to finance and working capital
454749
utilities, occupancy and housing Utilities Electricity
GasWater and sewageOccupancy and housing
515255575960
Transport 63
Red tape and regulations 69
WA regionsRegional business profileRegional business costsWA regional wagesWA regional occupancy and housingWA regional utilities WA regional transport
75768081828485
Discussion and summary 89
References 93
Appendix 95

List of figures
ii
figure 1 Proportion of actively trading businesses in Western Australia by employment size, 2014
6
figure 2 Proportion of actively trading businesses in Western Australia by employment size and turnover, 2014
8
figure 3 Proportion of actively trading businesses by industry – Australia and Western Australia, 2014
10
figure 4 Actively trading WA businesses by industry and number of employees, 2014
10
figure 5 Growth of businesses by annual turnover, Western Australia and Australia, 2003-2014
11
figure 6 Growth of WA businesses by annual employment size, Western Australia and Australia, 2003-2014
12
figure 7 Business entries and exits, Western Australia and Australia, 2003-2014 13figure 8 Cost shares of labour, capital and intermediate inputs – average of all
industries15
figure 9 Cost shares of labour, capital and intermediate inputs by industry 16figure 10 Reported key drivers of cost pressures for WA businesses in 2011 18figure 11 Barriers to general business activities or performance, 2012-13 19figure 12 Barriers to general business activities or performance, 2006-07
to 2012-1320
figure 13 Barriers to general business activities or performance, by industry, 2012-13
21
figure 14 Annual wage price inflation for WA and Australia: 2001 to 2014 27figure 15 Increase in wage price index (WPI) relative to June 2003: WA, by industry
sector28
figure 16 Relative labour costs per employee and cost per sales and service income in WA relative to Australia: 2007-08, by industry sector
34
figure 17 Relative labour costs per employee and cost per sales/service income in WA relative to Australia: 2013-14, by industry sector
34
figure 18 Payroll tax schedules as at July 2015: by state/territory and total employment costs
37
figure 19 Capital expenditure components, all industries, 2008-09 to 2013-14 47figure 20 Capital expenditure components, by industry, 2013-14 48figure 21 Private fixed Capital formation by industry, current prices, 2000-2014 48figure 22 Financial barriers to business activities by employment size, 2012-13 49figure 23 Financial barriers to business activities, 2006-07 to 2012-13 50figure 24 Financial barriers to business activities by industry, 2012-13 50figure 25 Comparison of Perth adjusted Utilities CPI to Australia 52figure 26 Comparison of Perth Annual Inflation of Utilities to Australia 53figure 27 Comparison of Perth Annual Inflation of Utilities to other states inflation 53figure 28 Comparison of Perth adjusted Utilities CPI to Australia 54figure 29 Comparison of Perth adjusted Electricity CPI to Australia 55figure 30 Comparison of Perth Annual Inflation of Electricity prices to Australia 56 figure 31 Changes in Electricity Tariffs, 2009 - 2015 56figure 32 Comparison of Perth adjusted Gas CPI to Australia 57figure 33 Comparison of Perth Annual Inflation of Gas prices to Australia 58figure 34 Comparison of Perth Annual Inflation of Water & Sewage prices to
Australia 59
3
iii
The CosTs of Doing Business in WA Pressures and barriers to industry performance
figure 35 Comparison of Perth Annual Inflation of Water & Sewage to other states inflation
59
figure 36 Average Benchmark weekly rental price of office space in Central Business Districts, 2009-2012
60
figure 37 Percentage change in established house price for Perth and Australia 1990-2013
61
figure 38 Mortgage cost shares for WA and Australia 2003-04 to 2011-12 62figure 39 Diesel Prices across state and territories, 2007–2014 65figure 40 Comparison of Diesel Prices, WA and Australia, 2007 to 2014 65figure 41 Comparison of Diesel Prices in WA to other states and territories,
2007–201466
figure 42 Unleaded fuel Prices across states and territories, 2002-2014 67figure 43 Comparison of Unleaded Prices, WA and Australia, 2002–2014 67figure 44 Comparison of Unleaded Prices in WA to other states and territories,
2007–201468
figure 45 Proportion of firms citing government regulation and compliance as a barrier to performance
71
figure 46 Proportion of firms citing government regulation and compliance as a barrier to performance by firm size, 2006-07 to 2012-13
72
figure 47 Proportion of firms citing government regulation and compliance as a barrier to performance by industry, 2006-07 to 2012-13
73
figure 48 Proportion of all WA businesses among WA regions, 2014 76figure 49 Proportion of employing and non-employing businesses, WA regions, 2014 77figure 50 Proportion of businesses by annual turnover size, WA regions, 2014 78figure 51 Annual percentage change of total number of businesses by region,
June 2009 – June 201479
figure 52 Average annual wages by WA region, 2005-06 to 2013-14 81figure 53 Commercial property per square metre, WA Regions, 2000 - 2014 82figure 54 Regional Housing Index, 2007-2013 83figure 55 Differences in Regional and Metro Business Electricity Tariffs 84figure 56 Regional Transport Index, 2007-2013 85figure 57 Difference in real price of Diesel, WA regions relative to Perth,
2001-201586
figure 58 Difference in real price of Unleaded Petrol, WA regions relative to Perth, 2001-2015
87
figure 59 Average wage costs per employee by industrial sector for WA and Australia: 2007-08 to 2013-14 (in June 2015 prices)
98
figure 60 Average wage costs per dollar of sales/service income by industrial sector for WA and Australia: 2007-08 to 2013-14 (in June 2015 prices)
100

iv
List of tables
Table 1 Proportion of business by employment size, by state and territory, June 2014
7
Table 2 Proportion of business by annual turnover size by state and territory, June 2014
8
Table 3 Ranking of WA industries by business counts, employment and economic value
9
Table 4 Business survival rates by state and territory, June 2010 – June 2014 14Table 5 Labour costs per employee (2015 $’s): by industry sector, WA and
Australia29
Table 6 Labour costs per dollar of sales and service income (2015s): by industry sector, WA and Australia
31
Table 7 Payroll tax bill - by level of employee costs and state/territory (as at 1 July 2015)
38
Table 8 Change in payroll tax liabilities between 2005-06 and 2015-16: by state/territory and employers’ payroll cost
40
Table 9 Projection of 2015-16 payroll tax liabilities for payroll tax thresholds uprated in line with AWOTE from 2005-06 to 2015-16: by state/territory and employers’ payroll costs
41
Table 10 Effect of changes in payroll rates and thresholds on payroll tax liability of small employer (relative to system as at July 2015)
42
Table 11 Effect of changes in payroll rates and thresholds on payroll tax liability of larger employer (relative to system as at July 2015)
43
Table 12 Proportion of business by employment size, WA regions, June 2014 77Table 13 Payroll tax rates and thresholds by state/territory, 2008-09 to 2015-16 96Table 14 Comparable (‘neutral’) payroll tax thresholds calculated by uprating July
2005 threshold by AWOTE97

5
v
The CosTs of Doing Business in WA Pressures and barriers to industry performance

Foreword
vi
Professor Alan DuncanDirector, Bankwest Curtin economics CentreCurtin Business school, Curtin university
The cost of doing business in Western Australia has long been a rhetoric heard and discussed throughout the state, with increased economic activity in recent times exacerbating the issue. The geography of the state, with its capital – Perth, one the most isolated cities on earth, together with the majority of its land area classified as ‘remote’ or ‘very remote’ can add to cost pressures, making business operations more challenging than might otherwise be the case.
The Cost of Doing Business in Western Australia is the fourth report in the BCeC’s ‘Focus on Western Australia’ series. it addresses an issue of central importance to Western Australia in maintaining its economic growth story – the costs of doing business in the state.
The question of whether the cost of doing business in Western Australia is more or less expensive compared to other states and territories and whether business input costs have been rising disproportionately over time, is largely a relative one. Much like the question of whether the cost of living has increased – it depends to a large extent on the means one has.
excessively high business costs can hamper growth and productivity, making it difficult for existing and incumbent firms to realise their full potential. A number of WA business input costs have been increasing over time and are high compared to other Australian jurisdictions. however, WA business revenues have also been increasing at a faster rate than other states and territories.
is the cost of doing business in Western Australia problematic? for some businesses and in certain regions and industries – yes. small to medium businesses, those operating in remote or regional areas and those reliant on inputs that have seen the biggest price increases are among these. for other businesses, cost pressures are for the most part a product of increased demand, fuelled by strong industry-specific economic growth.
Continued microeconomic reform that focuses on taxation and industry specific issues will help to ease cost pressures for many business in the West, ensuring that the state builds on previous growth and has the ability to diversify and compete in a global market.

Executive summary
Key findings
This fourth report in the Bankwest Curtin economics Centre’s Focus on Western Australia series addresses an issue of central importance to Western Australia in maintaining its economic growth story – the costs of doing business in the state.
The report examines the principal business cost components facing companies across different industry sectors in WA. information included in the report has been sourced from a range of data bases, including numerous Australian Bureau of statistics products, the Property Council of Australia, fuelWatch, specialised commercial sales price data sourced from Landgate and information from the Department of Regional Developments Regional Price indices.
The report sheds light on the main barriers to business activities and performance cited by companies in different industry sectors - including labour shortages and labour costs, input costs, and burdens of regulation or compliance – and look at those barriers that particularly affect the activities, growth or survival of businesses in the state.
A regional analysis of businesses operating in WA and the differential cost pressures these areas are experiencing is also included in the report.
WA Business Profile• WAhasalmost219,000actively
trading businesses. This constitutes around 10% of all Australian businesses.
• Likemoststatesandterritories,WestAustralian businesses are dominated by small business. small businesses account for almost 97% of all actively trading businesses, the majority of which are non-employing (62.0%).
• OneinfourWesternAustralianbusinesses report annual turnover of less than $50,000. similar proportions report an annual turnover above half a million.
• WAhasthehighestproportionofcompanies with annual turnover exceeding $2 million among all states and territories – 7.7 % of WA businesses reported
• Constructionisoneofthemostimportant industries in WA on a combination of number of businesses, number of employees and value - it ranking first in business counts, third in the number of people employed in the sector and second in terms of the economic value it brings to the state.
• Constructionandminingaremoreprominent in the West, with a greater proportion of active businesses in WA - 18.3% of the total number of businesses - compared to Australia.
• Businessesoperatingintheretailtradeand accommodation and food services sectors are more likely to be employers than those in other sectors.
• Thenumberofbusinesseswithlessthan $50,000 per year in annual turnover has been decreasing since 2007 for both WA and Australia.
7
vii
The CosTs of Doing Business in WA Pressures and barriers to industry performance

Key findings (continued)
• Thenumberofbusinesseswithaturnover of $200k to $2m increasedrapidly for WA and nationally - from63,981 to 74,889 (a 17% rise) between2007 and 2014.
• Thenumberofbusinesseswithannualturnover of $2 million or more has alsoincreased rapidly in WA, from 12,326to 16,971 entities – an increase ofalmost 30%.
Business Entries and Exits• Patternsofbusinessentriesand
exits in Western Australia have beensimilar to national trends over the pastdecade.
• ThenetbusinessentryrateinWAexceeded the national rate prior tothe gfC, peaking at 38,013 businessentries and 28,482 business exits in2006-07.
• Since2006-07businessentrieshavefallen considerably – by 30% for WAbetween 2009-10 and 2012-13 and by12% for Australia in the same period.
• Thisequatedtoanetfallofalmost11,000 WA businesses between 2009-10 and 2012-13. This pattern hasrecently reversed.
• BusinesssurvivalratesinWAaresimilar to those at a national level -61% of active businesses in June 2010remained in operation to at least June2014.
Business Perceptions• Themostcommonissuesreportedby
businesses as barriers to performanceare a lack of access to additional funds,the cost of inputs, and the lack oflabour skills.
• Morethan4outof5businessesinWAreport wages as a key cost pressure fortheir operations.
• Duringtheheartoftheresourcesboom in 2006-07, more than 1 in 4businesses reported a lack of skills inany location as a significant barrier –by 2012-13 this had reduced to 15.6%.
• Barrierstobusinessactivityandperformance can vary considerably byindustry.
• Oneinfivebusinessesintheconstruction sector report outstandingaccounts as a significant barrier tobusiness activity and performance.
Labour Costs• Labourcostssharesrunatanaverage
of around 28% of total costs for allbusinesses in Australia, but varywidely across industry - from 14% formining to 50% in administrative andsupport services.
• 9in10businessesreportlabourcostsas the key driver of cost pressures.
• WagesgrewsubstantiallyfasterinWA compared with Australia over thecourse of the resources boom, withannual wage inflation of 3% in 2003rising to 6.3% by 2008.
• Annualwageinflationiscurrentlyrunning at around 4% for WA,compared with 3.5% nationally.
• Theincreaseinnominalwagesformining in WA is highest across allindustry sectors, increasing by 61.5%between 2003 and 2014.
• Wagesintheutilitiessector(electricity, gas, water and waste) haverisen 57.7% since 2003, followed bythe construction sector (up 56.2%).
• Theutilitiessector(electricity,gas,water and waste) paid an average ofaround $98,643 per worker - a realincrease of 8.3% on 2007-08 figures.
viii

• ReallabourcostsperworkerinWAmining have risen from $145,400 to$161,600 since 2007-08, an increaseof 11.1%.
• WAhasseenparticularlylargeincreases in real costs per employeesince 2007-8 in public administration(up 44.1%, more than doublethe national sector increase) andconstruction (up 38.2%, also doublethe national increase).
• Theratiooftotalemployeecoststocompany sales and service incomerepresents the number of cents inemployee costs for a dollar of companyincome.
• TheWAwholesaletradeindustryhasthe lowest labour costs per dollar ofcompany income - an average of 6.3cents per dollar in 2013-14.
• Inmining,labourcostsrunataround10.2 cents per dollar of income, drivenby a combination of highly productivecapital and a strong, well-remuneratedskills base.
• Thelabourcostperdollarofincomeearned by businesses is lower in WAcompared to Australia in mining(by 16%), manufacturing (by 22%)and agriculture (by 13%), despitethere being a higher average wageper employee in these sectors in WAcompared to national rates.
Taxation Costs on Companies• Australia’s2.1millionbusinessespaid
around $70.5bn nationally in companytax in 2013-14, equivalent to anaverage of $33,592 per business.
• PayrolltaxrevenuesforWAwillamount to $3.74bn, equivalent to anaverage of $17,142 for each registeredbusiness in the state.
• PayrolltaxrevenuesinWAhaveincreased as a proportion of total statetax revenue over the last decade, risingfrom 26.1% in 2005-06 to some 40.5%on latest projections for 2015-16.
• Asat1July2015,WestAustralianbusinesses are currently taxed at asingle rate of 5.5% beyond a thresholdof $800,000 in total payroll costs netof exemptions.
• WA rankshighestin payroll tax costs for businesses with payrolls of between $1.75m and $7.5m, and equal highest up to $9.4m.
• Payrolltaxthresholdshavenotbeenuprated in line with wage inflation inWA, leading to payroll tax “bracketcreep”.
• Thishaseffectivelybroughtmoresmallbusinesses into the payroll tax systemover time.
• FortheWApayrolltaxsystemtohaveremained neutral over the last decadewould have required the July 2015threshold to be nearly $1,100,000,37.5% higher than the currentthreshold of $800,000.
• Thediminishingpayrolltaxthresholdintroduced in the 2015 state budgetwill increase WA payroll taxes by up to$44,000.
• Abusinesswitha$2mpayrollwill see payroll tax rise by $7,881, from$66,000 to $73,881.
• Businesseswitha$4mpayrollwillpay$21,015 more in payroll tax under the new system – $197,015 compared with$176,000.
9
ix
The CosTs of Doing Business in WA Pressures and barriers to industry performance

Capital Composition and Growth • Generally,costsassociatedwithcapital
depreciation and capital formation(interest expenses) are around 20% oftotal expenditure among businesses.
• Alargedegreeofvariationexiststhroughout industries, with capitalexpenditure for the mining, electricity,gas and water and financial andinsurance services relatively moredominant than in other industries.
• CapitalexpenditurecomponentsamongAustralian businesses has been changingover the last five years, away from plant,machinery and equipment towardsdwelling, buildings and other structures.
• Plant,machineryandequipmentconstituted around 50% of capitalexpenditure in 2008-09, this has sincefallen to 35% of expenditure.
• In2013-14,thestatesmostdominantindustry – mining had the highestproportion of capital expenditureallocated to dwellings, buildings andother structures – around 70% of allcapital spend.
• Fixedcapitalformationintheminingsector has increased by almost 700%,between 2005 and 2013.
Barriers to Finance and Working Capital• Smalltomediumenterprisesaremore
like to report lack of access to funds andinadequate working capital (outstandingaccounts receivable) as a significantbarrier to business activity than largebusinesses.
• Between2007-08and2010-11,businesses have increased their reportsof lack of access to additional funds andworking capital as a significant barrier tobusiness performance and activities.
• Almost1in4businessesintheminingand retail sector report lack of accessto funds as a significant barrier tobusiness performance.
• Businessesoperatinginthewholesaletrade sector and manufacturing sectorhave the highest rates of reportsof outstanding accounts receivablelimiting cash flow – 22.6%.
• Around1in5businessesoperatinginthe construction sector report issueswith working capital as a significantbarrier.
Utilities• Perthtotalutilityprices(includinggas,
electricity and water) have remainedconsistently below the nationalaverage over the last decade.
• ThepriceofelectricityinPerthhasincreased almost doubled between2008 and 2014.
• Electricitytariffsformediumsizebusinesses increased by 29% between2011 and 2012.
• TheconsumerpriceofgasinPerthwas almost equal to Australia prior tothe 2008 gas crisis. since 2008 gasprices have increased considerablyand continues to be volatile and abovenational levels.
Occupancy and Housing• Commercialrentsforofficeand
retail spaces, workshops and otherplaces of business operations canbe a substantial cost component formany businesses, particularly thoseoperating in the retail industry.
• Averageweekly rentalreturnsforPerthCBD office space has almost doubled in the four years to 2012, increasing from$250 to $470 per square metre.
x

9
xi
The CosTs of Doing Business in WA Pressures and barriers to industry performance
• PerthCBDofficespacerentswerethehighest among the five capitals in2011 and 2012.
• Housingcanbeanimportantfactorwhen attracting skilled workers toan area. it can also play a role inremuneration packages, inflatingwages and increasing business costs.
• HousingpriceshaveincreasedinWAata rate consistently above the nationalaverage for an extended period from2003-04.
• Therateofchangeinestablishedhouse prices in Perth was especiallyhigh over the boom period with annualpercentage changes well in excess of 20% not uncommon.
Transport• Overthefiveyearperiodfrom2009,
the number of Passenger vehicles andLight Commercial vehicles registeredwith diesel fuel increased by 103.6%and 65.4% respectively.
• Unleadedanddieselfuelpriceshavefollowed a similar pattern over time,increasing prior to the gfC beforefalling rapidly and increasing since.
• WAhasthethirdhighestdieselfuelprice across all states and territories.
• NTandTasmaniahavethehighestprice per litre of diesel and unleadedfuel.
Red Tape and Regulations• Governmentregulationandcompliance
was more likely to be cited as a barrierto performance as the economy grewrapidly. since the global financial crisisthis has decreased among all firms atsimilar rates, with other barriers morelikely to become problematic.
• In2009-10,18%ofinnovation-activebusinesses reported governmentregulation and compliance as a barrierto performance, whereas only 11%of non-innovation active businessesreported this issue.
• Smalltomediumenterprisesaremore likely to report regulation andcompliance as a significant barrier toperformance than big businesses.
• 17.9%ofbusinessesoperatinginthemining sector reported governmentregulation being a significant barrier tobusiness performance in 2012-13.
WA Regions – business profile • TheprofileofWAbusinessesatastate
level can mask important regionalpatterns.
• ThedominanceofthePerthmetropolitan area is clear, with three-quarters of all Western Australianbusinesses located in this region –162,495 entities.
• Miningdominantareas,includinggoldfields-esperance, the Pilbara,Kimberley and gascoyne have higherproportions of businesses employingmore than 200 employees.
• TheGascoyneregionhasthelowestnumber of actively trading businesses– just under 1,000 entities.
• TheGoldfields-Esperanceregionhasthe highest proportion of employingbusinesses – at 46%
• TheGoldfields-Esperance,Kimberleyand Pilbara regions all have greaterproportions of businesses with annualturnover of $2 million or more – 11%compared with the state average of 7%.

xii
• The2011-12to2012-13periodstands out for Western Australianregions, with almost all experiencinga reduction in the number of activelytrading businesses over the period.
WA Regions – costs• Theexpansiveandremotegeography
of the state can make businessoperations more challenging thanmight otherwise be the case in areasthroughout WA.
• WagesinthePilbarahavegrownthefastest, increasing by 60 % in the tenyears to 2013-14, from an averageannual wage of $58,000 to $93,000.
• AnnualwagesforPerthandPeelhavetracked closely together over the lastten years, with wages also increasingby 60 % in the last decade, fromaround $40,000 to $64,000.
• TheGoldfields-Esperanceregionhasseen substantial wage growth acrossthe period, with employees averagingthe second highest wages in the state –around $69,000 each year.
• ThePilbaraandPerthhaverecordedthe highest sale price per square metrefor retail space in the last two periods,averaging $6,340 and $5,920 persquare metre, respectively.
• Increasesinthepriceofcommercialspace in all property classifications isevident across all WA regions.
• Generallyhousingpriceshaveremained lower than Perth throughoutall years and most WA regions.notable exceptions are the usualsuspects – the Pilbara, Kimberley andmore recently the gascoyne regions.
• In2011,housingcostsintheKimberley were double that of Perth,but have since dropped back to around40 % higher than the state capital.
• RemoteareasincludingtheKimberley,Pilbara and gascoyne have experiencedhigher transport costs compared toPerth.
• ElectricitytariffsinWA’sregionalareas have largely remained similarwhen compared to metropolitanWA. Recently, regional areas haveexperienced higher electricity prices(tariffs) than those in metro areas.
• TransportpricesinthePilbarahaveremained persistently higher thanPerth – at around 12 %.
• AllWAregionsrecordhigheraveragefuel prices per litre compared to Perthover the last fifteen years.
• ThecostofalitreofdieselintheKimberley is 17 cents higher than inPerth.

11
1
The CosTs of Doing Business in WA Pressures and barriers to industry performance
Introduction
The cost of doing business in Western Australia has long been a rhetoric heard and discussed throughout the state and beyond. excessively high business costs can hamper growth and productivity, making it difficult for existing and incumbent firms to realise their full potential.
increased economic activity in recent times, has no doubt exacerbated the cost of business as an issue, especially as the race to capitalise on Western Australia’s resources and to further develop the state intensified. The geography of the state, with its capital – Perth, one of the most isolated cities on earth, together with the majority of its land area classified as ‘remote’ or ‘very remote’ also adds to cost pressures.
This fourth Bankwest Curtin Economics Centre (BCEC) Focus on Western Australia report addresses an issue of central importance to Western Australia in maintaining its economic growth story – the cost of doing business in the state. The report examines the principal business cost components facing companies across different industry sectors in WA.
There are a number of key questions relating to the business cost burdens faced by West Australian companies. What are the key cost components for companies in WA, and how have these costs varied over time and across sectors? Are there specific cost factors that affect WA companies to a greater extent than in the rest of Australia? Are there regional differences in the costs of doing business in WA?
The report sheds light on the main barriers to business activities and performance cited by companies in different industry sectors – including skills shortages and labour costs, input costs, and burdens of regulation or compliance – and look at those barriers that particularly affect the activities, growth or survival of businesses in the state.
Scope and limitationsA diversity of cost structures among Australian businesses exist, each with their own unique structure that reflects their type of business and how they conduct business. some of these costs may be considered excessive, however often require contextualisation by the revenue a firm receives (Productivity Commission, 2014). We recognise that particular costs and aspects of conducting business for certain industries and sub-industries are likely to be more prominent than others. notwithstanding this, there exists similarities in business cost structures and pressures that operate in industries throughout Western Australia. Costs that are common to most businesses include labour, capital, intermediate inputs such as transport and utilities; taxes and regulation and compliance. it is these cost components and pressures that we focus on in this report. A number of limitations exist around observing and measuring business costs, particularly at a state and regional level. Where data gaps exist, industry level information has been substituted, particularly for those industries that play a dominant role in Western Australia’s economy.


WAbusiness profile

WA business profile
6
97% of actively trading businesses in Western Australia are small businesses.
in this section we explore the profile of Western Australian businesses and how these differ to businesses in other states and territories and nationally. industry make-upandemploymentandturnoversizeareanalysed.TherelativehealthofWesternAustralian businesses, including business entries and exits and survival rates are also assessed. The cost structures of industries throughout Australia is also presented.
SizeLike most states and territories, business counts in Western Australian are dominated by the small business sector. small businesses account for almost 97 per cent of all actively trading businesses, the majority of which are non-employing (62.0%). Those employing 1-4 workers, ‘micro-businesses’ constitute almost one in five businesses inWA,followedbythoseclassifiedas‘small’–around10percent.Mediumsizedbusinesses that employ between 20 and 199 workers number 6,782 businesses (3.1 per cent) and large businesses employing 200 or more workers account for 0.2 per cent of all businesses (4,376 entities).
Figure 1 Proportion of actively trading businesses in Western Australia by employment size, 2014
source: BANKWEST CURTIN ECONOMICS CENTRE | ABS Cat no. 81650 Counts of Australian Businesses, Jun 2010 to Jun 2014 .
200+
20-1995-19employees
1-4employees
Nonemploying

Western Australia has around 2.5 million residents, which is slightly more than one-tenthoftheAustralianpopulation.Proportionallytopopulationsize,thenumber of business in WA is about one-tenth of businesses nation-wide, numbering almost 219,000 entities with an Australian Business number (Table 1). Compared to other states and territories, Western Australia’s distribution of businesses by employmentsizeisgenerallysimilar.Thestatehasahigherproportionofbusinessesemploying 20-199 workers (3.1%), compared to the national average of 2.5 per cent.TheNorthernTerritoryalsohasahigherproportionofmediumsizebusinesses–constituting 4.1 per cent of all businesses. WA has a smaller proportion of microbusinesses (employing 1-4 workers) compared to the national average – 24.8 per cent compared to 27.2 per cent.
Assessingbusinesssizethroughannualturnover,thedominanceofnon-employingentities is revealed with around 1 in 4 businesses having less than $50,000 per year in turnover and 16 per cent between $50,000 and $100,000 (figure 2). Around 20 per cent of businesses reported an annual turnover between $200,000 - $500,000 in 2014, and similar proportions reported $100,000 to $200,000. Around 23 per cent of businesses in Western Australia report an annual turnover above half a million dollars.
15
7
WA has almost 219,000 actively trading businesses. This constitutes around 10% of all Australian businesses.
The CosTs of Doing Business in WA Pressures and barriers to industry performance
Region non employing 1-4 5-19 20-199 200+ Total (‘000)
Australia 60.7% 27.2% 9.5% 2.5% 0.2% 2100.1
nsW 58.7% 29.5% 9.3% 2.3% 0.2% 697.2
ViC 61.0% 27.4% 9.1% 2.3% 0.2% 545.9
QLD 61.4% 26.1% 9.8% 2.6% 0.2% 416.7
sA 65.0% 22.8% 9.7% 2.3% 0.1% 143.5
WA 62.0% 24.8% 9.9% 3.1% 0.2% 218.8
TAs 59.6% 25.5% 12.2% 2.6% 0.1% 36.9
nT 58.9% 23.6% 13.2% 4.1% 0.2% 14.3
ACT 57.2% 28.0% 11.5% 3.0% 0.2% 25.3
source: BANKWEST CURTIN ECONOMICS CENTRE | ABS Cat no. 81650 Counts of Australian Businesses, Jun 2010 to Jun 2014.
Table 1 Proportion of business by employment size, by state and territory, June 2014

Size
8
One in four Western Australian businesses report annual turnover of less than $50,000.
Comparing annual turnover of Western Australia businesses to other states and territories, WA has relatively more companies with annual turnover above $2m, and less small businesses with less than $50k annual turnover (Table 2). in 2014 7.7 per cent of WA businesses reported annual turnover exceeding $2 million, whereas the Australian average is 6.4 per cent. Tasmania and south Australia have the lowest proportion of companies with large annual turnover. The ACT has the second highest proportion of businesses with $2m plus turnover – 6.9 per cent.
Figure 2 Proportion of actively trading businesses in Western Australia by employment size and turnover, 2014
source: BANKWEST CURTIN ECONOMICS CENTRE | ABS Cat no. 81650 Counts of Australian Businesses, Jun 2010 to Jun 2014.
$2m or more8%
$500k to lessthan $2m
15%
$200k to lessthan $500k
19%
$100k to lessthan $200k
18%
$50k to lessthan $100k
16%
Zero to $500k24%
Region Zero to $50k$50k to less than $100k
$100k to less than
$200K
$200k to less than
$500k
$500k to less than
$2m$2m
or more
Australia 26.7% 16.6% 17.7% 18.6% 14.0% 6.4%
nsW 26.7% 17.1% 17.5% 18.6% 13.6% 6.5%
ViC 27.2% 16.9% 17.8% 18.3% 13.6% 6.2%
QLD 26.5% 15.9% 17.9% 19.2% 14.5% 6.1%
sA 28.7% 16.7% 17.2% 17.6% 14.0% 5.7%
WA 24.6% 16.0% 17.6% 19.0% 15.2% 7.7%
TAs 27.8% 16.5% 16.9% 18.6% 14.5% 5.6%
nT 21.8% 14.9% 17.4% 19.1% 17.5% 9.3%
ACT 24.7% 14.5% 18.0% 19.7% 16.2% 6.9%
source: BANKWEST CURTIN ECONOMICS CENTRE | ABS Cat no. 81650 Counts of Australian Businesses, Jun 2010 to Jun 2014.
Table 2 Proportion of business by annual turnover size by state and territory, June 2014

Industry
While the dominance of businesses within certain industries is important in terms of their absolute counts, it is also a useful exercise to understand the relative importance of these industries taking into account the extent to which they employ workers and their overall economic value to the state. Table 3 shows the rankings of industries by business counts, employment and economic value in Western Australia in 2014.
Construction is clearly one of the most important industries within the state, ranking first in business counts, third in the number of people employed in the sector and second in terms of its economic value that it brings to the state. Professional, scientific and technical services also ranks highly on all three metrics. on the other hand rental, hiring and real estate services, whilst ranked third in overall business counts, employs a smaller number of people in the state than other industries (ranking 16th out of 19). This sector is also ranked relative low in terms of the economic value it contributes to the state – 14th. The states persistent number one contributor to economic value – the mining sector ranks 14th in terms of absolute business counts, but 4th when taking into account the volume of workers it employs. health care and social assistance is ranked first in terms of employment, sixth in its economic value and 8th in the number of active businesses. Agriculture, forestry and fishing has a high volume of business entities that falls within this sector (ranking 5th) yet is ranked second last in terms of economic value and 14th in the number of employees in the industry.
17
9
Construction ranks 1st in terms of business counts, 3rd in employment and 2nd in terms of the economic value that it brings to WA.
The CosTs of Doing Business in WA Pressures and barriers to industry performance
industryBusiness counts
number employed
economic value
Business counts
number employed
economic value
no. no. $ (m) Rank
Accommodation and food services 7,858 71,760 3,265 11 9 16
Administrative and support services 7,728 48,124 7,565 12 12 8
Agriculture, forestry and fishing 17,818 34,015 3,252 5 14 17
Arts and recreation services 2,235 22,556 971 16 17 19
Construction 40,080 130,499 31,303 1 3 2
education and training 2,344 98,236 7,061 15 6 10
electricity, gas, water and waste services 701 22,132 5,141 19 18 13
financial and insurance services 18,591 32,848 7,463 4 15 9
health care and social assistance 10,427 140,624 10,928 8 1 6
information media and telecommunications 1,421 15,800 3,006 17 19 18
Manufacturing 8,977 91,546 12,099 10 7 4
Mining 2,999 114,600 70,867 14 4 1
other services 9,437 53,739 3,309 9 11 15
Professional, scientific and technical services 25,708 102,761 13,152 2 5 3
Public administration and safety 714 72,944 6,900 18 8 11
Rental, hiring and real estate services 23,181 23,272 4,246 3 16 14
Retail trade 13,096 136,622 8,483 7 2 7
Transport, postal and warehousing 13,837 64,003 11,586 6 10 5
Wholesale trade 6,730 41,806 6,077 13 13 12
note: Industries are ANZSIC is 1-digit level. Economic value is measured as industry gross value added (IGVA).source: BANKWEST CURTIN ECONOMICS CENTRE | ABS Cat no. 81650 Counts of Australian Businesses, Jun 2010 to Jun 2014, ABS Cat No. 5220.0 Australian
National Accounts: State Accounts and ABS Cat No. 6291.0.55.003. Labour Force, Australia, Detailed, Quarterly.
Table 3 Ranking of WA industries by business counts, employment and economic value
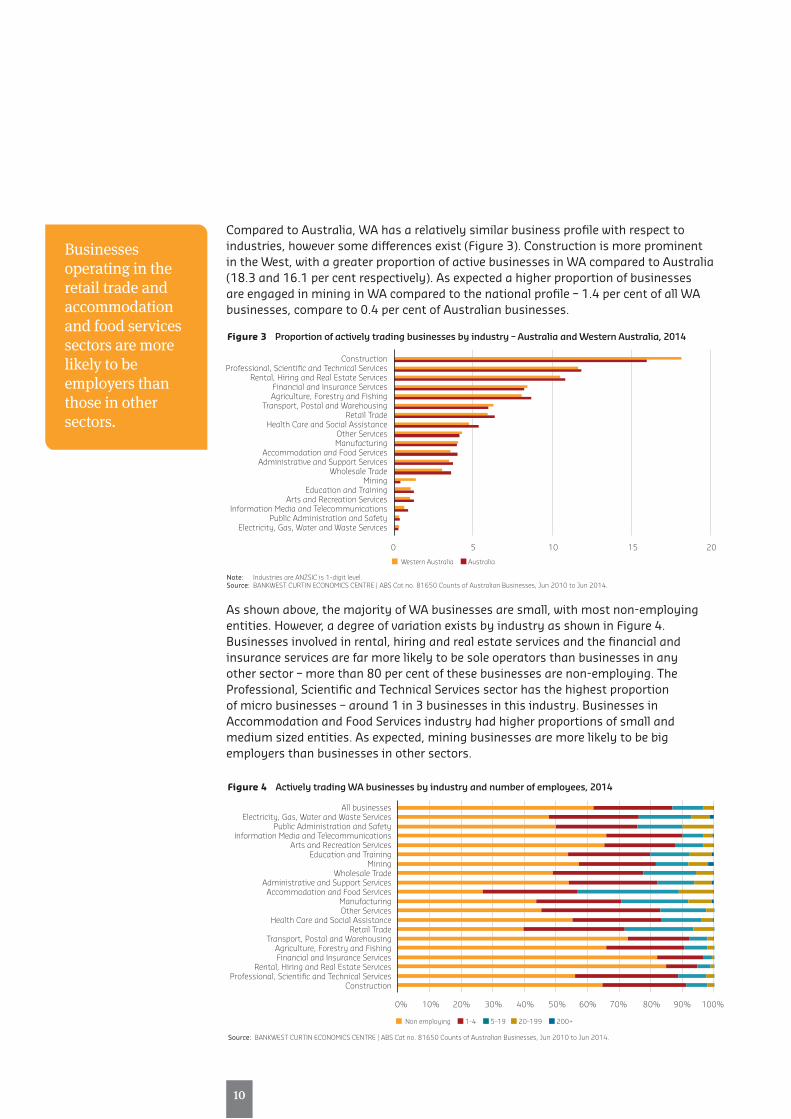
Compared to Australia, WA has a relatively similar business profile with respect to industries, however some differences exist (figure 3). Construction is more prominent in the West, with a greater proportion of active businesses in WA compared to Australia (18.3 and 16.1 per cent respectively). As expected a higher proportion of businesses are engaged in mining in WA compared to the national profile – 1.4 per cent of all WA businesses, compare to 0.4 per cent of Australian businesses.
As shown above, the majority of WA businesses are small, with most non-employing entities. however, a degree of variation exists by industry as shown in figure 4. Businesses involved in rental, hiring and real estate services and the financial and insurance services are far more likely to be sole operators than businesses in any other sector – more than 80 per cent of these businesses are non-employing. The Professional, scientific and Technical services sector has the highest proportion of micro businesses – around 1 in 3 businesses in this industry. Businesses in Accommodation and food services industry had higher proportions of small and mediumsizedentities.Asexpected,miningbusinessesaremorelikelytobebigemployers than businesses in other sectors.
10
Businesses operating in the retail trade and accommodation and food services sectors are more likely to be employers than those in other sectors.
Figure 3 Proportion of actively trading businesses by industry – Australia and Western Australia, 2014
note: Industries are ANZSIC is 1-digit level. source: BANKWEST CURTIN ECONOMICS CENTRE | ABS Cat no. 81650 Counts of Australian Businesses, Jun 2010 to Jun 2014.
Western Australia Australia
ConstructionProfessional, Scientific and Technical Services
Rental, Hiring and Real Estate ServicesFinancial and Insurance ServicesAgriculture, Forestry and Fishing
Transport, Postal and WarehousingRetail Trade
Health Care and Social AssistanceOther ServicesManufacturing
Accommodation and Food ServicesAdministrative and Support Services
Wholesale TradeMining
Education and TrainingArts and Recreation Services
Information Media and TelecommunicationsPublic Administration and Safety
Electricity, Gas, Water and Waste Services
0 5 10 15 20
Figure 4 Actively trading WA businesses by industry and number of employees, 2014
source: BANKWEST CURTIN ECONOMICS CENTRE | ABS Cat no. 81650 Counts of Australian Businesses, Jun 2010 to Jun 2014.
Non employing 1-4 5-19 20-199 200+
All businessesElectricity, Gas, Water and Waste Services
Public Administration and SafetyInformation Media and Telecommunications
Arts and Recreation ServicesEducation and Training
MiningWholesale Trade
Administrative and Support ServicesAccommodation and Food Services
ManufacturingOther Services
Health Care and Social AssistanceRetail Trade
Transport, Postal and WarehousingAgriculture, Forestry and FishingFinancial and Insurance Services
Rental, Hiring and Real Estate ServicesProfessional, Scientific and Technical Services
Construction
0% 10% 20% 30% 40% 50% 60% 70% 80% 90% 100%

Changes over time
19
11
The CosTs of Doing Business in WA Pressures and barriers to industry performance
over the last ten years, the profile of businesses operating in Western Australia has seen some changes, particularly during and after the global financial Crisis. generally, the pattern of the number of active businesses in WA has followed national trends. The number of businesses with less than $50,000 per year in annual turnover has been decreasing since 2007 for both WA and Australia (figure 5). While these results can be driven by shifts in annual turnover, moving businesses into higher classifications, they are also likely to reflect (to some extent) the impact of the economic downturn. Businesses turning over between $50 and $200k annually have had a bumpy ride over the past decade. for WA, the number of these businesses has been on an upward trajectory since 2003, stagnating as the gfC took hold and declining since, with the last period showing an increase.
on the other hand, the number of businesses with turnover of between $200k to $2m increased rapidly for WA and nationally between 2007 and 2014. The number of WA businesses in this turnover bracket increased by 17 per cent (from 63,981 to 74,889) in this period. for Australia the increase was 14 per cent between 2007 and 2014. The number of businesses with annual turnover of $2 million or more has also increased rapidly during this time for Western Australia, from 12,326 to 16,971 entities – an increase of almost 30 per cent.
Figure 5 Growth of businesses by annual turnover, Western Australia and Australia, 2003 - 2014
note: Dollars are in nominal values.source: BANKWEST CURTIN ECONOMICS CENTRE | ABS Cat no. 81650 Counts of Australian Businesses, Jun 2010 to Jun 2014.
70,00065,00060,00055,00050,00045,00040,00035,000
700,000650,000600,000550,000500,000450,000400,000350,000
Jun
2003
Jun
2004
Jun
2005
Jun
2006
Jun
2007
Jun
2008
Jun
2009
Jun
2010
Jun
2011
Jun
2012
Jun
2013
Jun
2014
Zero to $50k
Western Australia Australia (right axis)
76,000
72,000
68,000
64,000
60,000
760,000
720,000
680,000
640,000
600,000
Jun
2003
Jun
2004
Jun
2005
Jun
2006
Jun
2007
Jun
2008
Jun
2009
Jun
2010
Jun
2011
Jun
2012
Jun
2013
Jun
2014
$200k to less than $2m
Western Australia Australia (right axis)
18,000
16,000
14,000
12,000
10,000
180,000
160,000
140,000
120,000
100,000
Jun
2003
Jun
2004
Jun
2005
Jun
2006
Jun
2007
Jun
2008
Jun
2009
Jun
2010
Jun
2011
Jun
2012
Jun
2013
Jun
2014
$2m or more
Western Australia Australia (right axis)
77,00076,00075,00074,00073,00072,00071,00070,000
770,000760,000750,000740,000730,000720,000710,000700,000
Jun
2003
Jun
2004
Jun
2005
Jun
2006
Jun
2007
Jun
2008
Jun
2009
Jun
2010
Jun
2011
Jun
2012
Jun
2013
Jun
2014
$50k to less than $200k
Western Australia Australia (right axis)
12
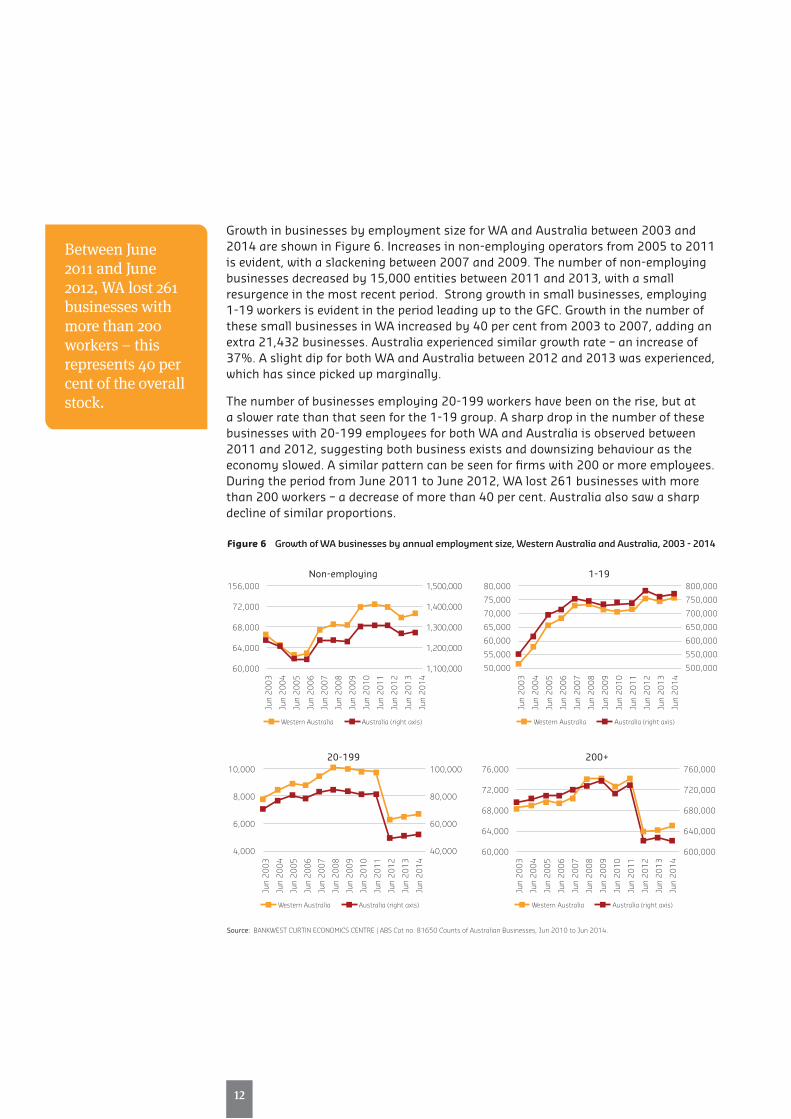
Between June 2011 and June 2012, WA lost 261 businesses with more than 200 workers – this represents 40 per cent of the overall stock.
GrowthinbusinessesbyemploymentsizeforWAandAustraliabetween2003and2014 are shown in figure 6. increases in non-employing operators from 2005 to 2011 is evident, with a slackening between 2007 and 2009. The number of non-employing businesses decreased by 15,000 entities between 2011 and 2013, with a small resurgence in the most recent period. strong growth in small businesses, employing 1-19 workers is evident in the period leading up to the gfC. growth in the number of these small businesses in WA increased by 40 per cent from 2003 to 2007, adding an extra 21,432 businesses. Australia experienced similar growth rate – an increase of 37%. A slight dip for both WA and Australia between 2012 and 2013 was experienced, which has since picked up marginally.
The number of businesses employing 20-199 workers have been on the rise, but at a slower rate than that seen for the 1-19 group. A sharp drop in the number of these businesses with 20-199 employees for both WA and Australia is observed between 2011and2012,suggestingbothbusinessexistsanddownsizingbehaviourastheeconomy slowed. A similar pattern can be seen for firms with 200 or more employees. During the period from June 2011 to June 2012, WA lost 261 businesses with more than 200 workers – a decrease of more than 40 per cent. Australia also saw a sharp decline of similar proportions.
Figure 6 Growth of WA businesses by annual employment size, Western Australia and Australia, 2003 - 2014
source: BANKWEST CURTIN ECONOMICS CENTRE | ABS Cat no. 81650 Counts of Australian Businesses, Jun 2010 to Jun 2014.
76,000
72,000
68,000
64,000
60,000
760,000
720,000
680,000
640,000
600,000
Jun
2003
Jun
2004
Jun
2005
Jun
2006
Jun
2007
Jun
2008
Jun
2009
Jun
2010
Jun
2011
Jun
2012
Jun
2013
Jun
2014
200+
Western Australia Australia (right axis)
10,000
8,000
6,000
4,000
100,000
80,000
60,000
40,000
Jun
2003
Jun
2004
Jun
2005
Jun
2006
Jun
2007
Jun
2008
Jun
2009
Jun
2010
Jun
2011
Jun
2012
Jun
2013
Jun
2014
20-199
Western Australia Australia (right axis)
80,000
75,000
70,000
65,000
60,000
55,000
50,000
800,000
750,000
700,000
650,000
600,000
550,000
500,000
Jun
2003
Jun
2004
Jun
2005
Jun
2006
Jun
2007
Jun
2008
Jun
2009
Jun
2010
Jun
2011
Jun
2012
Jun
2013
Jun
2014
1-19
Western Australia Australia (right axis)
156,000
72,000
68,000
64,000
60,000
1,500,000
1,400,000
1,300,000
1,200,000
1,100,000
Jun
2003
Jun
2004
Jun
2005
Jun
2006
Jun
2007
Jun
2008
Jun
2009
Jun
2010
Jun
2011
Jun
2012
Jun
2013
Jun
2014
non-employing
Western Australia Australia (right axis)
Business entries and exits
21
13
WA experienced a net loss of 11,000 businesses between 2009-10 and 2012-13.
The CosTs of Doing Business in WA Pressures and barriers to industry performance
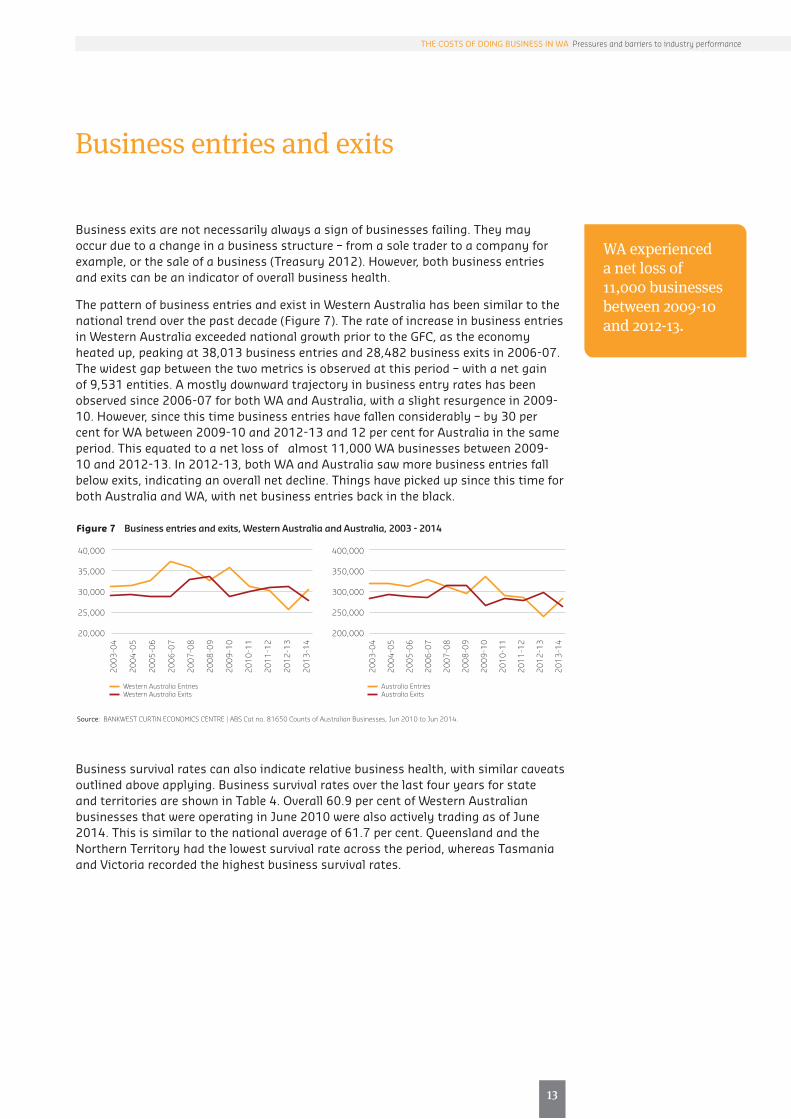
Business exits are not necessarily always a sign of businesses failing. They may occur due to a change in a business structure – from a sole trader to a company for example, or the sale of a business (Treasury 2012). however, both business entries and exits can be an indicator of overall business health.
The pattern of business entries and exist in Western Australia has been similar to the national trend over the past decade (figure 7). The rate of increase in business entries in Western Australia exceeded national growth prior to the gfC, as the economy heated up, peaking at 38,013 business entries and 28,482 business exits in 2006-07. The widest gap between the two metrics is observed at this period – with a net gain of 9,531 entities. A mostly downward trajectory in business entry rates has been observed since 2006-07 for both WA and Australia, with a slight resurgence in 2009-10. however, since this time business entries have fallen considerably – by 30 percent for WA between 2009-10 and 2012-13 and 12 per cent for Australia in the same period. This equated to a net loss of almost 11,000 WA businesses between 2009-10 and 2012-13. in 2012-13, both WA and Australia saw more business entries fall below exits, indicating an overall net decline. Things have picked up since this time for both Australia and WA, with net business entries back in the black.
Business survival rates can also indicate relative business health, with similar caveats outlined above applying. Business survival rates over the last four years for state and territories are shown in Table 4. overall 60.9 per cent of Western Australian businesses that were operating in June 2010 were also actively trading as of June 2014. This is similar to the national average of 61.7 per cent. Queensland and the northern Territory had the lowest survival rate across the period, whereas Tasmania and Victoria recorded the highest business survival rates.
Figure 7 Business entries and exits, Western Australia and Australia, 2003 - 2014
source: BANKWEST CURTIN ECONOMICS CENTRE | ABS Cat no. 81650 Counts of Australian Businesses, Jun 2010 to Jun 2014.
40,000
35,000
30,000
25,000
20,000
2003
-04
2004
-05
2005
-06
2006
-07
2007
-08
2008
-09
2009
-10
2010
-11
2011
-12
2012
-13
2013
-14
Western Australia Entries Western Australia Exits
400,000
350,000
300,000
250,000
200,000
2003
-04
2004
-05
2005
-06
2006
-07
2007
-08
2008
-09
2009
-10
2010
-11
2011
-12
2012
-13
2013
-14
Australia Entries Australia Exits

14
61 per cent of businesses operating at June 2010 were also operating at June 2014.
operating in June 2010
survival rate
June 2011 June 2012 June 2013 June 2014
no. % % % %
new south Wales 704,763 86.4 76.8 68.4 61.7
Victoria 537,262 86.9 77.4 69.3 62.9
Queensland 433,409 85.7 75.3 66.4 59.4
south Australia 148,668 87.9 79 71.1 64.7
Western Australia 220,885 86.5 75.9 67.5 60.9
Tasmania 38,989 88.4 79.6 71.7 65
northern Territory 14,199 85.7 75.6 66.9 59.9
Australian Capital Territory 25,212 85.3 75 65.9 58.9
Australia 2,124,650 86.5 76.7 68.3 61.7
source: BANKWEST CURTIN ECONOMICS CENTRE | ABS Cat no. 81650 Counts of Australian Businesses, Jun 2010 to Jun 2014.
Table 4 Business survival rates by state and territory, June 2010 – June 2014

Cost structure
23
15
The CosTs of Doing Business in WA Pressures and barriers to industry performance
specific data that shows the cost structure of Western Australian businesses are not available, however, industry wide patterns are likely to be similar across state and territories. figure 8 demonstrates the average cost share of industries in terms of labour, capital and intermediate inputs over the last decade. Around 20 per cent of total costs of businesses relates to capital, while firms allocate more than 55 per cent of their cost to buy goods or commodities required for the purpose of production. And labour costs capture one-quarter of total costs across industries.
A degree of cost structure variation exists among industries as illustrated by figure 9. Despite the variation among industries, the cost of intermediate inputs remainsthe most dominant component of cost shares, with the minimum share of 40 per cent in the financial and insurance services industry. The construction industry has the highest reliance on intermediate inputs, which constitutes 69 per cent of the cost structure for businesses in that sector. Labour costs are a significant expense for a number of firms – particular the retail trade and administrative and support services sectors - 41 and 49 per cent respectively. Mining, electricity, gas and water and financial and insurance services have higher proportions of capital in their cost structures compared to other industries.
Figure 8 Cost shares of labour, capital and intermediate inputs – average of all industries
source: BANKWEST CURTIN ECONOMICS CENTRE | ABS Cat no.5260.0.55.002 Estimates of Industry Multifactor Productivity, Australia.
100%
90%
80%
70%
60%
50%
40%
30%
20%
10%
0%
1194
-95
1196
-97
1198
-99
2000
-01
2002
-03
2004
-05
2006
-07
2008
-09
2010
-11
2012
-13
Labour Capital

16
Figure 9 Cost shares of labour, capital and intermediate inputs by industry
source: BANKWEST CURTIN ECONOMICS CENTRE | ABS Cat no.5260.0.55.002 Estimates of Industry Multifactor Productivity, Australia.
100%
90%
80%
70%
60%
50%
40%
30%
20%
10%
0%
Min
ing
Agric
ultu
re, F
ores
try
and
Fish
ing
Man
ufac
turin
g
Info
rmat
ion,
Med
ia a
nd T
elec
omm
unic
atio
ns
Elec
tric
ity,
Gas
, Wat
er a
nd W
aste
Ser
vice
s
Cons
truc
tion
Tran
spor
t, P
osta
l and
War
ehou
sing
Fina
ncia
l and
Insu
ranc
e Se
rvic
es
Rent
al, H
iring
and
Rea
l Est
ate
Serv
ices
Who
lesa
le T
rade
Reta
il Tr
ade
Acco
mm
odat
ion
and
Food
Ser
vice
s
Prof
essi
onal
, Sci
enti
fic a
nd T
echn
ical
Ser
vice
s
Adm
inis
trat
ive
and
Supp
ort
Serv
ices
Arts
and
Rec
reat
ion
Serv
ices
Oth
er S
ervi
ces
Labour Capital
13% 16% 18% 17% 17%23%
26% 25%20%
33%
41%34%
40%
49%
27%
40%
45%
25%
12%
26%33%
9%
15%
36%
25%17%
13%
8% 5%
3%
13%
8%
43% 60% 70% 57% 50% 69% 58% 40% 55% 51% 46% 57% 55% 48% 60% 52%
perceptions
Business
18
More than 4 out of 5 businesses in WA report wages as a key cost pressure.
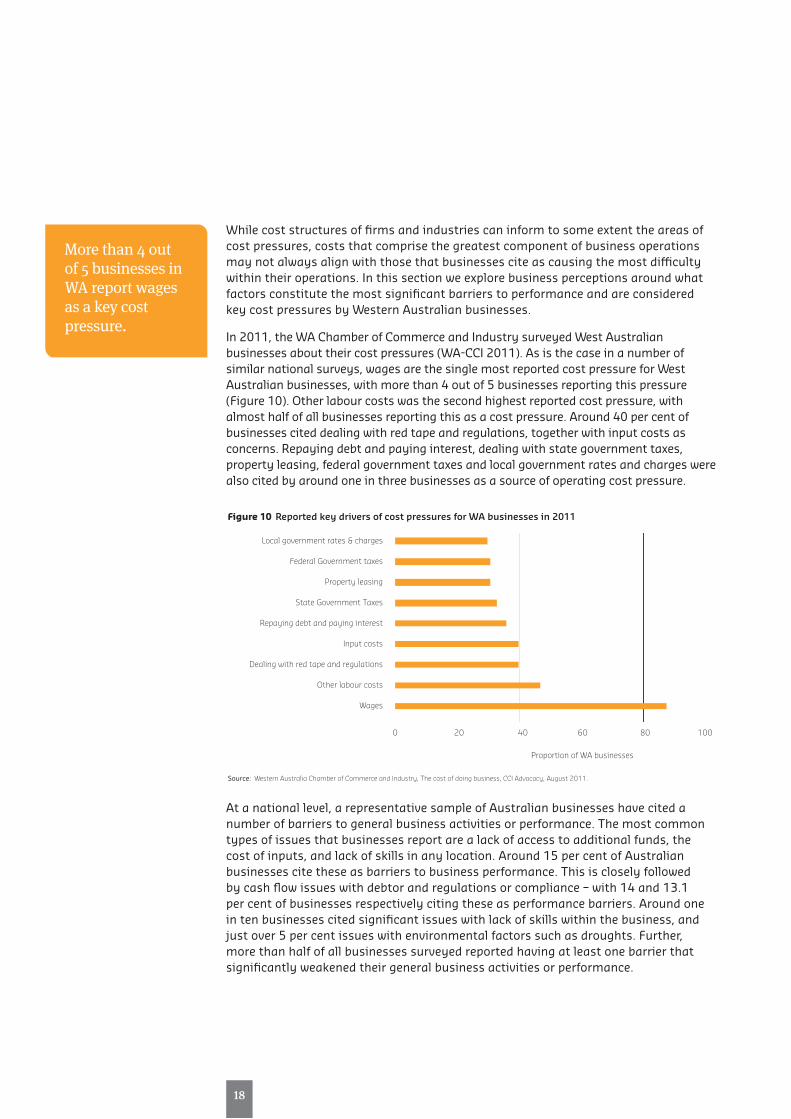
While cost structures of firms and industries can inform to some extent the areas of cost pressures, costs that comprise the greatest component of business operations may not always align with those that businesses cite as causing the most difficulty within their operations. in this section we explore business perceptions around what factors constitute the most significant barriers to performance and are considered key cost pressures by Western Australian businesses.
in 2011, the WA Chamber of Commerce and industry surveyed West Australian businesses about their cost pressures (WA-CCi 2011). As is the case in a number of similar national surveys, wages are the single most reported cost pressure for West Australian businesses, with more than 4 out of 5 businesses reporting this pressure (figure 10). other labour costs was the second highest reported cost pressure, with almost half of all businesses reporting this as a cost pressure. Around 40 per cent of businesses cited dealing with red tape and regulations, together with input costs as concerns. Repaying debt and paying interest, dealing with state government taxes, property leasing, federal government taxes and local government rates and charges were also cited by around one in three businesses as a source of operating cost pressure.
At a national level, a representative sample of Australian businesses have cited a number of barriers to general business activities or performance. The most common types of issues that businesses report are a lack of access to additional funds, the cost of inputs, and lack of skills in any location. Around 15 per cent of Australian businesses cite these as barriers to business performance. This is closely followed by cash flow issues with debtor and regulations or compliance – with 14 and 13.1 per cent of businesses respectively citing these as performance barriers. Around one in ten businesses cited significant issues with lack of skills within the business, and just over 5 per cent issues with environmental factors such as droughts. further, more than half of all businesses surveyed reported having at least one barrier that significantly weakened their general business activities or performance.
Figure 10 Reported key drivers of cost pressures for WA businesses in 2011
source: Western Australia Chamber of Commerce and Industry, The cost of doing business, CCI Advocacy, August 2011.
0 20 40 60 80 100
Proportion of WA businesses
Local government rates & charges
Federal Government taxes
Property leasing
State Government Taxes
Repaying debt and paying interest
Input costs
Dealing with red tape and regulations
Other labour costs
Wages

27
19
In 2006-07, a period when the economy was booming, more than 1 in 4 businesses reported lack of skills in any location as a significant barrier – by 2012-13 thishad reduced to 15.6 per cent.
The CosTs of Doing Business in WA Pressures and barriers to industry performance
A number of reported significant barriers to business activities and performance have changed over the period between 2006-07 and 2012-13 (figure 12). A similar reduction is observed for businesses reporting lack of skills within the business as a significant barrier to performance – from 15.6 per cent in 2006-07 to 9.6 per cent in 2012-13. environmental factors as a significant barrier have also reduced substantially, halving between the two periods, from 11.2 per cent to 5.3 per cent. This is likely to reflect the impact of the Millennium drought, with 2006 one of the driest years on record throughout Australia. By 2012-13, the drought had broken in most areas across Australia.
similar proportions of businesses reported significant barriers stemming from cash flow problems across the two periods. A slightly higher proportion of businesses reported barriers in performance due to regulations or compliance and costs of inputs in 2012-13 compared with 2006-07.
Figure 11 Barriers to general business activities or performance, 2012-13
note: Businesses were asked to identify barriers that significantly hampered general business activities or performance. source: BANKWEST CURTIN ECONOMICS CENTRE | ABS Cat No. 8167.0 Selected Characteristics of Australian Business, 2012-13,
Table 1, Barriers to general business activities or performance.
40
30
20
10
0
Lack of access to funds
Environmentalfactors
Regulations orcompliance
Skills in anylocation
Cost of inputs
Cash flow from debtors
Skills within the business
All businesses 2012-13

20
One if five businesses in the construction sector report outstanding accounts as a significant barrier to business activity and performance.
Reported barriers to business performance and activity can vary substantially by industry, as demonstrated in figure 13. Businesses operating in Western Australia’s most prominent industry in terms of economic value to the state – mining, were more likely to report lack of access to funds and regulation and compliance as significant barriers to business activities and performance – 24 and 18 per cent respectively.
Businesses operating in the state’s second highest contributor to both economic output and employment – the construction sector, frequently cite ‘being paid’ or cash flows from debtors as the most significant barrier to activity and performance. Construction is also the sector with the largest number of businesses operating within Western Australia – numbering more than 40,000 entities, the majority of which are sole traders or small businesses.
The retail sector, which is the biggest employer in Western Australia, ranking seventh in terms of economic contribution to the state and numbering just over 13,000 businesses across the state, is more likely to experience difficulties with accessing funds, the costs of inputs and a lack of skills in any location.
Figure 12 Barriers to general business activities or performance, 2006-07 to 2012-13
note: Businesses were asked to identify barriers that significantly hampered general business activities or performance. source: BANKWEST CURTIN ECONOMICS CENTRE| ABS Cat No. 8167.0 Selected Characteristics of Australian Business, 2012-13,
Table 1, Barriers to general business activities or performance.
0 5 10 15 20 25 30
Environmental factors
Regulations or compliance
Skills in any location
Skills within the business
Cash flow from debtors
Cost of inputs
Lack of access to funds
11.25.3
2006-07 2012-13
11.813.1
26.215.6
15.69.6
14.914
13.915.1
16.515.4

29
21
The CosTs of Doing Business in WA Pressures and barriers to industry performance
Figure 13 Barriers to general business activities or performance, by industry, 2012-13
note: Businesses were asked to identify barriers that significantly hampered general business activities or performance. source: BANKWEST CURTIN ECONOMICS CENTRE| ABS Cat No. 8167.0 Selected Characteristics of Australian Business, 2012-13,
Table 1, Barriers to general business activities or performance.
Lack of access to funds
Lack of access to funds
Lack of access to funds
Lack of access to funds
Lack of access to funds
Lack of access to funds
Environmentalfactors
Environmentalfactors
Environmentalfactors
Environmentalfactors
Environmentalfactors
Environmentalfactors
Regulations orcompliance
Regulations orcompliance
Regulations orcompliance
Regulations orcompliance
Regulations orcompliance
Regulations orcompliance
Skills in anylocation
Skills in anylocation
Skills in anylocation
Skills in anylocation
Skills in anylocation
Skills in anylocation
Cost of inputs Cost of inputs
Cost of inputs Cost of inputs
Cost of inputs Cost of inputs
Cash flow from debtors
Cash flow from debtors
Cash flow from debtors
Cash flow from debtors
Cash flow from debtors
Cash flow from debtors
Skills within the business
Skills within the business
Skills within the business
Skills within the business
Skills within the business
Skills within the business
Agriculture, Forestry and Fishing
All business 2012-13
Mining
All business 2012-13
Manufacturing
All business 2012-13
Electricity, Gas, Water and Waste Services
All business 2012-13
Construction
All business 2012-13
Wholesale Trade
All business 2012-13
40
30
20
10
0
40
30
20
10
0
40
30
20
10
0
40
30
20
10
0
40
30
20
10
0
40
30
20
10
0

22
Lack of access to funds
Lack of access to funds
Lack of access to funds
Lack of access to funds
Lack of access to funds
Lack of access to funds
Environmentalfactors
Environmentalfactors
Environmentalfactors
Environmentalfactors
Environmentalfactors
Environmentalfactors
Regulations orcompliance
Regulations orcompliance
Regulations orcompliance
Regulations orcompliance
Regulations orcompliance
Regulations orcompliance
Skills in anylocation
Skills in anylocation
Skills in anylocation
Skills in anylocation
Skills in anylocation
Skills in anylocation
Cost of inputs Cost of inputs
Cost of inputs Cost of inputs
Cost of inputs Cost of inputs
Cash flow from debtors
Cash flow from debtors
Cash flow from debtors
Cash flow from debtors
Cash flow from debtors
Cash flow from debtors
Skills within the business
Skills within the business
Skills within the business
Skills within the business
Skills within the business
Skills within the business
Retail Trade
All business 2012-13
Accommodation and Food Services
All business 2012-13
Transport, Postal and Warehousing
All business 2012-13
Information Media and Telecommunications
All business 2012-13
Financial and Insurance Services
All business 2012-13
Rental, Hiring and Real Estate Services
All business 2012-13
40
30
20
10
0
40
30
20
10
0
40
30
20
10
0
40
30
20
10
0
40
30
20
10
0
40
30
20
10
0

31
23
The CosTs of Doing Business in WA Pressures and barriers to industry performance
Lack of access to funds
Lack of access to funds
Lack of access to funds
Lack of access to funds
Environmentalfactors
Environmentalfactors
Environmentalfactors
Environmentalfactors
Regulations orcompliance
Regulations orcompliance
Regulations orcompliance
Regulations orcompliance
Skills in anylocation
Skills in anylocation
Skills in anylocation
Skills in anylocation
Cost of inputs Cost of inputs
Cost of inputs Cost of inputs
Cash flow from debtors
Cash flow from debtors
Cash flow from debtors
Cash flow from debtors
Skills within the business
Skills within the business
Skills within the business
Skills within the business
Professional, Scientific and Technical Services
All business 2012-13
Administrative and Support Services
All business 2012-13
Health Care and Social Assistance
All business 2012-13
Arts and Recreation Services
All business 2012-13
40
30
20
10
0
40
30
20
10
0
40
30
20
10
0
40
30
20
10
0

Labourcosts

Introduction
Labour is one of the most significant single business operating expenses for many businesses in Australia. overall, employment costs represent around 25% of the total costs of running a business on average, but with wide variation across industry sectors. The analysis of cost structures in figure 9 shows the contrast between labour cost shares, from 14% for mining to 50% for administrative and support services.
A recent CCi-WA survey reported that 88% of businesses highlighted wages as a key driver of cost pressures, with the second highest being ‘other labour costs’. Yet employees are a driving force in economic growth and prosperity in the state, and the labour market should provide appropriate remuneration for worker skills and productivity. increases in the real cost per employee in WA should not be attributed simply to labour becoming more expensive. in a well-functioning market, wage and salary awards should rise in line with the benefits to businesses from increased labour productivity. Productivity improvements and changes over time and across industries in the compositional mix of skills and seniority can provide a perfectly reasonable explanation for labour cost increases.
Acknowledgingthecontributionoflabourtoeconomicactivity,andrecognizingtheneedforatleastsomeattemptat‘standardizing’labourcostmeasuresforskillsandexperience, the ABs has constructed a Wage Price index (WPi). The index seeks to quantifythecostsofastandardized‘bundle’oflabour(inthesamewaythatcostoflivingmeasuresstandardizeaconsumptionbundle).TheWPIisreleasedquarterlybythe ABs, and presents wage cost measures broken down by industry, and by states and territories1.
26
1 See Table 2.

Wage costs over time
35
27
2 The underlying WPI measure is available at Abs Cat. 6345.0 (Wage Price Index, Australia), and the index is standardized to 100 as at 2009. Hence, the measure is useful in a relative sense, but not as an absolute indicator of wage price costs at any point in time.
The CosTs of Doing Business in WA Pressures and barriers to industry performance
Taking a broad view of the relative change in employment costs in WA compared with national trends, figure 14 shows annual wage price inflation for WA and Australia from 2001 and 2014 using the WPi index2, as well as the percentage point difference in the two series (shown as bars and measured against the right hand scale).
These trends show a clear increase in employment costs in WA compared with Australia, from around 3 per cent annually at the start of the millennium (similar to national figures) to 6.3 per cent by 2008 (compared with 4.6 per cent for Australia overall). This represented a rate of wage inflation nearly 1.8 percentage points higher than the national average by the start of the gfC. Although wage costs rose more steeply in WA over the heat of the resources boom, the post-gfC decline for the state was also more severe – dropping fully 2.1 percentage points to 4.2 per cent by 2010, compared with 3.9 per cent nationally (down 0.9 percentage points since 2008). After further growth in wages over thefirstfewyearsofthecurrentdecade,thelatestavailabledataonstandardizedwage(WPi) inflation shows a return to similar post-gfC levels – around 4 per cent for the state, compared with 3.5 per cent nationally.
As noted earlier, wage inflation varies across sectors of the economy. To show this, figure 15 compares the value of WPi across the main industry classification in Australia. WPi data are broken down either by industry, or by state/territory (but not by both together). nevertheless, this breakdown is instructive to the degree that industry-specific wage inflation trends in WA compare with national patterns.
Theincreaseinstandardizedwagesforminingishighestacrossallindustrysectors,increasing by 61.5 points between 2003 (indexed to 100) and 2014. Most of this increase occurred during the second half of the resources boom and before the gfC (2006-2009), a period where significant excess demand for labour in the sector placed strong upward pressure on wages.
similar increases occurred in the electricity and gas sector (up 57.7 over the period) and construction (rising by 56.2 points). At the other end of the distribution, wages in the accommodation and food sectors increased least - by 35.8 points over the same period - with retail wages increasing by 41.1 points.
Difference: Western Australia to Australia (ppt, RHS) Western Australia Australia
note: The wage price index controls for the “quality or quantity of work performed” to ensure that only pure price changes are reflected in the indexes. Percentage point differences in WPI inflation between WA and Australia are measured against the RHS scale.
source: BANKWEST CURTIN ECONOMICS CENTRE | Authors’ calculations using ABS Cat No. 6345.0 Wage Price Index, Australia.
Figure 14 Annual wage price inflation for WA and Australia: 2001 to 2014
Jan
2001 Ja
n 20
02 Jan
2003 Ja
n 20
04 Jan
2005 Ja
n 20
06 Jan
2007 Ja
n 20
08 Jan
2009 Ja
n 20
10 Jan
2011 Ja
n 20
12 Jan
2013 Ja
n 20
14
8.0
7.0
6.0
5.0
4.0
3.0
2.0
1.0
0.0
-1.0
-2.0
4.0
3.5
3.0
2.5
2.0
1.5
1.0
0.5
0.0
-0.5
-1.0
Annu
al w
age
pric
e in
flati
on (%
)
Diff
eren
ce: W
A to
Aus
tral
ia (p
pt)

28
2006 2010 2014
note: The wage price index controls for the “quality or quantity of work performed” to ensure that only pure price changes are reflected in the indexes. Industries are classified according to standard ANZSIC 2-digit disaggretations. Data are for Australia overall, with Industries sorted in order of increase in wage price index between 2003 and 2014.
source: BANKWEST CURTIN ECONOMICS CENTRE | Authors’ calculations using ABS Cat No. 6345.0 Wage Price Index, Australia.
Figure 15 Increase in wage price index (WPI) relative to June 2003: by industry sector
Min
ing
Ele
ctric
ity, g
as, w
ater
an
d w
aste
ser
vice
s
Con
stru
ctio
n
Edu
catio
n an
d tr
aini
ng
Pub
lic a
dmin
istr
atio
n an
d sa
fety
Pro
fess
iona
l, sc
ient
ific
and
tech
nica
l ser
vice
s
Hea
lth c
are
and
soci
al
assi
stan
ce
Fin
anci
al a
nd in
sura
nce
serv
ices
Tra
nspo
rt, p
osta
l and
w
areh
ousi
ng
Who
lesa
le tr
ade
Man
ufac
turin
g
Art
s an
d re
crea
tion
serv
ices
Ren
tal,
hirin
g an
d re
al
esta
te s
ervi
ces
Adm
inis
trat
ive
and
sup-
port
ser
vice
s
Oth
er s
ervi
ces
Inf
orm
atio
n m
edia
and
te
leco
mm
unic
atio
ns
Ret
ail t
rade
Acc
omm
odat
ion
and
food
ser
vice
s
70605040302010
0
Incr
ease
in W
PI in
dex
(200
3=10
0) +61.
5
+57.
7
+56.
2
+53.
1
+52.
3
+51.
5
+50.
4
+48.
5
+47.
3
+46.
2
+46.
1
+44.
5
44.0
+43.
8
+43.
2
+41.
3
The Wage Price index measure doesn’t allow for a differentiation of labour costs by state and industry combined. instead, Table 5 compares average employee costs for WA and Australia using the ratio of total labour costs to headcount employment for each industry sector. The analysis compares 2007-8 with 2013-14, with costs uprated to June 2015 to provide a valid comparison of real changes in average costs over time.
These measures should not be used to infer any change in the costliness of equivalent labour over the period. it is perfectly possible for the composition and skill mix of employees to have evolved differently between WA and Australia within each sector. A general increase in wages might also indicate an increase in workforce productivity. Rather, the measure should be taken simply as an indication of the average labour cost per employee in each of the main industries for the state compared with the equivalent measure for Australia overall.

37
29
The CosTs of Doing Business in WA Pressures and barriers to industry performance
Table 5 Labour costs per employee (2015 $’s): by industry sector, WA and Australia
Western Australia Australia
2007-08 2013-14 Diff % Diff 2007-08 2013-14 Diff % Diff
Mining 145,402 161,566 +16,164 +11.1% 127,038 141,963 +14,925 +11.7%
electricity, gas, water and waste services
91,120 98,643 +7,523 +8.3% 94,192 95,491 +1,300 +1.4%
Construction 55,556 76,806 +21,250 +38.2% 47,912 56,167 +8,255 +17.2%
Professional, scientific and technical services
68,597 72,209 +3,611 +5.3% 67,308 68,095 +788 +1.2%
information Media and Telecommunications
80,461 68,455 -12,006 -14.9% 82,381 81,442 -938 -1.1%
Manufacturing 62,547 68,167 +5,619 +9.0% 62,887 63,005 +117 +0.2%
Administrative and support services 49,561 61,727 +12,167 +24.5% 46,438 41,553 -4,885 -10.5%
Wholesale trade 59,613 61,055 +1,441 +2.4% 65,338 61,543 -3,795 -5.8%
Transport, postal and warehousing 54,191 59,671 +5,480 +10.1% 55,197 57,007 +1,810 +3.3%
Total selected industries 51,736 59,522 +7,786 +15.0% 47,324 47,355 +32 +0.1%
Public administration and safety (private)
37,613 54,200 +16,587 +44.1% 39,598 47,500 +7,902 +20.0%
education and training (private) 40,723 47,568 +6,844 +16.8% 43,214 46,182 +2,968 +6.9%
health care and social assistance (private)
44,144 42,679 -1,465 -3.3% 42,134 40,800 -1,334 -3.2%
Rental, hiring and real estate services 37,763 42,596 +4,833 +12.8% 37,337 35,742 -1,595 -4.3%
Arts and recreation services 34,461 31,850 -2,611 -7.6% 31,288 28,737 -2,551 -8.2%
Retail trade 31,189 31,539 +350 +1.1% 31,340 31,297 -43 -0.1%
Accommodation and food services 27,445 28,530 +1,085 +4.0% 26,180 24,028 -2,152 -8.2%
Agriculture, forestry and fishing 15,740 14,869 -871 -5.5% 14,990 13,296 -1,694 -11.3%
note: Industries are reported using the standard ANZSIC 2-digit classification. Labour costs per employee for WA and Australia for each industry are calculated as the ratio of total labour costs to total headcount employment, with costs uprated to June 2015 prices.
source: BANKWEST CURTIN ECONOMICS CENTRE | Authors’ calculations using ABS Cat No. 6345.0 Wage Price Index, Australia.
The mining sector recorded the highest average labour costs per employee, rising from $145,402 to $161,566 between 2007-8 and 2013-14 (both uprated to 2015 dollars) - a real increase of 11.1 per cent in just over half a decade. The utilities sector (electricity, gas, water and waste) paid an average of around $98,643 per worker - a real increase of 8.3 per cent on 2007-08 figures.
The state saw particularly large increases in real costs per employee since 2007-8 in public administration (up 44.1 per cent, more than double the national sector increase) and construction (up 38.2 per cent , also double the national increase). Low average employee costs are shown on latest data in agriculture ($14,869), accommodation and food services ($28,530) and the retail trade ($31,539). These sectors showed little or no increase over the last half decade, with average labour costs falling particularly in agriculture – down by 5.5 per cent in WA and by 11.3 per cent in Australia. This is most likely explained by lower skilled workers and a higher prevalence of casual, part-time, seasonal and piecemeal work.
A second metric by which to compare the cost of labour over time, and across states, is the ratio of total employee costs to company sales and service income for each industry. The ratio can be interpreted as the number of cents in employee costs for a dollar of company income. for illustration, an index of 10 says that it costs a business 10 cents in labour for every dollar of income earned.
This bears some relation to the productivity of labour, but the correlation will be limited again by differences in skill composition across industries, and by the fact that the measure doesn’t differentiate either between capital-intensive and labour-intensive industries, or private commercial versus public service industries.
Table 6 reports the change in average labour costs per dollar of income between 2007-08 and 2013-14 for each industry sector. Results are presented for WA and Australia, and show both levels and changes over the period between 2007-08 and 2013-14.
Measures vary substantially by industry, with mining, manufacturing, retail and iT sectors showing low labour cost to income ratios of between 10 and 20 cents per dollar. The health, education, public administration and administrative support sectors provide public services rather than sales, and labour costs to income ratios are naturally higher as a result – at between 40 and 80 cents per dollar of income.
30

39
31
The CosTs of Doing Business in WA Pressures and barriers to industry performance
Table 6 Labour costs per dollar of company revenue (2015 ’s): by industry sector, WA and Australia
Western Australia Australia
2007-08 2013-14 Diff % Diff 2007-08 2013-14 Diff % Diff
Wholesale trade 6.9 6.3 -0.6 -9.0% 8.7 7.3 -1.4 -16.5%
Agriculture, forestry and fishing 11.0 7.8 -3.2 -29.1% 11.9 8.9 -3.0 -25.3%
Mining 12.9 10.2 -2.8 -21.3% 13.4 12.2 -1.2 -9.1%
Retail trade 12.2 10.2 -2.0 -16.4% 12.4 10.4 -2.0 -15.8%
electricity, gas, water and waste services
13.3 11.2 -2.0 -15.2% 14.0 9.2 -4.8 -34.2%
Manufacturing 11.8 11.3 -0.6 -4.9% 16.2 14.4 -1.8 -11.3%
Rental, hiring and real estate services 18.6 15.1 -3.5 -18.9% 16.6 13.0 -3.6 -22.0%
Total selected industries 18.1 15.9 -2.3 -12.4% 20.2 17.6 -2.7 -13.2%
information Media and Telecommunications
21.2 16.9 -4.3 -20.4% 20.6 18.4 -2.1 -10.3%
Construction 19.3 19.7 0.4 +2.2% 18.6 17.0 -1.5 -8.1%
Transport, postal and warehousing 27.1 20.8 -6.3 -23.3% 25.8 21.5 -4.4 -16.9%
Arts and recreation services 25.6 23.2 -2.4 -9.3% 22.7 22.1 -0.6 -2.6%
Accommodation and food services 31.5 27.3 -4.2 -13.5% 28.9 24.5 -4.4 -15.3%
Professional, scientific and technical services
42.9 32.2 -10.7 -25.0% 43.3 35.0 -8.4 -19.3%
Public administration and safety (private)
53.7 38.2 -15.5 -28.9% 54.2 39.4 -14.9 -27.4%
health care and social assistance (private)
63.1 56.4 -6.7 -10.6% 63.5 57.0 -6.6 -10.3%
Administrative and support services 65.9 57.5 -8.4 -12.7% 59.2 50.5 -8.7 -14.7%
education and training (private) 102.8 81.9 -20.9 -20.4% 94.6 88.0 -6.6 -7.0%
note: Industries are reported using the standard ANZSIC 2-digit classification. Labour costs per dollar of company revenue is calculated as the ratio of total labour costs to total company sales and service income.
source: BANKWEST CURTIN ECONOMICS CENTRE | Authors’ calculations using ABS Cat No. 6345.0 Wage Price Index, Australia.
The WA wholesale trade industry has the lowest labour costs per dollar of sales and service income at an average of 6.3 cents in 2013-14, down 9 per cent from 6.9 cents in 2007-08. Retail is similar in this regard, with the combination of low average costs per worker and high sales and service revenues leading to a low ratio of 10.2 cents in the costs of labour per dollar of income.
Mining, on the other hand, is highly capital-intensive (45 per cent of total cost share). Labour costs per dollar of income in mining run at around 10.2 cents per dollar of income, driven by a combination of highly productive capital and a strong, well-remunerated skills base.
The general pattern over time is of reducing labour cost per dollar of income – with falls of around 10 per cent to 29 per cent across most industries over the last six years. This is the case in all bar one sector (construction being the exception, with a 2.2 per cent increase in labour cost per dollar of income over the period).
32

Relative labour costs in WA
it is entirely possible to see relatively high labour costs per employee in an industry, but a low labour cost per dollar of income earned, in sectors that generates high revenues and profits. it is important then for us to judge the costs per worker against the company income earned by that labour. We can do so by comparing labour cost to income ratio for similar industries, or for the same industries in different regions.
The degree of capital- and labour intensity, productivity and profitability vary enormously, and it is unreasonable to compare a highly commercial sector – mining, say, or manufacturing – with service oriented sectors such as public administration or education. one shouldn’t make too much of inter-industry comparisons within WA, either for labour costs per employee or labour costs per dollar of income. however, more can be inferred about the relative costs of labour in WA to the rest of the country by comparing the levels and changes in the same industry sectors between this state and Australia.
figure 16 and figure 17 plots the percentage difference between WA and Australia in the labour cost per employee and labour cost per income measures, for each industry sector. These charts serve to highlight the following features:
• HigheraveragespendingperemployeeforWArelativetoAustraliacorrespondstoapositive percentage difference in labour costs per employee
• HigheraveragespendingperemployeeforWArelativetoAustraliacorrespondstoahigher percentage difference in labour costs per dollar of income.
Those WA industries in the top right segment of each chart (figure 16 for 2007-08 and figure 17 for 2013-14) have both high costs per employee relative to the same industry in Australia overall, and also a higher labour cost per dollar of income earned.
Construction, real estate services, and administration and support services feature in this quadrant for both comparison years. in 2007-08, the average labour cost per employee in construction was around 16 per cent higher in WA than in Australia. By 2013-14 average labour costs per employee in WA were 36 per cent higher. At the same time, the construction industry faced labour costs per dollar of company income that were 4% higher in WA than in Australia in 2007-08, but 15 per cent higher by 2013-14. The administration and support sector also shows a significant increase in labour costs per employee relative to Australia (48 per cent higher by 2013-14), and in labour costs per dollar of income earned (14 per cent higher in 2013-14).
The labour cost per dollar of income earned by businesses is lower in WA compared to Australia in mining (by 16 per cent ), manufacturing (by 22 per cent ) and agriculture (by 13 per cent ), despite there being a higher average wage per employee in these sectors in WA compared to national rates. Labour costs in public administration have also grown significantly faster in WA than in Australia.
Mining also spent more per employee in WA, around 24 per cent higher than the Australian average. however labour costs required to generate a dollar of income for WA mining companies were 3.4 per cent lower in 2007-08, moving to fully 17 per cent lower by 2013-14.
Public administration costs in WA were 4 per cent lower than the Australian average in 2007-08. however, by 2013-14 the costs per employee had risen to around 14 per cent . This is despite labour costs to income ratios in public administration being the same in the state compared with national figures.
41
33
The CosTs of Doing Business in WA Pressures and barriers to industry performance

34
note: Industries are reported using the standard ANZSIC 2-digit classification. Wage costs per employee for WA and Australia for each industry are calculated as the ratio of total labour costs to total headcount employment, with 2007-08 to 2013-14 costs uprated to June 2015 prices. Employee cost per unit of sales/service income is calculated as the ratio of total labour costs to total sales/service income. The chart presents the percentage difference in cost per employee and cost per sales income in WA relative to Australia.
source: BANKWEST CURTIN ECONOMICS CENTRE | Authors’ calculations using ABS Cat No. 6345.0 Wage Price Index, Australia.
Figure 16 Relative labour costs per employee and cost per sales/service income in WA relative to Australia: 2007-08, by industry sector
+50%
+40%
+30%
+20%
+10%
0%
-10%
-20%
Labo
ur c
osts
per
em
ploy
ee: W
A re
lati
ve t
o Au
stra
lia (%
diff
eren
ce)
Ratio of labour costs to company revenue: WA relative to Australia (% difference)
-30% -20% -10% 0% +10% +20% +30%Manufacturing
Wholesale
electricity/gasPublic admin
iT Transporteducation
Rental/real estate
AccommodationAdmin/support
Arts/recreation
Construction
Prof/tech
Retail
health/socialAgriculture
ALL INDUSTRIES
Mining
note: Industries are reported using the standard ANZSIC 2-digit classification. Wage costs per employee for WA and Australia for each industry are calculated as the ratio of total labour costs to total headcount employment, with 2007-08 to 2013-14 costs uprated to June 2015 prices. Employee cost per unit of sales/service income is calculated as the ratio of total labour costs to total sales/service income. The chart presents the percentage difference in cost per employee and cost per sales income in WA relative to Australia.
source: BANKWEST CURTIN ECONOMICS CENTRE | Authors’ calculations using ABS Cat No. 6345.0 Wage Price Index, Australia.
Figure 17 Relative labour costs per employee and cost per sales/service income in WA relative to Australia: 2013-14, by industry sector
+50%
+40%
+30%
+20%
+10%
0%
-10%
-20%
Labo
ur c
osts
per
em
ploy
ee: W
A re
lati
ve t
o Au
stra
lia (%
diff
eren
ce)
Ratio of labour costs to company revenue: WA relative to Australia (% difference)
-30% -20% -10% 0% +10% +20% +30%
Manufacturing
Wholesale
Public admin
iT
education
Rental/real estateAccommodation
Admin/support
Arts/recreation
Construction
Retail
Agriculture
ALL INDUSTRIES
Mining
Prof/techhealth/social
Transport
electricity/gas

on companies
Tax costs
Taxes on businesses in WA
The suite of taxes formally levied on businesses in Australia are familiar, and include the following main instruments:
• Companytax-leviedonbusinessprofits
• Payrolltax-leviedonlabourvalueadded
• GoodsandSalesTax(GST)-addedtothepriceofacompanies’goodsandservices.
• CapitalGainsTax-leviedoncapitalgainsfromthedisposalofassets
• Landtaxandbusinessrates-leviedonthepurchaseoflandandpublicservices
Company tax is paid on the profits of businesses at a standard rate of 30 per cent for most businesses in Australia. Reforms announced in the 2015-16 budget included a 1.5 percentage point tax cut for incorporated businesses with an annual turnover under $2 million, and a 5 per cent tax discount up to a $1,000 cap for unincorporated businesses. small businesses can also claim a tax deduction for singles asset purchases up to $20,000. Dividends paid from company profits (and therefore subject to company tax) attract a franking credit, and if companies receive dividends from other business, these franking credits can be used to offset the company tax paid.
gsT is formally collected from companies, but the effective incidence is passed onto consumers by including gsT in sales prices. Businesses can claim input tax credits for gsT paid on their own business purchases, with some also subject to certain gsT concessions.
Australia’s 2.1 million businesses paid around $70.5bn nationally in company tax in 2013-14, equivalent to an average of $33,592 per business. however, the vast majority of company tax is paid by a small fraction of companies.
36

Payroll tax
Payroll tax is one of the principal tax-related costs to businesses, alongside company taxation and property taxes. Payroll tax is levied on the total employment (payroll) costs incurred by a business, with some exemptions for business-related accommodation and travel costs. As at 1 July 2015, West Australian businesses are currently taxed at a single rate of 5.5 per cent beyond a threshold of $800,000 in total payroll costs net of exemptions.
however, unlike company tax, there are significant differences between states and territories in the rates and free thresholds for payroll tax. This means that businesses with an equivalent employment payroll will bear a different payroll tax burden in different state/territory jurisdictions. The two panels in figure 18 illustrate these state/territory differences for payroll costs of up to $3m (in the left hand panel) and to $20m (on the right).
45
37
The CosTs of Doing Business in WA Pressures and barriers to industry performance
Figure 18 Payroll tax schedules as at July 2015: by state/territory and total employment costs
Payr
oll t
ax li
abili
ty ($
per
ann
um)
150,000
125,000
100,000
75,000
50,000
25,000
0
0
250,
000
500,
000
750,
000
1,00
0,00
0
1,25
0,00
0
1,50
0,00
0
1,75
0,00
0
2,00
0,00
0
2,25
0,00
0
2,50
0,00
0
2,75
0,00
0
3,00
0,00
0
(a) for payroll costs of up to $3m
Total employment (payroll) costs: ($ per annum)
Payr
oll t
ax li
abili
ty ($
per
ann
um)
note: Payroll tax schedules for each state and territory are calculated using tax rates and thresholds as at 1 July 2015. Panel (a) focuses on payroll tax liabilities for employer payroll costs of up to $3,000,000 while Panel (b) shows payroll tax schedules for payroll costs of up to $20,000,000.
source: BANKWEST CURTIN ECONOMICS CENTRE | Authors’ calculations
1,400,000
1,200,000
1,000,000
800,000
600,000
400,000
200,000
0
NSW Vic QLD SA WA TAS NT ACT
0
1,00
0,00
0
2,00
0,00
0
3,00
0,00
0
4,00
0,00
0
5,00
0,00
0
6,00
0,00
0
7,00
0,00
0
8,00
0,00
0
9,00
0,00
0
10,0
00,0
00
11,0
00,0
00
12,0
00,0
00
13,0
00,0
00
14,0
00,0
00
15,0
00,0
00
16,0
00,0
00
17,0
00,0
00
18,0
00,0
00
19,0
00,0
00
20,0
00,0
00
(b) for payroll costs of up to $20m
Total employment (payroll) costs: ($ per annum)

The costs to WA businesses of payroll tax
What costs do payroll taxes impose on businesses of different scales and profiles in Western Australia? is payroll tax more penalising in WA than in other states and territories? And are there behaviours or impacts of the payroll tax?
The latest MYefo update for 2014-15 estimates that payroll tax revenues for WA will amount to $3.74bn, equivalent to an average of $17,142 for each registered business in the state, or $2,736 per employee.
however, the argument that WA is the most costly jurisdiction for payroll tax simply bycomparingtotalpayrolltaxrevenueswiththesizeoftheWApopulation(CCIWA)is spurious. The existence of a payroll tax threshold means that larger firms with a higher salary bill will face a higher average payroll tax liability. With more firms of this type in WA, the per capita (or more appropriately, per employee) payroll tax bill will necessarily be higher in WA than for other states and territories. This does not singleoutpayrolltaxassingularlymorepenalisinginWA,butratherthatthesizeand composition of firms in the state are different.
A more appropriate benchmark of the contribution of payroll tax regimes to business costs should compare payroll tax liabilities for the same type of firm, with the same salary bill, in different jurisdictions (which we do in Table 7).
Table 7 Payroll tax bill – by level of employee costs and state/territory (as at 1 July 2015)
state/territory Payroll tax employer payroll costs
Rate ThresholdDeduction
rate $1,000,000 $2,000,000 $5,000,000 $10,000,000
new south Wales 5.45% 750,000 0.00 13,625 3 68,125 4 231,625 3 504,125 5
Victoria 4.85% 550,000 0.00 21,825 1 70,325 2 215,825 7 458,325 8
Queensland 4.75% 1,100,000 0.25 - 5 53,438 5 231,563 4 475,000 6
south Australia 4.95% 600,000 0.00 19,800 2 69,300 3 217,800 6 465,300 7
Western Australia 5.50% 800,000 0.11 12,313 4 73,881 1 258,582 1 550,000 2
Tasmania 6.10% 1,250,000 0.00 - 5 45,750 6 228,750 5 533,750 4
northern Territory 5.50% 1,500,000 0.25 - 5 34,375 7 240,625 2 550,000 2
Australian Capital Territory 6.85% 1,850,000 0.00 - 5 10,275 8 215,775 8 558,275 1
note: Payroll tax liabilities for each state and territory are calculated at different employer payroll costs using tax rates and thresholds as at 1 July 2015 (see Appendix for full details).
source: BANKWEST CURTIN ECONOMICS CENTRE | Authors’ calculations
The architecture of the payroll tax system as shown in figure 18 – specifically the tax-free threshold – generates a higher average payroll tax liability as company wage costs rise. Businesses with total wage costs below the threshold are exempt from payroll tax, with the average liability as a proportion of the wage bill rising progressively towards the payroll tax rate as payroll costs increase.
A business with wage costs of $1m will be exempt from payroll tax in Queensland, Tasmania, northern Territory and ACT. The same business will pay $12,313 in Western Australia (1.2 per cent of the salary bill), $13,625 in new south Wales (1.4 per cent of salary) and $21,825 in Victoria (2.2per cent of salary).
38

Western Australia ranks first in payroll tax costs for businesses with a total payroll of $2m (a $73,881 liability, or 3.7 per cent of payroll costs) and first for businesses with a $5m payroll ($258,582, or 5.2 per cent of payroll costs) and second for businesses with $10m in payroll costs ($550,000, also 5.5 per cent of payroll costs).
ACT offers the greatest free threshold across all states and territories, to the extent that businesses with up to $1.85m in employment costs will pay no payroll tax. however, ACT also imposes the highest payroll tax rate of 6.85 per cent. This imposes a progressively higher payroll tax burden for larger businesses – $558,275 for a company with a $10m payroll.
Varying payroll tax rates and thresholds do create complexities for businesses that operate in multiple jurisdictions. This remains the case despite agreements between state and territory Treasurers to harmonise the legislation and administration of payroll tax systems nationally, culminating in a formal 2010 Payroll Tax harmonisation Joint Protocol. Payroll tax is more penalising for labour- rather than capital-intensive businesses, and more small businesses will be drawn into the payroll tax system as wage costs increase.
Payroll tax will necessarily be more penalising if businesses face higher cost of workers for a given level of productivity. however, it’s a strained argument to suggest that payroll tax rates should adjust to offset any growth in the costs of labour in WA, in the manner that gsT revenues to states and territories even up the revenue generating capacities across jurisdictions.
47
39
The CosTs of Doing Business in WA Pressures and barriers to industry performance

Have payroll tax costs increased over time?
Payroll tax revenues in WA have increased as a proportion of total state tax revenue over the last decade, rising from 26.1per cent in 2005-06 to some 40.5per cent on latest projections for 2015-16. This can be explained in part by the growth of businesses in WA overthelasttenyears,bothinnumberandinthesizeoftheworkforceemployed.
however, part of the increase in payroll tax revenue stems from the fact that the payroll tax system in WA – in common with a number of other states and territories in Australia - has not remained neutral over time. Many payroll tax thresholds – including the threshold that applies in WA – have remained broadly the same in nominal terms over time.
The static nature of payroll tax thresholds means that more businesses have been drawn into the payroll tax regime, or are paying more in tax, simply because thresholds haven’t adjusted upwards to match wage inflation. This represents the same sort of bracket creep that afflicts the personal income tax system in Australia.
Table 8 compares payroll tax liabilities for each state and territory using tax rates and thresholds as at 1 July 2005 and 1 July 2015. for comparison, employer payroll costs for 2005 are reweighted by a wage inflator (AWoTe) to compare 2005 tax liabilities with the 2015 employer payroll figures on a like-for-like basis (see Appendix for full details of historical payroll tax rates and thresholds).
in 2015 equivalent dollars, a WA business with employment costs of $2m is paying $24,373 more in payroll tax now – some 49 per cent more – than was the case in 2005.Thisisthelargestexcessliabilityforabusinessofthissizeacrossallstatesandterritories. This is because of the 1 July 2015 diminishing threshold, and because the payroll tax rate in WA has remained unchanged at 5.5per cent over the period since 2005, with the payroll tax threshold rising only once (from $750,000 to $800,000 in 2014-15).
in contrast, south Australia has seen rate reductions from 5.67 per cent to 4.95 per cent since 2005, along with an increase in the payroll tax threshold from $504,000 to $600,000. As a result, south Australian businesses with wage costs of $10m are liable for the equivalent of $59,793 less in payroll tax now than in 2005.
Table 8 Change in payroll tax liabilities between 2005-06 and 2015-16: by state/territory and employers’ payroll costs
state/territory Payroll tax Change in equivalent payroll tax liability, 2005-06 to 2015-16
Rate ThresholdDeduction
rate $1,000,000 $2,000,000 $5,000,000 $10,000,000new south Wales 5.45% 750,000 0.00 +6,418 3 +918 5 -15,582 5 -43,082 6
Victoria 4.85% 550,000 0.00 +11,669 2 +7,669 4 -4,331 4 -24,331 5
Queensland 4.75% 1,100,000 0.25 - 5 +8,699 3 -15,644 6 - 3
south Australia 4.95% 600,000 0.00 +5,007 4 -2,193 7 -23,793 7 -59,793 7
Western Australia 5.50% 800,000 0.11 +12,313 1 +24,373 1 +44,074 1 +60,492 1
Tasmania 6.10% 1,250,000 0.00 - 5 +14,100 2 +14,100 2 +14,100 2
northern Territory 5.50% 1,500,000 0.25 - 5 -6,973 8 -33,223 8 -70,000 8
Australian Capital Territory 6.85% 1,850,000 0.00 - 5 -1,158 6 -1,158 3 -1,158 4
note: Changes in payroll tax liabilities for each state and territory are calculated for different employer payroll costs using tax rates and thresholds as at 1 July 2005 and 1 July 2015. For comparison, employer payroll costs for 2005 are reweighted by AWOTE to compare with the 2015 employer payroll figures (see Appendix for full details).
source: BANKWEST CURTIN ECONOMICS CENTRE | Authors’ calculations
for the WA payroll tax system to have remained neutral over the last decade would require the pre-July 2015 threshold to be 37.5 per cent higher than in July 2005 – rising to nearly $1,100,00 (in line with wage inflation, and shown in Table 9). This shows that non-uprating of the payroll tax threshold (bracket creep) can disproportionately affect the tax payments of smaller businesses.
40

Table 9 Projection of 2015-16 payroll tax liabilities for payroll tax thresholds uprated in line with AWOTE from 2005-06 to 2015-16: by state/territory and employers’ payroll costs
state/territory WA nsW ViC QLD sA TAs nT ACT
Payroll tax rate as at 1 July 2015 5.50% 5.45% 4.85% 4.75% 4.95% 6.10% 5.50% 6.85%
Payroll tax threshold as at 1 July 2015
800,000 750,000 550,000 1,100,000 600,000
1,250,000
1,500,000
1,850,000
Payroll tax threshold if July 2005 uprated by AWoTe
1,099,856 879,885 806,561 1,246,503 739,103 1,481,139 1,466,475 1,833,093
employee costs of $1,000,000
Payroll tax liability (actual) 11,000 13,625 21,825 0 19,800 0 0 0
Payroll tax liability (if neutral since 2005)
0 6,546 9,382 0 12,914 0 0 0
$ difference (neutral vs actual) +11,000 +7,079 +12,443 +0 +6,886 +0 +0 +0
% difference (neutral vs actual) * +108.1% +132.6% - +53.3% - - -
employee costs of $2,500,000
Payroll tax liability (actual) 93,500 95,375 94,575 66,500 94,050 76,250 55,000 44,525
Payroll tax liability (if neutral since 2005)
77,008 88,296 82,132 59,541 87,164 62,150 56,844 45,683
$ difference (neutral vs actual) +16,492 +7,079 +12,443 +6,959 +6,886 +14,100 -1,844 -1,158
% difference (neutral vs actual) +21.4% +8.0% +15.2% +11.7% +7.9% +22.7% -3.2% -2.5%
employee costs of $5,000,000
Payroll tax liability (actual) 231,000 231,625 215,825 185,250 217,800 228,750 192,500 215,775
Payroll tax liability (if neutral since 2005)
214,508 224,546 203,382 178,291 210,914 214,650 194,344 216,933
$ difference (neutral vs actual) +16,492 +7,079 +12,443 +6,959 +6,886 +14,100 -1,844 -1,158
% difference (actual vs neutral) +7.7% +3.2% +6.1% +3.9% +3.3% +6.6% -0.9% -0.5%
note: ‘Neutral’ payroll tax thresholds are calculated by uprating the July 2005 threshold by AWOTE for each state and territory (see Appendix for full details).source: BANKWEST CURTIN ECONOMICS CENTRE | Authors’ calculations
49
41
The CosTs of Doing Business in WA Pressures and barriers to industry performance

There has been some national debate around broadening the payroll tax base through reductions in the tax threshold combined with a reduction in the tax rate. To further understand the distributional aspects of such discussions, Table 10 compares payroll tax liabilities under the pre-July 2015 reform system for a business with $2m in wage costs with those that would accrue for different combinations of payroll tax rates and thresholds. Table 11 does the same, but focuses on a larger business with a $20m payroll.
These two tables make clear the fact that lower payroll tax thresholds (either through non-uprating or explicit reductions) have a greater proportionate impact on the payroll tax bills of smaller companies, with increased tax burdens possible even with a corresponding reduction in the payroll tax rate. To illustrate this point, we see that a reduction to $600,000 from the current WA threshold combined with a reduction to 5.0per cent in the tax rate would increase the payroll tax cost by 6.1 per cent for a business with wage costs of $2m (Table 10, third panel) at the same time as decreasing the payroll tax bill by 7.1 per cent for businesses with a $20m payroll. Conversely, increasing the tax threshold to $1,200,000 for a business with $2m is shown to reduce its payroll tax liability by a third (Table 11).
Table 10 Effect of changes in payroll rates and thresholds on payroll tax liability of small employer (relative to system pre-July 2015)
(a) employer payroll costs of $2,000,000
Payroll tax threshold $600,000 $700,000 $800,000 $900,000 $1,000,000 $1,100,000 $1,200,000
Tax rate Payroll tax liability ($)6.50% 91,000 84,500 78,000 71,500 65,000 58,500 52,000 6.25% 87,500 81,250 75,000 68,750 62,500 56,250 50,000 6.00% 84,000 78,000 72,000 66,000 60,000 54,000 48,000 5.75% 80,500 74,750 69,000 63,250 57,500 51,750 46,000 5.50% 77,000 71,500 66,000 60,500 55,000 49,500 44,000 5.25% 73,500 68,250 63,000 57,750 52,500 47,250 42,000 5.00% 70,000 65,000 60,000 55,000 50,000 45,000 40,000 4.75% 66,500 61,750 57,000 52,250 47,500 42,750 38,000 4.50% 63,000 58,500 54,000 49,500 45,000 40,500 36,000
Payroll tax threshold $600,000 $700,000 $800,000 $900,000 $1,000,000 $1,100,000 $1,200,000
Tax rate Difference from pre-July 2015 ($)6.50% +25,000 +18,500 +12,000 +5,500 -1,000 -7,500 -14,0006.25% +21,500 +15,250 +9,000 +2,750 -3,500 -9,750 -16,0006.00% +18,000 +12,000 +6,000 - -6,000 -12,000 -18,0005.75% +14,500 +8,750 +3,000 -2,750 -8,500 -14,250 -20,0005.50% +11,000 +5,500 - -5,500 -11,000 -16,500 -22,0005.25% +7,500 +2,250 -3,000 -8,250 -13,500 -18,750 -24,0005.00% +4,000 -1,000 -6,000 -11,000 -16,000 -21,000 -26,0004.75% +500 -4,250 -9,000 -13,750 -18,500 -23,250 -28,0004.50% -3,000 -7,500 -12,000 -16,500 -21,000 -25,500 -30,000
Payroll tax threshold $600,000 $700,000 $800,000 $900,000 $1,000,000 $1,100,000 $1,200,000
Tax rate Difference from pre-July 2015 (% of current liability)6.50% +37.9% +28.0% +18.2% +8.3% -1.5% -11.4% -21.2%6.25% +32.6% +23.1% +13.6% +4.2% -5.3% -14.8% -24.2%6.00% +27.3% +18.2% +9.1% +0.0% -9.1% -18.2% -27.3%5.75% +22.0% +13.3% +4.5% -4.2% -12.9% -21.6% -30.3%5.50% +16.7% +8.3% - -8.3% -16.7% -25.0% -33.3%5.25% +11.4% +3.4% -4.5% -12.5% -20.5% -28.4% -36.4%5.00% +6.1% -1.5% -9.1% -16.7% -24.2% -31.8% -39.4%4.75% +0.8% -6.4% -13.6% -20.8% -28.0% -35.2% -42.4%4.50% -4.5% -11.4% -18.2% -25.0% -31.8% -38.6% -45.5%
note: Changes in payroll tax liabilities are calculated relative to the WA payroll tax regime as at 1 July 2005 and 1 July 2015. Changes in payroll tax liabilities for different combinations of rates and thresholds are expressed in dollar terms and as a percentage of the payroll costs under the current system.
source: BANKWEST CURTIN ECONOMICS CENTRE | Authors’ calculations
42

These two tables make clear the fact that lower payroll tax thresholds (either through non-uprating or explicit reductions) have a greater proportionate impact on the payroll tax bills of smaller companies, with increased tax burdens possible even with a corresponding reduction in the payroll tax rate. To illustrate this point, we see that a reduction to $600,000 from in the current WA threshold combined with a reduction to 5.0% in the tax rate would increase the payroll tax cost by 6.1% for a business with wage costs of $2m (Table 10, third panel) at the same time as decreasing the payroll tax bill by 7.1% for businesses with a $10m payroll. Conversely, increasing the tax threshold to $1,200,000 for a business with $2m is shown to reduce its payroll tax liability by a third (Table 11).
Table 11 Effect of changes in payroll rates and thresholds on payroll tax liability of larger employer (relative to system pre-July 2015)
(b) employer payroll costs of $10,000,000
Payroll tax threshold $600,000 $700,000 $800,000 $900,000 $1,000,000 $1,100,000 $1,200,000
Tax rate Payroll tax liability ($)6.50% 611,000 604,500 598,000 591,500 585,000 578,500 572,000 6.25% 587,500 581,250 575,000 568,750 562,500 556,250 550,000 6.00% 564,000 558,000 552,000 546,000 540,000 534,000 528,000 5.75% 540,500 534,750 529,000 523,250 517,500 511,750 506,000 5.50% 517,000 511,500 506,000 500,500 495,000 489,500 484,000 5.25% 493,500 488,250 483,000 477,750 472,500 467,250 462,000 5.00% 470,000 465,000 460,000 455,000 450,000 445,000 440,000 4.75% 446,500 441,750 437,000 432,250 427,500 422,750 418,000 4.50% 423,000 418,500 414,000 409,500 405,000 400,500 396,000
Payroll tax threshold $600,000 $700,000 $800,000 $900,000 $1,000,000 $1,100,000 $1,200,000
Tax rate Difference from pre-July 2015 ($)6.50% +105,000 +98,500 +92,000 +85,500 +79,000 +72,500 +66,0006.25% +81,500 +75,250 +69,000 +62,750 +56,500 +50,250 +44,0006.00% +58,000 +52,000 +46,000 +40,000 +34,000 +28,000 +22,0005.75% +34,500 +28,750 +23,000 +17,250 +11,500 +5,750 -5.50% +11,000 +5,500 - -5,500 -11,000 -16,500 -22,0005.25% -12,500 -17,750 -23,000 -28,250 -33,500 -38,750 -44,0005.00% -36,000 -41,000 -46,000 -51,000 -56,000 -61,000 -66,0004.75% -59,500 -64,250 -69,000 -73,750 -78,500 -83,250 -88,0004.50% -83,000 -87,500 -92,000 -96,500 -101,000 -105,500 -110,000
Payroll tax threshold $600,000 $700,000 $800,000 $900,000 $1,000,000 $1,100,000 $1,200,000
Tax rate Difference from pre-July 2015 (% of current liability)6.50% +20.8% +19.5% +18.2% +16.9% +15.6% +14.3% +13.0%6.25% +16.1% +14.9% +13.6% +12.4% +11.2% +9.9% +8.7%6.00% +11.5% +10.3% +9.1% +7.9% +6.7% +5.5% +4.3%5.75% +6.8% +5.7% +4.5% +3.4% +2.3% +1.1% -5.50% +2.2% +1.1% - -1.1% -2.2% -3.3% -4.3%5.25% -2.5% -3.5% -4.5% -5.6% -6.6% -7.7% -8.7%5.00% -7.1% -8.1% -9.1% -10.1% -11.1% -12.1% -13.0%4.75% -11.8% -12.7% -13.6% -14.6% -15.5% -16.5% -17.4%4.50% -16.4% -17.3% -18.2% -19.1% -20.0% -20.8% -21.7%
note: Changes in payroll tax liabilities are calculated relative to the WA payroll tax regime as at 1 July 2005 and 1 July 2015. Changes in payroll tax liabilities for different combinations of rates and thresholds are expressed in dollar terms and as a percentage of the payroll costs under the current system.
source: BANKWEST CURTIN ECONOMICS CENTRE | Authors’ calculations
51
43
The CosTs of Doing Business in WA Pressures and barriers to industry performance


Capital

Introduction
46
generally, costs associated with capital depreciation and capital acquisition (including interest expenses) are around 20% of total expenditure among businesses, as shown in figure 8 of the WA Business Profile section. however, a large degree of variation exists throughout industries, with capital expenditure for the mining, electricity, gas and water and financial and insurance services relatively more dominant than in other industries (see figure 9).
The ability to access and raise capital can be a key element of business operations and success, allowing a business to build and grow. Assessing differences in capital formation and access for WA is challenging, with few data sources to rely upon. Access to capital can be inhibited by a number of factors including red tape and regulations, the financial climate and a lack of information and awareness by those seeking it.
in this section we examine capital expenditure components and capital growth for WA’s most dominant industry – mining. We also look at firms reported barriers to accessing finance and generating consistent working capital.
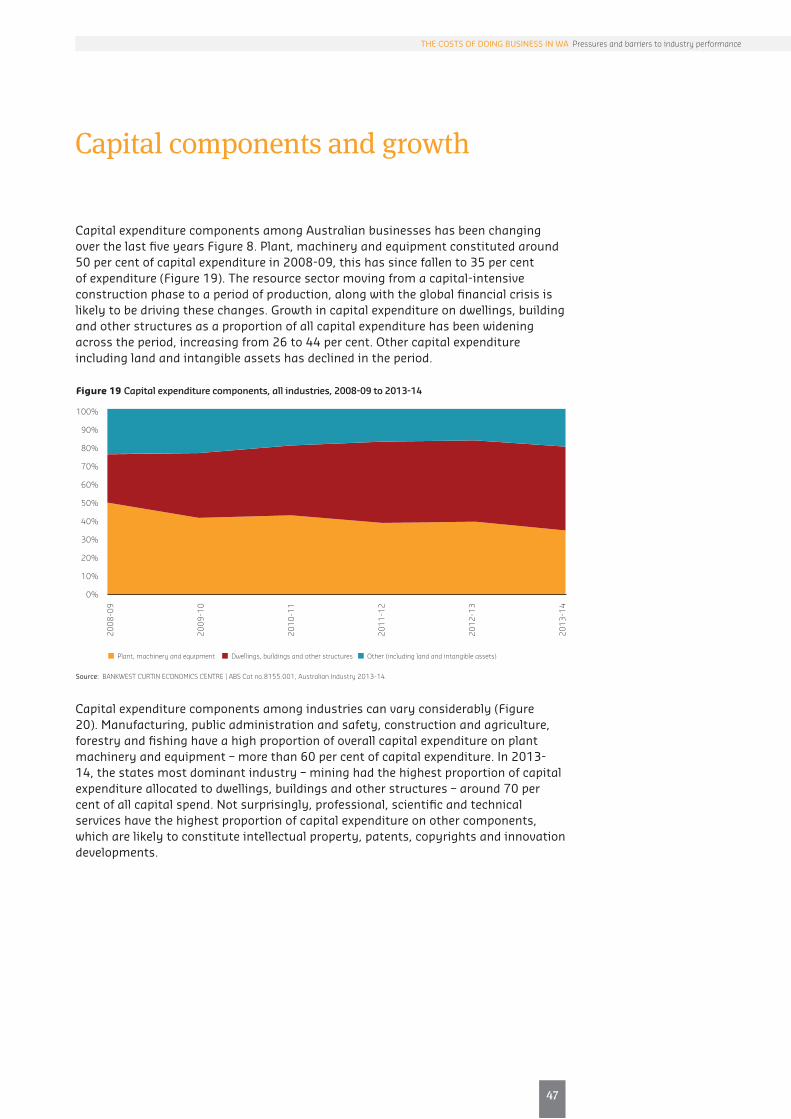
Capital components and growth
Capital expenditure components among Australian businesses has been changing over the last five years figure 8. Plant, machinery and equipment constituted around 50 per cent of capital expenditure in 2008-09, this has since fallen to 35 per cent of expenditure (figure 19). The resource sector moving from a capital-intensive construction phase to a period of production, along with the global financial crisis is likely to be driving these changes. growth in capital expenditure on dwellings, building and other structures as a proportion of all capital expenditure has been widening across the period, increasing from 26 to 44 per cent. other capital expenditure including land and intangible assets has declined in the period.
Capital expenditure components among industries can vary considerably (figure 20). Manufacturing, public administration and safety, construction and agriculture, forestry and fishing have a high proportion of overall capital expenditure on plant machinery and equipment – more than 60 per cent of capital expenditure. in 2013-14, the states most dominant industry – mining had the highest proportion of capital expenditure allocated to dwellings, buildings and other structures – around 70 per cent of all capital spend. not surprisingly, professional, scientific and technical services have the highest proportion of capital expenditure on other components, which are likely to constitute intellectual property, patents, copyrights and innovation developments.
55
47
The CosTs of Doing Business in WA Pressures and barriers to industry performance
Figure 19 Capital expenditure components, all industries, 2008-09 to 2013-14
source: BANKWEST CURTIN ECONOMICS CENTRE | ABS Cat no.8155.001, Australian Industry 2013-14.
100%
90%
80%
70%
60%
50%
40%
30%
20%
10%
0%
2008
-09
2009
-10
2010
-11
2011
-12
2012
-13
2013
-14
Plant, machinery and equipment Dwellings, buildings and other structures Other (including land and intangible assets)

over the last fifteen years, fixed capital formation has been increasing considerably for Western Australia’s most prominent industry – mining. Compared to all other industries, which have remained relatively flat, fixed capital formation in the mining sector increased by almost 700 per cent between 2005 and 2013 (figure 21). There was a dip in capital formation during the gfC, but the industry returned to capital growth soon after. in the more recent period between 2013 and 2014, fixed capital formation has dropped off in the mining sector. While, mining has had an increasing trend since 2003, professional, scientific and technical services industry have shown the opposite pattern, decreasing and remaining below the trend of all industries. With relatively better progress, construction, another important industry in the state, has moved along with national figures in terms of gross capital formation [graphs not shown].
48
Fixed capital formation in the mining sector has increased by almost 700 per cent, between 2005 and 2013.
Figure 20 Capital expenditure components, by industry, 2013-14
source: BANKWEST CURTIN ECONOMICS CENTRE | ABS Cat no.8155.001, Australian Industry 2013-14
Plant, machinery and equipment Dwellings, buildings and other structures Other (including land and intangible assets)
Other servicesArts and recreation services
Health care and social assistance (private)Education and training (private)
Public administration and safety (private)Administrative and support services
Professional, scientific and technical servicesRental, hiring and real estate services
Information media and telecommunicationsTransport, postal and warehousingAccommodation and food services
Retail tradeWholesale trade
ConstructionElectricity, gas, water and waste services
ManufacturingMining
Agriculture, forestry and fishing
0% 10% 20% 30% 40% 50% 60% 70% 80% 90% 100%
source: BANKWEST CURTIN ECONOMICS CENTRE| ABS Cat no.5204.0, Private Gross Fixed Capital Formation, by Industry.
Difference: All Industries-Mining Mining All Industries
Figure 21 Private fixed Capital formation by industry, current prices, 2000 - 2014
Jan
2000
Jan
2001
Jan
2002
Jan
2003
Jan
2004
Jan
2005
Jan
2006
Jan
2007
Jan
2008
Jan
2009
Jan
2010
Jan
2011
Jan
2012
Jan
2013
Jan
2014
1200
1000
800
600
400
200
0
400
350
300
250
200
150
100
50
0
Inde
x Ja
n 20
00=1
00
Diff
eren
ce ($
bill
ion)

Barriers to Finance and Working Capital
Barriers to finance and inadequate working capital can restrict business growth and prosperity. small to medium enterprises can often face considerable challenges in accessing capital and since the gfC this has increased as creditors and regulators tightened conditions.
small to medium enterprises are more likely to report lack of access to funds and inadequate working capital (outstanding accounts receivable) as a significant barrier to business activity than large businesses (figure 22).
Businesses with 20-199 persons had the highest rates of reporting lack of access to additional funds and working capital as a barrier to performance – 18.8 per cent and 17.6 per cent respectively. Large entities with more than 200 persons were less likely to report these problems – 11 per cent report access to additional funds as a significant barrier, and around 6 per cent working capital as a barrier.
Between 2007-08 and 2010-11, businesses have increased their reports of lack of access to additional funds and working capital as a significant barrier to business performance and activities. in the last two periods, this has decreased somewhat, with around 15 per cent of businesses reporting access to funds as a barrier and 14 per cent reporting working capital as a problem.
57
49
The CosTs of Doing Business in WA Pressures and barriers to industry performance
Figure 22 Financial barriers to business activities by employment size, 2012-13
Prop
orti
on o
f bus
ines
ses
20
18
16
14
12
10
8
6
4
2
0 0-4 persons 5-19 persons 20-199 persons 200 or more persons Total
note: Businesses were asked to identify barriers that significantly hampered general business activities or performance. source: BANKWEST CURTIN ECONOMICS CENTRE | ABS Cat No. 8167.0 Selected Characteristics of Australian Business, 2012-13, Table 1, Barriers to general busi-
ness activities or performance.
13.9
12.3
17.516.4
18.817.6
11
5.9
15.414
Lack of access to additional funds Outstanding accounts receivable limiting cash flow

50
Almost 1 in 4 businesses in the mining and retail sector report lack of access to funds as a significant barrier to business performance.
Figure 23 Financial barriers to business activities, 2006-07 to 2012-13Pr
opor
tion
of b
usin
esse
s
20
18
16
14
12
10
8
6
4
2
0 2006-07 2007-08 2008-09 2009-10 2010-11 2011-12 2012-13
note: Businesses were asked to identify barriers that significantly hampered general business activities or performance. source: BANKWEST CURTIN ECONOMICS CENTRE | ABS Cat No. 8167.0 Selected Characteristics of Australian Business, 2012-13, Table 1,
Barriers to general business activities or performance.
16.5
14.9
Lack of access to additional funds Outstanding accounts receivable limiting cash flow
12.9 13.4
16.6
14.815.5
14.6
17.8
16.4 15.9 15.4 15.414.0
Again, variation by industry is evident. Most industries have higher rates of businesses reporting lack of access to funds as a substantial barrier to business activities and performance (figure 24). The mining and retail sector has the highest rate of businesses reporting lack of access to funds as a significant barrier to performance, with around 1 in 4 businesses citing this as an issue in 2012-13. This is closely followed by entities operating in the information media and telecommunications sector – 22 per cent, arts and recreation – 20 per cent and manufacturing – 17 per cent.
not surprisingly, businesses in the construction sector have one of the highest reports of issues with working capital inhibiting business performance. Around 1 in 5 businesses operating in the construction sector report this as a significant barrier. Businesses operating in the wholesale trade sector and manufacturing sector have the highest rates of reports of outstanding accounts receivable limiting cash flow – 22.6 per cent.
Figure 24 Financial barriers to business activities by industry, 2012-13
note: Businesses were asked to identify barriers that significantly hampered general business activities or performance. source: BANKWEST CURTIN ECONOMICS CENTRE | ABS Cat No. 8167.0 Selected Characteristics of Australian Business, 2012-13, Table 1,
Barriers to general business activities or performance.
Cash flow from debtors Lack of access to funds
All businessesOther services
Arts and recreation servicesHealth Care and Social Assistance
Administrative and Support ServicesProfessional, Scientific and Technical Services
Rental, Hiring and Real Estate ServicesFinancial and Insurance Services
Information Media and TelecommunicationsTransport, Postal and WarehousingAccommodation and Food Services
Retail TradeWholesale Trade
ConstructionElectricity, Gas, Water and Waste Services
ManufacturingMining
Agriculture, Forestry and Fishing
0 5 10 15 20 25 30
is a booma boom?WhenUtilities
occupancy and housing

52
Utilities
utilities including electricity, gas and water can be a significant input to business operations, particularly those in the manufacturing, construction and mining sectors. Most of these markets have and continue to be highly regulated due to the nature of the product and are subject to numerous reviews and inquiries. While it is beyond the scope to explore in-depth each market separately, a high level analysis of price movements in WA and compared to other states and territories is offered. The majority of the analysis stems from household price movements, which generally align with business prices, however, there can be divergences between the two sectors.
Compared to national inflation levels for all utilities (electricity, gas, water and sewage and other household fuels), Perth utility prices have remained consistently below the national average, with a widening between the two series observed from 2003 onwards (figure 25).
Annual percentage changes in utility prices have remained smaller in Perth than Australia up until June 2009 (figure 26). As shown, since then the price of utilities grew at a faster rate in Perth than Australia for two years until June 2011. During this time, annual utility prices in Perth increased by around 20 per cent. from 2012 until the latest period in March 2015, inflation movements in utilities have become more consistent with the national averages.
Perth utility prices have remained consistently below the national average over the last decade.
Figure 25 Comparison of Perth adjusted Utilities CPI to Australia
note: CPI has been adjusted to an index reference period of March quarter 2000 = 100 – All Utilities include Electricity, Water and sewage, Gas and other household fuels.
source: BANKWEST CURTIN ECONOMICS CENTRE | ABS Cat No. 6401.0 Consumer Price Index, Table 11.
Mar
ch 2
000=
100
Mar
ch 2
000
Mar
ch 2
001
Mar
ch 2
002
Mar
ch 2
003
Mar
ch 2
004
Mar
ch 2
005
Mar
ch 2
006
Mar
ch 2
007
Mar
ch 2
008
Mar
ch 2
009
Mar
ch 2
010
Mar
ch 2
011
Mar
ch 2
012
Mar
ch 2
013
Mar
ch 2
014
Mar
ch 2
015
350
300
250
200
150
100
50
Perth Australia

61
53
The CosTs of Doing Business in WA Pressures and barriers to industry performance
Among state and territory capitals, Perth had the lowest growth in utility prices between 2000 and 2008, aligning with the minimum inflation values of all state and territories (figure 27). from 2009 onwards inflation increased substantially, reaching the maximum rate among all states and territories, but this has since decreased. While not returning to the minimum state value inflationary movements, utility price changes remain lower than the maximum state capital value.
Figure 26 Comparison of Perth Annual Inflation of Utilities to Australia
note: Rates presented above calculated on quarterly CPI of all Utilities – All Utilities include Electricity, Water and sewage, Gas and other household fuels. source: BANKWEST CURTIN ECONOMICS CENTRE | ABS Cat No. 6401.0 Consumer Price Index, Table 11.
Annu
al In
flati
on (%
)
Perc
enta
ge P
oint
diff
eren
ce (%
)
35
30
25
20
15
10
5
0
-5
-10
-15
35
30
25
20
15
10
5
0
-5
-10
-15
Difference Perth-Australia Perth Australia
Mar
ch 2
000
Mar
ch 2
001
Mar
ch 2
002
Mar
ch 2
003
Mar
ch 2
004
Mar
ch 2
005
Mar
ch 2
006
Mar
ch 2
007
Mar
ch 2
008
Mar
ch 2
009
Mar
ch 2
010
Mar
ch 2
011
Mar
ch 2
012
Mar
ch 2
013
Mar
ch 2
014
Mar
ch 2
015
Annu
al In
flati
on (%
)
35
30
25
20
15
10
5
0
-5
10
-15
Perth Max of States Inflations Min of States Inflations
Mar
ch 2
000
Mar
ch 2
001
Mar
ch 2
002
Mar
ch 2
003
Mar
ch 2
004
Mar
ch 2
005
Mar
ch 2
006
Mar
ch 2
007
Mar
ch 2
008
Mar
ch 2
009
Mar
ch 2
010
Mar
ch 2
011
Mar
ch 2
012
Mar
ch 2
013
Mar
ch 2
014
Mar
ch 2
015
Figure 27 Comparison of Perth Annual Inflation of Utilities to other states inflation
note: Rates presented above calculated on quarterly CPI of all Utilities – All Utilities include Electricity, Water and sewage, Gas and other household fuels. source: BANKWEST CURTIN ECONOMICS CENTRE | ABS Cat No. 6401.0 Consumer Price Index, Table 11.

54
Are all the Perth utilities cheaper than Australia? A disaggregation of utilities by the major sub groups illustrates that both electricity and water have been consistently lower than national prices, with the gap widening since 2009 (figure 28). This is despite inflation in utilities being the highest in Perth during this period. gas, however, is much more expensive in Perth compared to Australia, with prices increasing at a faster rate since 2009/10.
Figure 28 Comparison of Perth adjusted Utilities CPI to Australia
note: CPI of Utilities is adjusted relative to Utility CPI of March 2000.source: BANKWEST CURTIN ECONOMICS CENTRE | ABS Cat No. 6401.0 Consumer Price Index, Table 11.
Annu
al In
flati
on (%
)
Perth-Electricity Perth-Water & Sewage Perth-Gas Australia-Electricity Australia-Water & Sewage Australia-Gas
Mar
ch 2
000
Mar
ch 2
001
Mar
ch 2
002
Mar
ch 2
003
Mar
ch 2
004
Mar
ch 2
005
Mar
ch 2
006
Mar
ch 2
007
Mar
ch 2
008
Mar
ch 2
009
Mar
ch 2
010
Mar
ch 2
011
Mar
ch 2
012
Mar
ch 2
013
Mar
ch 2
014
Mar
ch 2
015
350
300
250
200
150
100
50

63
55
The CosTs of Doing Business in WA Pressures and barriers to industry performance
The WA electricity market has been the subject of numerous inquiries and has been on the government’s reform agenda for a number of years. The most significant reform was the vertical disaggregation of the state governments supply company – Western Power into four separate state-owned entities in 2006. These included Verve Energy,WesternPower,SynergyandHorizonPower.Priorto1997/98electricityprices in Western Australia had not seen any price increases for almost a decade. The 2006 reforms saw electricity prices increase significantly, particularly in the south West of the state.
electricity continues to be high on the government’s reform agenda, with a review into the market launched in 2014, initiated by the high subsidies that the state was paying ($500m per year), and the fact that electricity prices almost doubled between 2008 and 2014 (figure 29). Prices for Australia have also increased considerably during this time, but at a slightly slower rate – 78 per cent. Between 2014 and 2015, electricity prices in WA have come off slightly, decreasing by 4 per cent.
The static electricity prices in WA prior to the reforms is evident during the 2000s, withzerochangebetween2001and2009(Figure30).Between2009and2010,pricesincreased dramatically – by 26 per cent, whereas nationally it increased by only 15 per cent. The biggest price difference between Perth and the rest of Australia was between 2008 and 2009, where Perth recorded inflation 11 percentage points higher than the national average. since 2012, electricity price inflation in Perth has been among the lowest across state capitals.
Women are consistently more likely to be working in jobs that do not have paid leave entitlements when compared with men.
The 2011 -12 to 2012-13 period stands out for Western Australian regions, with almost all experiencing a reduction in the number of actively trading businesses over the period.
The price of electricity in Perth has increased by 82 per cent between 2008 and 2014.
Electricity
Figure 29 Comparison of Perth adjusted Electricity CPI to Australia
note: CPI has been adjusted to an index reference period of March quarter 2000 = 100.source: BANKWEST CURTIN ECONOMICS CENTRE | ABS Cat No. 6401.0 Consumer Price Index, Table 11.
Mar
ch 2
000=
100
Mar
ch 2
000
Mar
ch 2
001
Mar
ch 2
002
Mar
ch 2
003
Mar
ch 2
004
Mar
ch 2
005
Mar
ch 2
006
Mar
ch 2
007
Mar
ch 2
008
Mar
ch 2
009
Mar
ch 2
010
Mar
ch 2
011
Mar
ch 2
012
Mar
ch 2
013
Mar
ch 2
014
Mar
ch 2
015
350
300
250
200
150
100
50
Perth Australia

56
Business tariffsA comparison of business electricity tariffs over time is shown in figure 31 for small and medium businesses using metropolitan prices obtained from the By-laws. A similar pattern to residential electricity prices is observed for WA businesses across the 2009-2015 period. A general increase in business electricity tariffs is observed, particularlyformediumsizebusinessesusingmorethan50megawatthoursperannum. These businesses have seen tariffs increase considerably between 2011 and 2012, with the fixed daily charge increasing by 11 cents from 38 to 49 cents per day. since 2012, prices have risen more steadily. small businesses (those using less than 50 megawatts per annum) have also seen an increase in prices – a 50 per cent increase between 2009 and 2015 - from 28 to 42 cents.centnationally.forusingcentnationally.
Electricity tariffs for medium size businesses increased by 29% between 2011 and 2012.
Figure 30 Comparison of Perth Annual Inflation of Electricity prices to Australia
note: Rates presented above calculated on quarterly Electricity CPI.source: BANKWEST CURTIN ECONOMICS CENTRE| ABS Cat No. 6401.0 Consumer Price Index, Table 11.
Annu
al In
flati
on (%
)
Perc
enta
ge P
oint
diff
eren
ce (%
)
35
30
25
20
15
10
5
0
-5
-10
-15
35
30
25
20
15
10
5
0
-5
-10
-15
Difference Perth-Australia Perth Australia
Mar
ch 2
000
Mar
ch 2
001
Mar
ch 2
002
Mar
ch 2
003
Mar
ch 2
004
Mar
ch 2
005
Mar
ch 2
006
Mar
ch 2
007
Mar
ch 2
008
Mar
ch 2
009
Mar
ch 2
010
Mar
ch 2
011
Mar
ch 2
012
Mar
ch 2
013
Mar
ch 2
014
Mar
ch 2
015
Figure 31 Changes in Electricity Tariffs, 2009–2015
note: As in WA Department of Finance website (http://www.finance.wa.gov.au/) L2 tariff represents small businesses and L4 represents small\medium businesses. L2 tariff is applicable for consumers getting less than 50 megawatt hours per annum and L4 tariff is applicable for consumers getting 50 megawatt hours or more per annum. L2, L4 tariffs are applicable to regional WA. Low Daily usage represent first 1650 Kw/hr Usage.
source: BANKWEST CURTIN ECONOMICS CENTRE | Government of Western Australia- Department of Premier - Acts and Subsidiary legislation.
cent
s/da
y
60
50
40
30
20
10
0
2009
2010
2011
2012
2013
2014
2015
Fixed Charge /Day Low Daily Usage - /KW hr Exceeding Daily Usage - /KW hr
cent
s/da
y
60
50
40
30
20
10
0
2009
2010
2011
2012
2013
2014
2015
Fixed Charge /Day Low Daily Usage - /KW hr Exceeding Daily Usage - /KW hr
small business (low usage) Medium business (higher usage)
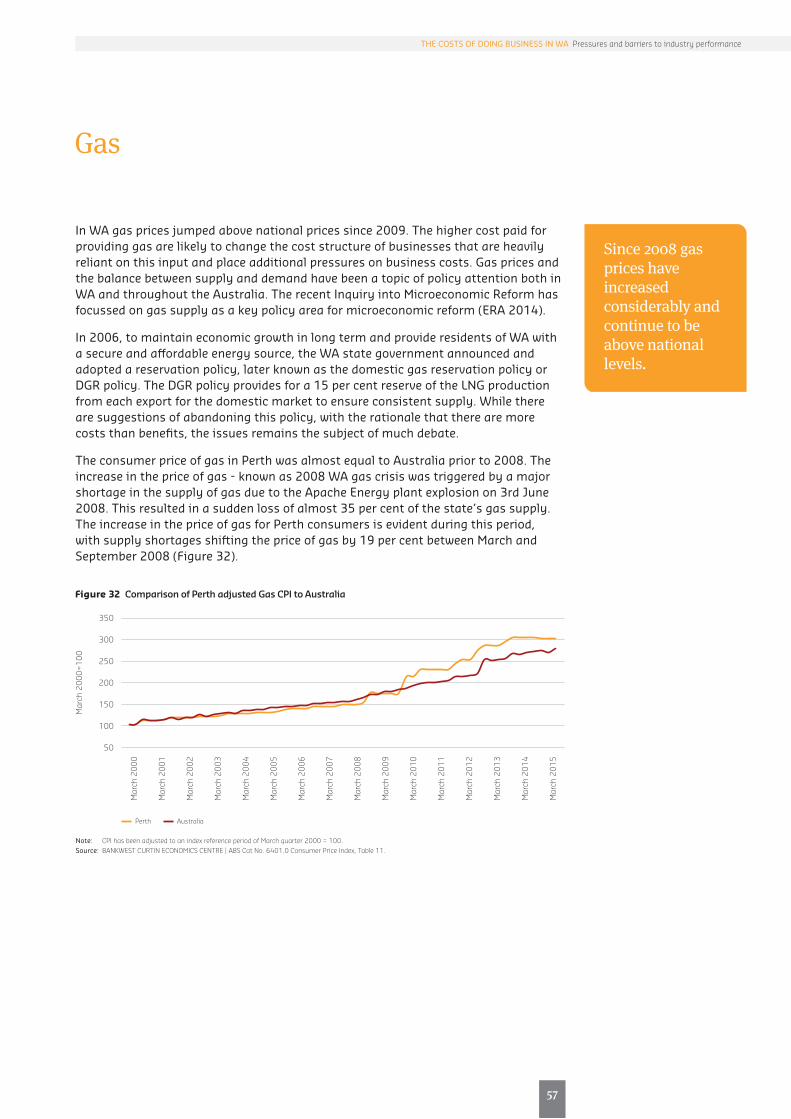
65
57
The CosTs of Doing Business in WA Pressures and barriers to industry performance
Women are consistently more likely to be working in jobs that do not have paid leave entitlements when compared with men.
Since 2008 gas prices have increased considerably and continue to be above national levels.
Gas
in WA gas prices jumped above national prices since 2009. The higher cost paid for providing gas are likely to change the cost structure of businesses that are heavily reliant on this input and place additional pressures on business costs. gas prices and the balance between supply and demand have been a topic of policy attention both in WA and throughout the Australia. The recent inquiry into Microeconomic Reform has focussed on gas supply as a key policy area for microeconomic reform (eRA 2014).
in 2006, to maintain economic growth in long term and provide residents of WA with a secure and affordable energy source, the WA state government announced and adopted a reservation policy, later known as the domestic gas reservation policy or DgR policy. The DgR policy provides for a 15 per cent reserve of the Lng production from each export for the domestic market to ensure consistent supply. While there are suggestions of abandoning this policy, with the rationale that there are more costs than benefits, the issues remains the subject of much debate.
The consumer price of gas in Perth was almost equal to Australia prior to 2008. The increase in the price of gas - known as 2008 WA gas crisis was triggered by a major shortage in the supply of gas due to the Apache energy plant explosion on 3rd June 2008. This resulted in a sudden loss of almost 35 per cent of the state’s gas supply. The increase in the price of gas for Perth consumers is evident during this period, with supply shortages shifting the price of gas by 19 per cent between March and september 2008 (figure 32).
Figure 32 Comparison of Perth adjusted Gas CPI to Australia
note: CPI has been adjusted to an index reference period of March quarter 2000 = 100.source: BANKWEST CURTIN ECONOMICS CENTRE | ABS Cat No. 6401.0 Consumer Price Index, Table 11.
Mar
ch 2
000=
100
Mar
ch 2
000
Mar
ch 2
001
Mar
ch 2
002
Mar
ch 2
003
Mar
ch 2
004
Mar
ch 2
005
Mar
ch 2
006
Mar
ch 2
007
Mar
ch 2
008
Mar
ch 2
009
Mar
ch 2
010
Mar
ch 2
011
Mar
ch 2
012
Mar
ch 2
013
Mar
ch 2
014
Mar
ch 2
015
350
300
250
200
150
100
50
Perth Australia

58
Between 2008 and 2012, gas price movements have been volatile, dipping between 2008 and 2009, followed by a sharp increase of 30 per cent between 2009 and 2010, and further decreases and rises. from 2011/12, Perth price movements have largely followed the national pattern.
Figure 33 Comparison of Perth Annual Inflation of Gas prices to Australia
note: Rates presented above calculated on quarterly Gas CPI.source: BANKWEST CURTIN ECONOMICS CENTRE| ABS Cat No. 6401.0 Consumer Price Index, Table 11.
Annu
al In
flati
on (%
)
Perc
enta
ge P
oint
diff
eren
ce (%
)
35
30
25
20
15
10
5
0
-5
10
-15
35
30
25
20
15
10
5
0
-5
10
-15
Difference Perth-Australia Perth Australia
Mar
ch 2
000
Mar
ch 2
001
Mar
ch 2
002
Mar
ch 2
003
Mar
ch 2
004
Mar
ch 2
005
Mar
ch 2
006
Mar
ch 2
007
Mar
ch 2
008
Mar
ch 2
009
Mar
ch 2
010
Mar
ch 2
011
Mar
ch 2
012
Mar
ch 2
013
Mar
ch 2
014
Mar
ch 2
015

67
59
The CosTs of Doing Business in WA Pressures and barriers to industry performance
Price movements have consistently remained lower than national movements, with the exception of the 2012-13 period and recent figures (figure 34). Between 2008 and 2012, water and sewage prices have increased at a faster rate in Perth compared to all state capitals. Perth water and sewage prices increased by 13 per cent between 2011 and 2012, whereas nationally they increased by only 4 per cent.
Compared to other utilities, water prices in Perth are among the countries lowest (figure 35). inflation in Perth water prices is among the lowest in the nation. Throughout the 2000s, water and sewage price inflation has been the minimum among state and territory capitals and currently remains well below the maximum state capital inflation level.
Water and Sewage
Figure 34 Comparison of Perth Annual Inflation of Water & Sewage prices to Australia
note: Rates presented above calculated on quarterly Water & Sewage CPI.source: BANKWEST CURTIN ECONOMICS CENTRE | ABS Cat No. 6401.0 Consumer Price Index, Table 11.
Annu
al In
flati
on (%
)
Perc
enta
ge P
oint
diff
eren
ce (%
)
35
30
25
20
15
10
5
0
-5
-10
-15
35
30
25
20
15
10
5
0
-5
-10
-15
Difference Perth-Australia Perth Australia
Mar
ch 2
000
Mar
ch 2
001
Mar
ch 2
002
Mar
ch 2
003
Mar
ch 2
004
Mar
ch 2
005
Mar
ch 2
006
Mar
ch 2
007
Mar
ch 2
008
Mar
ch 2
009
Mar
ch 2
010
Mar
ch 2
011
Mar
ch 2
012
Mar
ch 2
013
Mar
ch 2
014
Mar
ch 2
015
Annu
al In
flati
on (%
)
40
30
20
10
0
-10
-20
Perth Max of States Inflations Min of States Inflations
Mar
ch 2
000
Mar
ch 2
001
Mar
ch 2
002
Mar
ch 2
003
Mar
ch 2
004
Mar
ch 2
005
Mar
ch 2
006
Mar
ch 2
007
Mar
ch 2
008
Mar
ch 2
009
Mar
ch 2
010
Mar
ch 2
011
Mar
ch 2
012
Mar
ch 2
013
Mar
ch 2
014
Mar
ch 2
015
Figure 35 Comparison of Perth Annual Inflation of Water & Sewage to other states inflation
note: Rates presented above calculated on quarterly Water & Sewage CPI.source: BANKWEST CURTIN ECONOMICS CENTRE | ABS Cat No. 6401.0 Consumer Price Index, Table 11.

60
Occupancy and Housing
Occupancy
Commercial rents for office and retail spaces, workshops and other places of business operations can be a substantial cost component for many businesses, particularly those operating in the retail industry. The recent review into the cost of business in the retail sector highlights the significant costs associated with occupancy for those involved in retail and recent increases in costs per square metre of shop space and that rents as a proportion of revenue are generally higher in Australia compared to the united states and united Kingdom (Productivity Commission 2014).
figure 36 shows estimates of the average benchmark weekly rental price of office space in the Central Business Districts of five state capitals between 2009 and 2012 – Perth, sydney, Melbourne, Adelaide and Canberra. Average rental returns for PerthCBD office space has almost doubled in the four years to 2012, increasing from $250 to $470 per week. Perth CBD office space rents were the highest among the five capitals in 2011 and 2012.
All other capitals have seen very little change in the four years. sydney began with higher average weekly rents and has only seen slight increases over the same period – from $387 to $452. Canberra has seen little change over the period, with rentsshifting only slightly and coming off between 2011 and 2012. Adelaide has also seen relatively little change over the period.
Figure 36 Average Benchmark weekly rental return foroffice space in Central Business Districts, 2009-2012
Aver
age
wee
kly
rent
al re
turn
($pe
r sqm
) 500
450
400
350
300
250
200
150
100
50
0 2009 2010 2011 2012
note: Values represent weekly rental costs for offices less than 9000 square metres, except Sydney CBD and Canberra Civic which average price for offices less than 4500 and 4500 to 9000 square metres are reported.
source: BANKWEST CURTIN ECONOMICS CENTRE | Authors’ calculations from Property Council of Australia Benchmarks Survey of Operating Costs reports.
Perth CBD Sydney CBD Melbourne CBD Adelaide Canberra Civic
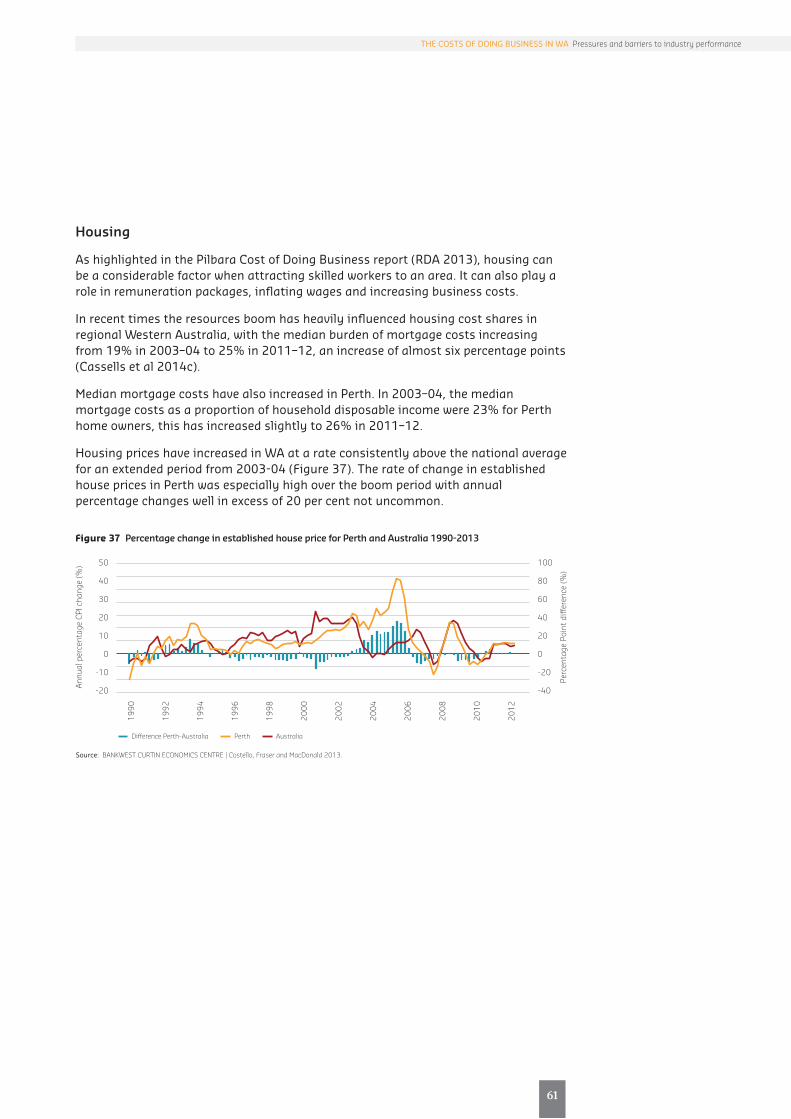
69
61
The CosTs of Doing Business in WA Pressures and barriers to industry performance
Housing
As highlighted in the Pilbara Cost of Doing Business report (RDA 2013), housing can be a considerable factor when attracting skilled workers to an area. it can also play a role in remuneration packages, inflating wages and increasing business costs.
in recent times the resources boom has heavily influenced housing cost shares in regional Western Australia, with the median burden of mortgage costs increasing from 19% in 2003–04 to 25% in 2011–12, an increase of almost six percentage points (Cassells et al 2014c).
Median mortgage costs have also increased in Perth. in 2003–04, the median mortgage costs as a proportion of household disposable income were 23% for Perth home owners, this has increased slightly to 26% in 2011–12.
housing prices have increased in WA at a rate consistently above the national average for an extended period from 2003-04 (figure 37). The rate of change in established house prices in Perth was especially high over the boom period with annual percentage changes well in excess of 20 per cent not uncommon.
Figure 37 Percentage change in established house price for Perth and Australia 1990-2013
source: BANKWEST CURTIN ECONOMICS CENTRE | Costello, Fraser and MacDonald 2013.
Annu
al p
erce
ntag
e CP
I cha
nge
(%)
Perc
enta
ge P
oint
diff
eren
ce (%
)50
40
30
20
10
0
-10
-20
100
80
60
40
20
0
-20
-40
Difference Perth-Australia Perth Australia
1990
1992
1994
1996
1998
2000
2002
2004
2006
2008
2010
2012

62
in 2003-04 only one in four WA households were paying more than 30 per cent towards housing costs, compared to over 30 per cent of households in the rest of Australia. By 2011-12, almost 40 per cent of all owner-occupier households were devoting over 30 per cent of their incomes towards mortgage repayments (figure 38). in addition, the proportion of households paying more than 40 per cent in disposable income has also been increasing for WA, from 14 per cent in 2003–04 to 22 per cent in 2011–12.
Figure 38 Mortgage cost shares for WA and Australia 2003-04 to 2011-12
Perc
enta
ge (%
)
45
40
35
30
25
20
15
10
5
0 2003-04
source: BANKWEST CURTIN ECONOMICS CENTRE | Authors’ calculations from ABS Survey of Income and Housing, 2003-04 to 2011-12.
30 per cent - Western Australia 30 per cent - Australia 40 per cent - Western Australia 40 per cent - Australia 50 per cent - Western Australia 50 per cent - Australia

Transport

Transport
Transportation is a key component of many business operations. it provides a means of transferring goods and workers to and from businesses and markets. some industries and entities will rely more heavily on transportation to conduct their business, with cost pressures in this area impacting on business operations and performance more than it may for other businesses. Whatever the business structure it is unlikely that transport costs do not play some sort of role in the overall business cost structure and business performance. The efficiency of transport is largely dominated by two key components – available infrastructure and fuel prices. The latter – fuel prices, can influence a number of business activities, including freight costs and worker productivity.
Australia wide there were 13.9 million petrol powered vehicles registered in 2014 accounting for 78.8% of the total vehicle fleet (ABs 2014). in comparison there were 3.3 million diesel powered vehicles accounting for 18.5% of the fleet. over the five year period from 2009, the number of Passenger vehicles and Light Commercial vehicles registered with diesel fuel increased by 103.6% and 65.4% respectively.
figure 39 shows the change in diesel pump prices across states and territories from 2007 to 2014. As expected Australian states and territories have tracked closely together over the last seven years. Queensland and Victoria have generally experienced lower diesel prices per litre at the pump than other states and territories, usually around 10 cents or more less than the highest price per litre which has consistently been in the northern Territory. Diesel prices increased rapidly between 2007 and 2008 among all states and territories, at a time when the economy was booming, but fell quickly in the following period. Prices have been increase since 2009, but have flattened in more recent periods. Western Australia has remained consistently the state with the third highest diesel price per litre across the period – second only to the northern Territory and Tasmania.
64
WA has the third highest diesel fuel price across all states and territories.

from 2007 to 2014, diesel prices in WA have consistently followed and remained above the national average (figure 40). The difference between the two prices has gradually disappeared, especially as the economy began to slow, however the gap has begun to widen again in the most recent period. The greatest difference between diesel prices in the West and nationally was observed in 2008, where the average price of diesel per litre was $1.70 in WA, compared to $1.62 nationally.
73
65
The CosTs of Doing Business in WA Pressures and barriers to industry performance
per
Lit
re
180.0
160.0
140.0
120.0
100.0
80.0
60.0
2007 2008 2009 2010 2011 2012 2013 2014
Figure 39 Diesel Prices across state and territories, 2007 – 2014
note: Data accessed from Australian Institute of Petroleum however, the information has been prepared by ORIMA Research Pty Ltd for the Australian Institute of Petroleum.
source: BANKWEST CURTIN ECONOMICS CENTRE | Australian Institute of Petroleum.
Western Australia NSW Vic QLD SA NT TAS
per
Lit
re
diff
eren
ce
180.0
160.0
140.0
120.0
100.0
80.0
60.0
25.0
20.0
15.0
10.0
5.0
0.0
-5.0
-10.0
-15.0
-20.0
-25.0
2007 2008 2009 2010 2011 2012 2013 2014
Difference National - Western Australia Western Australia National
Figure 40 Comparison of Diesel Prices, Western Australia and Australia, 2007 to 2014
note: Data accessed from Australian Institute of Petroleum however, the data prepared by ORIMA Research Pty Ltd for the Australian Institute of Petroleum. source: BANKWEST CURTIN ECONOMICS CENTRE | Australian Institute of Petroleum.
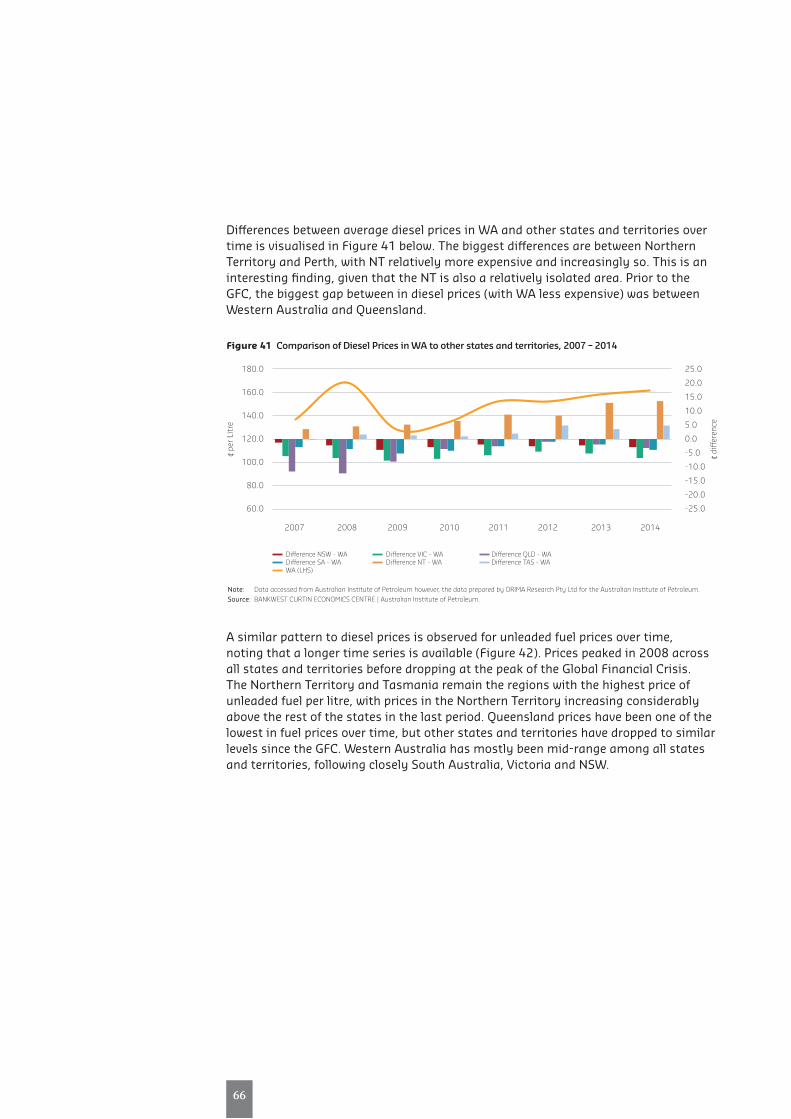
Differences between average diesel prices in WA and other states and territories over time is visualised in figure 41 below. The biggest differences are between northern Territory and Perth, with nT relatively more expensive and increasingly so. This is an interesting finding, given that the nT is also a relatively isolated area. Prior to the gfC, the biggest gap between in diesel prices (with WA less expensive) was between Western Australia and Queensland.
A similar pattern to diesel prices is observed for unleaded fuel prices over time, noting that a longer time series is available (figure 42). Prices peaked in 2008 across all states and territories before dropping at the peak of the global financial Crisis. The northern Territory and Tasmania remain the regions with the highest price of unleaded fuel per litre, with prices in the northern Territory increasing considerably above the rest of the states in the last period. Queensland prices have been one of the lowest in fuel prices over time, but other states and territories have dropped to similar levels since the gfC. Western Australia has mostly been mid-range among all states and territories, following closely south Australia, Victoria and nsW.
66
per
Lit
re
diff
eren
ce
180.0
160.0
140.0
120.0
100.0
80.0
60.0
25.0
20.0
15.0
10.0
5.0
0.0
-5.0
-10.0
-15.0
-20.0
-25.0
2007 2008 2009 2010 2011 2012 2013 2014
Difference NSW - WA Difference VIC - WA Difference QLD - WA Difference SA - WA Difference NT - WA Difference TAS - WA WA (LHS)
Figure 41 Comparison of Diesel Prices in WA to other states and territories, 2007 – 2014
note: Data accessed from Australian Institute of Petroleum however, the data prepared by ORIMA Research Pty Ltd for the Australian Institute of Petroleum.source: BANKWEST CURTIN ECONOMICS CENTRE | Australian Institute of Petroleum.

The alignment between WA and other states and territories in unleaded prices over time is illustrated clearly in figure 43. in the early 2000s WA was more expensive at the pump, but by 2005 unleaded prices per litre were very similar to national prices. The increase since in prices since the gfC is evident.
75
67
The CosTs of Doing Business in WA Pressures and barriers to industry performance
Figure 42 Unleaded fuel Prices across states and territories, 2002 - 2014
note: Data accessed from Australian Institute of Petroleum however, the information has been prepared by ORIMA Research Pty Ltd for the Australian Institute of Petroleum.
source: BANKWEST CURTIN ECONOMICS CENTRE | Australian Institute of Petroleum.
per
Lit
re
180.0
160.0
140.0
120.0
100.0
80.0
60.0
2007 2008 2009 2010 2011 2012 2013 2014
Western Australia NSW Vic QLD SA NT TAS
Figure 43 Comparison of Unleaded Prices, WA and Australia, 2002 - 2014
note: Data accessed from Australian Institute of Petroleum however, the information has been prepared by ORIMA Research Pty Ltd for the Australian Institute of Petroleum.
source: BANKWEST CURTIN ECONOMICS CENTRE | Australian Institute of Petroleum.
per
Lit
re
diff
eren
ce
180.0
160.0
140.0
120.0
100.0
80.0
60.0
25.0
20.0
15.0
10.0
5.0
0.0
-5.0
-10.0
-15.0
-20.0
-25.0
2002 2003 2004 2005 2006 2007 2008 2009 2010 2011 2012 2013 2014
Difference National - Western Australia Western Australia National

Differences between average unleaded prices in WA and other states and territories over time are shown in figure 44. Compared to other states and territories, the northern Territory and Tasmania again have higher prices per litre in unleaded petrol, with this difference increasing in the last five years. in 2014, the northern Territory was 21 cents more expensive per litre of unleaded fuel than WA, and Tasmania 9 cents dearer. unleaded fuel in WA was slightly more expensive in most other states and territories in 2014.
68
In 2014, the Northern Territory was 21 cents more expensive per litre of unleaded fuel than WA.
Figure 44 Comparison of Unleaded Prices in WA to other states and territories, 2007 – 2014
note: Data accessed from Australian Institute of Petroleum however, the data prepared by ORIMA Research Pty Ltd for the Australian Institute of Petroleum.source: BANKWEST CURTIN ECONOMICS CENTRE | Australian Institute of Petroleum.
per
Lit
re
diff
eren
ce
180.0
160.0
140.0
120.0
100.0
80.0
60.0
25.0
20.0
15.0
10.0
5.0
0.0
-5.0
-10.0
-15.0
-20.0
-25.0
2022 2003 2004 2005 2006 2007 2008 2009 2010 2011 2012 2013 2014
Difference NSW - WA Difference VIC - WA Difference QLD - WA Difference SA - WA Difference NT - WA Difference TAS - WA WA (LHS)

and regulations
Red Tape

Regulations and compliance are widespread among Australian society, and no entity is aware of this more than the business community. Regulation exists primarily to avoid unwanted community outcomes, however, how this is accomplished, by whom and whether the intervention was necessary in the first place can often result in unwarranted demands on businesses – commercial and not-for-profit alike.
good regulation can generate a number of positive benefits, for workers, the economy, community and the environment – however, the sweet spot that balances necessary protectionism and liberalism is often hard to strike. unnecessary or over-burdensome regulations and compliance (“red tape”) can inhibit business performance and potential.
numerous reports have focussed on the degree of regulatory burden within Australia and the need to balance necessary regulations and compliance with efficient business operations. The Council of Australian governments (CoAg), in recognition of the role that Australia’s federal system plays in adding to the ribbons of red tape that exist, continues to cite deregulation and its goal of reducing red tape as a priority among all governments (CoAg 2014).
While similar issues around red tape exist across state borders, including duplication of regulations and taxation and compliance, Western Australia faces a number of persistent issues in relation to inefficient or over-regulated practices. The recent comprehensive inquiry into Microeconomic Reform in Western Australia identified five key areas that require specific attention to enhance competition – retail trading hours, the taxi industry, potato market, housing sector and domestic gas reservation policy (eRA 2014). These areas suffer from a number of issues requiring changes to regulatory policy and practice. A compendium report to the Microeconomic Reform inquiry that focussed on red tape in WA found that four sectors were most affected by regulatory burden – the food industry, resources sector, tourism sector and land and infrastructure development were (synergies 2014). The source of regulatory burden for each sector varies but a common source identified was inconsistencies and overlap between different levels of government (eRA 2014).
government regulation and compliance was more likely to be cited as a barrier to performance as the economy grew rapidly (figure 45). since the global financial crisis this has decreased among all firms at similar rates, with other barriers more likely to become problematic. innovation-active businesses are much more likely to report government regulation and compliance as a barrier to performance than non-innovating firms. in 2009-10, 18 per cent of innovation-active businesses reported government regulation and compliance as a barrier to performance, whereas only 11 per cent of non-innovation active businesses reported this issue.
70

it has long been considered that small businesses face greater costs and barriers when it comes to regulation and compliance. This is due to the limited resources that they have to draw upon and lower economies of scale than larger firms. evidence from the Australian Business survey supports this theory, with higher proportions of smalltomediumsizebusinessesmorelikelytoreportregulationandcomplianceasa barrier to performance than big businesses employing 200 or more persons (figure 46). in the latest period, around 15 per cent of these businesses reported government regulation and compliance as a barrier to business performance.
Theproportionofmicro-sizebusinesses(employing0-4persons)reportinggovernment regulation as a business barrier increased between 2008-09 and 2010-11, but has since tapered off. Big businesses have increased their reports of government regulation and compliance as a barrier to performance since 2009-10 – from 10 to 18 per cent.
79
71
The CosTs of Doing Business in WA Pressures and barriers to industry performance
Figure 45 Proportion of firms citing government regulation and compliance as a barrier to performance
note: Businesses were asked to identify barriers that significantly hampered general business activities or performance. Innovative activity includes any work that was intended to, or did, result in the introduction of an innovation. An innovation is the introduction of a new or significantly improved good or services; operational process; organisational/managerial process; or marketing method.
source: BANKWEST CURTIN ECONOMICS CENTRE | ABS Cat No. 8167.0 Selected Characteristics of Australian Business, 2012-13, Table 1, Barriers to general business activities or performance.
Perc
enta
ge
2006-07 2007-08 2008-09 2009-10 2010-11 2001-12 2012-13
20
18
16
14
12
10
8
6
4
2
0
Innovation-active businesses Non innovation-active businesses All businesses

government regulation and compliance can impact upon certain sectors more than others, as shown in figure 47. Businesses operating in the information Media and Telecommunications sector were the least likely to report government regulation and compliance as a barrier to performance in each period from 2006-07 to 2012-13. An increase was evident between 2008-09 and 2009-10, from 5 to around 10 per cent, however this has since come back to previous levels.
Businesses operating in rental, hiring and real estate services and financial and insurance services sectors have increased reports of government regulation as a barrier to business performance substantially between 2006-07 and 2012-13. in 2006-07 the proportion of businesses operating in the rental, hiring and real estate sector that reported government regulation and compliance as a barrier to business performance was 5.2 per cent, by 2012-13 this had increased to 13.6 per cent. similar increases were observed for the finance sector, increasing from 17 to 30 per cent between 2006-07 and 2010-11. This has since decreased to 22.4 per cent.
in the last two periods, the electricity, gas, water and waste services sector has also seen an increase in regulation and compliance barriers, peaking at almost 1 in 4 businesses reporting this issue in 2011-12, however this has since reduced to 18 per cent of businesses.
72
Figure 46 Proportion of firms citing government regulation and compliance as a barrier to performance by firm size, 2006-07 to 2012-13
note: Businesses were asked to identify barriers that significantly hampered general business activities or performance. source: BANKWEST CURTIN ECONOMICS CENTRE | ABS Cat No. 8167.0 Selected Characteristics of Australian Business, 2012-13, Table 1, Barriers to general
business activities or performance.
Perc
enta
ge
2006-07 2007-08 2008-09 2009-10 2010-11 2001-12 2012-13
20
18
16
14
12
10
8
6
4
2
0
0-4 persons 5-19 persons 20-199 persons 200 or more persons

Businesses operating in the state’s biggest sector in terms of economic value – mining, have recorded an increase in government regulations and compliance being a hindrance to their performance. in 2006-07, 13.5 per cent of businesses operating in the mining sector reported government regulations as a significant barrier to performance, by 2010-11 this had increased to 1 in 5 businesses. A slight reduction has been seen since, with 17.9 per cent of mining businesses citing government regulation and compliance as a significant performance barrier.
81
73
17.9% of businesses operating in the mining sector reported government regulation being a significant barrier to business performance in 2012-13.
The CosTs of Doing Business in WA Pressures and barriers to industry performance
Figure 47 Proportion of firms citing government regulation and compliance as a barrier to performance by industry, 2006-07 to 2012-13
note: Businesses were asked to identify barriers that significantly hampered general business activities or performance. source: BANKWEST CURTIN ECONOMICS CENTRE | ABS Cat No. 8167.0 Selected Characteristics of Australian Business, 2012-13, Table 1, Barriers to general
business activities or performance.
0 2006-07 2007-08 2008-09 2009-10 2010-11 2011-12 2012-13
Perc
enta
ge
35
30
25
20
15
10
5
0
Mining Manufacturing
Electricity, Gas, Water and Waste Services Construction
Wholesale Trade Retail Trade
Accommodation and Food Services Transport, Postal and Warehousing
Information Media and Telecommunications Financial and Insurance Services
Rental, Hiring and Real Estate Services Professional, Scientific and Technical Services
Administrative and Support Services Health Care and Social Assistance
Arts and Recreation Services Other Services


is a booma boom?WhenWA Regions

76
Regional Business Profile
The profile of WA businesses at a state level can mask important regional patterns. The dominance of the Perth metropolitan area is clear, with three-quarters of all Western Australian businesses located in this region – 162,495 entities (figure 48 and Table 1). south West has the second highest number of businesses (15,045), housing almost 7 per cent of all WA businesses. This is followed by the Wheatbelt (4.4%), Peel (3.6%) and great southern (3.1%).
While the general pattern of higher proportions of smaller entities and lower proportions of larger businesses is evident, a number of WA regions have slightly different profiles (Table 1). The agricultural Wheatbelt area has a higher proportion of mico-businesses employing 1-4 persons when compared to the state overall – around 30 per cent compared with the state average of 24.8 per cent.
As expected, mining dominant areas, including goldfields-esperance, the Pilbara, Kimberley and gascoyne have higher proportions of businesses employing more than 200 employees – constituting around 5 per cent of all businesses. These areas are more likely to house businesses that are employers than other areas throughout Western Australia (figure 49).
in terms of overall counts, gascoyne has the lowest number of actively trading businesses – just under 1,000 entities. The gascoyne region has a higher proportion of small businesses, employing 5-19 workers – 13.8 per cent compared to the state average of just under 10 per cent. The Kimberley and goldfields-esperance regions also follows this pattern, with a higher proportion of small businesses than the state average – 14.9 and 13.4 per cent respectively.
Three-quarters of all WA businesses are located in Perth.
Figure 48 Proportion of all WA businesses among WA regions, 2014
source: BANKWEST CURTIN ECONOMICS CENTRE | ABS Cat no. 81650 Counts of Australian Businesses, Jun 2010 to Jun 2014.
74.3%
6.9%
4.4%
3.6%
3.1%
2.4% 2.0% 1.1% 1.1%0.5%
Perth
South West
Wheatbelt
Peel
Great Southern
Mid West
Goldfields - Esperance
Pilbara
Kimberley
Gascoyne

85
77
The CosTs of Doing Business in WA Pressures and barriers to industry performance
Perth is more likely to consist of non-employing actively trading businesses, with volume in this region driving the state average (figure 49). Areas surrounding metropolitan Perth – south West, Wheatbelt, Peel and great southern, follow similar trends to the state average in terms of the proportion of employing and non-employing businesses. The goldfields-esperance region has the highest proportion of employing businesses – at 46 per cent. This is followed by gascoyne (44.3%) and the Kimberley (41.2%).
Region Total non-employing 1-4 5-19 20-199 200+
Perth 162,495 62.8 24.4 9.6 3.0 0.1
south West 15,045 62.7 23.2 11.0 3.0 0.0
Wheatbelt 9,715 60.1 29.7 8.9 1.3 0.0
Peel 7,787 61.7 26.0 9.5 2.8 0.0
great southern 6,779 62.6 25.0 10.1 2.2 0.0
Mid West 5,152 58.9 27.5 11.0 2.6 0.0
goldfields-esperance 4,413 54.0 29.1 13.4 3.4 0.1
Pilbara 2,375 58.8 24.5 11.6 5.1 0.0
Kimberley 2,369 56.0 23.8 14.9 5.1 0.1
gascoyne 988 55.7 25.2 13.8 5.4 0.0
All WA 218,800 62.0 24.8 9.9 3.1 0.2
source: BANKWEST CURTIN ECONOMICS CENTRE | ABS Cat no. 81650 Counts of Australian Businesses, Jun 2010 to Jun 2014.
Table 12 Proportion of business by employment size, WA regions, June 2014
The Goldfields-Esperance region has the highest proportion of employing businesses – at 46 per cent.
Figure 49 Proportion of employing and non-employing businesses, WA regions, 2014
source: BANKWEST CURTIN ECONOMICS CENTRE | ABS Cat no. 81650 Counts of Australian Businesses, Jun 2010 to Jun 2014.
Prop
orti
on o
f bus
ines
ses
70
60
50
40
30
20
10
0
62.8
37.2
Non-employing Employing
62.7
37.3
60.1
39.9
61.7
38.3
62.6
37.4
58.9
41.1
54
46
Pert
h
Sout
h W
est
Whe
atbe
lt
Peel
Gre
at S
outh
ern
Mid
Wes
t
Gol
dfiel
ds -
Esp
eran
ce
Pilb
ara
Kim
berle
y
Gas
coyn
e
All W
A
58.8
41.2
56
44
55.7
44.3
62
38

78
Comparing annual turnover of businesses, figure 3 shows the variation that exists among WA regions. The goldfields-esperance, Kimberley and Pilbara regions all have greater proportions of businesses with annual turnover of $2 million or more – 11 per cent compared with the state average of 7 per cent. south West has the lowest proportion of active businesses with turnover of less than $2 million – 6 per cent. The gascoyne region has a greater proportion of businesses reporting annual turnover of $200,000 to under $2 million and lower proportions of small businesses turning over less than $50,000 each year. The Wheat Belt has a much higher presence of businesses with an annual turnover of between $500,000 and less than $2 million, than any other region, reflecting the farming activity in the region. Almost 1 in 4 actively trading businesses in the Wheat Belt report an annual turnover of between $500k–$2milllion.
Western Australia’s regions have seen some changes over the last five years in terms of the number of actively trading businesses in each region. figure 51 shows the annual percentage change in the total number of actively trading businesses for WA’s regions between 2009 and 2014.
The 2011 -12 to 2012-13 period stands out for Western Australian regions, with almost all experiencing a reduction in the number of actively trading businesses over the period, consistent with state and national trends. The Peel and Kimberley regions were hardest hit in the period, with a reduction of 4.7 and 4.4 per cent of businesses respectively. This represented a decrease of 373 businesses in the Peel region and 110 for the Kimberley. The gascoyne area was the only area to increase business counts between 2011-12 and 2012-13. The Wheatbelt experienced three consecutive periods where business counts declined year on, however, this has since reversed in the last period, with the area showing an overall increase in business counts between 2012-13 and 2013-14 – increasing by 2.1 per cent, which is equivalent to a gain of 197 entities.
Figure 50 Proportion of businesses by annual turnover size, WA regions, 2014
source: BANKWEST CURTIN ECONOMICS CENTRE | ABS Cat no. 81650 Counts of Australian Businesses, Jun 2010 to Jun 2014.
Perc
enta
ge (%
)
100908070605040302010
0
$2m or more $500k to < $2m $200k to < $500k $100k to < $200k $50k to < $100k Zero to < $50k
Gas
coyn
e
Gol
dfiel
ds -
Esp
eran
ce
Gre
at S
outh
ern
Kim
berle
y
Mid
Wes
t
Peel
Pert
h
Pilb
ara
Sout
h W
est
Whe
atbe
lt
All W
A
19% 21% 25% 20% 21% 23% 25% 20% 26% 21% 25%
14% 13%15%
13% 13%17% 16%
14%17%
12%16%
19% 16%16%
15% 16%19% 18%
17%
18%
16%
18%
23%20%
19%
20% 19%
21% 19%20%
19%
19%
19%
17%19%
18%20% 22%
14% 14%17%
15%
24%15%
8% 11% 7% 11% 9% 6% 7% 11% 6% 9% 7%

87
79
The CosTs of Doing Business in WA Pressures and barriers to industry performance
Data for the most recent period – from 2012-13 to 2013-14 reveals that most regions have seen a gain in the number of businesses operating in that area, however the growth has been slower than in previous years. These patterns are to be expected, as projects and economic activity ebbs and flows, and can reflect movement of self-employed workers in a flexible labour market. however, a consistent period of reduced business activity and net losses in businesses that are actively employing workers in the area can highlight a declining local economy. These results must be taken together with overall employment figures in regions to be more deterministic, as a reduction of business counts could flag a number of things, including amalgamation of businesses.
The 2011 -12 to 2012-13 period stands out for Western Australian regions, with almost all experiencing a reduction in the number of actively trading businesses over the period.
Figure 51 Annual percentage change of total number of businesses by region, June 2009 – June 2014
source: BANKWEST CURTIN ECONOMICS CENTRE | ABS Cat no. 81650 Counts of Australian Businesses, Jun 2010 to Jun 2014.
Bus
ines
s co
unts
, ann
ual p
erce
ntag
e ch
ange
8.0
6.0
4.0
2.0
0.0
-2.0
-4.0
-6.0
WA Region
Gas
coyn
e
Gol
dfiel
ds -
Esp
eran
ce
Gre
at S
outh
ern
Kim
berle
y
Mid
Wes
t
Peel
Pert
h
Pilb
ara
Sout
h W
est
Whe
atbe
lt
09-10 10-11 11-12 12-13 13-14

80
Cost pressures can vary among businesses, industries and regions. Western Australia is no exception to this, particularly when it comes to regional differentials around both cost of living and cost of doing business pressures. The expansive and remote geography of the state can make business operations more challenging than might otherwise be the case. A recent report on the cost of doing business in the Pilbara has highlighted these differences, but also the challenge in accessing regional price differentials (RDA 2013).
The Department of Regional Development, through its Royalties for Regions program has recently embarked on producing a Regional price index series, which allows price comparison of WA’s major centres and regions to Perth. however, these data primarily relate to household consumption, which while generally aligning with business cost movements, remain a secondary data source. in this section we bring together a number of pieces of information that seek to inform differences in business costs across Western Australia’s major regions.
Regional Business Costs

89
81
The CosTs of Doing Business in WA Pressures and barriers to industry performance
As discussed above, labour can constitute a considerable component of business costs and are cited as the number one cost pressure by WA businesses. The first focus on Western Australia report – sharing the Boom, illustrated the income variability that exists among WA’s regions - with mining prosperous areas more likely to have higher income households than other areas throughout the state (Cassells et al. 2014d).
Changes in average annual wages across WA’s major regions between 2005-06 and 2013-14 are shown in figure 52. Wages in the Pilbara have grown the fastest, increasing by 60 per cent in the ten years to 2013-14, from an average annual wage of $58,000 to $93,000. Annual wages for Perth and Peel have tracked closely together over the last ten years, which is unsurprising given the proximity of the areas to each other. Wages in these regions have also grown by 60 per cent in the last decade, from around $40,000 to $64,000 – an increase of 60 per cent. The goldfields-esperance region has seen substantial wage growth across the period, with employees averaging the second highest wages in the state – around $69,000 each year.
Wages in the Pilbara have grown the fastest in the state, increasing by 60 per cent in the ten years to 2013-14.
100,000
90,000
80,000
70,000
60,000
50,000
40,000
30,000
Gascoyne Total Goldfields - Esperance Total Great Southern Total Kimberley Total Mid West Total Peel Perth Pilbara Total South West Total Wheatbelt Total
2005
-06
2006
-07
2007
-08
2008
-09
2009
-10
2010
-11
2011
-12
2012
-13
2013
-14
Figure 52 Average annual wages by WA region, 2005-06 to 2013-14
source: BANKWEST CURTIN ECONOMICS CENTRE | ABS Cat No.1379.0, National Regional Profile, 2009-13.
WA Regional Wages

82
occupancy costs for businesses can be substantial. Lack of supply, particularly in regional areas can increase costs, placing pressure on actively trading businesses and inhibiting potential incumbents. Commercial property prices per square metre have been estimated for WA regions using specialised sale data from Landgate.
Commercial property sale prices per square metre for retail space, workshop space, office space, and combined office and workshop space across Western Australia’s regions are shown in figure 53. The Pilbara and Perth have recorded the highest sale price per square metre for retail space in the last two periods, averaging $6,340 and $5,920 per square metre, respectively. increases in commercial all property classifications, across all regions are evident. The resource rich areas of the Pilbara, Kimberley and more recently gascoyne area have seen big increases across the period. Perth commercial property space has also increased substantially – particularly for retail and office space. The goldfields-esperance, despite its high wages and relative wealth, has lower retail sale prices based on an average square metre. These results may be driven by lower commercial property turnover in these areas.
WA Regional Occupancy and Housing
Figure 53 Commercial property per square metre, WA Regions, 2000-2014
source: BANKWEST CURTIN ECONOMICS CENTRE | Landgate specialised data request.
$ pe
r squ
are
met
re
$ pe
r squ
are
met
re$
per s
quar
e m
etre
$ pe
r squ
are
met
re
9,0008,0007,0006,0005,0004,0003,0002,0001,000
0
9,0008,0007,0006,0005,0004,0003,0002,0001,000
0
9,0008,0007,0006,0005,0004,0003,0002,0001,000
0
9,0008,0007,0006,0005,0004,0003,0002,0001,000
0
Gas
coyn
e
Gol
dfiel
ds -
Esp
eran
ce
Gre
at S
outh
ern
Kim
berle
y
Mid
Wes
t
Peel
Pert
h
Pilb
ara
Sout
h W
est
Whe
atbe
lt
Gas
coyn
e
Gol
dfiel
ds -
Esp
eran
ce
Gre
at S
outh
ern
Kim
berle
y
Mid
Wes
t
Peel
Pert
h
Pilb
ara
Sout
h W
est
Whe
atbe
lt
Gas
coyn
e
Gol
dfiel
ds -
Esp
eran
ce
Gre
at S
outh
ern
Kim
berle
y
Mid
Wes
t
Peel
Pert
h
Pilb
ara
Sout
h W
est
Whe
atbe
lt
Gas
coyn
e
Gol
dfiel
ds -
Esp
eran
ce
Gre
at S
outh
ern
Kim
berle
y
Mid
Wes
t
Peel
Pert
h
Pilb
ara
Sout
h W
est
Whe
atbe
lt
Retail space office space only
Workshop space onlyoffice & workshop space
2002-2002 2003-2005 2006-2008 2009-2011 2012-2014

91
83
The CosTs of Doing Business in WA Pressures and barriers to industry performance
Residential occupancy costs can also be an important factor and can contribute to labour costs, especially for regional areas. housing prices can also play a key role in attracting and retaining skilled workers in an area.
The regional housing index is a reasonable proxy of the relative cost of occupancy for residents and businesses in regional areas throughout Western Australia. similar to the CPi, it includes mortgage interest rates, local government rates and charges, house repairs and maintenance, private rents, consumer credit charges and insurances costs (DRD 2011).
generally housing prices have remained lower than Perth throughout all years and most WA regions (figure 54). notable exceptions are the usual suspects – the Pilbara, Kimberley and more recently the gascoyne regions. housing costs in these regions have been higher than Perth throughout the six years from 2007 to 2013. in 2011, housing costs in the Kimberley were double that of Perth, but have since dropped back to around 40 per cent higher than the state capital.
Figure 54 Regional Housing Index, 2007-2013
note: Index in every year is relative to Perth, therefore benchmark for each year is different. source: BANKWEST CURTIN ECONOMICS CENTRE | WA – DRD Regional Price Index 2007, 2011, 2013.
WA
regi
onal
CPI
(Per
th=1
00)
250
200
150
100
50
0
Non-employing Employing Employing
Gas
coyn
e
Gol
dfiel
ds
Gre
at S
outh
ern
Kim
berle
y
Mid
Wes
t
Peel
Pilb
ara
Sout
h W
est
Whe
atbe
lt
Pert
h

84
Adequate supply for key utilities (electricity and gas) throughout WA’s regions has been a policy concern for a number of years. Regional areas often experience greater cost pressures for goods and services, with supply typically more expensive and less demand in terms of volume.
electricity tariffs in WA’s regional areas have largely remained similar when compared to metropolitan WA, however, over the past three years, some small differences have been observed (figure 55). for small businesses (L1-L2) in 2012, all fixed electricity prices and tariffs in regional WA areas were slightly higher than metro areas. By 2013, this had reversed, with metro prices more expensive than the regions. in 2014, metro prices for daily low and excess usage exceeded regional areas, however, fixed charges for small businesses in regional areas were higher than those in metro.
Pricesformediumsizebusinesses,consumingmorethan50megawatthoursperannum are shown in the second panel of figure 55. similar to small businesses, tariffs for medium businesses in regional WA were higher than metro areas in 2012. in 2013, no differences were observed between the two areas. however, more recently, regional areas have experienced higher electricity prices than those in metro areas.
WA Regional Utilities
Figure 55 Differences in Regional and Metro Business Electricity Tariffs
note: As in WA Department of Finance website (http://www.finance.wa.gov.au/) L1 and L2 tariffs represent small businesses and L3 and L4 represent small\medium businesses. L1 and L2 tariffs are applicable for consumers getting less than 50 megawatt hours per annum and L3 and L4 tariffs are applicable for consumers getting 50 megawatt hours or more per annum. L2, L4 tariffs are applicable to regional WA. Low Daily usage represent first 1650 Kw/hr Usage.
source: BANKWEST CURTIN ECONOMICS CENTRE | Government of Western Australia – Department of Premier - Acts and Subsidiary legislation.
1
0.5
0
-0.5
-1
-1.5
0.5
0
-0.5
-1
-1.5
-2
-2.5
2012 2013 2014 2012 2013 2014
Difference Fixed charged - L1-L2 Difference - Low Daily Usage - L1-L2 Difference - Exceeding Daily Usage - L1-L2
Difference Fixed charged - L3-L4 Difference - Low Daily Usage - L3-L4 Difference - Exceeding Daily Usage - L3-L4

93
85
The CosTs of Doing Business in WA Pressures and barriers to industry performance
As discussed earlier, transport prices can be an important component of business operations. for regional areas, businesses typically rely more heavily on the transportation of goods, services and people in and out of the area in order to maintain regular business activity. The regional transport index produced by the Department of Regional Development is a good proxy of the relative cost of transportation for businesses in regional areas throughout Western Australia. it includes motor vehicles, fuel (diesel and unleaded), tyres, auto parts and maintenance and motoring charges such as drivers licence fees and stamp duty (DRD 2011).
figure 56 presents a series of transport consumer price indices relative to Perth, which has a base of 100 in each year. Many of the regions surrounding Perth have seen similar price growth in transport commodities, with little difference between these areas and the state capital. Peel is the exception to this pattern for the last period (2013), where transport prices were almost 4 per cent higher than Perth. This is an unusual finding, given the proximity of Peel to Perth.
Remote areas including the Kimberley, Pilbara and gascoyne have experienced higher transport costs compared with Perth, particularly in the last two periods. in 2011 transport prices in the Kimberley were 14 per cent higher than Perth – by 2013, the relativity to Perth had decreased to 9 per cent higher. Transport prices in the Pilbara on the other hand have remained persistently higher than Perth – around 12 per cent in 2011 and 2013. The gascoyne area has also experienced higher transport prices relative to Perth, with this decreasing somewhat between 2011 and 2013.
WA Regional Transport
Figure 56 Regional Transport Index, 2007-2013
note: Index in every year is relative to Perth, therefore benchmark for each year is different. source: BANKWEST CURTIN ECONOMICS CENTRE | WA - DRD Regional Price Index 2007, 2011, 2013.
WA
regi
onal
CPI
(Per
th=1
00)
120
115
110
105
100
95
90
2007 2011 Employing
Gas
coyn
e
Gol
dfiel
ds
Gre
at S
outh
ern
Kim
berle
y
Mid
-Wes
t
Peel
Pilb
ara
Sout
h-W
est
Whe
atbe
lt
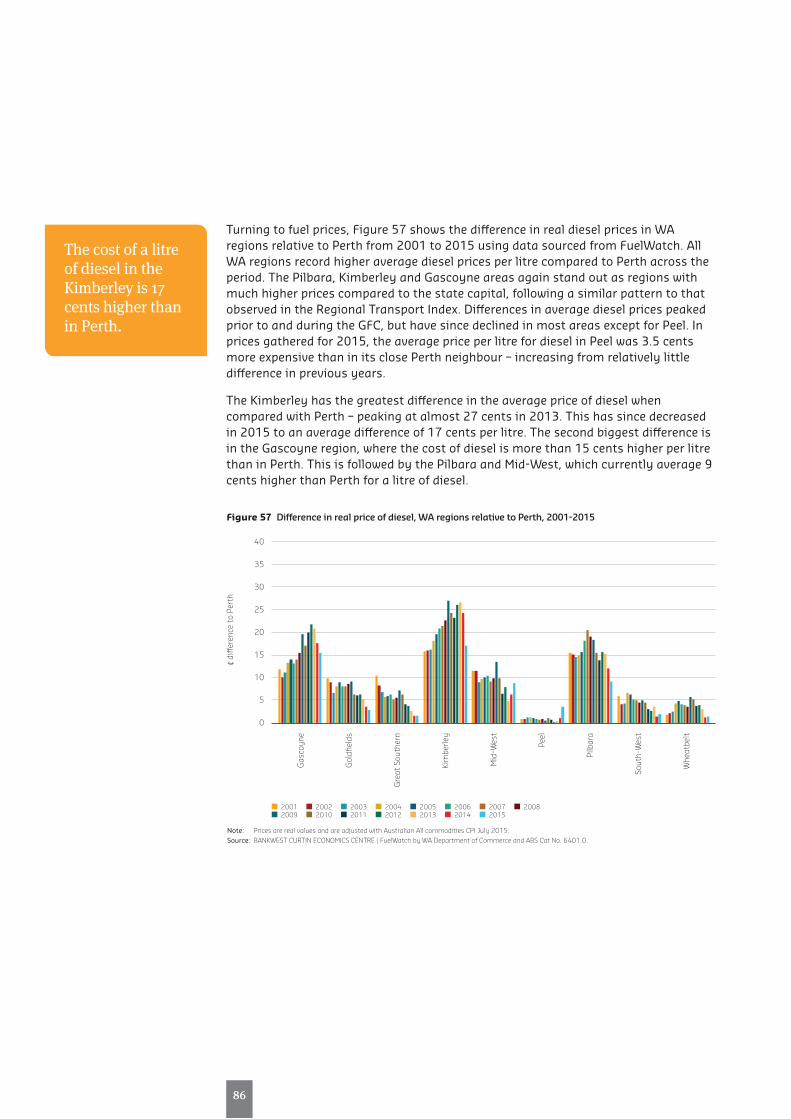
86
Turning to fuel prices, figure 57 shows the difference in real diesel prices in WA regions relative to Perth from 2001 to 2015 using data sourced from fuelWatch. All WA regions record higher average diesel prices per litre compared to Perth across the period. The Pilbara, Kimberley and gascoyne areas again stand out as regions with much higher prices compared to the state capital, following a similar pattern to that observed in the Regional Transport index. Differences in average diesel prices peaked prior to and during the gfC, but have since declined in most areas except for Peel. in prices gathered for 2015, the average price per litre for diesel in Peel was 3.5 cents more expensive than in its close Perth neighbour – increasing from relatively little difference in previous years.
The Kimberley has the greatest difference in the average price of diesel when compared with Perth – peaking at almost 27 cents in 2013. This has since decreased in 2015 to an average difference of 17 cents per litre. The second biggest difference is in the gascoyne region, where the cost of diesel is more than 15 cents higher per litre than in Perth. This is followed by the Pilbara and Mid-West, which currently average 9 cents higher than Perth for a litre of diesel.
The cost of a litre of diesel in the Kimberley is 17 cents higher than in Perth.
Figure 57 Difference in real price of diesel, WA regions relative to Perth, 2001-2015
note: Prices are real values and are adjusted with Australian All commodities CPI July 2015.source: BANKWEST CURTIN ECONOMICS CENTRE | FuelWatch by WA Department of Commerce and ABS Cat No. 6401.0.
diff
eren
ce t
o Pe
rth
40
35
30
25
20
15
10
5
0
2001 2002 2003 2004 2005 2006 2007 2008 2009 2010 2011 2012 2013 2014 2015
Gas
coyn
e
Gol
dfiel
ds
Gre
at S
outh
ern
Kim
berle
y
Mid
-Wes
t
Peel
Pilb
ara
Sout
h-W
est
Whe
atbe
lt

95
87
The CosTs of Doing Business in WA Pressures and barriers to industry performance
similar patterns are revealed when assessing price differences in unleaded petrol between WA regions and Perth over the last fifteen years (figure 58). Price differentials increased over the 2000s, peaking in 2008, but have since been declining as the economy slows. Differences in the price of unleaded fuel between WA regions and Perth are greater than those observed for diesel prices. The Kimberley region again has the greatest price differential, with a litre of unleaded fuel costing Kimberley residents and businesses 23 cents more than Perth residents.
Figure 58 Difference in real price of Unleaded Petrol, WA regions relative to Perth, 2001-2015
note: Prices are real values and are adjusted with Australian All commodities CPI July 2015.source: BANKWEST CURTIN ECONOMICS CENTRE | FuelWatch by WA Department of Commerce and ABS Cat No. 6401.0.
diff
eren
ce t
o Pe
rth
40
35
30
25
20
15
10
5
0
2001 2002 2003 2004 2005 2006 2007 2008 2009 2010 2011 2012 2013 2014 2015
Gas
coyn
e
Gol
dfiel
ds
Gre
at S
outh
ern
Kim
berle
y
Mid
-Wes
t
Peel
Pilb
ara
Sout
h-W
est
Whe
atbe
lt

Quotes

Discussion and summary
Discussion and summary
The question of whether the cost of doing business in Western Australia is more or less expensive compared to other states and territories and whether business input costs have been rising disproportionately over time, is largely a relative one. Much like the question of whether the cost of living has increased, the burden can be more easily borne if coupled with strong income growth.
A number of WA business input costs have been increasing over time and remain high compared to other Australian jurisdictions. however, WA business revenues have also increased at a faster rate than other states and territories.
But - excessive and persistently high business costs can constrain economic growth and competition by discouraging new business entrants, inhibiting existing businesses from growing and diversifying, and creating significant barriers to business performance and productivity.
Common business costs across industries and states include labour, capital and intermediate inputs such as electricity and transport. These costs go alongside skills shortages, regulation and compliance and lack of access to additional funds as the most frequently reported barriers and pressures to business performance.
During the heart of the resources boom in 2006-07, more than 1 in 4 businesses reported a lack of skills in any location as a significant barrier – by 2012-13 this had reduced to 15.6 per cent. our findings also show that barriers to business activity and performance can vary considerably by industry. for example, one in five businesses in the construction sector report outstanding accounts as a significant barrier to business activity and performance, whereas across all industries only 14 per cent report this issue.
Dealing with regulation and compliance is also often cited by firms as a barrier to performance, more so by small to medium enterprises. These businesses often face greater costs and barriers when it comes to regulation and compliance due to the limited resources that they have to draw upon and lower economies of scale than larger firms. survey data analysed in this report supports this theory, with higher proportionsofsmalltomediumsizebusinessesmorelikelytoreportregulationandcompliance as a barrier to performance than big businesses employing 200 or more persons. in the most recent survey data, there has been a closer alignment of small and big businesses.
Businesses operating in the state’s biggest sector in terms of economic value – mining, have recorded an increase in government regulations and compliance being a significant hindrance to their performance, from 13.5 per cent of businesses in 2007-07 to almost 1 in 5 in 2012-13.
good regulation can generate a number of positive benefits, for workers, the economy, community and the environment – however, the balance between necessary protectionism and liberalism is often hard to strike. unnecessary or over-burdensome regulations and compliance can inhibit business performance and potential.
Labour costs are also a significant cost of business, and increased rapidly in the state over the course of the mining boom, commensurate with increases in economic
90
activity. however, with labour costs shares running at an average of around 28 per cent of total costs for businesses, wage increases can place considerable pressure on business, especially small to medium enterprises that are less able to absorb price increases. The wage price index, which controls for changes in quality and quantity of work performed has increased by 46 per cent in Western Australia from 2005 to 2015 – for Australia, the increase has been 38 per cent across the same period.
Despite this, WA businesses are more effective in translating labour costs to company sales income than their counterparts in the rest of Australia. Average labour costs in the state are around 10 per cent higher than the national average, but businesses have been able to generate sales or service income at 15 per cent lower labour costs than the national average. Labour costs per dollar of income earned by businesses are lower particularly in mining (by 16 per cent), manufacturing (by 22 per cent) and agriculture (by 13 per cent), despite there being a higher average wage per employee in these sectors in WA compared to national rates.
Payroll taxes add to the burden of company taxes on WA businesses and this is likely to increase over the coming years. Payroll tax thresholds have not increased in line with wage inflation in WA, leading to payroll tax bracket creep. This has effectively brought more small businesses into the payroll tax system over time. The diminishing payroll tax threshold introduced in the 2015 state budget will increase WA payroll taxes by up to $44,000. This would see businesses with a $2m payroll increase their payroll tax by $16,500, from $66,000 to $86,500. Businesses with a $4m payroll will pay $44,000 more in payroll tax under the new system – $220,000 compared with $176,000.
The geography of the state – with its capital, Perth, one of the most isolated cities on earth, and with the majority of its land area classified as ‘remote’ or ‘very remote’ - can make business operations more challenging than might otherwise be the case. Business costs in regional areas of WA are among the highest, and increasingly so. The concentration of mining activities in these areas have played a major role in increasing both the cost of living and the cost of doing business. however, it is important to contextualise cost increases alongside the increase in business revenues and economic output that a number of regions have experienced.
Wages in the resource rich areas of the Pilbara and goldfields-esperance regions have grown rapidly in the last ten years. in the Pilbara, wages have increased by 60 per cent over the last decade from an average annual wage of $58,000 to $93,000. The goldfields-esperance region has also seen substantial wage growth, with employees currently averaging the second highest wages in the state – around $69,000 each year.
Western Australia’s regional areas have some of the highest costs of intermediate inputs, which again can be critical to business operations. Transport costs in the remote Kimberley, Pilbara and gascoyne regions have been consistently higher than in Perth - for the Kimberley region, almost 12 per cent higher. And over the last fifteen years, all WA regions have faced higher average fuel prices per litre compared to the state’s capital, with the current cost of a litre of diesel in the Kimberley 17 cents higher than in Perth.
99
91
The CosTs of Doing Business in WA Pressures and barriers to industry performance

occupancy and housing costs affect businesses directly, and also through the impact of low housing affordability on the capacity of skilled workers to locate to the state. occupancy costs can also be higher in more remote areas of the state relative to denser areas. The Pilbara recorded the second highest sale price per square metre for retail space in the last two periods, averaging $5,920 per square metre. generally housing prices have remained lower than Perth throughout all years and most WA regions. notable exceptions are the usual suspects – the Pilbara, Kimberley and more recently the gascoyne regions. in 2011, housing costs in the Kimberley were double that of Perth, but have since dropped back to around 40 per cent higher than the state capital.
is the cost of doing business in Western Australia problematic? for some businesses and in certain regions and industries – yes. small to medium businesses, those operating in remote or regional areas and those reliant on inputs that have seen the biggest price increases are among those businesses. for other businesses, cost pressures are for the most part a product of increased demand, fuelled by strong industry-specific economic growth.
Continued monitoring of cost pressures and microeconomic reform that focuses on taxation and industry specific issues will help to ease cost pressures for many business in the West, ensuring that the state builds on previous growth and has the ability to diversify and compete in a global market.
92

References
References
ABs (2014), Motor Vehicle Census Australia, Cat. 9309.0, Australian Bureau of statistics, Canberra, January.
ABs (2014), Australian National Accounts: State Accounts, 2013-14, Cat. 5220.0, Australian Bureau of statistics, Canberra, november.
ABs (2015a), Australian National Accounts: National Income, Expenditure and Product, Mar 2015, Cat. 5206.0, Australian Bureau of statistics, Canberra, June.
ABs (2015b), Consumer Price Index, Australia, Mar 2015, Cat. 6401.0, Australian Bureau of statistics, Canberra, April.
ABs (2015d), Residential Property Price Indexes: Eight Capital Cities, Dec 2014, Cat. 6416.0, Australian Bureau of statistics, Canberra, february.
ABs (2011), Consumer Price Index: Concepts, Sources and Methods, Australia, 2011.
Cassells, R., Dockery, M. and Duncan, A. (2014a), ‘falling Through the cracks: Poverty and Disadvantage in Australia’, Bankwest Curtin economics Centre, Focus on the States, issue no. 1, october 2014
Cassells, R., Dockery, M., Duncan, A., gao, g., Leong, K. and Mavisakalyan A., (2014b). Workforce and Skills: Western Australian labour markets in transition, Bankwest Curtin economics Centre, focus on Western Australia series, issue no. 3, August 2014. Perth.
Cassells, R., Duncan, A., gao, g., James, A., Leong, K., Markkanen, s. and Rowley, s. (2014c). Housing Affordability: The real costs of housing in WA. Bankwest Curtin economics Centre, focus on Western Australia series, issue no. 2, April 2014. Perth.
Cassells, R., Duncan, A., gao, g. (2014d), ‘sharing the Boom: The Distribution of income and Wealth in WA’. Bankwest Curtin economics Centre, Focus on Western Australia Report Series, issue no.1, february 2014
CoAg (2014), Council of Australian governments Communique of the 37th meeting, 2 May.
Costello, g., fraser, P. and MacDonald, g. (2013), ‘The impact of Monetary Policy on Australian Capital City housing Prices: The Case of Australia’. Paper presented to the 26th Australasian finance and Banking Conference, sydney, December 2013.
DRD (2011), Regional Price Index 2011 Basket of Goods and Services, Western Australia Department of Regional Development and Lands
eRA (2014) Inquiry into Microeconomic Reform in Western Australia Final Report, Western Australian economic Regulatory Authority
Productivity Commission (2014) Relative Costs of Doing Business in Australia: Retail Trade, Productivity Commission Research Report, september
RDA (2013) The Cost of Doing Business in the Pilbara, Regional Development Australia, Canberra, May.
Treasury (2012) Australian Small Business Key Statistics and Analysis, Australian government, December.
WA-CCi (2011) The cost of doing business: CCI Advocacy, Western Australia Chamber of Commerce and industry, August.
94

Appendix

96
Tab
le 1
3 P
ay
roll
tax
rate
s a
nd
th
resh
old
s b
y s
tate
/ter
rito
ry, 2
008-
09 t
o 20
15-1
6
stat
e/te
rrit
ory
WA
nsW
ViC
QLD
sATA
sn
TA
CT
Rat
eTh
resh
old
Rat
eTh
resh
old
Rat
eTh
resh
old
Rat
eTh
resh
old
Rat
eTh
resh
old
Rat
eTh
resh
old
Rat
eTh
resh
old
Rat
eTh
resh
old
2015
-16
5.50
%80
0,00
0 5
.45%
750
,000
4.8
5% 5
50,0
00 4
.75%
1,10
0,00
0 4.
95%
600
,000
6.1
0%1,
250,
000
5.50
%1,
500,
000
6.85
%1,
850,
000
2014
-15
5.50
% 8
00,0
00 5
.45%
750
,000
4.8
5% 5
50,0
00 4
.75%
1,10
0,00
0 4.
95%
600
,000
6.1
0%1,
250,
000
5.50
%1,
500,
000
6.85
%1,
850,
000
2013
-14
5.50
%75
0,00
0 5.
45%
750
,000
4.9
0% 5
50,0
00 4
.75%
1,10
0,00
0 4.
95%
600
,000
6.1
0%1,
250,
000
5.50
%1,
500,
000
6.85
%1,
750,
000
2012
-13
5.50
%75
0,00
0 5.
45%
689
,000
4.9
0% 5
50,0
00 4
.75%
1,10
0,00
0 4.
95%
600
,000
6.1
0%1,
010,
000
5.50
%1,
500,
000
6.85
%1,
750,
000
2011
-12
5.50
%75
0,00
0 5.
45%
678
,000
4.9
0% 5
50,0
00 4
.75%
1,00
0,00
0 4.
95%
600
,000
6.1
0%1,
010,
000
5.50
%1,
500,
000
6.85
%1,
500,
000
2010
-11
(1 J
an t
o 30
Jun
e)5.
50%
750,
000
5.45
% 6
38,0
00 4
.90%
550
,000
4.7
5%1,
000,
000
4.95
% 6
00,0
00 6
.10%
1,01
0,00
0 5.
90%
1,25
0,00
0 6.
85%
1,50
0,00
0
2010
-11
(1 J
uly
to
31 D
ec)
5.50
%75
0,00
0 5.
50%
638
,000
4.9
0% 5
50,0
00 4
.75%
1,00
0,00
0 4.
95%
600
,000
6.1
0%1,
010,
000
5.90
%1,
250,
000
6.85
%1,
500,
000
2009
-10
(1 J
an t
o 30
Jun
e)5.
50%
750,
000
5.65
% 6
38,0
00 4
.95%
550
,000
4.7
5%1,
000,
000
4.95
% 6
00,0
00 6
.10%
1,01
0,00
0 5.
90%
1,25
0,00
0 6.
85%
1,50
0,00
0
2009
-10
(1 J
uly
to
31 D
ec)
5.50
%75
0,00
0 5.
75%
638
,000
4.9
5% 5
50,0
00 4
.75%
1,00
0,00
0 4.
95%
600
,000
6.1
0%1,
010,
000
5.90
%1,
250,
000
6.85
%1,
500,
000
2008
-09
(1 J
an t
o 30
Jun
e)5.
50%
750,
000
5.75
% 6
23,0
00 4
.95%
550
,000
4.7
5%1,
000,
000
5.00
% 5
52,0
00 6
.10%
1,01
0,00
0 5.
90%
1,25
0,00
0 6.
85%
1,50
0,00
0
2008
-09
(1 J
uly
to
31 D
ec)
5.50
%75
0,00
0 6.
00%
623
,000
4.9
5% 5
50,0
00 4
.75%
1,00
0,00
0 5.
00%
552
,000
6.1
0%1,
010,
000
5.90
%1,
250,
000
6.85
%1,
500,
000
2007
-08
5.50
%75
0,00
0 6.
00%
600
,000
5.0
5% 5
50,0
00 4
.75%
1,00
0,00
0 5.
00%
552
,000
6.1
0%1,
010,
000
6.20
%1,
250,
000
6.85
%1,
250,
000
2006
-07
(1 J
uly
to
31 D
ec)
5.50
%75
0,00
0 6.
00%
600
,000
5.0
5% 5
50,0
00 4
.75%
1,00
0,00
0 5.
50%
504
,000
6.1
0%1,
010,
000
6.20
%1,
250,
000
6.85
%1,
250,
000
2006
-07
(1 J
uly
to
31 D
ec)
5.50
%75
0,00
0 6.
00%
600
,000
5.1
5% 5
50,0
00 4
.75%
1,00
0,00
0 5.
50%
504
,000
6.1
0%1,
010,
000
6.20
%1,
250,
000
6.85
%1,
250,
000
2005
-06
5.50
%75
0,00
0 6.
00%
600
,000
5.2
5% 5
50,0
00 4
.75%
850
,000
5.6
7% 5
04,0
00 6
.10%
1,01
0,00
0 6.
20%
1,00
0,00
0 6.
85%
1,25
0,00
0

105
97
The CosTs of Doing Business in WA Pressures and barriers to industry performance
Tab
le 1
4 P
ay
roll
tax
liab
iliti
es fo
r n
eutr
al u
pra
tin
g o
f ta
x th
resh
old
s si
nce
200
5-06
: by
sta
te/t
erri
tory
stat
e/te
rrit
ory
WA
nsW
ViC
QLD
sATA
sn
TA
CT
Rat
eTh
resh
old
Rat
eTh
resh
old
Rat
eTh
resh
old
Rat
eTh
resh
old
Rat
eTh
resh
old
Rat
eTh
resh
old
Rat
eTh
resh
old
Rat
eTh
resh
old
Payr
oll t
ax r
ate
as a
t 1
July
201
55.
50%
5.45
%4.
85%
4.75
%4.
95%
6.10
%5.
50%
6.85
%
Payr
oll t
ax t
hres
hold
as
at
1 Ju
ly 2
015
5.50
%80
0,00
0 5
.45%
750
,000
4.8
5% 5
50,0
00 4
.75%
1,1
00,0
00 4
.95%
600
,000
6.1
0% 1
,250
,000
5.5
0% 1
,500
,000
6.8
5% 1
,850
,000
Payr
oll t
ax t
hres
hold
if J
uly
2005
upr
ated
by
AW
oTe
1,09
9,85
6 87
9,88
5 80
6,56
1 1,
246,
503
739,
103
1,48
1,13
9 1,
466,
475
1,83
3,09
3
Empl
oyee
cos
ts o
f $1,
000,
000
Payr
oll t
ax li
abili
ty (a
ctua
l)11
,000
13
,625
21
,825
0
19,8
00
0 0
0
Payr
oll t
ax li
abili
ty
(if n
eutr
al s
ince
200
5)0
6,54
6 9,
382
0 12
,914
0
0 0
$ di
ffer
ence
(neu
tral
vs
actu
al)
+11,
000
+7,0
79+1
2,44
3+0
+6,8
86+0
+0+0
% d
iffer
ence
(neu
tral
vs
actu
al)
*+1
08.1
%+1
32.6
%-
+53.
3%-
--
Empl
oyee
cos
ts o
f $2,
500,
000
Payr
oll t
ax li
abili
ty (a
ctua
l)93
,500
95
,375
94
,575
66
,500
94
,050
76
,250
55
,000
44
,525
Payr
oll t
ax li
abili
ty
(if n
eutr
al s
ince
200
5)77
,008
88
,296
82
,132
59
,541
87
,164
62
,150
56
,844
45
,683
$ di
ffer
ence
(neu
tral
vs
actu
al)
+16,
492
+7,0
79+1
2,44
3+6
,959
+6,8
86+1
4,10
0-1
,844
-1,1
58
% d
iffer
ence
(neu
tral
vs
actu
al)
+21.
4%+8
.0%
+15.
2%+1
1.7%
+7.9
%+2
2.7%
-3.2
%-2
.5%
Empl
oyee
cos
ts o
f $5,
000,
000
Payr
oll t
ax li
abili
ty (a
ctua
l)23
1,00
0 23
1,62
5 21
5,82
5 18
5,25
0 21
7,80
0 22
8,75
0 19
2,50
0 21
5,77
5
Payr
oll t
ax li
abili
ty
(if n
eutr
al s
ince
200
5)21
4,50
8 22
4,54
6 20
3,38
2 17
8,29
1 21
0,91
4 21
4,65
0 19
4,34
4 21
6,93
3
$ di
ffer
ence
(neu
tral
vs
actu
al)
+16,
492
+7,0
79+1
2,44
3+6
,959
+6,8
86+1
4,10
0-1
,844
-1,1
58
% d
iffer
ence
(act
ual v
s ne
utra
l)+7
.7%
+3.2
%+6
.1%
+3.9
%+3
.3%
+6.6
%-0
.9%
-0.5
%
not
e:
Payr
oll t
ax li
abili
ties
for n
eutr
al u
prat
ing
of t
ax t
hres
hold
s si
nce
2005
-06:
by
stat
e/te
rrit
ory
sour
ce:
BAN
KWES
T CU
RTIN
ECO
NO
MIC
S CE
NTR
E | A
utho
rs’ c
alcu
lati
ons

98
Fig
ure
59
Ave
rag
e w
ag
e co
sts
per
em
plo
yee
by
ind
ust
ria
l sec
tor
for
WA
an
d A
ust
ralia
: 200
7-08
to
2013
-14
(in
Ju
ne
2015
pri
ces)
Diff
eren
ce
W
este
rn A
ustr
alia
Aus
tral
ia
not
e:
The
char
ts a
re o
rder
ed b
y 20
14 W
A em
ploy
men
t sh
are.
Em
ploy
men
t sh
are
calc
ulat
ions
are
bas
ed o
n to
tal n
umbe
rs e
mpl
oyed
by
maj
or A
ustr
alia
n an
d N
ew Z
eala
nd S
tand
ard
Indu
stria
l Cla
ssifi
cati
on (A
NZS
IC) 2
006
divi
sion
s (A
BS C
at N
o 12
92.0
).so
urce
: BA
NKW
EST
CURT
IN E
CON
OM
ICS
CEN
TRE
| Aut
hors
’ cal
cula
tion
s fr
om A
BS C
at N
o 62
91.0
, Feb
ruar
y 20
14.
i. M
inin
g
2007-08
2008-09
2009-10
2010-11
2011-12
2012-13
2013-14
180
,000
150
,000
120
,000
90,0
00
60,0
00
30,0
00 0
60%
50%
40%
30%
20%
10%
0%
wage cost/employee (in 2015 $’s)
Difference WA and Australia (%)
ii. E
lect
rici
ty, g
as,
wa
ter
an
d w
ast
e se
rvic
es
2007-08
2008-09
2009-10
2010-11
2011-12
2012-13
2013-14
180
,00
0
150
,00
0
120
,00
0
90,0
00
60,0
00
30,0
00 0
-30,
000
60%
50%
40%
30%
20%
10%
0% -10%
wage cost/employee (in 2015 $’s)
Difference WA and Australia (%)
iii.
Con
stru
ctio
n
2007-08
2008-09
2009-10
2010-11
2011-12
2012-13
2013-14
120,
000
100,
000
80,0
00
60,0
00
40,0
00
20,0
00 0
-20,
000
60%
50%
40%
30%
20%
10%
0% -10%
wage cost/employee (in 2015 $’s)
Difference WA and Australia (%)
vi. M
an
ufa
ctu
rin
g
2007-08
2008-09
2009-10
2010-11
2011-12
2012-13
2013-14
120,
000
100,
000
80,0
00
60,0
00
40,0
00
20,0
00 0
-20,
000
60%
50%
40%
30%
20%
10%
0% -10%
wage cost/employee (in 2015 $’s)
Difference WA and Australia (%)
v. In
form
ati
on, m
edia
an
d t
elec
omm
un
ica
tion
s
2007-08
2008-09
2009-10
2010-11
2011-12
2012-13
2013-14
120
,00
0
100
,00
0
80,0
00
60,0
00
40,0
00
20,0
00 0
-20,
000
60%
50%
40%
30%
20%
10%
0% -10%
wage cost/employee (in 2015 $’s)
Difference WA and Australia (%)
iv. P
rofe
ssio
na
l, sc
ien
tifi
c a
nd
tec
hn
ica
l
2007-08
2008-09
2009-10
2010-11
2011-12
2012-13
2013-14
120
,000
100
,000
80,0
00
60,0
00
40,0
00
20,0
00 0
-20
,000
60
%
50
%
40
%
30
%
20
%
10
%
0%
-10%
wage cost/employee (in 2015 $’s)
Difference WA and Australia (%)
vii.
Ad
min
istr
ati
ve a
nd
su
pp
ort
serv
ices
2007-08
2008-09
2009-10
2010-11
2011-12
2012-13
2013-14
120
,000
100
,000
80,0
00
60,0
00
40,0
00
20,0
00 0
-20
,000
60
%
50
%
40
%
30
%
20
%
10
%
0%
-10%
wage cost/employee (in 2015 $’s)
Difference WA and Australia (%)
viii
. Wh
oles
ale
tra
de
2007-08
2008-09
2009-10
2010-11
2011-12
2012-13
2013-14
120
,00
0
100
,00
0
80,0
00
60,0
00
40,0
00
20,0
00 0
-20,
000
60%
50%
40%
30%
20%
10%
0% -10%
wage cost/employee (in 2015 $’s)
Difference WA and Australia (%)
ix. T
ran
spor
t, p
osta
l an
d w
are
hou
sin
g
2007-08
2008-09
2009-10
2010-11
2011-12
2012-13
2013-14
120,
000
100,
000
80,0
00
60,0
00
40,0
00
20,0
00 0
-20,
000
60%
50%
40%
30%
20%
10%
0% -10%
wage cost/employee (in 2015 $’s)
Difference WA and Australia (%)
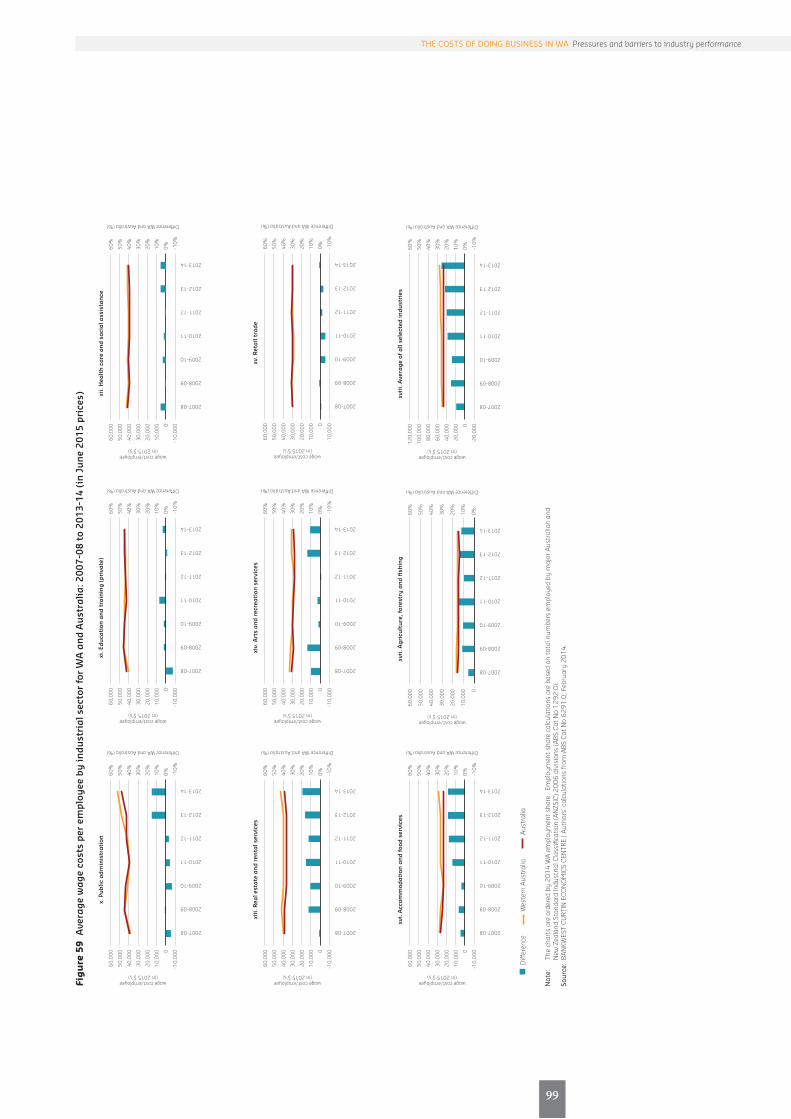
107
99
The CosTs of Doing Business in WA Pressures and barriers to industry performance
Fig
ure
59
Ave
rag
e w
ag
e co
sts
per
em
plo
yee
by
ind
ust
ria
l sec
tor
for
WA
an
d A
ust
ralia
: 200
7-08
to
2013
-14
(in
Ju
ne
2015
pri
ces)
Diff
eren
ce
W
este
rn A
ustr
alia
Aus
tral
ia
not
e:
The
char
ts a
re o
rder
ed b
y 20
14 W
A em
ploy
men
t sh
are.
Em
ploy
men
t sh
are
calc
ulat
ions
are
bas
ed o
n to
tal n
umbe
rs e
mpl
oyed
by
maj
or A
ustr
alia
n an
d N
ew Z
eala
nd S
tand
ard
Indu
stria
l Cla
ssifi
cati
on (A
NZS
IC) 2
006
divi
sion
s (A
BS C
at N
o 12
92.0
).so
urce
: BA
NKW
EST
CURT
IN E
CON
OM
ICS
CEN
TRE
| Aut
hors
’ cal
cula
tion
s fr
om A
BS C
at N
o 62
91.0
, Feb
ruar
y 20
14.
xii.
Hea
lth
ca
re a
nd
soc
ial a
ssis
tan
ce
2007-08
2008-09
2009-10
2010-11
2011-12
2012-13
2013-14
60,0
00
50,0
00
40,0
00
30,0
00
20,0
00
10,0
00
0
-10,
000
60%
50%
40%
30%
20%
10%
0% -10%
wage cost/employee (in 2015 $’s)
Difference WA and Australia (%)
xi. E
du
cati
on a
nd
tra
inin
g (
pri
vate
)
2007-08
2008-09
2009-10
2010-11
2011-12
2012-13
2013-14
60,0
00
50,0
00
40,0
00
30,0
00
20,0
00
10,0
00 0
-10,
000
60%
50%
40%
30%
20%
10%
0% -10%
wage cost/employee (in 2015 $’s)
Difference WA and Australia (%)
x. P
ub
lic a
dm
inis
tra
tion
2007-08
2008-09
2009-10
2010-11
2011-12
2012-13
2013-14
60,
000
50,
000
40,
000
30,
000
20,
000
10,
000 0
-10,
000
60%
50%
40%
30%
20%
10%
0%
-10%
wage cost/employee (in 2015 $’s)
Difference WA and Australia (%)
xv. R
eta
il tr
ad
e
2007-08
2008-09
2009-10
2010-11
2011-12
2012-13
2013-14
60,0
00
50,0
00
40,0
00
30,0
00
20,0
00
10,0
00
0
-10,
000
60%
50%
40%
30%
20%
10%
0% -10%
wage cost/employee (in 2015 $’s)
Difference WA and Australia (%)
xiv.
Art
s a
nd
rec
rea
tion
ser
vice
s
2007-08
2008-09
2009-10
2010-11
2011-12
2012-13
2013-14
60,0
00
50,0
00
40,0
00
30,0
00
20,0
00
10,0
00 0
-10,
000
60%
50%
40%
30%
20%
10%
0% -10%
wage cost/employee (in 2015 $’s)
Difference WA and Australia (%)
xiii
. Rea
l est
ate
an
d r
enta
l ser
vice
s
2007-08
2008-09
2009-10
2010-11
2011-12
2012-13
2013-14
60,
000
50,
000
40,
000
30,
000
20,
000
10,
000 0
-10,
000
60%
50%
40%
30%
20%
10%
0%
-10%
wage cost/employee (in 2015 $’s)
Difference WA and Australia (%)
xvi.
Acc
omm
oda
tion
an
d fo
od s
ervi
ces
2007-08
2008-09
2009-10
2010-11
2011-12
2012-13
2013-14
60,
000
50,
000
40,
000
30,
000
20,
000
10,
000 0
-10,
000
60%
50%
40%
30%
20%
10%
0%
-10%
wage cost/employee (in 2015 $’s)
Difference WA and Australia (%)
xvii
i. A
vera
ge
of a
ll se
lect
ed in
du
stri
es
2007-08
2008-09
2009-10
2010-11
2011-12
2012-13
2013-14
120,
000
100,
000
80,0
00
60,0
00
40,0
00
20,0
00
0
-20,
000
60%
50%
40%
30%
20%
10%
0% -10%
wage cost/employee (in 2015 $’s)
Difference WA and Australia (%)
xvii
. Ag
ricu
ltu
re, f
ores
try
an
d fi
shin
g
2007-08
2008-09
2009-10
2010-11
2011-12
2012-13
2013-14
60
,000
50
,000
40
,000
30
,000
20
,000
10
,000 0
60%
50%
40%
30%
20%
10%
0%
wage cost/employee (in 2015 $’s)
Difference WA and Australia (%)

100
Fig
ure
60
Ave
rag
e w
ag
e co
sts
per
dol
lar
of s
ale
s/se
rvic
e in
com
e b
y in
du
stri
al s
ecto
r fo
r W
A a
nd
Au
stra
lia: 2
007-
08 t
o 20
13-1
4 (i
n J
un
e 20
15 p
rice
s)
Diff
eren
ce
W
este
rn A
ustr
alia
Aus
tral
ia
not
e:
The
char
ts a
re o
rder
ed b
y 20
12-1
3 W
A w
age
cost
per
em
ploy
ee.
Wag
e co
sts
are
expr
esse
d in
201
5 $’
s, u
prat
ed u
sing
sta
te o
r nat
iona
l wag
e pr
ice
indi
ces.
Av
erag
e co
sts
per e
mpl
oyee
are
cal
cula
ted
for m
ajor
Aus
tral
ian
and
New
Zea
land
Sta
ndar
d In
dust
rial C
lass
ifica
tion
(AN
ZSIC
) 200
6 di
visi
ons.
sour
ce:
BAN
KWES
T CU
RTIN
ECO
NO
MIC
S CE
NTR
E | A
utho
rs’ c
alcu
lati
ons
from
ABS
Cat
No
8155
.0, M
ay 2
014.
i. W
hol
esa
le t
rad
e
2007-08
2008-09
2009-10
2010-11
2011-12
2012-13
2013-14
30 25 20 15 10 5 0
90%
75%
60%
45%
30%
15%
0%
wage cost/employee (in 2015 $’s)
Difference WA and Australia (%)
ii. A
gri
cult
ure
, for
estr
y a
nd
fish
ing
2007-08
2008-09
2009-10
2010-11
2011-12
2012-13
2013-14
20
15
10 5 0 -5 -10
60%
45%
30%
15%
0% -15%
-30%
wage cost/employee (in 2015 $’s)
Difference WA and Australia (%)
iii.
Min
ing
2007-08
2008-09
2009-10
2010-11
2011-12
2012-13
2013-14
20 15 10 5 0 -5 -10
60%
45%
30%
15%
0% -15%
-30%
wage cost/employee (in 2015 $’s)
Difference WA and Australia (%)
iv. R
eta
il tr
ad
e
2007-08
2008-09
2009-10
2010-11
2011-12
2012-13
2013-14
20 15 10 5 0 -5 -10
60%
45%
30%
15%
0% -15
%
-30
%
wage cost/employee (in 2015 $’s)
Difference WA and Australia (%)
v. E
lect
rici
ty, g
as,
wa
ter
an
d w
ast
e se
rvic
es
2007-08
2008-09
2009-10
2010-11
2011-12
2012-13
2013-14
20
15
10 5 0 -5 -10
60%
45%
30%
15%
0% -15%
-30%
wage cost/employee (in 2015 $’s)
Difference WA and Australia (%)
vi. M
an
ufa
ctu
rin
g
2007-08
2008-09
2009-10
2010-11
2011-12
2012-13
2013-14
20 15 10 5 0 -5 -10
60%
45%
30%
15%
0% -15%
-30%
wage cost/employee (in 2015 $’s)
Difference WA and Australia (%)
vii.
Ren
tal,
hir
ing
an
d r
eal e
sta
te s
ervi
ces
2007-08
2008-09
2009-10
2010-11
2011-12
2012-13
2013-14
30 25 20 15 10 5 0
90%
75%
60%
45%
30%
15%
0%
wage cost/employee (in 2015 $’s)
Difference WA and Australia (%)
viii
. In
form
ati
on M
edia
an
d T
elec
omm
un
ica
tion
s
2007-08
2008-09
2009-10
2010-11
2011-12
2012-13
2013-14
40
30
20
10 0
-10
-20
60%
45%
30%
15%
0% -15%
-30%
wage cost/employee (in 2015 $’s)
Difference WA and Australia (%)
ix. C
onst
ruct
ion
2007-08
2008-09
2009-10
2010-11
2011-12
2012-13
2013-14
30 25 20 15 10 5 0
90%
75%
60%
45%
30%
15%
0%
wage cost/employee (in 2015 $’s)
Difference WA and Australia (%)
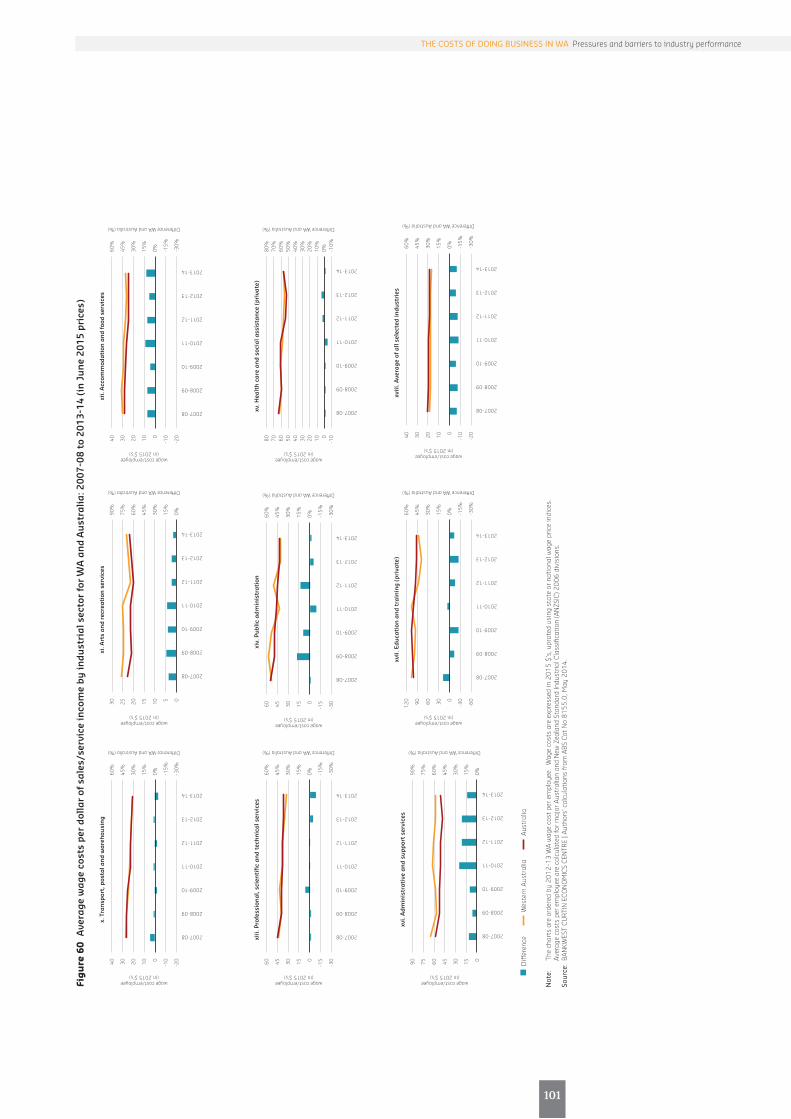
109
101
The CosTs of Doing Business in WA Pressures and barriers to industry performance
x. T
ran
spor
t, p
osta
l an
d w
are
hou
sin
g
2007-08
2008-09
2009-10
2010-11
2011-12
2012-13
2013-14
40 30 20 10 0
-10
-20
60
%
45
%
30
%
15
%
0%
-15%
-30%
wage cost/employee (in 2015 $’s)
Difference WA and Australia (%)
Fig
ure
60
Ave
rag
e w
ag
e co
sts
per
dol
lar
of s
ale
s/se
rvic
e in
com
e b
y in
du
stri
al s
ecto
r fo
r W
A a
nd
Au
stra
lia: 2
007-
08 t
o 20
13-1
4 (i
n J
un
e 20
15 p
rice
s)
Diff
eren
ce
W
este
rn A
ustr
alia
Aus
tral
ia
not
e:
The
char
ts a
re o
rder
ed b
y 20
12-1
3 W
A w
age
cost
per
em
ploy
ee.
Wag
e co
sts
are
expr
esse
d in
201
5 $’
s, u
prat
ed u
sing
sta
te o
r nat
iona
l wag
e pr
ice
indi
ces.
Av
erag
e co
sts
per e
mpl
oyee
are
cal
cula
ted
for m
ajor
Aus
tral
ian
and
New
Zea
land
Sta
ndar
d In
dust
rial C
lass
ifica
tion
(AN
ZSIC
) 200
6 di
visi
ons.
sour
ce:
BAN
KWES
T CU
RTIN
ECO
NO
MIC
S CE
NTR
E | A
utho
rs’ c
alcu
lati
ons
from
ABS
Cat
No
8155
.0, M
ay 2
014.
xi. A
rts
an
d r
ecre
ati
on s
ervi
ces
2007-08
2008-09
2009-10
2010-11
2011-12
2012-13
2013-14
30 25 20 15 10 5 0
90%
75%
60%
45%
30%
15%
0%
wage cost/employee (in 2015 $’s)
Difference WA and Australia (%)
xii.
Acc
omm
oda
tion
an
d fo
od s
ervi
ces
2007-08
2008-09
2009-10
2010-11
2011-12
2012-13
2013-14
40 30 20 10 0
-10
-20
60%
45%
30%
15%
0% -15%
-30%
wage cost/employee (in 2015 $’s)
Difference WA and Australia (%)
xiii
. Pro
fess
ion
al,
scie
nti
fic
an
d t
ech
nic
al s
ervi
ces
2007-08
2008-09
2009-10
2010-11
2011-12
2012-13
2013-14
60 45 30 15 0
-15
-30
60
%
45
%
30
%
15
%
0%
-15%
-30%
wage cost/employee (in 2015 $’s)
Difference WA and Australia (%)
xiv.
Pu
blic
ad
min
istr
ati
on
2007-08
2008-09
2009-10
2010-11
2011-12
2012-13
2013-14
60 45 30 15 0
-15
-30
60%
45%
30%
15%
0% -15%
-30%
wage cost/employee (in 2015 $’s)
Difference WA and Australia (%)
xv. H
ealt
h c
are
an
d s
ocia
l ass
ista
nce
(p
riva
te)
2007-08
2008-09
2009-10
2010-11
2011-12
2012-13
2013-14
80 70 60 50 40 30 20 10 0-1
0
80%
70%
60%
50%
40%
30%
20%
10%
0% -10%
wage cost/employee (in 2015 $’s)
Difference WA and Australia (%)
xvi.
Ad
min
istr
ati
ve a
nd
su
pp
ort
serv
ices
2007-08
2008-09
2009-10
2010-11
2011-12
2012-13
2013-14
90 75 60 45 30 15 0
90
%
75
%
60
%
45
%
30
%
15
%
0%
wage cost/employee (in 2015 $’s)
Difference WA and Australia (%)
xvii
. Ed
uca
tion
an
d t
rain
ing
(p
riva
te)
2007-08
2008-09
2009-10
2010-11
2011-12
2012-13
2013-14
120
90
60
30 0
-30
-60
60%
45%
30%
15%
0% -15%
-30%
wage cost/employee (in 2015 $’s)
Difference WA and Australia (%)
xvii
i. A
vera
ge
of a
ll se
lect
ed in
du
stri
es
2007-08
2008-09
2009-10
2010-11
2011-12
2012-13
2013-14
40 30 20 10 0
-10
-20
60%
45%
30%
15%
0% -15%
-30%
wage cost/employee (in 2015 $’s)
Difference WA and Australia (%)

104

About the Centre Disclaimer
While every effort has been made to ensure the accuracy of this document, the uncertain nature of economic data, forecasting and analysis means that the centre, Curtin University and/or Bankwest are unable to make any warranties in relation to the information contained herein. Any person who relies on the information contained in this document does so at their own risk. The centre, Curtin University, Bankwest, and/or their employees and agents disclaim liability for any loss or damage, which may arise as a consequence of any person relying on the information contained in this document. Except where liability under any statute cannot be excluded, the centre, Curtin University, Bankwest and/or their advisors, employees and officers do not accept any liability (whether under contract, tort or otherwise) for any resulting loss or damage suffered by the reader or by any other person.
The views in this publication are those of the authors and do not represent the views of Curtin University and/or Bankwest or any of their affiliates. This publication is provided as general information only and does not consider anyone’s specific objectives, situation or needs. Neither the authors nor the centre accept any duty of care or liability to anyone regarding this publication or any loss suffered in connection with the use of this publication or any of its content.
Authorised Use
© Bankwest Curtin Economics Centre, July 2015Bankwest Curtin Economics Centre Focus on Western Australia Report SeriesISBN: 978-1-925083-30-9
This report was written by: Rebecca Cassells, Alan Duncan, grace gao and Yashar Tarverdi from the Bankwest Curtin Economics Centre at Curtin Business School.
It can be cited as: Cassells R, Duncan A, gao g and Tarverdi Y (2015). ‘The Costs of Doing Business in WA’, Bankwest Curtin Economics Centre, Focus on Western Australia Report Series, Issue #4, July 2015.
This publication contains confidential and proprietary information of the Bankwest Curtin Economics Centre. All of the material in this publication is for your exclusive use and may not be otherwise used or modified for, or by, any other person or sold to or otherwise provided in whole or in part to any other person or entity without the prior written consent of the Bankwest Curtin Economics Centre.
A standard hard copy of, or electronic subscription to, this publication entitles employees of the same organisation and same physical location as the subscriber to the use of its contents for internal reporting purposes only. Multiple user licenses are available for organisations with more than one location.
The Bankwest Curtin Economics Centre is an independent economic and social research organisation located within the Curtin Business School at Curtin University. The centre was established in 2012 through the generous support from Bankwest (a division of the Commonwealth Bank of Australia), with a core mission to examine the key economic and social policy issues that contribute to the sustainability of Western Australia and the wellbeing of WA households.
The Bankwest Curtin Economics Centre is the first research organisation of its kind in Western Australia, and draws great strength and credibility from its partnership with Bankwest, Curtin University and the Western Australian government.
The centre brings a unique philosophy to research on the major economic issues facing the state. By bringing together experts from the research, policy and business communities at all stages of the process – from framing and conceptualising research questions, through the conduct of research, to the communication and implementation of research findings – we ensure that our research is relevant, fit for purpose, and makes a genuine difference to the lives of Australians, both in WA and nationally.
The centre is able to capitalise on Curtin University’s reputation for excellence in economic modelling, forecasting, public policy research, trade and industrial economics and spatial sciences. Centre researchers have specific expertise in economic forecasting, quantitative modelling, micro-data analysis and economic and social policy evaluation. The centre also derives great value from its close association with experts from the corporate, business, public and not-for-profit sectors.

business.curtin.edu.au/bcec Pressures and barriers to industry performance
BANKWEST CURTIN ECONOMICS CENTRE
Focus on Western Australia Report Series, No. 4July 2015
Bankwest Curtin Economics CentreTel: +61 8 9266 2873 Email: [email protected]
© Curtin University of Technology 2015Curtin University is a trademark of Curtin University of TechnologyCRICOS Provider Code 00301JADV079953
Contact
ThE COSTS Of DOINg BUSINESS IN WA


