A containment and disposition strategy for tritium-contaminated groundwater at the Savannah River Site, South Carolina, United States Daniel R. Hitchcock, Christopher D. Barton, Karin T. Rebel, Juiian Singer, John C. Seaman, 1. Dan Strawbridge, Susan J. Riha, and John I. Blake ABSTRACT A containment and disposition water management strategy has been implemented at the Savannah River Site to minimize the discharge of tritiated groundwater from the Old Radioactive Waste Burial Ground to Fourmile Branch, a tributary of the Savannah River. This paper presents a general overview of the water management strategy, which includes a two-component (pond and irrigation) system, and a summary of operations and effectiveness for the first 3 yr of operations. Tritiated groundwater seep discharge was impounded by a dam and distributed via irrigation to a 22-ac (8.9-ha) upland forested area comprised of mixed pines (loblolly and slash) and hard- woods (prirnanly sweetgum and laurel oak). As of March 2004, the system has irrigated approximately 133.2 million L (35.2 million gal) and prevented approximately 1880 Ci of tritium fkom entering Four- mile Branch via forest evapotranspiration, as well as via pond storage and evaporation. Prior to installation of the containment and dis- position strategy, tritium activity in Fourmile Branch downstream of the seep averaged approximately 500 pCi mL-'. Six months after installation, tritium activity averaged approximately 200 pCi mL- ' in Fourmile Branch. After 1 yr of operations, tritium activity averaged below 100 pCi mL-I in Fourmile Branch, and a range of 100-200 pCi mL-' tritium activity has been maintained as of March 2004. Complex hydrological factors and operational strate- gies influence remediation system success. Analyses may assist in developing groundwater management and remediation strategies for future projects at the Savannah River Site and other facilities located on similar landscapes. Copyr~ght02005. The American Association of Petroleum Ceologists/Division of Environmental Geosciences. All rights reserved. DO1.10.1306,leg.04 120404020 * .*
Transcript
A containment and disposition strategy for tritium-contaminated groundwater at the Savannah River Site, South Carolina, United States Daniel R. Hitchcock, Christopher D. Barton, Karin T. Rebel, Juiian Singer, John C. Seaman, 1. Dan Strawbridge, Susan J. Riha, and John I. Blake
ABSTRACT
A containment and disposition water management strategy has been implemented at the Savannah River Site to minimize the discharge of tritiated groundwater from the Old Radioactive Waste Burial Ground to Fourmile Branch, a tributary of the Savannah River. This paper presents a general overview of the water management strategy, which includes a two-component (pond and irrigation) system, and a summary of operations and effectiveness for the first 3 yr of operations. Tritiated groundwater seep discharge was impounded by a dam and distributed via irrigation to a 22-ac (8.9-ha) upland forested area comprised of mixed pines (loblolly and slash) and hard- woods (prirnanly sweetgum and laurel oak). As of March 2004, the system has irrigated approximately 133.2 million L (35.2 million gal) and prevented approximately 1880 Ci of tritium fkom entering Four- mile Branch via forest evapotranspiration, as well as via pond storage and evaporation. Prior to installation of the containment and dis- position strategy, tritium activity in Fourmile Branch downstream of the seep averaged approximately 500 pCi mL-'. Six months after installation, tritium activity averaged approximately 200 pCi mL- ' in Fourmile Branch. After 1 yr of operations, tritium activity averaged below 100 pCi mL-I in Fourmile Branch, and a range of 100-200 pCi mL-' tritium activity has been maintained as of March 2004. Complex hydrological factors and operational strate- gies influence remediation system success. Analyses may assist in developing groundwater management and remediation strategies for future projects at the Savannah River Site and other facilities located on similar landscapes.
Copyr~ght 02005. The American Association of Petroleum Ceologists/Division of Environmental Geosciences. All rights reserved.
DO1.10.1306,leg.04 120404020 * .*
INTRODUCTION
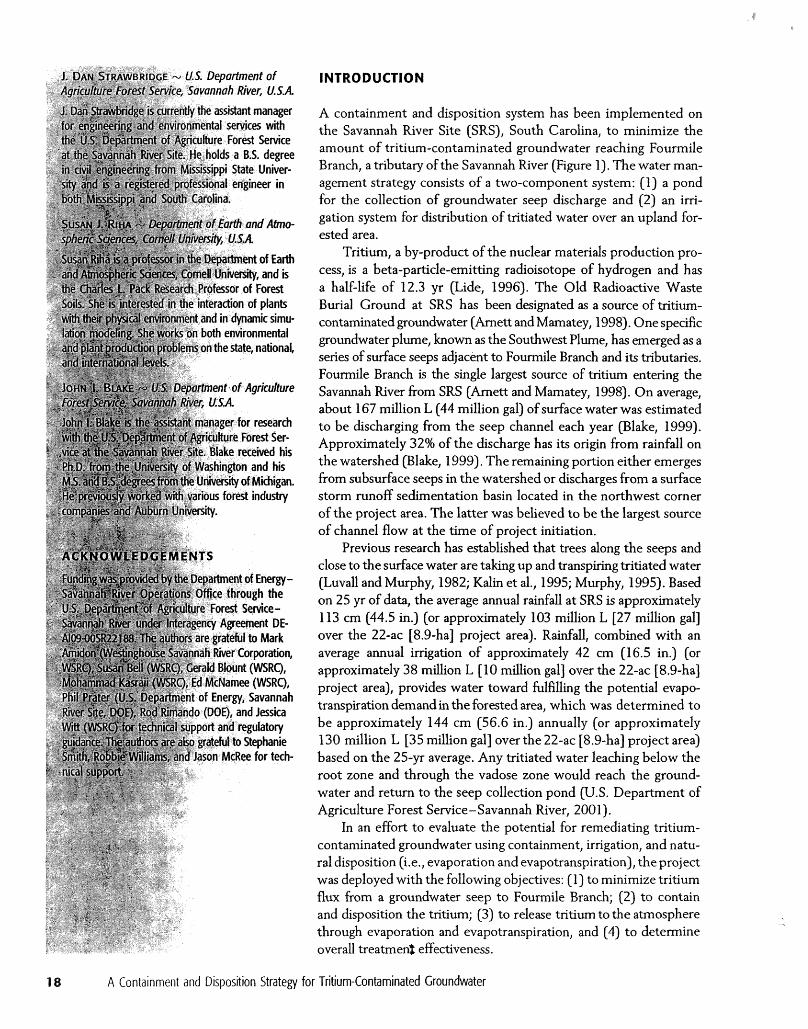
A containment and disposition system has been implemented on the Savannah River Site (SRS), South Carolina, to minimize the amount of tritium-contaminated groundwater reaching Fourmile Branch, a tributary of the Savannah River (Figure 1). The water man- agement strategy consists of a two-component system: (I) a pond for the collection of groundwater seep discharge and (2) an irri- gation system for distribution of tritiated water over an upland for- ested area,
Tritium, a by-product of the nuclear materials production pro- cess, is a beta-particle-emitting radioisotope of hydrogen and has a half-life of 12.3 yr (Lide, 1996). The Old Radioactive Waste Burial Ground at SRS has been designated as a source of tritium- contaminated groundwater (Arnett and Mamatey, 1998). One specific groundwater plume, known as the Southwest Plume, has emerged as a series of surface seeps adjacent to Fourmile Branch and its tributaries. Fourmile Branch is the single largest source of tritium entering the Savannah River from SRS (Amett and Mamatey, 1998). On average, about 167 million L (44 million gal) of surface water was estimated to be discharging from the seep channel each year (Blake, 1999). Approximately 32% of the discharge has its origin from rainfall on the watershed (Blake, 1 999). The remaining portion either emerges from subsurface seeps in the watershed or discharges from a surface storm runoff sedimentation basin located in the northwest comer of the project area. The latter was believed to be the largest source of channel flow at the time of project initiation.
Previous research has established that trees along the seeps and close to the surface water are taking up and transpiring tritiated water (Luvall and Murphy, 1982; Kalin et al., 1995; Murphy, 1995). Based on 25 yr of data, the average annual rainfall at SRS is approximately 113 cm (44.5 in.) (or approximately 103 million L [27 million gal] over the 22-ac [8.9-ha] project area). Rainfall, combined with an average annual irrigation of approximately 42 cm (16.5 in.) (or approximately 38 million L [ 10 million gal] over the 22-ac [8.9-ha] project area), provides water toward hlfilling the potential evapo- transpiration demand in the forested area, which was determined to be approximately 144 cm (56.6 in.) annually (or approximately 130 million L [35 million gal] over the 22-ac [8.9-ha] project area) based on the 25-yr average. Any tritiated water leaching below the root zone and through the vadose zone would reach the ground- water and return to the seep collection pond (U.S. Department of Agriculture Forest Service- Savannah River, 2001).
In an effort to evaluate the potential for remediating tritium- contaminated groundwater using containment, irrigation, and natu- ral disposition (i.e., evaporation and evapotranspiration), the project was deployed with the following objectives: (1) to minimize tritium flux from a groundwater seep to Fourmile Branch; (2) to contain and disposition the tritium; (3) to release tritium to the atmosphere through evaporation and evapotranspiration, and (4) to determine overau treatmed effectiveness,
18 A Containment and Disposition Strategy for Tritium-Contaminated Groundwater
RAINFALL EVAPOTRANSPIRATION
EVAPOTRANSPIRATION UNDER IRRlGATlON
POND EVAPORATION
RECHARGE
Figure 1. Conceptual drawing of the containment and disposition water management strategy. The water balance wifiout irrigation (left) is compared to the water budget where management strategy has been implemented (right).
MATERIALS AND METHODS
Pond System Description
The groundwater seep selected for this project was lo- cated on the SRS near Fourmile Branch, a tributary of the Savannah h e r . A sheet pile dam, which allowed for the collection of seep discharge and subsequent pond formation, was installed in October 2000. The valve to the dam was closed in November 2000. Over the next several months, seepage filled the impoundment, re- sulting in the formation of a pond with a 9.6 million-L (2.5 million-gal) storage capacity. This ~ o n d capacity is equivalent to 21.5 days of average discharge or 5.7% of the total annual discharge. Construction of a stormwater bypass (30-in. E76.2-m] pipe diameter) was completed in June 2002; this bypass was intended to drvert storm- water runoff, inclucfing stormwater sedimentation pond discharge, from upgradient of the project area around the pond toward Fourmile Branch. The diversion re- duced the irrigation operation time required to manage the pond water level by preventing mixing of pond tritium activity with stormwater runoff.
Irrigation System Design
The irrigation system is located on a 22-ac (8.9-ha) es- tablished upland forested area composed of mixed pines [primarily loblolly (Pinus taeda) and slash (Pinus elliorii)] and hardwoods (primarily sweetgum [Liquidambar styraciflua] and laurel oak [Querw lau~fololia]). The irrigation distribution system consists of two pumps (a 10-hp supply pump and a 1 5-hp distribution pump), a 15,140-L (4000-gal) supply tank, and float switches that control the respective pumps based on tank water level. The irrigation area layout consists of 28 plots, and plot size varies because of the topography of the area and the spacing of trees in the established forest. As water flows from the distribution pump to an in- dividual sprinkler head, the irrigation system is com- prised of a buried 4-in. (10-cm)-diameter Schedule 80 polyvinyl chloride (PVC) mainline, above-ground 2-in. (5-cm)-diameter header lines, 1 -in. (2.5-an)-diameter lateral lines, and 10-mm (0.4-in.)-diameter connection lines attached to a riser that mounts the sprinkler head at a height of approximately 0.5 m (1.6 ft). Each sprin- kler assembly is comprised of a 2-atm pressure regulator,
HITCHCOCK ET AL. 19
an antidrip mechanism, and a sprinkler head with a flow rate constant of 2.0 L min- ' (0.52 gal min- I). Risers and heads are spaced on an approximately 5-m (16.4-ft) square grid. The resulting flow per unit area is approxi- mately 31 8 L mine ' ac- ' (84 gal min- ' ac- I), or 0.0786-mm (0.003-inf equivalent depth of water per minute.
Routine irrigation System Operaaons
In March 2001, inigation system testing was performed, and routine operations began in April 2001. Irrigation to each plot was controlled by a solenoid valve, which was engaged using a two-wire system. Solenoid valve con- trol is accomplished using a lowm master@ flow con- troller that is managed using ~ u c o r @ software for defining daily irrigation schedules. Decision making for summer M y irrigation was accomplished using a spread- sheet algorithm m a , 2001), which provided a contin- uous daily estimate of soil water deficit using a water balance approach with inputs including measured rain- fall and previous irrigation depths, as well as calculated evapotranspiration using the Priestly-Taylor method (Priestly and Taylor, 1972). In summer months, if the calculated daily soil water deficit was greater than the estimated equivalent depth of water to be applied as ir- rigation, then irrigation proceeded as scheduled. Because winter transpiration is poorly understood in southeastern United States forests, winter irrigation scheduling times (October 15-April 15) were based on historic daily pan evaporation data from Blackville, South Carolina.
For the first year of operations (April 2001 -April 2002), plots were irrigated based on equivalent weekly volumes totaling 36 mm (1.4 in.) per week at a fre- quency of 6 mm (0.24 in) per day every day for 6 days per week. After 9 months of operations, it was rec- ommended that an evapotranspiration adjustment fac- tor of 0.9 multiplied by the potential evapotranspi- ration was a reasonable upper limit for forest stands with well-developed canopies (Riha, 20023, To ensure that overwatering did not occur, a reduction factor of 0.4 5 was applied to the evapotranspiration calculations, and daily irrigation schedule times for summer months were reduced accordingly beginning with the sum- mer irrigation schedule in April 2002 piha, 2002).
Seep Flow Rate Determination
An average seep flow estimated by tritium dilution in Fourmile Branch was determined to be 3 17.6 L rnin- (83.9 gal min- ') for 1993- 1997; however, no actual
seep flow measurements existed prior to 1999. A base flow rate of 150 L min-' (40 gal m i n L ) was deter- mined during a single measurement in 1999 and a peak flow of about 1300 L min - ' (342 gal rnin - ') following a storm event (Blake 1 999).
To properly assess the effectiveness of the tritiated water management strategy, seep flow rates were de- termined using a ~ o n d water balance approach. The ~ o n d water balance is based on the following model weekly intervals on a volumetric basis:
Pond water level was measured with an Remote Data Systems, Inc. Systems WL-80 data logger, whereas miss- ing data was supplanted by mean daily staff gage mea- surements using data collected prior to and after irri- gation. Pond volume and surface area were determined as related to pond water level using previously es- tablished surveying relationships (M. Arnidon, 2002, personal communication); bank storage of pond water was not considered.
Pond evaporation of tritiated water provided a sec- ondary mechanism of remedial action. It was assumed that rainwater mixed uniformly and instantaneously, so that pond activity was equal to surface activity. It was also assumed that tritiated water evaporated by the same mechanism as water, and that the partial pres- sure gradient had no influence on loss. The daily depth of pond water evaporation was estimated using the Penman method (Penman, 1948; Jensen et al., 1990), and daily evaporation volumes were determined by mul- tiplying the resulting equivalent depth of water evapo- rated and the daily average pond surface area for a given pond water level. The amount of tritium released to the atmosphere by evaporation was estimated by multi- plying the daily volume of water evaporated by the pond tritium activity. This procedure for determining daily evaporation volume may underestimate that vol- ume of tritiated water actually evaporated based on the work of Horton et al. (1971), who determined that the practical absence of tritiated water in the atmo- sphere creates a larger driving force for evaporative transport of tritiated water compared to water, This effect, however, is presumably small relative to the overall system performance.
Rainfall data was collected from several sources as data from various instrumentation were analyzed and evaluated for reliability and relevance over the course of tbe project duration. Initially, from April 2001 to
20 A Containment and Disposition Strategy for Tritium-Contaminated Groundwater
April 2002, rainfall from the SRS site weather data was monitored, as well as three tipping bucket rain gages located within and adjacent to the project area. After April 2002, two rainfall collectors with a funnel and carboy configuration located in the irrigation area were used. The contribution of rainfall to the pond wa- ter balance was determined by multiplying the equiv- alent depth and the respective pond surface area.
Irrigation provided the primary mechanism of re- medial action. If prescribed conditions were met, ir- rigation was performed. Flow rates to plots were de- termined in two ways: (1) using a Data IndustrialW flow sensor to measure flow (actual) or (2) calculating flow rate (theoretical) based on sprinkler head flow constants (2.0 L m i n '; 0.52 gal min- I ) , the number of heads per plot (-1 62 per ac), and plot irrigation time.
Soil Water Content and Pond and Soil Tritium Activity
To monitor and evaluate remediation effectiveness, 6 of the 28 irrigation plots contained three instrumentation clusters (n = 18) for monitoring purposes. In-situ mea- surements at the project area included soil water con- tent by time domain reflectometry using a TRIME@ unit on a biweekly basis at three depths: 25, 55, and 135 cm (9.8, 21.6, and 53.1 in.) (a 95-cm t37.4-in.] depth was added in April 2002). Soil water samples were also extracted monthly for tritium analyses us- ing soil water vapor tube samplers, which consisted of a vacuum pump for collecting soil water vapor from wells at a given depth and a cooler system for the con- densation of vapor into a liquid sample. Tritium ac- tivity of the water vapor was assumed to be in equi- librium with the tritium activity in the soil water at the sample depth. The soil water vapor well consisted of 1 in. (2.5-cm) Schedule 40 PVC well casing. The screen at the bottom was 6 in. (1 5 cm) long of slotted well driller's PVC pipe. A clay mixture was placed above the screen to prevent water flow through the borehole. Brass fittings at the top and side provided sample access. Air was drawn through plastic tubing attached to the side fitting by a minipump (- 1.5 L min- ') for about 36-48 hr. The air was cooled to 32°F (0°C) as it entered a glass U-tube in an ice chest, and water vapor condensed and collected in a small test tube at the base. These samples were collected in the first 3.0 m (9.84 ft) of the soil profile at five depths: 25, 55, 135,205, and 295 cm (9.8,21.6,53.1,80.7, and 1 1 6.4 in.). Soil water samples were analyzed for tritium activity by liquid scintillation analysis with an estimated
detection limit of 20 pCi mL- ' and a counting error below 2% for elevated tritium activity (Minaxi Tri- Carb 4000, Packard Instrument Co.). In addition, pond samples for tritium analysis were taken separately three times per week by the SRS Environmental Monitor- ing Services.
RESULTS AND DISCUSSION
Rainfall and Evapotranspiration Deficits
Figure 2 gives monthly storm event frequency and rainfall data over the first 3 yr of irrigation operations. During this period, an average of approximately 73 rainfall events per year greater than 2 mm (0.08 in.) occurred at SRS, which is the minimum needed to ex- ceed canopy storage. Annual rainfall at the project area during 2001 (916 mm; 36 in.) was 25.2% below the 30-yr average annual rainfall (1 225 mm; 48 in.), where- as during 2002 (863 rnm; 33.9 in.), it was 29.5% below 30-yr average annual rainfall. The calculated evapo- transpiration deficit for the project area (Figure 3), which is equivalent to the calculated potential evapo- transpiration minus measured rainfall, ranged from 20 mm (0.8 in) (winter) to 50 mm (1.9 in.) (summer) in 2001 and from - 10 mm ( - 0.4 in) (winter) to 150 mrn (5.9 in.) (summer) in 2002. From the calculated monthly evapotranspiration deficits, it is apparent that favor- able conditions for irrigation existed from April 2001 to October 2002 because drought conditions persisted during these months at SRS. However, between No- vember 2002 and June 2003, with the exception of the months of January and May 2003, measured rain- fall typically exceeded calculated evapotranspiration, resulting in a net negative evapotranspiration deficit. Annual rainfall for 2003 (1 425 mm; 56 in.) was 16.3% above the 30-yr average annual rainfall. However, be- cause the decision to irrigate was based on daily contin- uous soil water deficit calculations in summer months, irrigation was feasible during months with a negative def- icit because of the available storage in the soil profile. Favorable irrigation conditions returned in August 2003.
Irrigation
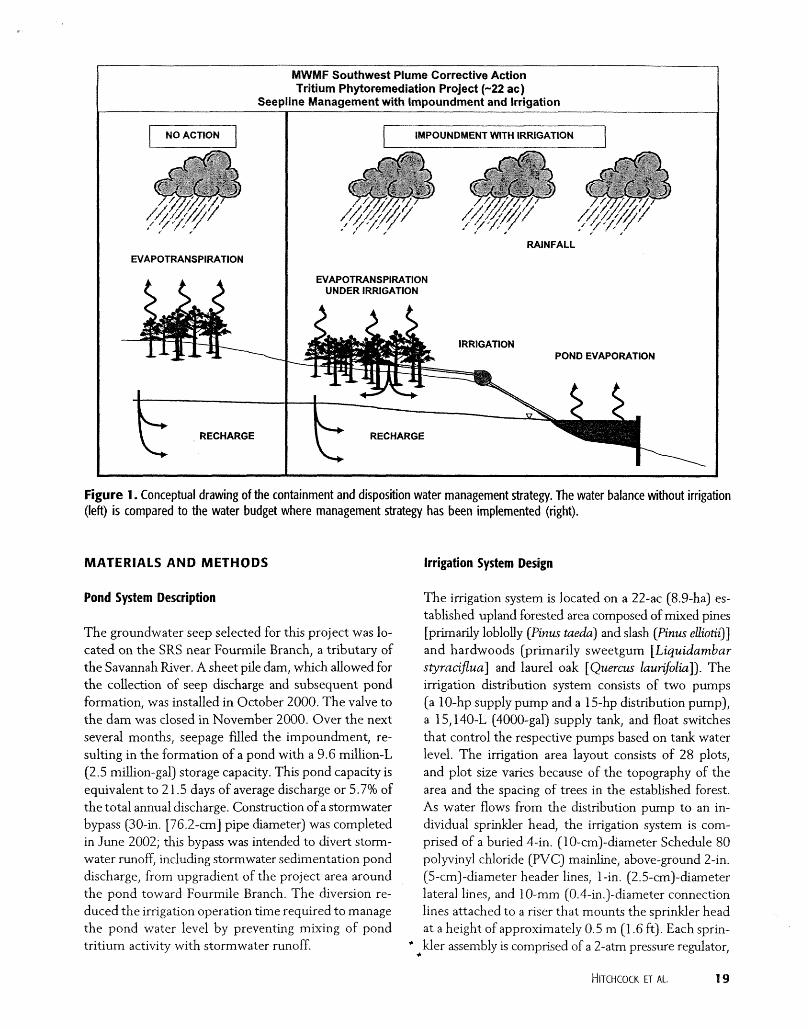
Figure 4 shows daily irrigation volumes based on actual flow rates. As of the end of March 2004, cumulative ir- rigation volume totaled 1 33.2 million L (3 5.2 million gal)
* since irrigation operations began in April 2001. Over
A M J J A S O N D J F M A M J J A S O N D J F M A M J J A S O N D
2001 2002 2003 Figure 2. Monthly rainfall and number of storm events (>2.0 mm; >O.08 in.) during the first 3 yr of irrigation operations (April 200 1 - December 2003).
the 3-yr ~er iod, approximately 1500 Ci of tritium was (14 million gal) were irrigated to 28 plots on the 22-ac distributed over the 22-ac (8.9-ha) forested area via ir- (8.9-ha) irrigation area over a %month period. In 2002, a rigation. In 200 1 (9 months), approximately 53 million L total volume of approximately 36 d o n L (9.6 million gal)
Figure 3. Evapotranspirati on deficits (evapotranspiration mi- nus rainfall) from April 2001 to March 2004.
A Containment and Disposition Strategy for Tritium-Contaminated Groundwater
A M J J A S O N D J F M A M J J A S O M D J F M A M J J A S O N D 2001 2002 2003
was applied during the period. In 2003, a total vol- ume of approximately 38 million L (10 million gal) was applied during the period. The varying impacts between drought years (2001 and 2002) and a wet year (2003) on irrigation operations can be seen in Figure 4, which shows daily irrigation volumes for April 2001 - March 2004. In 2002, irrigation was limited by the lack of pond water available for irrigation in the summer, when seep flow into the pond could not keep up with daily irrigation. Conversely, the ability to irrigate was limited by a lack of available soil water deficit in 2003. As previously noted, the pond finally overflowed the dam in March 2003 and continued over the dam through March 2004.
Pond Level, Volume, and Tritium Activity
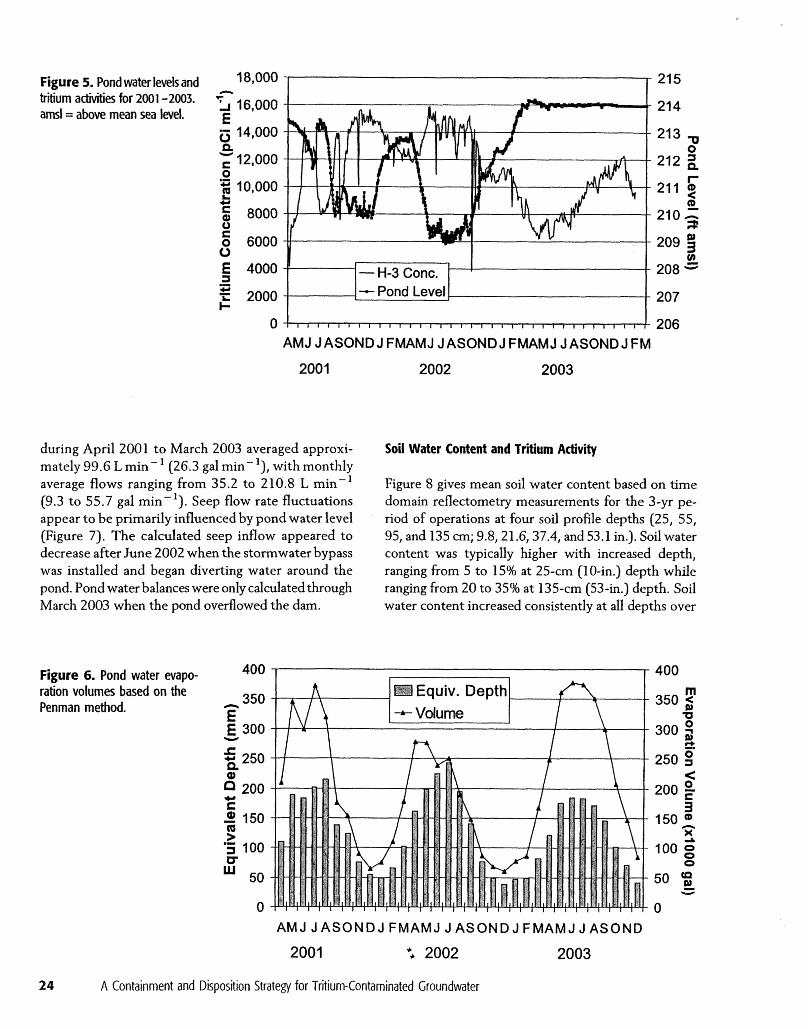
The pond overflowed the dam at the beginning of ir- rigation operations (April 2001) and did not overflow again until March 2003, after which flow continued over the dam for the remainder of the year. Pond water level [Figure 5) ranged from 63.7 m (209 ft) to 65.2 m (2 14 ft) above mean sea level between April 2001 and March 2004. Pond water level fluctuation was pri- marily influenced by irrigation and rainfall. The storm- water bypass diverted approximately 56.8 million L (1 5 d o n gal) around the pond &om November 2002 to
Figure 4. Daify irrigation vof- umes ft-om April 2001 to Mar& 2m. A total of 35.2 gal (1 33.2 L) was irrigated over the 3-yr period.
March 2004. Tritium activity in the pond (Figure 5) ranged from 5000 to 16,000 pCi mL- ' (1 Ci = 1 x 10¹² pCi). Pond tritium activity fluctuations were primarily in- fluenced by rainfall events. As of March 3 1, 2004, ap- proximately 95 Ci of tritium was stored in the pond.
Pond Water Balance and Seep Flow Rates
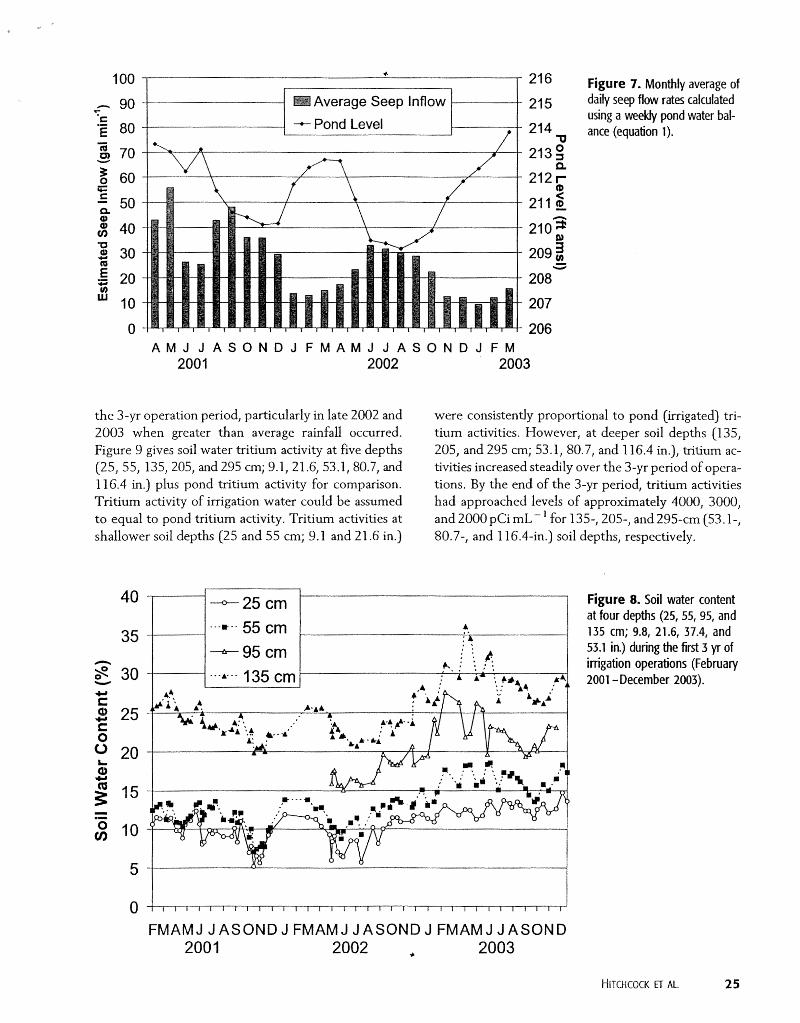
Monthly pond evaporation as calculated using the Penman equation (Figure 6) in terms of equivalent depth ranged from as high as 240 mm (9.4 in.) in July 2002 to as low as 35 mm (1.4 in.) in December 2002. Monthly volumetric pond evaporation ranged from as high as 1.42 million L (375,000 gal) in June 2003 to as low as 227,000 L (60,000 gal) in December of 2001 and 2002. A total of approximately 27.3 million L (7.2 million gal) of pond water was evaporated over the 3-yr period based on the Penman method. Ap- proximately 284 Ci of tritium was released to the atmosphere by tritium flux via evaporation between April 2001 and March 2004, based on Penman evapo- ration and daily pond tritium activities. Weekly seep discharge flow rates were determined using weekly evaporation, rainfall, and irrigation volumes, along with the weekly change in pond storage, in equation 1. Calculated seep discharge flow rates (Figure 7) based
* on pond water balance calculations for data collected *
HITCHCOCK ET AL. 23
Figure 5. Pond water Iwb and
am! = a h e mean sea lwei.
~ i i i i ~ ~ i ~ ~ ~ ~ l ~ l l l l l , l l 1 2 0 6 AMJJASONDJFMAMJJASONDJFMAMJJASONDJFM
..II = 2000 c
during April 2001 to March 2003 averaged approxi- mately 99.6 L min- ' (26.3 gal min- I), with monthly average flows ranging from 35.2 to 210.8 L min-' (9.3 to 55.7 gal min- '). Seep flow rate fluctuations appear to be primarily influenced by pond water level (Figure 7). The calculated seep inflow appeared to decrease after June ZOO2 when the stormwater bypass was installed and began diverting water around the pond. Pond water balances were only calculated through March 2003 when the pond overflowed the dam.
Soil Water Content and Tritium Activity
4- Pond eve^ J
Figure 8 gives mean soil water content based on time domain reflectometry measurements for the 3-yr pe- riod of operations at four soil profile depths (25, 55, 95, and 135crn;9.8,21.6,37.4,and53.1 in.).Soilwater content was typically higher with increased depth, ranging from 5 to 15% at 25-cm (10-in.) depth while ranging from 20 to 35% at 135-cm (%-in.) depth. Soil water content increased consistently at all depths over
207
Figure 6. Pond water evapo- 400 400 ration volumes based on the 350 m Penman method. - 350 f m
E 300 Y
300 C =. .r, 250 250 2
200 <
.cI 200 g r: 2 150
3 Q
150 2 > )<
'5 100 4
CT 100 g
50 0
50 E!. u
0 0 AMJ JASONDJFMAMJ JASONDJFMAMJJASOND
24 A Containment and Disposition Strategy for Tritium-Contaminated Groundwater
f?!4B# Average Seep Inflow I -1 -- Pond Level 1 * I
A M J J A S O N D J F M A M J J A S O N D J F M 2001 2002 2003
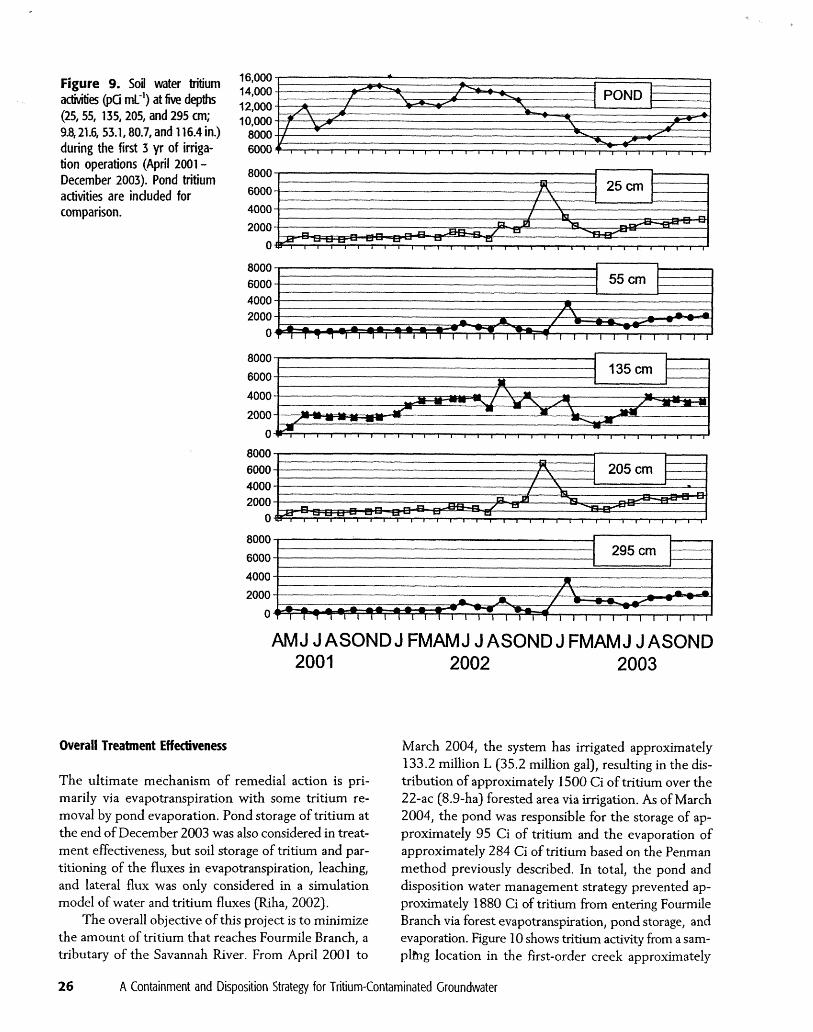
the 3-yr operation period, particularly in late 2002 and 2003 when greater than average rainfall occurred. Figure 9 gives soil water tritium activity at five depths (25, 55, 135,205, and295 crn; 9.1,21.6, 53.1,80.7, and 116.4 in.) plus pond tritium activity for comparison. Tritium activity of irrigation water could be assumed to equal to pond tritium activity. Tritium activities at shallower soil depths (25 and 55 cm; 9.1 and 21.6 in.)
Figure 7. Monthly average of daily seep flow rates calculated using a w e & pond water bal- ance (equa~on l).
were consistently proportional to pond (irrigated) tri- tium activities. However, at deeper soil depths (1 35, 205, and 295 cm; 53.1, 80.7, and 1 16.4 in.), tritium ac- tivities increased steadily over the 3-yr period of opera- tions. By the end of the 3-yr period, tritium activities had approached levels of approximately 4000, 3000, and 2000 pCi mL-' for 135-,205, and 295-cm (53.1-, 80.7-, and 1 1 6.4-in.) soil depths, respectively.
+25 crn ---r-- 55 cm +.
Figure 8. Soil water content at four depths (25,55,95, and 135 cm; 9.8, 21.6, 37.4, and 53.1 in.) during the first 3 yr of irrigation operations (February 2001 - December 2003).
FMAMJ JASONDJFMAMJJASONDJFMAMJJASOND 2001 2002
3. 2003
Figure 9. Soil water tritium @ci ml-') at fiYe depth
(25,55, 135,205, and 295 an; 9 4 21 5, 53.1,80.7, and 1 16.4 in.) during the first 3 yr of irriga- tion operations (April 2001 - December 2003). Pond tr=ttium a&vities are included for comparison.
AMJJASONDJFMAMJJASONDJFMAMJJASOND
Overall Treatment Effectiveness
The ultimate mechanism of remedial action is pri- marily via evapotranspiration with some tritium re- moval by pond evaporation. Pond storage of tritium at the end of December 2003 was also considered in treat- ment effectiveness, but soil storage of tritium and par- titioning of the fluxes in evapotranspiration, leaching, and lateral flux was only considered in a simulation model of water and tritium fluxes @ha, 2002).
The overall objective of this project is to minimize the amount of tritium that reaches Fourmile Branch, a tributary of the Savannah River. From April 2001 to
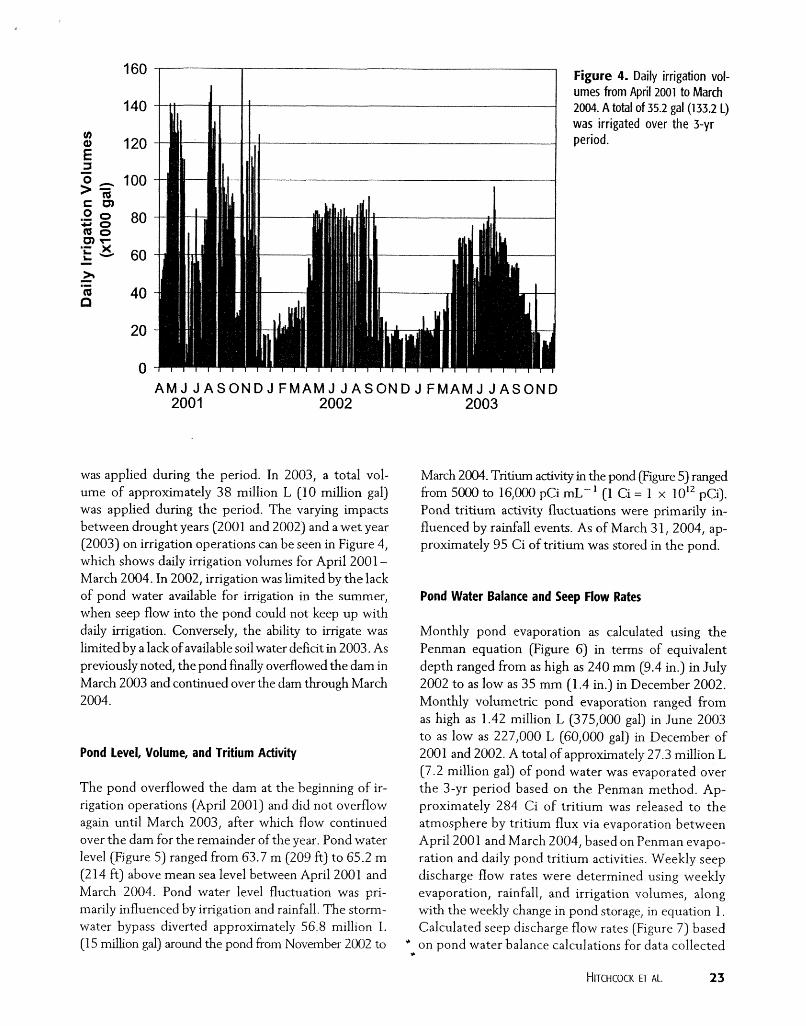
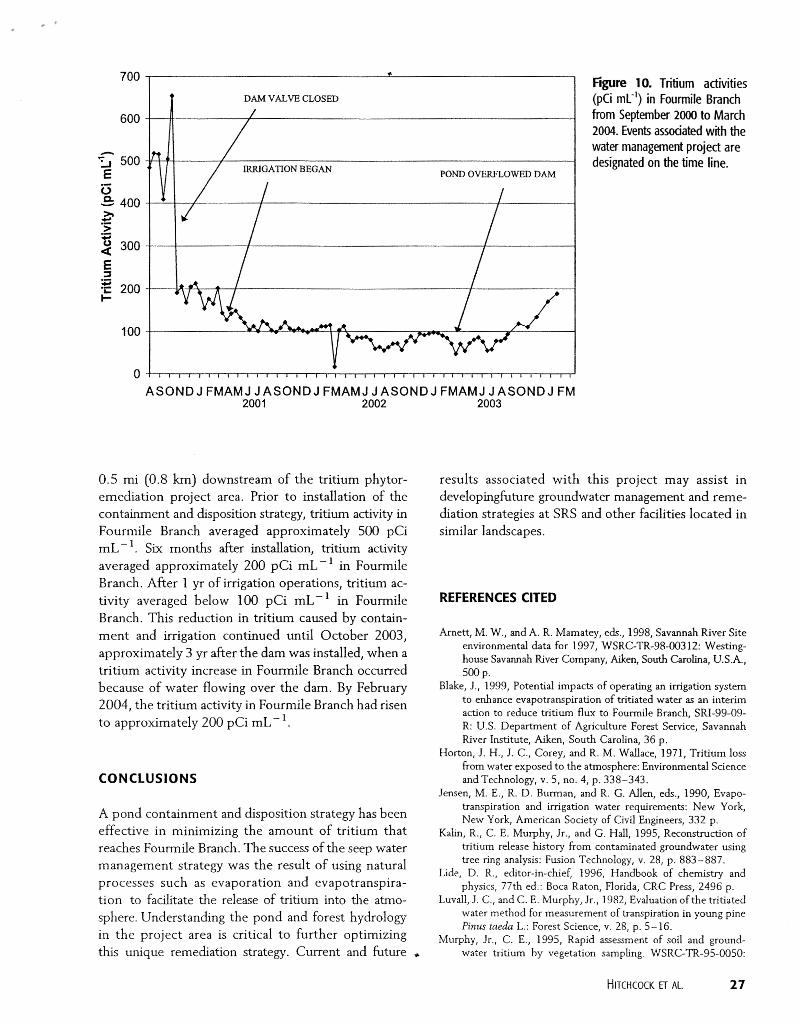
March 2004, the system has irrigated approximately 133.2 million L (35.2 million gal), resulting in the dis- tribution of approximately 1500 Ci of tritium over the 22-ac (8.9-ha) forested area via irrigation. As of March 2004, the pond was responsible for the storage of ap- proximately 95 Ci of tritium and the evaporation of approximately 284 Ci of tritium based on the Penman method previously described. In total, the pond and disposition water management strategy prevented ap- proximately 1880 Ci of tritium from entering Fourmile Branch via forest evapotranspiration, pond storage, and evaporation. Figure 1 0 shows tritium activity from a sam- plmg location in the first-order creek approximately
26 A Containment and Disposition Strategy for Tritium-Contaminated Groundwater
POND OVERFLOWD DAM
700 Figure 10. Tritium activities (pCi rn~-') in Foumile Bmnch
600 from Sqtember 2200 to March 2004. Events associated with the
A vvater management project are 500 designated on the time line.
E - 400
a - > - .w 2 300
5 - 200
100
0 ASONDJFMAMJJASONDJFMAMJJASONDJFMAMJJASONDJFM
2001 2002 2003
0.5 mi (0.8 krn) downstream of the tritium phytor- results associated with this project may assist in ernediation project area. Prior to installation of the developinghture groundwater management and reme- containment and disposition strategy, tritium activity in diation strategies at SRS and other facilities located in Fourmile Branch averaged approximately 500 pCi similar landscapes. m ~ - '. Six months after installation, tritium activity averaged approximately 200 pCi mL-' in Fourmile Branch. After 1 yr of irrigation operations, tritium ac- tivity averaged below 100 pCi mL-' in Fourmile REFERENCES CITED
Branch. This reduction in tritium caused by contain- ment and irrigation continued until October 2003. Arnett, M. W., and A. R. Mamatey, eds., 1998, Savannah River Site - approximately 3 yr after the dam was installed, when a tritium activity increase in Fourrnile Branch occurred
environmental data for 1997, WSRC-TR-98-003 12: Westing- house Savannah River Company, Aiken, South Carolina, U.S.A., 500 p.
because of water flowing over the dam, By February Blake, J,, 1999, Potential impacts of operating an irrigation system
2004, the tritium activity in Fourmile Branch had risen to enhance evapotranspiration of tritiated water as an interim action to reduce tritium flux to Fourmile Branch, SRI-99-09-
to approximately 200 pCi mL- '. R: U.S. Department of Agriculture Forest Service, Savannah River Institute, Aiken, South Carolina, 36 p.
Horton, J. H., J. C., Corey, and R. M. Wallace, 1971, Tritium loss fiom water exposed to the atmosphere: Environmental Science
CONCLUSIONS andTechnology, v. 5, no. 4, p. 338-343. Jensen, M. E., R. D. Burman, and R. G. Allen, eds., 1990, Evapo-
A pond containment and disposition strategy has been effective in minimizing the amount of tritium that reaches Fourmile Branch. The success of the seep water management strategy was the result of using natural processes such as evaporation and evapotranspira- tion to facilitate the release of tritium into the atmo- sphere. Understanding the pond and forest hydrology in the project area is critical to further optimizing this unique remediation strategy. Current and future
transpiration and irrigation water requirements: New York, New York, American Society of Civil Engineers, 332 p.
Kalin, R., C. E. Murphy, Jr., and G. Hall, 1995, Reconstruction of tritium release history from contaminated groundwater using tree ring analysis: Fusion Technology, v. 28, p. 883-887.
Lide, D. R., editor-in-chief, 1996, Handbook of chemistry and physics, 77th ed.: Boca Raton, Florida, CRC Press, 2496 p.
Luvall, J. C., and C. E. Murphy, Jr., 1982, Evaluation of the tritiated water method for measurement of transpiration in young pine Pinus taeda L.: Forest Science, v. 28, p. 5-16.
Mufphy, Jr., C. E., 1995, Rapid assessment of soil and ground- -A water tritium by vegetation sampling. WSRC-TR-95-0050:
Westinghouse Savannah River Corporation, Aiken, South Caro- lina, U.S.A, 23 p.
Penman, H. L., 1948, Natural evaporation from open water, bare soil and grass: Proceedings of the Royal Society A: Mathemat- ical, Physical, and Engineering Sciences., v. 193, p. 120- 145.
Priestly, C. H. B., and B. J. Taylor, 1972, On the assement of surface heat fiw evaporation using large scale parameters: Monthly Weather Review, v. 100, p. 81 -92.
Riha, S. J., 2001, Soil properties: Savannah River Site southwest mixed waste plume tritium remediation site: Interim re-
* port for Forest Service-Savannah River, October 3 1, 2001, 13 p.
Riha, S. J., 2002, Soil profile water and tritium fluxes: Savannah River Site southwest mixed waste plume tritium remedia- tion site: Interim report for Forest Service-Savannah River, March 3 1, 2002, 13 p.
U.S. Depament of Agricultwre Forest Senrice-Savamafi River, 2001, Effectiveness monitoring plan for the tritiated water man- agement facility Southwest Plume interim measures, Rev. 0, WSRC RP-2001-4033, February 10,2001, 25 p.
A Containment and Disposition Strategy for Tritium-Contaminated Groundwater