U.S. FISH AND WILDLIFE SERVICE DIVISION OF ENVIRONMENTAL QUALITY REGION 6 CONTAMINANT EXPOSURE AND REPRODUCTIVE HEALTH OF SANDHILL CRANES IN THE CENTRAL PLATTE RIVER VALLEY, NEBRASKA. Photo by Lee Robinson 3/14/05 U.S. Fish and Wildlife Service Nebraska Field Office 203 West 2 nd Street Grand Island, NE 68801 May, 2005
Transcript
U.S. FISH AND WILDLIFE SERVICE DIVISION OF ENVIRONMENTAL QUALITY
REGION 6
CONTAMINANT EXPOSURE AND REPRODUCTIVE HEALTH OF SANDHILL CRANES IN THE CENTRAL PLATTE RIVER
VALLEY, NEBRASKA.
Photo by Lee Robinson 3/14/05
U.S. Fish and Wildlife Service Nebraska Field Office
203 West 2nd Street Grand Island, NE 68801
May, 2005
CONTAMINANT EXPOSURE AND REPRODUCTIVE HEALTH OF SANDHILL CRANES IN THE CENTRAL PLATTE RIVER VALLEY, NEBRASKA.
Prepared by Matthew S. Schwarz1
Christina D. Lydick1
Karen J. Nelson2
Timothy S. Gross3
1U.S. Fish and Wildlife Service Division of Environmental Quality Nebraska Field Office Grand Island, Nebraska 68801. 2U.S. Fish and Wildlife Service Division of Environmental Quality Montana Field Office Helena, Montana 59601. 3U.S. Geological Survey Biological Resources Division Florida Caribbean Science Center Gainesville, Florida 32653.
U.S. Fish and Wildlife Service Division of Environmental Quality
Region 6 DEC ID: 6F39
FFS: 199960004
Congressional District 3
iii
ACKNOWLEDGEMENTS
The authors thank those that contributed time and effort towards this study. Dave Brant and
his crew from the U.S. Geological Survey’s Northern Prairie Natural Resource Center collected the
cranes and Dave assisted with crane necropsies. Carla Wieser of the U.S. Geological Survey’s Florida
Caribbean Science Center analyzed all crane plasma samples. Amelinda Webb, a Student Career
Experience Program employee with the Nebraska Ecological Services Field Office, screened gizzard
contents for lead shot. Sheryl Leffer provided data on hormone concentrations in sandhill cranes from
Patuxent National Wildlife Research Center. Tim Fannin and Larry Gamble peer-reviewed the final
report draft, and Larry Gamble also coordinated project funding and sample submission.
iv
TABLE OF CONTENTS
ACKNOWLEDGEMENTS iii ABSTRACT v LIST OF TABLES vi LIST OF FIGURES vii ACRONYMS AND ABBREVIATIONS vii INTRODUCTION 1 Research Objectives 3 METHODS 5 Sample Collection 5 Hormones and Gonad Histology 6 Gizzard Lead Shot Screen 7 Chemical Analyses 7 Elemental Contaminants 8 Organochlorine Chemical Residues 8 Pesticides in Soil and Corn 8 RESULTS AND DISCUSSION 9 Sample Collections 9 Hormones 11 Gonad Histology 13 Elemental Contaminants 13 Organochlorines and Pesticides 16 Management Recommendations 17 Conclusions 17 REFERENCES CITED 19 APPENDIX A: Additional Tables 22
ABSTRACT
The central Platte River Valley provides crucial staging habitat for the endangered
whooping crane (Grus americana) and the mid-continent population of sandhill cranes
(Grus canadensis). Platte River flow depletions and the conversion of native wet
meadows for agriculture and other purposes has decreased the cranes natural habitat in
the central Platte River Valley, and waste corn now makes up most of the cranes diet
while they are in the Valley.
The purpose of this research was to measure organochlorine, elemental
contaminant, and pesticide exposure to sandhill cranes from the central Platte River
Valley, and to evaluate their reproductive condition. Pesticides and organochlorines were
measured in soil and waste corn samples collected from cornfields where sandhill cranes
foraged. Elemental and/or organochlorine contaminants were measured in sandhill crane
carcass, liver, brain, muscle, and kidney tissues. Reproduction in sandhill cranes was
evaluated by measuring sex steroids in blood plasma and by histological examination of
gonads.
Sandhill cranes collected from the central Platte River Valley in 1999 and 2001
appeared to be in normal reproductive condition and concentrations of organochlorines in
their tissues were not at levels considered harmful. In addition, pesticides in corn and
soil from cornfields were all below detection. Elemental contaminants measured in crane
tissues also were generally low, with the exception of boron. Concentrations of boron in
LIST OF TABLES 1 Detections and mean concentrations of elemental contaminants in
liver samples of sandhill cranes from the central Platte River Valley, 2001 compared to 1989 -1990. 14
2 Concentrations of organic contaminants detected in sandhill cranes
collected from the central Platte River Valley, Nebraska, 1999 and 2001. 17 A.1
Summary of samples collected for analytical residue analysis from sandhill cranes and cornfields in the central Platte River Valley, Nebraska, 1999 and 2001. 22
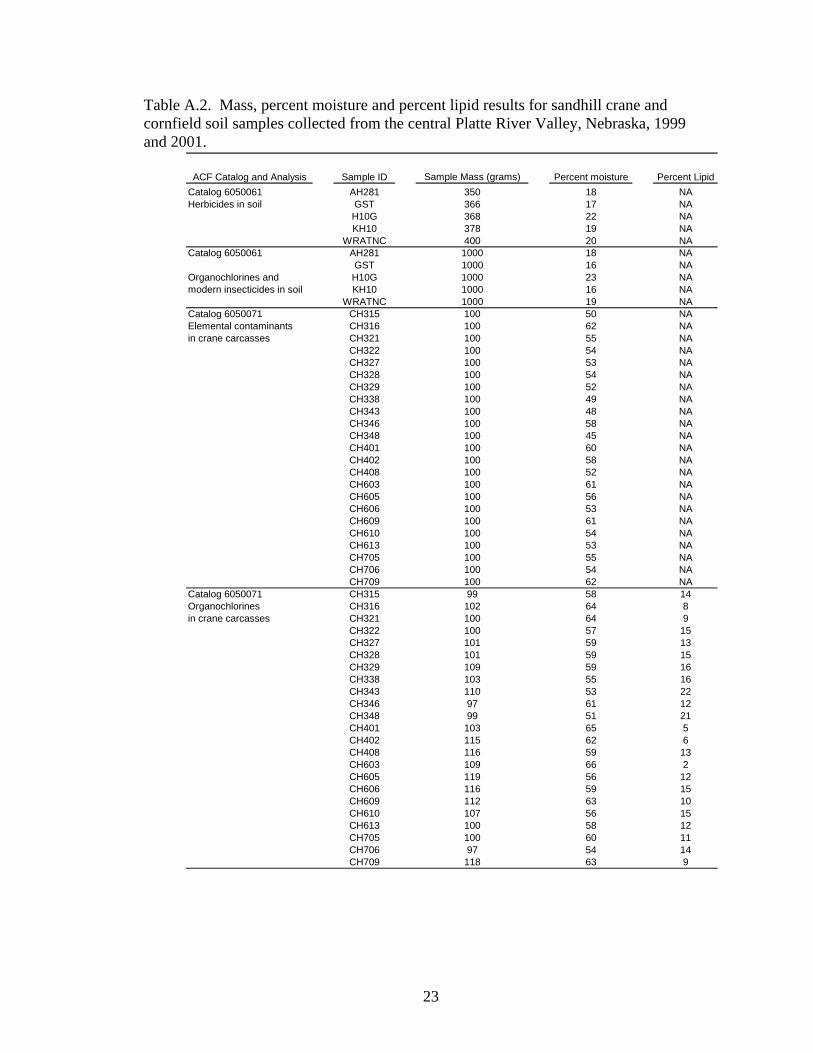
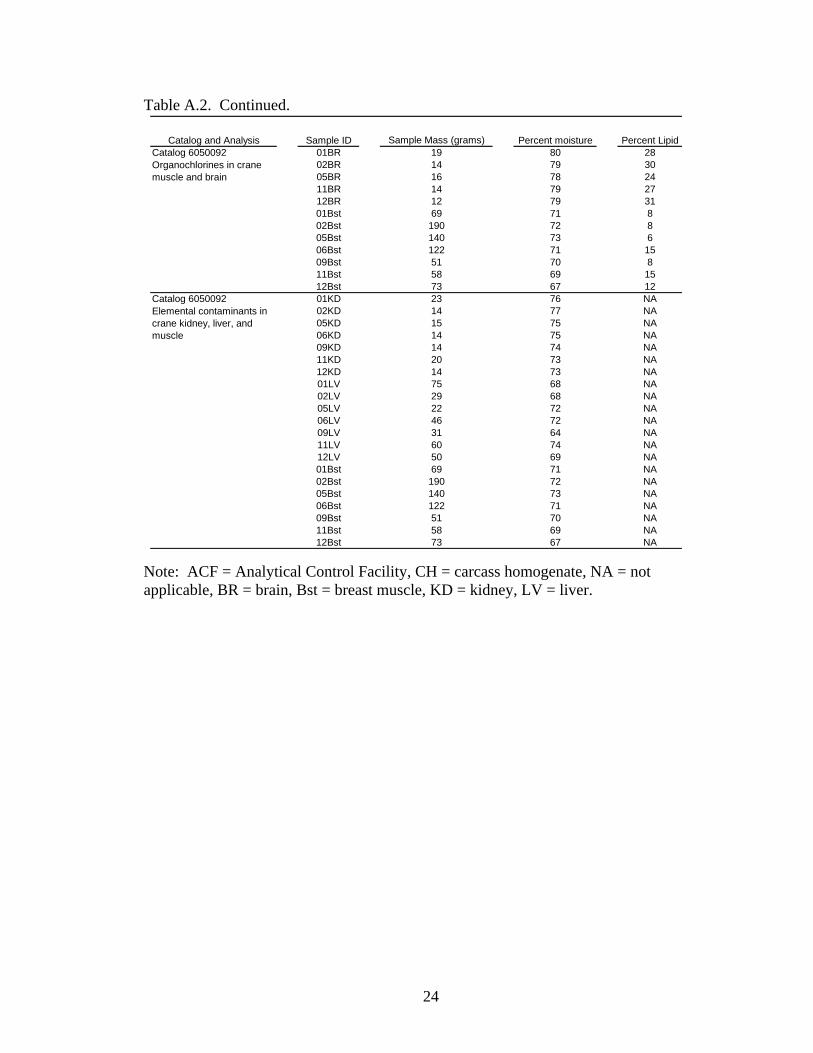
A.2 Mass, percent moisture and percent lipid results for sandhill crane and
cornfield soil samples collected from the central Platte River Valley, Nebraska, 1999 and 2001. 23
A.3 Limits of detection (LOD) and spike recovery data for an analysis of
pesticides in waste corn collected from sandhill foraging areas in the central Platte River Valley, Nebraska, 1999 and 2001. 25
A.4
Limits of detection (LOD) for organochlorines and pesticides in soil samples collected from cornfields in the central Platte River Valley, Nebraska, 1999. 26
A.5 Concentrations of estradiol and testosterone in blood plasma and feces
from sandhill cranes in the central Platte River Valley, Nebraska, 1999. 27 A.6
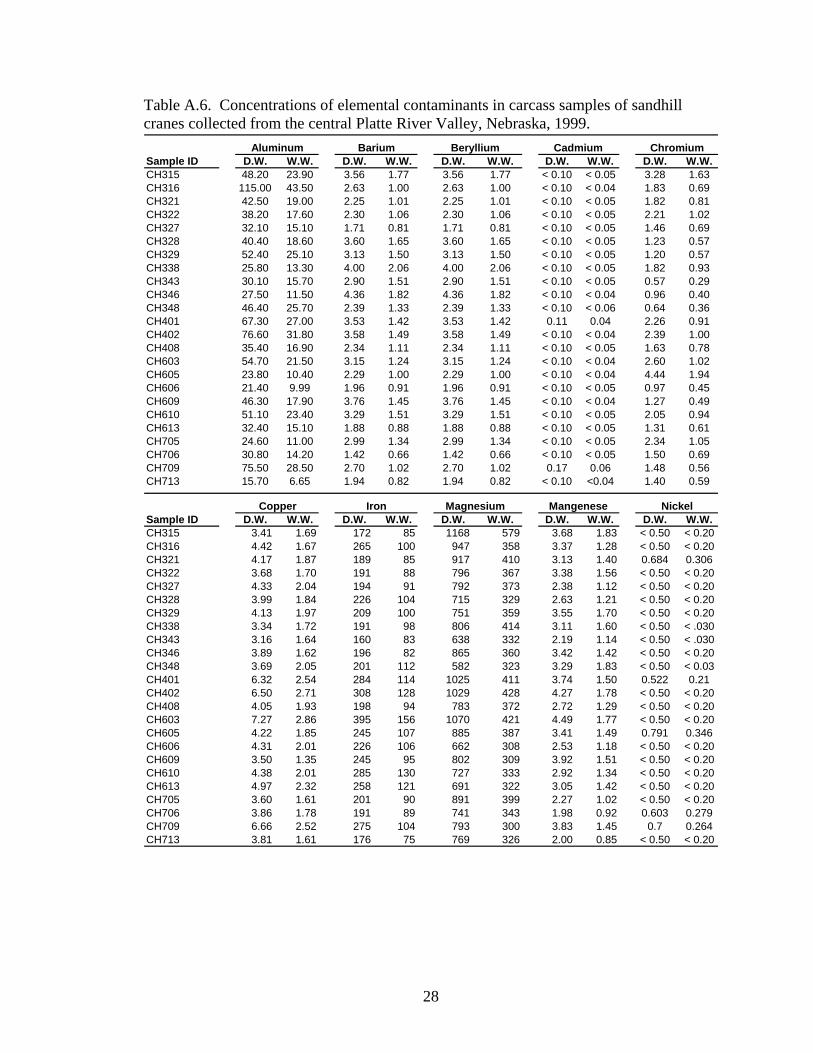
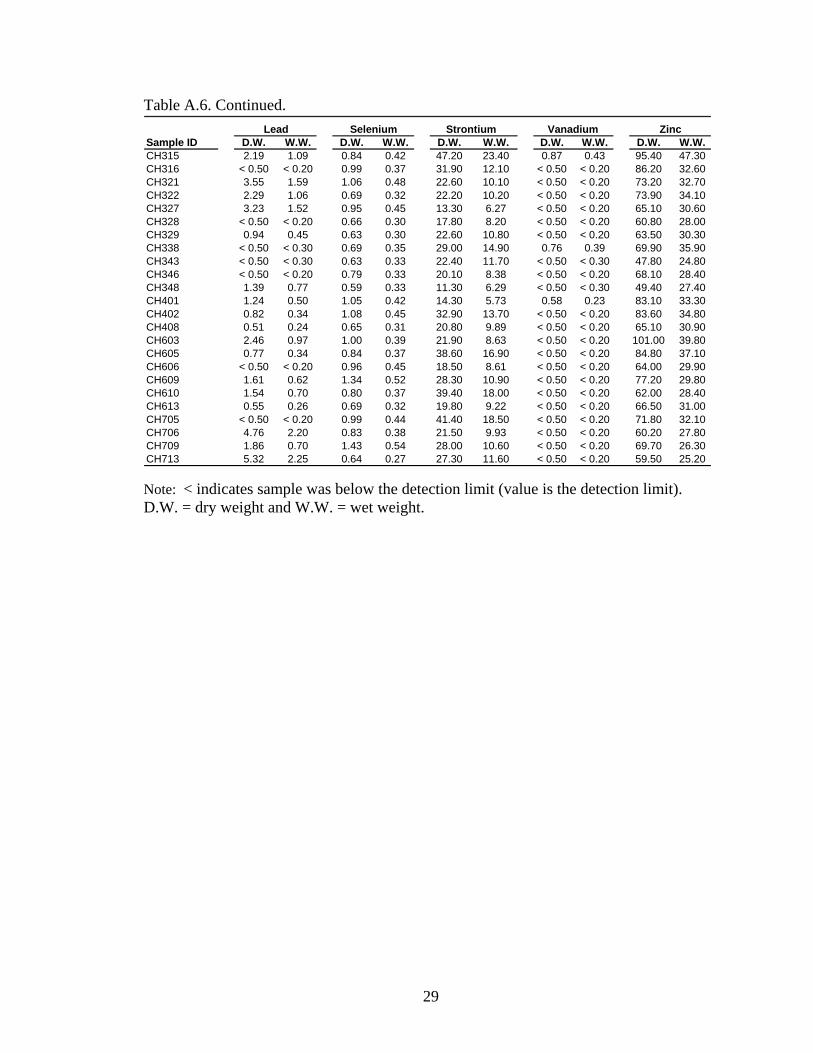
Concentrations of elemental contaminants in carcass samples of sandhill cranes collected from the central Platte River Valley, Nebraska, 1999. 28
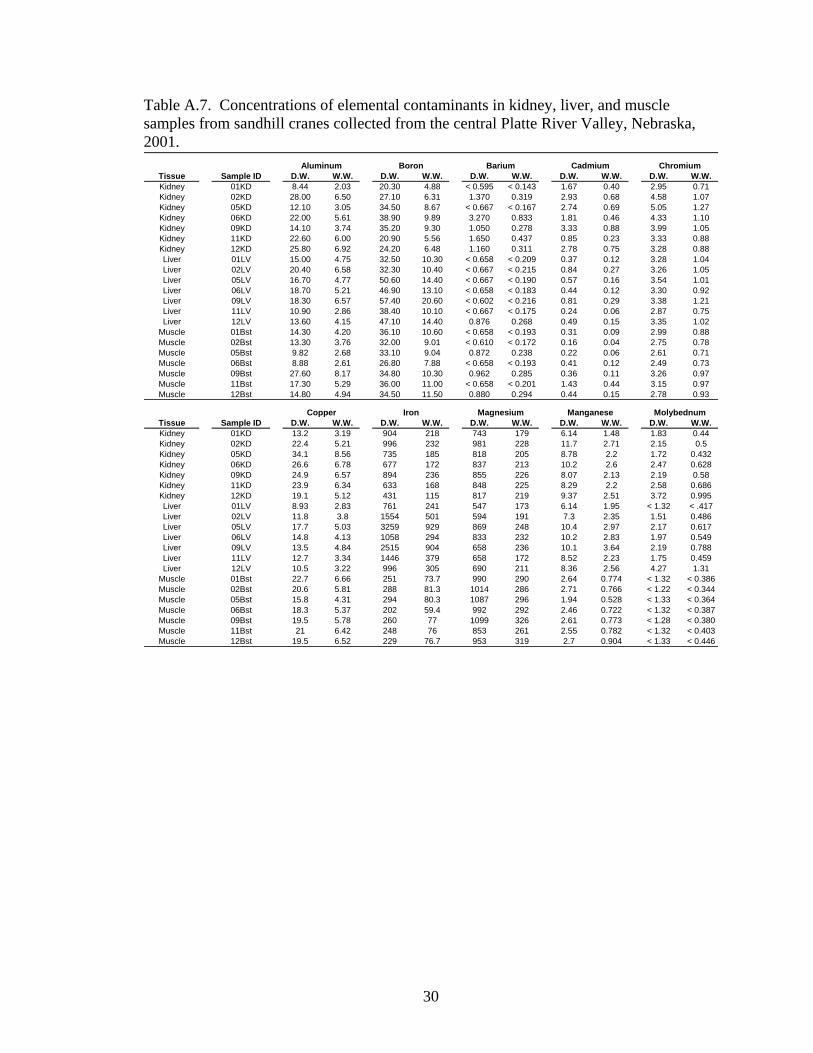
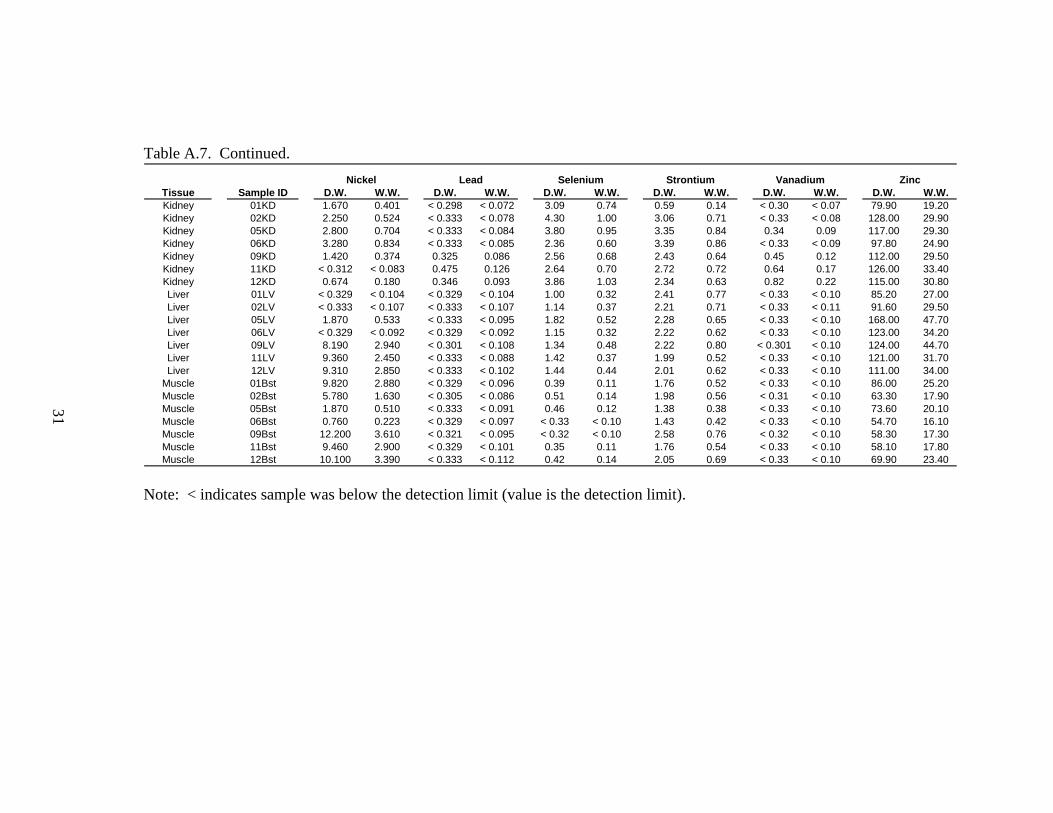
A.7 Concentrations of elemental contaminants in kidney, liver, and muscle
samples from sandhill cranes collected from the central Platte River Valley, Nebraska, 2001. 30
vi
LIST OF FIGURES 1 Location of the study site in the central Platte River Valley of
south-central Nebraska. 4 2 Location of sandhill cranes collected near the central Platte
River in Phelps, Buffalo, Kearney, and Hall counties of South Central, Nebraska. 10
3 Concentrations of estradiol and testosterone in blood plasma
and fecal samples from sandhill cranes collected from the Platte River Valley, Nebraska, 1999. 12
ACRONYMS AND ABBREBIATIONS
< less than n sample sizeµg/g micrograms per gram NAS National Academy of SciencesACF Analytical Control Facility NEFO Nebraska Ecological Services Field OfficeBRD Biological Resources Discipline OC organochlorineCB carbamates OP organophosphatesDDT dichlorodiphenyltrichloroethane p level of significancedw dry weight PACF Patuxent Analytical Control FacilityE estradiol PCBs polychlorinated biphenylse.g. example given pers. comm. personal commentaryE/T estrogen to testosterone ratio pg/ml picograms per milliliteret al. and others QA/QC quality assurance and quality controlFCSC Florida Caribbean Science Center RIA radioimmunoassayfw fresh weight Service U.S. Fish and Wildlife Serviceg gram T testosteroneGC/MS gas chromatography/mass spectrometry USDA U.S. Department of Agriculture mg/kg milligrams per kilogram USFWS U.S. Fish and Wildlife Servicemg/L milligrams per liter USGS U.S. Geological Survey ml milliliter ww wet weight
vii
INTRODUCTION
The central Platte River Valley provides crucial staging habitat for the endangered
whooping crane (Grus americana) and 80 percent of the mid-continent population of
sandhill cranes (Grus canadensis) (Tacha et al., 1984). A 53-mile reach of the Platte
River in this area has been federally designated as critical habitat for the endangered
whooping crane (USFWS, 1978) and a recent evaluation by the National Research
Council indicated that the proportion of the whooping crane population that uses the
central Platte River as a stopover each year has been increasing (NRC, 2004).
Approximately 500,000 sandhill cranes spend six to eight weeks along the central Platte
River from February to early April before continuing to their breeding grounds (U.S. Fish
and Wildlife Service, 1981). During this staging period, sandhill cranes increase their
body mass by 30 - 34 percent (Krapu et al., 1985). Approximately 40 percent of the
accumulated fat reserves are utilized during migration to their breeding grounds and the
remaining reserves sustain them during nesting (U.S. Fish and Wildlife Service, 1981).
Landscape changes in the central Platte River Valley caused by flow depletions of
the Platte River and conversion of native wet meadows for agriculture and other purposes
have resulted in the concentration of cranes along river reaches that still satisfy their
habitat needs (Reinecke and Krapu, 1986). Intensive agriculture surrounds much of the
existing river and wet meadow habitat in the central Platte River Valley. More than 45
percent of the land area around the Platte River from Lexington to Chapman is planted to
corn (Stamer and Huntzinger, 1994). Cranes forage in cornfields, alfalfa fields, and wet
meadows and their diet typically consists of 97 percent corn and 3 percent invertebrates
(Reinecke and Krapu, 1986).
Sandhill cranes foraging in cornfields and alfalfa fields may be exposed to
pesticides by ingestion of food items and grit. In 1999, 98 percent of the corn crop in
Nebraska received herbicide treatment, and 31 percent received insecticides (Nebraska
Agricultural Statistics Service, 1999). In addition to modern pesticides that are designed
to quickly breakdown in the environment, sandhill cranes may be exposed to
1
contaminants that are environmentally persistent such as organochlorines and elemental
contaminants. Mid-continent sandhill cranes have been documented to live over 19 years
in the wild (Tacha et al., 1994), and although their diets consist mainly of items low on
the food chain, their relatively long life could result in significant accumulation of
persistent chemicals.
Only a few studies have investigated contaminant exposure to sandhill cranes.
Most of these studies have focused on lead toxicity to cranes that ingest lead objects
(Wallace et al., 1983; Windingstad et al., 1984; Franson and Hereford, 1994). Mullins et
al. (1979) reported that concentrations of organochlorine pesticides in sandhill cranes
were generally low; however, older paired and breeding cranes had significantly higher
concentrations of mercury and dichlorodiphenyltrichloroethane (DDT). Fannin (1992)
evaluated pesticide, organochlorine, and elemental contaminant exposure to sandhill
cranes in Nebraska during the spring migration of 1989. Exposure to organophosphate
and carbamate pesticides was evaluated by measuring brain acetylcholinesterase
inhibition, and all cranes tested (n = 57) had brain acetylcholinesterase activity within the
expected normal range. Stomach contents of five cranes tested (the five cranes with the
lowest acetylcholinesterase activity) did not have detectable concentrations of pesticides.
Concentrations of oxychlordane, heptachlor epoxide, and p,p’-DDE (a metabolite of
DDT) in sandhill crane carcasses also were low. However, boron and lead were detected
in crane liver at concentrations of concern. The concentration of lead in the liver of one
crane was 55 micrograms per gram (µg/g dw), a concentration indicative of lead toxicity
in avian species (Kendall and Scanlon, 1985). However, this high lead concentration
may have resulted from contamination when the crane was collected by shooting it with a
rifle (Fannin, 1992). The highest concentration of boron (2.42 µg/g dw) was near a 3
µg/g dw threshold for delayed growth and behavioral effects in mallards (Hoffman et al.,
1990).
2
3
Research Objectives
The purpose of this research was to determine organochlorine, elemental
contaminant, and pesticide exposure to sandhill cranes from the central Platte River
Valley (Figure 1) and evaluate their reproductive condition. This was accomplished by
performing the following subordinate objectives:
1) Evaluate the reproductive condition of sandhill cranes captured in Nebraska by
comparing hormone levels in blood and fecal samples to those of a reference population of Florida sandhill cranes housed at the U.S. Geological Survey (USGS) Patuxent Wildlife Research Center in Laurel, Maryland.
2) Evaluate reproductive health of sandhill cranes by histological examination of
gonads for sexual maturation and morphological abnormalities. 3) Measure elemental contaminants, organochlorine pesticides, and polychlorinated
biphenyls (PCBs) in crane carcass, liver, brain, muscle, and/or kidney tissues. 4) Measure pesticide concentrations in waste-corn and soil samples collected from
foraging areas to evaluate potential dietary uptake. 5) Screen gizzard contents for lead shot to determine whether cranes are ingesting
spent lead while foraging.
Figure 1. Location of the study site in the central Platte River Valley of south-central Nebraska.
= study site
4
5
METHODS
Sample Collection
Cranes were collected along the central Platte River by USGS Biological
Resources Discipline (BRD) personnel from the Northern Prairie Wildlife Research
Center as part of their ongoing study on long-term changes in spatial and temporal use of
habitat, nutrient storage, and carrying capacity of sandhill cranes in the Platte Valley,
Nebraska. Cranes were collected either by shotgun at dusk when they were returning to
their roost sites or by accidental mortality from rocket nets used to capture and band
sandhill cranes. Sandhill cranes were identified to subspecies by BRD personnel using
morphometric measurements of the tarsus, wing chord, culmen, and toe.
When time permitted, BRD personnel collected blood samples from recently
killed birds or live birds that were captured, banded, and released. All blood samples
were collected by syringe with a heparinized 20-gauge needle. Blood samples were
stored in 5 milliliter (ml) heparinized vacutainers and kept on wet ice until U.S. Fish and
Wildlife Service (Service) personnel arrived within 8 hours. Blood samples were then
centrifuged at 1,000 revolutions per minute for 10 minutes to obtain a plasma fraction,
which was aspirated by pipette into 2 ml cryo-vials. Fecal samples (approximately 0.5 -
1.0 gram) from recently killed birds also were collected into cryo-vials using a stainless
steel spatula. Blood plasma and fecal samples were stored frozen at the Nebraska
Ecological Services Field Office (NEFO) in Grand Island, Nebraska.
Gonads from shotgun-collected cranes were removed, weighted to the nearest
0.01 gram (g) and stored in 10 percent buffered formalin. The remainder of the carcass
was frozen and shipped to the University of Western Ontario where it was homogenized.
A 100 g sub-sample of crane homogenate (whole crane minus feathers, gonads, and
ingesta) from each crane was shipped frozen to NEFO where the samples were stored
frozen until shipped to the appropriate lab for residue analysis.
6
Cranes accidentally killed by rocket nets were necropsied by Service personnel.
Reproductive tracts were removed and stored in 10 percent buffered formalin. Liver,
muscle, brain, and kidney tissues were measured to the nearest 0.01 gram (g), collected
into certified clean glass containers, and stored frozen for chemical analyses. Gizzards
were collected whole and kept frozen for lead shot examination. Fecal samples
(approximately 0.5 - 1.0 g) were collected opportunistically and frozen until time of
shipment.
In February of 1999, Service biologists collected waste corn and soil from
cornfields where cranes foraged. Twenty cornfields representing 20 different farms were
chosen for sampling. Approximately 500 g of corn was collected uniformly across each
cornfield into a certified clean glass jar. An acid cleaned and acetone rinsed stainless
steel sieve was used to remove soil that may have been collected with the waste corn
sample and then each sample was transferred into a new chemically clean container.
Surface soil (approximately 1,500 g) also was collected uniformly across five of the 20
cornfields into a certified clean glass jar using a stainless steel spoon. Both corn and soil
samples were kept cold and then stored frozen at NEFO until shipped for chemical
analyses.
Hormones and Gonad Histology
Crane blood plasma and fecal samples were shipped frozen by overnight delivery
to the USGS Florida Caribbean Science Center (FCSC) in Gainesville, FL.
Concentrations of the sex steroid hormones estradiol and testosterone were measured in
plasma and fecal samples using radioimmunoassay (RIA) procedures. These
concentrations were compared to a hormone profile established from a reference
population of sandhill cranes kept at the USGS Patuxent Wildlife Research Center in
Laurel, Maryland. The hormone profile for the reference population was established by
the same RIA procedure used in our study and included 55 samples collected
intermittently during a one-year period (Sheryl Leffer, Hood College, pers. comm.,
2000).
7
Crane gonad samples also were shipped to FCSC by overnight delivery. Gonadal
sections were stained with hematoxylin and eosin prior to histological examination.
Stained gonads were then examined with a compound light microscope to identify
reproductive stage and screen for lesions or abnormalities. Gonads from female birds
were classified according to four stages: undeveloped/immature (stage 0), previtellogenic
(stage 1), early vitellogenic (stage 2), and late vitellogenic (stage 3). Male gonadal
tissues also were classified to four stages of maturation: inactive/immature (stage 0),
early spermatogenic (stage 1), mid-spermatogenic (stage 2), and late spermatogenic
(stage 3).
Gizzard Lead Shot Screen
A FALCON MD-10 metal detector (Falcon Prospecting Equipment, Mesa, AZ)
was used to screen gizzard contents for lead shot or other metal objects. Samples spiked
with No. 7 lead shot were screened at the beginning of each day as a quality assurance
and quality control (QA/QC) measure.
Chemical Analyses
Quantification of contaminant residues in cornfield soil, waste corn, and crane
tissues was performed by several different laboratories (Appendix Table A.1). All
samples, except those for the pesticide scan in corn, were submitted to the Patuxent
Analytical Control Facility (PACF), since renamed the Analytical Control Facility (ACF)
(Appendix Table A.2). Detailed descriptions of lab methods including sample
preparation, sample digestion, QA/QC results, and detection limits are provided in the
ACF catalogs, which are available upon request (ACF phone: 304-876-7336). In brief,
the analysis of duplicate samples, spiked samples, and standard reference materials
indicated acceptable levels of precision and accuracy, and limits of detection were within
ACF’s contract requirements (ACF, 2005). Corn samples were submitted directly to the
Technical Services Division of the U.S. Department of Agriculture (USDA), Kansas
City, Missouri. The QA/QC methods for the pesticide scan included 2 reagent blanks, 2
8
spikes at 0.02 µg/g, two spikes at 0.1 µg/g, and 4 randomly selected duplicate samples.
Detection limits for pesticides in corn ranged from 0.02 – 0.1 µg/g and the mean percent
recoveries were generally above 80 percent (Appendix Table A.3). All statistical
calculations were performed with JMP® Version 5 software (JMP, 2002). Where means
are provided, the “±” refers to a standard error unless otherwise noted.
Elemental Contaminants
For elemental analyses, crane carcass, liver, muscle, and kidney samples were
freeze dried, percent moisture was determined, and results were provided as wet weight
nickel, lead, strontium, vanadium, and zinc. Mercury concentrations were determined by
cold vapor atomic absorption, and graphite furnace atomic absorption was used to
measure arsenic, selenium, and small concentrations of lead and cadmium.
Organochlorine Chemical Residues
Crane muscle, brain, and carcass samples were analyzed for 21 organochlorine
(OC) contaminants including hexachlorobenzene, total polychlorinated biphenyls,
lindane (alpha, beta, and gamma), chlordane (alpha and gamma), cis- and trans-
nonachlor, dieldrin, endrin, heptachlor epoxide, mirex, oxychlordane, toxaphene, and
DDT p,p’ and o,p’ isomers and their metabolites (o,p'-DDD, o,p'-DDE, p,p'-DDD, and
p,p'-DDE). Concentrations were measured by gas chromatography/mass spectrometry
(GC/MS). Detection limits for the OC analysis of brain, muscle and carcass samples
were 0.05 milligrams per kilogram (mg/kg) ww for total PCBs and toxaphene, and 0.01
mg/kg ww for all other OCs.
Pesticides in Soil and Corn
Soil samples were sent to the Mississippi State Chemical Laboratory in
Mississippi State, Mississippi, for a herbicide scan that included atrazine, cyanazine,
9
metribuzin, propazine, and simazine. Soil samples were also tested at ACF for OCs and
other pesticides classified as either organophosphates (OP) or carbamates (CB). For the
herbicide scan, samples were desiccated overnight, extracted in a PRQ Accelerated
Solvent Extractor and quantified by a Varian Model 3400 Gas Chromatograph. Gas
chromatography (GC) was used to quantify OP and CB pesticides by following standard
operating procedures (PACF, 1989). Megabore capillary columns were used for the GC
separations and a flame photometric detector and a nitrogen phosphorus detector were
used for determinations of OPs and CBs, respectively. Analytical methods for measuring
OCs in soil included Soxhlet extraction and lipid removal as described by Cromartie et al.
(1975) followed by quantification with a gas-liquid chromatograph equipped with a 63Ni
electron capture detector. Residues in 10 percent of the samples were confirmed by
GC/MS. Detection limits for OCs and pesticides in soil samples were generally 0.01 and
0.05 mg/kg ww, respectively (Appendix Table A.4). Corn samples were analyzed by
GC/MS for 42 pesticides which included OCs, CBs, OPs, and triazines (Appendix Table
A.4).
RESULTS AND DISCUSSION
Sample Collections
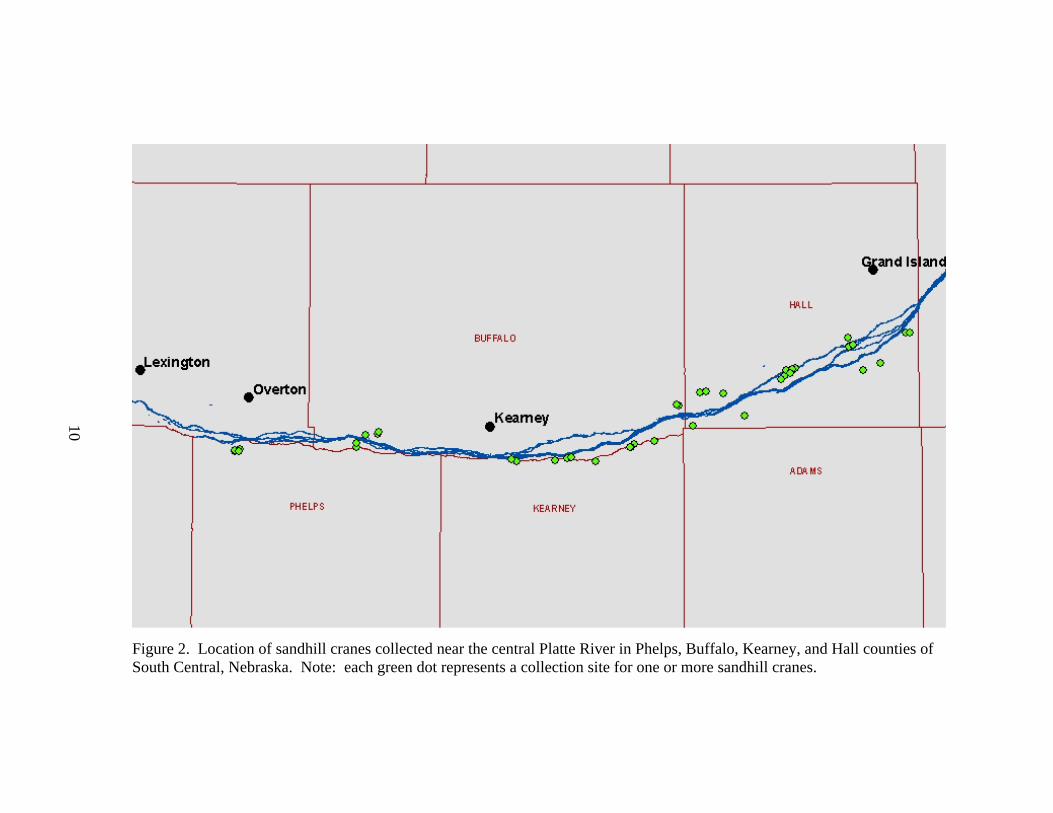
A total of 51 sandhill cranes were collected in 1999 (n = 44) and 2001(n = 7) from
four Nebraska counties in the central Platte River Valley (Figure 2). In addition, 14
sandhill cranes were sub-lethally sampled for blood plasma in 1999. Sampling was
suspended in 2000 due to changes in the contaminants personnel at the Service’s Grand
Island Field Office.
Figure 2. Location of sandhill cranes collected near the central Platte River in Phelps, Buffalo, Kearney, and Hall counties of South Central, Nebraska. Note: each green dot represents a collection site for one or more sandhill cranes.
10
11
Hormones
Concentrations of estradiol (E) and testosterone (T) in sandhill cranes were
measured in 57 blood plasma samples and 20 fecal samples from canadensis, rowani, and
tabida subspecies (Appendix Table 5). Blood E averaged 656 ± 37 and 873 ± 91
picograms per milliliter (pg/ml) in male and female cranes, respectively. Testosterone in
blood averaged 1029 ± 74 and 364 ± 28 pg/ml in male and female cranes, respectively.
Concentrations of E and T in fecal samples averaged 2,188 ± 259 and 1,634 ± 152 pg/ml
in females and 849 ± 133 and 2,165 ± 274 pg/ml in males, respectively. Female cranes
had significantly (p < 0.05) greater concentrations of E in blood and fecal samples than
males (Figure 3). Males had significantly (p < 0.05) greater concentrations of T in blood
than females, but gender differences in fecal T were not significant (Figure 3). There
also was no significant difference in blood T or E between male rowani and canadensis
(data not shown).
The estrogen to testosterone ratio (E/T) in blood plasma and fecal samples from
wildlife has been used as an indicator of physiological responses to environmental
conditions including potential exposure to endocrine disrupting chemicals (Culotta, 1995;
Goodbred et al., 1997; Washburn et al., 2004). Females generally have a higher E/T than
males. In our study, the E/T ratio for females was greater than one in 21/22 blood plasma
samples and 7/8 fecal samples. Males had an E/T of less than one in 28/35 blood plasma
samples and 12/12 fecal samples. Concentrations of estradiol can peak in male sandhill
cranes during the spring (Sheryl Leffer, Hood College, pers. comm., 2000) and may
explain why some of the males had an E/T ratio greater than one. Abnormal estrogen to
testosterone ratios have been linked to potential endocrine disruption in carp from
exposure to pesticides in water (Goodbred et al., 1997) and feminization of male
alligators exposed to p,p'-DDE (Culotta, 1995). However, there are no known studies
that have linked abnormal E/T ratios in avian species to exposure to environmental
contaminants.
12
C
once
ntra
tion
(pg/
ml)
0
200
400
600
800
1000
1200
Fem alesMales
22
35
22
A
B
B
A35Blood
Horm ones
Estradio l Testosterone
Con
cent
ratio
n (p
g/m
l)
0
500
1000
1500
2000
2500
3000
Fem alesM ales
8
12
8
A
B
A
A
12
Feces
Figure 3. Concentrations of estradiol and testosterone in blood plasma and fecal samples from sandhill cranes collected from the Platte River Valley, Nebraska, 1999. The sample size is above each standard error bar and different letters indicate significant differences (p < 0.05) as determined by a Wilcoxon test.
13
Gonad Histology
Gonadal histology for 44 cranes (28 males and 16 females) collected in 1999
indicated that all males were moderately spermatogenic (stage 2) and all females were
between stages 1 and 2 (previtellogenic/early vitellogenic). In 2001, an additional 5
gonad samples (3 females and 2 males) were examined. Both males were stage 1 (early
spermatogenic) with no mature sperm and the females were all stage 2 (early
vitellogenic) with small follicles. No reproductive abnormalities were observed.
Elemental Contaminants
A total of 24 carcass samples and seven samples each of liver, kidney, and muscle
were analyzed for elemental contaminants (Appendix Tables A.6 and A.7).
Concentrations of arsenic, beryllium, mercury, and Mo were below detection limits in all
samples analyzed. All other elemental contaminants examined in this study were
detected in one or more of the tissue samples submitted for analysis.
With the exception of boron, concentrations of elemental contaminants in the
sandhill cranes were generally below levels of concern. Boron concentrations in sandhill
crane livers were much greater than those reported previously by Fannin (1992) (Table
1). Concentrations of boron in livers of sandhill cranes in our study (n = 7) ranged from
32 to 57 mg/kg dw and averaged 44 ± 4 mg/kg dw. In comparison, liver samples (n = 20)
from mallards (Anas platyrhynchos) fed 1,000 mg/kg dw boron in their diet had a mean
concentration of 33 mg/kg dw (Smith and Anders, 1989). Ducks fed this ration of boron
also had a significantly (p < 0.05) lower hatching success of fertile eggs (Smith and
Anders, 1989). Furthermore, dietary concentrations of 300 - 400 mg boron/kg of feed
(Eisler, 1990). Mean concentrations of boron in liver samples from ducks fed 300 - 400
mg boron/kg fw in their diet were 15 mg/kg dw (maximum of 24 mg/kg dw) and 17
mg/kg dw (maximum of 36 mg/kg dw) for adults and ducklings, respectively (Smith and
Anders, 1989). Dietary levels of 100 mg boron/kg fw resulted in reduced growth of
14
Table 1. Detections and mean concentrations of elemental contaminants in liver samples of sandhill cranes from the central Platte River Valley, 2001 compared to 1989 -1990.
Note: Data in columns not shaded is from this study. Data in the shaded columns is from Fannin (1992) and PACF catalog 6050014. ND = number of samples above detection limits, NA = number of samples analyzed, SE = standard error, Max = maximum concentration detected, Min = minimum concentration detected, Max LOD = the highest limit of detection reported. * indicates a geometric mean. Arsenic and Beryllium were not frequently detected in this study (0/7 for each element) or in Fannin, (1992) (1/17 for each element).
15
female mallard ducklings, especially under conditions of low protein (Hoffman et al.,
1990), and ducklings exhibited reduced growth when their parents were fed boron at 30
mg/kg fw (Smith and Anders, 1989). The actual concentrations of boron that are harmful
to cranes are not known and may be different to those in ducks due to philological
differences between the species.
Boron exposure to sandhill cranes likely occurred within the study area, because
boron is rapidly accumulated and eliminated. Adult mallards fed a diet of 1,600 mg
boron/kg accumulated equilibrium levels of boron in liver and blood within 2 – 15 days
and completely eliminated boron from these tissues within one day after removing boron
from their diet (Pendleton et al., 1995). Sources of boron could include municipal
wastewater effluent, irrigation drain water, fertilizers, and emissions from a coal fired
power plant. Laundry detergents originating from household use may contribute as much
as 50 percent of the boron loadings in effluents discharged into aquatic environments
(Eisler, 1990). Approximately 30 percent of boron in coal is released into the atmosphere
by coal-fired power plants (Eisler, 1990). Fly-ash from coal fired power plants can be
used as a soil amendment in agriculture (Petruzzelli, 1989) and may result in an increased
uptake of boron by corn (Kukier et al., 1994). Boron fertilization is not recommended in
corn fields of the central Platte River Valley; however, it is recommended for alfalfa
fields if soil concentrations of boron are less than 0.25 mg/kg (Knudsen and Frank,
1974).
Waterborne concentrations of boron are generally less than 0.1 milligrams per
liter (mg/L) in natural freshwater ecosystems (Adriano, 1986, as cited by USDOI, 1998),
but can be much greater, especially in pumped groundwater (USDOI, 1998). In the
heavily irrigated western San Joaquin Valley of California, concentrations of boron in
surface water ranged from 11- 65 mg/L (USDOI, 1998). Invertebrates from wetlands that
receive irrigation drainage water can accumulate high concentrations of boron (Hothem
and Ohlendorf, 1989; Tuttle et al., 1996).
In Nebraska, concentrations of boron in 19 irrigation water samples collected in
2004 averaged 0.14 mg/L and ranged from 0.59 - 1.5 mg/L (R. Ferguson, Department of
16
Agronomy and Horticulture, University of Nebraska, pers. comm., 2005). Furthermore,
concentrations of boron in 49 soil samples from Nebraska ranged from 0.59 – 1.5 mg/kg
and averaged 0.9 mg/kg (R. Ferguson, Department of Agronomy and Horticulture,
University of Nebraska, pers. comm., 2005). These data indicate that sandhill cranes may
not be exposed to high concentrations of boron in river water or soils from cornfields;
however, site specific data for areas used by the cranes is needed.
No lead shot was found in the 73 gizzards that were analyzed during this study.
Wallace et al. (1983) also reported a low incidence of lead shot in gizzards of sandhill
cranes. However, ingestion of lead objects (e.g., unspent .22 caliber shell cartridges and
fishing sinkers) by wild cranes can cause mortality (Windingstad et al., 1984; Franson
and Hereford, 1994).
Organochlorines and Pesticides
Concentrations of OCs and pesticides were generally below detection limits and
were not detected at levels of concern. A total of 24 carcass samples and 7 samples each
of brain, muscle, and liver tissue were analyzed for OCs. Only endrin, lindane, p,p'-
DDD, and p,p'-DDE were detected (Table 2). A total of 5 soil samples and 24 corn
samples were analyzed for pesticides and all were below detection limits. Since
agricultural pesticides are generally not applied while the cranes are in the area between
February and late March, the lack of residues detected in February indicate that pesticide
residues may not persist over winter in soil and corn and pesticide exposure to cranes is
probably low.
17
Table 2. Concentrations of organic contaminants detected in sandhill cranes collected from the central Platte River Valley, Nebraska, 1999 and 2001.
Note: * indicates that half the detection limit was used to calculate the mean and standard error for samples that were below detection limits. ND/NA = number of detections over the number of samples analyzed, NC = not calculated because more than 50 percent of the samples analyzed were below detection.
Management Recommendations
More research is needed to evaluate boron exposure and effects to sandhill cranes
that use the central Platte River Valley as a staging area during the spring migration. The
results of this study included high concentrations of boron in sandhill crane liver samples;
however, the number of samples analyzed was small (n = 7). Future evaluations should
include a more robust sampling for boron in sandhill crane livers. In addition, sources of
boron exposure to sandhill cranes should be evaluated by measuring concentrations of
boron in waste corn, invertebrate food items, water, and soil/sediments from wet
meadows and/or cornfields.
Conclusions
Sandhill cranes collected from the central Platte River Valley in 1999 and 2001
did not have harmful concentrations of organochlorines contaminants. In addition,
pesticides in corn and soil from cornfields where cranes foraged were all below detection
at the beginning of the staging period in February. Elemental contaminants measured in
crane tissues also were generally low with the exception of boron. Boron concentrations
in sandhill crane liver tissues were higher than previously reported for the area and
18
exceeded toxicity thresholds for mallards. It is unclear why concentrations of boron in
cranes increased within the 10 years between 1989 and 1999. More research is needed to
identify sources of boron to the area and determine whether boron exposure to sandhill
cranes may be adversely affecting their reproductive potential.
REFERENCES Adriano DC. 1986. Trace elements in the terrestrial environment. Springer-Verlag,
New York. 533 pp. Analytical Control Facility (ACF). 2005. U.S. Fish and Wildlife Service Division of
BM, Prouty RM, Swineford DM. 1975. Residues of organochlorine pesticides and polychlorinated biphenyls and autopsy data for Bald Eagles, 1971-72. Pesticide Monitoring Journal 9:11-14.
Culotta E. 1995. New evidence about feminized alligators. Science 267(5196):330-331. Eisler R. 1990. Boron hazards to fish, wildlife, and invertebrates: a synoptic review.
U.S. Fish and Wildlife Service Biological Report 85 (1.20), Contaminant Hazard Reviews Report 20. 32 pp.
Fannin TE. 1992. Contaminant residues in sandhill cranes killed upon striking power
lines in central Nebraska. Proceedings of the North American Crane Workshop 6:166-170.
Franson JC, Hereford SG. 1994. Lead poisoning in a Mississippi sandhill crane. Wilson
Reconnaissance of 17-β-estradiol, 11-ketotestoeterone, vitellogenin, and gonad histopathology in common carp of United States streams: potential for contaminant-induced endocrine disruption. Sacramento, CA. U.S. Geological Survey Open-File Report # 96-627. 47 pp.
Hoffman DJ, Camardese MB, LeCaptain LJ, Pendleton GW. 1990. Effects of boron on
growth and physiology in mallard ducklings. Environmental Toxicology and Chemistry 9:335-346.
Hothem RL, Ohlendorf HM. 1989. Contaminants in foods of aquatic birds at Kesterson
Reservoir, California, 1985. Archives of Environmental Contamination and Toxicology 18(6):773-786.
JMP. 2002. JMP Version 5. SAS Institute Inc., Cary, NC, 1989-2002.
19
Kendall RJ, Scanlon PF. 1985. Histology and ultrastructure of kidney tissue from ringed
turtle doves that ingested lead. Journal of Environmental Pathology Toxicology and Oncology 6:85-96.
Knudsen D, Frank KD. 1974. Understanding your soil test: calcium, magnesium, boron,
copper, chlorine, molybdenum. University of Nebraska-Lincoln Cooperative Extension, Institute of Agriculture and Natural Resources. G74-165-A. http://ianrpubs.unl.edu/soil/g165.htm
Krapu GL, Iverson G, Reinecke KJ, Boise CM. 1985. Fat deposition and usage by
arctic-nesting sandhill cranes during spring. Auk 102:362-368. Kukier U, Sumner ME, Miller WP. 1994. Boron release from fly ash and its uptake by
corn. Journal of Environmental Quality 23(3):596-603. Mittra BN, Karmakar S, Swain DK, Ghosh BC. 2003. Fly ash – a potential source of
soil amendment and a component of integrated plant nutrient supply system. 2003 International Ash Utilization Symposium, Center for Applied Energy Research, University of Kentucky, Paper #28. http://www.flyash.info/2003/28mit.pdf
Mullins WH, Bizeau EG, Benson WW. 1978. Pesticide and heavy metal residues in
greater sandhill cranes. 1978 Crane Workshop. pp 189-195. National Research Council (NRC). 2004. Endangered and Threatened Species of the
Platte River. Committee on Endangered and Threatened Species in the Platte River Basin. The National Academies Press Washington DC. 247 pp.
National Agricultural Statistics Service (NASS). 1999. Nebraska agri-facts: 1999
agricultural chemical usage. http://www.nass.usda.gov/ne/special/agchem00.pdf Patuxent Wildlife Research Center (PACF). 1989. Analytical Chemistry Group,
Standard Operating Procedure (SOP) for the Organophosphate/Carbamate Scanning Method (0-25.00).
Pendleton GW, Whitworth MR, Olsen GH. 1995. Accumulation and loss of arsenic and
boron, alone and in combination, in mallard ducks. Environmental Toxicology and Chemistry 14(8)1357-1364.
Petruzzelli G. 1989. Recycling wastes in agriculture: heavy metal bioavailability.
Tacha TC, Nesbitt SA, Vohs PA. 1994. Sandhill crane. In Tacha TC, Braun CE eds
Migratory Shore and Upland Game Bird Management in North America. Allen Press, Lawrence, Kansas, USA 77-94.
Tuttle PL, Janik CA, Wiemyer SN. 1996. Stillwater National Wildlife Refuge wetlands
contaminant monitoring. Region 1 Study ID:93-1-1CO2A. U.S. Fish and Wildlife Service. 67 pp + Apped.
U.S. Fish and Wildlife Service. 1978. Determination of critical habitat for the whooping
crane. Federal Register 43:20938-20942. U.S. Fish and Wildlife Service. 1981. The Platte River ecology study special research
report. U.S. Fish and Wildlife Service, Jamestown, ND. Northern Prairie Wildlife Research Center. http://www.npwrc.usgs.gov/resource/othrdata/platteco/platteco.htm
U.S. Department of the Interior (USDOI). 1998. Guidelines for interpretation of the
biological effects of selected constituents in biota, water and sediment. National irrigation water quality program information report No. 3. 198 pp. + App. http://www.usbr.gov/niwqp
Wallace BM, Warren RJ, Gaines GD. 1983. Lead shot incidence in sandhill cranes
collected from Alaska, Canada, and Texas. Prairie Naturalist 15(4):155-156. Washburn BE, Tempel DJ, Millspaugh JJ, Gutierrez RJ, Seamans ME. 2004. Factors
related to fecal estrogens and fecal testosterone in California spotted owls. Condor 106(3):567-579.
Windingstad RM, Kerr SM, Locke LN, Hurt JJ. 1984. Lead poisoning of sandhill cranes
Table A.1. Summary of samples collected for analytical residue analysis from sandhill cranes and cornfields in the central Platte River Valley, Nebraska, 1999 and 2001.
Date Sample Type Analysis N Laboratory PACF Catalog ID03/99 Sandhill crane carcass Elemental contaminants 23 GERG 605007103/99 Sandhill crane carcass OCs 23 PACF 605007103/01 Sandhill crane brain OCs 5 PACF 605009203/01 Sandhill crane liver Elemental contaminants 7 PACF 605009203/01 Sandhill crane kidney Elemental contaminants 7 PACF 605009203/01 Sandhill crane muscle OCs 7 PACF 605009203/01 Sandhill crane muscle Elemental contaminants 7 PACF 605009204/99 Cornfield soil OCs, Pesticides 5 PACF 605006104/99 Cornfield soil Herbicides 5 MSCL 605006104/99 Waste corn Pesticides 24 USDA NA GERG = Geochemical and Environmental Research Group, PACF = Patuxent Analytical Control Facility, MSCL = Mississippi State Chemical Lab, USDA = U.S. Department of Agriculture, OCs = organochlorine compounds, NA = not applicable, N = the number of samples analyzed.
22
Table A.2. Mass, percent moisture and percent lipid results for sandhill crane and cornfield soil samples collected from the central Platte River Valley, Nebraska, 1999 and 2001.
ACF Catalog and Analysis Sample ID Sample Mass (grams) Percent moisture Percent LipidCatalog 6050061 AH281 350 18 NAHerbicides in soil GST 366 17 NA
Elemental contaminants in crane kidney, liver, and muscle
Note: ACF = Analytical Control Facility, CH = carcass homogenate, NA = not applicable, BR = brain, Bst = breast muscle, KD = kidney, LV = liver.
24
Table A.3. Limits of detection (LOD) and spike recovery data for an analysis of pesticides in waste corn collected from sandhill foraging areas in the central Platte River Valley, Nebraska, 1999 and 2001.
Note: NR = not reported. * indicates that some recoveries were well over 100 percent indicating an interference in the matrix that was used for the spikes.
25
Table A.4. Limits of detection (LOD) for organochlorines and pesticides in soil samples collected from cornfields in the central Platte River Valley, Nebraska, 1999.
Chemical Class Chemical ClassLOD = 0.01 mg/kg wet weight LOD = 0.05 mg/kg wet weight
Note: lindane includes alpha, beta, and gama isomers, chlordane includes alpha and gama isomers, DDT (dichlorodiphenyltrichloroethane) includes o,p' and p,p' isomers and metabolites DDD and DDE, PCB = polychlorinated biphenyls, EPN = Ethyl 4-nitrophenyl phenylphosphonothioate
26
Table A.5. Concentrations of estradiol and testosterone in blood plasma and feces from sandhill cranes in the central Platte River Valley, Nebraska, 1999.
Crane ID DateSub
Species Gender Estradiol Testosterone E/T Estradiol Testosterone E/T315 990302 canadensis F 674 392 1.7 NC NC NA316 990302 canadensis F 671 409 1.6 NC NC NA321 990310 canadensis F 560 360 1.6 3352 2546 1.3338 990329 canadensis F 854 313 2.7 1365 1294 1.1346 990407 canadensis F 583 361 1.6 1251 1395 0.9348 990409 canadensis F 744 313 2.4 2431 1568 1.6605 990308 rowani F 727 345 2.1 NC NC NA609 990309 canadensis F 1534 429 3.6 2347 1362 1.7613 990316 canadensis F 613 302 2.0 NC NC NA705 990309 canadensis F 815 374 2.2 2426 1914 1.3612 990316 canadensis F 1586 380 4.2 NC NC NA341 990401 canadensis F 1471 292 5.0 NC NC NA347 990409 canadensis F 945 317 3.0 NC NC NA324 990315 rowani F 1583 361 4.4 NC NC NA410 990323 UNK F 1485 301 4.9 2757 1725 1.6323 990312 canadensis F 637 357 1.8 1574 1271 1.222R 990312 UNK F 506 292 1.7 NC NC NA23 990317 UNK F 543 301 1.8 NC NC NA32 990316 UNK F 256 913 0.3 NC NC NA33 990312 UNK F 476 327 1.5 NC NC NA45 990323 UNK F 531 308 1.7 NC NC NA47 990401 UNK F 1406 279 5.0 NC NC NA322 990312 canadensis M 732 1335 0.5 NC NC NA327 990321 rowani M 483 1374 0.4 935 4660 0.2328 990322 rowani M 504 1397 0.4 763 2228 0.3329 990323 rowani M 601 1312 0.5 441 2177 0.2343 990405 canadensis M 482 821 0.6 1661 2361 0.7401 990225 rowani M 714 978 0.7 338 1463 0.2402 990307 canadensis M 605 804 0.8 NC NC NC408 990316 rowani M 494 535 0.9 556 2296 0.2603 990225 tabida M 489 1382 0.4 1258 1660 0.8606 990308 rowani M 603 714 0.8 771 1965 0.4610 990311 canadensis M 605 1431 0.4 210 943 0.2706 990310 rowani M 691 702 1.0 1317 1834 0.7709 990315 canadensis M 619 1319 0.5 1368 1406 1.0713 990319 rowani M 725 1595 0.5 581 2987 0.2318 990304 canadensis M 657 1385 0.5 NC NC NA326 990318 canadensis M 505 1303 0.4 NC NC NA330 990323 canadensis M 471 1340 0.4 NC NC NA614 990318 canadensis M 701 1357 0.5 NC NC NA615 990323 canadensis M 641 1316 0.5 NC NC NA703 990308 canadensis M 697 737 0.9 NC NC NA704 990308 canadensis M 575 543 1.1 NC NC NA313 990301 rowani M 638 1446 0.4 NC NC NA331 990323 rowani M 470 1380 0.3 NC NC NA345 990406 rowani M 613 1282 0.5 NC NC NA407 990315 rowani M 578 1384 0.4 NC NC NA409 990323 rowani M 646 1306 0.5 NC NC NA314 990301 canadensis M 609 1388 0.4 NC NC NA11 990324 UNK M 549 1386 0.4 NC NC NA12 990318 UNK M 926 318 2.9 NC NC NA13 990319 UNK M 578 328 1.8 NC NC NA14 990321 UNK M 1395 329 4.2 NC NC NA
21R 990312 UNK M 654 946 0.7 NC NC NA31 990329 UNK M 874 269 3.2 NC NC NA34 990320 UNK M 412 303 1.4 NC NC NA46 990325 UNK M 1415 273 5.2 NC NC NA
FecesConcentration (pg/ml)Concentration (pg/ml)
Blood Plasma
Note: NC = not collected, NA = not applicable, UNK = unknown, M = male, F = female, Date = date collected in YYMMDD format, E/T = the estradiol to testosterone ratio.
27
Table A.6. Concentrations of elemental contaminants in carcass samples of sandhill cranes collected from the central Platte River Valley, Nebraska, 1999.
Table A.7. Concentrations of elemental contaminants in kidney, liver, and muscle samples from sandhill cranes collected from the central Platte River Valley, Nebraska, 2001.