Contaminant transport through an unsaturatedsoil liner beneath a landfill
S.G. Fityus, D.W. Smith, and J.R. Booker
Abstract: Contaminant transport through soil is often modelled mathematically by means of the dispersion–advectionequation. When investigating contaminant migration beneath a landfill, a common assumption is that the soil issaturated; however, it is well known that the soil beneath many landfills is only partially saturated. In this paper,steady-state unsaturated moisture distributions are employed in the dispersion–advection equation to find transientcontaminant distributions beneath a landfill. A finite layer formulation is used to simplify the contaminant masstransport equation and account for heterogeneous soil profiles. Various assumptions concerning the flow regime beneaththe landfill and the functional relation between volumetric water content and the diffusion coefficient in the transportequation are made to highlight differences between contaminant transport through saturated and unsaturated soils. It isfound that diffusive contaminant mass transfer through a partially saturated soil liner is comparatively insensitive tovariation of the volumetric moisture content at the top of the soil liner alone. However, accounting for the dependenceof the diffusion coefficient on the volumetric moisture content of the soil does have a significant effect on diffusivemass transfer through a partially saturated soil liner. Though it is difficult to measure the dependence of the diffusioncoefficient on the volumetric moisture content of the soil experimentally, this information appears necessary for arational analysis of contaminant transport through partially saturated soils.
Résumé: Le transport de contaminants à travers le sol est souvent modélisé mathématiquement au moyen del’équation de dispersion–advection. Au cours de l’étude de la migration de contaminants sous un enfouissementsanitaire, l’on pose habituellement l’hypothèse que le sol est saturé; cependant, il est bien connu que le sol sousplusieurs enfouissements sanitaires n’est que partiellement saturé. Dans cet article, des distributions non saturées deteneur en eau à l’état permanent sont utilisées dans l’équation de dispersion-advection pour déterminer les distributionstransitoires de contaminants sous l’enfouissement sanitaire. Une formulation de couche finie est utilisée pour simplifierl’équation de transport de masse du contaminant et prendre en compte les profils de sol hétérogènes. L’on fait diverseshypothèses concernant le régime d’écoulement sous l’enfouissement et la relation fonctionnelle entre la teneur en eauvolumétrique et le coefficient de diffusion dans l’équation de transport pour mettre en lumière les différences entre letransport de contaminant à travers les sols saturés et non saturés. L’on trouve que le transfert de masse descontaminants par diffusion à travers une membrane de sol partiellement saturé est comparativement insensible à lavariation de la teneur en eau volumétrique au sommet de la membrane de sol seule. Cependant, le fait de prendre encompte la dépendance du coefficient de diffusion sur la teneur en eau volumétrique du sol a un effet significatif sur letransfert de masse par diffusion à travers une membrane de sol partiellement saturé. Quoique qu’il soit difficile demesurer de façon expérimentale la dépendance du coefficient de diffusion sur la teneur en eau volumétrique du sol,cette information semble être nécessaire pour une analyse rationnelle du transport des contaminants à travers des solspartiellement saturés.
Mots clés: enfouissement sanitaire, transport de contaminants, sol non saturé.
[Traduit par la Rédaction] Fityus et al. 354
Introduction
In order to protect the environment from contamination bypollutants, waste materials are now usually placed in engi-neered landfills. In recent years the design of engineeredlandfills has been regulated by the relevant authorities to en-sure that the appropriate performance criteria are met. To
demonstrate the likelihood of compliance with regulations,environmental engineers now make routine recourse tomathematical models of the proposed landfill. One outstand-ing feature of the modelling approach is the capacity for pre-dictions to be made well into the future, therebydemonstrating the likely impacts of current practice on theenvironment and future generations. The validity of predic-
Received November 17, 1997. Accepted December 8, 1998.
S.G. Fityus and D.W. Smith.Department of Civil, Surveying and Environmental Engineering, The University of Newcastle,Callaghan, Australia 2308.J.R. Booker.1 School of Civil Engineering, The University of Sydney, Sydney, Australia 2006.1Deceased.
tions based on mathematical modelling of contaminanttransport has been investigated and shown to be good fortime periods measured in decades (Quigley and Rowe 1986)and even for time periods of thousands of years (Desaulnierset al. 1981; Quigley et al. 1983; Rowe and Sawicki 1992).
Moisture conditions beneath a landfillThere are many situations where the soil beneath a landfill
is partially saturated. For example, many landfills are con-structed in arid or semiarid environments, where the soil isusually partially saturated to great depths. The partially satu-ratedconditions prevailing beneath landfills will be determinedby a number of factors including the low-permeability cap-ping layers and liners used to contain the waste.
In this paper, consideration is given to the two commonsituations of a natural soil liner and a geocomposite liner,where the geocomposite liner consists of a natural geologicmaterial covered by a synthetic geomembrane. For munici-pal waste landfills, low- or high-density polyethylene(LDPE or HDPE) is often chosen as the geomembrane(Cossu 1994). Most geomembranes have a very lowpermeativity to water, with most moisture transfer throughthe membrane occurring by diffusion rather than by bulkflow (Artieres et al. 1994; Fityus and Smith 1998). The ef-fect of a carefully laid geomembrane is to reduce moistureflow through the soil beneath the landfill to very small val-ues (Giroud and Bonaparte 1989). If the piezometricgroundwater table is located at some distance below thegeomembrane and the air-entry value of the soil is not toohigh, then conditions are created where some depth of soilbeneath the landfill will be in a state of partial saturation.Bonaparte and Gross (1990) investigated 55 landfills andreported that 53 had water tables below the base of thelandfill. For this reason, it is expected that a zone of partialsaturation beneath landfills is a commonplace occurrence.A documented example is the Keele Valley landfill in On-tario, Canada (King et al. 1993).
Based on previous engineering experience of imperviouscovers placed over partially saturated soils (e.g., Lytton1969), it is expected that the moisture conditions in the soilbeneath most of the landfill will ultimately attain a steadystate. An important question arises as to the time period overwhich transient moisture change occurs and its influence oncontaminant transport through the liner. To answer thesequestions comprehensively is beyond the scope of this paper.However, it is clear that very deep and initially very dry finegrained soils may take many decades to reach equilibriummoisture conditions beneath a landfill.
For the example landfill examined in this paper, whichhas an unsaturated zone 5 m indepth and employs parame-ters typical of a fine-grained soil, it can be demonstrated thatthe transient moisture changes occur over a time scale that issmall relative to the time scale for contaminant mass transferfrom the landfill. Therefore, from the viewpoint of an engi-neering contaminant transport design analysis, it is reason-able to assume that steady-state, unsaturated moistureconditions will prevail beneath the landfill, with only a smallerror being introduced by assuming that contaminant trans-port takes place through soil with steady-state moisture con-ditions.
Contaminant transport through unsaturated soilsVan Genuchten (1991) reviewed the extensive literature
on solutions to transport equations for partially saturatedsoils, mainly published by soil and water-resources scien-tists, and found that the dispersion–advection equation is themost popular representation for contaminant transport, andRichards equation is most popular for the representation ofmoisture behavior. Few analytic solutions are known to thedispersion–advection equation in a partially saturated soil,but van Genuchten (1981) presented analytic solutions basedon a spatially and temporally invariant unsaturated moisturecontent. Of course, for most applications of practical interestthe moisture content of the soil varies with position.
In this paper, a semianalytic approach to the solution ofthe dispersion–advection equation, specifically designed forthe analysis of contaminant transport through horizontallylayered soils beneath landfills, will be employed. Thismethod has been developed by Rowe and others over a num-ber of years (e.g., Rowe and Booker 1985a, 1985b, 1990;Rowe et al. 1995), and has proven robust and accurate forboth one- and two-dimensional analysis of miscible contam-inant transport through saturated soils. The solution tech-nique employs a Laplace transformation to remove the timedependence from the governing equation, and a finite layermethod to deal with heterogeneous soil profiles. Solutionsare obtained in the real-time domain by numerical inversionof the transform solution (Talbot 1979).
The extension of contaminant transport analysis from sat-urated soils to unsaturated soils is relatively straightforward(e.g., Freeze and Cherry 1979). A simple but importantchange is the replacement of the soil porosity by the volu-metric moisture content of the soil. In a partially saturatedsoil, this has the obvious effect of reducing the conductivecross-sectional area through which a contaminant may flow,but it is not immediately clear what effect this has on masstransfer through a soil liner beneath a landfill. The quantita-tive effect of partial saturation on mass transfer beneath thelandfill is examined for the illustrative problem analyzed inthis paper.
Contaminant transport analysis for a partially saturatedsoil is also influenced by the dependence of the diffusion,dispersion, and partitioning coefficients on the volumetricmoisture content of the soil. Research relating diffusion co-efficients for saturated soils (see review in Shackleford andDaniel 1991a, 1991b) to those for unsaturated soils was ini-tially undertaken by soil scientists attempting to explain nu-trient transfer to the roots of plants in the unsaturated zone(Klute and Letey 1958; Porter et al. 1960; Romkens andBruce 1964; Warncke and Barber 1972; Barraclough andTinker 1981). More recently, geotechnical engineers have in-vestigated diffusion through unsaturated soils while attempt-ing to explain the mass transfer characteristics ofcontaminants through leachate collection systems withinlandfills (Rowe and Badv 1996a, 1996b). The quantitativeeffect of the dependence of the diffusion coefficient on thevolumetric moisture content of the soil is also examined inthe illustrative problem analyzed in this paper.
It is also generally recognized that the dispersivity of asoil is a function of the volumetric moisture content of thesoil. However, in the case of contaminant transport througha landfill liner functioning as intended by the design engi-
neer, the advection is so small that the dispersivity may betaken as zero (Rowe et al. 1995), and this approximationwill be adopted here.
The partitioning coefficient is a parameter in thedispersion–advection equation representing a geochemicalmodel consisting of a single chemical equilibrium equation.Although it is well recognized that the partitioning coeffi-cient can play a crucial role in controlling the rate of masstransfer through saturated soils and has been extensively in-vestigated (Rowe et al. 1995), there is an unfortunate dearthof information on the effect of partial saturation on the parti-tioning coefficient. To the authors’ knowledge, only two pa-pers have tried to quantify the relationship between partialsaturation and the partitioning coefficient for inorganic ions(Brown 1953; Lim et al. 1994). While this initial researchhas revealed that there is a significant dependence of thepartitioning coefficient on the volumetric moisture contentfor at least some soils, the implications of this for geo-technical design of landfill liners are unclear. Experimentaldata quantifying the dependence of the contaminant parti-tioning coefficient on the volumetric moisture content ofclay soils presents an important challenge for geotechnicalexperimentalists. For the illustrative example examined inthis paper, it is assumed that there is no sorption onto thesoil skeleton, although this may easily be incorporated in theanalysis when appropriate data are available (Fityus andSmith 1997).
Additional considerations when analyzing contaminantmigration through unsaturated soils
When a coarse-grained soil desaturates, the air phase ini-tially forms as occluded air bubbles (Fredlund and Rahardjo1993). As the degree of suction increases, the air phase inboth fine- and coarse-grained soils becomes continuous andmoisture movement by diffusive mass transfer along vaporpartial pressure gradients becomes possible. The vapor diffu-sion coefficient depends on the moisture content of the soil,
increasing as the moisture content decreases. However, ithas been found that under isothermal conditions water vaporflow is small (Fredlund and Rahardjo 1993), so it is ne-glected in the analysis presented here.
Further, it is noted that, given suitable conditions, thereare a number of subtle physical behaviors that can be exhib-ited by clay soils and are relevant to a contaminant transportanalysis through unsaturated soils. One of these is osmoti-cally induced fluid flow in response to contaminant concen-tration gradients. A montmorillonite soil, for example, canact as an imperfect semipermeable membrane. The effective-ness of a soil to act as a semipermeable membrane is mea-sured by its osmotic efficiency parameter, with a value ofone denoting perfect membrane efficiency and a value ofzero denoting no osmotically induced fluid flow (Mitchell1991). Experiments have also shown that the osmotic effi-ciency parameter of a clay is moisture dependent, increasingas the moisture content decreases. Kaolinitic clays, for ex-ample, have zero osmotic efficiency factor when saturatedand for most of the range of partial saturation; however,kaolinitic clay begins to act as a imperfect semipermeablemembrane at a volumetric moisture content of less than ap-proximately 10% (Olsen 1972). In this paper, only soils thatdo not act as a semipermeable membrane are considered(i.e., the osmotic efficiency parameter is taken to be zero atall moisture contents).
Description of the example problem and analysismethod employed in this paper
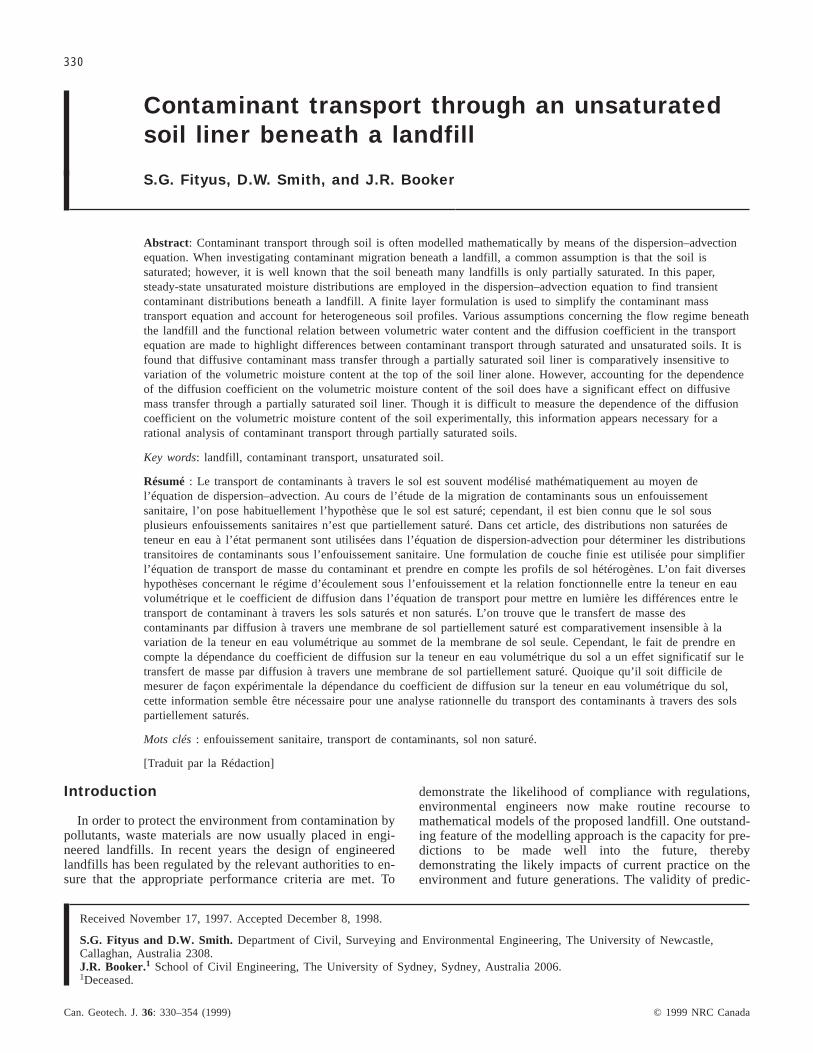
In this paper, consideration is given to the transport of asingle, miscible, nonvolatile contaminant from a landfill,through a natural soil liner or a geocomposite liner understeady-state moisture conditions (Fig. 1). This leads to theconsideration of a linear, second-order, partial differentialtransport equation with nonconstant coefficients in one spa-tial dimension. Perhaps the simplest approximate method forsolving this equation is to divide the soil into many
sublayers and assume that for each sublayer the coefficientsin the transport equation are constant, that is, assume thatthe volumetric moisture content is constant within eachsublayer. In this paper, a more rigorous solution method isadopted. The nonconstant coefficient transport equation issolved directly in the Laplace transform domain using poly-nomials. Although this does not lead to a significant gain incomputational efficiencies over the simpler sublayeringmethod, it does provide a numerically independent methodof solution, allowing greater confidence in the accuracy ofthe computed solutions.
It is expected that the contaminant mass transfer charac-teristics of a liner will be significantly influenced by the par-tial saturation of the soil. Landfill design will be improvedby understanding and quantifying these effects. For the pur-poses of illustration, the performance of a landfill over apartially saturated natural soil is analyzed, and the followingquestions are addressed. (1) Given representative parametervalues, what are the mass transfer characteristics of the land-fill liner, assuming complete saturation of the soil? This so-lution is employed as a reference solution against whichcontaminant transport solutions for unsaturated soils arecompared. (3) How does the moisture dependence of the dif-fusion coefficient influence the contaminant mass transferthrough the soil liner? (4) What effects does partial satura-tion of the soil liner beneath a geomembrane have on con-taminant mass transfer through a geocomposite liner?(5) How is the contaminant mass transfer through the par-tially saturated geocomposite liner affected by variations inthe permeativity of the geomembrane? (6) What influencedoes a small advective flow through a partially saturatedliner have on its mass transfer behavior?
Though it is believed that the trends revealed by the anal-ysis of the illustrative problem presented here are generalones, the answers found to these questions naturally applyonly to the specific example considered and should not beextrapolated to different design conditions. Every landfill de-sign is unique and should be designed on an individual basis.
Moisture in an unsaturated soil liner
In the period following construction, the soil beneath alandfill may either wet up or dry out, depending upon theinitial moisture condition of the soil and the hydraulicboundary conditions. The hydraulic flux through the topof the unsaturated soil liner can be estimated using awater-balance model of the landfill. The water-balancemodel should take into account a multitude of factors suchas climate, material properties and geometry of the caplayer, surface grading, vegetation covering, waste type andinitial moisture content, and waste and liner permeabilities,and the details of landfill operations such as leachate recy-cling and (or) landfill gas removal.
The lower hydraulic boundary condition for the unsatu-rated soil will be fixed by the position of the peizometricgroundwater table and the air-entry value of the soil. Theposition of the groundwater table should in turn be estimatedfrom a regional groundwater model, taking into account theregional hydrogeology and any likely changes in resourceusage. It is noted that climate-change predictions could beincluded in these models.
It is also appreciated that biodegradation of the waste in amunicipal landfill may lead to significant time-dependenttemperature gradients, which in turn may lead to changes inthe moisture profile of the surrounding soil. However, forthe sake of simplicity, the position of the water table is takento be time invariant and the temperature gradient zero in theillustrative example analyzed here. Given the estimated hy-draulic boundary conditions for the unsaturated soil, it isnecessary to estimate the moisture distribution through thepartially saturated soil, and the period required for steady-state moisture conditions to become established.
There are many approaches to modelling moisture flow inunsaturated soils. Pullan (1990) presents a comprehensiveoverview of the substantial body of unsaturated flow theorywhich has been developed up to 1990. Fityus and Smith(1994) employed the so-called “theta–based” form of Rich-ards equation to model unsaturated moisture flow, viz.,
[1] Dz
Dz t
m m( ) ( )ϑ ϑ∂∂
− ∂∂
= ∂∂
2
2
θ α θ θ
wherez is the vertical position,t is time,ϑ is the volumetricmoisture content of the soil,Dm(ϑ) is the moisturediffusivity function, α is a parameter described by Philip(1968) as “a measure of the relative importance of gravityand capillarity for water movement (within the soil),” andθis a new variable of mathematical convenience obtainedfrom the application of a Kirchhoff transformation to thevolumetric moisture contentϑ, viz.,
[2] θ =∗
∫ Dm dϑ
ϑϑ ϑ( )
In eq. [2], ϑ* is a convenient reference value, here takento be dry soil (i.e.,ϑ = 0). Equation [1] may be employed toanalyze the evolution of moisture profiles beneath the land-fill given any initial condition. Steady-state moisture profilesmay be estimated either as long-term solutions of eq. [1] oras a solution of the steady-state governing differential equa-tion. In many cases, a good approximation to real soil be-havior is found by adopting an exponential expression forthe moisture diffusivity (Mualem 1976), viz.,
[3] D Dm moe( )ϑ ϑ= γ
whereDmo is the limiting diffusivity (as the moisture contentapproaches zero), andγ is an empirically fitted exponent.Substituting this approximation for the moisture diffusivityin eq. [2] results in a relationship between the true andKirchoff–transformed moisture contents, viz.,
[4] θγ
γ ϑ( )
( )ϑ = −Dmo e 1
For a single layer, with moisture contentsϑT andϑB at thetop and bottom of the layer, respectively, the general steady-state solution to eq. [1] is
[5] θ θ θ θ θα
α αα( )z
H
HB
Hz= −
−+ −
−
B T Te
e ee
1 1
where H is the thickness of the soil component in ageocomposite liner, and so the volumetric moisture distribu-tion is here estimated to be given by
and the Darcy flux,vz, through the soil layer is given by
[7] v az
H
H= −
−θ θ α
αB Te
e1
For a single layer, eqs. [6] and [7] can be evaluated di-rectly. However, if the soil is horizontally stratified, continu-ity of moisture flux and free energy (i.e., soil suction) applyat the soil layer interfaces. Note that this implies the mois-ture profile may be discontinuous at the interfaces in a strati-fied soil.
Contaminant transport equation
The dispersion–advection equation is adopted as the gov-erning differential equation describing contaminant transportthrough partially saturated soil. The form of the one-dimensional dispersion–advection equation with linear equi-librium controlled sorption is
[8] ( )ϑ ρDc
zDz
Dz
vcz
Kct
∂∂
+ ∂∂
+ ∂∂
−
∂
∂= + ∂
∂
2
2ϑ ϑ ϑ ϑt d d
where c is the concentration of contaminant in the porefluid, vt is the average true linear velocity of the pore fluidin the z direction, D is the effective hydrodynamic disper-sion coefficient,ρd is the dry density of the soil, andKd isthe increment in mass of contaminant sorbed onto the soilskeleton per unit increment of concentration per unit drymass of soil.
Equation [8] may be simplified by the introduction of theLaplace transformation defined by
[9] c s c t tst( ) ( )=∞ −∫0
e d
where c(s) is the transformed concentration function interms of the transform parameters. Assuming the soil is ini-tially contaminant free, eq. [8] is equivalent to
[10] ( )ϑ ϑ ϑ ϑ ϑDc
zDz
Dz
vcz
K sct∂∂
+ ∂∂
+ ∂∂
−
∂
∂= +
2
2ρd d
Of course, eq. [10] has to be solved subject to appropriateLaplace transformed boundary conditions. These conditionsare discussed in detail as the need arises in the exampleproblems.
An advantage of the proposed formulation is that eq. [10]is compatible with the integral transform techniques for sol-ute transport analysis developed by Rowe et al. (1995). Aswill be shown, the solution is obtained in the Laplace trans-form domain using semianalytic methods and numericallyinverted to find the solution in the real-time domain (Talbot1979). For problems with two spatial dimensions, a Fouriertransform may also be employed, thereby retaining the ele-gance of the analysis. Integral transform methods have theadvantages of requiring minimal data preparation and of be-ing computationally efficient, especially for evaluating solu-
tions at large time periods and in two spatial dimensions.These advantages facilitate the rapid assessment of landfilldesign alternatives and so are useful as a design aid.
Finite layer formulation for contaminanttransport analysis
Contaminant transport solution for a single soil layerEquation [10] can be particularized to a given problem by
choosing specific functions describing the spatial variationof ϑ and D. If spatially invariant values for the moisturecontent and diffusion coefficient are employed, then eq. [10]reduces to the familiar dispersion–advection equation for asaturated soil. This is computationally convenient, as con-taminant transport through a saturated zone of soil (e.g., thecapillary zone) is easily accommodated in the analysis.
Equation [6] is a relation describing the moisture contentas a function ofz, but it is of a difficult mathematical formand, if substituted directly in eq. [10], leaves this equationintractable. Although quadratic or higher degree polynomialapproximations to the moisture distribution could be em-ployed to approximate eq. [6], a simple alternative is to“sublayer” the soil, approximating the moisture distributionin each sublayer by a linear moisture distribution. Adoptingthis approach, the moisture distribution to be employed inthe transport equation is
[11] ϑ( )z A Bz= +
whereA andB are empirically fitted constants. Note that thefinite layer approach enables the soil moisture distribution tobe broken into discrete segments, so regardless of the com-plexity of the actual moisture distribution in the soil liner,the simple linear expression of eq. [11] can always give agood approximation to the moisture distribution if smallenough layers are used.
There is comparatively little research by geotechnical en-gineers on contaminant diffusion through soil under unsatu-rated conditions (Lim et al. 1994; Rowe and Badv 1996a,1996b). More research has been conducted by soil scientistsinterested in nutrient movement in unsaturated soils. How-ever, due to the experimental difficulties involved, only ahandful of research papers exist on diffusion through par-tially saturated clay soils.
Based on the experimental data available (for example,see Porter et al. 1960; Rowell et al. 1967; Barraclough andTinker 1981; Conca and Wright 1990), it is clear that the dif-fusion coefficient is significantly reduced as the soil be-comes unsaturated, and this is assumed to reflect decreasingcontinuity and increasing tortuosity as the volumetric mois-ture content of the soil decreases. An examination of experi-mental data shows that a linear relation between theunsaturated diffusion coefficient and the volumetric moisturecontent is a reasonable approximation in many cases. In thenumerical examples presented here, it is assumed that abilinear model is adequate, and so
[12] D( )ϑϑ ϑ ϑ
ϑ ϑ=
+ >≤
Λ Ω 1
10
whereD(ϑ) is the effective diffusion coefficient of the solutethrough the pore fluid, andΛ and Ω are empirically fitted
constants for a particular soil. Note that the constantΛ forsoils may be negative, and so for the bilinear model the dif-fusion coefficient may be zero valued at a nonzero moisturecontent,ϑl. Based on experimental data, this appears to be agood approximation in many cases.
Now when eqs. [11] and [12] are employed in eq. [10],the transformed contaminant flux equation is
[13] f z Jz Lz Gcz
Ec( ) ( )= − + + + =2 0dd
and substituting this into the mass conservation equationleads to the governing transport equation
[14] ( ) ( ) ( )Jz Lz Gc
zJz L E
cz
X Yz c22
22 0+ + + + − − + =d
ddd
whereE, G, J, L, X, and Y are constants comprised of theparametersA, B, Λ, andΩ (andKd if desired). Note that bysetting the coefficientΩ to zero, eq. [14] can be used to ex-amine unsaturated soil with a constant diffusion coefficient,and by settingB to zero implies an unsaturated soil with aspatially uniform moisture content. Of course, whenΩ andBare zero andA is chosen to be the soil porosity, eq. [14] re-duces to the usual transport equation for a saturated homo-geneous soil.
Equation [14] is an ordinary, homogeneous differentialequation with nonconstant coefficients. Solutions to thisequation can be found using a power series, and so we letthe Laplace-transformed contaminant concentration be ap-proximated by
[15] c z a a z a z a z a zkk
jT j( ) ........ = + + + + =0 1 2
2
where
[16] , , , .... , , , ..... a a a a a z z z zjT
kj T k= =0 1 2
21and
It can be shown that coefficients of polynomials of degree2 and higher can be expressed as a linear combination of thecoefficientsa0 and a1, that is,
[17] a a aj j j= +0 1δ ς
where the vectors δj and ς are found using matrix con-densation after substitution of eq. [15] into eq. [14].
Then employing eq. [17] in eq. [15] shows
[18] c z a z a zjT j
jT j( ) = +0 1δ ς
wherea0 anda1 are found from the boundary conditions. Toimprove the accuracy of the power-series approximationover the interval 0≤ z ≤ h, a simple mapping of the interval0 ≤ z ≤ h onto the interval –1≤ z* ≤ 1 may be employed, viz.,
[19] zz hh
∗ = −( )( )
2
and the mapped concentration functionc* then approximatedby a series of Chebyshev polynomials (Tk). The Chebyshevpolynomials areT0 = 1, T1 = z* , and, in general,
[20] T z z T T kk k k+ −= −1 12( )* * ≥ 1
The use of Chebyshev polynomials improves the accuracyof the series approximation by ensuring uniform conver-
gence of the series over the approximation interval (Geraldand Wheatley 1984).
Global matrix for a multilayer soil profileNow let the concentration at the top of thenth horizontal
soil layer in anN-layered soil profile (c nT ) be expressed byeq. [18], and likewise the concentration at the bottom of thelayer (c nB ). Similarly, the contaminant flux at the top (fTn)and bottom (fBn) of the soil layer may be expressed usingeq. [13]. From this set of four equations the constantsa0 anda1 may be eliminated, leading to
[21]f
f
P Q
R S
c
cn
n
n n
n n
n
n
T
B
T
B
=
whereP, Q, andSare the coefficients relating the fluxes andconcentrations at the top and bottom of the soil layer. Fur-ther details can be found in Rowe and Booker (1985a).
Equation [21] represents contaminant transport throughthe nth horizontal soil layer. By taking into account continu-ity of concentration and contaminant flux at each layer inter-face, the description of contaminant transport through asingle layer may be assembled into a global matrix repre-senting contaminant transport through the entire soil profileof N layers. This leads to the following set of simultaneousequations:
[22]
f
f
P
R
N
T
B
1 1
10
0
0
0
0
⋅⋅⋅⋅
=
0
0
0
0
0
0
0
0
0
0
01
1 2
2
2
2 3
3
3
3 4
⋅⋅⋅⋅
+
⋅⋅⋅⋅
+
⋅⋅⋅⋅
+⋅⋅
Q
S P
R
Q
S P
R
Q
S P
⋅⋅
⋅ ⋅ ⋅ ⋅⋅ ⋅ ⋅ ⋅⋅ ⋅ ⋅ ⋅⋅ ⋅ ⋅ ⋅
⋅⋅
0
0
0 0 0 0
0 0 0 0
0 0 0 0
0 0 0 0
0 0 0 0
0 0 0 0
0
0
0
0
⋅⋅
+
⋅⋅⋅⋅
−P S
R
Q
SN N
N
N
N
1
0
0
0
0
⋅⋅⋅⋅
c
c
c
c
c
cn
n
T1
T2
T3
T4
T
B
Equation [22] representsN simultaneous equation inN + 2unknowns. However, introducing appropriate boundary con-ditions into eq. [22] and solving the system of equations re-veals the concentrations at each layer interface. Once this iscomplete, the contaminant flux at each interface may be cal-culated using eq. [13]. The boundary conditions for the ex-ample problem are described in detail in the next section(see eqs. [25] and [27]).
Illustrative example
For the purposes of demonstrating the proposed analysismethod and to illustrate some of the more important effectsof contaminant flow through a partially saturated soil liner, alandfill similar to that described by Rowe et al. (1985a) isanalyzed. It is a waste landfill of considerable lateral extentcontaining a finite mass of contaminant. The geometric de-tails of the landfill are shown in Fig. 1. The principal com-ponents of the landfill from the top down are as follows:(i) a volume of waste that is covered by a capping layer;(ii ) a primary leachate collection system; (iii ) a geocom-posite liner consisting of a geomembrane overlying a naturalsoil layer (the soil layer is hereafter referred to as the soil
liner); (iv) a saturated aquifer immediately below the unsatu-rated soil liner (i.e., the air-entry value of the soil is taken tobe zero for simplicity); and (v) a layer immediately beneaththe aquifer which is impermeable to both water and contami-nant.
Moisture profiles through the unsaturated soil liner areevaluated subject to the saturated condition at the interfacebetween the soil liner and the base aquifer (ϑB = ϑsat, whereϑsat is the moisture content of the saturated soil), togetherwith a specified Darcy flux through the soil liner. Mostgeomembranes adopted in practice will have very low per-meativity to water. For geocomposite liners constructed un-der rigorous quality assurance programmes, research byBonaparte and Gross (1990) has shown that anticipatedadvective velocities across the geomembrane are very small,ranging from close to 0 mm/year to usually less than3 mm/year. When a geomembrane liner is installed in thefield, small undetected holes may be introduced during seaming.The analysis of contaminant transport through these holesrequires an analysis separate from that described here (Rowe1998).
For the example landfill considered here, the followingparameters are adopted:
Contaminant boundary conditionsIt is assumed that the maximum concentration above the
liner in the landfill (clo) occurs shortly after closure of thelandfill and that this concentration will decrease with time ascontaminant moves into the liner–aquifer system. The initialmass of contaminant in the landfill is specified by the pa-rameterHf, known as the equivalent height of leachate, andis equal to the total volume of leachate at initial concentra-tion clo divided by the plan area of the landfill.
For the case of a liner without a geomembrane (it is notedthat a partially saturated soil may be present without ageomembrane installed, providing the moisture flux throughthe base of the landfill is sufficiently small), the concentra-tion at the top of the soil liner,cT1(t), is taken to be equal tothe concentration in the landfill,cl(t). The concentration ofcontaminant in the landfill at some later time is then givenby (Rowe et al. 1995)
[23] c t c t cH
f c zt
l T1 lof
T1 d at( ) ( ) ( , )= = − =∫10
0τ τ
where fT1(c,t) is the contaminant mass flux into the top ofthe soil liner (i.e., atz = 0), andτ is a dummy integrationvariable.
Rowe et al. (1995) report that a geomembrane in a landfillliner system may be modelled directly as a very thin layerusing their semianalytic method. In this paper, an alternateapproach is taken. The boundary condition of eq. [23] can bemodified to include a geomembrane thicknesswg immedi-ately above the soil liner. In this case, the flux in eq. [23] isdefined by the geomembrane properties. Most reported re-search on the diffusive mass transport through geomembranesis predicated upon the assumption that the mass transfer isproportional to the contaminant concentration differenceacross the membrane. Hence,
[24] f c tD
Wc t c tT1
g
gl T1( , ) [ ( ) ( )]= −
whereDg is the mass transfer coefficient for the contaminantthrough the geomembrane. Then, substituting eq. [24] ineq. [23] and taking the Laplace transform leads to
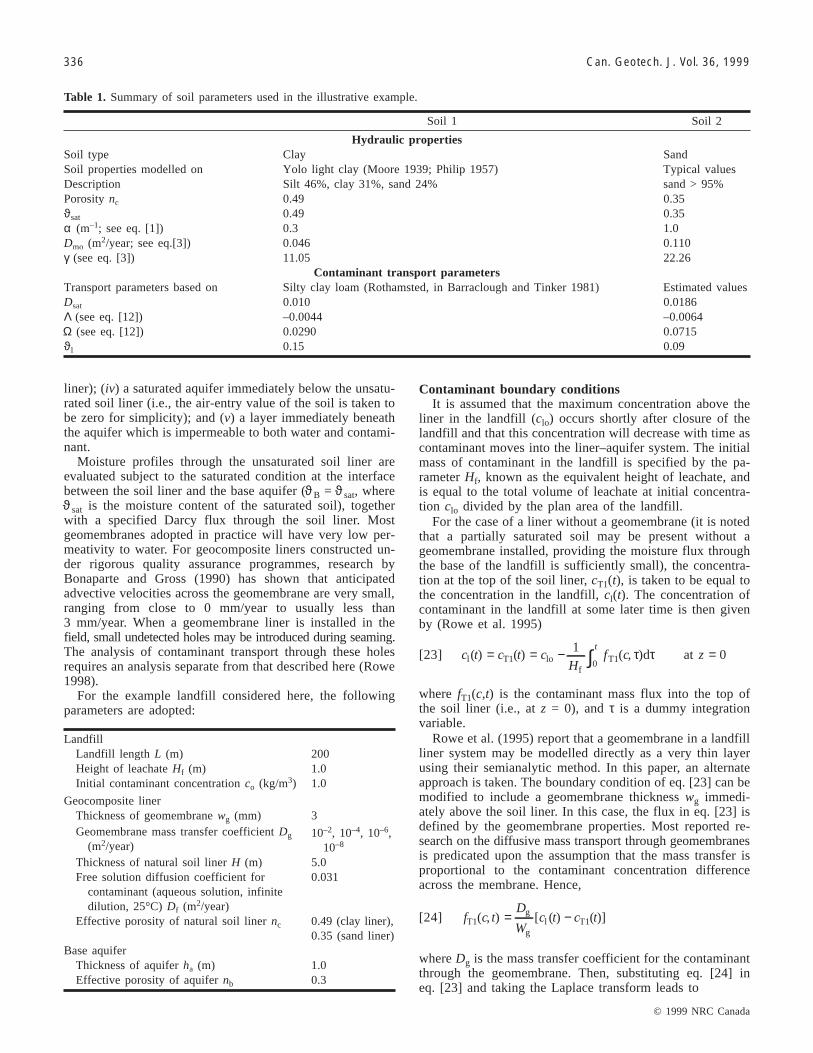
Hydraulic propertiesSoil type Clay SandSoil properties modelled on Yolo light clay (Moore 1939; Philip 1957) Typical valuesDescription Silt 46%, clay 31%, sand 24% sand > 95%Porositync 0.49 0.35ϑsat 0.49 0.35α (m–1; see eq. [1]) 0.3 1.0Dmo (m2/year; see eq.[3]) 0.046 0.110γ (see eq. [3]) 11.05 22.26
Contaminant transport parametersTransport parameters based on Silty clay loam (Rothamsted, in Barraclough and Tinker 1981) Estimated valuesDsat 0.010 0.0186Λ (see eq. [12]) –0.0044 –0.0064Ω (see eq. [12]) 0.0290 0.0715ϑl 0.15 0.09
Table 1. Summary of soil parameters used in the illustrative example.
LandfillLandfill length L (m) 200Height of leachateHf (m) 1.0Initial contaminant concentrationco (kg/m3) 1.0
Geocomposite linerThickness of geomembranewg (mm) 3Geomembrane mass transfer coefficientDg
(m2/year)10–2, 10–4, 10–6,
10–8
Thickness of natural soil linerH (m) 5.0Free solution diffusion coefficient for
Equation [25] may now be substituted directly intoeq. [22].
We next consider the contaminant behavior at the base ofthe soil liner. Though truly a two-dimensional problem, it isassumed that the concentration of contaminant in the baseaquifer does not vary in the vertical or horizontal direction,and that the contaminant transport in this layer takes placeby advection alone. This approximation is considered ade-quate for many practical situations where the base velocityis relatively small (Rowe and Booker 1985a, 1985b). Thenet change in the mass of contaminant in the base aquifer atany time t will be equal to the difference between the con-taminant mass flux entering the aquifer from above and thecontaminant mass flux leaving the aquifer from the side. Itfollows that the aquifer concentrationcBN (t) is given by
[26] c tf c
n hv cn L
z HNt N t N
BB
b
b B
b
d d at( )( , )= − =∫ ∫0 0
τ τ τ
wherefBN (c,t) is the contaminant mass flux into the aquifer
from the soil liner above, andvb is the advection in the baseaquifer. Laplace transforming eq. [26] and rearranging leads to
[27] f sn h cv
sn LN NB b a B
b
b
= +
1
Equation [27] may also be substituted directly into eq. [22].Following substitution of eqs. [25] and [27] into eq. [22],eq. [22] now involvesN simultaneous equations inN un-knowns, and this system of equations may be solved usingstandard numerical methods.
Material parameters for soil linerTwo soil types are considered for the unsaturated soil liner
immediately beneath the geomembrane and above the aqui-fer. Where possible the soil parameters are based on those ofreal soils, however, it is noted that the soil properties in Ta-ble 1 do not represent the estimated behavior of any onesoil, but rather represent a collage of typical values for soilsof each type. To the authors’ knowledge, there is no reportedresearch giving all the parameters for a particular soil re-quired for an analysis of contaminant transport through anunsaturated soil liner beneath a landfill.
Fig. 2. Moisture-equilibration times in a partially saturated clay profile.
Verification
Numerical verification of the validity of the assumptionof steady-state moisture conditions beneath the landfill
The analysis of contaminant transport in this paper isbased upon the assumption that the moisture profile beneaththe landfill is time invariant. However, it is well known thatconstruction of a covered area over a natural soil will resultin transient moisture changes, as infiltration and evapo-transpiration from the top of the soil are prevented (Lytton1969). Therefore, the time required for equilibrium moisture
conditions to be established, compared with the time re-quired for contaminant transport through the soil liner, is ofimportance. It is clear that the coarser the soil, the morequickly equilibrium moisture conditions will be achieved. Itcan be shown by the solution of Richards equation (eq. [1])that in the case of the sand soil with parameters shown inTable 1, equilibrium moisture conditions are achieved in amatter of days.
The time required to reach moisture equilibrium for theclay soil, with parameters shown in Table 1, has been inves-tigated by Fityus and Smith (1997). The results are repro-
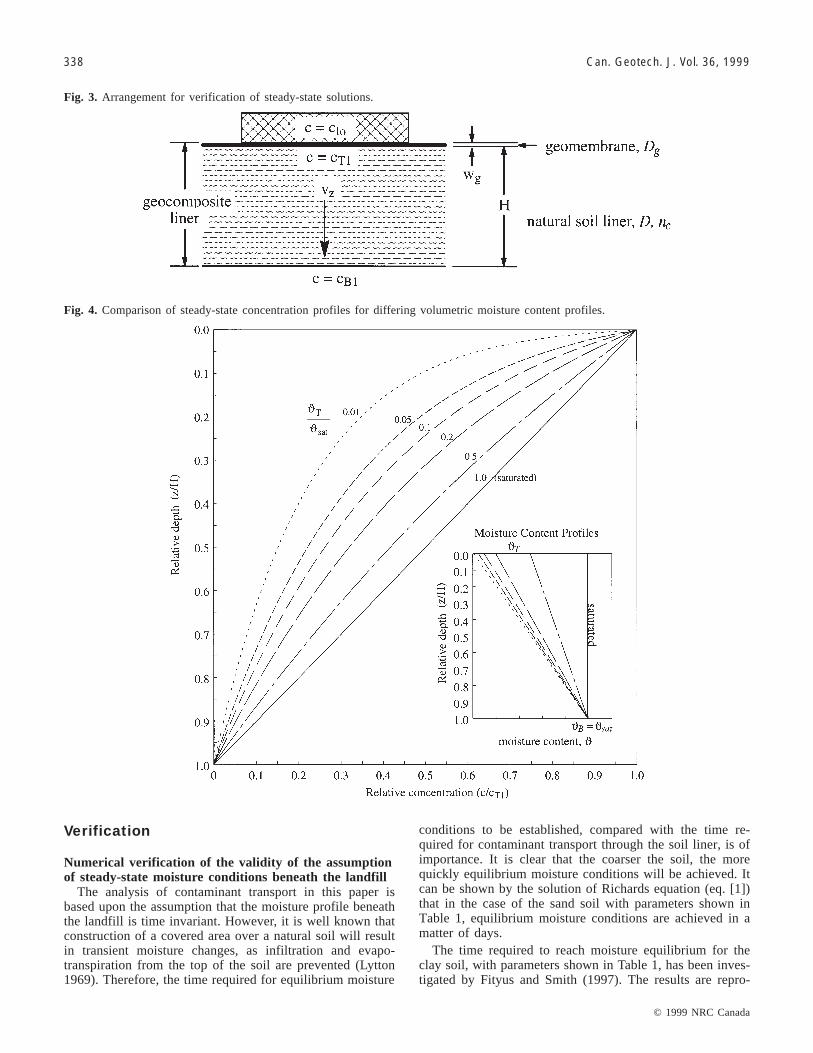
Fig. 3. Arrangement for verification of steady-state solutions.
Fig. 4. Comparison of steady-state concentration profiles for differing volumetric moisture content profiles.
duced in Fig. 2, which shows the time rate of change ofmoisture content at the top of the soil layer and at the mid-height of the soil layer. Both “wetting” and “drying” curvesare shown for the soil liner initially “dry” and initially“wet.” As expected, both curves asymptote smoothly to theequilibrium moisture condition.
It is clear from the curves, that moisture equilibration inthe clay liner is of the order of 8–10 years, and that the ma-jority of the moisture change has occurred within 6–8 years.Given the period of time associated with construction to clo-sure of the landfill (perhaps a decade or more), and the timetaken for say 10% of the contaminant mass to traverse theunsaturated soil liner and enter the base aquifer (found to beat least hundreds of years), it is concluded that the steady-state moisture profile beneath the landfill is a reasonable ap-proximation for the analysis of the landfill considered here.
Verification of contaminant transport analysis throughan unsaturated soil
As mentioned previously, the differential equation govern-ing contaminant transport through saturated soils is a partic-ular case of the more general contaminant transport throughunsaturated soil. By choosing the contaminant transport pa-rameters in eq. [14] to represent a saturated soil, the exam-ple problem considered by Rowe and Booker (1985a,1985b) was reanalyzed, and it was found that the two analy-
ses were in agreement, at least to within plotting accuracy ofthe contaminant profiles and mass transfer curves.
As a means of checking the Chebyshev polynomial seriessolutions to eq. [14] for an unsaturated soil liner, steady-state analytic solutions for contaminant transport through asingle, partially saturated, isotropic, homogeneous soil layerwere found (see Fig. 3). It was assumed that the diffusioncoefficient was constant and that the moisture content variedlinearly across the soil layer of thicknessH, from saturatedat the bottom (ϑsat = ϑB = nc), to partially saturated at the top(ϑT) (see inset to Fig. 4). For this case the governing differ-ential equation for contaminant transport through the par-tially saturated soil is
[28] D A Bzc
zDB v
cz
z( ) ( )+ + − =dd
dd
2
20
which has a general solution
[29] c C C A Bzv DBz= + +1 2( ) /
whereC1 and C2 are constants that may be evaluated fromthe boundary conditions. For simplicity, the concentration atthe top of the soil liner is taken to be a constant (cT1) and theconcentration at the bottom of the soil liner is taken to bezero. It is noted in passing that for the case of zeroadvection, the solution to eq. [28] reduces to
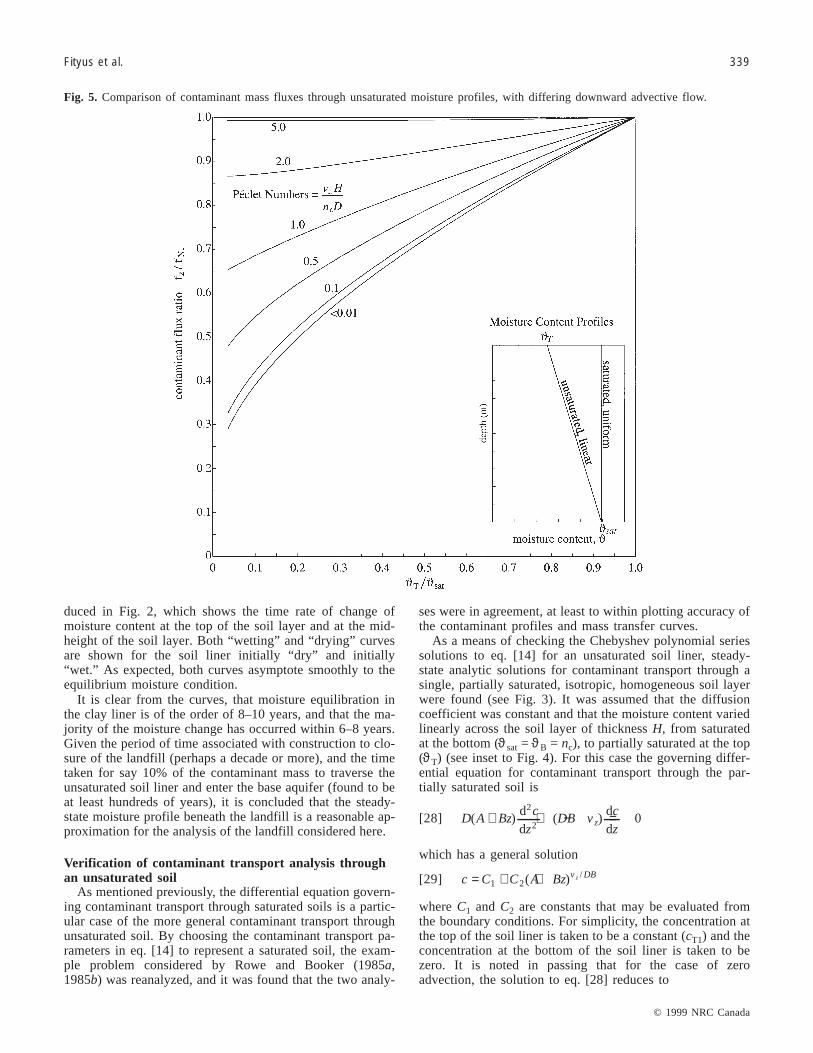
Fig. 5. Comparison of contaminant mass fluxes through unsaturated moisture profiles, with differing downward advective flow.
[30] c C C A Bz= + +1 2 ln( )
A convenient Péclet number for the soil liner may be de-fined as PN =vzH/ncD. Figure 4 shows nondimensionalsteady-state contaminant profiles through the soil liner forPéclet number zero (i.e., zero advection), and Fig. 5 showsnondimensional steady-state contaminant mass fluxesthrough the soil liner for a range of Péclet numbers. InFig. 5 the contaminant fluxes through the soil liner havebeen normalized with respect to the contaminant mass fluxthrough the soil liner when it is saturated, viz.,
[31] fc vz
v H n D
v H n D
z
zN1
T1 e
e
c
c=
−
( / )
( / ) 1
The steady-state analytic solutions for each Péclet numberand the long-term solutions found using the Chebyshevpolynomial series solution were found to be in exact agree-ment, to at least three significant figures.
Analytic solutions for the steady-state contaminant fluxthrough a geocomposite liner with no advection (i.e., a soilliner covered by a geomembrane) were also found. If thecontaminant flux through the geomembrane (eq. [24]) isequated with the flux through the soil liner, then the steady-
state concentration profile through the geocomposite can beshown to be
[32] c zc D A BH
BDw D A BH A( )
ln( )
[ln( ) ln( )]=
++ + −
lo g
g g
++ + −
+c D
BDw D A BH AA Bzlo g
g g[ln( ) ln( )]ln( )
and the steady-state flux through the geocomposite liner is
[33] f zc BDD
BDw D A BH A( )
[ln( ) ln( )]=
+ + −lo g
g g
Figure 6 shows nondimensional steady-state contaminantfluxes through the soil liner for a range of different ratios ofthe membrane transfer coefficient (Dg) to soil liner diffusioncoefficient (D). In Fig. 6 the ratio of the geomembranethickness (wg) to soil liner thickness (H) is chosen to be0.001, and the contaminant flux has been normalized withrespect to the contaminant flux through the geocompositewhen the soil liner is completely saturated, viz.,
Fig. 6. Comparison of contaminant mass fluxes through a partially saturated geocomposite liner for various geomembrane diffusioncoefficients (Dg).
[34] fn c DD
n DW D HN2
c lo g
c g g
=+
Once again, the steady-state analytic solutions and long-term solutions found using the Chebyshev polynomial seriesexpansion were found to be in exact agreement.
Contaminant transport analysis of thelandfill liner
IntroductionIn order to have a meaningful reference point for assess-
ing contaminant transport through a partially saturated
geocomposite liner, transport through a saturated soil liner,with no geomembrane present, was investigated first. Thisanalysis is referred to as case 1. The next two analyses, alsowith no geomembrane present, but now with the soil linerpartially saturated, are referred to as cases 2 and 3. Cases 2and 3 are compared and contrasted to case 1. In this way,some of the practical implications of unsaturated soil condi-tions on contaminant transport through the soil liner may behighlighted. Next, the influence of advection through a soilliner is examined. Finally the mass transfer characteristics ofa geocomposite liner are considered, and this behavior iscompared and contrasted to the mass transfer characteristicsof a partially saturated soil liner. It is noted here that for thesake of brevity, the influence of advection and the
Fig. 7. Contaminant transport solutions for a saturated soil liner with a constant contaminant diffusion coefficient: clay soil.
geomembrane on liner performance is only considered forthe clay soil liner. We proceed to described cases 1–3 inmore detail.
Cases 1–3 examine the response of the soil liner alone(i.e., with no geomembrane present), and with diffusivemass transport being the sole transport mechanism (i.e., withadvective transport zero). Three different states of the soilliner are considered as follows: (1) diffusive mass transportthrough a saturated soil liner with a constant contaminantdiffusion coefficient; (2) diffusive mass transport through anunsaturated soil liner, with a constant contaminant diffusioncoefficient value, being the same as that for case 1, and withthe purpose of case 2 being to allow consideration of the in-fluence of a spatially varying moisture content, without in-
cluding the effects of moisture dependence of the diffusioncoefficient; and (3) diffusive mass transport through an un-saturated soil liner, with the contaminant diffusion coeffi-cient set to vary with the volumetric moisture content.
Case 1: contaminant transport through a saturated soilliner
If the advection in the base aquifer (vb) is zero, then nomass can escape from the liner–aquifer system and eventu-ally a uniform concentration will be established throughoutthe soil liner and base aquifer. This is seen to be true for theclay soil liner in Fig. 7 and the sand soil liner in Fig. 8. Ineach figure, the curve representing the concentration at thetop of the soil liner decreases smoothly over time and joins
Fig. 8. Contaminant transport solutions for a saturated soil with a constant contaminant diffusion coefficient: sand soil.
the smoothly increasing curve representing the concentrationin the base aquifer. For the clay soil, Fig. 7a shows that con-centration equilibrium is established in approximately 3500years, whereas for the sand soil Fig. 8a shows that equilib-rium conditions are established in approximately 2000 years.The difference in equilibrium times may be attributed to thedifference in the diffusion coefficients for the two soil types.
When there is a horizontal advection (vb) through the baseaquifer, contaminant mass is lost from the liner–aquifer sys-tem and the long-term concentrations in the landfill and thebase aquifer must be zero. This expected behavior is con-firmed by examination of Figs. 7a and 8a. It is also con-firmed by Figs. 7b and 8b where the total contaminant mass
flux through the base aquifer, normalized with respect to theinitial mass, is seen to be equal to one after a long period oftime.
As the horizontal advection through the base aquifer in-creases, the peak contaminant concentration in the baseaquifer is reduced. For the clay soil, whenvb = 0.0 m/year,the peak nondimensional concentration in the base aquifer isapproximately 0.2, and this decreases to 0.008 whenvb in-creases to 10.0 m/year.
We here define “breakthrough” of the contaminantthrough the soil liner to mean the time required for 0.01% ofthe initial mass in the landfill to pass through the soil linerinto the base aquifer. It is seen from Fig. 7b that this occurs
Fig. 9. Comparison of contaminant transport solutions for saturated and unsaturated soils with a constant contaminant diffusioncoefficient: clay soil.
for the clay soil after 100 years, whereas for the sand soilFig. 8b shows that breakthrough occurs after 60 years.
In this case, both the sand and clay soils were saturatedunder conditions of zero advection. Practically this could beachieved in a number of different ways, but the simplest isto raise the water table to the top of the soil liner.
Case 2: contaminant transport through an unsaturatedsoil liner with a constant diffusion coefficient
For this analysis, the conditions are the same as those forcase 1 except that the soil liner is now unsaturated, with themoisture profile calculated according to eq. [6]. Moistureprofiles within the unsaturated soil liner are evaluated sub-
ject to a saturated boundary condition at the contact with thebase aquifer (ϑB = ϑsat, i.e., water table at the base of thesoil liner) and zero Darcy flux through the soil liner. Theair-entry value of the soil is taken to be zero for simplicity,although nonzero values may be easily accommodated in theanalysis.
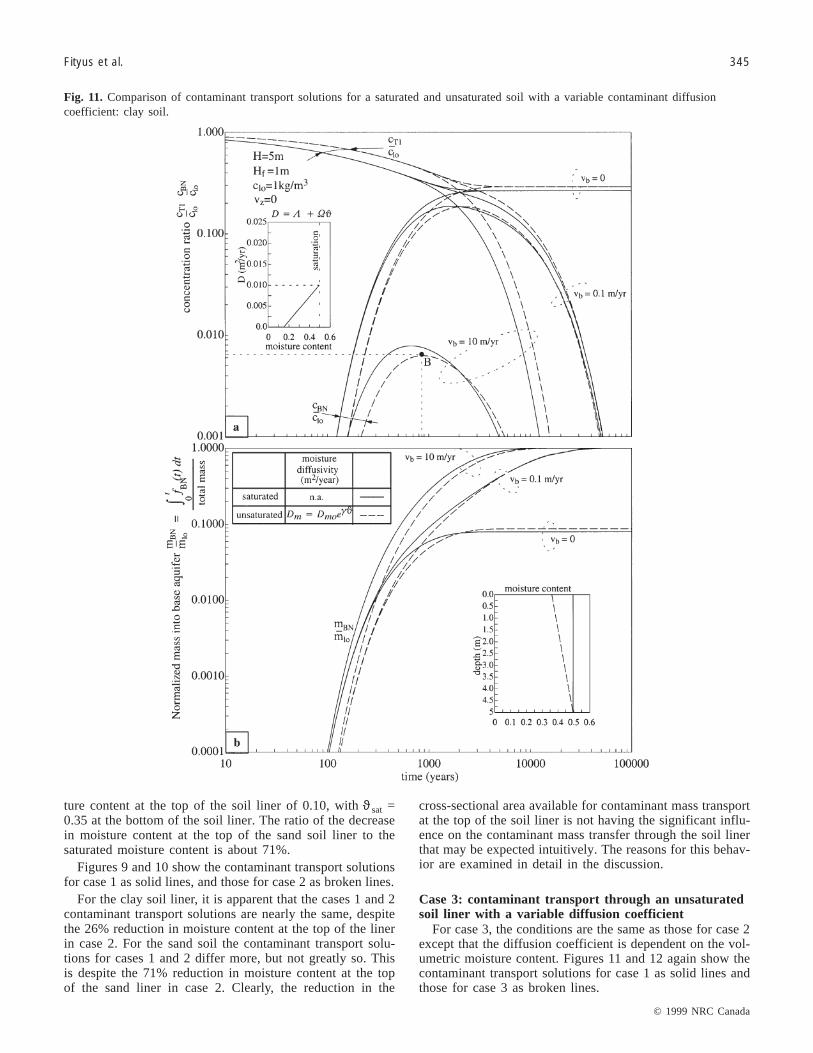
For the clay soil, the decrease in moisture content at thetop of the soil liner is relatively small. The inset to Fig. 9bshows the volumetric moisture content at the top of the soilliner is 0.36, withϑsat = 0.49 at the bottom of the soil liner.The ratio of the decrease in moisture content at the top ofthe clay soil liner to the saturated moisture content is about26%. For the sand soil, the inset to Fig. 10b shows a mois-
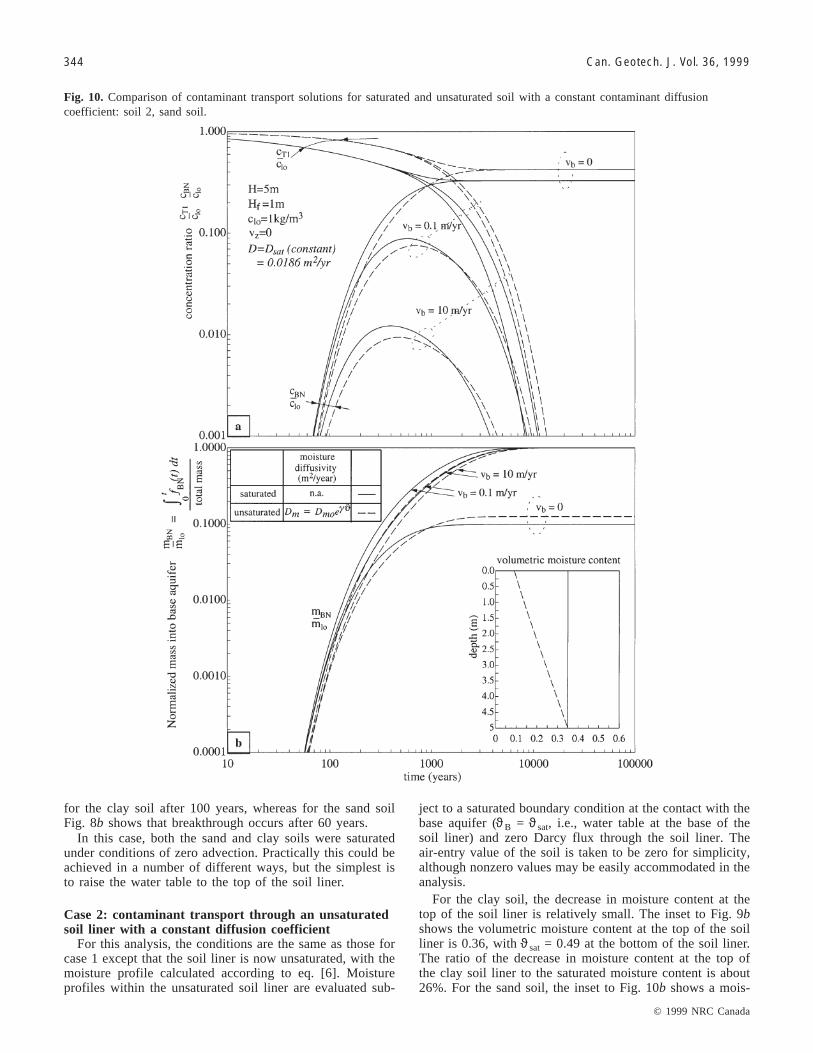
Fig. 10. Comparison of contaminant transport solutions for saturated and unsaturated soil with a constant contaminant diffusioncoefficient: soil 2, sand soil.
ture content at the top of the soil liner of 0.10, withϑsat =0.35 at the bottom of the soil liner. The ratio of the decreasein moisture content at the top of the sand soil liner to thesaturated moisture content is about 71%.
Figures 9 and 10 show the contaminant transport solutionsfor case 1 as solid lines, and those for case 2 as broken lines.
For the clay soil liner, it is apparent that the cases 1 and 2contaminant transport solutions are nearly the same, despitethe 26% reduction in moisture content at the top of the linerin case 2. For the sand soil the contaminant transport solu-tions for cases 1 and 2 differ more, but not greatly so. Thisis despite the 71% reduction in moisture content at the topof the sand liner in case 2. Clearly, the reduction in the
cross-sectional area available for contaminant mass transportat the top of the soil liner is not having the significant influ-ence on the contaminant mass transfer through the soil linerthat may be expected intuitively. The reasons for this behav-ior are examined in detail in the discussion.
Case 3: contaminant transport through an unsaturatedsoil liner with a variable diffusion coefficient
For case 3, the conditions are the same as those for case 2except that the diffusion coefficient is dependent on the vol-umetric moisture content. Figures 11 and 12 again show thecontaminant transport solutions for case 1 as solid lines andthose for case 3 as broken lines.
Fig. 11. Comparison of contaminant transport solutions for a saturated and unsaturated soil with a variable contaminant diffusioncoefficient: clay soil.
Clearly if there is no contaminant mass loss from theliner–aquifer system, the final contaminant concentrationsdepend only on the total volume of pore fluid in the system.This is true because the equations governing the moisturedistribution are independent of equations governing the con-taminant behavior. A comparison of Figs. 9 and 10 (case 2)with Figs. 11 and 12 (case 3) shows that this is reflected inthe calculated contaminant transport solutions. However, ex-amination of Figs. 11 and 12 shows that moisture depend-ence of the diffusion coefficient does have a pronouncedeffect on the rate at which contaminant moves throughoutthe soil liner. For example, the time required for the liner–aquifer system to reach concentration equilibrium is signifi-
cantly increased for case 3 compared with case 2. For theclay soil, equilibrium times are increased from 3500 to 5000years, and for the sand soil from 2000 to 40 000 years.There is also a significant delay in the breakthrough time forboth liners, increasing from 100 to 200 years for the clayliner and from 60 to 250 years for the sand liner.
When there is contaminant mass loss from theliner–aquifer system due to the presence of a horizontalvelocityin the pore fluid of the base aquifer, the predicted time forthe entire contaminant mass to pass through the system is in-creased considerably if the diffusion coefficient is moisturedependent. A comparison of case 1 solutions andcase 3 solu-tions shows that the time for the entire contaminant mass to
Fig. 12. Comparison of contaminant transport solutions for a saturated and unsaturated soil with a variable contaminant diffusioncoefficient: soil 2, sand soil.
pass through the liner–aquifer system increases from a fewthousand years to greater than 10 000 years for both the clayand sand liners.
Influence of advection on mass transfer through thesoil liner
There may be a flux of water through the landfill liner,with the magnitude of the flux depending on many factors.An estimate of the water flux through the liner may be madeon the basis of a water mass balance for the whole landfill,or by measurement. Providing the Darcy velocity is not toolarge, the soil liner will remain partially saturated.
Figure 13 illustrates the influence of advective flow oncontaminant transport through the clay soil liner. Apart fromthe advection, the liner considered here is the same as that
considered in case 3. The contaminant transport solutions forthe unsaturated soil liner, represented by broken lines, areagain compared with the case 1 solutions represented bysolid lines. Note, from the inset to Fig. 13b, that a verticalDarcy velocity through the liner of 0.01 m/year has only aminor influence on the estimated steady-state moisture pro-file when compared with the moisture profile for zeroadvection.
Figure 13a shows the effect that a vertical advection hason the maximum contaminant concentration at the baseof the liner. It is seen that for advections less than0.001 m/year, advection has no influence on the peak con-centration in the base aquifer. As advection increases above0.001 m/year, the peak concentration in the base aquifer in-creases. Of particular relevance is the result that a small
advective flow can substantially increases the contaminantmass flux through the soil liner. For example, an advectiveflow of just 0.01 m/year results in an order of magnitude in-crease in the peak concentration observed in the aquifer.This finding highlights the need for effective control ofadvection. Figure 13b shows that as the advection increasesabove 0.001 m/year, the time at which the peak concentra-tion occurs in the base aquifer decreases. Note that points Aand B in Figs. 7 and 11, respectively, are identified in Fig. 13a.
Influence of a geomembrane on mass transfer throughthe landfill liner
Many modern landfill liners are geocomposite liners, con-sisting of a geomembrane in direct contact with a soil liner.
Excluding transport through holes in the geomembrane(which requires a separate analysis), the movement of waterthrough the geomembrane is controlled by the gradient ofthe Gibb free energy across the geomembrane (Fityus andSmith 1998). Water diffuses across the intact geomembrane,and then causes bulk fluid flow in the soil pore water. Basedon a consideration of factors discussed in Giroud andBonaparte (1989) and Bonaparte and Gross (1990) and re-cent estimates of the mass transfer characteristics of HDPEliner material (Rowe 1998), it is estimated that the averageadvective flow through the soil layer of a geocomposite linerwould be less than 0.001 m/year.
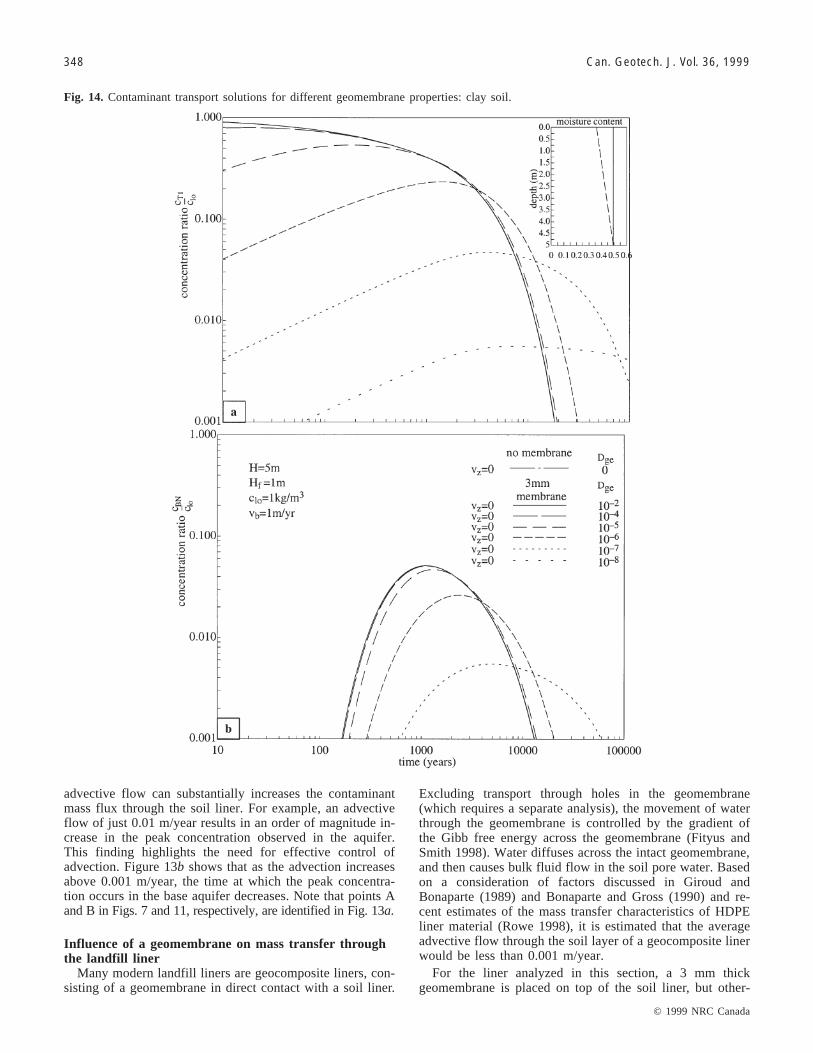
For the liner analyzed in this section, a 3 mm thickgeomembrane is placed on top of the soil liner, but other-
Fig. 14. Contaminant transport solutions for different geomembrane properties: clay soil.
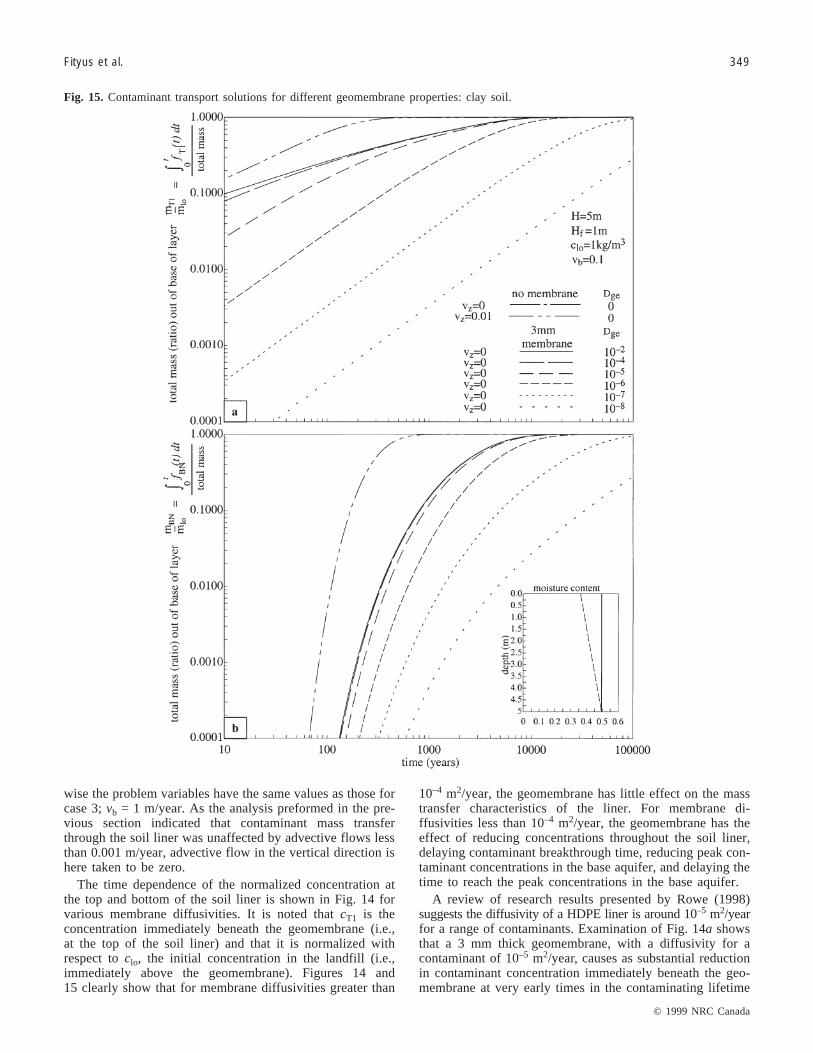
wise the problem variables have the same values as those forcase 3;vb = 1 m/year. As the analysis preformed in the pre-vious section indicated that contaminant mass transferthrough the soil liner was unaffected by advective flows lessthan 0.001 m/year, advective flow in the vertical direction ishere taken to be zero.
The time dependence of the normalized concentration atthe top and bottom of the soil liner is shown in Fig. 14 forvarious membrane diffusivities. It is noted thatcT1 is theconcentration immediately beneath the geomembrane (i.e.,at the top of the soil liner) and that it is normalized withrespect toclo, the initial concentration in the landfill (i.e.,immediately above the geomembrane). Figures 14 and15 clearly show that for membrane diffusivities greater than
10–4 m2/year, the geomembrane has little effect on the masstransfer characteristics of the liner. For membrane di-ffusivities less than 10–4 m2/year, the geomembrane has theeffect of reducing concentrations throughout the soil liner,delaying contaminant breakthrough time, reducing peak con-taminant concentrations in the base aquifer, and delaying thetime to reach the peak concentrations in the base aquifer.
A review of research results presented by Rowe (1998)suggests the diffusivity of a HDPE liner is around 10–5 m2/yearfor a range of contaminants. Examination of Fig. 14a showsthat a 3 mmthick geomembrane, with a diffusivity for acontaminant of 10–5 m2/year, causes as substantial reductionin contaminant concentration immediately beneath the geo-membrane at very early times in the contaminating lifetime
of the landfill (i.e., at the top of the soil liner thenondimensional concentration is 0.3), but only a very smallreduction at later times. Figure 14b also shows that a HDPEgeomembrane 3 mm thick will only have a small influenceon the peak concentration in the base aquifer, these observa-tions suggesting that the primary role of the geomembranein this case is controlling the hydraulic conditions of theliner, rather than preventing contaminant transport. Theseobservations could influence selection of the geomembranethickness and type.
For the example problem with an unsaturated clay linerand a moisture-dependent diffusion coefficient, it is con-cluded that a 3 mmthick HDPE geomembrane will conferlittle benefit on the expected contaminant mass transfercharacteristics of the liner, providing advection is controlled.The role of the geomembrane in controlling contaminanttransport through the liner would be reduced even further ifthe soil liner further desaturates, or if the geomembranewere thinner. This contrasts with the more significant bene-fits conferred for controlling contaminant transport when the
Fig. 16. Comparison of times for the transport of a percentage of contaminant mass through a soil liner: clay soil.
clay liner is saturated.
Discussion of the contaminant transportanalysis for the landfill liner
A comparison of the contaminant transport solutions forcases 1 and 2 has shown only minor differences, and it wasnoted that this may not have been expected intuitively. Toremind the reader, both case 1 and case 2 concerned diffu-sive mass transport, case 1 through a saturated soil and case2 through a partially saturated soil. Case 1 is analogous toone-dimensional heat transport through a bar of constantcross section with depth, whereas case 2 is analogous toone-dimensional heat transport through a bar of increasingcross section with depth. This increasing cross-sectional areawith depth is here referred to as the geometric influence.
To gain a better appreciation of the role played by thegeometric influence on diffusive transport, contaminanttransport solutions are again calculated for a soil liner withthe moisture profile predicted from eq. [6], but this timehaving moisture content boundary conditions at the top andbottom of the liner. This approach enables the influence of awide range of moisture profiles to be examined, and the geo-metric influence made apparent. It is noted that the moisturecontent at the bottom of the soil liner is taken to be the satu-rated moisture content in all cases.
Figure 16 shows three diagrams. On the horizontal axis isa normalized moisture content at the top of the soil liner.When the normalized moisture content equals one, there is auniform moisture content equal to the saturated moisturecontent throughout the soil liner. The vertical axis shows thetime in years for 1% (Fig. 16a), 50% (Fig. 16b), and 99%(Fig. 16c) of the initial mass of contaminant in the landfill topass through the soil liner into the base aquifer.
The solid line in Fig. 16 represents the solution for thesoil condition in case 1, that is, the time required for thespecified percentage of contaminant mass to pass through asaturated soil liner. The line with long dashes represents themass transfer times for various states of partial saturationdetermined for each of the moisture content boundary condi-tions. Comparing the solid line and the line with long dashesdemonstrates the remarkable insensitivity of the time for1%, 50%, and 99% of the contaminant mass to be trans-ferred through the liner with respect to the moisture contentat the top of the liner. A 50% reduction in moisture contentat the top of the liner only increases the time for a specifiedpercentage of contaminant mass transfer to pass through theliner by less than 10% in all three diagrams. To double themass transfer time requires that the moisture content at thetop of the liner be reduced to below 6% of the moisture con-tent at the base.
To help confirm this extraordinary observation, a reexami-nation of the steady-state nondimensional solutions previ-ouslyemployed for transport modelling verification showsthisbehavior is also apparent, though it is not as extreme asthatobserved for transient conditions. For a diffusion-dominatedtransport process (i.e., Péclet number < 0.01), Fig. 4 showsthat if the moisture content at the top of the layer is reducedto 50% of the moisture content at the bottom of the layer,the steady-state contaminant mass flux through the soil is re-
duced by only 30%, not 50% as might be expected intu-itively. To reduce the contaminant mass transfer by 50% re-quires a 80% reduction in the moisture content at the top ofthe soil liner.
This mass transfer behavior for a diffusion-dominated processcan be explained in the following way. As the volumetricmoisture content is reduced, there is a reduction in the cross-sectional area available for mass transfer, thereby reducingthe mass flux in proportion. However, the increase in moisturecontent with depth serves to dilute the contaminant concen-tration as it is transported through the soil liner. This dilu-tion of contaminant with depth serves to increase the spatialconcentration gradient at the top of the soil liner (seen inFig. 3), and so in the case of a diffusion-dominated process,the rate of diffusive mass transfer is increased proportion-ally. These two effects, the reduction in cross-sectional areaand the increased concentration gradient, oppose one an-other. The apparent insensitivity of contaminant mass trans-fer to the reduction in the moisture content at the top of thesoil liner can be explained by the net effect of these two op-posing influences.
On the other hand, the advective mass flux is constant ifthe Darcy velocity through the partially saturated soil liner isconstant. This may be confirmed by examining thenondimensional solutions shown in Fig. 5. For a Péclet num-ber of five, Fig. 5 shows that the contaminant mass fluxthrough the liner is almost independent of the moisture con-tent at the top of the soil layer. It is therefore apparent that alinearly increasing moisture content with depth does influ-ence the rate of diffusive mass flux through an unsaturatedsoil liner, but it has no influence on the advective mass fluxwhen a constant Darcy velocity is assumed.
Figures 11 and 12 indicate that taking the moisture de-pendence of the diffusion coefficient into account does havea very significant influence on the mass transfer characteris-tics of the liner. This is confirmed by reference to Fig. 16,the lines with short dashes indicating that, for each normal-ized moisture content at the top of the liner, the time formass transfer through the liner is greatly increased. It isnoted in passing that at some nonzero moisture content, thetime for a percentage of the contaminant mass to passthrough the liner becomes infinite. This is because the diffu-sion coefficient becomes zero at some nonzero moisturecontent (see eq. [12]).
It is further observed that, although diffusive mass trans-fer through a partially saturated liner is reduced as the mois-ture content is reduced, if the advective velocity through theliner is constant, the Péclet number for the soil liner in-creases, thereby setting a limit on the effectiveness of reduc-tions in diffusive mass transfer as a means of controllingcontaminant flux from the landfill. This indicates that con-trol of the advective component of the contaminant transportshould remain a central objective of liner design.
It is concluded that partial saturation of the soil liner doeshave a significant influence on diffusive contaminant masstransfer through a landfill liner, but the primary reason forthe significant influence in this paper is not due to geometri-cal effects of partial saturation as may be commonly sup-posed, but is due to the moisture dependence of the diffusioncoefficient. Although the geometrical effects of partial satu-
ration lead to a reduction in diffusive mass transfer throughthe soil liner, this investigation suggests that the moisturedependence of the diffusion coefficient is of primary impor-tance.
As the diffusive mass transfer at low moisture content willbe small, this suggests a role for partially saturated soil as adiffusive-transport barrier. Clearly though, a geomembranemay play a valuable role in controlling advection throughthe landfill liner, and therefore advective mass transport ofthe contaminant. It is apparent that each component of ageocomposite complements the other.
The main findings here suggest that an adequate charac-terization of the moisture dependence of the diffusion coeffi-cient is essential for realistic modelling of diffusive masstransport through the unsaturated zone. However, it isclearly apparent that experimental difficulties involved in es-timating the moisture dependence of the diffusion coefficientin clay soils pose a significant challenge for geotechnicalexperimentalists.
Conclusions
An approach for analyzing one-dimensional contaminantmigration from a landfill through a partially saturated land-fill liner has been described in detail. The quasi-linearizedRichards equation was employed to predict the steady-state,unsaturated volumetric moisture distribution throughout asoil liner. It has been shown that for the example landfillwith a 5 m thick soil liner, equilibrium moisture conditionswere established over a time period that is comparativelysmall compared with the time required for contaminant masstransport through the liner. Therefore, employing a steady-statemoisture distribution in the dispersion–advection equation isa reasonable approximation to make. A careful examinationof the contaminant transport solutions for transport throughan unsaturated soil liner suggests the following:
(1) Partial saturation of the soil liner leads to a reductionin cross-sectional area available for contaminant mass trans-port, which has the effect of decreasing the diffusive massflux.
(2) The increase in moisture content with depth results indilution of the contaminant with increasing depth in the soilliner. This has the effect of increasing the concentration gra-dient at the top of the soil liner and proportionally increasingthe rate of diffusive mass transfer though the soil liner.
(3) The geometrical influences on contaminant transportthrough a liner described in (1) and (2) lead to two effectswhich oppose one another, thereby leading to a greatly re-duced sensitivity of diffusive mass transport through a soilliner with respect to the moisture content at the top of thesoil liner.
(4) Accounting for the dependence of the diffusion coeffi-cient on the volumetric moisture content of the soil leads toa greatly reduced diffusive mass transfer through the soilliner. The very low diffusion coefficients for both fine- andcoarse-grained soils at low volumetric moisture contentssuggest a role for unsaturated soils as effective barriers todiffusive mass transport.
(5) Though experimentally difficult, it appears necessaryto measure the moisture dependence of the diffusion coeffi-
cient for a realistic analysis of contaminant transport througha partially saturated soil liner.
(6) The analysis of the example geocomposite liner in thispaper consisting of a geomembrane overlying a partially sat-urated soil liner suggests that, when advective transport isnegligible, the relative beneficial effect of a geomembrane incontaining the contaminant in a landfill is reduced as the de-gree of soil liner saturation decreases. In other words, at lowmoisture contents the primary barrier to diffusive masstransport will be the partially saturated soil. However, it isnoted that the relative importance of advective transportthrough the liner will increase as the rate of diffusive masstransport through the liner decreases.
(7) The advective contaminant mass flux through the soilliner is not influenced by the degree of saturation if theDarcy velocity through the soil is constant.
For a properly functioning landfill liner the advective ve-locity is sufficiently small for diffusive mass transport todominate advective mass transport. Therefore, conclusions(1)–(6) appear relevant for liner design with partially satu-rated soils. However, as noted in conclusion (7), the magni-tude of the advective mass transport will set a lower limit onthe effectiveness of a strategy of controlling diffusive masstransfer alone.
Although it is believed that general trends are revealed bythe analysis of the example problem, every landfill design isunique and should be designed on an individual basis.Finally, it is noted that while it is likely that moisture de-pendence of the partitioning coefficient exerts a very impor-tant influence on contaminant mass transfer through apartially saturated soil liner, a detailed investigation of itssignificance is currently hampered by a dearth of experimen-tal data.
References
Artieres, O., Gousse, F., and Prigent, E. 1994. Laboratory-aging ofgeomembranes in municipal landfill leachates.In Landfilling ofwaste: barriers.Edited byT.H. Christensen, R. Cossu, and R.Stegmann. E. & F.N. Spon Ltd., London, U.K., pp. 393–412.
Barraclough, P.B., and Tinker, P.B. 1981. The determination ofionic diffusion coefficients in field soils. I. Diffusion coeffi-cients in sieved soils in relation to water content and dry den-sity. Journal of Soil Science,32: 225–236.
Bonaparte, R., and Gross, B.A. 1990. Field behavior of double-liner systems.In Waste containment systems: construction, regu-lation and performance. American Society of Civil Engineers,Geotechnical Special Publication 26, pp. 52–83.
Brown, D.A. 1953. The effect of moisture content on the cation ex-change capacity. Soil Science Society of American Proceedings,19: 92–96.
Conca, J.L., and Wright, J. 1990. Diffusion coefficients in gravelunder unsaturated conditions. Water Resources Research,20:1055–1066.
Cossu, R. 1994. Engineering of landfill barrier systems.InLandfilling of waste: barriers.Edited by T.H. Christensen, R.Cossu, and R. Stegmann. E. & F.N. Spon Ltd., London, U.K.,pp. 11–24.
Desaulniers, D.D., Cherry, J.A., and Fritz, P. 1981. Origin, age andmovement of pore water in argillaceous Quaternary deposits atfour sites in southwestern Ontario. Journal of Hydrology,50:231–257.
Fityus, S.G., and Smith, D.W. 1994. Moisture distribution in a par-tially saturated homogeneous soil layer.In Proceedings of the8th International Conference on Computer Methods and Advancesin Geomechanics, Morgantown, Pa., Vol. 2, pp. 1055–1061.
Fityus, S.G., and Smith, D.W. 1997. Contaminant transport analy-sis through unsaturated soil beneath a landfill accounting formoisture dependent transport parameters.In Proceedings of the1st Australia – New Zealand Conference on EnvironmentalGeotechnics, Melbourne, pp. 373–380.
Fityus, S.G., and Smith, D.W. 1998. Modelling of a geomembranein a landfill liner. In Proceedings of the 3rd International Con-gress on Environmental Geotechnics, Lisbon, Portugal, Vol. 2,pp. 807–812.
Fredlund, D.G., and Rahardjo, H. 1993. Soil mechanics for unsatu-rated soils. John Wiley and Sons, Inc., New York.
Freeze, R.H., and Cherry, J.A. 1979. Groundwater. Prentice HallInc., Englewood Cliffs, N.J.
Giroud, J.P., and Bonaparte, R. 1989. Leakage through liners con-structed with geomembranes. Part I. Geomembrane liners. PartII. Composite liners. Geotextiles and Geomembranes,8: 27–68,71–112.
King, K.S., Quigley, R.M., Fernandez, F., Reades, D.W., andBacopoulos, A. 1993. Hydraulic conductivity and diffusionmonitoring of the Keele Valley landfill liner, Maple, Ontario.Canadian Geotechnical Journal,30: 124–134.
Klute, A., and Letey, J. 1958. The dependance of ionic diffusion onthe moisture content of non-absorbing porous media. Soil Sci-ence Society of American Proceedings,22: 213–215.
Lim, P.C., Barbour, S.L., and Fredlund, D.G. 1994. Laboratory de-termination of diffusion and adsorption coefficients of inorganicchemicals for unsaturated soils.In Proceedings of the 1st Inter-national Congress on Environmental Geotechnique, Edmonton,Alta., pp. 319–324.
Lytton, R.L. 1969. The theory of moisture movement in expansiveclays. Research Report 118-1, Project 3-8-68-118, Centre forHighway Research, The University of Texas at Austin, Austin, Tex.
Mitchell, J.K. 1991. Conduction phenomena: from theory to prac-tice. Géotechnique,41(3): 299–340.
Moore, R.E. 1939. Water conduction from shallow water tables.Hilgardia, 12: 383–401.
Mualem, Y. 1976. A catalogue of hydraulic properties of unsatu-rated soils. Report for Research Project 442, Technion, Israel In-stitute of Technology, Haifa, Israel.
Olsen, H.W. 1972. Liquid movement through kaolinite under hy-draulic, electric and osmotic gradients. American AssociationEngineering Geology Bulletin,56: 2022–2028.
Philip, J.R. 1957. The theory of infiltration: 1. The infiltrationequation and its solution. Soil Science,83: 345–357.
Philip, J.R. 1968. Hydrostatics and hydrodynamics in swellingsoils. Water Resources Research,4: 1039–1047.
Porter, L.K., Kemper, W.D., Jackson, R.D., and Stewart, B.A. 1960.Chloride diffusion in soils as influenced by moisture content.Proceedings of the Soil Science Society of America,24: 460–463.
Pullan, A.J. 1990. The quasilinear approximation for unsaturatedporous media flow. Water Resources Research,26: 1219–1234.
Quigley, R.M., and Rowe, R.K. 1986. Leachate migration throughclay below a domestic waste landfill, Sarnia, Ontario, Canada:chemical interpretation and modelling philosophies.In Hazard-ous and industrial solid waste testing and disposal.Edited byD.Lorenzen et al. American Society for Testing and Materials,Special Technical Publication 933, Vol. 6, pp. 93–103.
Quigley, R.M., Gwyn, Q.H.J., White, O.L., Rowe, R.K., Haynes,J.E., and Bohdanowicz, A. 1983. Leda clay from deep boreholesat Hawkesbury, Ontario. Part 1: geology and geotechnique. Ca-nadian Geotechnical Journal,20: 288–298.
Romkens, M.J.M., and Bruce, R.R. 1964. Nitrate diffusivity in re-lation to moisture content of non-absorbing media. Soil Science,98: 332–337.
Rowe, R.K. 1998. Geosynthetics and the minimisation of contami-nant migration through barrier systems beneath solid waste.Keynote Lecture for the 6th International Conference onGeosynthetics, Atlanta, Ga., pp. 27–102.
Rowe, R.K., and Badv, K. 1996a. Chloride migration throughclayey silt underlain by fine sand or silt. Journal of GeotechnicalEngineering, ASCE,122: 60–68.
Rowe, R.K., and Badv, K. 1996b. Advective–diffusive contaminantmigration in unsaturated sand and gravel. Journal ofGeotechnical Engineering, ASCE,122: 965–975.
Rowe, R.K., and Booker, J.R. 1985a. 1-D pollutant migration insoils of finite depth. Journal of Geotechnical Engineering,ASCE, 111: 479–499.
Rowe, R.K., and Booker, J.R. 1985b. 2-D pollutant migration insoils of finite depth. Canadian Geotechnical Journal,22: 429–436.
Rowe, R.K., and Booker, J.R. 1990. Pollute v.5 — 1D migrationthrough a non-homogeneous soil: users manual. Report No.GEOP-1-90.
Rowe, R.K., and Sawicki, D. 1992. Modelling of a natural diffu-sion profile and implications for landfill design.In Proceedingsof the 4th International Symposium on Numerical Methods inGeomechanics, Swansea, U.K.Edited by G.N. Pande and S.Pietruszak. Balkema, Rotterdam, pp. 481–489.
Rowe, R.K., Quigley, R.M., and Booker, J.R. 1995. Clayey barriersystems for waste disposal facilities. E. & F.N. Spon Ltd.(Chapman Hall), London, U.K.
Rowell, D.L., Martin, M.W., and Nye, P.H. 1967. The measure-ment and mechanism of ion diffusion in soils; III. The effect ofmoisture content and soil solution concentration on the self dif-fusion of ions in soils. Journal of Soil Science,18: 204–222.
Shackelford, C.D., and Daniel, D.E. 1991a. Diffusion in a satu-rated soil. I: Background. Journal of Geotechnical Engineering,ASCE, 117: 467–484.
Shackelford, C.D., and Daniel, D.E. 1991b. Diffusion in a satu-rated soil. II: Results for compacted clay. Journal ofGeotechnical Engineering, ASCE,117: 485–505.
Talbot, A. 1979. The accurate numerical inversion of Laplacetransforms. Journal of the Institute of Mathematical Applica-tions, 23: 97–120.
van Genuchten, M.Th. 1981. Analytic solutions for chemical trans-port with simultaneous adsorption, zero-order production andfirst order decay. Journal of Hydrology,49: 213–233.
van Genuchten, M.Th. 1991. Recent progress in modelling waterflow and chemical transport in the unsaturated zone.In Proceed-ings of the 20th General Assembly of the International Union ofGeodesy and Geophysics, Vienna, Austria. IAHS, Institute ofHydrology, Wallingford, U.K., pp. 169–183.
Warncke, D.D., and Barber, S.A. 1972. Diffusion of zinc in soil. I:The influence of soil moisture. Soil Science Society of Ameri-can Proceedings,36: 39–42.
List of symbols
a0, a1,..., ak: power series coefficientsA, B: empirically fitted constants in the expression to de-
c* : mapped concentration functionc: concentration of contaminant in the pore fluidco: initial contaminant concentrationc(s): transformed concentration function in terms of the
transform parametersclo: initial contaminant concentration at the top of the liner
(i.e., within the landfill)cl(t): contaminant concentration at the top of the liner (i.e.,
within the landfill)cT1(t): contaminant concentration at the top of the soil linercTn, cBn: concentrations at the top and bottom, respectively,
of the nth soil sublayercBN(t): contaminant concentration in the aquifercBN,max: maximum contaminant concentration in the aquiferD: effective hydrodynamic coefficient of the solute, usually
assumed to be the sum of two components, namely, thediffusive component arising from the macroscopic de-scription of mass transfer due to thermal agitation ofthe contaminant and the dispersive component arisingfrom pore fluid velocity fluctuations about a meanvalue; D is also referred to as the molecular diffusioncoefficient in the text
D(ϑ): function denoting the moisture dependence of the dif-fusion coefficient
Df: free solution diffusion coefficientDg: membrane mass transfer coefficientDge: diffusion coefficient of the contaminant in the
geomembraneDm: moisture diffusivity in the unsaturated soil linerDmo: limiting moisture diffusivity as the moisture content
approaches zeroDsat: D for a saturated soilE, G, J, L, X, Y: constants in the contaminant transport equa-
tion for an unsaturated soil; they are simple functions ofthe parametersA, B, Λ, Ω (and Kd if desired)
fN1, fN2: normalizing contaminant fluxesfBN(c,τ): contaminant flux into the aquifer from the soil liner
abovefTn, fBn: contaminant fluxes at the top and bottom, respec-
tively, of the nth soil sublayerfz: contaminant mass fluxh: thickness of a sublayer in the soil component of a
geocomposite liner, so that 0≤ z ≤ hha: thickness of base aquiferH: thickness of the soil component in a geocomposite liner
Hf: equivalent height of leachate; it is equal to the total vol-ume of leachate at concentrationclo divided by the planarea of the landfill
Kd: contaminant partitioning coefficientL: landfill lengthmBN(t): total mass of contaminant which has entered the
aquifer from the base of the soil linermlo: initial mass of contaminant in the landfillnb: effective porosity of the aquifernc: effective porosity of the soil linerN: total number of a soil sublayers in a multilayered soil
liner profilePN: Péclet number for the soil liner (=vzH/ncD)r: rate of contaminant mass sink per unit volume of soils: Laplace transform parametert: time variabletmax: time at which the maximum contaminant concentration
occurs at the base of the linerT0, T1,..., Tn: Chebyshev polynomialsvb: advection in the base aquifervt: average true linear velocity of the pore fluid in thez di-
rection (positive downward)vz: Darcy moisture flow in the vertical direction (positive
downward)wg: thickness of the geomembrane in the geocomposite linerz* : transformed vertical coordinatez: vertical coordinate (positive downward)α: soil parameter used in the estimation of the unsaturated
permeabilityγ: empirically fitted exponentδj: vector of coefficientsθ: Kirchoff-transformed moisture contentΛ, Ω: empirically fitted constantsρd: dry density of the soilτ: tortuosity parameterϑ: volumetric moisture content of the soilϑ* : reference value ofϑϑl: moisture content at which the diffusion coefficient is zero
valuedϑT, ϑB: moisture contents at the top and bottom, respec-
tively, of the soil linerϑsat: volumetric moisture content of the saturated soil; this is
equal to the soil porosityςj: vector of coefficientsNote: Overbars denote a Laplace-transformed quantity