25


Contents Page
Group financial highlights 1
Management commentary 2–5
Unaudited condensed consolidated income statement 6
Unaudited condensed consolidated statement of comprehensive income 7
Unaudited condensed consolidated balance sheet 8
Unaudited condensed consolidated statement of changes in equity 9
Unaudited condensed consolidated statement of cash flows 10
Notes to the condensed consolidated interim financial information 11–23
This document in both English and Chinese is now available in printed form and on the website of the Company at http://www.nanyangholdingslimited.com.

NANYANG HOLDINGS LIMITED1
GROUP FINANCIAL HIGHLIGHTS
Unaudited
Six months ended 30 June
2016 2015 Variance
HK$’000 HK$’000
Revenue and income 91,854 105,539 (13%)
Profit attributable to equity holders
of the Company 63,600 118,292 (46%)
Profit attributable to equity holders
of the Company after deducting:
– changes in fair value of investment
properties and related tax effects (5,020) (54,347) (91%)
58,580 63,945 (8%)
Earnings per share HK$1.80 HK$3.35 (46%)
Earnings per share
– after deducting the changes in fair value
of investment properties and related
tax effects HK$1.66 HK$1.81 (8%)

NANYANG HOLDINGS LIMITED2
The Board of Directors of Nanyang Holdings Limited announces that the unaudited Group
results for the six months ended 30 June 2016 showed a profit after taxation of HK$63.6 million
(2015: profit of HK$118.3 million). The current period’s profit comprises the dividend receivable
from The Shanghai Commercial & Savings Bank, Ltd., in respect of its 2015 earnings, of
approximately HK$44.3 million (after the 20% withholding tax), and the change in fair value
of investment properties (including those owned by the joint ventures and an associate) which
resulted in a net gain of HK$5.0 million (2015: HK$54.3 million). Excluding the net effect of
revaluing the investment properties at fair value, the half year would have shown a profit after tax
of HK$58.6 million (2015: profit of HK$63.9 million). Earnings per share were HK$1.80 (2015:
HK$3.35). Excluding the net effect of revaluing the investment properties at fair value, earnings
per share would have been HK$1.66 (2015: HK$1.81).
Business Review and Prospects
Real Estate
Hong KongUncertainty in the global economy continued to affect business sentiments. Leasing activities at
the Kwun Tong area have slowed. In order to attract new tenants, we have fitted out a vacant unit
with standard landlord provision and false ceiling. Of the 290,000 sq.ft. of industrial/office space
the Group holds at Nanyang Plaza, 91.4% is leased.
ShanghaiEarnings at Shanghai Sung Nan Textile Co. Ltd., the joint venture of which the Group owns 65%,
continued to be steady. The total leasable area of 28,142 sq.m. is fully leased to third parties.
Business of the anchor tenant, a Taiwan listed company in the restaurant and wedding banquet
business, who leased the main factory building totalling 21,202 sq.m., was satisfactory.
The Group’s investment, a 16.7% interest in HSL China Metropolitan Fund which holds a service
apartment complex in Shanghai, has been classified as an associate. The residential market in
Shanghai is good. Since the sales of the units by strata-title, it was positively received by buyers
and approximately 88% were sold. The building has a total of 196 units and a retail podium.
ShenzhenSouthern Textile Company Limited, the joint venture of which the Group owns 45% in Shenzhen,
continued to perform well. The upgrading of the corridors of two floors of the building should
enhance occupancy and achieve higher rentals. Of the total leasable area of 18,400 sq.m.,
presently 100% is leased.
Financial Investments
In the first half of 2016, business and market sentiments was affected by concerns regarding the
slowing economic growth in the PRC and the referendum on the United Kingdom’s membership
in the European Union, which increased uncertainty and volatility in the equity markets. During
this period we reduced European equities and bonds as well as commodities, and increased U.S.
equities and U.S. and Japanese bonds. For the six months ended 30 June 2016, the portfolios
declined by 1.16%. The value of the portfolios, at the end of the period, stood at US$36.5 million
or approximately HK$283.2 million.
NANYANG HOLDINGS LIMITED3
Business Review and Prospects (Continued)
Financial Investments (Continued)
Following the outcome of the referendum vote whereby the United Kingdom voted to exit the
European Union, the equity markets will continue to experience volatility and uncertainty. Funds
that invested in Europe began to flow back to the U.S. and emerging markets. As at 22 August
2016, the latest practicable date, the portfolios improved to a positive of approximately 2.7%
year to date and their value stood at approximately US$38.0 million or approximately HK$294.6
million. Equities comprised approximately 59.8% (of which approximately 38.7% was in U.S.
equities), bonds 23.3%, commodities 0.9% and cash 16.0%.
Outlook for the rest of the year, we expect markets to remain volatile as affected by geopolitical
events and the upcoming U.S. election at the later part of this year. However, the continued low
interest rates and concerted efforts by governments in the United Kingdom, Europe, Japan and
the PRC to adopt stimulus measures should cushion any significant downturn. We look forward
to the remainder of this year with guarded expectations in a low yield environment.
The Group’s investment in The Shanghai Commercial & Savings Bank, Ltd. (“SCSB”) in
Taiwan, has been classified under non-current assets as an available-for-sale financial asset and
is stated at fair value. The holding represents approximately 4% of the total issued share capital
of SCSB. The Group will receive a cash dividend of approximately HK$44.3 million, after
deducting 20% withholding tax, at the end of August, and a stock dividend of 3,220,102 shares
some time in September.
SCSB continues to expand in the Asia Pacific region. On 18 July 2016, the Singapore branch
officially opened. In August 2016, SCSB received the Best Customer Satisfaction Award.
Presently SCSB has 69 branches in Taiwan, one in Hong Kong, one in Vietnam and one in
Singapore. Besides Jakarta, Indonesia, SCSB has a representative office in Bangkok, Thailand
and one in Cambodia. SCSB also holds a 57% interest in Shanghai Commercial Bank Limited
(“SCB”) in Hong Kong. SCB has 43 branches in Hong Kong, three in China and four branches
overseas. The unaudited net income of SCSB for the three months ended 31 March 2016 was
approximately NT$2,620.1 million (2015 same period: net income of approximately NT$2,771.7
million). Total shareholders equity at 31 March 2016 was approximately NT$117,223.0 million
(31/3/2015: approximately NT$110,218.6 million). (These figures were extracted from the
SCSB’s website http://www.scsb.com.tw).
Financial Position
The Group’s investment properties with a value of HK$1,892 million (31/12/2015: HK$1,892
million) have been mortgaged to a bank to secure general banking facilities of which HK$57
million has been drawn down as at 30 June 2016 (31/12/2015: HK$40 million). The Group also
borrowed Euro 1.0 million (approximately HK$8.8 million as at 30 June 2016) collatorized by a
portion of the investment portfolio, to hedge its Euro exposure.
NANYANG HOLDINGS LIMITED4
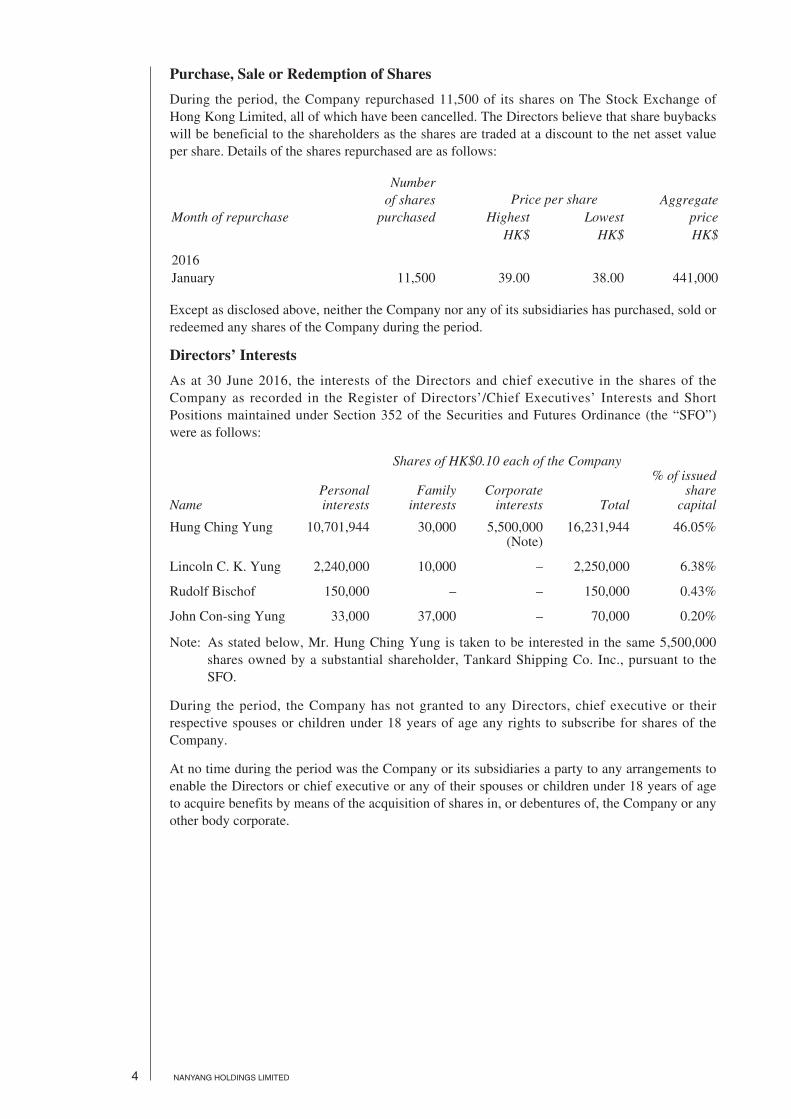
Purchase, Sale or Redemption of Shares
During the period, the Company repurchased 11,500 of its shares on The Stock Exchange of
Hong Kong Limited, all of which have been cancelled. The Directors believe that share buybacks
will be beneficial to the shareholders as the shares are traded at a discount to the net asset value
per share. Details of the shares repurchased are as follows:
Month of repurchase
Number of shares
purchasedPrice per share Aggregate
priceHighest LowestHK$ HK$ HK$
2016
January 11,500 39.00 38.00 441,000
Except as disclosed above, neither the Company nor any of its subsidiaries has purchased, sold or
redeemed any shares of the Company during the period.
Directors’ Interests
As at 30 June 2016, the interests of the Directors and chief executive in the shares of the
Company as recorded in the Register of Directors’/Chief Executives’ Interests and Short
Positions maintained under Section 352 of the Securities and Futures Ordinance (the “SFO”)
were as follows:
Shares of HK$0.10 each of the Company
NamePersonal interests
Family interests
Corporate interests Total
% of issued share
capital
Hung Ching Yung 10,701,944 30,000 5,500,000 (Note)
16,231,944 46.05%
Lincoln C. K. Yung 2,240,000 10,000 – 2,250,000 6.38%
Rudolf Bischof 150,000 – – 150,000 0.43%
John Con-sing Yung 33,000 37,000 – 70,000 0.20%
Note: As stated below, Mr. Hung Ching Yung is taken to be interested in the same 5,500,000
shares owned by a substantial shareholder, Tankard Shipping Co. Inc., pursuant to the
SFO.
During the period, the Company has not granted to any Directors, chief executive or their
respective spouses or children under 18 years of age any rights to subscribe for shares of the
Company.
At no time during the period was the Company or its subsidiaries a party to any arrangements to
enable the Directors or chief executive or any of their spouses or children under 18 years of age
to acquire benefits by means of the acquisition of shares in, or debentures of, the Company or any
other body corporate.

NANYANG HOLDINGS LIMITED5
Substantial Shareholders
As at 30 June 2016, the Register of Substantial Shareholders’ Interests and Short Positions
maintained under Section 336 of the SFO shows that the following party, other than the Directors
as disclosed above, was interested in 5 per cent or more of the issued share capital of the
Company:
Number of shares% of issued
share capital
Tankard Shipping Co. Inc. 5,500,000 (Note) 15.60%
Note: Mr. Hung Ching Yung is taken to be interested in the same 5,500,000 shares owned by
Tankard Shipping Co. Inc. pursuant to the SFO.
Employees
The Group employed 14 employees as at 30 June 2016. Remuneration is determined by reference
to the qualifications and experience of the staff concerned. Salaries and discretionary bonuses are
reviewed annually. The Group also provides other benefits including medical cover and provident
funds.
Other Change in Director’s Information under Rule 13.51B(1) of the Listing Rules
Mr. Lincoln C.K. Yung, the Deputy Managing Director of the Company, retired as Chairman
and Non-Executive Director of Shanghai Commercial Bank Limited and Paofoong Insurance
Company (Hong Kong) Limited with effect from 20 April 2016 and has been appointed as the
Honorary Chairman of Shanghai Commercial Bank Limited.
Saved as disclosed above, there is no other change to Director’s information as required to be
disclosed pursuant to Rule 13.51B(1) of the Rules Governing the Listing of Securities on The
Stock Exchange of Hong Kong Limited (the “Listing Rules”).
Corporate Governance
None of the Directors of the Company is aware of any information that would reasonably
indicate that the Company is not, or was not for any part of the six months ended 30 June 2016,
in compliance with the code provisions of the Corporate Governance Code and Corporate
Governance Report as set out in Appendix 14 of the Listing Rules.
Code for Dealing in Company’s Securities by Directors
The Company has adopted the Model Code for Securities Transactions by Directors of Listed
Issuers as set out in Appendix 10 of the Listing Rules (the “Model Code”). Having made specific
enquiry of all directors, the Company’s directors confirmed that they have complied with the
required standard as set out in the Model Code throughout the six months ended 30 June 2016.
Audit Committee and review of results
The Audit Committee has reviewed with management the accounting principles and practices
adopted by the Group and discussed auditing, internal controls and financial reporting matters
including a review of the unaudited consolidated financial statements for the period ended
30 June 2016 with the management. The unaudited interim financial statements of the Group
for the six months ended 30 June 2016 have been reviewed by the Group’s external auditor,
PricewaterhouseCoopers, in accordance with Hong Kong Standard on Review Engagements 2410
“Review of Interim Financial Information Performed by the Independent Auditors of the Entity”
issued by the Hong Kong Institute of Certified Public Accountants.

NANYANG HOLDINGS LIMITED6
UNAUDITED CONDENSED CONSOLIDATED INCOME STATEMENTFOR THE SIX MONTHS ENDED 30 JUNE 2016
Six months ended 30 June
Note 2016 2015
HK$’000 HK$’000
Revenue and income 6 91,854 105,539
Direct costs (7,739) (7,696)
Gross profit 84,115 97,843
Administrative expenses (17,896) (17,712)
Other operating income 1,202 700
Other operating expenses (1,531) (1,092)
Changes in fair value of investment properties 7,946 51,014
Operating profit 7 73,836 130,753
Finance expense 8 (197) (385)
Share of profits of joint ventures 4,401 5,778
Share of profit/(loss) of an associate 1,033 (12)
Profit before income tax 79,073 136,134
Income tax expense 9 (15,473) (17,842)
Profit attributable to equity holders of the Company 63,600 118,292
Earnings per share (basic and diluted) 10 HK$1.80 HK$3.35

NANYANG HOLDINGS LIMITED7
UNAUDITED CONDENSED CONSOLIDATED STATEMENT OF COMPREHENSIVE INCOMEFOR THE SIX MONTHS ENDED 30 JUNE 2016
Six months ended 30 June
2016 2015
HK$’000 HK$’000
Profit for the period 63,600 118,292
Other comprehensive incomeItems that may be reclassified subsequently to profit or loss
Fair value (losses)/gains on available-for-sale financial assets (84,553) 91,073
Share of other comprehensive (loss)/income of joint ventures
and an associate accounted for under equity method (3,641) 1,157
Currency translation differences 1,280 (701)
Other comprehensive (loss)/income for the period, net of tax (86,914) 91,529
Total comprehensive (loss)/income for the period attributable to equity holders of the Company (23,314) 209,821

NANYANG HOLDINGS LIMITED8
UNAUDITED CONDENSED CONSOLIDATED BALANCE SHEETAS AT 30 JUNE 2016
Note30 June
201631 December
2015
HK$’000 HK$’000
ASSETSNon-current assets
Property, plant and equipment 12 667 798
Investment properties 13 2,039,380 2,031,370
Investments in joint ventures 108,344 104,919
Investment in an associate 73,629 75,261
Available-for-sale financial assets 14 1,085,838 1,169,115
Deferred income tax assets 363 442
3,308,221 3,381,905
Current assetsTrade and other receivables 15 67,013 9,797
Financial assets at fair value through profit or loss 16 236,274 243,447
Tax recoverable – 2
Cash and bank balances
– Pledged bank deposits 28,244 38,416
– Cash and cash equivalents 42,880 44,696
374,411 336,358
Total assets 3,682,632 3,718,263
EQUITYCapital and reserves attributable to
the Company’s equity holdersShare capital 17 3,525 3,526
Other reserves 887,960 974,873
Retained profits 2,633,639 2,605,730
Total equity 3,525,124 3,584,129
LIABILITIESNon-current liabilities
Deferred income tax liabilities 18 21,849 20,973
Current liabilitiesTrade and other payables 19 53,353 54,453
Current income tax liabilities 15,937 1,415
Short term bank loans – secured 65,843 57,000
Derivative financial liability 526 293
135,659 113,161
Total liabilities 157,508 134,134
Total equity and liabilities 3,682,632 3,718,263

NANYANG HOLDINGS LIMITED9
UNAUDITED CONDENSED CONSOLIDATED STATEMENT OF CHANGES IN EQUITYFOR THE SIX MONTHS ENDED 30 JUNE 2016
Six months ended 30 June 2016Attributable to equity holders of the Company
Share capital
Other reserves
Retained profits
Total equity
HK$’000 HK$’000 HK$’000 HK$’000
Balance at 1 January 2016 3,526 974,873 2,605,730 3,584,129
Total comprehensive (loss)/income for the period ended 30 June 2016 – (86,914) 63,600 (23,314)
Transactions with owners, recognised directly in equity:Dividends relating to 2015 paid
in June 2016 (Note 11) – – (35,250) (35,250)Shares repurchased and
cancelled (1) 1 (441) (441)
Balance at 30 June 2016 3,525 887,960 2,633,639 3,525,124
Six months ended 30 June 2015
Attributable to equity holders of the Company
Share
capital
Other
reserves
Retained
profits
Total
equity
HK$’000 HK$’000 HK$’000 HK$’000
Balance at 1 January 2015 3,526 1,181,008 2,491,362 3,675,896
Total comprehensive income for the period ended 30 June 2015 – 91,529 118,292 209,821
Transactions with owners, recognised directly in equity:Dividends relating to 2014
paid in June 2015 (Note 11) – – (42,314) (42,314)
Balance at 30 June 2015 3,526 1,272,537 2,567,340 3,843,403

NANYANG HOLDINGS LIMITED10
UNAUDITED CONDENSED CONSOLIDATED STATEMENT OF CASH FLOWSFOR THE SIX MONTHS ENDED 30 JUNE 2016
Six months ended 30 June
2016 2015
HK$’000 HK$’000
Cash flows from operating activities 14,621 22,071
Cash flows from investing activitiesReturn of capital from a joint venture – 1,507
Other cash outflows from investment activities, net – (117)
Net cash inflows from investing activities – 1,390
Cash flows from financing activitiesDividends paid (35,250) (42,314)
Drawdown of bank loan 8,843 20,000
Repayment of bank loan – (1,769)
Other cash flows from financing activities, net (263) (385)
Decrease/(increase) in pledged bank deposits 10,172 (1,295)
Net cash outflows from financing activities (16,498) (25,763)
Net decrease in cash and cash equivalents (1,877) (2,302)
Cash and cash equivalents at 1 January 44,696 47,511
Currency translation difference 61 (56)
Cash and cash equivalents at 30 June 42,880 45,153
Analysis of cash and cash equivalentsCash and bank balances 42,880 45,153

NANYANG HOLDINGS LIMITED11
NOTES TO THE CONDENSED CONSOLIDATED INTERIM FINANCIAL INFORMATION
1 General information
Nanyang Holdings Limited (“the Company”) is a limited liability company incorporated in
Bermuda. The address of its office in Hong Kong is Room 1808 St George’s Building, 2 Ice
House Street, Central, Hong Kong.
The Company is listed on The Stock Exchange of Hong Kong Limited.
The Company and its subsidiaries (together “the Group”) are engaged in property investment
and investment holding and trading.
This condensed consolidated interim financial information (“Interim Financial Information”)
is presented in thousands of Hong Kong dollars (HK$’000), unless otherwise stated. This
Interim Financial Information has been approved for issue by the Board of Directors on 26
August 2016.
2 Basis of preparation
This Interim Financial Information for the six months ended 30 June 2016 has been prepared
in accordance with Hong Kong Accounting Standard (“HKAS”) 34 “Interim Financial
Reporting” issued by the Hong Kong Institute of Certified Public Accountants.
This Interim Financial Information should be read in conjunction with the 2015 annual
financial statements, which have been prepared in accordance with Hong Kong Financial
Reporting Standards (“HKFRS”).
3 Significant accounting policies
The significant accounting policies and methods of computation used in the preparation of
the Interim Financial Information are consistent with those used in the 2015 annual financial
statements, except for the adoption of the amendments to HKFRS effective for the year
ending 31 December 2016.
(a) Amendments to standards effective in current accounting period and are relevant to the Group’s operations
During the period ended 30 June 2016, the Group has adopted the following
amendments to standards which are relevant to the Group’s operations and are
mandatory for accounting periods beginning on 1 January 2016:
HKAS 1 (Amendments) Disclosure Initiative
HKFRS 10, HKFRS12 and
HKAS 28 (Amendments)
Investment Entities: Applying the Consolidation
Exception
HKAS 16 and HKAS 38
(Amendments)
Clarification of Acceptable Methods of Depreciation
and Amortisation
HKAS 27 (Amendment) Equity Method in Separate Financial Statements
Annual Improvements Project Annual Improvements 2014
The adoption of these amendments to standards does not have any significant change to
the accounting policies or any significant effect on the results and financial position of
the Group.

NANYANG HOLDINGS LIMITED12
3 Significant accounting policies (Continued)
(b) New standards and amendments to standards that are not yet effective and have not been early adopted by the Group
The following new standards and amendments to standards have been published which
are mandatory for the Group’s accounting periods beginning on or after 1 January 2017
or later periods but have not been early adopted by the Group:
HKAS 12 (Amendments) Income Taxes (1)
HKAS 7 (Amendments) Statement of Cash Flows (1)
HKFRS 15 Revenue from Contracts with Customers (2)
HKFRS 9 Financial Instruments (2)
HKFRS 16 Leases (3)
HKFRS 10 and HKAS 28
(Amendments)
Sale or Contribution of Assets between an Investor
and its Associate or Joint Venture (4)
(1) Effective for annual periods beginning on or after 1 January 2017
(2) Effective for annual periods beginning on or after 1 January 2018
(3) Effective for annual periods beginning on or after 1 January 2019
(4) Effective date is to be determined
The Group has already commenced an assessment of the impact of the above new
standards and amendments to standards but is not yet in a position to state whether they
would have a significant impact to its results of operations and financial position.
4 Financial risk management
The Group’s investment activities expose it to various types of risk which are associated
with the financial instruments and markets in which it invests. The types of financial risk to
which the Group is exposed are market risk (including equity price risk, currency risk and
interest rate risk), credit and counterparty risk and liquidity risk. The Group’s overall risk
management programme focuses on the unpredictability of financial markets and seeks to
minimise the potential adverse effects it may have on the Group’s financial performance.
The interim condensed consolidated financial information does not include all financial
risk management information and disclosures required in the annual financial statements,
and should be read in conjunction with the Group’s annual financial statements as at 31
December 2015.
There have been no changes in any risk management policies since the year end.

NANYANG HOLDINGS LIMITED13
4 Financial risk management (Continued)
Fair value estimation
The table below analyses financial instruments carried at fair value, by valuation method.
The different levels have been defined as follows:
• Quoted prices (unadjusted) in active markets for identical assets or liabilities (level 1).
• Inputs other than quoted prices included within level 1 that are observable for the assets
or liabilities, either directly (that is, as prices) or indirectly (that is, derived from prices)
(level 2).
• Inputs for the assets or liabilities that are not based on observable market data (that is,
unobservable inputs) (level 3).
The following table presents the Group’s assets and liabilities that are measured at fair value
at 30 June 2016. See note 13 for disclosures of the investment properties that are measured at
fair value.
Level 1 Level 2 Level 3 TotalHK$’000 HK$’000 HK$’000 HK$’000
AssetsFinancial assets at fair value through
profit or loss 236,274 – – 236,274Available-for-sale financial assets 1,085,838 – – 1,085,838
Total assets 1,322,112 – – 1,322,112
Liabilities Derivative financial liability – 526 – 526
The following table presents the Group’s assets and liabilities that are measured at fair value
at 31 December 2015.
Level 1 Level 2 Level 3 Total
HK$’000 HK$’000 HK$’000 HK$’000
AssetsFinancial assets at fair value through
profit or loss 243,447 – – 243,447
Available-for-sale financial assets 1,169,115 – – 1,169,115
Total assets 1,412,562 – – 1,412,562
Liabilities Derivative financial liability – 293 – 293
The fair value of financial instruments traded in active markets is based on quoted market
prices at the balance sheet date. A market is regarded as active if quoted prices are readily
and regularly available from an exchange, dealer, broker, industry group, pricing service
or regulatory agency, and those prices represent actual and regularly occurring market
transactions on an arm’s length basis. The quoted market price used for financial assets held
by the Group is the current bid price. These instruments are included in level 1.

NANYANG HOLDINGS LIMITED14
4 Financial risk management (Continued)
Fair value estimation (Continued)
The fair value of financial instruments that are not traded in an active market (for example,
over-the-counter derivatives) is determined by using valuation techniques. These valuation
techniques maximise the use of observable market data where it is available and rely as
little as possible on entity specific estimates. If all significant inputs required to fair value an
instrument are observable, the instrument is included in level 2.
If one or more of the significant inputs is not based on observable market data, the
instrument is included in level 3.
There were no transfers between any level during the period.
5 Estimate
The preparation of interim financial information requires management to make judgements,
estimates and assumptions that affect the application of accounting policies and the reported
amounts of assets and liabilities, income and expense. Actual results may differ from these
estimates.
In preparing this condensed consolidated interim financial information, the significant
judgements made by management in applying the Group’s accounting policies and the key
sources of estimation uncertainty were the same as those that applied to the consolidated
financial statements for the year ended 31 December 2015.
6 Revenue and income and segment information
Revenue mainly comprises rental and related income from investment properties. Income
represents dividend income from listed investments and available-for-sale financial assets,
interest income and net realised and unrealised (losses)/gains on financial assets at fair value
through profit or loss. Revenue and income recognised during the period comprises the
following:
Six months ended 30 June
2016 2015
HK$’000 HK$’000
Gross rental income from investment properties 31,885 30,719
Net realised and unrealised (losses)/gains on financial assets
at fair value through profit or loss (4,571) 10,352
Dividend income from financial assets at fair value
through profit or loss 1,786 1,756
Dividend income from available-for-sale financial assets 57,333 56,881
Interest income 241 690
Management fee income from investment properties 5,180 5,141
91,854 105,539
The Group is organised on a worldwide basis into two main business segments:
Real estate – investment in and leasing of industrial/office premises
Financial investments – holding and trading of investment securities
There are no sales or other transactions between the business segments.
NANYANG HOLDINGS LIMITED15
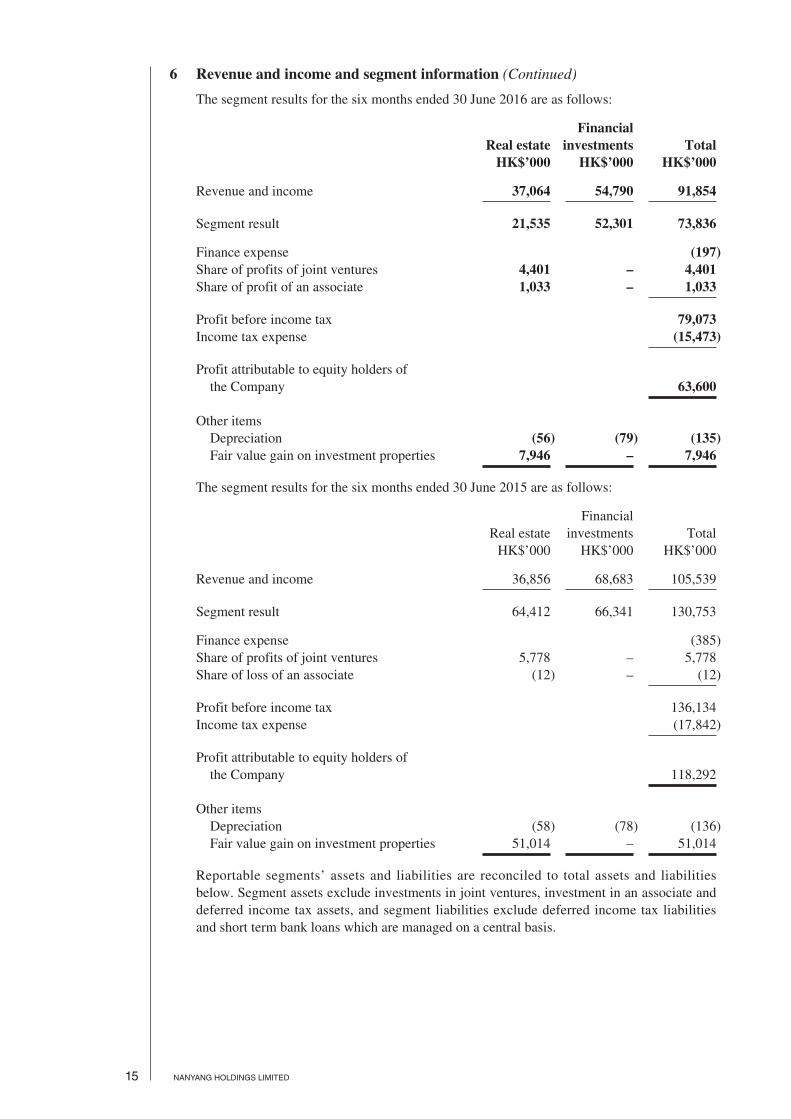
6 Revenue and income and segment information (Continued)
The segment results for the six months ended 30 June 2016 are as follows:
Real estateFinancial
investments TotalHK$’000 HK$’000 HK$’000
Revenue and income 37,064 54,790 91,854
Segment result 21,535 52,301 73,836
Finance expense (197)Share of profits of joint ventures 4,401 – 4,401Share of profit of an associate 1,033 – 1,033
Profit before income tax 79,073Income tax expense (15,473)
Profit attributable to equity holders of
the Company 63,600
Other items
Depreciation (56) (79) (135)Fair value gain on investment properties 7,946 – 7,946
The segment results for the six months ended 30 June 2015 are as follows:
Real estate
Financial
investments Total
HK$’000 HK$’000 HK$’000
Revenue and income 36,856 68,683 105,539
Segment result 64,412 66,341 130,753
Finance expense (385)
Share of profits of joint ventures 5,778 – 5,778
Share of loss of an associate (12) – (12)
Profit before income tax 136,134
Income tax expense (17,842)
Profit attributable to equity holders of
the Company 118,292
Other items
Depreciation (58) (78) (136)
Fair value gain on investment properties 51,014 – 51,014
Reportable segments’ assets and liabilities are reconciled to total assets and liabilities
below. Segment assets exclude investments in joint ventures, investment in an associate and
deferred income tax assets, and segment liabilities exclude deferred income tax liabilities
and short term bank loans which are managed on a central basis.

NANYANG HOLDINGS LIMITED16
6 Revenue and income and segment information (Continued)
The segment assets and liabilities as at 30 June 2016 are as follows:
Real estateFinancial
investments TotalHK$’000 HK$’000 HK$’000
Segment assets 2,040,918 1,459,378 3,500,296Investments in joint ventures 108,344 – 108,344Investment in an associate 73,629 – 73,629Unallocated assets 363
3,682,632
Segment liabilities 47,078 22,738 69,816Unallocated liabilities 87,692
157,508
The segment assets and liabilities as at 31 December 2015 are as follows:
Real estate
Financial
investments Total
HK$’000 HK$’000 HK$’000
Segment assets 2,032,654 1,504,987 3,537,641
Investments in joint ventures 104,919 – 104,919
Investment in an associate 75,261 – 75,261
Unallocated assets 442
3,718,263
Segment liabilities 47,526 8,635 56,161
Unallocated liabilities 77,973
134,134
The Company is incorporated in Bermuda and is domiciled in Hong Kong. The Group’s
revenue and income from Hong Kong and from other countries for the period ended 30 June is
analysed as follows:
Six months ended 30 June
2016 2015
HK$’000 HK$’000
Hong Kong 34,459 40,525
United States of America 2,377 2,182
Europe (2,248) 5,127
Taiwan 57,333 56,880
Other countries (67) 825
91,854 105,539

NANYANG HOLDINGS LIMITED17
6 Revenue and income and segment information (Continued)
At 30 June 2016, the total of non-current assets other than financial instruments and deferred
income tax assets located/operated in Hong Kong and in other places are as follows:
30 June 2016
31 December
2015
HK$’000 HK$’000
Hong Kong 2,039,767 2,031,809
Mainland China 182,253 180,539
2,222,020 2,212,348
7 Operating profit
Operating profit is stated after charging the following:
Six months ended 30 June
2016 2015
HK$’000 HK$’000
Depreciation 135 136
Employee benefit expense (including directors’ emoluments) 12,322 12,331
Operating leases payments on land and buildings 1,890 1,900
Management fee expense in respect of investment properties 5,396 5,322
8 Finance expense
Six months ended 30 June
2016 2015
HK$’000 HK$’000
Interest expense on bank loans 197 385
9 Income tax expense
Hong Kong profits tax has been provided at the rate of 16.5% (2015: 16.5%) on the estimated
assessable profit for the period. Withholding tax on dividends receivable from overseas
investments including joint ventures and an associate has been calculated at the rates of
taxation prevailing in the countries in which the investments operate.
Six months ended 30 June
2016 2015
HK$’000 HK$’000
Current income tax
– Hong Kong profits tax 1,523 1,570
– Withholding tax 12,995 15,168
Deferred income tax 955 1,104
15,473 17,842

NANYANG HOLDINGS LIMITED18
10 Earnings per share
Basic earnings per share is calculated by dividing the profit attributable to equity holders of
the Company by the weighted average number of ordinary shares in issue during the period.
Six months ended 30 June
2016 2015
Earnings (HK$’000)Profit attributable to equity holders of the Company 63,600 118,292
Number of shares (thousands)Weighted average number of ordinary shares in issue 35,252 35,262
Earnings per share (HK$)Basic and diluted (Note) 1.80 3.35
Note:
The Company has no dilutive potential ordinary shares and basic earnings per share are
equal to diluted earnings per share.
11 Dividends
Six months ended 30 June
2016 2015
HK$’000 HK$’000
2015 final dividend paid of HK$0.60
(2015: 2014 final dividend paid of HK$0.60) per share 21,150 21,157
2015 special dividend paid of HK$0.40
(2015: 2014 special dividend paid of HK$0.60) per share 14,100 21,157
35,250 42,314
The Directors have not declared an interim dividend for the six months ended 30 June 2016
(2015: Nil).

NANYANG HOLDINGS LIMITED19
12 Property, plant and equipment
30 June 2016
31 December
2015
HK$’000 HK$’000
Property, plant and equipment 667 798
Movement during the period is set out below:
Six months ended 30 June
2016 2015
HK$’000 HK$’000
Net book amount as at 1 January 798 1,033
Additions 4 32
Depreciation (135) (136)
Net book amount as at 30 June 667 929
13 Investment properties
30 June 2016
31 December
2015
HK$’000 HK$’000
Investment properties 2,039,380 2,031,370
Movement during the period is set out below:
Six months ended 30 June
2016 2015
HK$’000 HK$’000
At fair valueOpening balance at 1 January 2,031,370 1,945,200
Additions 64 186
Fair value changes 7,946 51,014
Closing balance at 30 June 2,039,380 1,996,400
The Group’s investment properties with an aggregate carrying value of HK$1,892,000,000
(31 December 2015: HK$1,892,000,000) have been mortgaged to a bank to secure general
banking facilities of which HK$57,000,000 (31 December 2015: HK$40,000,000) was
utilised as at 30 June 2016.

NANYANG HOLDINGS LIMITED20
13 Investment properties (Continued)
Valuation processes of the Group
The basis of the valuation of investment properties is fair value being the amount for which
the property could be exchanged between willing parties in an arm’s length transaction,
based on current prices in an active market for similar properties in the same location
and condition and subject to similar leases. The investment properties were revalued by
Prudential Surveyors International Limited, independent qualified valuer not related to the
Group, who hold a recognised relevant professional qualification and have recent experience
in the locations and segments of the investment properties valued, at 30 June 2016. For all
investment properties, their current use equates to the highest and best use.
The Group’s finance department reviews the valuations performed by the independent
valuers for financial reporting purposes. This department reports directly to the senior
management. Discussions of valuation processes and results are held between the
management and valuers at least once every six months, in line with the Group’s interim and
annual reporting dates.
At each financial year end the finance department:
• Verifies all major inputs to the independent valuation report;
• Assesses property valuations movements when compared to the prior year valuation
report;
• Holds discussions with the independent valuer.
Valuation techniques
Fair value measurements using significant unobservable inputs
Fair values of completed industrial and commercial properties in Hong Kong are generally
derived using the income capitalisation method and wherever appropriate, by direct
comparison method. Income capitalisation method is based on the capitalisation of the
net income and reversionary income potential by adopting appropriate capitalisation
rates, which are derived from analysis of sale transactions and valuers’ interpretation of
prevailing investor requirements or expectations. The prevailing market rents adopted
in the valuation have reference to recent lettings, within the subject properties and other
comparable properties. Direct comparison method is based on comparing the property to be
valued directly with other comparable properties, which have recently transacted. However,
given the heterogeneous nature of real estate properties, appropriate adjustments are usually
required to allow for any qualitative differences that may affect the price likely to be
achieved by the property under consideration.
Significant inputs used to determine fair value
Capitalisation rates are estimated by valuer based on the risk profile of the investment
properties being valued. The higher the rates is, the lower the fair value will be.
Prevailing market rents are estimated based on recent lettings for Hong Kong investment
properties, within the subject properties and other comparable properties. The lower the rents
is, the lower the fair value will be.
At 30 June 2016, capitalisation rates of 2.1% to 5.0% and market rent of HK$12.0 to
HK$25.7 per square feet are used in the income capitalisation method for Hong Kong
completed industrial and commercial properties.

NANYANG HOLDINGS LIMITED21
14 Available-for-sale financial assets
The available-for-sale financial assets are primarily the Group’s investment in The Shanghai
Commercial & Savings Bank, Ltd., a licensed bank in Taiwan (“SCSB”), representing
approximately 4% of the total issued share capital of SCSB, which is stated at fair value.
15 Trade and other receivables
30 June 2016
31 December
2015
HK$’000 HK$’000
Trade receivables (Note) 52 89
Prepayments and deposits 6,814 7,585
Other receivables 2,174 2,123
Dividend receivables 57,973 –
67,013 9,797
Note:
The Group does not grant any credit period to its customers.
At 30 June 2016, the aging analysis of the trade receivables were as follows:
30 June 2016
31 December
2015
HK$’000 HK$’000
Within 30 days 52 48
31-60 days – 41
52 89
16 Financial assets at fair value through profit or loss
The Group’s financial assets at fair value through profit or loss with an aggregate
carrying value of HK$78,997,000 (31 December 2015: HK$83,012,000) together with
the bank deposit of HK$28,244,000 (31 December 2015: HK$38,416,000) have been
pledged to secure general banking facilities of which HK$8,843,000 (31 December 2015:
HK$17,000,000) was utilised as at 30 June 2016.

NANYANG HOLDINGS LIMITED22
17 Share capital
Number of Shares Amount
HK$’000
Ordinary share, issued and fully paid:
At 1 January 2015, 30 June 2015 and 1 January 2016 35,261,738 3,526
Shares repurchased and cancelled (11,500) (1)
At 30 June 2016 35,250,238 3,525
During the period, the Company repurchased a total of 11,500 of its own shares through
purchases on The Stock Exchange of Hong Kong Limited on 25 January 2016 and 26
January 2016. The aggregate price of HK$441,000 paid was charged against retained profits
and the nominal value of the shares repurchased of HK$1,150 was transferred to the capital
redemption reserve.
18 Deferred income tax liabilities
Six months ended 30 June
2016 2015
HK$’000 HK$’000
Opening balance at 1 January 20,973 19,819
Charge to profit and loss 876 1,104
Closing balance at 30 June 21,849 20,923
19 Trade and other payables
30 June 2016
31 December 2015
HK$’000 HK$’000
Trade payables 3,224 2,977Other payables 50,129 51,476
53,353 54,453
At 30 June 2016, the aging analysis of trade payables were as follows:
30 June 2016
31 December 2015
HK$’000 HK$’000
Within 30 days 2,883 2,637
31-60 days 341 340
3,224 2,977

NANYANG HOLDINGS LIMITED23
20 Banking facilities
As at 30 June 2016, the Group has general banking facilities of which HK$57 million (31
December 2015: HK$40 million) was utilised by the Group on short term bank loans.
21 Related party transactions
In addition to the related party information and transactions disclosed elsewhere in the
condensed consolidated financial statements, the following is a summary of significant
related party transactions entered into the ordinary course of business between the Group and
its related parties during the period.
(a) Key management compensation
Six months ended 30 June
2016 2015
HK$’000 HK$’000
Salaries and other employee benefits 9,581 9,466
Post-employment benefits 36 149
9,617 9,615
(b) Related party balances
30 June 2016
31 December
2015
HK$’000 HK$’000
Amounts due from joint ventures 2,174 2,123
On behalf of the Board
Rudolf BischofChairman
Hong Kong, 26 August 2016


