171


CONTENTS
Page
Notice of Meeting 1
Corporate Information 5 Directors’ Profile 6
Corporate Governance Statement 8
Statement on Risk Management and Internal Control 15
Audit Committee Report 17
Nomination Committee 21
Remuneration Committee 21
5 Years Group Financial Highlights 22
Parkson Network 23
Chairman’s Statement:
English 24
Bahasa Malaysia 31
Chinese 37
Financial Statements:
Directors’ Report 42
Statement by Directors 47
Statutory Declaration 47
Independent Auditors’ Report 48
Income Statements 50
Statements of Comprehensive Income 51
Consolidated Statement of Financial Position 52
Company Statement of Financial Position 54
Consolidated Statement of Changes in Equity 55
Company Statement of Changes in Equity 57
Statements of Cash Flows 58
Notes to the Financial Statements 60
List of Group Properties 162
Material Contracts 162
Analysis of Shareholdings 163
Other Information 166
Form of Proxy Enclosed

1
NOTICE OF MEETING
NOTICE IS HEREBY GIVEN THAT the Thirtieth Annual General Meeting of Parkson Holdings Berhad will be held at the Meeting Hall, Level 16, Office Tower, No. 1 Jalan Nagasari (Off Jalan Raja Chulan), 50200 Kuala Lumpur on 12 December 2013 at 10.30 am for the following purposes:
AGENDA
1. To receive the Directors’ Report and Audited Financial Statements for the financial year ended 30 June 2013.
2. To approve the payment of Directors’ fees amounting to RM215,000 (2012 : RM244,000).
3. To re-elect Director:
In accordance with Article 99 of the Company’s Articles of Association, Cik Zainab binti Dato’ Hj. Mohamed who was appointed during the financial year retires and, being eligible, offers herself for re-election.
4. To consider and, if thought fit, pass the following resolution pursuant to Section 129(6) of the Companies Act, 1965 as an ordinary resolution:
“THAT pursuant to Section 129(6) of the Companies Act, 1965, Y. Bhg. Tan Sri William H.J. Cheng be and is hereby re-appointed Director of the Company to hold office until the next annual general meeting of the Company.”
5. To re-appoint Auditors to hold office until the conclusion of the next annual general meeting and to authorise the Directors to fix their remuneration.
6. Special Business
6.1 To consider and, if thought fit, pass the following ordinary resolutions:
6.1.1 Authority to Directors to issue shares
“THAT pursuant to Section 132D of the Companies Act, 1965 and subject to the approval of all relevant authorities being obtained, the Directors be and are hereby empowered to issue shares in the Company at any time and upon such terms and conditions and for such purposes as the Directors may, in their absolute discretion deem fit, provided that the aggregate number of shares issued pursuant to this resolution does not exceed 10% of the issued and paid-up capital of the Company for the time being and that such authority shall continue to be in force until the conclusion of the next annual general meeting of the Company.”
6.1.2 Proposed Shareholders’ Mandate for Recurrent Related Party Transactions
“THAT approval be and is hereby given for the Company and its subsidiaries to enter into recurrent related party transactions of a revenue or trading nature which are necessary for its day-to-day operations as detailed in paragraph 3.3 and with those related parties as set out in paragraph 3.2 of Part A(I) of the Circular to Shareholders of the Company dated 20 November 2013 (“Related Parties”) which has been despatched to the shareholders of the Company, provided that such transactions are undertaken in the ordinary course of business and are on normal commercial terms which are consistent with the Group’s usual business practices and policies, and on terms not more favourable to the Related Parties than those generally available to the public and are not to the detriment of the minority shareholders; and
THAT authority conferred by this ordinary resolution will only continue to be in force until:
(i) the conclusion of the next annual general meeting of the Company at which time it will lapse, unless by a resolution passed at the meeting, the authority is renewed;
Note 3
Resolution 1
Resolution 2
Resolution 3
Resolution 4
Resolution 5
Resolution 6

2
(ii) the expiration of the period within which the next annual general meeting after that date is required to be held pursuant to Section 143(1) of the Companies Act, 1965 (but must not extend to such extension as may be allowed pursuant to Section 143(2) of the Companies Act, 1965); or
(iii) revoked or varied by resolution passed by the shareholders of the Company in general meeting,
whichever is the earlier; and
THAT the Directors of the Company be and are hereby authorised to complete and do all such acts and things to give effect to the transactions contemplated and/or authorised by this ordinary resolution.”
6.1.3 Proposed Renewal of Authority for Share Buy-Back
“THAT, subject to the Companies Act, 1965, the provisions of the Articles of Association of the Company, the Bursa Malaysia Securities Berhad (“Bursa Securities”) Main Market Listing Requirements, and the approvals of all relevant governmental and/or regulatory authorities, the Company be and is hereby authorised to buy-back such amount of ordinary shares of RM1.00 each in the Company as may be determined by the Directors of the Company from time to time through Bursa Securities upon such terms and conditions as the Directors may deem fit and expedient in the interest of the Company provided that:
(i) the aggregate number of shares bought-back does not exceed 10% of the total issued and paid-up capital of the Company at any point of time; and
(ii) the maximum funds to be allocated for the share buy-back shall not exceed the retained profits or the share premium account of the Company or both, based on its latest audited financial statements available up to the date of the share buy-back transaction
(hereinafter referred to as the “Proposed Share Buy-Back”); and
THAT authority conferred by this ordinary resolution shall commence immediately upon the passing of this resolution and will only continue to be in force until:
(i) the conclusion of the next annual general meeting of the Company, unless by ordinary resolution passed at that meeting, the authority is renewed, either unconditionally or subject to conditions; or
(ii) the expiration of the period within which the next annual general meeting after that date is required by law to be held; or
(iii) revoked or varied by resolution passed by the shareholders of the Company in general meeting,
whichever occurs first; and
THAT authority be and is hereby given to the Directors of the Company to decide in their absolute discretion to retain the ordinary shares of RM1.00 each in the Company so purchased by the Company as treasury shares and/or cancel them and to distribute the treasury shares as share dividends and/or resell the treasury shares; and
FURTHER, THAT authority be and is hereby unconditionally and generally given to the Directors of the Company to take all such steps as are necessary or expedient and/or enter into any and all agreements, arrangements and guarantee with any party or parties to implement, finalise and give full effect to the Proposed Share Buy-Back with full powers to assent to any conditions, modifications, revaluations, variations and/or amendments (if any) as may be imposed by the relevant authorities.”
Resolution 7

3
6.2 To consider and, if thought fit, pass the following special resolution:
Proposed Amendment to the Articles of Association of the Company
“THAT the existing Articles of Association of the Company be amended by the relevant additions and deletions as specifically set out in the Annexure of Part A(II) of the Circular to Shareholders dated 20 November 2013 which has been despatched to the shareholders of the Company.”
7. To transact any other business for which due notice shall have been given.
By Order of the Board
CHAN POH LANLIM KWEE PENGSecretaries
Kuala Lumpur20 November 2013
Notes:
1. Proxy
• Inrespectofdepositedsecurities,onlyMemberswhosenamesappearintheRecordofDepositorson5December2013shallbeeligibletoattendtheMeeting.
• AmemberentitledtoattendandvoteattheAnnualGeneralMeetingisentitledtoappointaproxytoattendandvoteinsteadofhim.AproxyneednotbeamemberoftheCompany.Theinstrumentappointingaproxymustbeinwritingunderthehandoftheappointororhisattorneydulyauthorisedinwritingor,iftheappointorisacorporation,eitherundersealorthehandofanofficerorattorneydulyauthorised.
• TheinstrumentofproxyshallbedepositedattheofficeoftheRegistraroftheCompany,Level13,OfficeTower,No.1JalanNagasari(OffJalanRajaChulan),50200KualaLumpurnotlessthanforty-eight(48)hoursbeforethetimeforholdingtheMeeting.
• CompletedFormofProxysentthroughfacsimiletransmissionshallnotbeaccepted.
2. CirculartoShareholdersdated20November2013(“Circular”)
DetailsonthefollowingaresetoutintheCircularenclosedtogetherwiththe2013AnnualReport:
(i) PartA(I)-ProposedShareholders’MandateforRecurrentRelatedPartyTransactions
(ii) PartA(II)-ProposedAmendmenttotheArticlesofAssociationoftheCompany
(iii) PartB-ProposedRenewalofAuthorityforShareBuy-Back
3. AgendaItem1
ThisitemoftheAgendaismeantfordiscussiononly.TheprovisionsofSection169oftheCompaniesAct,1965requirethattheDirectors’ReportandtheAuditedFinancialStatementsbelaidbeforetheCompanyatitsAnnualGeneralMeeting.Assuch,thisAgendaitemisnotabusinesswhichrequiresaresolutiontobeputtovotebyshareholders.
Resolution 8

4
4. Resolution5
ThisapprovalwillallowtheCompanytoprocuretherenewalofthegeneralmandate(“GeneralMandate”)whichwillempowertheDirectorsoftheCompanytoissuesharesintheCompanyuptoanamountnotexceedingintotal10%oftheissuedandpaid-upcapitaloftheCompany.Thisauthority,unlessrevokedorvariedatageneralmeeting,willexpireattheconclusionofthenextannualgeneralmeetingoftheCompany.
AsatthedateofthisNotice,nonewsharesintheCompanywereissuedpursuanttothemandategrantedtotheDirectorsatthelastAnnualGeneralMeetingoftheCompanyheldon21November2012whichwilllapseattheconclusionofthisAnnualGeneralMeeting.
TheGeneralMandatewillprovideflexibilitytotheCompanyforanypossiblefundraisingactivities,includingbutnotlimitedtoplacingofsharesforpurposesoffundingfutureinvestmentprojects,workingcapitaland/oracquisitions.
5. Resolution6
ThisapprovalwillallowtheCompanyanditssubsidiariestoenterintorecurrentrelatedpartytransactionsofarevenueortradingnaturewiththoserelatedpartiesassetoutinparagraph3.2ofPartA(I)oftheCircular,whicharenecessaryfortheGroup’sday-to-dayoperationsundertakenintheordinarycourseofbusinessandareonnormalcommercialtermswhichareconsistentwiththeGroup’susualbusinesspracticesandpolicies,andontermsnotmorefavourabletotherelatedpartiesthanthosegenerallyavailabletothepublicandarenottothedetrimentoftheminorityshareholders.
6. Resolution7
ThisapprovalwillempowertheDirectorsoftheCompanytopurchasetheCompany’ssharesupto10%oftheissuedandpaid-upcapitaloftheCompanyatanypointoftime.Thisauthority,unlessrevokedorvariedatageneralmeeting,willexpireattheconclusionofthenextannualgeneralmeetingoftheCompany.
7. Resolution8
ThisapprovalwillallowamendmentstobemadetotheArticlesofAssociationoftheCompany(“AA”),whererelevant,tobringtheAAinlinewiththeBursaMalaysiaSecuritiesBerhadMainMarketListingRequirements,tofacilitatesomeadministrativeissuesandtoensureconsistencythroughouttheAA.
STATEMENT ACCOMPANYING NOTICE OF ANNUAL GENERAL MEETING
Details of the Director standing for re-appointment at the Thirtieth Annual General Meeting of the Company are set out in the Directors’ Profile on page 6 of the 2013 Annual Report.

5
CORPORATE INFORMATION
Board of Directors : Y. Bhg. Tan Sri William H.J. Cheng (ChairmanandManagingDirector) Y. Bhg. Tan Sri Abdul Rahman bin Mamat Cik Zainab binti Dato’ Hj. Mohamed Mr Yeow Teck Chai Mr Cheng Sin Yeng
Secretaries : Ms Chan Poh Lan Ms Lim Kwee Peng
Company No : 89194-P
Registered Office : Level 14, Office Tower No. 1 Jalan Nagasari (Off Jalan Raja Chulan) 50200 Kuala Lumpur Tel No : 03-21420155 Fax No : 03-21413448 Homepage : http://www.lion.com.my/parkson
Share Registrar : Secretarial Communications Sdn Bhd Level 13, Office Tower No. 1 Jalan Nagasari (Off Jalan Raja Chulan) 50200 Kuala Lumpur Tel Nos : 03-21420155, 03-21418411 Fax No : 03-21428409
Auditors : Ernst & Young Level 23A, Menara Milenium Jalan Damanlela Pusat Bandar Damansara 50490 Kuala Lumpur
Principal Bankers : JPMorgan Chase Bank CIMB Bank Berhad RHB Bank Berhad Industrial and Commercial Bank of China (Malaysia) Berhad
Stock Exchange Listing : Bursa Malaysia Securities Berhad (“Bursa Securities”)
Stock Name : PARKSON
Bursa Securities Stock No : 5657
Reuters Code : PRKN.KL
ISIN Code : MYL5657OO001

6
DIRECTORS’ PROFILE
Tan Sri William H.J. ChengNon-IndependentChairmanandManagingDirector
Y. Bhg. Tan Sri William H.J. Cheng, a Malaysian, aged 70, was appointed to the Board on 30 March 1989. He was appointed the Managing Director and the Chairman of the Company on 16 August 2006 and 13 November 2006 respectively.
Tan Sri William Cheng has more than 40 years of experience in the business operations of The Lion Group encompassing retail, property development, mining, oil and gas, steel, agriculture and computer.
Tan Sri William Cheng was the President of The Associated Chinese Chambers of Commerce and Industry of Malaysia (“ACCCIM”) and The Chinese Chamber of Commerce and Industry of Kuala Lumpur and Selangor (“KLSCCCI”) from 2003 to 2012. He is now a Life Honorary President of ACCCIM and an Honorary President of KLSCCCI.
Tan Sri William Cheng’s other directorships in public listed companies are as follows:
• ChairmanofLionDiversifiedHoldingsBerhadandLionForestIndustriesBerhad• ChairmanandManagingDirectorofLionCorporationBerhad
He is also the Chairman of Lion AMB Resources Berhad and ACB Resources Berhad, and a Founding Trustee of The Community Chest, a company limited by guarantee incorporated for charity purposes.
Tan Sri William Cheng has a direct shareholding of 218,439,012 ordinary shares of RM1.00 each and an indirect interest in 300,751,384 ordinary shares of RM1.00 each in the Company. By virtue of his substantial interest in the Company, he is deemed to be interested in the subsidiaries of the Company, both wholly-owned and those set out on page 165 of this Annual Report.
Tan Sri William Cheng attended all eight (8) Board Meetings of the Company held during the financial year ended 30 June 2013.
Tan Sri Abdul Rahman bin Mamat IndependentNon-ExecutiveDirector
Y. Bhg. Tan Sri Abdul Rahman bin Mamat, a Malaysian, aged 60, was appointed to the Board on 14 March 2011. He is also the Chairman of the Remuneration Committee and a member of the Audit Committee of the Company.
Tan Sri Abdul Rahman graduated with a Bachelor of Economics (Honours) degree from University Malaya, Malaysia and has an Advanced Management Programme qualification from Harvard Business School, Boston, the United States of America.
Tan Sri Abdul Rahman joined the Ministry of International Trade and Industry (“MITI”) as an Assistant Director on 18 April 1975 and served in various capacities in MITI for 35 years before retiring in December 2010 which included: (1) Deputy Trade Commissioner, Malaysian Trade Office, New York, the United States of America; (2) Director of Trade, Malaysian Trade Centre, Taipei, Taiwan; (3) Economic Counsellor/Trade Commissioner and Deputy Permanent Representative to the United Nations Economic and Social Commission (ESCAP), Malaysian Trade Office, Bangkok, Thailand; (4) Special Assistant to the Minister of International Trade and Industry, Tan Sri Rafidah binti Abdul Aziz; (5) Director, Export Promotion Bureau, Malaysia External Trade Development Corporation (MATRADE); (6) Director of Industries; (7) Senior Director, Policy and Industry, Services Division; (8) Deputy Secretary-General (Industry); and (9) in September 2006, Secretary-General of MITI.
During his tenure in MITI, he also served as MITI’s representative on the board of various companies and corporations including Malaysian Industrial Development Authority (MIDA), MATRADE, Johor Corporation, Regional Economic Development Authority (RECODA), Sarawak and Small and Medium Corporation, Malaysia.
Tan Sri Abdul Rahman has represented Malaysia in a number of international meetings, bilateral, regional and multilateral negotiations, conferences and symposiums and has also contributed towards formulating, implementing and monitoring policies and programs on international trade and industrial growth and entrepreneurship development. He is an honorary member of the ASEAN Federation of Engineering Organisations and a Malaysian Leader for the High Level Task Force on ASEAN Economic Integration.
He currently serves on the board of several private limited companies involved in manufacturing, retail and services sectors covering global logistics, petrochemical, healthcare and oil, gas and energy.
He is also a Director of Hiap Teck Venture Berhad, a public listed company.
Tan Sri Abdul Rahman attended all eight (8) Board Meetings of the Company held during the financial year ended 30 June 2013.

7
Zainab binti Dato’ Hj. MohamedIndependentNon-ExecutiveDirector
Cik Zainab binti Dato’ Hj. Mohamed, a Malaysian, aged 56, was appointed to the Board on 23 November 2012. She is also the Chairman of the Company’s Audit Committee and a member of the Nomination Committee, Remuneration Committee and Executive Share Option Scheme Committee of the Company.
Cik Zainab obtained her Diploma in Accountancy from Universiti Teknologi MARA (UiTM) in 1978 and studied at the London School of Accountancy, England for the Association of Chartered Certified Accountants qualification from 1979 to 1981. She is a Fellow Member of the Association of Chartered Certified Accountants and a Chartered Accountant with the Malaysian Institute of Accountants.
Cik Zainab has more than 30 years of experience in the audit and finance fields holding various positions in an audit firm, a commercial bank, an investment and holding company, a petroleum multinational company, a general insurance company and a solid waste management concessionaire.
Currently, she manages her own management and consultancy firm, ANZ Consultancy Services.
Cik Zainab attended all five (5) Board Meetings of the Company held during the financial year ended 30 June 2013 subsequent to her appointment.
Yeow Teck ChaiIndependentNon-ExecutiveDirector
Mr Yeow Teck Chai, a Malaysian, aged 63, was appointed to the Board on 16 August 2006. He is also the Chairman of the Nomination Committee and Executive Share Option Scheme Committee, and a member of the Audit Committee and Remuneration Committee of the Company.
Mr Yeow holds a Bachelor of Economics (Hons) degree from the University of Malaya.
Mr Yeow served the Malaysian Industrial Development Authority (“MIDA”) for 32 years and held the post of Deputy Director General prior to his retirement in August 2006. He was responsible for the promotion, coordination and development of the manufacturing and services sectors in MIDA. In 2011, Mr Yeow was appointed a council member of the Federation of Malaysian Manufacturers.
He is also a Director of Globetronics Technology Berhad, a public listed company.
Mr Yeow attended all eight (8) Board Meetings of the Company held during the financial year ended 30 June 2013.
Cheng Sin YengNon-IndependentNon-ExecutiveDirector
Mr Cheng Sin Yeng, a Malaysian, aged 61, was appointed to the Board on 29 August 2001. He is also a member of the Nomination Committee and Remuneration Committee of the Company.
Mr Cheng is a member of the Malaysian Institute of Certified Public Accountants and the Malaysian Institute of Accountants. He was attached to Coopers & Lybrand (now known as PricewaterhouseCoopers) for seven (7) years as an audit assistant. After completing his professional examination as a Certified Public Accountant, he joined the Hong Leong Group and was with its Property Division for three (3) years as an Accountant. Mr Cheng joined The Lion Group in 1982 as the Chief Accountant of Posim Berhad (now known as Lion Forest Industries Berhad). He was subsequently designated the Senior Chief Accountant of the Property & Construction Division and thereafter as the General Manager - Accounts based in The Lion Group Finance Division until his retirement in August 2013.
Mr Cheng attended all eight (8) Board Meetings of the Company held during the financial year ended 30 June 2013.
Mr Cheng who retires at the forthcoming Annual General Meeting of the Company, does not seek re-election as Director of the Company.
Save as disclosed above, none of the Directors has (i) any interest in shares in the Company or its subsidiaries; (ii) any family relationship with any Director and/or major shareholder of the Company; (iii) any conflict of interests with the Company; and (iv) any conviction for offences within the past 10 years.

8
CORPORATE GOVERNANCE STATEMENT
The Board of Directors (“Board”) recognises the importance of practising and maintaining sound corporate governance to direct the businesses and practices of the Group towards enhancing business prosperity, sustainability and on-going value creation for its stakeholders. The Board is fully committed in ensuring that a high standard of corporate governance is practised and maintained throughout the Group as the underlying principles in discharging its roles and responsibilities.
The Board is pleased to present below the Governance Framework and how the Group has applied the guiding principles of good governance and the extent to which it has complied with the Principles and Recommendations set out in the Malaysian Code on Corporate Governance 2012 (“MCCG”). The principles and recommended best practices have been applied consistently throughout the financial year ended 30 June 2013 except where otherwise rationalised herein. The Board has also taken into account the requirements issued by the Bursa Malaysia Securities Berhad (“Bursa Securities”) – Guidelines for Directors of Listed Issuers on the Statement on Risk Management & Internal Control.
Governance Framework
1. THE BOARD OF DIRECTORS (“BOARD”)
Roles and Responsibilities
The Board is entrusted with the responsibility in leading and directing the Group towards achieving its strategic goals and realising long-term shareholders’ values. The Board retains full and effective control of the Group’s strategic plans, overseeing the conduct of the Group’s businesses, implementing, reviewing and maintaining an appropriate system of risk, control and compliance management and ensuring the adequacy and integrity of the Group’s system of internal control. The Board is also responsible in ensuring financial integrity, setting the Group’s risk appetite, reviewing and approving material contracts or transactions including related party transactions, capital financing and succession planning and for the implementation of shareholders’ communications.
The Board meets on a quarterly basis, with additional meetings convened as and when necessary. During the financial year ended 30 June 2013, eight (8) Board Meetings were held and all the Directors attended all the Board Meetings held during the financial year. A brief profile of each member of the Board are set out in the Directors’ Profile section of this Annual Report.
Board Charter
The Board has established a Board Charter which is available on the corporate website. The Board Charter clearly sets out the principal role of the Board, the demarcation of the roles, functions, responsibilities and powers of the Board, the Board Committees and the management. It also defines the specific accountabilities and responsibilities of the Board to enhance coordination, communication and facilitation between the management and the Board and ultimately, to reinforce the overall accountability of both the Board and the management towards the Company and the stakeholders as well as to serve as reference criteria for the Board in the assessment of its own performance and of its individual Directors.
PARKSON HOLDINGS BERHAD (89194-P) (Incorporated in Malaysia) CORPORATE GOVERNANCE STATEMENT The Board of Directors (“Board”) recognises the importance of practising and maintaining sound corporate governance to direct the businesses and practices of the Group towards enhancing business prosperity, sustainability and on-going value creation for its stakeholders. The Board is fully committed in ensuring that a high standard of corporate governance is practised and maintained throughout the Group as the underlying principles in discharging its roles and responsibilities. The Board is pleased to present below the Governance Framework and how the Group has applied the guiding principles of good governance and the extent to which it has complied with the Principles and Recommendations set out in the Malaysian Code on Corporate Governance 2012 (“MCCG”). The principles and recommended best practices have been applied consistently throughout the financial year ended 30 June 2013 except where otherwise rationalised herein. The Board has also taken into account the requirements issued by the Bursa Malaysia Securities Berhad (“Bursa Securities”) – Guidelines for Directors of Listed Issuers on the Statement on Risk Management & Internal Control. Governance Framework
STAKEHOLDERS
Board of Directors
Nomination Committee Audit Committee Remuneration Committee
ManagementKey Operating Companies
1
9
Directors’ Code of Ethics
The Board in discharging its functions has observed the Code of Ethics for Company Directors issued by the Companies Commission of Malaysia, the provisions of the Companies Act, 1965 and the principles of the MCCG.
The Group has put in place a Code of Ethics for all employees of the Group, including the Whistleblower Policy of the Group and such codes, policies and ethics are briefed to all employees and accessible for reference within the Group.
Board Composition, Independence and Diversity Balance
The Board comprises five (5) Directors, four (4) of whom are non-executive. The current Board composition complies with the Bursa Securities Main Market Listing Requirements (“Listing Requirements”). The broad range of experience, skills and knowledge of the Directors effectively facilitate the discharge of the Board’s stewardship.
The Group Chairman also assumes the position of the Group’s Managing Director. He brings with him a wealth of over 40 years of experience in the business operations of the Group and possesses the calibre to ensure that policies and strategies approved by the Board are effectively implemented. In view of the vast experience of the Group Chairman/Managing Director, the Board considers the departure from the recommended practice of separating the functions as appropriate under the present circumstances.
In promoting diversity, gender and opportunities, the Board in its appointments and composition pays due recognition and weightage to the skills, experience and business acumen of the Directors. The Board reviews the appropriate mix of skills, experience and knowledge required of its members, in the context of the needs of the Group’s businesses and strategies. The Board reviews its composition and size from time to time for appropriateness and the fulfillment of the gender diversity representation. The Board acknowledges the recommendation of MCCG pertaining to the establishment of boardroom gender diversity policy. The Board currently has a female Director.
Represented on the Board are three (3) independent non-executive Directors who bring their independent advice,
views and judgement to bear on the decision-making process of the Group to ensure that a balanced and unbiased deliberation process is in place to safeguard the interests of other stakeholders. As and when a potential conflict of interest arises, it is mandatory practice for the Directors concerned to declare their interests and abstain from the decision-making process.
In line with the MCCG, the Board has adopted a nine-year policy for independent Directors. The tenure of an independent Director should not exceed a cumulative term of nine (9) years. Upon completion of the nine years, an independent Director may continue to serve on the Board subject to the Director’s re-designation as a non-independent Director. In the event such Director is to be retained as an independent Director, the Board must first justify and obtain shareholders’ approval.
The Board, assisted by the Nomination Committee assessed the independent Directors on an annual basis with a view to ensuring that the independent Directors bring independent and objective judgement to the Board deliberations. The Board with the assistance of the Nomination Committee also assesses the effectiveness of the Board as a whole, the Board Committees and the contribution of each individual Director, including independent Directors, on an annual basis. All assessments and evaluation carried out by the Nomination Committee in discharging its duties were also properly documented.
In respect of the assessment for the financial year ended 30 June 2013, the Board was satisfied that the Board and the Board Committees have discharged their duties and responsibilities effectively. The Board was also satisfied that the Board composition in term of size, the balance between executive, non-executive and independent Directors and mix of skills and experience was adequate.
10
Board Committees
The Board delegates certain functions to several committees, namely the Audit Committee, Nomination Committee, and Remuneration Committee to support and assist in discharging its fiduciary duties and responsibilities. The respective committees report to the Board on matters considered and their recommendations thereon. The ultimate responsibility for the final decision on all matters, however, lies with the Board.
The Board may form other committees delegated with specific authorities to act on its behalf whenever required. These committees operate under approved terms of reference or guidelines set out by the Board.
Supply of Information
The Board, as a whole and its members in their individual capacities, has unrestricted access to complete information on a timely basis in the form and quality necessary for the discharge of their duties and responsibilities. Prior to each Board meeting, all Board members are furnished with the relevant documents and sufficient information to enable them to obtain a comprehensive understanding of the issues to be deliberated upon. Senior management of the Group is also invited to attend Board meetings to provide their professional views, advice and explanation on specific items on the agenda in order for the Board to arrive at an informed decision.
Besides direct interactions with the management, external independent professional advisers are also made available at the Company’s expense to render their independent views and advice to the Board, whenever deemed necessary and under appropriate circumstances.
Company Secretaries
The Company Secretaries advise the Board on its duties and obligations, and the appropriate requirements, disclosures and procedures to be complied with in relation thereto. The Company Secretaries are also responsible in ensuring that Board meeting procedures are followed and that applicable rules and regulations are complied with.
The appointment and removal of Company Secretaries are subject to the approval of the Board.
Appointments to the Board
The Nomination Committee is responsible for identifying, evaluating and nominating suitable candidates with the necessary mix of skills, experience and competencies to be appointed to the Board and Board Committees to ensure the effectiveness of the Board. Newly appointed Directors will be given a familiarisation programme to familiarise themselves with the Group’s operations to better understand the Group’s businesses.
The process of assessing the Directors is an on-going responsibility of the Nomination Committee and the Board which is properly documented.
The members and terms of reference of the Nomination Committee are presented on page 21 of this Annual Report.
Directors’ Remuneration
The Company has adopted the objective as recommended by the MCCG in determining the remuneration of executive Directors so as to ensure that it attracts and retains the Directors needed to manage the Company and the Group effectively. Directors do not participate in decisions regarding their own remuneration. The responsibilities for developing a formal and transparent remuneration policy and determining the remuneration packages of executive Directors lie with the Remuneration Committee. Nevertheless, it is the ultimate responsibility of the Board to approve the remuneration of these Directors. The members and terms of reference of the Remuneration Committee are presented on page 21 of this Annual Report.
11
Directors’ fees are recommended by the Board for the approval by shareholders of the Company at the annual general meeting.
For confidentiality, the details of the Directors’ remuneration are not disclosed for each individual Director. The transparency and accountability aspects of corporate governance applicable to Directors’ remuneration recommended by the best practices of the MCCG are deemed appropriately served by the disclosures in the ensuing paragraphs.
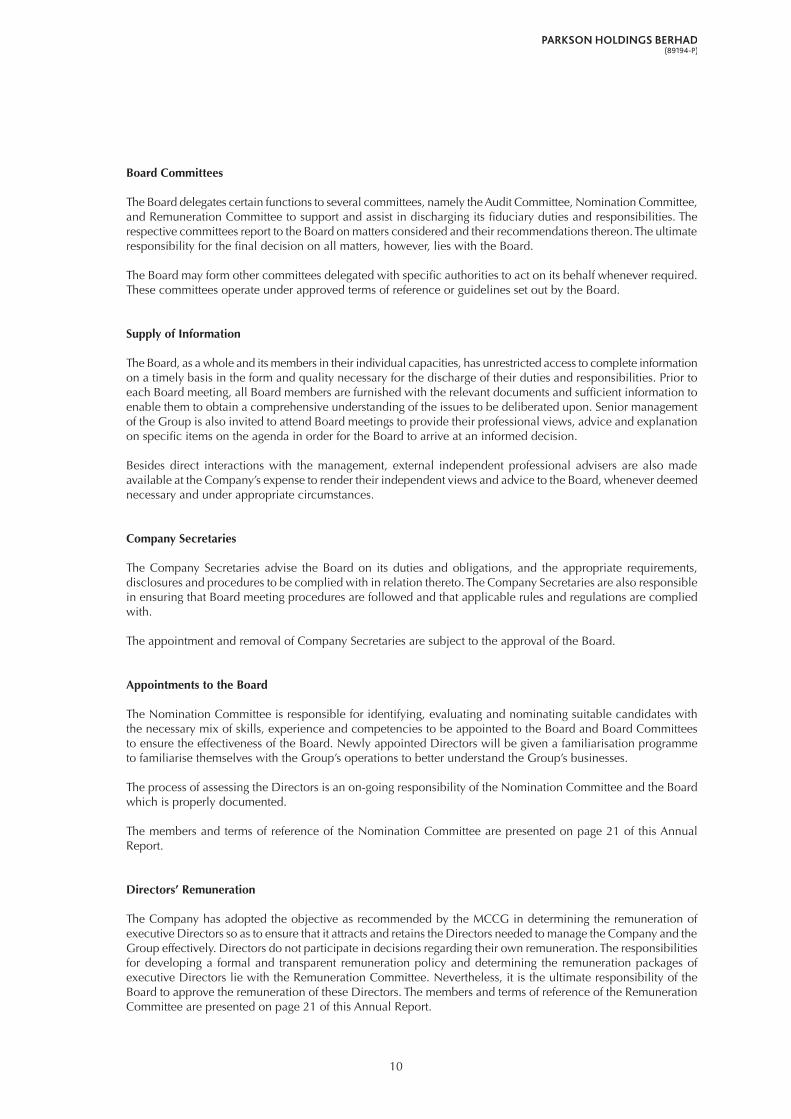
The aggregate remuneration of Directors who served during the financial year ended 30 June 2013 are categorised as follows:
Salaries & Other Fees Emoluments Total RM’000 RM’000 RM’000
Executive Director 266 463 729Non-executive Directors* 165 – 165
431 463 894
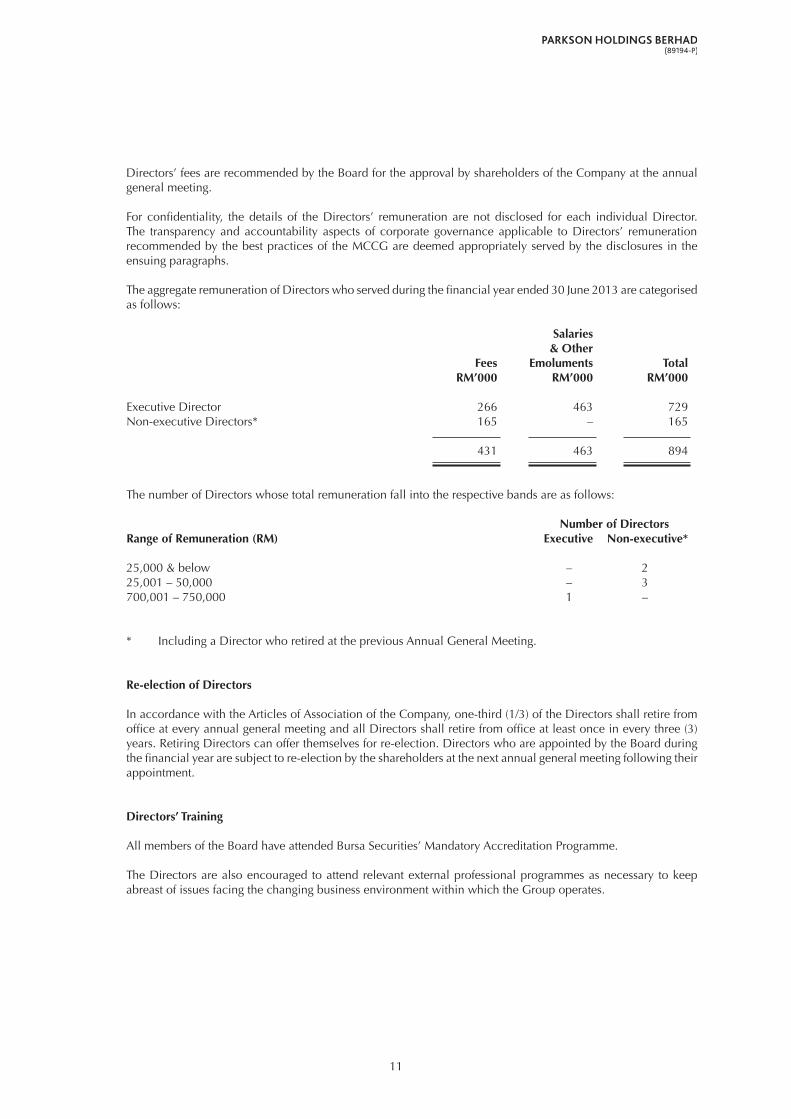
The number of Directors whose total remuneration fall into the respective bands are as follows:
Number of DirectorsRange of Remuneration (RM) Executive Non-executive*
25,000 & below – 225,001 – 50,000 – 3700,001 – 750,000 1 –
* Including a Director who retired at the previous Annual General Meeting.
Re-election of Directors
In accordance with the Articles of Association of the Company, one-third (1/3) of the Directors shall retire from office at every annual general meeting and all Directors shall retire from office at least once in every three (3) years. Retiring Directors can offer themselves for re-election. Directors who are appointed by the Board during the financial year are subject to re-election by the shareholders at the next annual general meeting following their appointment.
Directors’ Training
All members of the Board have attended Bursa Securities’ Mandatory Accreditation Programme.
The Directors are also encouraged to attend relevant external professional programmes as necessary to keep abreast of issues facing the changing business environment within which the Group operates.
12
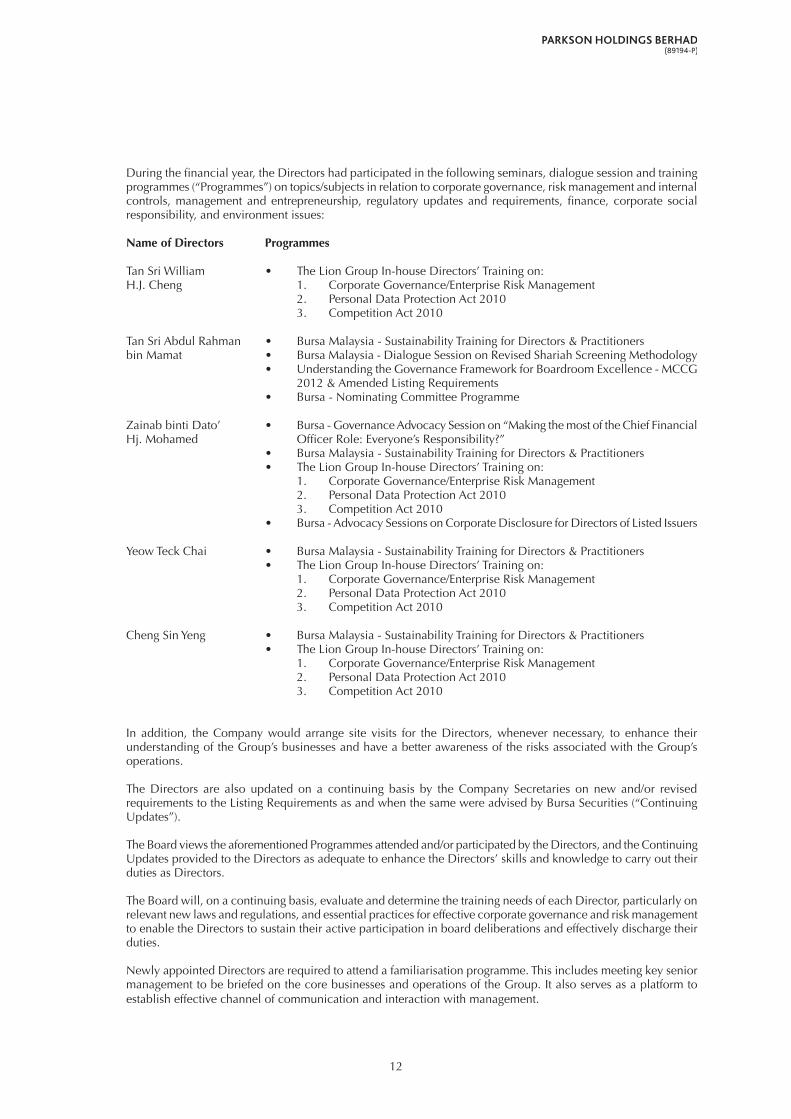
During the financial year, the Directors had participated in the following seminars, dialogue session and training programmes (“Programmes”) on topics/subjects in relation to corporate governance, risk management and internal controls, management and entrepreneurship, regulatory updates and requirements, finance, corporate social responsibility, and environment issues:
Name of Directors Programmes
Tan Sri WilliamH.J. Cheng
• TheLionGroupIn-houseDirectors’Trainingon:1. Corporate Governance/Enterprise Risk Management2. Personal Data Protection Act 20103. Competition Act 2010
Tan Sri Abdul Rahmanbin Mamat
• BursaMalaysia-SustainabilityTrainingforDirectors&Practitioners• BursaMalaysia-DialogueSessiononRevisedShariahScreeningMethodology• UnderstandingtheGovernanceFrameworkforBoardroomExcellence-MCCG
2012 & Amended Listing Requirements• Bursa-NominatingCommitteeProgramme
Zainab binti Dato’Hj. Mohamed
• Bursa-GovernanceAdvocacySessionon“MakingthemostoftheChiefFinancialOfficer Role: Everyone’s Responsibility?”
• BursaMalaysia-SustainabilityTrainingforDirectors&Practitioners• TheLionGroupIn-houseDirectors’Trainingon:
1. Corporate Governance/Enterprise Risk Management2. Personal Data Protection Act 20103. Competition Act 2010
• Bursa-AdvocacySessionsonCorporateDisclosureforDirectorsofListedIssuers
Yeow Teck Chai • BursaMalaysia-SustainabilityTrainingforDirectors&Practitioners• TheLionGroupIn-houseDirectors’Trainingon:
1. Corporate Governance/Enterprise Risk Management2. Personal Data Protection Act 20103. Competition Act 2010
Cheng Sin Yeng • BursaMalaysia-SustainabilityTrainingforDirectors&Practitioners• TheLionGroupIn-houseDirectors’Trainingon:
1. Corporate Governance/Enterprise Risk Management2. Personal Data Protection Act 20103. Competition Act 2010
In addition, the Company would arrange site visits for the Directors, whenever necessary, to enhance their understanding of the Group’s businesses and have a better awareness of the risks associated with the Group’s operations.
The Directors are also updated on a continuing basis by the Company Secretaries on new and/or revised requirements to the Listing Requirements as and when the same were advised by Bursa Securities (“Continuing Updates”).
The Board views the aforementioned Programmes attended and/or participated by the Directors, and the Continuing Updates provided to the Directors as adequate to enhance the Directors’ skills and knowledge to carry out their duties as Directors.
The Board will, on a continuing basis, evaluate and determine the training needs of each Director, particularly on relevant new laws and regulations, and essential practices for effective corporate governance and risk management to enable the Directors to sustain their active participation in board deliberations and effectively discharge their duties.
Newly appointed Directors are required to attend a familiarisation programme. This includes meeting key senior management to be briefed on the core businesses and operations of the Group. It also serves as a platform to establish effective channel of communication and interaction with management.

13
2. RELATIONS WITH SHAREHOLDERS AND INVESTORS
The Board has oversight over the implementation and maintenance of the required effective communications and engagements with shareholders.
The annual general meeting is the principal forum for dialogue with shareholders. Shareholders are provided with an opportunity to participate in the question and answer session at which shareholders may raise questions regarding the proposed resolutions at the meeting as well as on matters relating to the Group’s businesses and affairs. The Chairman and the Board members are in attendance to respond to shareholders’ queries.
The Group also values dialogues with institutional investors, fund managers and analysts. The Group has been practising open discussions with investors/fund managers/analysts upon request. In this regard, information is disseminated with strict adherence to the disclosure requirements of Bursa Securities.
The Company’s homepage at www.lion.com.my/parkson provides easy access to corporate information pertaining to the Group and its activities.
The Board has identified the Company Secretaries to whom concerns may be conveyed and who would bring the same to the attention of the Board.
3. SUSTAINABILITY
The Board in discharging its governance role should be guided to ensure that the Group’s and the Company’s business strategies and businesses promote sustainability. This includes due attention and consideration of the Environmental, Social and Governance aspects of the businesses and operations which underpin sustainability. The sustainability activities carried out by the Group are set out in the Corporate Social Responsibility section of the Chairman’s Statement on pages 28 and 29 of this Annual Report.
4. ACCOUNTABILITY AND AUDIT
Financial Reporting
The Board aims to present a balanced and clear assessment of the Group’s position, financial performance and future prospects to the Company’s stakeholders through the annual financial statements, quarterly financial reports and corporate announcements which are in accordance with the Listing Requirements. The Board is also responsible in ensuring that the accounting records of the Group are properly kept. The Board discusses and reviews the recommendations proposed by the Audit Committee prior to the adoption of the financial statements of the Group and of the Company, including timely and quality disclosure through appropriate corporate disclosure policies and procedures adopted.
The Audit Committee supports the Board in its responsibility to oversee the financial reporting and the effectiveness of the internal controls of the Group. The Audit Committee comprises three (3) Directors, all of whom are independent. The terms of reference and activities of the Audit Committee are set out in the Audit Committee Report on pages 17 to 20 of this Annual Report.
Directors’ Responsibility in Financial Reporting
The Board is satisfied that for the financial year ended 30 June 2013, the financial statements presented give a true and fair view of the state of affairs, results and cash flows of the Group and of the Company. In preparing the financial statements, the Group has applied, on a consistent basis, the applicable approved accounting standards and the provisions of the Companies Act, 1965.

14
Internal Control
The Board has overall responsibility in maintaining a sound internal control system for the Group to achieve its objectives within an acceptable risk profile as well as safeguarding shareholders’ investment and the Group’s assets. An overview of the state of internal control within the Group is set out in the Statement on Risk Management and Internal Control on pages 15 and 16 of this Annual Report.
Relationship with the External Auditors
The Board has established a formal and transparent relationship with the external auditors through the Audit Committee. The Audit Committee assesses the suitability and independence of external auditors and recommends the appointment of the external auditors and their remuneration to the Board. The appointment of the external auditors is subject to the approval of shareholders at the annual general meeting whilst their remuneration is determined by the Board. The external auditors meet with the Audit Committee at least twice a year and attend the annual general meeting of the Company.
5. RECOGNISE AND MANAGE RISKS
Risk Management Framework
The Board regards risk management as an integral part of business operations. A Corporate Risk Management System implementing an Enterprise Wide Risk Management Framework (CRMS-ERM) was developed, enhanced and documented. The CRMS-ERM Manual sets out in a comprehensive manner the process adopted by the Group towards risk identification, evaluation, treatment, risks appetite setting, control, tracking and monitoring of strategic, business, financial and operational risks. The Risk Management Committee plays a pivotal role in overseeing the implementation of the risk management framework, periodically reviewing the risk management scorecards and reporting the status to the Audit Committee. The Risk Management Committee also assesses all material and key risks associated with the Group’s businesses and operations as well as corporate proposals.
Internal Audit Function
The Board has established an internal audit function within the Group. The internal audit function is led by a Chief Internal Auditor who reports directly to the Audit Committee. The internal auditors attend all meetings of the Audit Committee and the detailed internal audit function is set out in the Audit Committee Report on pages 17 to 20 of this Annual Report.
Compliance Function
The Board has approved a Compliance Framework which lays down mechanisms and tools to ensure consistency and efficiency in identifying, managing and mitigating compliance risks within the Group. Reviews are conducted by the Group Compliance Function to assess the degree of compliance with statutory, regulatory and codes of ethics/standards requirements and internal standard operating procedures aligned to the business objectives. The Audit Committee is provided with compliance reports at agreed intervals to facilitate the Board with a holistic and overview of all compliance matters.
15
STATEMENT ON RISK MANAGEMENT AND INTERNAL CONTROL
INTRODUCTION
The Board of Directors (“Board”) acknowledges the importance of maintaining a sound system of internal control to safeguard shareholders’ investments and the Group’s assets. Guided by the StatementonRiskManagement&InternalControl:GuidelinesforDirectorsofListedIssuers, the Board is pleased to present the Statement on Risk Management and Internal Control of the Group (excluding associated companies, as the Board does not have control over their operations) pursuant to the Bursa Malaysia Securities Berhad Main Market Listing Requirements.
BOARD RESPONSIBILITY
The Board affirms its overall responsibility for the Group’s system of internal control and risk management, and for reviewing the adequacy and integrity of these systems. However, in view of the inherent limitations in any system, such system of internal control is designed to manage rather than to eliminate risks that may impede the achievement of the Group’s objectives. The system can therefore only provide reasonable and not absolute assurance against material misstatements, frauds or losses. The system of internal control covers risk management, financial, organisational, operational and compliance controls.
The Board confirms that there is an on-going process of identifying, evaluating and managing significant risks by the management. The process has been put in place for the year and is reviewed periodically by the Board through its Audit Committee’s activities detailed in the Audit Committee Report.
The Group’s risk management and internal control system is operating adequately and effectively, in all material aspects, based on the risk management model and structure established by the Group.
RISK MANAGEMENT
The Board regards risk management as an integral part of business operations. A Corporate Risk Management System encompassing an Enterprise Wide Risk Management Framework (CRMS-ERM) was developed and enhanced to set out in a comprehensive manner the process adopted by the Group towards risk identification, evaluation, control and monitoring as well as in determining the Group’s risks appetite. The Risk Management Committee continues to play a pivotal role in overseeing the implementation of the risk management framework, periodically reviewing the risk management processes and ensuring that on-going measures taken were adequate to manage, address or mitigate the identified risks and reporting the status to the Audit Committee.
CONTROL AND MONITORING PROCESS
The Board is committed to maintaining a strong internal control structure for the proper conduct of the Group’s business operations. The key elements include:
• Anoperationalstructureandorganisationalchartwithdefinedlinesofresponsibilityanddelegationofauthoritytogether with a hierarchical structure of reporting and accountability
• Internalpoliciesandstandardoperatingproceduresthatareregularlyupdatedtoreflectchangingrisksorresolveoperational deficiencies including to clearly define limits of authority
• Adetailedbudgetingprocesswhichrequiresallbusinessunitstopreparebudgetandbusinessplanonanannualbasis
• ReviewofkeybusinessvariablesandthemonitoringoftheachievementsoftheGroup’sperformanceonaquarterlybasis by the Board and the Audit Committee
• ConfirmationoftheeffectivenessofinternalcontrolandriskassessmentprocessbytheGeneralManagerorotherSenior Management staff of key operating companies by way of completion of the Risk Management and Internal Control-Self-Assessment Questionnaire (RMIC-SAQ) on an annual basis

16
• AcomplianceprogrammereviewedbytheAuditCommitteeonanannualbasisaddressingallthecriticalandhigh risk compliance areas of statutory, regulatory, codes and internal ethics/standards/policies and procedures. Periodically reported by the compliance function to the Compliance Committee to monitor and address on-going changes and implementations in the legislative and regulatory requirements affecting the Group
• Periodicexaminationofbusinessprocessesandsystemofinternalcontrolbytheinternalauditfunctionwhichregularly submits its reports to the Audit Committee
• Adequate insuranceandphysical safeguardsonmajorassets are inplace toensureassetsof theGrouparesufficiently covered
• ACodeofEthicsforallemployeeswhichdefinestheethicalstandardsandconductatwork
• AWhistleblowerPolicyestablishedundertheHumanResourcePolicyManualwhichdefinestherightsofinformantsand also the protections accorded them. The channels of escalation are also documented to encourage and enable concerned parties to report any wrongdoings so that they can be properly addressed
• ACompetitionPolicyandRiskAssessmentaddressingtheCompetitionAct2010andthePersonalDataProtectionAct 2010, and training programmes in place under the compliance function to address these recent legislations requirements impacting the Group’s businesses and operations
• ACrisisManagementCommunicationPolicyandprocessestablishedundertheCorporateCommunicationtoguide the handling of external communications in the events of crisis/disasters
CONCLUSION
The Board is of the view that the system of risk management and internal control in place is generally satisfactory and sufficient to safeguard all stakeholders’ interest.

17
AUDIT COMMITTEE REPORT
COMPOSITION As at the date of this Annual Report, the composition of the Audit Committee is as follows:
• Members
Cik Zainab binti Dato’ Hj. Mohamed (elected as the Chairman on 28 November 2012)(Chairman,IndependentNon-ExecutiveDirector)
Y. Bhg. Tan Sri Abdul Rahman bin Mamat(IndependentNon-ExecutiveDirector)
Mr Yeow Teck Chai(IndependentNon-ExecutiveDirector)
Dr Folk Jee Yoong who was the Chairman of the Audit Committee, ceased to be the Chairman and a member of the Audit Committee upon his retirement as a member of the Board on 21 November 2012.
The composition of the Audit Committee complies with Chapter 15 of the Bursa Malaysia Securities Berhad (“Bursa Securities”) Main Market Listing Requirements (“Listing Requirements”).
• Secretaries
The Secretaries of Parkson Holdings Berhad, Ms Chan Poh Lan and Ms Lim Kwee Peng, are also Secretaries of the Audit Committee.
• Membership
The Audit Committee shall be appointed by the Board from amongst their number and shall consist of not less than three (3) members, all of whom shall be non-executive Directors with a majority of them being independent Directors. The composition of the Audit Committee shall fulfill the requirements as prescribed in the Listing Requirements. The members of the Audit Committee shall elect a chairman among themselves who is an independent Director.
• MeetingsandMinutes
The Audit Committee shall meet at least four (4) times annually and the Chief Internal Auditor and the Chief Financial Officer shall normally be invited to attend the meetings. A majority of independent Directors present shall form a quorum. The Audit Committee shall meet with the external auditors without the executive Board members being present at least twice a year.
Minutes of each meeting shall be kept and distributed to each member of the Audit Committee and the Board. The Chairman of the Audit Committee shall report on each meeting to the Board.
TERMS OF REFERENCE
• Responsibilities
(a) Assessing the risks and control environment.(b) Overseeing financial reporting.(c) Evaluating the internal and external audit process.(d) Reviewing conflict of interest situations and related party transactions.
• Authority
In conducting its duties and responsibilities, the Audit Committee shall have:
(a) the authority to investigate any matter within its terms of reference. (b) full and unrestricted access to any information pertaining to the Company and the Group including the
right to invite other Directors and/or Management of the Company to attend any particular Audit Committee meeting to discuss specific issues.
(c) direct communication channels with the external and internal auditors.(d) the right to obtain independent professional or other advice as necessary.
18
• Duties
The duties of the Audit Committee are:
(a) To consider the appointment, resignation and dismissal of external auditors, their audit fee, review their suitability, competence, independence and non-audit engagement services.
(b) To discuss with the external auditors, prior to the commencement of audit, the nature and scope of audit, obtain their written assurance of independence and to ensure co-ordination of audit where more than one audit firm is involved.
(c) To review and assess the financial statements prior to the approval of the Board, ensuring:
- going concern assumption- compliance with accounting standards, timeliness disclosure and regulatory compliance requirements- changes in accounting policies and practices and ensuring a true and fair view of the Group’s and
the Company’s financial position and performance - significant issues arising from audit- understanding of Management’s representations
(d) To discuss problems and reservations arising from the interim and final audits, and any matter the auditors may wish to discuss, and to discuss with the Independent Non-Executive Directors in private (excluding the attendance of other Directors and Management/Executive of the Company) arising from the above matters.
(e) To review the external auditors’ management letter and management’s response thereto.
(f) To establish the following with the internal audit function:
- review the adequacy of the scope, functions, competency, performances and resources requirements of the internal audit function and that it has the necessary authority and independence to carry out its work
- review internal audit programme- ensure co-ordination of external audit with internal audit- consider the major findings of internal audit reviews/investigations and management’s response, and
ensure that appropriate actions are taken on the recommendations of the internal audit function
(g) To review any related party transaction and conflict of interests situation that may arise within the Company and the Group.
(h) To consider the appointment of independent advisers for corporate proposals involving related parties.
(i) To assess the quality and effectiveness of the system of internal control and efficiency of operations, and to review the risk policy and implementation of the risk management framework. Continually, reviewing and monitoring the effectiveness of control systems and sound risk management.
(j) To promptly report to Bursa Securities on any matter where the Audit Committee is of the view that the matter reported by it to the Board has not been satisfactorily resolved resulting in a breach of the Listing Requirements.
(k) To perform any other such function as may be directed by the Board.
ACTIVITIES DURING THE FINANCIAL YEAR
During the financial year under review, eight (8) Audit Committee Meetings were held. Whilst Cik Zainab binti Dato’ Hj. Mohamed attended all the five (5) Meetings held subsequent to her appointment as a member of the Audit Committee, Y. Bhg. Tan Sri Abdul Rahman bin Mamat and Mr Yeow Teck Chai had full attendance for all the eight (8) Meetings held in the financial year.
The Audit Committee carried out its duties in accordance with its Terms of Reference during the year.

19
The main activities undertaken by the Audit Committee during the year were as follows:
• FinancialResults
(a) Reviewed the interim unaudited financial statements of the Group prior to recommending them for approval by the Board.
(b) Reviewed the annual financial statements of the Group prior to submission to the Board for its consideration and approval focusing particularly on changes in or implementation of major accounting policies, significant and unusual events and compliance with applicable accounting standards approved by the Malaysian Accounting Standards Board (“MASB”) and other legal requirements.
• InternalAudit
(a) Reviewed the annual audit plan to ensure adequate scope and coverage on the activities of the Group, taking into consideration the assessment of key risk areas.
(b) Reviewed the audit programmes, resource requirements and skill levels of the internal auditors for the year and assessed the performance of the internal audit function.
(c) Reviewed the internal audit reports, audit recommendations made and management’s response to these recommendations and actions taken to improve the system of internal control and procedures.
(d) Monitored the implementation of the audit recommendations to ensure that all key risks and controls have been addressed.
(e) Reviewed the Risk Management and Internal Control – Self-Assessment ratings submitted by the respective operations management.
• ExternalAudit
(a) Reviewed with external auditors the audit planning memorandum covering the audit objectives and approach, audit plan, key audit areas and relevant technical pronouncements and accounting standards issued by MASB.
(b) Reviewed with external auditors the results of the audit and the audit report in particular, accounting issues and significant audit adjustments arising from the external audit.
(c) Reviewed with external auditors the memorandum of comments and recommendations arising from their study and evaluation of the system of internal and accounting controls together with management’s response to the findings of the external auditors.
(d) Evaluated the performance of the external auditors and made recommendations to the Board on their appointment and remuneration.
(e) Convened meetings with the external auditors without executive Board members and management being present to discuss issues arising from their review.
• RiskManagement
Reviewed the Strategic Corporate Risk Management Scorecard of key operations and the mitigating controls to address identified risks.
• RelatedPartyTransactions
Reviewed related party transactions entered into by the Group. Reviewed recurrent related party transactions of a revenue or trading nature on a quarterly basis for compliance under the Shareholders’ Mandate.
• MaterialTransactions
Reviewed material transactions entered into by the Group.

20
INTERNAL AUDIT FUNCTION
The internal audit function is undertaken by the Group Management Audit Department (“GMA Department”). Its principal activity is to perform regular and systematic reviews of the system of internal control so as to provide reasonable assurance that such system continues to operate satisfactorily and effectively.
The purpose, authority and responsibility of the internal audit function as well as the nature of the assurance activities provided by the function are articulated in the Internal Audit Charter.
In discharging its function, the GMA Department adopts the InternationalStandardsfortheProfessionalPracticeofInternalAuditing as well as established auditing guidelines to enhance its competency and proficiency.
A risk-based audit plan is tabled to the Audit Committee for approval on an annual basis. The audit plan covers key operational and financial activities that are significant to the overall performance of the Group and is developed to ensure adequate coverage on a regular basis. Key risk areas are continuously identified and prioritised to ascertain the scope of the audit activities through the adoption by the operation management of the Risk Management and Internal Control – Self-Assessment Questionnaire and the Strategic Corporate Risk Management Scorecard.
During the financial year, the internal auditors had conducted independent reviews and evaluated risk exposures relating to the Group’s governance, operations and information system as follows:
• Reliabilityandintegrityoffinancialandoperationalinformation• Effectivenessandefficiencyofoperations• Safeguardingofassets• Compliancewithsetpoliciesandprocedures• Identificationofopportunitiestoimprovetheoperationsandprocesses• Investigationsandspecialauditreviews
The internal auditors also established follow-up review to monitor and to ensure that internal audit recommendations are effectively implemented.
The internal audit activities have been carried out according to the internal audit plan approved by the Audit Committee for the financial year.
The total cost incurred in managing the internal audit function of the Group for the financial year was RM277,000.

21
NOMINATION COMMITTEE
REMUNERATION COMMITTEE
Chairman : Mr Yeow Teck Chai (IndependentNon-ExecutiveDirector)
Members : Mr Cheng Sin Yeng (Non-IndependentNon-ExecutiveDirector)
Cik Zainab binti Dato’ Hj. Mohamed (IndependentNon-ExecutiveDirector)
Terms of Reference : • TorecommendtotheBoard,candidatesfordirectorshipsin Parkson Holdings Berhad
• Toconsider,inmakingitsrecommendations,candidatesfor directorships proposed by the Chief Executive Officer and, within the bounds of practicability, by any other senior executive or any Director or shareholder
• TorecommendtotheBoard,DirectorstofilltheseatsonBoard Committees
• ToassisttheBoardinreviewingonanannualbasis,therequired mix of skills and experience and other qualities, including core competencies which non-executive Directors should bring to the Board
• Toassess,onanannualbasis, theeffectivenessof theBoard as a whole, the committees of the Board and the contribution of each individual Director, based on the process and procedure laid out by the Board
Chairman : Tan Sri Abdul Rahman bin Mamat (IndependentNon-ExecutiveDirector)
Members : Mr Yeow Teck Chai (IndependentNon-ExecutiveDirector)
Mr Cheng Sin Yeng (Non-IndependentNon-ExecutiveDirector)
Cik Zainab binti Dato’ Hj. Mohamed (IndependentNon-ExecutiveDirector)
Terms of Reference : • To recommend to theBoard, the remunerationof theexecutive Directors in all its forms, drawing from outside advice as necessary
• Tocarryoutotherresponsibilities,functionsorassignmentsas may be defined by the Board from time to time

22
5 YEARS GROUP FINANCIAL HIGHLIGHTS
Financial years ended 30 June 2009 2010 2011 2012 2013
Gross sales proceeds (RM’000) 7,844,181 8,617,870 9,493,726 11,196,311 11,571,141
Revenue (RM’000) 2,583,705 2,722,256 2,925,082 3,422,858 3,502,523
Profit before tax (RM’000) 939,033 704,173 805,267 887,663 618,895
Profit after tax (RM’000) 775,433 533,598 606,622 668,712 436,442
Net profit attributable to owners of the parent (RM’000) 542,687 285,128 348,404 380,076 239,708
Total assets (RM’000) 6,526,179 6,738,500 7,270,943 7,786,347 8,585,842
Net assets (RM’000) 1,749,581 1,882,680 2,236,090 2,686,088 2,780,664
Total borrowings (RM’000) 2,107,127 2,024,013 1,950,361 1,260,791 1,579,689
Earnings per share (Sen) 53.3 28.0 32.3 34.9 22.1
Net assets per share (Sen) 171 183 205 248 257
Dividends (Paid and Proposed):
• Cashdividend: - Rate (Sen) 5.0 6.0 15.0 16.0 18.0 - Amount (net of tax) (RM’000) 50,727 64,803 162,398 173,918 195,141
• Sharedividend (No.ofshares) 1for100 1for100 – – –
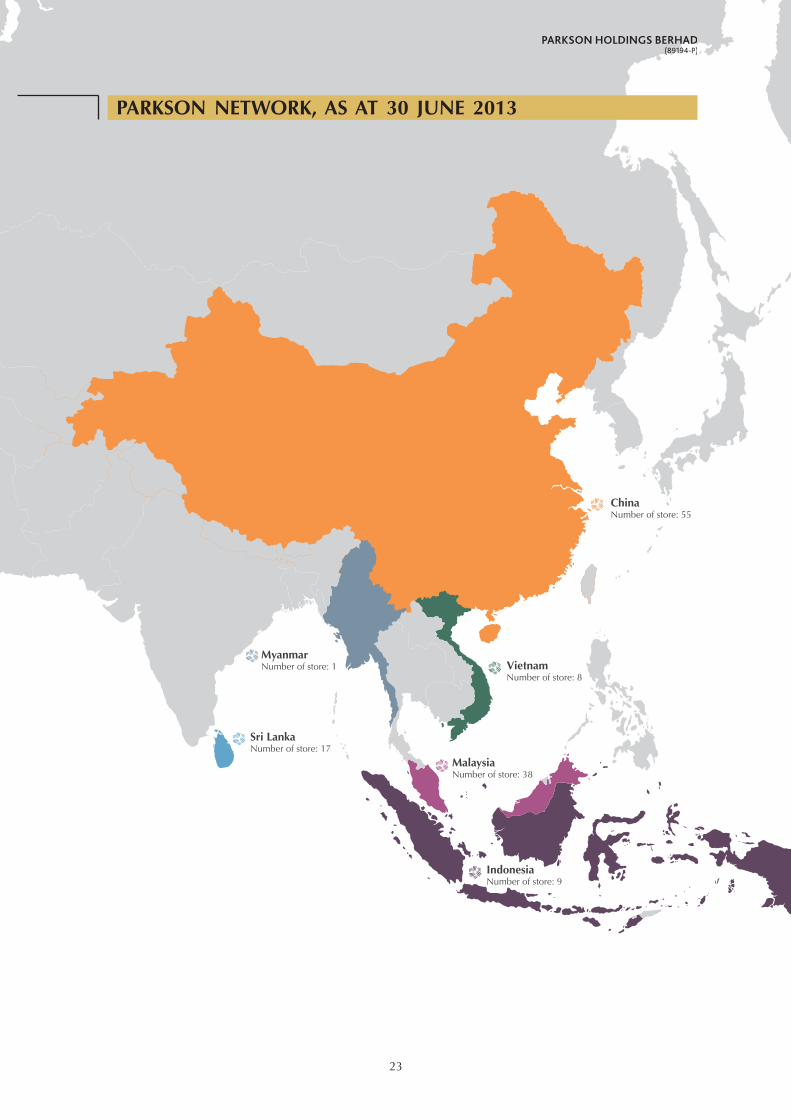
MyanmarNumber of store: 1
Sri LankaNumber of store: 17
MalaysiaNumber of store: 38
IndonesiaNumber of store: 9
VietnamNumber of store: 8
ChinaNumber of store: 55
23
PARKSON NETWORK, AS AT 30 JUNE 2013
24
CHAIRMAN’S STATEMENT
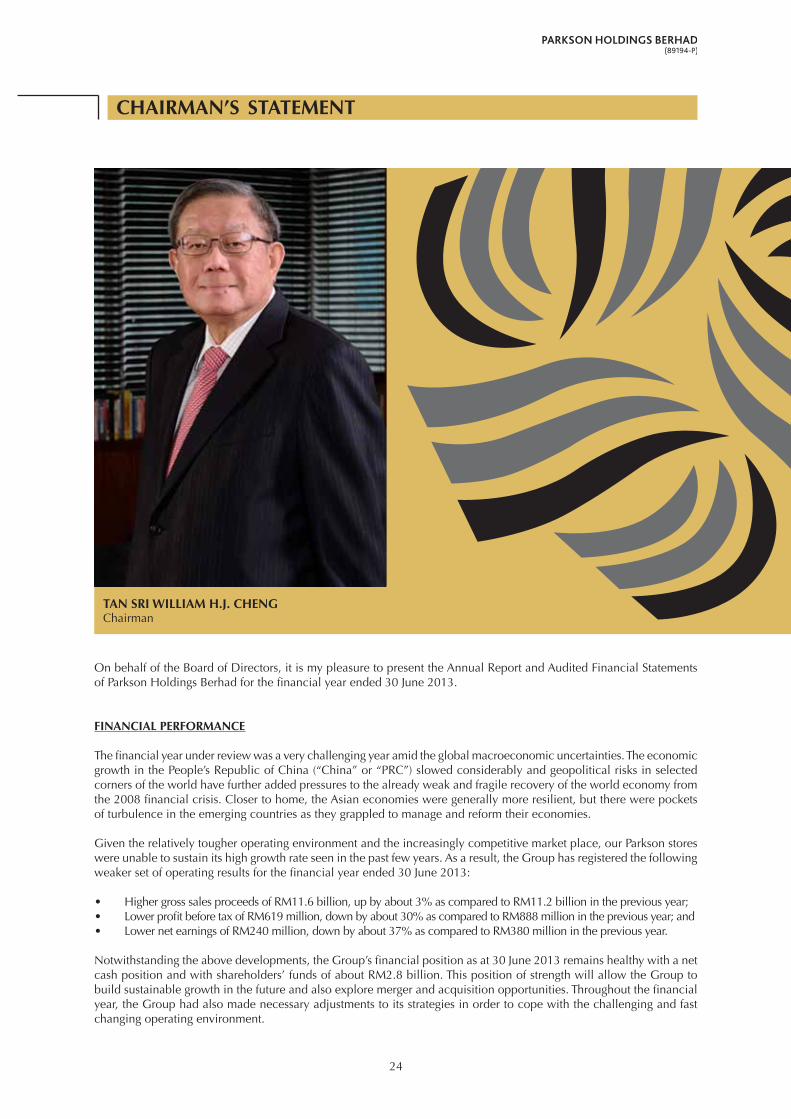
TAN SRI WILLIAM H.J. CHENGChairman
On behalf of the Board of Directors, it is my pleasure to present the Annual Report and Audited Financial Statements of Parkson Holdings Berhad for the financial year ended 30 June 2013.
FINANCIAL PERFORMANCE
The financial year under review was a very challenging year amid the global macroeconomic uncertainties. The economic growth in the People’s Republic of China (“China” or “PRC”) slowed considerably and geopolitical risks in selected corners of the world have further added pressures to the already weak and fragile recovery of the world economy from the 2008 financial crisis. Closer to home, the Asian economies were generally more resilient, but there were pockets of turbulence in the emerging countries as they grappled to manage and reform their economies.
Given the relatively tougher operating environment and the increasingly competitive market place, our Parkson stores were unable to sustain its high growth rate seen in the past few years. As a result, the Group has registered the following weaker set of operating results for the financial year ended 30 June 2013:
• HighergrosssalesproceedsofRM11.6billion,upbyabout3%ascomparedtoRM11.2billioninthepreviousyear;• LowerprofitbeforetaxofRM619million,downbyabout30%ascomparedtoRM888millioninthepreviousyear;and• LowernetearningsofRM240million,downbyabout37%ascomparedtoRM380millioninthepreviousyear.
Notwithstanding the above developments, the Group’s financial position as at 30 June 2013 remains healthy with a net cash position and with shareholders’ funds of about RM2.8 billion. This position of strength will allow the Group to build sustainable growth in the future and also explore merger and acquisition opportunities. Throughout the financial year, the Group had also made necessary adjustments to its strategies in order to cope with the challenging and fast changing operating environment.
25
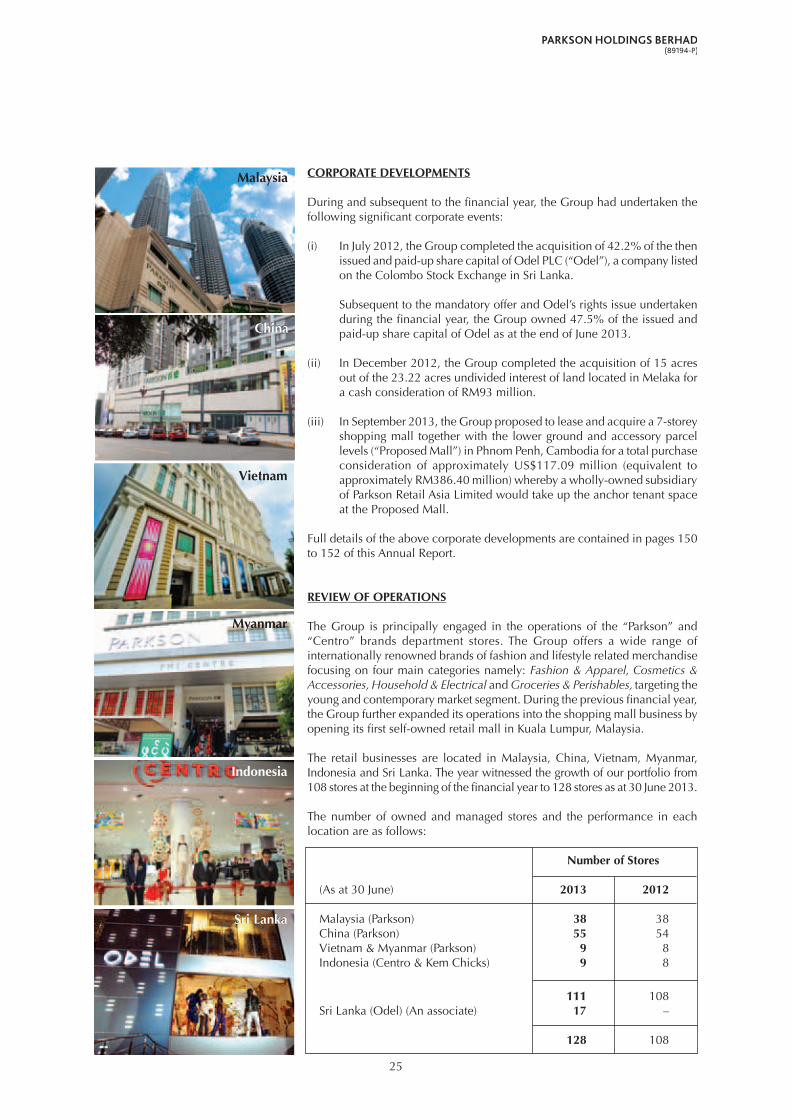
CORPORATE DEVELOPMENTS
During and subsequent to the financial year, the Group had undertaken the following significant corporate events:
(i) In July 2012, the Group completed the acquisition of 42.2% of the then issued and paid-up share capital of Odel PLC (“Odel”), a company listed on the Colombo Stock Exchange in Sri Lanka.
Subsequent to the mandatory offer and Odel’s rights issue undertaken during the financial year, the Group owned 47.5% of the issued and paid-up share capital of Odel as at the end of June 2013.
(ii) In December 2012, the Group completed the acquisition of 15 acres out of the 23.22 acres undivided interest of land located in Melaka for a cash consideration of RM93 million.
(iii) In September 2013, the Group proposed to lease and acquire a 7-storey shopping mall together with the lower ground and accessory parcel levels (“Proposed Mall”) in Phnom Penh, Cambodia for a total purchase consideration of approximately US$117.09 million (equivalent to approximately RM386.40 million) whereby a wholly-owned subsidiary of Parkson Retail Asia Limited would take up the anchor tenant space at the Proposed Mall.
Full details of the above corporate developments are contained in pages 150 to 152 of this Annual Report.
REVIEW OF OPERATIONS
The Group is principally engaged in the operations of the “Parkson” and “Centro” brands department stores. The Group offers a wide range of internationally renowned brands of fashion and lifestyle related merchandise focusing on four main categories namely: Fashion&Apparel,Cosmetics&Accessories,Household&Electrical and Groceries&Perishables,targeting the young and contemporary market segment. During the previous financial year, the Group further expanded its operations into the shopping mall business by opening its first self-owned retail mall in Kuala Lumpur, Malaysia.
The retail businesses are located in Malaysia, China, Vietnam, Myanmar, Indonesia and Sri Lanka. The year witnessed the growth of our portfolio from 108 stores at the beginning of the financial year to 128 stores as at 30 June 2013.
The number of owned and managed stores and the performance in each location are as follows: Number of Stores
(As at 30 June) 2013 2012
Malaysia (Parkson) 38 38 China (Parkson) 55 54 Vietnam & Myanmar (Parkson) 9 8 Indonesia (Centro & Kem Chicks) 9 8
111 108 Sri Lanka (Odel) (An associate) 17 –
128 108
Indonesia
Malaysia
China
Vietnam
Myanmar
Indonesia
Sri LankaSri Lanka
China

26
Revenue Segment Profit
(RM’Million) 2013 2012 2013 2012
Retail operations in: - Malaysia 872 830 104 121 - China 2,357 2,340 462 690 - Vietnam & Myanmar 109 99 4 12 - Indonesia 131 133 13 9
3,469 3,402 583 832
Property & investment holding 39 24 7 4 Less: Inter-segment (5) (3) – –
3,503 3,423 590 836
(“Segmentprofit”referstooperatingprofitbeforeemployeeshare-basedpayments,interests,shareofresultsofassociatesandtax)
Malaysia (Parkson)
Parkson is an established department store chain in Malaysia since 1987. Supported by its 26 years of operating track record, our local Parkson Division continued to deliver satisfactory performance despite weakening consumer sentiments and intensifying competition. For the current financial year, Parkson Malaysia managed to maintain its growth momentum with decent same store sales (“SSS”) growth of approximately 5% (2012: 9%) despite being bogged down by the softening of the retail market post-general election and the drop in blended margin due to the increased promotions.
To further strengthen its operations and network, Parkson Malaysia took up anchor tenant space in Plaza Merdeka, Kuching in November 2012. Following the closure of a Parkson store in Sunway Putra Mall, Kuala Lumpur during the financial year due to the change of the landlord’s business model, our domestic network coverage remains at 38 stores, same as a year ago.
With the slower growth in the local retail market, Parkson will strengthen its presence via on-going refurbishment and upgrading of existing stores as well as increasing sales and promotion activities in order to capture greater market share and to further enhance the “Parkson” brand image.
China (Parkson)
In the year 2012, the economic growth in the PRC declined with a reported growth rate of 7.8%. The economic growth has been slowing largely due to the tightening of its macro policy to unwind the aggressive monetary stimulus introduced right after the 2008 financial crisis. This managed slowdown, however, ran into stronger than anticipated external headwinds and to avoid the risk that growth might be hampered by too great and too rapid a slowdown, policy action has been rebalanced and replaced by measures to support growth. The easing of inflationary pressures allowed the PRC government to relax its monetary policy and to introduce additional fiscal measures to speed up the transformation of its economic growth model.
Given the relatively tougher operating environment and the increasing competition especially from the one-stop shopping malls and e-commerce, Parkson China has registered marginally higher revenue but lower operating profit. In line with the generally weaker sentiments on discretionary spending, Parkson China posted a negative SSS growth of approximately 1% (2012: +6%) for the financial year under review.

27
In light of the above, Parkson China has scaled down its expansion programme, and opened only 4 new stores during the financial year under review. In line with the Group’s efforts to rationalise its store portfolio, enhance its stores’ image and improve its operating efficiency, Parkson China has closed 2 stores and terminated a management agreement during the financial year. As at 30 June 2013, the Group operates 55 stores across 35 cities.
Parkson China will continue its expansionary strategy with lesser but bigger new stores to be opened in existing markets or nearby cities to better utilise the Group’s many advantageous positions. To maintain its competitive edge, average size of new stores will increase gradually as the Group seeks to increase its offering of value merchandise and quality services to better service its customers. The Group will also continue to invest in the merchandise assortment with an aim to introduce new and distinctive brands with the latest range of products in the market place ahead of its competitors.
During the financial year, together with Parkson Malaysia, Parkson China introduced the e-commerce platform which forms part of the broader multi-channel marketing programme to enable the Group to better serve its customers.
Vietnam & Myanmar (Parkson)
Since the last financial year, the Vietnamese economy had faced various challenges resulting in tight government policies which have curbed economic growth. Parkson Vietnam has not been spared from the economic crisis and recorded a negative SSS growth of approximately 1% (2012: +9%) for the financial year under review. To mitigate this, Parkson Vietnam had made necessary adjustments to its operating strategies to keep abreast with the challenging and fast changing operating environment.
As at 30 June 2013, Parkson Vietnam has a network of 8 stores (inclusive of 3 managed stores) located in the top three major cities i.e. Ho Chi Minh City (5 stores), Hanoi (2 stores) and Hai Phong (1 store).
In May 2013, the Division opened its first store under the Parkson banner in FMI Centre in Yangon, Myanmar. Plans are in place to expand the existing business by opening more stores in Indochina over the next few years.
Indonesia (Parkson, Centro & Kem Chicks)
Our foray into the Indonesian retail market in 2011 through the acquisition of “Centro” department stores continued to yield encouraging results. The Division has performed well with SSS growth of about 6% (2012: 9%) and was able to contribute higher profit to the Group. However, due to the weakening of the Indonesian Rupiah, the Division reported a marginally lower revenue of RM131 million.
The Group will pursue a dual-brand strategy in Indonesia, which will see it leveraging on the Centro brand to capture the large middle-class market segment and at the same time, introducing new Parkson department stores there to meet the demands of the Indonesian upper-class market segment in first-tier cities. It is noteworthy to mention that the Group shall be opening new stores in Indonesia outside of its traditional bases in the islands of Java and Bali, with tenancies for new stores in Sumatra and Sulawesi islands. Such expansion plans are very much in line with the Group’s strategies of reaching out to customers by establishing its presence across the different major cities and towns in each of its markets.
28
Sri Lanka (Parkson & Odel)
In July 2012, the Group completed the acquisition of Odel PLC (“Odel”), a company listed on the Colombo Stock Exchange in Sri Lanka. Odel is one of the leading retail companies in Sri Lanka and operates 17 retail stores located in Colombo and Kandy. At the end of June 2013, the Group owned 47.5% of the issued and paid-up share capital of Odel.
The acquisition is part of the Group’s strategy to go beyond the Southeast Asian retail market to seek opportunities in countries with strong growth. It marked another new milestone for the Group and is expected to provide the Group with the opportunity to establish a footprint in Sri Lanka and extend its department store chain into other parts of Asia.
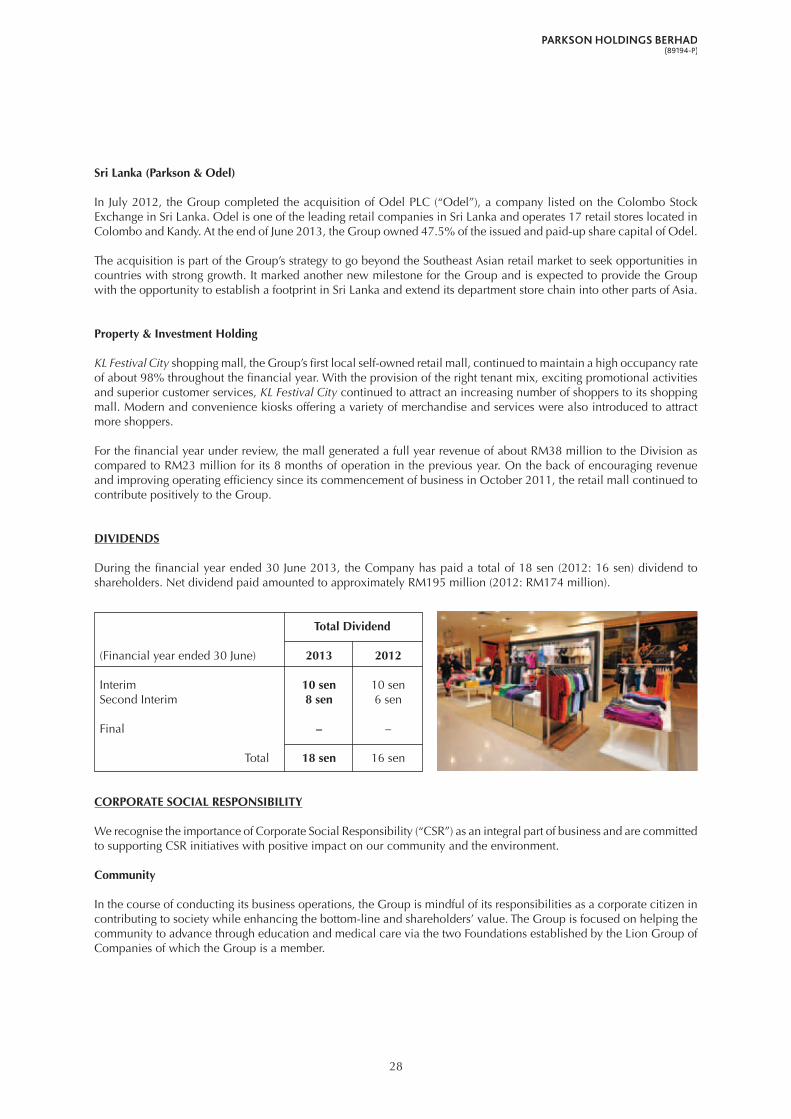
Property & Investment Holding
KLFestivalCityshopping mall, the Group’s first local self-owned retail mall, continued to maintain a high occupancy rate of about 98% throughout the financial year. With the provision of the right tenant mix, exciting promotional activities and superior customer services, KLFestivalCity continued to attract an increasing number of shoppers to its shopping mall. Modern and convenience kiosks offering a variety of merchandise and services were also introduced to attract more shoppers.
For the financial year under review, the mall generated a full year revenue of about RM38 million to the Division as compared to RM23 million for its 8 months of operation in the previous year. On the back of encouraging revenue and improving operating efficiency since its commencement of business in October 2011, the retail mall continued to contribute positively to the Group.
DIVIDENDS
During the financial year ended 30 June 2013, the Company has paid a total of 18 sen (2012: 16 sen) dividend to shareholders. Net dividend paid amounted to approximately RM195 million (2012: RM174 million).
Total Dividend
(Financial year ended 30 June) 2013 2012
Interim 10 sen 10 senSecond Interim 8 sen 6 sen
Final – –
Total 18 sen 16 sen
CORPORATE SOCIAL RESPONSIBILITY
We recognise the importance of Corporate Social Responsibility (“CSR”) as an integral part of business and are committed to supporting CSR initiatives with positive impact on our community and the environment.
Community
In the course of conducting its business operations, the Group is mindful of its responsibilities as a corporate citizen in contributing to society while enhancing the bottom-line and shareholders’ value. The Group is focused on helping the community to advance through education and medical care via the two Foundations established by the Lion Group of Companies of which the Group is a member.

29
The Lion-Parkson Foundation disburses funds for various needs such as education, charity and scientific research; and offers scholarships to undergraduates in the local universities annually. The Lion Group Medical Assistance Fund provides financial assistance to the less fortunate suffering from critical illnesses who require medical treatment including surgery, purchase of medical equipment and medication. The Fund also sponsors community health programmes such as medical camps, and the purchase of dialysis machines for Dialysis Centres providing subsidised treatment to those suffering from kidney failure.
The Group also organises its yearly Back-To-School Charity Drive with Parkson stores nationwide providing collection bins for the public to donate essential school items such as uniforms, shoes and stationery, which are distributed to needy school children throughout the country. Parkson is also working with its business associates such as the cosmetics houses to contribute certain portion of the sale of the associates’ products in Parkson stores to charitable causes.
Environment
Under its ParksonCaresMyPark programme, the Group has adopted parks in various states with the objective to maintain the parks for the enjoyment and benefit of the surrounding communities. The programme involves restoration, enhancement and upgrading facilities to improve the condition of the parks and recreational amenities in promoting a green environment and healthier lifestyle for the public.
Parkson’s commitment to preserving the environment is also reflected in its participation in the ‘No Plastic Bag Day’ adopted by several states to reduce the use of plastic bags, and a replanting programme to rehabilitate the mangrove forests together with its business partner.
PROSPECTS
In line with the PRC’s medium to long term economic reform objective of shifting its economic growth towards higher domestic consumption, the Group strongly believes that the emergence of the middle class in the PRC will continue to accelerate in the next decade. Given the Group’s marketing focus on the middle to middle upper market segment, the Group is strategically positioned to tap on this evolving macroeconomic development. However, the competition landscape in the fast changing department store business is expected to remain challenging in the near future and consolidation is inevitable. Leveraging on the Group’s strong balance sheet and the strong Parkson brand equity, the Group is well positioned and ready to capitalise on the consolidation of the retail industry in China.
On the Southeast Asian retail scene, the continued economic expansion in the countries where the Group has presence augurs well for Parkson as our store design and offerings will be more than able to meet the demands and expectations of the emerging middle class. We believe that our store expansion strategy will allow us to harness the largely under-served middle to upper income segment of the retail market in these countries for which the leverage potential and rewards will be significant.

30
For the Division involved in the management of shopping malls, the number of malls in Malaysia has been increasing with the rising income and prosperity level in the country. The presence of more malls will mean keener competition for shoppers and tenants. However, the Group has the advantage of its Parkson department store being its own anchor tenant, thus enabling this Division to attract high shopper traffic and good tenant mix. The Group will continue to seek expansion opportunities in key locations commensurate with its investment strategies.
BOARD OF DIRECTORS
The Board would like to extend its warm welcome to Cik Zainab binti Dato’ Hj. Mohamed on her appointment as an Independant Non-Executive Director of the Company during the financial year. The Board is confident that the Company will benefit from her invaluable experience and expertise.
At the forthcoming Annual General Meeting, Mr Cheng Sin Yeng will be retiring and will not be seeking re-election as Director of the Company. Mr Cheng served as a member of the Nomination Committee and Remuneration Committee of the Company. On behalf of the Board, I would like to express my sincere appreciation for his invaluable contribution during his tenure as a Director of the Company, and a member of the Company’s aforementioned committees.
ACKNOWLEDGEMENT
On behalf of the Board, I wish to extend my sincere thanks to all our valued customers, suppliers, financiers, business associates, Government authorities and shareholders for their continued support, co-operation and confidence in the Group.
I would also like to convey my sincere appreciation and gratitude to my fellow Directors for their invaluable guidance, support and contribution throughout the year as well as to record my appreciation to our employees at all levels for their dedication, commitment and contribution to the Group.
TAN SRI WILLIAM H.J. CHENGChairman
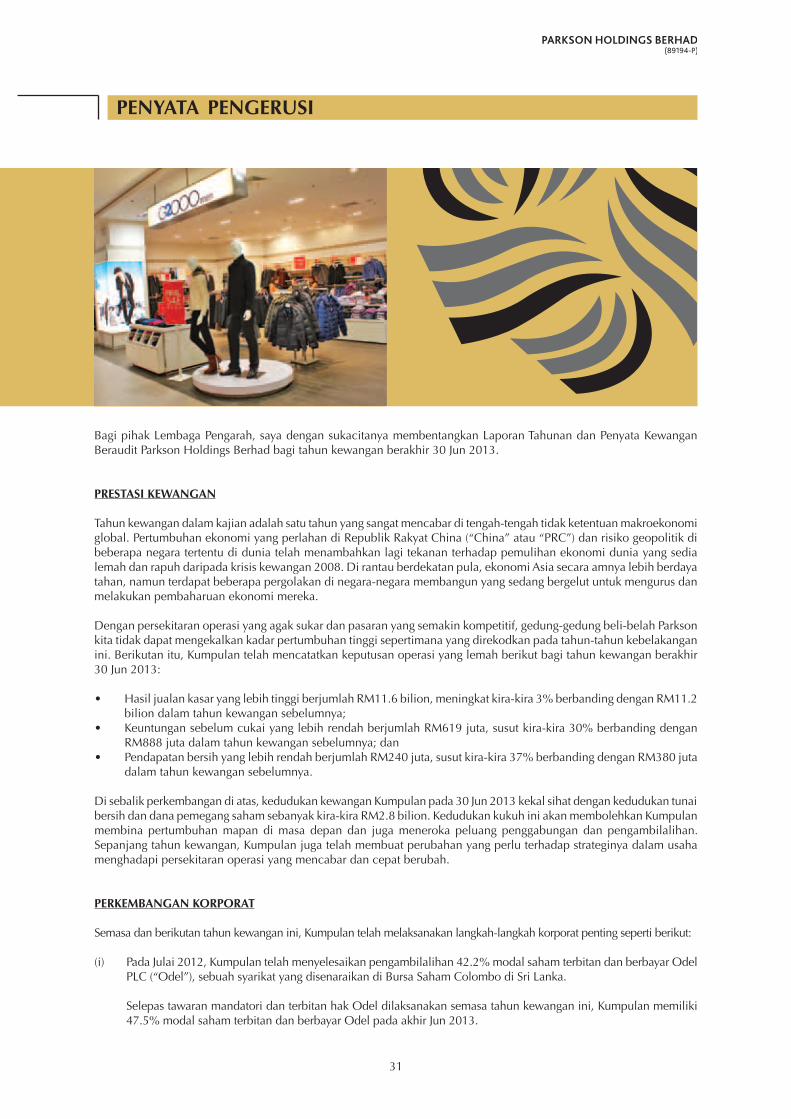
31
PENYATA PENGERUSI
Bagi pihak Lembaga Pengarah, saya dengan sukacitanya membentangkan Laporan Tahunan dan Penyata Kewangan Beraudit Parkson Holdings Berhad bagi tahun kewangan berakhir 30 Jun 2013.
PRESTASI KEWANGAN
Tahun kewangan dalam kajian adalah satu tahun yang sangat mencabar di tengah-tengah tidak ketentuan makroekonomi global. Pertumbuhan ekonomi yang perlahan di Republik Rakyat China (“China” atau “PRC”) dan risiko geopolitik di beberapa negara tertentu di dunia telah menambahkan lagi tekanan terhadap pemulihan ekonomi dunia yang sedia lemah dan rapuh daripada krisis kewangan 2008. Di rantau berdekatan pula, ekonomi Asia secara amnya lebih berdaya tahan, namun terdapat beberapa pergolakan di negara-negara membangun yang sedang bergelut untuk mengurus dan melakukan pembaharuan ekonomi mereka.
Dengan persekitaran operasi yang agak sukar dan pasaran yang semakin kompetitif, gedung-gedung beli-belah Parkson kita tidak dapat mengekalkan kadar pertumbuhan tinggi sepertimana yang direkodkan pada tahun-tahun kebelakangan ini. Berikutan itu, Kumpulan telah mencatatkan keputusan operasi yang lemah berikut bagi tahun kewangan berakhir 30 Jun 2013:
• HasiljualankasaryanglebihtinggiberjumlahRM11.6bilion,meningkatkira-kira3%berbandingdenganRM11.2bilion dalam tahun kewangan sebelumnya;
• KeuntungansebelumcukaiyanglebihrendahberjumlahRM619juta,susutkira-kira30%berbandingdenganRM888 juta dalam tahun kewangan sebelumnya; dan
• PendapatanbersihyanglebihrendahberjumlahRM240juta,susutkira-kira37%berbandingdenganRM380jutadalam tahun kewangan sebelumnya.
Di sebalik perkembangan di atas, kedudukan kewangan Kumpulan pada 30 Jun 2013 kekal sihat dengan kedudukan tunai bersih dan dana pemegang saham sebanyak kira-kira RM2.8 bilion. Kedudukan kukuh ini akan membolehkan Kumpulan membina pertumbuhan mapan di masa depan dan juga meneroka peluang penggabungan dan pengambilalihan. Sepanjang tahun kewangan, Kumpulan juga telah membuat perubahan yang perlu terhadap strateginya dalam usaha menghadapi persekitaran operasi yang mencabar dan cepat berubah.
PERKEMBANGAN KORPORAT
Semasa dan berikutan tahun kewangan ini, Kumpulan telah melaksanakan langkah-langkah korporat penting seperti berikut:
(i) Pada Julai 2012, Kumpulan telah menyelesaikan pengambilalihan 42.2% modal saham terbitan dan berbayar Odel PLC (“Odel”), sebuah syarikat yang disenaraikan di Bursa Saham Colombo di Sri Lanka.
Selepas tawaran mandatori dan terbitan hak Odel dilaksanakan semasa tahun kewangan ini, Kumpulan memiliki 47.5% modal saham terbitan dan berbayar Odel pada akhir Jun 2013.

32
(ii) Pada Disember 2012, Kumpulan menyelesaikan pengambilalihan 15 ekar daripada 23.22 ekar kepentingan tidak dibahagi tanah yang terletak di Melaka pada pertimbangan tunai sebanyak RM93 juta.
(iii) Pada September 2013, Kumpulan bercadang untuk memajak dan mengambilalih pusat beli-belah 7 tingkat bersama-sama dengan tingkat bawah dan ruang tambahan (“Cadangan Pusat Beli-Belah”) di Phnom Penh, Kemboja pada jumlah pertimbangan pembelian kira-kira AS$117.09 juta (bersamaan dengan kira-kira RM386.40 juta) di mana anak syarikat milik penuh Parkson Retail Asia Limited akan mengambil ruang penyewa utama di Cadangan Pusat Beli-Belah.
Maklumat penuh perkembangan korporat di atas terkandung dalam muka surat 150 hingga 152 dalam Laporan Tahunan ini.
KAJIAN OPERASI Kumpulan pada dasarnya terbabit dalam operasi gedung beli-belah jenama “Parkson” dan “Centro”. Kumpulan menawarkan pelbagai fesyen dan barangan berkaitan gaya hidup berjenama terkenal antarabangsa dengan memfokuskan kepada empat kategori utama barangan iaitu: Fesyen&Pakaian,Komestik&Aksesori,KelengkapanRumah&BaranganElektrik dan BaranganRuncit&TidakTahanLama, yang mensasarkan segmen pasaran golongan muda dan kontemporari. Dalam tahun kewangan sebelumnya, Kumpulan telah meluaskan operasi ke perniagaan pusat beli-belah dengan membuka pusat beli-belah milik sendiri yang pertama di Kuala Lumpur, Malaysia.
Perniagaan peruncitan bertumpu di Malaysia, China, Vietnam, Myanmar, Indonesia dan Sri Lanka. Tahun ini portfolio kita menyaksikan pertumbuhan daripada 108 gedung beli-belah di permulaan tahun kewangan kepada 128 gedung beli-belah setakat 30 Jun 2013.
Jumlah gedung beli-belah yang dimiliki dan diuruskan serta prestasi di setiap lokasi adalah seperti berikut:
Bilangan Gedung Beli-Belah
(Sehingga 30 Jun) 2013 2012
Malaysia (Parkson) 38 38 China (Parkson) 55 54 Vietnam & Myanmar (Parkson) 9 8 Indonesia (Centro & Kem Chicks) 9 8
111 108 Sri Lanka (Odel) (Sebuah syarikat sekutu) 17 – 128 108
Pendapatan Segmen Untung
(RM’Juta) 2013 2012 2013 2012
Operasi peruncitan di: - Malaysia 872 830 104 121 - China 2,357 2,340 462 690 - Vietnam & Myanmar 109 99 4 12 - Indonesia 131 133 13 9
3,469 3,402 583 832
Hartanah & pegangan pelaburan 39 24 7 4 Tolak: Antara segmen (5) (3) – –
3,503 3,423 590 836
(“Segmenuntung”merujuk kepadauntungoperasi sebelumbahagianbayaranperkongsian kakitangan, faedah,bahagiankeputusansyarikatsekutudancukai)

33
Malaysia (Parkson)
Parkson adalah rangkaian gedung beli-belah yang terkenal di Malaysia sejak 1987. Disokong oleh rekod operasi selama 26 tahun, Bahagian Parkson tempatan terus mencatatkan prestasi memuaskan di sebalik sentimen pengguna yang lemah dan persaingan yang semakin sengit. Bagi tahun kewangan semasa, Parkson Malaysia berjaya mengekalkan momentum pertumbuhan baik dengan jualan gedung sama (“SSS”) berkembang sebanyak kira-kira 5% (2012: 9%), meskipun dipengaruhi oleh kelembapan pasaran runcit pasca pilihan raya umum dan penurunan dalam margin ekoran peningkatan aktiviti promosi.
Dalam usaha mengukuhkan lagi operasi dan rangkaiannya, Parkson Malaysia mengambil ruang penyewa utama di Plaza Merdeka, Kuching pada November 2012. Susulan penutupan gedung beli-belah Parkson di Sunway Putra Mall, Kuala Lumpur kerana perubahan model perniagaan tuan tanah semasa tahun kewangan, liputan rangkaian domestik kekal dengan 38 gedung beli-belah, sama seperti tahun lalu.
Dengan pertumbuhan yang lebih perlahan dalam pasaran runcit tempatan, Parkson akan terus mengukuhkan kehadiran melalui penambahbaikan dan menaik taraf gedung beli-belah sedia ada, di samping meningkatkan aktiviti promosi dan jualan dalam usaha menguasai bahagian pasaran yang lebih besar serta meningkatkan lagi imej jenama “Parkson”.
China (Parkson)
Pada tahun 2012, pertumbuhan ekonomi di China mencatatkan penurunan dengan kadar pertumbuhan yang dilaporkan sebanyak 7.8%. Pertumbuhan perlahan ekonomi sebahagian besarnya disebabkan oleh langkah mengetatkan dasar makro untuk merehatkan rangsangan kewangan agresif yang diperkenalkan sejurus selepas krisis kewangan 2008. Langkah itu berjaya menangani kelembapan, namun ia menyebabkan cabaran luaran yang lebih kuat daripada dijangkakan dan untuk mengelakkan risiko kemungkinan pertumbuhan terjejas oleh kelembapan yang serius, langkah dasar yang diambil telah diimbangi semula dan digantikan dengan langkah untuk menyokong pertumbuhan. Penurunan tekanan inflasi membolehkan kerajaan PRC untuk melonggarkan dasar kewangan dan memperkenalkan langkah fiskal tambahan untuk mempercepatkan transformasi model pertumbuhan ekonomi.
Dengan persekitaran operasi yang agak sukar dan persaingan semakin meningkat terutama dari pusat beli-belah sehenti dan e-dagang, Parkson China telah mencatatkan perolehan lebih tinggi sedikit tetapi keuntungan operasi yang lebih rendah. Sejajar dengan sentimen yang secara umumnya lemah dalam perbelanjaan, Parkson China mencatatkan pertumbuhan negatif SSS kira-kira 1% (2012: +6%) bagi tahun kewangan yang dikaji.
Bersandarkan perkembangan di atas, Parkson China telah mengurangkan program pengembangan, dan hanya membuka 4 gedung beli-belah baru dalam tahun kewangan yang dikaji. Selaras dengan usaha Kumpulan untuk merasionalkan portfolio dan meningkatkan imej gedung beli-belahnya serta menambahbaik kecekapan operasi, Parkson China telah menutup 2 gedung beli-belah dan menamatkan satu perjanjian pengurusan sepanjang tahun kewangan. Setakat 30 Jun 2013, Kumpulan mengendalikan operasi 55 gedung beli-belah merangkumi 35 bandaraya.
Parkson China akan meneruskan strategi pengembangan dengan membuka bilangan gedung beli-belah baru yang lebih rendah tetapi lebih luas di pasaran sedia ada atau bandar berdekatan untuk memanfaatkan kelebihan yang banyak dimiliki oleh Kumpulan. Untuk mengekalkan daya saing, saiz purata gedung beli-belah baru akan meningkat secara beransur-ansur memandangkan Kumpulan sedang berusaha untuk menambahkan penawaran barangan bernilai dan perkhidmatan berkualiti dalam usaha menawarkan perkhidmatan terbaik kepada pelanggan. Kumpulan juga akan terus melabur dalam pelbagai barangan dengan matlamat untuk memperkenalkan jenama baru dan tersendiri dengan pelbagai rangkaian produk terbaru di pasaran lebih awal daripada pesaingnya.
Dalam tahun kewangan ini, Parkson Malaysia bersama-sama dengan Parkson China memperkenalkan platform e-dagang yang merupakan sebahagian daripada program perluasan pemasaran pelbagai saluran untuk membolehkan Kumpulan menawarkan yang terbaik kepada pelanggan.
Vietnam & Myanmar (Parkson)
Sejak tahun kewangan yang lalu, ekonomi Vietnam menghadapi pelbagai cabaran ekoran dasar kerajaan yang ketat yang menjejaskan pertumbuhan ekonomi. Parkson Vietnam tidak terlepas daripada krisis ekonomi dan mencatatkan pertumbuhan negatif SSS kira-kira 1% (2012: +9%) bagi tahun kewangan yang dikaji. Untuk mengurangkan kesan ini,

34
Parkson Vietnam melaksanakan pengubahsuaian yang perlu terhadap strategi operasi membolehkannya berdepan dengan persekitaran operasi yang mencabar dan cepat berubah.
Setakat 30 Jun 2013, Parkson Vietnam mempunyai 8 rangkaian gedung beli-belah (termasuk 3 gedung yang diurus) yang terletak di tiga bandar utama iaitu Bandaraya Ho Chi Minh (5 gedung), Hanoi (2 gedung) dan Hai Phong (1 gedung).
Pada Mei 2013, Bahagian ini membuka gedung beli-belah pertama di bawah jenama Parkson di FMI Centre di Yangon, Myanmar. Perancangan telah dibuat untuk mengembangkan perniagaan yang sedia ada dengan membuka lebih banyak gedung beli-belah di Indochina dalam tempoh beberapa tahun yang akan datang.
Indonesia (Parkson, Centro & Kem Chicks)
Pembabitan kita ke dalam pasaran runcit Indonesia pada 2011 menerusi pengambilalihan gedung beli-belah “Centro” terus menyumbang hasil yang menggalakkan. Bahagian ini mencatatkan prestasi yang baik dengan pertumbuhan SSS kira-kira 6% (2012: 9%) dan berupaya menyumbang keuntungan lebih tinggi kepada Kumpulan. Walau bagaimanapun, disebabkan kelemahan Rupiah Indonesia, Bahagian ini melaporkan pendapatan yang lebih rendah berjumlah RM131 juta.
Kumpulan akan melaksanakan strategi dwi-jenama di Indonesia, yang akan menyaksikan ia memanfaatkan jenama Centro untuk menguasai segmen pasaran kelas pertengahan yang besar dan pada masa sama, memperkenalkan gedung beli-belah baru Parkson di sana untuk memenuhi permintaan segmen pasaran kelas atasan Indonesia di bandaraya peringkat satu. Kumpulan juga akan membuka gedung beli-belah baru di Indonesia iaitu di luar lokasi tradisional di Pulau Jawa dan Bali, dengan menyewa kedai baru di kepulauan Sumatera dan Sulawesi. Rancangan pengembangan itu sejajar dengan strategi Kumpulan mendekati pelanggan dengan mewujudkan kehadiran di seluruh bandaraya utama dan bandar besar yang berbeza di setiap pasarannya.
Sri Lanka (Parkson & Odel)
Pada Julai 2012, Kumpulan menyelesaikan pengambilalihan Odel PLC (“Odel”), sebuah syarikat yang disenaraikan di Bursa Saham Colombo di Sri Lanka. Odel adalah salah satu daripada syarikat runcit terkemuka di Sri Lanka dan mengendalikan operasi 17 gedung beli-belah yang terletak di Colombo dan Kandy. Pada akhir Jun 2013, Kumpulan memiliki 47.5% daripada modal saham terbitan dan berbayar Odel.
Pengambilalihan itu adalah sebahagian daripada strategi Kumpulan untuk beroperasi melampaui pasaran runcit Asia Tenggara bagi meneroka peluang di negara-negara dengan pertumbuhan yang kukuh. Ia menandakan satu lagi pencapaian baru bagi Kumpulan dan dijangka akan menyediakan Kumpulan dengan peluang untuk bertapak di Sri Lanka dan mengembangkan rantaian gedung beli-belah ke rantau lain di Asia.
Hartanah & Pegangan Pelaburan
Pusat beli-belah KLFestivalCity, sebuah pusat beli-belah tempatan pertama milik sendiri Kumpulan terus mengekalkan kadar penghunian yang tinggi kira-kira 98% sepanjang tahun kewangan. Dengan peruntukan gabungan penyewa yang tepat, aktiviti promosi menarik dan perkhidmatan pelanggan yang mantap, KLFestivalCity terus menarik peningkatan jumlah pembeli ke pusat beli-belahnya. Kiosk moden dan selesa yang menawarkan pelbagai barangan dan perkhidmatan turut diperkenalkan bagi menarik lebih ramai pembeli.

35
Bagi tahun kewangan yang dikaji, pusat beli-belah ini menjana pendapatan kira-kira RM38 juta untuk setahun penuh kepada Bahagian berbanding RM23 juta bagi tempoh 8 bulan beroperasi pada tahun sebelumnya. Disokong oleh pendapatan yang mengggalakkan dan peningkatan kecekapan operasi sejak memulakan perniagaannya pada Oktober 2011, pusat beli-belah ini terus memberi sumbangan positif kepada Kumpulan.
DIVIDEN
Pada tahun kewangan berakhir 30 Jun 2013, Syarikat telah membayar dividen sebanyak 18 sen (2012: 16 sen) kepada pemegang saham. Dividen bersih yang dibayar berjumlah kira-kira RM195 juta (2012: RM174 juta).
Jumlah Dividen
(Tahun kewangan berakhir 30 Jun) 2013 2012
Interim 10 sen 10 senInterim kedua 8 sen 6 sen
Akhir – – Jumlah 18 sen 16 sen
TANGGUNGJAWAB SOSIAL KORPORAT
Kami mengakui kepentingan Tanggungjawab Sosial Korporat (“CSR”) sebagai sebahagian daripada perniagaan dan komited untuk menyokong inisiatif CSR yang memberi kesan positif kepada masyarakat dan alam sekitar.
Komuniti Dalam melaksanakan operasi perniagaan, Kumpulan sedar akan tanggungjawabnya sebagai warga korporat dalam menyumbang kepada masyarakat, di samping meningkatkan keuntungan dan nilai pemegang saham. Kumpulan memberi tumpuan dalam membantu masyarakat untuk mencapai kemajuan melalui pendidikan dan rawatan perubatan melalui dua Yayasan yang ditubuhkan oleh Syarikat-Syarikat Kumpulan Lion di mana Kumpulan adalah ahli.
Yayasan Lion-Parkson mengagihkan dana untuk pelbagai keperluan seperti pendidikan, kebajikan dan penyelidikan saintifik, dan setiap tahun, menawarkan biasiswa kepada pelajar di universiti tempatan. Tabung Bantuan Perubatan Kumpulan Lion menyediakan bantuan kewangan kepada golongan kurang bernasib baik yang menderita penyakit kritikal yang memerlukan rawatan perubatan termasuk pembedahan, pembelian peralatan perubatan dan ubat-ubatan. Tabung turut menaja program kesihatan masyarakat seperti kem perubatan, dan pembelian mesin dialysis untuk Pusat Dialisis yang menyediakan subsidi rawatan untuk mereka yang menderita kegagalan buah pinggang.
Kumpulan juga menganjurkan Program Amal Tahunan Kembali Ke Sekolah di mana gedung beli-belah Parkson di seluruh negara menyediakan tong pungutan untuk orang ramai menderma barangan utama persekolahan seperti pakaian seragam, kasut dan alat tulis, yang diedarkan kepada kanak-kanak sekolah yang memerlukan di seluruh negara. Parkson juga bekerjasama dengan rakan perniagaan seperti pusat kosmetik untuk menyumbang bahagian tertentu daripada jualan produk syarikat bersekutu di gedung beli-belah Parkson untuk tujuan kebajikan. Alam Sekitar
Di bawah program “ParksonPeliharaTamanSaya”, Kumpulan telah menjadikan taman di beberapa negeri sebagai taman angkat dengan matlamat untuk mengekalkan taman untuk dinikmati dan memberi manfaat kepada masyarakat sekeliling. Program ini melibatkan pemulihan, peningkatan dan menaik taraf kemudahan bagi memperbaiki suasana taman dan kemudahan rekreasi dalam usaha mempromosikan persekitaran hijau serta gaya hidup sihat untuk orang ramai.
Komitmen Parkson untuk memelihara alam sekitar juga dapat dilihat menerusi penyertaan dalam ‘Hari Tanpa Beg Plastik’ yang digunapakai oleh beberapa negeri untuk mengurangkan penggunaan beg plastik, dan program penanaman semula untuk memulihkan hutan bakau bersama-sama dengan rakan kongsi perniagaannya.

36
PROSPEK Selaras dengan objektif pembaharuan ekonomi jangka sederhana hingga panjang PRC untuk mengubah pertumbuhan ekonominya ke arah penggunaan domestik yang tinggi, Kumpulan percaya bahawa kemunculan kelas pertengahan di PRC akan terus meningkat pada dekad akan datang. Dengan fokus pemasaran Kumpulan kepada pasaran segmen pertengahan hingga pertengahan atas, Kumpulan berada dalam kedudukan strategik untuk memanfaatkan perkembangan pembangunan makroekonomi ini. Walau bagaimanapun, persaingan dalam perubahan perniagaan gedung beli-belah dijangka kekal mencabar dalam masa terdekat dan penggabungan tidak dapat dielakkan. Memanfaatkan lembaran imbangan kewangan Kumpulan dan ekuiti jenama Parkson yang kukuh, Kumpulan berada pada kedudukan baik dan bersedia untuk merebut peluang daripada penggabungan industri runcit di China.
Mengenai industri peruncitan Asia Tenggara, perkembangan ekonomi yang berterusan di negara di mana Kumpulan mempunyai operasi perniagaan telah memberi manfaat kepada Parkson kerana reka bentuk dan barangan yang ditawarkan oleh gedung beli-belah kita berupaya memenuhi permintaan dan harapan kelas pertengahan baru muncul. Kita percaya bahawa strategi pengembangan gedung kita akan membolehkan kita merebut peluang dalam pasaran runcit segmen pendapatan pertengahan hingga atasan yang belum banyak diterokai di mana ia menawarkan potensi dan ganjaran yang signifikan.
Bagi Bahagian yang terlibat dalam pengurusan pusat beli-belah, bilangan pusat beli-belah di Malaysia telah bertambah seiring dengan peningkatan pendapatan dan tahap kemakmuran di negara ini. Kehadiran lebih banyak pusat beli-belah akan menyumbang kepada persaingan lebih sengit untuk pembeli dan penyewa. Walau bagaimanapun, gedung beli-belah Parkson Kumpulan memiliki kelebihan kerana ia sendiri menjadi penyewa utama, sekali gus membolehkan Bahagian ini menarik kehadiran pembeli yang tinggi dan penyewa yang baik. Kumpulan akan terus meninjau peluang pengembangan di lokasi utama selaras dengan strategi pelaburannya.
LEMBAGA PENGARAH
Lembaga Pengarah ingin mengalu-alukan Cik Zainab binti Dato’ Hj. Mohamed sebagai Pengarah Bebas Bukan Eksekutif Syarikat pada tahun kewangan. Lembaga Pengarah yakin bahawa Syarikat akan beroleh manfaat daripada pengalaman dan kepakaran beliau yang tidak ternilai.
Pada Mesyuarat Agung Tahunan yang akan datang, Encik Cheng Sin Yeng akan bersara dan tidak memohon untuk dilantik semula sebagai Pengarah Syarikat. Encik Cheng berkhidmat sebagai ahli Jawatankuasa Pencalonan dan ahli Jawatankuasa Gabungan Syarikat. Bagi pihak Lembaga Pengarah, saya ingin merakamkan setinggi-tinggi penghargaan di atas sumbangan beliau yang tidak ternilai sepanjang tempoh perkhidmatan beliau sebagai Pengarah Syarikat, dan ahli jawatankuasa syarikat yang disebutkan di atas.
PENGHARGAAN
Bagi pihak Lembaga Pengarah, saya ingin menyampaikan ucapan terima kasih kepada semua pelanggan, pembekal, pembiaya, rakan perniagaan, pihak berkuasa kerajaan dan para pemegang saham atas sokongan berterusan, kerjasama dan keyakinan mereka terhadap Kumpulan.
Saya juga ingin merakamkan penghargaan ikhlas dan terima kasih kepada rakan-rakan Pengarah atas bimbingan dan sokongan mereka dan sumbangan yang tidak ternilai sepanjang tahun serta menyatakan penghargaan saya kepada kakitangan di semua peringkat atas dedikasi, komitmen dan sumbangan kepada Kumpulan.
TAN SRI WILLIAM H.J. CHENGPengerusi

37
主席报告
我谨代表董事部,欣然提呈百盛控股有限公司截至2013年6月30日的会计年度之常年报告和经审核财务报表。
财务表现
在全球宏观经济不稳定的情况下,本会计年度可谓是挑战重重的一年。中国经济成长大幅放缓,同时世界一些角落的地缘政治风险依然存在,都对世界经济自2008年金融危机以来本已脆弱的复苏态势构成压力。接近本国的地区,亚洲各地经济基本上较具回弹力,但正当新兴国家在致力于管理和改革它们的经济之际,这些新兴国家的经济会出现少许动荡。
鉴于营运环境较为艰难且市场竞争日益激烈,我们的百盛商店无法维持过去几年的高增长率。因此,在截至2013年6月30日的会计年度,本集团录得下述较疲弱的营运业绩:
• 较高的销售所得款额,共116亿令吉,比上一年度的112亿令吉增加约3%;• 较低的税前利润,共6亿1千900万令吉,比上一年度的8亿8千800万令吉减少约30%;以及• 较低的净利润,共2亿4千万令吉,比上一年度的3亿8千万令吉减少约37%。
虽然如此,本集团在2013年6月30日的财务状况仍然健全,处于净现金状态并拥有股东基金约28亿令吉。这样的实力将为本集团建立可持续的增长,以及探讨合并与收购的机会。在本会计年度,本集团也在策略上进行所需的调整,以便应付具挑战性和迅速变化的营运环境。
企业发展
在本会计年度期间及期后,本集团进行下述的重大企业事项:
(i) 在2012年7月,本集团完成收购Odel PLC(“Odel”)当时42.2%发行及缴足资本。Odel是在斯里兰卡于科伦坡股票交易所挂牌的公司。
过后在本会计年度内通过强制性献购和Odel发行附加股,截至2013年6月底,本集体拥有Odel47.5%的股权。
(ii) 在2012年12月,本集团以现金9千300万令吉完成收购在马六甲一片23.22依格其中15依格的土地。
(iii) 在2013年9月,本集团建议租赁和收购在柬埔寨首都金边的一座7层楼购物广场以及其底层和附属楼层,总收购价约1亿1千709万美元(相等于大约3亿8千640万令吉)。Parkson Retail Asia Limited的独资子公司将成为此购物广场的主要租户。
上述企业发展的详情列在本常年报告的150页至152页。
业务检讨
本集团主要从事经营“百盛”和“Centro”品牌的百货商店业务。本集团提供一系列国际知名品牌的时装及时尚商品,专注于四类主要商品:时装与服装、化妆品与配饰、家居用品与电器以及食品与生鲜商品,以年轻人和时尚消费者为对象。在上一个会计年度,通过在马来西亚首都吉隆坡开设本身拥有的第一家零售购物广场,本集团的业务进一步扩充到购物广场业务。
零售业务分布在马来西亚、中国、越南、缅甸、印尼和斯里兰卡。本会计年度见证了本集团投资的增长,百货商店从会计年度开始时的108家增加至2013年6月30日的128家。
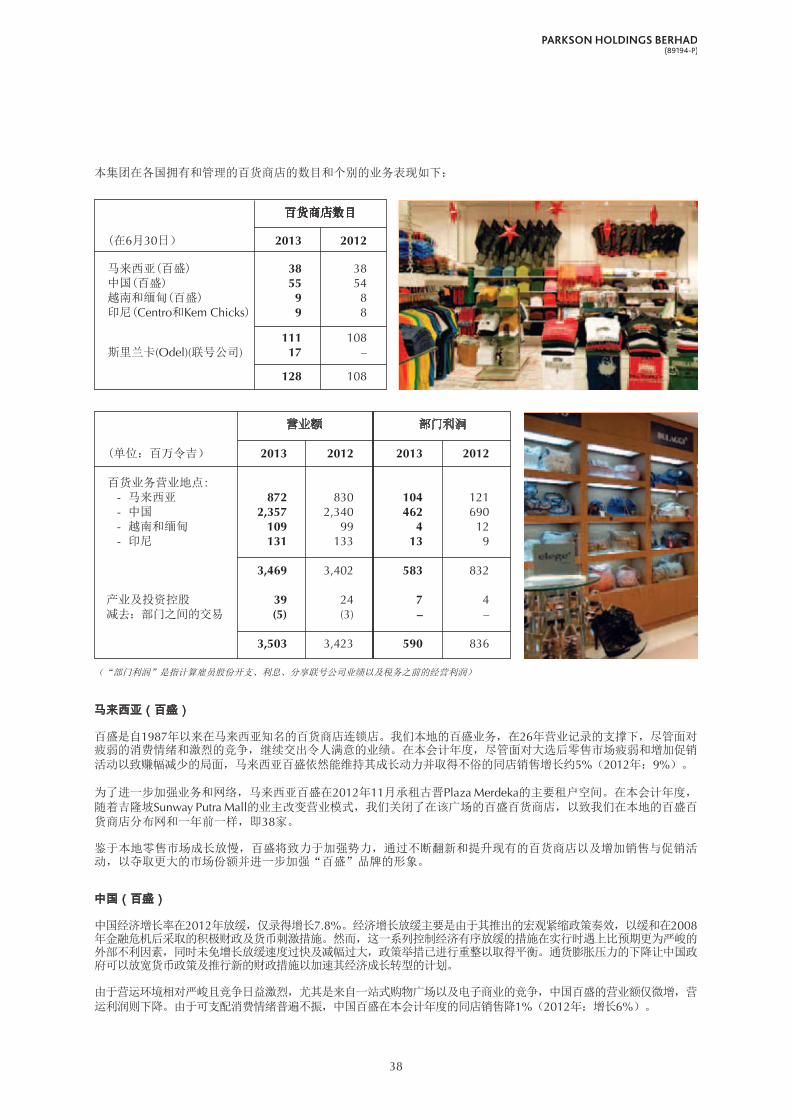
38
本集团在各国拥有和管理的百货商店的数目和个别的业务表现如下:
百货商店数目
(在6月30日) 2013 2012
马来西亚(百盛) 38 38 中国(百盛) 55 54 越南和缅甸(百盛) 9 8 印尼(Centro和Kem Chicks) 9 8
111 108 斯里兰卡(Odel)(联号公司) 17 –
128 108
(单位:百万令吉) 2013 2012 2013 2012
百货业务营业地点: - 马来西亚 872 830 104 121 - 中国 2,357 2,340 462 690 - 越南和缅甸 109 99 4 12 - 印尼 131 133 13 9
3,469 3,402 583 832
产业及投资控股 39 24 7 4 减去:部门之间的交易 (5) (3) – –
3,503 3,423 590 836
(“部门利润”是指计算雇员股份开支、利息、分享联号公司业绩以及税务之前的经营利润)
马来西亚(百盛)
百盛是自1987年以来在马来西亚知名的百货商店连锁店。我们本地的百盛业务,在26年营业记录的支撑下,尽管面对疲弱的消费情绪和激烈的竞争,继续交出令人满意的业绩。在本会计年度,尽管面对大选后零售市场疲弱和增加促销活动以致赚幅减少的局面,马来西亚百盛依然能维持其成长动力并取得不俗的同店销售增长约5%(2012年:9%)。
为了进一步加强业务和网络,马来西亚百盛在2012年11月承租古晋Plaza Merdeka的主要租户空间。在本会计年度,随着吉隆坡Sunway Putra Mall的业主改变营业模式,我们关闭了在该广场的百盛百货商店,以致我们在本地的百盛百货商店分布网和一年前一样,即38家。
鉴于本地零售市场成长放慢,百盛将致力于加强势力,通过不断翻新和提升现有的百货商店以及增加销售与促销活动,以夺取更大的市场份额并进一步加强“百盛”品牌的形象。
中国(百盛)
中国经济增长率在2012年放缓,仅录得增长7.8%。经济增长放缓主要是由于其推出的宏观紧缩政策奏效,以缓和在2008年金融危机后采取的积极财政及货币刺激措施。然而,这一系列控制经济有序放缓的措施在实行时遇上比预期更为严峻的外部不利因素,同时未免增长放缓速度过快及减幅过大,政策举措已进行重整以取得平衡。通货膨胀压力的下降让中国政府可以放宽货币政策及推行新的财政措施以加速其经济成长转型的计划。
由于营运环境相对严峻且竞争日益激烈,尤其是来自一站式购物广场以及电子商业的竞争,中国百盛的营业额仅微增,营运利润则下降。由于可支配消费情绪普遍不振,中国百盛在本会计年度的同店销售降1%(2012年:增长6%)。

39
鉴于以上情况,本集团相应放缓扩张计划,在本会计年度只开设4家新店。为配合本集团在优化其门店组合,提升门店形象及改善经营效益的努力,中国百盛在本会计年度关闭2家百货商店和终止一家管理店的管理协议。截止2013年6月30日,本集团在中国35个城市经营55家百货商店。
中国百盛将继续其扩充策略,在现有市场或邻近城市开设较少但规模更大的新店,以充分利用本集团的许多优势。为保持其竞争优势,新店的平均规模将逐渐扩大,因为本集团追求提升其商品价值及服务素质,务求为客户提供更优质的服务。本集团也将继续投资在商品配搭,旨在领先竞争者在市场推介最新且具特色的产品系列。
在本会计年度,中国百盛连同马来西亚百盛,推介电子商务平台,这构成更广泛的多元管道经销计划的一部分,使到本集团能更好地为其顾客服务。
越南和缅甸(百盛)
自上一个会计年度以来,越南的经济面对各种挑战,导致政府采取紧缩政策以抑制经济成长。在本会计年度,越南百盛同样遭受经济危机打击,同店销售降约1%(2012年:增长9%)。为缓和以上挑战,越南百盛已对营业策略进行所需的调整以迎合具挑战性和迅速变化的营运环境。
截至2013年6月30日,越南百盛拥有8家百货商店 (包括3家管理百货商店),位于越南的三大城市,即胡志明市(5家),河内(2家)以及海防(1家)。
在2013年5月,本组在缅甸首都仰光的FMI Centre,开设第一家百盛品牌的百货商店。本集团正计划扩展现有的业务,在未来几年内在印度支那国家开设更多的百货商店。
印尼 (百盛,Centro和Kem Chicks)
我们在2011年通过收购Centro品牌的百货商店进军印尼的零售业市场,这项业务继续取得令人鼓舞的业绩。本组表现良好,同店销售增长约6%(2012年:9%),也为本集团带来更高的利润。不过,由于印尼盾币值疲弱,本组取得1亿3千100万令吉的微低营业额。
本集团将在印尼执行双品牌策略,以Centro品牌夺取众多中产阶级市场的份额,同时推介百盛品牌的百货商店以迎合在印尼第一线城市上层阶级市场的需求。值得一提的是,本集团将会在印尼爪哇岛和巴厘岛以外的地区开设新店,即在苏门答腊岛和苏拉威西岛租赁场地开设新店。这样的扩充计划非常符合本集团的策略,通过在每一个市场个别的大城市和城镇立足,和顾客们接触。
斯里兰卡(百盛和Odel)
在2012年7月,本集团完成收购一家在斯里兰卡于科伦坡股票交易所挂牌的公司Odel PLC(“Odel”)。Odel是斯里兰卡领先的零售公司之一,在科伦坡和康提经营17家百货商店。截止2013年6月底,本集团拥有Odel47.5%的发行资本和缴足资本。
这项收购是本集团跨越东南亚零售业市场并在强劲成长的国家寻找机会的策略之一。这标志着本集团另一个新里程碑,相信能提供机会让本集团在斯里兰卡立足并把我们的百货商店连锁店开拓到亚洲其他地区。
产业与投资控股
本集团第一个本地自有的购物广场,吉隆坡百乐广场,在本会计年度继续保持约98%的高租用率。正确的租户组合,激动人心的促销活动以及优越的客户服务使吉隆坡百乐广场继续吸引更多顾客到访。另外,现代化和方便的购物亭,提供各类商品和服务,也为此购物广场吸引更多的购物者。
在本会计年度,此广场为本组提供3千800万令吉整年的营业额,相比上一年度营业8个月的业绩是2千300万令吉。自2011年10月开始营业以来,通过令人鼓舞的营业额以及不断改善的营运效益,这个购物广场继续对本集团作出积极贡献。

40
股息在2013年6月30日的会计年度,本公司总共派发了18仙的股息给股东(2012年:16仙)。派发的净股息大约1亿9千500万令吉(2012年:1亿7千400万令吉)。
总股息 (6月30日的会计年度) 2013 2012 中期 10 仙 10 仙 第二中期 8 仙 6 仙
终期 – – 总数 18 仙 16 仙
企业的社会责任我们意识到企业社会责任的重要性,并认为它是商业活动中不可或缺的一部份,并将继续承诺支持可为社区与环境带来正面影响的企业社会责任的倡议。
社区
本集团在展开商业活动时,深切了解到作为企业公民的责任,在提高利润和股东企业价值的同时,也要回馈社会。作为金狮集团成立的两项基金的成员,本集团着重于通过这两项基金,以教育和医疗服务来回馈社会。
金狮百盛基金拨款供许多用途诸如教育、慈善和科学研究;每年都提供奖学金给在本地大学深造的在籍大学本科生。金狮集团医药援助基金则为迫切需要医疗,患严重疾病的不幸社群提供财务援助,包括手术、购置医疗器仪和药物。这项基金也赞助社区保健计划如医疗营,并且添购洗肾机器给那些提供津贴治疗服务给肾病患者的洗肾中心。
本集团也联合全国百盛商店主办年度回校慈善活动,提供回收箱给大众以便捐献学校必需品如校服、鞋子和文具,然后分发给全国各地有需要的学童。百盛也和其商业附属伙伴,诸如化妆品公司合作,把其在百盛百货商店内的档位销售产品收入的一部份捐作慈善用途。
环境
在“百盛关怀我的公园”计划下,本集团“领养”各州属的公园,提供维修让周围的社区得以享用。这项计划涉及修复、加强与提升公园环境与休闲设施,为大众提倡绿色环境与更健康的生活方式。
百盛对保护环境的承诺,也反映在其参与各州“无塑胶袋日”的活动,以减少对塑胶袋的使用;以及与其商业伙伴参与一项重植计划以恢复红树林。
展望
配合中国的中期至长期经济改革以把其经济增长目标转移到更高的国内消费,本集团深信正在崛起的中国中产阶级在未来十年将会继续增加。鉴于本集团的行销集中在中至中高档阶级市场,本集团将尽占宏观经济发展的优势。然而,竞争形势在迅速改变的百货商店业务预料在近期仍具挑战性,因此业内合并将无可避免。凭藉本集团良好的资产负债表和强劲的百盛品牌资产,本集团已为百货商店业内合并准备就绪。
关于东南亚的零售业务,本集团拥有业务的国家继续取得经济扩展,对百盛而言是吉兆,预示着我们的百货商店的设计和所提供的商品将能迎合正在兴起的中产阶级的需求和期待。我们相信,我们的百货商店扩展策略将使到我们在这些国家的零售市场,开拓大体上服务不够周全的中产阶级至高等收入阶层的市场,其优势潜能和回酬将是不凡的。
本组管理购物广场的业务,随着人民的收入日益提高和国家日益繁荣,马来西亚购物广场的数目逐渐增加。更多的购物广场意味着更激烈的竞争以争取顾客和租户。不过,本集团因为百盛百货商店是其本身的主要租户而占优势,使到本组能够吸引更多的购物者人流和良好的租户组合。本集团将继续寻找配合其发展策略,在关键地点寻找扩展机会。
41
董事部
本集团热烈欢迎Zainab binti Dato’ Hj. Mohamed女士在本会计年度被委任为本公司的独立非执行董事。董事部确信本公司将从她宝贵的经验和专长中受惠。
在即将召开的常年股东大会,郑善营先生将荣休并不会寻求连任本公司的董事。郑先生任本公司的提名委员会和薪酬委员会的委员。我谨代表董事部,对于郑先生在担任本公司董事以及上述两个委员会的委员所做出的杰出贡献表达真诚的谢意。
鸣谢我谨代表董事部,真诚感谢所有尊贵的客户、供应商、银行家、商业伙伴、政府机构以及股东们,继续给予本集团支持与合作,及对本集团有信心。
我也要最真诚感谢董事们,在过去一年来给予的可贵指导,支持和所作的贡献,也要感谢我们各级雇员不懈的献身精神及对本集团的贡献。
主席丹斯里锺廷森

42
FINANCIAL STATEMENTS
2013For The Financial Year Ended 30 June 2013
DIRECTORS’ REPORT
The Directors hereby present their report together with the audited financial statements of the Group and of the Company for the financial year ended 30 June 2013.
PRINCIPAL ACTIVITIES
The principal activity of the Company is investment holding. The principal activities of its subsidiaries are set out in Note 16 to the financial statements. There have been no significant changes in the nature of the principal activities of the Company and of the Group during the financial year.
RESULTS
Group Company RM’000 RM’000
Profit/(Loss) for the year 436,442 (3,598,419)
Profit/(Loss) for the year attributable to: Owners of the parent 239,708 (3,598,419) Non-controlling interests 196,734 –
436,442 (3,598,419)
There were no material transfers to or from reserves or provisions during the financial year other than as disclosed in the financial statements.
In the opinion of the Directors, the results of the operations of the Group and of the Company during the financial year were not substantially affected by any item, transaction or event of a material and unusual nature, other than the allowance made for impairment loss on an amount due from a subsidiary which resulted in a loss of RM3,777,000,000 to the Company as disclosed in Note 21 to the financial statements.
DIVIDENDS
The amount of dividends paid by the Company since 30 June 2012 were as follows:
RM’million
In respect of the financial year ended 30 June 2013:
• Aninterimsingletierdividendof10%(10senpershare)wasdeclaredon12November2012 and paid on 10 December 2012; and 108• Asecondinterimsingletierdividendof8%(8senpershare)wasdeclaredon24April2013 and paid on 22 May 2013. 87
Total dividends paid since 30 June 2012 195
The Directors do not recommend the payment of a final dividend in respect of the current financial year.
43
DIRECTORS
The Directors of the Company in office since the date of the last report and at the date of this report are:
Tan Sri William H.J. ChengTan Sri Abd Rahman Bin MamatZainab binti Dato’ Hj. Mohamed (Appointed on 23.11.2012)Yeow Teck ChaiCheng Sin YengDr Folk Jee Yoong (Retired on 21.11.2012)
Mr Cheng Sin Yeng retires at the forthcoming Annual General Meeting and does not seek re-election at the forthcoming Annual General Meeting.
In accordance with Article 99 of the Company’s Articles of Association, Cik Zainab binti Dato’ Hj. Mohamed who was appointed during the financial year retires at the forthcoming Annual General Meeting and, being eligible, offers herself for re-election.
Pursuant to Section 129(6) of the Companies Act, 1965, Y. Bhg. Tan Sri William H.J. Cheng retires and offers himself for re-appointment as Director of the Company to hold office until the next Annual General Meeting.
DIRECTORS’ BENEFITS
Neither at the end of the financial year, nor at any time during that year, did there subsist any arrangement to which the Company was a party, whereby the Directors might acquire benefits by means of the acquisition of shares in, or debentures of, the Company or any other body corporate.
Since the end of the previous financial year, no Director of the Company has received or become entitled to receive a benefit (other than the benefits included in the aggregate amount of emoluments received or due and receivable by the Directors as shown in Note 8(b) to the financial statements or the fixed salary of a full time employee of the Company) by reason of a contract made by the Company or a related corporation with any Director or with a firm of which the Director is a member, or with a company in which the Director has a substantial financial interest, except as disclosed in Note 34 to the financial statements.
DIRECTORS’ INTERESTS
According to the Register of Directors’ Shareholdings, the interests of the Directors in office at the end of the financial year in shares in the Company during and at the end of the financial year are as follows:
Number of ordinary shares of RM1.00 each 1.7.2012 Acquired Disposed 30.6.2013
Tan Sri William H.J. ChengDirect interest 218,439,012 – – 218,439,012 Indirect interest 300,330,856 – 5,872 300,324,984

44
DIRECTORS’ INTERESTS (continued)
The interests of the Directors in office at the end of the financial year in shares in the related corporations during and at the end of the financial year are as follows:
Nominal value per ordinary Number of shares share 1.7.2012 Acquired Disposed 30.6.2013
Tan Sri William H.J. ChengDirect Interest
Parkson Retail Asia Limited (“Parkson Asia”) * 500,000 – – 500,000
Tan Sri William H.J. ChengIndirect Interest
Kiara Innovasi Sdn Bhd RM1.00 3,000,000 – – 3,000,000 Parkson Asia * 457,983,300 – – 457,983,300 Parkson Retail Group Limited HK$0.02 1,448,270,000 – – 1,448,270,000
Nominal value per ordinary Number of shares share 15.2.2013# Acquired Disposed 30.6.2013
Parkson Myanmar Investment Company Pte Ltd * 2,100,000 – – 2,100,000
Currency 1.7.2012 Acquired Disposed 30.6.2013
Investments in the People’s Republic of China
Chongqing Wanyou Parkson Plaza Co Ltd Rmb 21,000,000 – – 21,000,000 Dalian Tianhe Parkson Shopping Centre Co Ltd Rmb 60,000,000 – – 60,000,000 Guizhou Shenqi Parkson Retail Development Co Ltd Rmb 10,200,000 – – 10,200,000 Qingdao No. 1 Parkson Co Ltd Rmb 223,796,394 – – 223,796,394 Wuxi Sanyang Parkson Plaza Co Ltd Rmb 48,000,000 – – 48,000,000 Xinjiang Youhao Parkson Development Co Ltd Rmb 10,200,000 – – 10,200,000
Investment in Vietnam
Parkson Hanoi Co Ltd US$ 3,360,000 – – 3,360,000
* Shares in companies incorporated in Singapore do not have a par value.# Became a related corporation on 15 February 2013.
Save as disclosed above, none of the other Directors in office at the end of the financial year had any interest in shares in the Company or its related corporations during and at the end of the financial year.

45
TREASURY SHARES
During the financial year, the Company repurchased a total of 3,086,400 of its issued ordinary shares from the open market at an average price of RM4.05 per share. The total consideration paid for the repurchase including transaction costs was RM12.49 million. The repurchase transactions were financed by internally generated funds. The shares repurchased are being held as treasury shares in accordance with Section 67A of the Companies Act, 1965.
As at 30 June 2013, the Company held 12,389,631 treasury shares with a carrying amount of RM58.17 million and further relevant details are disclosed in Note 27 to the financial statements.
ExECUTIVE SHARE OPTION SCHEME (“ESOS”)
The ESOS of the Company became effective on 7 May 2008 and will expire on 6 May 2018 upon its renewal for a further period of five years from 7 May 2013 to 6 May 2018. The main features of the ESOS are set out in Note 29 to the financial statements.
The persons to whom the options have been granted have no right to participate, by virtue of the options, in any share issue of any other company.
The movements in the number of options granted, exercised and lapsed pursuant to the ESOS during the financial year are as follows:
Subscription price per Number of options Grant date share 1.7.2012 Granted Exercised Lapsed 30.6.2013
7 April 2010 RM5.31 70,000 – – – 70,000
OTHER STATUTORY INFORMATION
(a) Before the income statements, the statements of comprehensive income and the statements of financial position of the Group and of the Company were made out, the Directors took reasonable steps:
(i) to ascertain that proper action had been taken in relation to the writing off of bad debts and the making of allowance for doubtful debts and had satisfied themselves that there were no known bad debts and that adequate allowance had been made for doubtful debts; and
(ii) to ensure that any current assets which were unlikely to realise their values as shown in the accounting records in the ordinary course of business had been written down to an amount which they might be expected so to realise.
(b) At the date of this report, the Directors are not aware of any circumstances which would render:
(i) it necessary to write off any bad debts or the amount of the allowance for doubtful debts inadequate to any substantial extent in respect of these financial statements; and
(ii) the values attributed to the current assets in the financial statements of the Group and of the Company misleading.
(c) At the date of this report, the Directors are not aware of any circumstances which have arisen which would render adherence to the existing method of valuation of assets or liabilities of the Group and of the Company misleading or inappropriate.
(d) At the date of this report, the Directors are not aware of any circumstances not otherwise dealt with in this report or the financial statements of the Group and of the Company which would render any amount stated in the financial statements misleading.
46
OTHER STATUTORY INFORMATION (continued)
(e) At the date of this report, there does not exist:
(i) any charge on the assets of the Group or of the Company which has arisen since the end of the financial year which secures the liabilities of any other person; or
(ii) any contingent liability of the Group or of the Company which has arisen since the end of the financial year.
(f) In the opinion of the Directors:
(i) no contingent or other liability has become enforceable or is likely to become enforceable within the period of twelve months after the end of the financial year which will or may affect the ability of the Group and of the Company to meet their obligations when they fall due; and
(ii) no item, transaction or event of a material and unusual nature has arisen in the interval between the end of the financial year and the date of this report which is likely to affect substantially the results of the operations of the Group and of the Company for the financial year in which this report is made, except as disclosed in Note 37 to the financial statements.
SIGNIFICANT EVENTS
Significant events during the financial year are disclosed in Note 36 to the financial statements.
SUBSEqUENT EVENTS
Details of subsequent events are disclosed in Note 37 to the financial statements.
AUDITORS
The auditors, Ernst & Young, have expressed their willingness to continue in office.
Signed on behalf of the Board in accordance with a resolution of the Directors dated 18 October 2013.
TAN SRI WILLIAM H.J. CHENG CHENG SIN YENGChairman and Managing Director Director
Kuala Lumpur, Malaysia
47
We, Tan Sri William H.J. Cheng and Cheng Sin Yeng, being two of the Directors of Parkson Holdings Berhad, do hereby state that, in the opinion of the Directors, the accompanying financial statements set out on pages 50 to 160 are drawn up in accordance with Malaysian Financial Reporting Standards, International Financial Reporting Standards and the requirements of the Companies Act, 1965 in Malaysia, so as to give a true and fair view of the financial positions of the Group and of the Company as at 30 June 2013 and of their financial performance and cash flows for the year then ended.
The supplementary information set out in Note 44 to the financial statements on page 161 has been prepared in accordance with Guidance on Special Matter No. 1, DeterminationofRealisedandUnrealisedProfitsorLossesintheContextofDisclosuresPursuanttoBursaMalaysiaSecuritiesBerhadListingRequirements, as issued by the Malaysian Institute of Accountants and the directive of Bursa Malaysia Securities Berhad.
Signed on behalf of the Board in accordance with a resolution of the Directors dated 18 October 2013.
TAN SRI WILLIAM H.J. CHENG CHENG SIN YENGChairman and Managing Director Director
Kuala Lumpur, Malaysia
I, Tan Sri William H.J. Cheng, the Director primarily responsible for the financial management of Parkson Holdings Berhad, do solemnly and sincerely declare that the accompanying financial statements set out on pages 50 to 161 are in my opinion correct, and I make this solemn declaration conscientiously believing the same to be true and by virtue of the provisions of the Statutory Declarations Act, 1960.
Subscribed and solemnly declared by theabovenamed Tan Sri William H.J. Chengat Kuala Lumpur in the Federal Territoryon 18 October 2013. TAN SRI WILLIAM H.J. CHENG
Before me,
W530TAN SEOK KETTCommissioner for OathsKuala Lumpur
STATEMENT BY DIRECTORSPURSUANT TO SECTION 169(15) OF THE COMPANIES ACT, 1965
STATUTORY DECLARATIONPURSUANT TO SECTION 169(16) OF THE COMPANIES ACT, 1965
48
INDEPENDENT AUDITORS’ REPORTTO THE MEMBERS OF PARKSON HOLDINGS BERHAD
REPORT ON THE FINANCIAL STATEMENTS
We have audited the financial statements of Parkson Holdings Berhad, which comprise the statements of financial position as at 30 June 2013 of the Group and of the Company, and the income statements, statements of comprehensive income, statements of changes in equity and statements of cash flows of the Group and of the Company for the year then ended, and a summary of significant accounting policies and other explanatory notes, as set out on pages 50 to 160.
Directors’responsibilityforthefinancialstatements
The Directors of the Company are responsible for the preparation of financial statements so as to give a true and fair view in accordance with Malaysian Financial Reporting Standards, International Financial Reporting Standards and the requirements of the Companies Act, 1965 in Malaysia. The Directors are also responsible for such internal control as the Directors determine is necessary to enable the preparation of financial statements that are free from material misstatement, whether due to fraud or error.
Auditors’responsibility
Our responsibility is to express an opinion on these financial statements based on our audit. We conducted our audit in accordance with approved standards on auditing in Malaysia. Those standards require that we comply with ethical requirements and plan and perform the audit to obtain reasonable assurance about whether the financial statements are free from material misstatement.
An audit involves performing procedures to obtain audit evidence about the amounts and disclosures in the financial statements. The procedures selected depend on our judgement, including the assessment of risks of material misstatement of the financial statements, whether due to fraud or error. In making those risk assessments, we consider internal control relevant to the entity’s preparation of financial statements that give a true and fair view in order to design audit procedures that are appropriate in the circumstances, but not for the purpose of expressing an opinion on the effectiveness of the entity’s internal control. An audit also includes evaluating the appropriateness of accounting policies used and the reasonableness of accounting estimates made by the Directors, as well as evaluating the overall presentation of the financial statements.
We believe that the audit evidence we have obtained is sufficient and appropriate to provide a basis for our audit opinion.
Opinion
In our opinion, the financial statements give a true and fair view of the financial position of the Group and of the Company as at 30 June 2013 and of their financial performance and cash flows for the year then ended in accordance with Malaysian Financial Reporting Standards, International Financial Reporting Standards and the requirements of the Companies Act, 1965 in Malaysia.
REPORT ON OTHER LEGAL AND REGULATORY REqUIREMENTS
In accordance with the requirements of the Companies Act, 1965 (“Act”) in Malaysia, we also report the following:
(a) In our opinion, the accounting and other records and the registers required by the Act to be kept by the Company and its subsidiaries of which we have acted as auditors have been properly kept in accordance with the provisions of the Act.
(b) We have considered the financial statements and the auditors’ reports of all the subsidiaries of which we have not acted as auditors, which are indicated in Note 16 to the financial statements, being financial statements that have been included in the consolidated financial statements.
(c) We are satisfied that the financial statements of the subsidiaries that have been consolidated with the financial statements of the Company are in form and content appropriate and proper for the purposes of the preparation of the consolidated financial statements and we have received satisfactory information and explanations required by us for those purposes.
(d) The auditors’ reports on the financial statements of the subsidiaries were not subject to any qualification material to the consolidated financial statements and did not include any comment required to be made under Section 174(3) of the Act.
49
OTHER REPORTING RESPONSIBILITIES
The supplementary information set out in Note 44 to the financial statements on page 161 is disclosed to meet the requirement of Bursa Malaysia Securities Berhad and is not part of the financial statements. The Directors are responsible for the preparation of the supplementary information in accordance with Guidance on Special Matter No. 1, DeterminationofRealisedandUnrealisedProfitsorLossesintheContextofDisclosuresPursuanttoBursaMalaysiaSecuritiesBerhadListingRequirements, as issued by the Malaysian Institute of Accountants (“MIA Guidance”) and the directive of Bursa Malaysia Securities Berhad. In our opinion, the supplementary information is prepared, in all material respects, in accordance with the MIA Guidance and the directive of Bursa Malaysia Securities Berhad.
OTHER MATTERS
(a) As stated in Note 2.2 to the financial statements, Parkson Holdings Berhad adopted Malaysian Financial Reporting Standards on 1 July 2012 with a transition date of 1 July 2011. These standards were applied retrospectively by the Directors to the comparative information in these financial statements, including the statements of financial position as at 30 June 2012 and 1 July 2011, and the income statements, statements of comprehensive income, statements of changes in equity and statements of cash flows for the year ended 30 June 2012 and related disclosures. We were not engaged to report on the comparative information and it is unaudited. Our responsibilities as part of our audit of the financial statements of the Group and of the Company for the year ended 30 June 2013 have, in these circumstances, included obtaining sufficient appropriate audit evidence that the opening balances as at 1 July 2012 do not contain misstatements that materially affect the financial position as at 30 June 2013 and financial performance and cash flows for the year then ended.
(b) This report is made solely to the members of the Company, as a body, in accordance with Section 174 of the Companies Act, 1965 in Malaysia and for no other purpose. We do not assume responsibility to any other person for the content of this report.
ERNST & YOUNG LOW KHUNG LEONGAF: 0039 No. 2697/01/15(J)Chartered Accountants Chartered Accountant
Kuala Lumpur, Malaysia18 October 2013
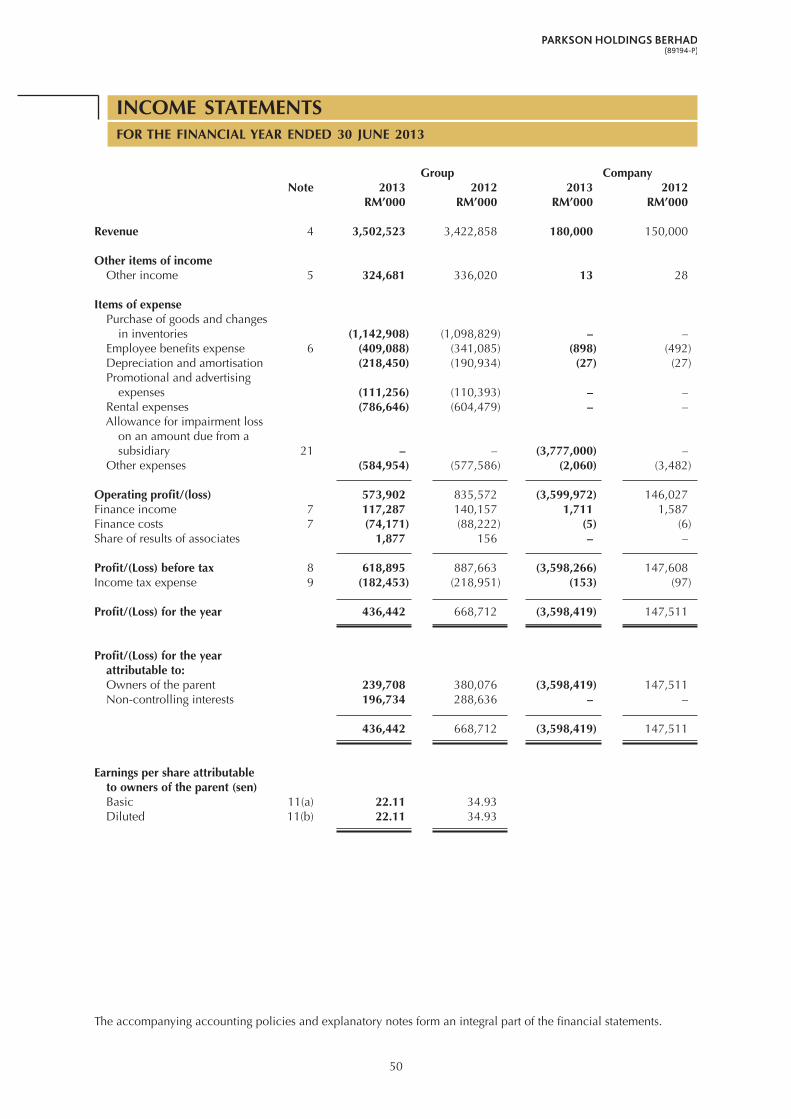
50
INCOME STATEMENTSFOR THE FINANCIAL YEAR ENDED 30 JUNE 2013
Group Company Note 2013 2012 2013 2012 RM’000 RM’000 RM’000 RM’000
Revenue 4 3,502,523 3,422,858 180,000 150,000
Other items of income Other income 5 324,681 336,020 13 28
Items of expense Purchase of goods and changes in inventories (1,142,908) (1,098,829) – – Employee benefits expense 6 (409,088) (341,085) (898) (492) Depreciation and amortisation (218,450) (190,934) (27) (27) Promotional and advertising expenses (111,256) (110,393) – – Rental expenses (786,646) (604,479) – – Allowance for impairment loss on an amount due from a subsidiary 21 – – (3,777,000) – Other expenses (584,954) (577,586) (2,060) (3,482)
Operating profit/(loss) 573,902 835,572 (3,599,972) 146,027 Finance income 7 117,287 140,157 1,711 1,587 Finance costs 7 (74,171) (88,222) (5) (6)Share of results of associates 1,877 156 – –
Profit/(Loss) before tax 8 618,895 887,663 (3,598,266) 147,608 Income tax expense 9 (182,453) (218,951) (153) (97)
Profit/(Loss) for the year 436,442 668,712 (3,598,419) 147,511 Profit/(Loss) for the year attributable to: Owners of the parent 239,708 380,076 (3,598,419) 147,511 Non-controlling interests 196,734 288,636 – –
436,442 668,712 (3,598,419) 147,511
Earnings per share attributable to owners of the parent (sen) Basic 11(a) 22.11 34.93 Diluted 11(b) 22.11 34.93
The accompanying accounting policies and explanatory notes form an integral part of the financial statements.
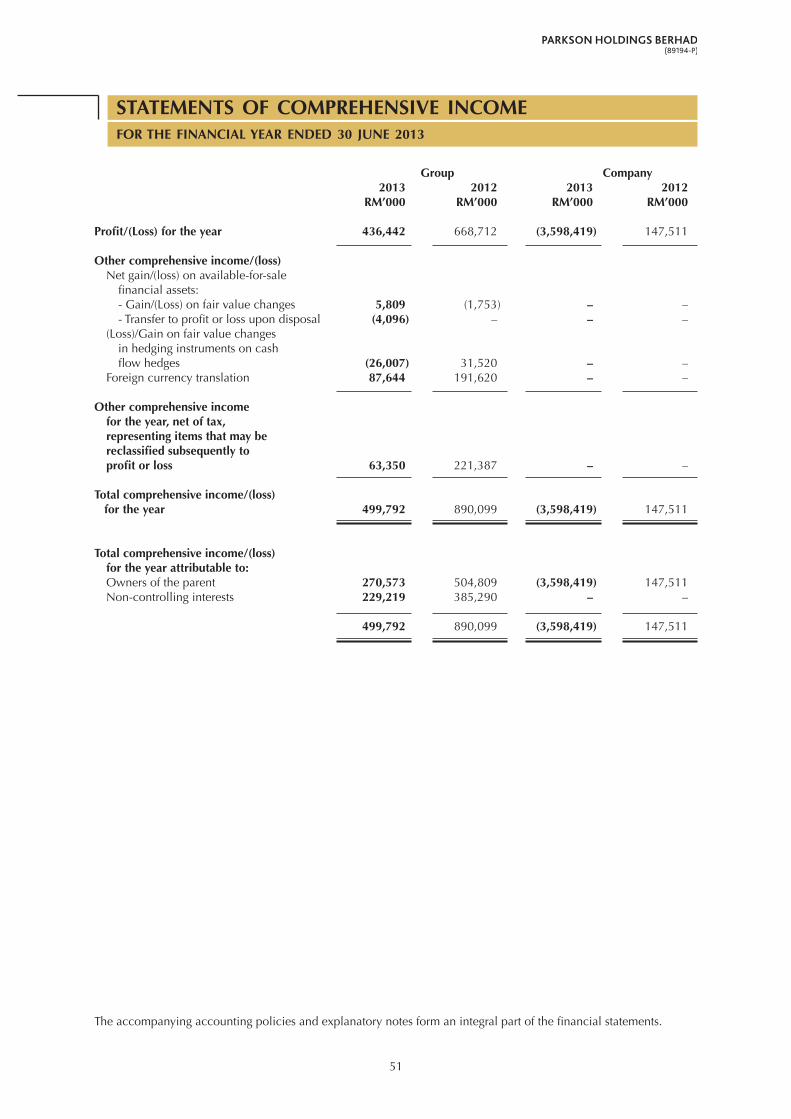
51
STATEMENTS OF COMPREHENSIVE INCOMEFOR THE FINANCIAL YEAR ENDED 30 JUNE 2013
Group Company 2013 2012 2013 2012 RM’000 RM’000 RM’000 RM’000
Profit/(Loss) for the year 436,442 668,712 (3,598,419) 147,511
Other comprehensive income/(loss) Net gain/(loss) on available-for-sale financial assets: - Gain/(Loss) on fair value changes 5,809 (1,753) – – - Transfer to profit or loss upon disposal (4,096) – – – (Loss)/Gain on fair value changes in hedging instruments on cash flow hedges (26,007) 31,520 – – Foreign currency translation 87,644 191,620 – –
Other comprehensive income for the year, net of tax, representing items that may be reclassified subsequently to profit or loss 63,350 221,387 – –
Total comprehensive income/(loss) for the year 499,792 890,099 (3,598,419) 147,511
Total comprehensive income/(loss) for the year attributable to: Owners of the parent 270,573 504,809 (3,598,419) 147,511 Non-controlling interests 229,219 385,290 – –
499,792 890,099 (3,598,419) 147,511
The accompanying accounting policies and explanatory notes form an integral part of the financial statements.
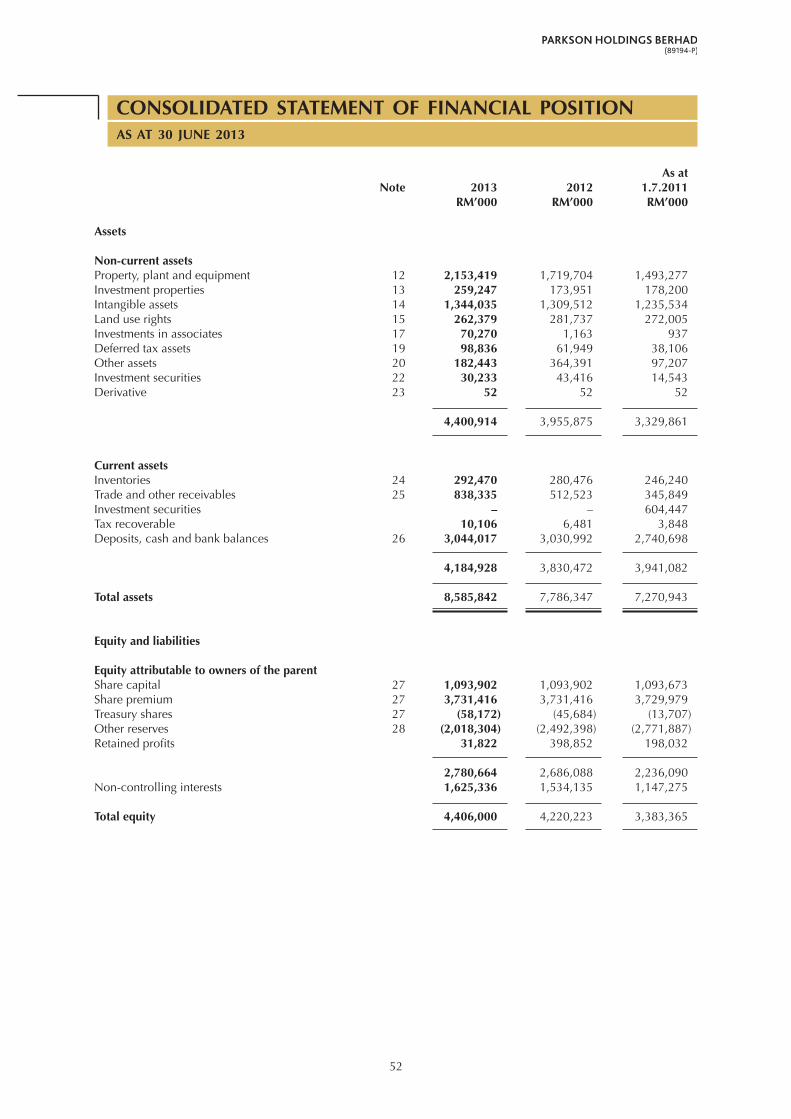
52
CONSOLIDATED STATEMENT OF FINANCIAL POSITIONAS AT 30 JUNE 2013
As at Note 2013 2012 1.7.2011 RM’000 RM’000 RM’000
Assets
Non-current assetsProperty, plant and equipment 12 2,153,419 1,719,704 1,493,277 Investment properties 13 259,247 173,951 178,200 Intangible assets 14 1,344,035 1,309,512 1,235,534 Land use rights 15 262,379 281,737 272,005 Investments in associates 17 70,270 1,163 937 Deferred tax assets 19 98,836 61,949 38,106 Other assets 20 182,443 364,391 97,207 Investment securities 22 30,233 43,416 14,543 Derivative 23 52 52 52
4,400,914 3,955,875 3,329,861
Current assetsInventories 24 292,470 280,476 246,240 Trade and other receivables 25 838,335 512,523 345,849 Investment securities – – 604,447 Tax recoverable 10,106 6,481 3,848 Deposits, cash and bank balances 26 3,044,017 3,030,992 2,740,698
4,184,928 3,830,472 3,941,082 Total assets 8,585,842 7,786,347 7,270,943
Equity and liabilities
Equity attributable to owners of the parentShare capital 27 1,093,902 1,093,902 1,093,673 Share premium 27 3,731,416 3,731,416 3,729,979 Treasury shares 27 (58,172) (45,684) (13,707)Other reserves 28 (2,018,304) (2,492,398) (2,771,887)Retained profits 31,822 398,852 198,032
2,780,664 2,686,088 2,236,090 Non-controlling interests 1,625,336 1,534,135 1,147,275
Total equity 4,406,000 4,220,223 3,383,365

53
As at Note 2013 2012 1.7.2011 RM’000 RM’000 RM’000
Non-current liabilitiesDeferred tax liabilities 19 134,122 119,714 114,085 Loans and borrowings 30 1,579,669 1,245,822 739,151 Long term payables 32 214,799 122,953 73,050 Derivative financial instruments designated as hedging instruments 39(c) – 14,798 22,236
1,928,590 1,503,287 948,522
Current liabilitiesTrade and other payables and other liabilities 33 2,210,364 2,017,557 1,703,585 Loans and borrowings 30 20 171 1,184,457 Tax payables 40,868 45,109 46,497 Derivative financial instruments designated as hedging instruments – – 4,517
2,251,252 2,062,837 2,939,056
Total liabilities 4,179,842 3,566,124 3,887,578
Total equity and liabilities 8,585,842 7,786,347 7,270,943
The accompanying accounting policies and explanatory notes form an integral part of the financial statements.
CONSOLIDATED STATEMENT OF FINANCIAL POSITIONAS AT 30 JUNE 2013 (continued)
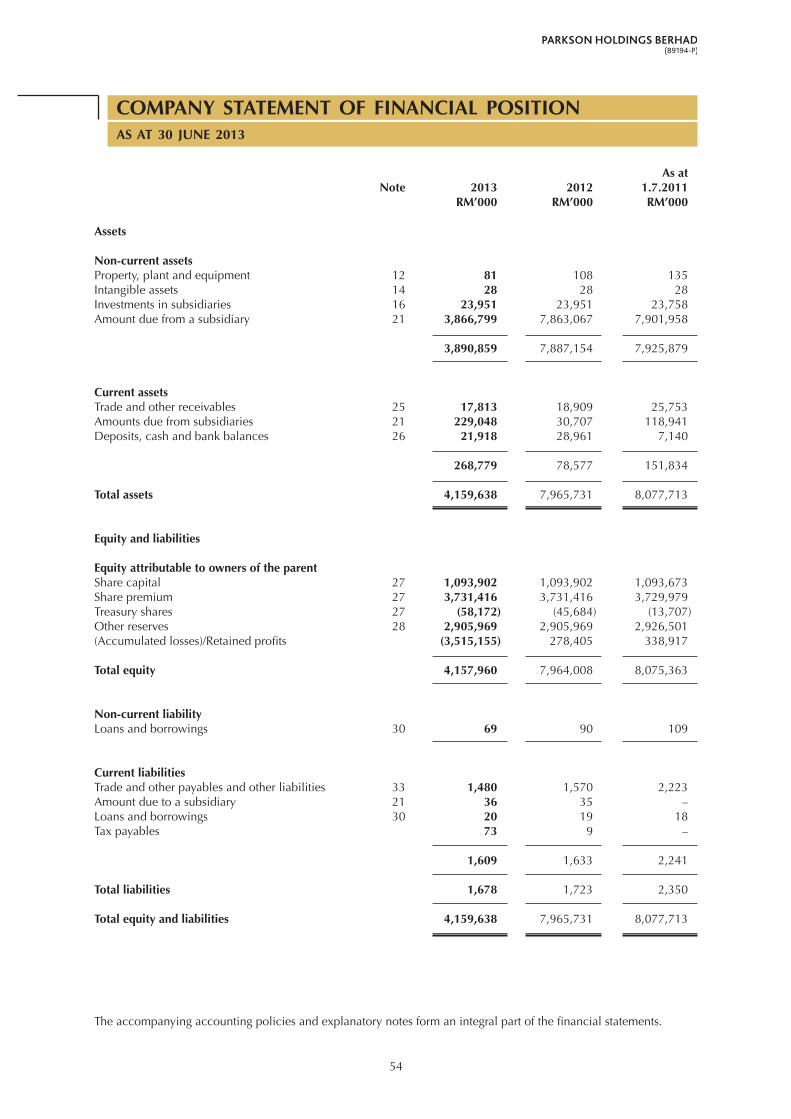
54
COMPANY STATEMENT OF FINANCIAL POSITIONAS AT 30 JUNE 2013
As at Note 2013 2012 1.7.2011 RM’000 RM’000 RM’000
Assets
Non-current assetsProperty, plant and equipment 12 81 108 135Intangible assets 14 28 28 28 Investments in subsidiaries 16 23,951 23,951 23,758 Amount due from a subsidiary 21 3,866,799 7,863,067 7,901,958
3,890,859 7,887,154 7,925,879
Current assetsTrade and other receivables 25 17,813 18,909 25,753 Amounts due from subsidiaries 21 229,048 30,707 118,941 Deposits, cash and bank balances 26 21,918 28,961 7,140
268,779 78,577 151,834
Total assets 4,159,638 7,965,731 8,077,713
Equity and liabilities
Equity attributable to owners of the parentShare capital 27 1,093,902 1,093,902 1,093,673 Share premium 27 3,731,416 3,731,416 3,729,979 Treasury shares 27 (58,172) (45,684) (13,707)Other reserves 28 2,905,969 2,905,969 2,926,501 (Accumulated losses)/Retained profits (3,515,155) 278,405 338,917
Total equity 4,157,960 7,964,008 8,075,363
Non-current liabilityLoans and borrowings 30 69 90 109
Current liabilitiesTrade and other payables and other liabilities 33 1,480 1,570 2,223Amount due to a subsidiary 21 36 35 –Loans and borrowings 30 20 19 18Tax payables 73 9 –
1,609 1,633 2,241
Total liabilities 1,678 1,723 2,350
Total equity and liabilities 4,159,638 7,965,731 8,077,713
The accompanying accounting policies and explanatory notes form an integral part of the financial statements.

55
CONSOLIDATED STATEMENT OF CHANGES IN EqUITYFOR THE FINANCIAL YEAR ENDED 30 JUNE 2013
Attributable to owners of the parent Non-distributable Non- Share Share Treasury Other Retained controlling Total Note capital premium shares reserves profits Total interests equity RM’000 RM’000 RM’000 RM’000 RM’000 RM’000 RM’000 RM’000 (Note 27) (Note 27) (Note 27) (Note 28)
At 1 July 2012 1,093,902 3,731,416 (45,684) (2,492,398) 398,852 2,686,088 1,534,135 4,220,223
Total comprehensive income for the year – – – 30,865 239,708 270,573 229,219 499,792
Transactions with ownersTransfer to capital reserves – – – 2,294 (2,294) – – –Dilution of interest in subsidiaries 16(c) – – – 7,357 16,082 23,439 (23,439) –Employee share options lapsed – – – (11,217) 11,217 – – –Employee share options exercised – – – (1) 14 13 12 25 Purchase of treasury shares 27 – – (12,488) – – (12,488) – (12,488)Transfer to merger deficit – – – 436,616 (436,616) – – –Equity-settled share option arrangements granted by a subsidiary – – – 8,180 – 8,180 7,695 15,875 Contributions by non-controlling interests – – – – – – 3,632 3,632 Dividends to non-controlling interests – – – – – – (125,918) (125,918)Dividends paid to shareholders of the Company 10 – – – – (195,141) (195,141) – (195,141)
Total transactions with owners – – (12,488) 443,229 (606,738) (175,997) (138,018) (314,015)
At 30 June 2013 1,093,902 3,731,416 (58,172) (2,018,304) 31,822 2,780,664 1,625,336 4,406,000
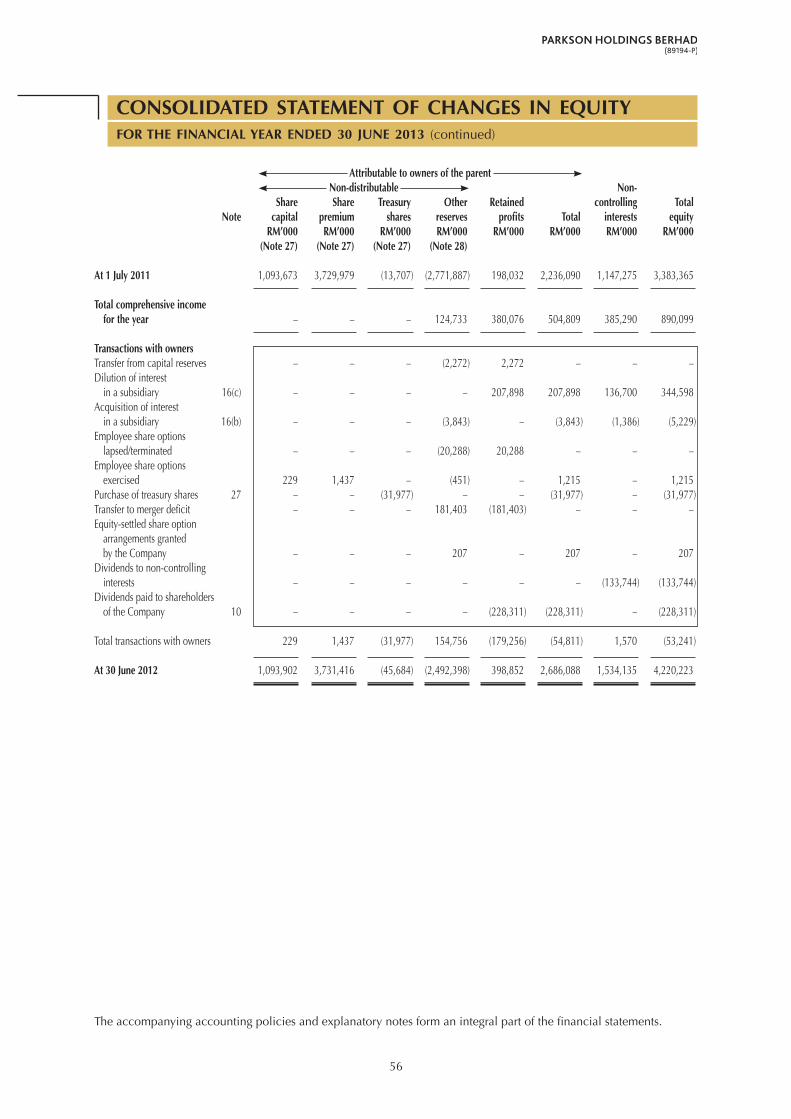
56
Attributable to owners of the parent Non-distributable Non- Share Share Treasury Other Retained controlling Total Note capital premium shares reserves profits Total interests equity RM’000 RM’000 RM’000 RM’000 RM’000 RM’000 RM’000 RM’000 (Note 27) (Note 27) (Note 27) (Note 28)
At 1 July 2011 1,093,673 3,729,979 (13,707) (2,771,887) 198,032 2,236,090 1,147,275 3,383,365
Total comprehensive income for the year – – – 124,733 380,076 504,809 385,290 890,099
Transactions with ownersTransfer from capital reserves – – – (2,272) 2,272 – – –Dilution of interest in a subsidiary 16(c) – – – – 207,898 207,898 136,700 344,598Acquisition of interest in a subsidiary 16(b) – – – (3,843) – (3,843) (1,386) (5,229)Employee share options lapsed/terminated – – – (20,288) 20,288 – – –Employee share options exercised 229 1,437 – (451) – 1,215 – 1,215 Purchase of treasury shares 27 – – (31,977) – – (31,977) – (31,977)Transfer to merger deficit – – – 181,403 (181,403) – – –Equity-settled share option arrangements granted by the Company – – – 207 – 207 – 207 Dividends to non-controlling interests – – – – – – (133,744) (133,744)Dividends paid to shareholders of the Company 10 – – – – (228,311) (228,311) – (228,311)
Total transactions with owners 229 1,437 (31,977) 154,756 (179,256) (54,811) 1,570 (53,241)
At 30 June 2012 1,093,902 3,731,416 (45,684) (2,492,398) 398,852 2,686,088 1,534,135 4,220,223
The accompanying accounting policies and explanatory notes form an integral part of the financial statements.
CONSOLIDATED STATEMENT OF CHANGES IN EqUITYFOR THE FINANCIAL YEAR ENDED 30 JUNE 2013 (continued)

57
COMPANY STATEMENT OF CHANGES IN EqUITYFOR THE FINANCIAL YEAR ENDED 30 JUNE 2013
(Accumulated) Non-distributable losses)/ Share Share Treasury Other Retained Total Note capital premium shares reserves profits equity RM’000 RM’000 RM’000 RM’000 RM’000 RM’000 (Note 27) (Note 27) (Note 27) (Note 28)
At 1 July 2012 1,093,902 3,731,416 (45,684) 2,905,969 278,405 7,964,008 Total comprehensive loss for the year – – – – (3,598,419) (3,598,419)
Transactions with owners Purchase of treasury shares 27 – – (12,488) – – (12,488)Dividends paid 10 – – – – (195,141) (195,141)
Total transactions with owners – – (12,488) – (195,141) (207,629)
At 30 June 2013 1,093,902 3,731,416 (58,172) 2,905,969 (3,515,155) 4,157,960
At 1 July 2011 1,093,673 3,729,979 (13,707) 2,926,501 338,917 8,075,363
Total comprehensive income for the year – – – – 147,511 147,511
Transactions with ownersEmployee share options lapsed/terminated – – – (20,288) 20,288 –Employee share options exercised 229 1,437 – (451) – 1,215Purchase of treasury shares 27 – – (31,977) – – (31,977)Equity-settled share option arrangements granted – – – 207 – 207Dividends paid 10 – – – – (228,311) (228,311)
Total transactions with owners 229 1,437 (31,977) (20,532) (208,023) (258,866)
At 30 June 2012 1,093,902 3,731,416 (45,684) 2,905,969 278,405 7,964,008
The accompanying accounting policies and explanatory notes form an integral part of the financial statements.

58
STATEMENTS OF CASH FLOWSFOR THE FINANCIAL YEAR ENDED 30 JUNE 2013
Group Company Note 2013 2012 2013 2012 RM’000 RM’000 RM’000 RM’000 Restated
Cash flows from operating activitiesProfit/(Loss) before tax 618,895 887,663 (3,598,266) 147,608Adjustments for: Allowance for impairment loss on an amount due from a subsidiary – – 3,777,000 – Depreciation and amortisation 8 218,450 190,934 27 27 Amortisation of deferred lease expenses and income, net 8 781 853 – – Property, plant and equipment written off 8 545 343 – – Goodwill written off 8 – 2,834 – – Impairment loss on goodwill 8 3,000 – – – (Reversal of)/Allowance for impairment loss on receivables, net 8 (815) 717 – – (Reversal of)/Write down of inventories 8 (77) 675 – – Employee share-based payment 6 15,875 207 – 14 Defined benefit plan 6 (1,380) 1,635 – – Unrealised exchange gain 8 (4,711) (6,625) – – Loss on disposal of property, plant and equipment 8 1,623 453 – – Gain on disposal of investment securities 8 (4,655) – – – Share of results of associates (1,877) (156) – – Interest expense 7 74,171 88,222 5 6 Interest income 7 (117,287) (140,157) (1,711) (1,587) Dividend income from: - A subsidiary 4 – – (180,000) (150,000) - Investment securities 4 (1,409) – – –
Operating profit/(loss) before working capital changes 801,129 1,027,598 (2,945) (3,932)
Changes in working capital: Inventories (7,096) (25,710) – – Receivables and other assets (113,189) (216,227) 22,926 135,142 Payables 212,044 290,473 (89) (618)
Net changes in working capital 91,759 48,536 22,837 134,524
Cash flows generated from operations 892,888 1,076,134 19,892 130,592 Taxes paid (222,563) (256,918) (89) (88)Interest paid (51,664) (91,459) (5) (6)Interest received 103,387 152,674 808 414
Net cash flows generated from operating activities 722,048 880,431 20,606 130,912

59
Group Company Note 2013 2012 2013 2012 RM’000 RM’000 RM’000 RM’000 Restated
Cash flows from investing activitiesPurchase of property, plant and equipment 12 (366,003) (308,309) – –Additions to investment properties 13 (95,869) (8,439) – –Additions to intangible assets 14 (3,690) (5,112) – –Proceeds from disposal of property, plant and equipment 4,808 1,601 – –Proceeds from disposal of investment securities 20,209 – – –Acquisition of interest in a subsidiary 16 – (5,229) – –Acquisition of an associate 17 (68,036) – – –Purchase of investment securities – (30,000) – –Prepayment for acquisition of land and building 20 – (211,338) – –Deposit paid for acquisition of land and building 25 (206,880) – – –Dividends received from: - A subsidiary – – 180,000 150,000 - An associate 701 191 – – - Investment securities 1,409 – – –Changes in deposits with banks (17,541) 63,942 – –
Net cash flows (used in)/generated from investing activities (730,892) (502,693) 180,000 150,000
Cash flows from financing activitiesDividends paid to: - Shareholders of the Company (195,141) (228,311) (195,141) (228,311) - Non-controlling interests (125,918) (133,744) – –Issuance of shares by: - The Company – 1,215 – 1,215 - A subsidiary 25 – – –Contributions by non-controlling interests 3,632 – – –Net proceeds from listing of a subsidiary 16 – 344,598 – –Purchase of treasury shares (12,900) (31,977) (12,488) (31,977)Proceeds from loans and borrowings 1,750,086 475,022 – –Repayment of loans, borrowings, notes and derivative liability (1,493,171) (618,127) – –Hire purchase principal payments (32) (42) (20) (18)
Net cash flows used in financing activities (73,419) (191,366) (207,649) (259,091)
Net (decrease)/increase in cash and cash equivalents (82,263) 186,372 (7,043) 21,821 Effects of changes in exchange rates 19,990 55,932 – –Cash and cash equivalents at 1 July 1,357,828 1,115,524 28,961 7,140
Cash and cash equivalents at 30 June 26 1,295,555 1,357,828 21,918 28,961
The accompanying accounting policies and explanatory notes form an integral part of the financial statements.
STATEMENTS OF CASH FLOWSFOR THE FINANCIAL YEAR ENDED 30 JUNE 2013 (continued)

60
NOTES TO THE FINANCIAL STATEMENTSFOR THE FINANCIAL YEAR ENDED 30 JUNE 2013
1. CORPORATE INFORMATION
The Company is a public limited liability company, incorporated and domiciled in Malaysia, and listed on the Main Market of Bursa Malaysia Securities Berhad (“Bursa Securities”). The registered office and the principal place of business of the Company are both located at Level 14, Office Tower, No. 1 Jalan Nagasari (Off Jalan Raja Chulan), 50200 Kuala Lumpur.
The principal activity of the Company is investment holding. The principal activities of its subsidiaries are set out in Note 16. There have been no significant changes in the nature of the principal activities of the Company and of the Group during the financial year.
The financial statements were authorised for issue by the Board of Directors in accordance with a resolution of the Directors on 18 October 2013.
2. SUMMARY OF SIGNIFICANT ACCOUNTING POLICIES
2.1 Basis of preparation
The financial statements of the Group and of the Company have been prepared in accordance with Malaysian Financial Reporting Standards (“MFRSs”), International Financial Reporting Standards (“IFRSs”) and the requirements of the Companies Act, 1965 in Malaysia.
For the periods up to and including the financial year ended 30 June 2012, the Group and the Company prepared their financial statements in accordance with Financial Reporting Standards (“FRSs”). These financial statements, for the financial year ended 30 June 2013, are the Group’s and the Company’s first annual financial statements prepared in accordance with MFRSs and IFRSs.
The transition to MFRSs did not entail any significant adjustments, other than those disclosed in Note 2.2.
The financial statements have been prepared on the historical cost basis except as disclosed in the accounting policies below.
The financial statements are presented in Ringgit Malaysia (“RM”) and all values are rounded to the nearest thousand (RM’000) except when otherwise indicated.
2.2 First-time adoption of MFRSs
These audited financial statements are the Group’s and the Company’s first annual financial statements prepared under the MFRSs framework. Accordingly, the Group and the Company have applied MFRS 1 First-timeAdoptionofMalaysianFinancialReportingStandards upon their adoption of the MFRSs framework on 1 July 2012.
The estimates as at 1 July 2011 and as at 30 June 2012 were consistent with those made for the same dates in accordance with FRSs. The estimates used by the Group and the Company to present these amounts in accordance with MFRSs reflect conditions as at 1 July 2011, the date of transition to MFRSs and as at 30 June 2012.
In the preparation of the Group’s and the Company’s opening MFRSs statements of financial position as at 1 July 2011, the amounts previously reported in accordance with the previous FRSs framework have been adjusted for the financial effects of the adoption of the MFRSs framework. There are no adjustments arising from the transition to MFRSs, other than those discussed below.
Accordingly, notes related to statements of financial position as at the date of transition to MFRSs are only presented for those items.
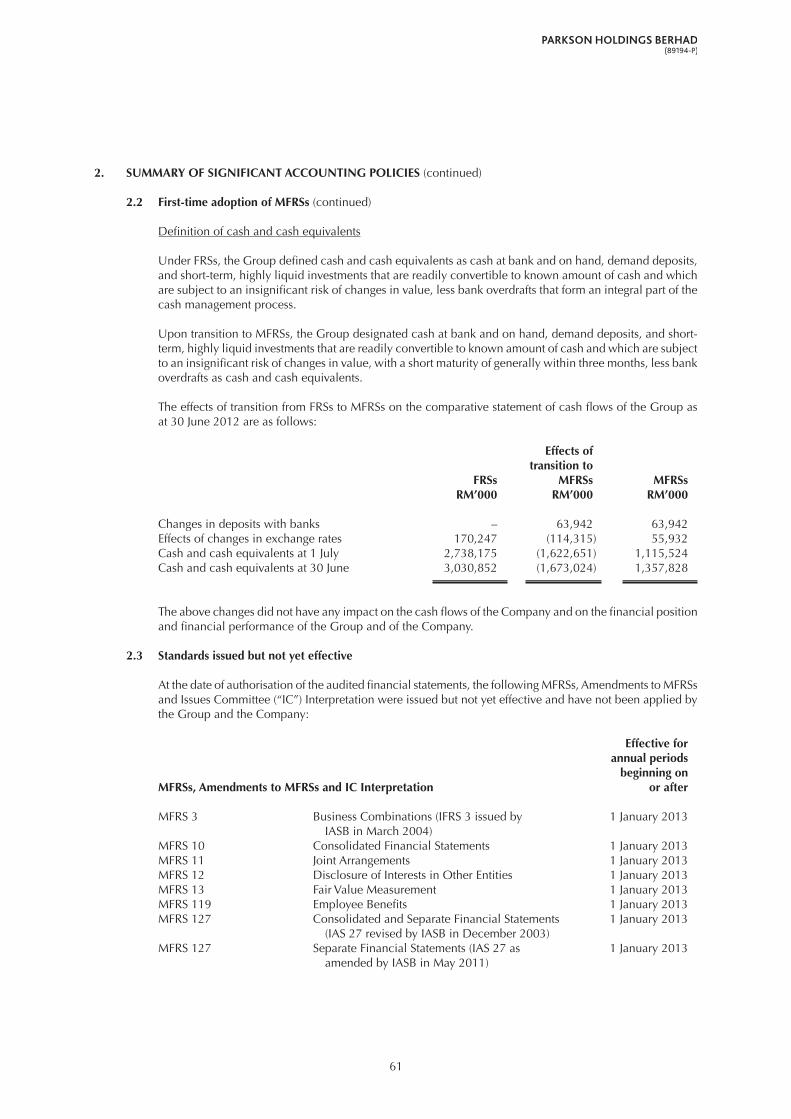
61
2. SUMMARY OF SIGNIFICANT ACCOUNTING POLICIES (continued)
2.2 First-time adoption of MFRSs (continued)
Definition of cash and cash equivalents
Under FRSs, the Group defined cash and cash equivalents as cash at bank and on hand, demand deposits, and short-term, highly liquid investments that are readily convertible to known amount of cash and which are subject to an insignificant risk of changes in value, less bank overdrafts that form an integral part of the cash management process.
Upon transition to MFRSs, the Group designated cash at bank and on hand, demand deposits, and short-term, highly liquid investments that are readily convertible to known amount of cash and which are subject to an insignificant risk of changes in value, with a short maturity of generally within three months, less bank overdrafts as cash and cash equivalents.
The effects of transition from FRSs to MFRSs on the comparative statement of cash flows of the Group as at 30 June 2012 are as follows:
Effects of transition to FRSs MFRSs MFRSs RM’000 RM’000 RM’000
Changes in deposits with banks – 63,942 63,942Effects of changes in exchange rates 170,247 (114,315) 55,932Cash and cash equivalents at 1 July 2,738,175 (1,622,651) 1,115,524 Cash and cash equivalents at 30 June 3,030,852 (1,673,024) 1,357,828
The above changes did not have any impact on the cash flows of the Company and on the financial position and financial performance of the Group and of the Company.
2.3 Standards issued but not yet effective
At the date of authorisation of the audited financial statements, the following MFRSs, Amendments to MFRSs and Issues Committee (“IC”) Interpretation were issued but not yet effective and have not been applied by the Group and the Company:
Effective for annual periods beginning onMFRSs, Amendments to MFRSs and IC Interpretation or after
MFRS 3 Business Combinations (IFRS 3 issued by 1 January 2013 IASB in March 2004)MFRS 10 Consolidated Financial Statements 1 January 2013MFRS 11 Joint Arrangements 1 January 2013MFRS 12 Disclosure of Interests in Other Entities 1 January 2013MFRS 13 Fair Value Measurement 1 January 2013MFRS 119 Employee Benefits 1 January 2013MFRS 127 Consolidated and Separate Financial Statements 1 January 2013 (IAS 27 revised by IASB in December 2003)MFRS 127 Separate Financial Statements (IAS 27 as 1 January 2013 amended by IASB in May 2011)
62
2. SUMMARY OF SIGNIFICANT ACCOUNTING POLICIES (continued)
2.3 Standards issued but not yet effective (continued)
Effective for annual periods beginning onMFRSs, Amendments to MFRSs and IC Interpretation (continued) or after
MFRS 128 Investments in Associates and Joint Ventures 1 January 2013 (IAS 28 as amended by IASB in May 2011)Amendments to First-time Adoption of MFRSs 1 January 2013 MFRS 1 - Government LoansAmendments to First-time Adoption of MFRSs 1 January 2013 MFRS 1 (Annual Improvements 2009-2011 Cycle)Amendments to Disclosures - Offsetting Financial Assets and 1 January 2013 MFRS 7 Financial LiabilitiesAmendments to Consolidated Financial Statements: 1 January 2013 MFRS 10 Transition GuidanceAmendments to Joint Arrangements: Transition Guidance 1 January 2013 MFRS 11Amendments to Disclosure of Interests in Other Entities: 1 January 2013 MFRS 12 Transition GuidanceAmendments to Presentation of Financial Statements 1 January 2013 MFRS 101 (Annual Improvements 2009-2011 Cycle)Amendments to Property, Plant and Equipment 1 January 2013 MFRS 116 (Annual Improvements 2009-2011 Cycle)Amendments to Financial Instruments: Presentation 1 January 2013 MFRS 132 (Annual Improvements 2009-2011 Cycle)Amendments to Interim Financial Reporting 1 January 2013 MFRS 134 (Annual Improvements 2009-2011 Cycle)Amendments to Investment Entities 1 January 2014 MFRS 10Amendments to Investment Entities 1 January 2014 MFRS 12Amendments to Investment Entities 1 January 2014 MFRS 127Amendments to Offsetting Financial Assets and Financial 1 January 2014 MFRS 132 LiabilitiesAmendments to Recoverable Amount Disclosures for 1 January 2014 MFRS 136 Non-Financial AssetsAmendments to Novation of Derivatives and Continuance of 1 January 2014 MFRS 139 Hedge AccountingIC Interpretation 21 Levies 1 January 2014MFRS 9 Financial Instruments (IFRS 9 issued by IASB 1 January 2015 in November 2009 and October 2010)

63
2. SUMMARY OF SIGNIFICANT ACCOUNTING POLICIES (continued)
2.3 Standards issued but not yet effective (continued)
The above MFRSs, Amendments to MFRSs and IC Interpretation are not expected to have a material impact on the financial statements of the Group and of the Company, except as discussed below:
MFRS 10 Consolidated Financial Statements
MFRS 10 replaces part of MFRS 127 Consolidated and Separate Financial Statements that deals with consolidated financial statements and IC Interpretation 112 Consolidation–SpecialPurposeEntities.
Under MFRS 10, an investor controls an investee when (a) the investor has power over an investee; (b) the investor has exposure, or rights, to variable returns from its involvement with the investee; and (c) the investor has ability to use its power over the investee to affect the amount of the investor’s returns. Under MFRS 127 ConsolidatedandSeparateFinancialStatements, control was defined as the power to govern the financial and operating policies of an entity so as to obtain benefits from its activities.
MFRS 10 includes detailed guidance to explain when an investor has control over the investee. MFRS 10 requires the investor to take into account all relevant facts and circumstances.
The change in accounting of the Group’s investments will be applied in accordance with the relevant transitional provisions as set out in MFRS 10 as if the acquisitions had been accounted for in accordance with MFRS 3 at the date of acquisition.
MFRS 11 Joint Arrangements
MFRS 11 replaces MFRS 131 InterestsinJointVentures and IC Interpretation 113 JointlyControlledEntities–Non-monetaryContributionsbyVenturers.
The classification of joint arrangements under MFRS 11 is determined based on the rights and obligations of the parties to the joint arrangements by considering the structure, the legal form, the contractual terms agreed by the parties to the arrangement and when relevant, other facts and circumstances. Under MFRS 11, joint arrangements are classified as either joint operations or joint ventures.
A joint operation is a joint arrangement whereby the parties that have joint control of the arrangement have rights to the assets, and obligations for the liabilities, relating to the arrangement. A joint venture is a joint arrangement whereby the parties that have joint control of the arrangement have rights to the net assets of the arrangement.
MFRS 11 removes the option to account for jointly controlled entity (“JCE”) using proportionate consolidation. Instead, JCE that meets the definition of a joint venture must be accounted for using the equity method.
The application of this new standard will affect the financial position of the Group due to the cessation of proportionate consolidation of Xinjiang Youhao Parkson Development Co Ltd (“Xinjiang Youhao”). Under MFRS 11, Xinjiang Youhao is treated as a joint venture and will be accounted for using the equity method.
MFRS 11 will be applied in accordance with the relevant transitional provisions set out in MFRS 11. The initial investment as at 1 July 2013 for the purposes of applying the equity method will be measured as the aggregate of the carrying amounts of the assets and liabilities that the Group had previously proportionately consolidated.
MFRS 12 Disclosures of Interests in Other Entities
MFRS 12 includes all disclosure requirements for interests in subsidiaries, joint arrangements, associates and structured entities. A number of new disclosures are required. This standard affects disclosures only and has no impact on the Group’s financial position or performance.

64
2. SUMMARY OF SIGNIFICANT ACCOUNTING POLICIES (continued)
2.3 Standards issued but not yet effective (continued)
MFRS 127 Separate Financial Statements
As a consequence of the new MFRS 10 and MFRS 12, MFRS 127 is limited to accounting for subsidiaries, jointly controlled entities and associates in separate financial statements.
MFRS 128 Investments in Associates and Joint Ventures
As a consequence of the new MFRS 11 and MFRS 12, MFRS 128 is renamed as MFRS 128 InvestmentsinAssociates and JointVentures. This new standard describes the application of the equity method to investments in joint ventures in addition to associates.
MFRS 13 Fair Value Measurement
MFRS 13 establishes a single source of guidance under MFRS for all fair value measurements. MFRS 13 does not change when an entity is required to use fair value, but rather provides guidance on how to measure fair value under MFRS when fair value is required or permitted.
Upon adoption of MFRS 13, the Group will take into consideration the highest and best use of certain properties in measuring the fair value of such properties. The adoption of MFRS 13 is expected to result in higher fair value of certain properties of the Group.
MFRS 119 Employee Benefits
The most significant change relates to the accounting for changes in defined benefit obligations and plan assets. The amendments require the recognition of changes in defined benefit obligations and in fair value of plan assets when they occur, and hence eliminate the “corridor approach” as permitted under the previous version of MFRS 119 and accelerate the recognition of past service costs. The amendments require all actuarial gains and losses to be recognised immediately through other comprehensive income in order for the net pension asset or liability recognised in the consolidated statement of financial position to reflect the full value of the plan deficit or surplus.
The amendments to MFRS 119 require retrospective application with certain exceptions. The application of the amendments to MFRS 119 is expected to change the amounts reported in the financial statements in respect of the Group’s defined benefit plan. The Group is currently assessing the impact of the amendments on the financial position and performance of the Group.
MFRS 3 Business Combinations (IFRS 3 issued by IASB in March 2004) and MFRS 127 Consolidated and Separate Financial Statements (IAS 27 revised by IASB in December 2003)
An entity shall apply these earlier versions of MFRS 3 and MFRS 127 only if the entity has elected to do so as allowed in MFRS 10 ConsolidatedFinancialStatements. The adoption of these standards are not expected to have a significant impact to the Group and the Company.
MFRS 9 Financial Instruments: Classification and Measurement
MFRS 9 reflects the first phase of the work on the replacement of MFRS 139 FinancialInstruments:RecognitionandMeasurement and applies to classification and measurement of financial assets and financial liabilities as defined in MFRS 139. The adoption of the first phase of MFRS 9 will have an effect on the classification and measurement of the Group’s financial assets. The Group will quantify the effect in conjunction with the other phases, when the final standard including all phases is issued.

65
2. SUMMARY OF SIGNIFICANT ACCOUNTING POLICIES (continued)
2.4 Subsidiaries and basis of consolidation
(a) Subsidiaries
A subsidiary is an entity in which the Company, directly or indirectly, controls more than half of its voting power or issued share capital or controls the composition of its board of directors; or over which the Company has a contractual right to exercise a dominant influence with respect to that entity’s financial and operating policies.
The results of subsidiaries are included in the Company’s profit or loss to the extent of dividends received and receivable. The Company’s investments in subsidiaries are stated at cost less any impairment losses. On disposal of such investments, the difference between net disposal proceeds and their carrying amounts is included in profit or loss.
(b) Basis of consolidation
The consolidated financial statements comprise the financial statements of the Company and its subsidiaries (collectively referred to as the “Group”) as at 30 June each year.
Subsidiaries are consolidated from the date of acquisition, being the date on which the Group obtained control, and continue to be consolidated until the date when such control ceases. The financial statements of the subsidiaries are prepared for the same reporting year as the parent company, using consistent accounting policies. All intragroup balances, transactions, unrealised gains and losses resulting from intragroup transactions and dividends are eliminated on consolidation in full.
Total comprehensive income within a subsidiary is attributed to the non-controlling interest even if it results in a deficit balance.
A change in the ownership interest of a subsidiary, without a loss of control, is accounted for as an equity transaction.
If the Group loses control over a subsidiary, it derecognises (i) the assets (including goodwill) and liabilities of the subsidiary; (ii) the carrying amount of any non-controlling interest; and (iii) the cumulative translation differences recorded in equity, and recognises (i) the fair value of the consideration received; (ii) any investment retained in the former subsidiary at its fair value; and (iii) any resulting gain or loss in profit or loss. The Group’s share of components previously recognised in other comprehensive income is reclassified to profit or loss or retained profits, as appropriate.
Business combinations involving entities under common control are accounted for by applying the pooling of interest method. The assets and liabilities of the combining entities are reflected at their carrying amounts reported in the consolidated financial statements of the controlling holding company. Any difference between the consideration paid and the share capital of the ‘acquired’ entity is reflected within equity as merger reserve/deficit. The profit or loss reflect the results of the combining entities for the full year, irrespective of when the combination takes place. Comparatives are presented as if the entities had always been combined since the date the entities had come under common control.
At each reporting date, the Group’s retained profits for the immediate preceding financial year in relation to the entities under common control, after adjusting for proposed/declared dividend as at that date will be transferred to merger deficit.
(c) Transactions with non-controlling interests
Non-controlling interests (“NCI”) represent the portion of profit or loss and net assets in subsidiaries not held by the Group and are presented separately in profit or loss of the Group and within equity in the consolidated statement of financial position, separately from parent shareholders’ equity. Transactions with NCI are accounted for using the entity concept method, whereby, transactions with NCI are accounted for as transactions with owners. On acquisition of NCI, the difference between the consideration and book value of the share of the net assets acquired is recognised directly in equity. Gain or loss on disposal to NCI is recognised directly in equity.

66
2. SUMMARY OF SIGNIFICANT ACCOUNTING POLICIES (continued)
2.5 Investments in associates
The Group’s investment in its associate is accounted for using the equity method. An associate is an entity in which the Group has significant influence.
Under the equity method, the investment is initially recognised at cost. The carrying amount of the investment is adjusted to recognise changes in the Group’s share of net assets of the associate since the acquisition date. Goodwill relating to the associate is included in the carrying amount of the investment and is neither amortised nor individually tested for impairment.
The profit or loss reflects the Group’s share of the results of operations of the associate. When there has been a change recognised directly in the equity of the associate, the Group recognises its share of any changes, when applicable, in the statement of changes in equity. Unrealised gains and losses resulting from transactions between the Group and the associate are eliminated to the extent of the interest in the associate.
The Group’s share of profit or loss of an associate is shown on the face of profit or loss and represents profit or loss after tax and NCI in the subsidiaries of the associate.
The financial statement of the associate is prepared for the same reporting period as the Group. When necessary, adjustments are made to bring the accounting policies in line with those of the Group.
After application of the equity method, the Group determines whether it is necessary to recognise an impairment loss on its investment in its associate. The Group determines at each reporting date whether there is objective evidence that the investment in the associate is impaired. If this is the case, the Group calculates the amount of impairment as the difference between the recoverable amount of the associate and its carrying value and recognises the amount in profit or loss.
Upon loss of significant influence over the associate, the Group measures and recognises any retained investment at its fair value. Any difference between the carrying amount of the associate upon loss of significant influence and the fair value of the retaining investment and proceeds from disposal is recognised in profit or loss.
2.6 Interest in a joint venture
The Group has an interest in a joint venture which is a jointly controlled entity, whereby the venturers have a contractual arrangement that establishes joint control over the economic activities of the entity. The arrangement requires unanimous agreement for financial and operating decisions among the venturers. The Group recognises its interest in the joint venture using the proportionate consolidation method. The Group combines its proportionate share of each of the assets, liabilities, income and expenses of the joint venture with similar items, line by line, in its consolidated financial statements. The financial statement of the joint venture is prepared for the same reporting period as the Group. Adjustments are made where necessary to bring the accounting policies in line with those of the Group.
The Group’s share of intragroup balances, transactions and unrealised gains and losses on such transactions between the Group and its joint venture are eliminated on consolidation. Losses on these transactions are recognised immediately if there is evidence of a reduction in the net realisable value of current assets or an impairment loss. The joint venture is proportionately consolidated until the date on which the Group ceases to have joint control over the joint venture.
Upon loss of joint control, the Group measures and recognises its remaining investment at its fair value. The difference between the carrying amount of the investment upon loss of joint control and the fair value of the remaining investment and proceeds from disposal is recognised in profit or loss. When the remaining investment constitutes significant influence, it is accounted for as an investment in an associate.

67
2. SUMMARY OF SIGNIFICANT ACCOUNTING POLICIES (continued)
2.7 Property, plant and equipment and depreciation
All items of property, plant and equipment are initially recorded at cost. Subsequent costs are included in the asset’s carrying amount or recognised as a separate asset, as appropriate, only when it is probable that future economic benefits associated with the item will flow to the Group and the cost of the item can be measured reliably.
Subsequent to recognition, property, plant and equipment are measured at cost less accumulated depreciation and accumulated impairment losses. When significant parts of property, plant and equipment are required to be replaced in intervals, the Group recognises such parts as individual assets with specific useful lives and depreciation respectively. Likewise, when a major inspection is performed, its cost is recognised in the carrying amount of the property, plant and equipment as a replacement if the recognition criteria are satisfied. All other repair and maintenance costs are recognised in profit or loss as incurred.
Depreciation is computed on a straight-line basis over the estimated useful lives of the assets as follows:
Buildings 2% - 8%Office equipment and vehicles 10% - 25%Furniture, fittings and other equipment 10% - 20%Renovation 10% - 20%
Capital work-in-progress included in property, plant and equipment are not depreciated as these assets are not yet available for use. The carrying values of property, plant and equipment are reviewed for impairment when events or changes in circumstances indicate that the carrying value may not be recoverable. The residual value, useful life and depreciation method are reviewed at each financial year-end, and adjusted prospectively, if appropriate.
An item of property, plant and equipment is derecognised upon disposal or when no future economic benefits are expected from its use or disposal. Any gain or loss on derecognition of the asset is included in profit or loss in the year the asset is derecognised.
2.8 Investment properties
Investment properties and investment properties under construction (“IPUC”) are initially measured at cost, including transaction costs. Subsequent to initial recognition, investment properties are measured at cost less accumulated depreciation and any accumulated impairment losses. IPUC are not depreciated as they are not yet ready for their intended use.
A property interest under an operating lease is classified and accounted for as an investment property on a property-by-property basis when the Group holds it to earn rental or for capital appreciation or both. Any such property interest under an operating lease classified as an investment property is carried at fair value.
Investment properties are derecognised either when they have been disposed of or when they are permanently withdrawn from use and no future economic benefit is expected from their disposal. Any gain or loss on the retirement or disposal of an investment property is recognised in profit or loss in the year of retirement or disposal.
Transfers are made to or from investment property only when there is a change in use. For a transfer from investment property to owner-occupied property, the deemed cost for subsequent accounting is the fair value at the date of change in use. For a transfer from owner-occupied property to investment property, the property is accounted for in accordance with the accounting policy for property, plant and equipment up to the date of change in use.

68
2. SUMMARY OF SIGNIFICANT ACCOUNTING POLICIES (continued)
2.9 Business combination and goodwill
Consideration transferred in a business combination is measured at the acquisition date fair value which is the sum of the acquisition date fair values of assets transferred by the Group, liabilities assumed by the Group to the former owners of the acquiree and the equity interests issued by the Group in exchange for control of the acquiree. For each business combination, the Group elects whether to measure the NCI in the acquiree that are present ownership interests and entitle their holders to proportionate share of assets in the event of liquidation at fair value or at the proportionate share of the acquiree’s identifiable net assets. All other components of NCI are measured at fair value. Acquisition-related costs are expensed as incurred.
When the Group acquires a business, it assesses the financial assets and liabilities assumed for appropriate classification and designation in accordance with the contractual terms, economic circumstances and pertinent conditions as at the acquisition date. This includes the separation of embedded derivatives in host contracts by the acquiree.
If the business combination is achieved in stages, the previously held equity interest is remeasured at its acquisition date fair value and any resulting gain or loss is recognised in profit or loss.
Any contingent consideration to be transferred by the acquirer is recognised at fair value at the acquisition date. Contingent consideration classified as an asset or liability that is a financial instrument and within the scope of MFRS 139 is measured at fair value with changes in fair value either recognised in profit or loss or as a change to other comprehensive income. If the contingent consideration is not within the scope of MFRS 139, it is measured in accordance with the appropriate MFRSs. Contingent consideration that is classified as equity is not remeasured and subsequent settlement is accounted for within equity.
Goodwill is initially measured at cost, being the excess of the aggregate of the consideration transferred, the amount recognised for NCI and any fair value of the Group’s previously held equity interests in the acquiree over the identifiable net assets acquired and liabilities assumed. If the sum of this consideration and other items is lower than the fair value of the net assets acquired, the difference is, after reassessment, recognised in profit or loss as a gain on bargain purchase.
After initial recognition, goodwill is measured at cost less any accumulated impairment losses. Goodwill is tested for impairment, annually or more frequently if events or changes in circumstances indicate that the carrying value may be impaired. The Group performs its annual impairment test of goodwill as at 30 June. For the purpose of impairment testing, goodwill acquired in a business combination is, from the acquisition date, allocated to each of the Group’s cash-generating units (“CGU”), or groups of CGUs, that are expected to benefit from the synergies of the combination, irrespective of whether other assets or liabilities of the Group are assigned to those units or groups of units.
Where goodwill has been allocated to a CGU (or groups of CGUs) and part of the operation within that unit is disposed of, the goodwill associated with the operation disposed of is included in the carrying amount of the operation when determining the gain or loss on the disposal. Goodwill disposed in these circumstances is measured based on the relative values of the disposed operation and the portion of the CGU retained.
69
2. SUMMARY OF SIGNIFICANT ACCOUNTING POLICIES (continued)
2.10 Other intangible assets
Intangible assets acquired separately are measured on initial recognition at cost. The cost of intangible assets acquired in a business combination is their fair value at the date of acquisition. Following initial recognition, intangible assets are carried at cost less any accumulated amortisation and accumulated impairment losses. Internally generated intangible assets, excluding capitalised development costs, are not capitalised and expenditure is reflected in profit and loss in the period in which the expenditure is incurred.
The useful lives of intangible assets are assessed as either finite or indefinite.
Intangible assets with finite lives are amortised over the useful economic life and assessed for impairment whenever there is an indication that the intangible asset may be impaired. The amortisation period and the amortisation method for an intangible asset with a finite useful life are reviewed at least at the end of each reporting period. Changes in the expected useful life or the expected pattern of consumption of future economic benefits embodied in the asset are considered to modify the amortisation period or method, as appropriate, and are treated as changes in accounting estimates. The amortisation expense on intangible assets with finite lives is recognised in profit or loss as the expense category that is consistent with the function of the intangible assets.
Intangible assets with indefinite useful lives are not amortised, but are tested for impairment annually, either individually or at the CGU level. The assessment of indefinite life is reviewed annually to determine whether the indefinite life continues to be supportable. If not, the change in useful life from indefinite to finite is made on a prospective basis.
Gains or losses arising from derecognition of an intangible asset are measured as the difference between the net disposal proceeds and the carrying amount of the asset and are recognised in profit or loss when the asset is derecognised.
• Customerrelationships
Customer relationships which were acquired in a business combination are amortised on a straight-line basis over their estimated useful lives of 5 years.
• Computersoftware
Computer software of the Group is amortised on a straight-line basis over their estimated useful lives ranging from 3 to 8 years.
• Clubmemberships
Club memberships are amortised on a straight-line basis over their estimated useful lives ranging from 25 to 99 years.
2.11 Land use rights
Land use rights are initially measured at cost. Following initial recognition, land use rights are measured at cost less accumulated amortisation and accumulated impairment losses. Land use rights are amortised over their lease terms.
70
2. SUMMARY OF SIGNIFICANT ACCOUNTING POLICIES (continued)
2.12 Impairment of non-financial assets
The Group assesses at each reporting date whether there is an indication that an asset may be impaired. If any indication exists, or when annual impairment testing for an asset is required, the Group estimates the asset’s recoverable amount. An asset’s recoverable amount is the higher of an asset’s or CGU’s fair value less costs to sell and its value in use. Recoverable amount is determined for an individual asset, unless the asset does not generate cash inflows that are largely independent of those from other assets or groups of assets. Where the carrying amount of an asset or CGU exceeds its recoverable amount, the asset is considered impaired and is written down to its recoverable amount.
In assessing value in use, the estimated future cash flows are discounted to their present value using a pre-tax discount rate that reflects current market assessments of the time value of money and the risks specific to the asset. In determining fair value less costs to sell, recent market transactions are taken into account. If no such transactions can be identified, an appropriate valuation model is used. These calculations are corroborated by valuation multiples, quoted share prices for publicly traded companies or other available fair value indicators.
The Group bases its impairment calculation on detailed budgets and forecast calculations, which are prepared separately for each of the Group’s CGU to which the individual assets are allocated. These budgets and forecast calculations are generally covering a period of five years. For longer periods, a long term growth rate is calculated and applied to project future cash flows after the fifth year.
Impairment losses of continuing operations, including impairment on inventories, are recognised in profit or loss in those expense categories consistent with the function of the impaired asset, except for a property previously revalued when the revaluation was taken to other comprehensive income. In this case, the impairment is recognised in other comprehensive income up to the amount of any previous revaluation.
For assets excluding goodwill, an assessment is made at each reporting date to determine whether there is an indication that previously recognised impairment losses no longer exist or have decreased. If such indication exists, the Group estimates the asset’s or CGU’s recoverable amount. A previously recognised impairment loss is reversed only if there has been a change in the assumptions used to determine the asset’s recoverable amount since the last impairment loss was recognised. The reversal is limited so that the carrying amount of the asset does not exceed its recoverable amount, nor exceed the carrying amount that would have been determined, net of depreciation, had no impairment loss been recognised for the asset in prior years. Such reversal is recognised in profit or loss unless the asset is carried at a revalued amount, in which case, the reversal is treated as a revaluation increase.
The following assets have specific characteristics for impairment testing:
Goodwill
Goodwill is tested for impairment annually as at 30 June and also when circumstances indicate that the carrying value may be impaired.
Impairment is determined for goodwill by assessing the recoverable amount of each CGU (or groups of CGUs) to which the goodwill relates. Where the recoverable amount of the CGU is less than its carrying amount, an impairment loss is recognised. Impairment losses relating to goodwill cannot be reversed in future periods.
Intangible assets
Intangible assets with indefinite useful lives are tested for impairment annually as at 30 June either individually or at the CGU level, as appropriate and when circumstances indicate that the carrying value may be impaired.
71
2. SUMMARY OF SIGNIFICANT ACCOUNTING POLICIES (continued)
2.13 Financial instruments - initial recognition and subsequent measurement
(a) Financial assets
Initial recognition and measurement
Financial assets within the scope of MFRS 139 FinancialInstruments:RecognitionandMeasurement (“MFRS 139”) are classified as financial assets at fair value through profit or loss, loans and receivables, held-to-maturity investments, available-for-sale financial assets, or as derivatives designated as hedging instruments in an effective hedge, as appropriate. The Group determines the classification of its financial assets at initial recognition.
All financial assets are recognised initially at fair value plus transaction costs, except in the case of financial assets recorded at fair value through profit or loss.
Purchases or sales of financial assets that require delivery of assets within a time frame established by regulation or convention in the market place (regular way trades) are recognised on the trade date i.e., the date that the Group commits to purchase or sell the assets.
Subsequent measurement
The subsequent measurement of financial assets depends on their classification as described below:
Financial assets at fair value through profit or loss
Financial assets at fair value through profit or loss includes financial assets held-for-trading and financial assets designated upon initial recognition at fair value through profit or loss. Financial assets are classified as held-for-trading if they are acquired for the purpose of selling or repurchasing in the near term. This category includes derivative financial instruments entered into by the Group that are not designated as hedging instruments in hedge relationships as defined by MFRS 139. Derivatives, including separated embedded derivatives are also classified as held-for-trading unless they are designated as effective hedging instruments.
Financial assets at fair value through profit or loss are carried in the statement of financial position at fair value with changes in fair value recognised as finance income or finance costs in profit or loss.
The Group has not designated any financial assets upon initial recognition as at fair value through profit or loss.
The Group evaluates its financial assets held-for-trading, other than derivatives, to determine whether the ability and intention to sell them in the near term is still appropriate. When the Group is unable to trade these financial assets due to inactive markets and management’s intention to sell them in the foreseeable future significantly changes, the Group may elect to reclassify these financial assets in rare circumstances. The reclassification to loans and receivables, available-for-sale or held-to-maturity depends on the nature of the assets. This evaluation does not affect any financial assets designated at fair value through profit or loss using the fair value option at designation, as these instruments cannot be reclassified after initial recognition.
Derivatives embedded in host contracts are accounted for as separate derivatives if their economic characteristics and risks are not closely related to those of the host contracts and the host contracts are not held-for-trading or designated at fair value through profit or loss. These embedded derivatives are measured at fair value with changes in fair value recognised in profit or loss. Reassessment only occurs if there is a change in the terms of the contract that significantly modifies the cash flows that would otherwise be required.
Financial assets at fair value through profit or loss could be presented as current or non-current. Financial assets that are held primarily for trading purposes are presented as current whereas financial assets that are not held primarily for trading purposes are presented as current or non-current based on the settlement date.

72
2. SUMMARY OF SIGNIFICANT ACCOUNTING POLICIES (continued)
2.13 Financial instruments - initial recognition and subsequent measurement (continued)
(a) Financial assets (continued)
Loans and receivables
Loans and receivables are non-derivative financial assets with fixed or determinable payments that are not quoted in an active market. After initial measurement, such financial assets are subsequently measured at amortised cost using the effective interest rate (“EIR”) method, less impairment. Amortised cost is calculated by taking into account any discount or premium on acquisition and fees or costs that are an integral part of the EIR. The EIR amortisation is included in finance income in profit or loss. The losses arising from impairment are recognised in profit or loss as finance costs.
Loans and receivables are classified as current assets, except for those having maturity dates later than twelve months after the reporting date which are classified as non-current.
Held-to-maturity investments
Non-derivative financial assets with fixed or determinable payments and fixed maturities are classified as held-to-maturity when the Group has the positive intention and ability to hold them to maturity. After initial measurement, held-to-maturity investments are measured at amortised cost using the EIR method, less impairment. Amortised cost is calculated by taking into account any discount or premium on acquisition and fees or costs that are an integral part of the EIR. The EIR amortisation is included in finance income in profit or loss. The losses arising from impairment are recognised in profit or loss as finance costs.
Held-to-maturity investments are classified as non-current assets, except for those having maturity within twelve months after the reporting date which are classified as current.
Available-for-sale financial assets
Available-for-sale financial assets include equity and debt securities. Equity investments classified as available-for-sale are those, neither classified as held-for-trading nor designated at fair value through profit or loss. Debt securities in this category are those which are intended to be held for an indefinite period of time and which may be sold in response to needs for liquidity or in response to changes in the market conditions.
After initial measurement, available-for-sale financial assets are subsequently measured at fair value with unrealised gains or losses recognised in other comprehensive income as available-for-sale investment revaluation reserve until the investments are derecognised, at which time, the cumulative gain or loss is recognised in other operating income, or determined to be impaired, at which time the cumulative loss is reclassified to profit or loss as finance costs and removed from the available-for-sale investment revaluation reserve. Interest income on available-for-sale debt securities is calculated using the EIR method and is recognised in profit or loss.
The Group evaluates its available-for-sale financial assets to determine whether the ability and intention to sell them in the near term is still appropriate. When the Group is unable to trade these financial assets due to inactive markets and management’s intention to do so significantly changes in the foreseeable future, the Group may elect to reclassify these financial assets in rare circumstances. Reclassification to loans and receivables is permitted when the financial assets meet the definition of loans and receivables and the Group has the ability and intention to hold these assets for the foreseeable future or until maturity. Reclassification to held-to-maturity category is permitted only when the entity has the ability and intention to hold the financial assets accordingly.

73
2. SUMMARY OF SIGNIFICANT ACCOUNTING POLICIES (continued)
2.13 Financial instruments - initial recognition and subsequent measurement (continued)
(a) Financial assets (continued)
Available-for-sale financial assets (continued)
For a financial asset reclassified out of the available-for-sale category, any previous gain or loss on that asset that has been recognised in equity is amortised to profit or loss over the remaining life of the investment using the EIR method. Any difference between the new amortised cost and the expected cash flows is also amortised over the remaining life of the asset using the EIR method. If the asset is subsequently determined to be impaired, then the amount recorded in equity is reclassified to profit or loss.
Investments in equity investments whose fair values cannot be reliably measured are recognised at cost less impairment loss.
Available-for-sale financial assets are classified as non-current assets unless they are expected to be realised within twelve months after the reporting date.
Derecognition
A financial asset (or, where applicable, a part of a financial asset or part of a group of similar financial assets) is derecognised when:
• Therightstoreceivecashflowsfromtheassethaveexpired.Afinancialassetisderecognisedwhen the contractual right to receive cash flows from the asset has expired. On derecognition of a financial asset in its entirety, the difference between the carrying amount and the sum of the consideration received and any cumulative gain or loss that had been recognised in other comprehensive income is recognised in profit or loss.
• TheGrouphastransferreditsrightstoreceivecashflowsfromtheassetorhasassumedanobligation to pay the received cash flows in full without material delay to a third party under a ‘pass-through’ arrangement; and either (a) the Group has transferred substantially all the risks and rewards of the asset, or (b) the Group has neither transferred nor retained substantially all the risks and rewards of the asset, but has transferred control of the asset.
When the Group has transferred its rights to receive cash flows from an asset or has entered into a pass-through arrangement, and has neither transferred nor retained substantially all of the risks and rewards of the asset nor transferred control of it, the asset is recognised to the extent of the Group’s continuing involvement in it.
In such case, the Group also recognises an associated liability. The transferred asset and the associated liability are measured on a basis that reflects the rights and obligations that the Group has retained.
Continuing involvement that takes the form of a guarantee over the transferred asset is measured at the lower of the original carrying amount of the asset and the maximum amount of consideration that the Group could be required to repay.

74
2. SUMMARY OF SIGNIFICANT ACCOUNTING POLICIES (continued)
2.13 Financial instruments - initial recognition and subsequent measurement (continued)
(b) Impairment of financial assets
The Group assesses at each reporting date whether there is objective evidence that a financial asset or a group of financial assets is impaired. A financial asset or a group of financial assets is deemed to be impaired if, there is objective evidence of impairment as a result of one or more events that has occurred after the initial recognition of the asset (an incurred ‘loss event’) and that loss event has an impact on the estimated future cash flows of the financial asset or the group of financial assets that can be reliably estimated.
Evidence of impairment may include indications that the debtors or a group of debtors is experiencing significant financial difficulty, default or delinquency in interest or principal payments, the probability that they will enter bankruptcy or other financial reorganisation and where observable data indicate that there is a measurable decrease in the estimated future cash flows, such as changes in arrears or economic conditions that correlate with defaults.
Financial assets carried at amortised cost
For financial assets carried at amortised cost, the Group first assesses whether objective evidence of impairment exists individually for financial assets that are individually significant, or collectively for financial assets that are not individually significant. If the Group determines that no objective evidence of impairment exists for an individually assessed financial asset, whether significant or not, it includes the asset in a group of financial assets with similar credit risk characteristics and collectively assesses them for impairment. Assets that are individually assessed for impairment and for which an impairment loss is, or continues to be, recognised are not included in a collective assessment of impairment. If there is objective evidence that an impairment loss has been incurred, the amount of the loss is measured as the difference between the asset’s carrying amount and the present value of estimated future cash flows (excluding future expected credit losses that have not yet been incurred). The present value of the estimated future cash flows is discounted at the financial asset’s original EIR. If a loan has a variable interest rate, the discount rate for measuring any impairment loss is the current EIR.
The carrying amount of the asset is reduced through the use of an allowance account and the amount of the loss is recognised in profit or loss. Interest income continues to be accrued on the reduced carrying amount and is accrued using the rate of interest used to discount the future cash flows for the purpose of measuring the impairment loss. The interest income is recorded as part of finance income in profit or loss. Loans together with the associated allowance are written off when there is no realistic prospect of future recovery and all collateral has been realised or has been transferred to the Group. If, in a subsequent year, the amount of the estimated impairment loss increases or decreases because of an event occurring after the impairment loss was recognised, the previously recognised impairment loss is increased or reduced by adjusting the allowance account. If a write-off is later recovered, the recovery is credited to profit or loss as finance costs.

75
2. SUMMARY OF SIGNIFICANT ACCOUNTING POLICIES (continued)
2.13 Financial instruments - initial recognition and subsequent measurement (continued)
(b) Impairment of financial assets (continued)
Available-for-sale financial assets
For available-for-sale financial assets, the Group assesses at each reporting date whether there is objective evidence that an asset or a group of assets is impaired.
In the case of equity investments classified as available-for-sale, objective evidence would include a significant or prolonged decline in the fair value of the investment below its cost. ‘Significant’ is evaluated against the original cost of the investment and ‘prolonged’ against the period in which the fair value has been below its original cost. Where there is evidence of impairment, the cumulative loss, measured as the difference between the acquisition cost and the current fair value, less any impairment loss on that investment previously recognised in profit or loss, is removed from other comprehensive income and recognised in profit or loss. Impairment losses on equity investments are not reversed through profit or loss; increases in their fair values after impairments are recognised directly in other comprehensive income. In the case of debt instruments classified as available-for-sale, impairment is assessed based on the same criteria as financial assets carried at amortised cost. However, the amount recorded for impairment is the cumulative loss measured as the difference between the amortised cost and the current fair value, less any impairment loss on that investment previously recognised in profit or loss.
Future interest income continues to be accrued based on the reduced carrying amount of the asset, using the rate of interest used to discount the future cash flows for the purpose of measuring the impairment loss. The interest income is recorded as part of finance income in profit or loss. If, in a subsequent year, the fair value of a debt instrument increases and the increase can be objectively related to an event occurring after the impairment loss was recognised in profit or loss, the impairment loss is reversed through the profit or loss.
Unquoted equity securities carried at cost
If there is objective evidence (such as significant adverse changes in the business environment where the issuer operates, probability of insolvency or significant financial difficulties of the issuer) that an impairment loss on financial assets carried at cost has been incurred, the amount of the loss is measured as the difference between the asset’s carrying amount and the present value of estimated future cash flows discounted at the current market rate of return for a similar financial asset. Such impairment losses are not reversed in subsequent periods.
(c) Financial liabilities
Initial recognition and measurement
Financial liabilities within the scope of MFRS 139 are classified as financial liabilities at fair value through profit or loss, loans and borrowings, or as derivatives designated as hedging instruments in an effective hedge, as appropriate. Classification of financial liabilities is determined at initial recognition.
All financial liabilities are recognised initially at fair value and, in the case of loans and borrowings, carried at amortised cost. This includes directly attributable transaction costs.
Financial liabilities include trade and other payables, bank overdrafts, loans and borrowings, financial guarantee contracts, and derivative financial instruments.

76
2. SUMMARY OF SIGNIFICANT ACCOUNTING POLICIES (continued)
2.13 Financial instruments - initial recognition and subsequent measurement (continued)
(c) Financial liabilities (continued)
Subsequent measurement
The subsequent measurement of financial liabilities depends on their classification as described below:
Financial liabilities at fair value through profit or loss
Financial liabilities at fair value through profit or loss include financial liabilities held-for-trading and financial liabilities designated upon initial recognition as at fair value through profit or loss.
Financial liabilities are classified as held-for-trading if they are acquired for the purpose of selling in the near term. This category includes derivative financial instruments entered into by the Group that are not designated as hedging instruments in hedge relationships as defined by MFRS 139. Separated embedded derivatives are also classified as held-for-trading unless they are designated as effective hedging instruments.
Gains or losses on financial liabilities held-for-trading are recognised in profit or loss.
The Group has not designated any financial liabilities upon initial recognition as at fair value through profit or loss.
Other financial liabilities
The Group’s and the Company’s other financial liabilities include trade payables, other payables and loans and borrowings.
Trade and other payables are recognised initially at fair value plus directly attributable transaction costs and subsequently measured at amortised cost using the EIR method.
Loans and borrowings are recognised initially at fair value, net of transaction costs incurred, and subsequently measured at amortised cost using the EIR method. Loans and borrowings are classified as current liabilities unless the Group has an unconditional right to defer settlement of the liability for at least twelve months after the reporting date.
For other financial liabilities, gains and losses are recognised in profit or loss when the liabilities are derecognised, and through the amortisation process.
Derecognition
A financial liability is derecognised when the obligation under the liability is discharged or cancelled or expires. When an existing financial liability is replaced by another from the same lender on substantially different terms, or the terms of an existing liability are substantially modified, such an exchange or modification is treated as a derecognition of the original liability and the recognition of a new liability. The difference in the respective carrying amounts is recognised in profit or loss.

77
2. SUMMARY OF SIGNIFICANT ACCOUNTING POLICIES (continued)
2.13 Financial instruments - initial recognition and subsequent measurement (continued)
(d) Offsetting of financial instruments
Financial assets and financial liabilities are offset with the net amount reported in the statements of financial position only if there is a current enforceable legal right to offset the recognised amounts and an intent to settle on a net basis, or to realise the assets and settle the liabilities simultaneously.
(e) Fair value of financial instruments
The fair value of financial instruments that are traded in active markets at each reporting date is determined by reference to quoted market prices or dealer price quotations (bid price for long positions and ask price for short positions), without any deduction for transaction costs.
For financial instruments not traded in an active market, the fair value is determined using appropriate valuation techniques. Such techniques may include:
• usingrecentarm’slengthmarkettransactions;• referencetothecurrentfairvalueofanotherinstrumentthatissubstantiallythesame;or• adiscountedcashflowanalysisorothervaluationmodels.
An analysis of fair values of financial instruments and further details of fair value measurement are disclosed in Note 38.
2.14 Cash and cash equivalents
Cash and cash equivalents comprise cash at bank and on hand, demand deposits, and short-term, highly liquid investments that are readily convertible to known amount of cash and which are subject to an insignificant risk of changes in value, with a maturity of three months or less. These also include bank overdrafts that form an integral part of the cash management process.
2.15 Inventories
Inventories are stated at the lower of cost and net realisable value.
The cost of merchandise and consumables are determined using the weighted average method. The cost of merchandise and consumables comprise cost of purchase.
In determination of closing inventories, cost is calculated based on weighted average and retail inventory method.
Net realisable value is the estimated selling price in the ordinary course of business less the estimated costs of completion and the estimated costs necessary to make the sale.
2.16 Provisions
Provisions are recognised when there is a present obligation (legal or constructive) as a result of a past event, it is probable that an outflow of economic resources will be required to settle the obligation and the amount can be estimated reliably.
Provisions are reviewed at each reporting date and adjusted to reflect the current best estimate. If it is no longer probable that an outflow of economic resources will be required to settle the obligation, the provision is reversed. If the effect of the time value of money is material, provisions are discounted using a current pre-tax rate that reflects, where appropriate, the risks specific to the liability. When discounting is used, the increase in the provision due to the passage of time is recognised as finance cost.

78
2. SUMMARY OF SIGNIFICANT ACCOUNTING POLICIES (continued)
2.17 Borrowing costs
Borrowing costs are capitalised as part of the cost of a qualifying asset if they are directly attributable to the acquisition, construction or production of that asset. Capitalisation of borrowing costs commences when the activities to prepare the asset for its intended use or sale are in progress and the expenditures and borrowing costs are incurred. Borrowing costs are capitalised until the assets are substantially completed for their intended use or sale.
All other borrowing costs are recognised in profit or loss in the period they are incurred. Borrowing costs consist of interest and other costs that the Group and the Company incurred in connection with the borrowing of funds.
2.18 Government grants
Government grants are recognised at their fair values where there is reasonable assurance that the grants will be received and all attaching conditions will be complied with. When the grant relates to an expense item, it is recognised as income on a systematic basis over the periods that the costs, which it is intended to compensate, are expensed.
2.19 Derivative financial instruments and hedge accounting
Initial recognition and subsequent measurement
The Group uses derivative financial instruments such as forward currency contracts and interest rate swaps to hedge its foreign currency risk and interest rate risk respectively. Such derivative financial instruments are initially recognised at fair value on the date on which a derivative contract is entered into and are subsequently remeasured at fair value. Derivatives are carried as financial assets when the fair value is positive and as financial liabilities when the fair value is negative.
Any gains or losses arising from changes in the fair value of derivatives are taken directly to profit or loss, except for the effective portion of cash flow hedges, which is recognised in other comprehensive income.
For the purpose of hedge accounting, hedges are classified as:
• fairvaluehedgeswhenhedgingtheexposuretochangesinthefairvalueofarecognisedassetorliability or an unrecognised firm commitment (except for foreign currency risk);
• cashflowhedgeswhenhedgingexposuretovariabilityincashflowsthatiseitherattributabletoaparticular risk associated with a recognised asset or liability or a highly probable forecast transaction or the foreign currency risk in an unrecognised firm commitment; or
• hedgesofanetinvestmentinaforeignoperation.
At the inception of a hedge relationship, the Group formally designates and documents the hedge relationship to which the Group wishes to apply hedge accounting and the risk management objective and strategy for undertaking the hedge. Such hedges are expected to be highly effective in achieving offsetting changes in fair value or cash flows and are assessed on an ongoing basis to determine that they actually have been highly effective throughout the financial reporting periods for which they were designated.
79
2. SUMMARY OF SIGNIFICANT ACCOUNTING POLICIES (continued)
2.19 Derivative financial instruments and hedge accounting (continued)
Initial recognition and subsequent measurement (continued)
Hedges which meet the strict criteria for hedge accounting are accounted for as described below:
Fair value hedges
The change in the fair value of an interest rate hedging derivative is recognised in profit or loss as finance costs. The change in the fair value of the hedged item attributable to the risk hedged is recorded as part of the carrying value of the hedged item and is also recognised in profit or loss as finance costs.
For fair value hedges relating to items carried at amortised cost, the adjustment to carrying value is amortised through profit or loss over the remaining term to maturity. Effective interest rate amortisation may begin as soon as an adjustment exists and shall begin no later than when the hedged item ceases to be adjusted for changes in its fair value attributable to the risk being hedged.
If the hedge item is derecognised, the unamortised fair value is recognised immediately in profit or loss.
When an unrecognised firm commitment is designated as a hedged item, the subsequent cumulative change in the fair value of the firm commitment attributable to the hedged risk is recognised as an asset or liability with a corresponding gain or loss recognised in profit or loss.
Cash flow hedges
The effective portion of the gain or loss on the hedging instrument is recognised directly in other comprehensive income as hedging reserve, while any ineffective portion is recognised immediately in profit or loss as other operating expenses.
Amounts recognised in other comprehensive income are transferred to profit or loss when the hedged transaction affects profit or loss, such as when the hedged financial income or financial expense is recognised or when a forecast sale occurs. Where the hedged item is the cost of a non-financial asset or non-financial liability, the amounts recognised in other comprehensive income are transferred to the initial carrying amount of the non-financial asset or liability.
If the forecast transaction or firm commitment is no longer expected to occur, the cumulative gain or loss previously recognised in equity is transferred to profit or loss. If the hedging instrument expires or is sold, terminated or exercised without replacement or rollover, or if its designation as a hedge is revoked, any cumulative gain or loss previously recognised in other comprehensive income remains in other comprehensive income until the forecast transaction or firm commitment affects profit or loss.
Current versus non-current classification
Derivative instruments that are not designated as effective hedging instruments are classified as current or non-current or separated into a current and non-current portion based on an assessment of the facts and circumstances (i.e., the underlying contracted cash flows).
Where the Group will hold a derivative as an economic hedge (and does not apply hedge accounting) for a period beyond twelve months after the reporting date, the derivative is classified as non-current (or separated into current and non-current portions) consistent with the classification of the underlying item.
Embedded derivates that are not closely related to the host contract are classified consistent with the cash flows of the host contract.
Derivative instruments that are designated as, and are effective hedging instruments, are classified consistently with the classification of the underlying hedged item. The derivative instrument is separated into a current portion and a non-current portion only if a reliable allocation can be made.

80
2. SUMMARY OF SIGNIFICANT ACCOUNTING POLICIES (continued)
2.20 Employee benefits
(a) Defined contribution plans
The Group participates in the national pension schemes as defined by the laws of the countries in which it has operations. Pursuant to the relevant laws and regulations in the respective countries, the subsidiaries of the Group operating with employees are required to participate in the retirement benefit schemes organised by the local jurisdiction whereby the Group is required to contribute a certain percentage of the salaries of its employees to the retirement benefits scheme. The only obligation of the Group with respect to the retirement benefits scheme is to pay the ongoing required contributions. Contributions made to the defined contribution retirement benefits scheme are charged to profit or loss in the period in which the related service is performed.
(b) Defined benefit plan
The Group makes provision for employee service entitlements in order to meet the minimum benefits required to be paid to qualified employees, as required under the Indonesian Labour Law No. 13/2003. The said provisions, which are unfunded, are estimated using actuarial calculations based on the report prepared by an independent firm of actuaries.
Actuarial gains or losses are recognised in profit or loss when the net cumulative unrecognised actuarial gains or losses at the end of the previous reporting year exceed 10% of the defined benefit obligation at that date. Such gains or losses in excess of the 10% corridor are amortised on a straight-line basis over the expected average remaining service years of the covered employees.
Past service cost is recognised as an expense on a straight-line basis over the average period until the benefit becomes vested. To the extent that the benefit is already vested immediately following the introduction of, or changes to, the employee benefit programme, the Group recognises past service cost immediately.
The related estimated liability for employee benefits is the aggregate of the present value of the defined benefit obligations at the end of the reporting period and unrecognised actuarial gains and losses, less unrecognised past service cost.
(c) Employee share option plans Employees of the Group receive remuneration in the form of share-based payment transactions,
whereby employees render services as consideration for equity instruments (equity-settled transactions).
The cost of equity-settled transactions is recognised together with a corresponding increase in share option reserve in equity over the period in which the performance and/or service conditions are fulfilled. The cumulative expense recognised for equity-settled transactions at each reporting date until the vesting date reflects the extent to which the vesting period has expired and the Group’s best estimate of the number of equity instruments that will ultimately vest. The charge or credit to profit or loss for a period represents the movement in cumulative expense recognised as at the beginning and end of that period and is recognised in employee benefits expense.
No expense is recognised for options that do not ultimately vest, except for equity-settled transactions for which vesting is conditional upon a market or non-vesting condition. These are treated as vesting irrespective of whether or not the market or non-vesting condition is satisfied, provided that all other performance and/or service conditions are satisfied. The share option reserve is transferred to retained profits upon expiry of the share options. When the options are exercised, the share option reserve is transferred to share premium if new shares are issued, or to treasury shares if the options are satisfied by the issuance of treasury shares. The dilutive effect of outstanding options is reflected as additional share dilution in the computation of diluted earnings per share.
81
2. SUMMARY OF SIGNIFICANT ACCOUNTING POLICIES (continued)
2.21 Leases
The determination of whether an arrangement is, or contains, a lease is based on the substance of the arrangement at the inception date. The arrangement is assessed for whether fulfilment of the arrangement is dependent on the use of a specific asset or assets or the arrangement conveys a right to use the asset or assets, even if that right is not explicitly specified in an arrangement.
(a) As lessee
Finance leases, which transfer to the Group substantially all the risks and rewards incidental to ownership of the leased item, are capitalised at the inception of the lease at the fair value of the leased asset or, if lower, at the present value of the minimum lease payments. Any initial direct costs are also added to the amount capitalised. Lease payments are apportioned between the finance charges and reduction of the lease liability so as to achieve a constant rate of interest on the remaining balance of the liability. Finance charges are charged to profit or loss. Contingent rents, if any, are charged as expenses in the periods in which they are incurred.
Leased assets are depreciated over the estimated useful life of the asset. However, if there is no reasonable certainty that the Group will obtain ownership by the end of the lease term, the asset is depreciated over the shorter of the estimated useful life and the lease term.
Operating lease payments are recognised as an expense in profit or loss on a straight-line basis over the lease term. The aggregate benefit of incentives provided by the lessor is recognised as a reduction of rental expense over the lease term on a straight-line basis.
The lessee shall recognise the aggregate benefit of incentives as a reduction of rental expense over the lease term, on a straight-line basis unless another systematic basis is representative of the time pattern of the lessee’s benefit from the use of the leased asset.
(b) As lessor
Leases in which the Group does not transfer substantially all the risks and benefits of ownership of the asset are classified as operating leases. Initial direct costs incurred in negotiating an operating lease are added to the carrying amount of the leased asset and recognised over the lease term on the same bases as rental income. Contingent rents are recognised as revenue in the period in which they are earned.
2.22 Foreign currency
(a) Functional and presentation currency
The individual financial statements of each entity in the Group are measured using the currency of the primary economic environment in which the entity operates (“the functional currency”). The consolidated financial statements are presented in Ringgit Malaysia (“RM”), which is also the Company’s functional currency.
(b) Foreign currency transactions
Transactions in foreign currencies are measured in the respective functional currencies of the Company and its subsidiaries and are recorded on initial recognition in the functional currencies at exchange rates approximating those ruling at the transaction dates. Monetary assets and liabilities denominated in foreign currencies are translated at the rate of exchange ruling at the reporting date. Non-monetary items denominated in foreign currencies that are measured at historical cost are translated using the exchange rates as at the dates of the initial transactions. Non-monetary items denominated in foreign currencies measured at fair value are translated using the exchange rates at the date when the fair value was determined.

82
2. SUMMARY OF SIGNIFICANT ACCOUNTING POLICIES (continued)
2.22 Foreign currency (continued)
(b) Foreign currency transactions (continued)
Exchange differences arising on the settlement of monetary items or on translating monetary items at the reporting date are recognised in profit or loss except for exchange differences arising on monetary items that form part of the Group’s net investment in foreign operations, which are recognised initially in other comprehensive income and accumulated under foreign currency translation reserve in equity. The foreign currency translation reserve is reclassified from equity to profit or loss of the Group on disposal of the foreign operation.
Exchange differences arising on the translation of non-monetary items carried at fair value are included in profit or loss for the period except for the differences arising on the translation of non-monetary items in respect of which gains and losses are recognised directly in equity. Exchange differences arising from such non-monetary items are also recognised directly in equity.
(c) Foreign operations
The assets and liabilities of foreign operations are translated into RM at the rate of exchange ruling at the reporting date and income and expenses are translated at exchange rates at the dates of the transactions. The exchange differences arising on the translation are taken directly to other comprehensive income. On disposal of a foreign operation, the cumulative amount recognised in other comprehensive income and accumulated in equity under foreign currency translation reserve relating to that particular foreign operation is recognised in profit or loss.
Goodwill and fair value adjustments arising on the acquisition of foreign operations are treated as assets and liabilities of the foreign operations and are recorded in the functional currency of the foreign operations and translated at the closing rate at the reporting date.
2.23 Revenue recognition
Revenue is recognised to the extent that it is probable that the economic benefits will flow to the Group and the revenue can be reliably measured. Revenue is measured at the fair value of consideration received or receivable.
(a) Sale of goods
Revenue on sale of goods is recognised net of sales taxes and discounts upon the transfer of significant risks and rewards of ownership of goods to the customer. Revenue is not recognised to the extent where there are significant uncertainties regarding recovery of the consideration due, associated costs or the possible return of goods.
(b) Commissions from concessionaire sales
Commissions from concessionaire sales are recognised upon the sale of goods by the concessionaire.
(c) Interest income
For all financial instruments measured at amortised cost, interest income or expense is recorded using the effective interest rate method, which is the rate that exactly discounts the estimated future cash payments or receipts through the expected life of the financial instrument or a shorter period, where appropriate, to the net carrying amount of the financial asset or liability. Interest income is included in finance income in profit or loss.

83
2. SUMMARY OF SIGNIFICANT ACCOUNTING POLICIES (continued)
2.23 Revenue recognition (continued)
(d) Revenue from services
Revenue from services rendered is recognised net of service taxes and discounts and when the services are rendered.
(e) Rental income
Rental income is accounted for on a straight-line basis over the lease terms. The aggregate costs of incentives provided to lessees are recognised as a reduction of rental income over the lease term on a straight-line basis.
(f) Royalty income
Royalty income is recognised on an accrual basis.
(g) Promotion income and sales commissions
Promotion income and minimum guaranteed sales commissions are recognised according to the underlying contract terms with concessionaires and as these services have been provided in accordance therewith.
(h) Management and consultancy fees
Management and consultancy fees are recognised net of service taxes and discounts when the services are rendered.
(i) Revenue from customer loyalty award
Revenue from customer loyalty award is recognised when the obligation in respect of the award is fulfilled.
(j) Dividend income
Dividend income is recognised when the Group’s right to receive payment is established.
2.24 Customer loyalty award
The Group operates loyalty programmes which allow customers to accumulate points when they purchase products in the Group’s stores. The points can be redeemed for free or discounted goods from the Group’s stores.
The Group allocates consideration received from the sale of goods to the goods sold and the points issued that are expected to be redeemed.
The consideration allocated to the points issued is measured at the fair value of the points. It is recognised as a liability (deferred revenue) in the statements of financial position and recognised as revenue when the points are redeemed, have expired or are no longer expected to be redeemed. The amount of revenue recognised is based on the number of points that have been redeemed, relative to the total number expected to be redeemed.
84
2. SUMMARY OF SIGNIFICANT ACCOUNTING POLICIES (continued)
2.25 Income taxes
(a) Current tax
Current tax assets and liabilities are measured at the amount expected to be recovered from or paid to the taxation authorities. The tax rates and tax laws used to compute the amount are those that are enacted or substantively enacted by the reporting date.
Current taxes are recognised in profit or loss except to the extent that the tax relates to items recognised outside profit or loss, either in other comprehensive income or directly in equity.
(b) Deferred tax
Deferred tax is provided for using the liability method on temporary differences at the reporting date between the tax bases of assets and liabilities and their carrying amounts for financial reporting purposes.
Deferred tax liabilities are recognised for all temporary differences, except:
• wherethedeferredtaxliabilityarisesfromtheinitialrecognitionofgoodwillorofanassetorliability in a transaction that is not a business combination and, at the time of the transaction, affects neither the accounting profit nor taxable profit or loss; and
• in respect of taxable temporary differences associatedwith investments in subsidiaries,associates and interests in joint ventures, where the timing of the reversal of the temporary differences can be controlled and it is probable that the temporary differences will not reverse in the foreseeable future.
Deferred tax assets are recognised for all deductible temporary differences, carry forward of unused tax credits and unused tax losses, to the extent that it is probable that taxable profit will be available against which the deductible temporary differences, and the carry forward of unused tax credits and unused tax losses can be utilised except:
• wherethedeferredtaxassetrelatingtothedeductibletemporarydifferencearisesfromtheinitial recognition of an asset or liability in a transaction that is not a business combination and, at the time of the transaction, affects neither the accounting profit nor taxable profit or loss; and
• inrespectofdeductibletemporarydifferencesassociatedwithinvestmentsinsubsidiaries,associates and interests in joint ventures, deferred tax assets are recognised only to the extent that it is probable that the temporary differences will reverse in the foreseeable future and taxable profit will be available against which the temporary differences can be utilised.
The carrying amount of deferred tax assets is reviewed at each reporting date and reduced to the extent that it is no longer probable that sufficient taxable profit will be available to allow all or part of the deferred tax assets to be utilised. Unrecognised deferred tax assets are reassessed at each reporting date and are recognised to the extent that it has become probable that future taxable profit will allow the deferred tax assets to be utilised.
Deferred tax assets and liabilities are measured at the tax rates that are expected to apply to the year when the asset is realised or the liability is settled, based on tax rates and tax laws that have been enacted or substantively enacted at the reporting date.

85
2. SUMMARY OF SIGNIFICANT ACCOUNTING POLICIES (continued)
2.25 Income taxes (continued)
(b) Deferred tax (continued)
Deferred tax relating to items recognised outside profit or loss is recognised outside profit or loss. Deferred tax items are recognised in correlation to the underlying transaction either in other comprehensive income or directly in equity and deferred tax arising from a business combination is adjusted against goodwill on acquisition.
Deferred tax assets and deferred tax liabilities are offset, if a legally enforceable right exists to set off current tax assets against current tax liabilities and the deferred taxes relate to the same taxable entity and the same taxation authority.
(c) Sales tax
Revenues, expenses and assets are recognised net of the amount of sales tax except:
• wherethesalestaxincurredinapurchaseofassetsorservicesisnotrecoverablefromthetaxation authority, in which case the sales tax is recognised as part of the cost of acquisition of the asset or as part of the expense item as applicable; and
• receivablesandpayablesthatarestatedwiththeamountofsalestaxincluded.
The net amount of sales tax recoverable from, or payable to, the taxation authority is included as part of receivables or payables in the statements of financial position.
2.26 Segmental reporting
For management purposes, the Group is organised into operating segments based on their products and services which are independently managed by the respective segment managers responsible for the performance of the respective segments under their charge. The segment managers report directly to management of the Company who regularly review the segment results in order to allocate resources to the segments and to assess the segment performance. Additional disclosures on each of these segments are shown in Note 41, including the factors used to identify the reportable segments and the measurement basis of segment information.
2.27 Share capital and share issuance expenses
An equity instrument is any contract that evidences a residual interest in the assets of the Group and of the Company after deducting all of its liabilities. Ordinary shares are equity instruments.
Ordinary shares are recorded at the proceeds received, net of directly attributable incremental transaction costs. Ordinary shares are classified as equity. Dividends on ordinary shares are recognised in equity in the period in which they are declared.
2.28 Treasury shares
Own equity instruments that are reacquired (treasury shares) are recognised at cost and deducted from equity. No gain or loss is recognised in profit or loss on the purchase, sale, issue or cancellation of treasury shares. Any difference between the carrying amount and the consideration, if reissued, is recognised in equity. Voting rights related to treasury shares are nullified and no dividends are allocated to them.
2.29 Contingencies
A contingent liability or asset is a possible obligation or asset that arises from past events and whose existence will be confirmed only by the occurrence or non-occurrence of uncertain future event(s) not wholly within the control of the Group.
Contingent liabilities and assets are not recognised in the statements of financial position of the Group.
86
3. SIGNIFICANT ACCOUNTING JUDGEMENTS AND ESTIMATES
The preparation of the Group’s and the Company’s financial statements requires management to make judgements, estimates and assumptions that affect the reported amounts of revenues, expenses, assets and liabilities, and the disclosure of contingent liabilities at the reporting date. However, uncertainty about these assumptions and estimates could result in outcomes that could require a material adjustment to the carrying amount of the asset or liability affected in the future.
3.1 Judgements made in applying accounting policies
In the process of applying the Group’s accounting policies, management has made the following judgements, apart from those involving estimations, which have the most significant effect on the amounts recognised in the financial statements:
(i) Classification between investment properties and owner-occupied properties
The Group determines whether a property qualifies as an investment property, and has developed criteria in making that judgement. Investment property is a property held to earn rentals or for capital appreciation or both. Therefore, the Group considers whether a property generates cash flows largely independently of the other assets held by the Group.
Some properties comprise a portion that is held to earn rentals or for capital appreciation and another portion that is held for use in the production or supply of goods or services or for administrative purposes. If these portions could be sold separately, the Group accounts for the portions separately. If the portions could not be sold separately, the property is an investment property only if an insignificant portion is held for use in the production or supply of goods or services or for administrative purposes. Judgement is made on an individual property basis to determine whether ancillary services are so significant that a property does not qualify as an investment property.
(ii) Impairment of available-for-sale financial assets
The Group reviews its available-for-sale financial assets at each reporting date to assess whether they are impaired. The Group also records impairment charges on available-for-sale equity investment when there has been a significant or prolonged decline in the fair value below its cost.
The determination of ‘significant’ or ‘prolonged’ requires judgement. In making this judgement, the Group evaluates, among other factors, historical share price movements and the duration and extent to which the fair value of an investment is less than its cost.
(iii) Operating lease commitments - the Group as lessee
The Group has entered into commercial property leases for its retail stores business. The commercial properties combined leases of land and buildings. At the inception of lease, it was not possible to obtain a reliable estimate of the split of the fair values of the lease interest between the land and the buildings. The Group has determined, based on an evaluation of the terms and conditions of the arrangements, that the lessor retains all the significant risks and rewards of relevant properties and so accounts for them as operating leases.
(iv) Tax provisions
Determining tax provisions involves judgement on the future tax treatment of certain transactions. The Group carefully evaluates tax implications of transactions and tax provisions are set up accordingly. The tax treatment of such transactions is assessed periodically to take into account all the changes in tax legislation and practices.
87
3. SIGNIFICANT ACCOUNTING JUDGEMENTS AND ESTIMATES (continued)
3.2 Key sources of estimation uncertainty
The key assumptions concerning the future and other key sources of estimation uncertainty at the reporting date, that have a significant risk of causing a material adjustment to the carrying amounts of assets and liabilities within the next financial year are discussed below:
(i) Income taxes
Significant estimation is involved in determining the provision for income taxes. There are certain transactions and computations for which the ultimate tax determination is uncertain during the ordinary course of business. The Group and the Company recognise liabilities for expected tax issues based on estimates of whether additional taxes will be due. Where the final tax outcome of these matters is different from the amounts that were initially recognised, such differences will impact the income tax and deferred tax provisions in the period in which such determination is made.
(ii) Share-based payment
The Group measures the cost of equity-settled transactions with employees by reference to fair value of the equity instruments at the date at which they are granted. Estimating fair value requires determining the most appropriate valuation model for a grant of equity instruments, which is dependent on the terms and conditions of the grant. This also requires determining the most appropriate inputs to the valuation model including the expected life of the option, volatility and dividend yield and making assumptions about them. The assumptions and valuation models used are disclosed in Note 29.
(iii) Operating lease commitments - the Group as lessee
The Group has entered into commercial property leases for its retail stores business. The Group has determined, based on an evaluation of the terms and conditions of the arrangements, that the lessor retains all the significant risks and rewards of relevant properties and so accounts for them as operating leases. A 5% difference in the minimum lease payments would result in approximately 9% (2012: 4%) variance in the profit for the year.
(iv) Useful lives of plant and equipment
Plant and equipment are depreciated on a straight-line basis over the assets’ useful lives. Management estimates the useful lives of these plant and equipment to be within 4 to 10 years. These are common life expectancies applied in the industry. Changes in the expected level of usage and technological developments could impact the economic useful lives and the residual values of these assets, therefore future depreciation charges could be revised. A 10% difference in the average useful lives of these assets from management’s estimates would result in approximately 5% (2012: 2%) variance in the profit for the year.
(v) Impairment of loans and receivables
The Group and the Company assess at each reporting date whether there is any objective evidence that a financial asset is impaired. To determine whether there is objective evidence of impairment, the Group and the Company consider factors such as the probability of insolvency or significant financial difficulties of the debtor and default or significant delay in payments.
Where there is objective evidence of impairment, the amount and timing of future cash flows are estimated based on historical loss experience for assets with similar credit risk characteristics. The carrying amounts of the Group’s and of the Company’s loans and receivables at the reporting date are disclosed in Note 25.
88
3. SIGNIFICANT ACCOUNTING JUDGEMENTS AND ESTIMATES (continued)
3.2 Key sources of estimation uncertainty (continued)
(vi) Impairment of goodwill and other intangibles
Goodwill, brands and other indefinite life intangibles are tested for impairment annually and at other times when such indicators exist. This requires an estimation of the value in use of the cash-generating units to which goodwill and customer loyalty award are allocated.
When value in use calculations are undertaken, management must estimate the expected future cash flows from the asset or cash-generating unit and choose a suitable discount rate in order to calculate the present value of those cash flows. Further details of the carrying value, the key assumptions applied in the impairment assessment of goodwill and brands and sensitivity analysis to changes in the assumptions are disclosed in Note 14.
(vii) Deferred tax assets
Deferred tax assets are recognised for all unused tax losses to the extent that it is probable that taxable profit will be available against which the losses can be utilised. Significant management judgement is required to determine the amount of deferred tax assets that can be recognised, based on the likely timing and level of future taxable profits together with future tax planning strategies.
Assumptions about generation of future taxable profits depend on management’s estimates of future cash flows. These depends on estimates of future sales, operating costs, capital expenditure, dividends and other capital management transactions. Judgement is also required about application of income tax legislation. These judgements and assumptions are subject to risks and uncertainty, hence, there is a possibility that changes in circumstances will alter expectations, which may impact the amount of deferred tax assets recognised in the statements of financial position and the amount of unrecognised tax losses and unrecognised temporary differences.
During the financial year, the Group has recognised RM7,610,000 (2012: RM17,778,000) of unused tax losses as management considered that it is probable that taxable profits will be available against which the losses can be utilised.
The carrying value of recognised and unrecognised deferred tax assets of the Group are disclosed in Note 19 and Note 9 respectively.
(viii) Fair value of financial instruments
Where the fair value of financial assets and financial liabilities recorded in the statements of financial position cannot be derived from active markets, they are determined using valuation techniques including the discounted cash flows model. The inputs to these models are taken from observable markets where possible, but where this is not feasible, a degree of judgement is required in establishing fair values. The judgements include considerations of inputs such as liquidity risk, credit risk and volatility. Changes in assumptions about these factors could affect the reported fair value of financial instruments.
(ix) Defined benefit plan
The cost of defined benefit pension plan is determined using actuarial valuations. The actuarial valuation involves making certain assumptions which include discount rates, future salary increases and retirement age. Due to the complexity of the valuation, the underlying assumptions and its long term nature, defined benefit obligations are sensitive to changes in assumptions above. Further details are disclosed in Note 32(iii).
(x) Impairment of available-for-sale financial assets
The Group classifies certain assets as available-for-sale and recognises movements of their fair values in equity. When the fair value declines, management makes assumptions about the decline in value to determine whether there is an impairment that should be recognised in profit or loss. The carrying amount of available-for-sale financial assets was RM233,000 (2012: RM13,416,000) as at 30 June 2013.

89
4. REVENUE
Group Company 2013 2012 2013 2012 RM’000 RM’000 RM’000 RM’000
Sales of goods - direct sales 1,368,065 1,341,689 – –Commissions from concessionaire sales (i) 1,906,945 1,881,587 – –Consultancy and management service fees 9,908 7,947 – –Rental income 216,196 191,635 – –Dividend income from: A subsidiary – – 180,000 150,000 Investment securities 1,409 – – –
3,502,523 3,422,858 180,000 150,000
(i) The commissions from concessionaire sales are analysed as follows:
Group 2013 2012 RM’000 RM’000
Gross revenue from concessionaire sales 9,975,563 9,655,040
Commissions from concessionaire sales 1,906,945 1,881,587
5. OTHER INCOME Group Company 2013 2012 2013 2012 RM’000 RM’000 RM’000 RM’000
Promotion income 62,179 49,124 – –Credit card handling fees 96,646 116,476 – –Government grants (i) 4,802 3,306 – –Equipment and display space lease income 26,247 25,073 – –Administration and management fees 80,450 79,132 – – Service fees 15,967 18,604 – –Other income 38,390 44,305 13 28 324,681 336,020 13 28
(i) Various government grants were granted by the local authorities in the People’s Republic of China (“PRC”) to reward certain subsidiaries for their contributions to the local economy. There are no unfulfilled conditions or contingencies attached to these government grants.
90
6. EMPLOYEE BENEFITS ExPENSE
Group Company 2013 2012 2013 2012 RM’000 RM’000 RM’000 RM’000
Wages, salaries and bonuses 283,127 231,942 775 390Defined contribution plans 34,377 28,645 63 28 Employee share-based payments: The Company – 207 – 14 A subsidiary 15,875 – – –Defined benefit plan (Note 32(iii)) (1,380) 1,635 – –Other staff related expenses 77,089 78,656 60 60 409,088 341,085 898 492
Included in employee benefits expense of the Group and of the Company are an executive Director’s remuneration amounting to RM729,000 (2012: RM694,000) and RM244,000 (2012: RM244,000) respectively as further disclosed in Note 8(b).
7. FINANCE INCOME/COSTS
Group Company 2013 2012 2013 2012 RM’000 RM’000 RM’000 RM’000
Finance income
Interest income on: Amount due from a related party (Note 34(a)) 898 1,173 898 1,173 Cross currency interest rate swap arrangement (Note 30(i)) 18,606 11,767 – – Credit linked notes – 21,712 – – Unwinding of discount on rental deposits receivable 2,154 2,789 – – Short term deposits and others 95,629 102,716 813 414 117,287 140,157 1,711 1,587
Finance costs
Interest expenses on: Senior guaranteed notes due November 2011 – 19,319 – – Term loans and bank loans 61,027 67,460 – – Bonds (Note 30(ii)) 11,553 – – – Unwinding of discount on rental deposits payable 1,305 1,037 – – Hire purchase liabilities (Note 31) 6 6 5 6 Bank overdrafts and others 280 400 – –
74,171 88,222 5 6

91
8. PROFIT/(LOSS) BEFORE TAx
(a) Profit/(Loss) before tax is stated at after charging/(crediting):
Group Company 2013 2012 2013 2012 RM’000 RM’000 RM’000 RM’000
Directors’ remuneration (Note b) 894 888 409 438 Auditors’ remuneration: - Statutory audit 1,969 1,718 30 30 - Parkson Retail’s statutory audit 2,105 2,226 – –Depreciation and amortisation: - Property, plant and equipment 202,345 178,397 27 27 - Investment properties 5,166 3,220 – – - Land use rights 7,870 8,421 – – - Intangible assets 3,069 896 – –Property, plant and equipment written off 545 343 – –Goodwill written off – 2,834 – –Impairment loss on goodwill 3,000 – – –Allowance for impairment loss on receivables 160 1,141 – –Reversal of impairment loss on receivables (975) (424) – –(Reversal of)/Write down of inventories (77) 675 – –Exchange gain, net: - Realised (4,340) (507) – (4) - Unrealised (4,711) (6,625) – –Loss on disposal of property, plant and equipment 1,623 453 – –Operating lease rentals in respect of leased properties: - Minimum lease payments 640,107 499,407 – – - Contingent lease payments 143,942 102,839 – – - Amortisation of deferred lease expenses 2,597 2,233 – –Direct operating expenses of investment properties 10,206 9,814 – –Gain on disposal of investment securities (4,655) – – –Gross rental income in respect of investment properties (48,047) (45,516) – –Sub-letting of properties: - Minimum lease payments (113,973) (101,094) – – - Contingent lease payments (52,360) (43,645) – – - Amortisation of deferred lease income (1,816) (1,380) – –
92
8. PROFIT/(LOSS) BEFORE TAx (continued)
(b) The details of remuneration receivable by Directors of the Company during the financial year are as follows:
Group Company 2013 2012 2013 2012 RM’000 RM’000 RM’000 RM’000
Executive Director: Fees 266 231 50 50 Salaries and other emoluments 420 420 180 180 Pension costs - defined contribution plans 43 43 14 14 729 694 244 244
Non-executive Directors*: Fees 165 194 165 194
894 888 409 438
(c) The number of Directors of the Company whose total remuneration during the financial year fell within the following bands is analysed below:
Number of Directors 2013 2012
Executive Director:- RM650,001 to RM700,000 – 1 - RM700,001 to RM750,000 1 –
Non-executive Directors*:- RM25,000 and below 2 2 - RM25,001 to RM50,000 3 4
* 2013: Including a Director who retired at the Annual General Meeting held on 21 November 2012.
2012: Including Directors who resigned during the financial year ended 30 June 2012.
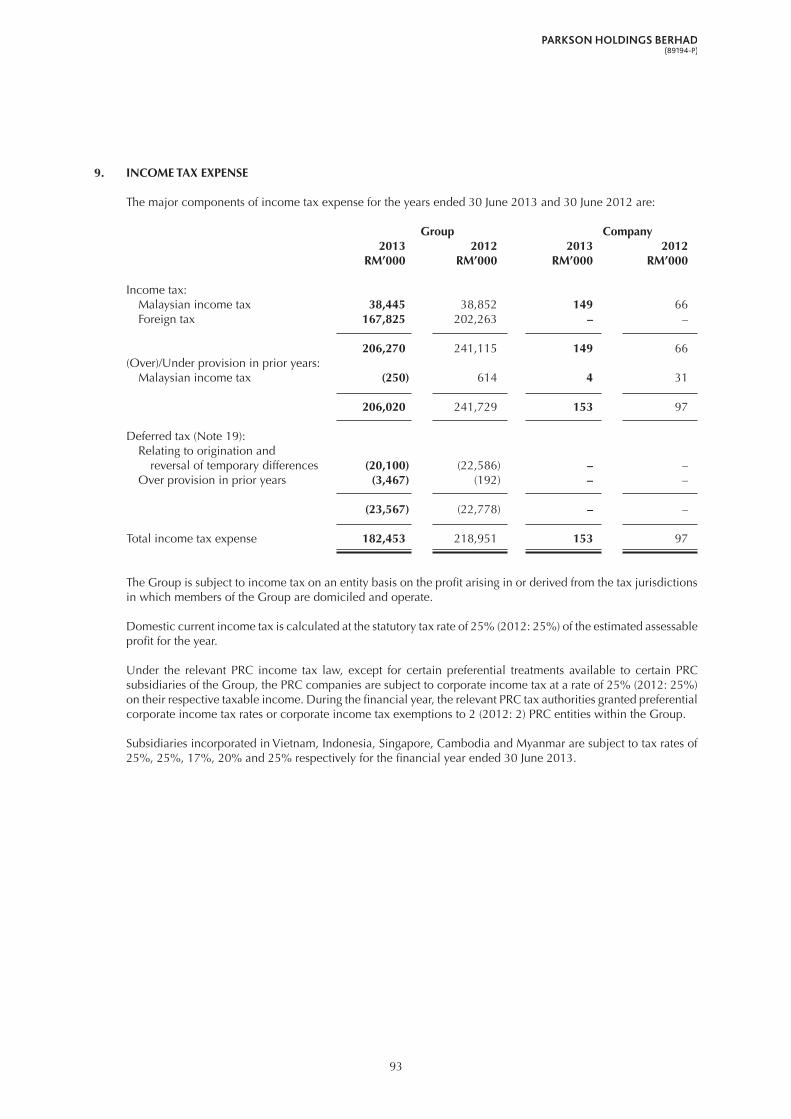
93
9. INCOME TAx ExPENSE
The major components of income tax expense for the years ended 30 June 2013 and 30 June 2012 are:
Group Company 2013 2012 2013 2012 RM’000 RM’000 RM’000 RM’000
Income tax: Malaysian income tax 38,445 38,852 149 66 Foreign tax 167,825 202,263 – –
206,270 241,115 149 66(Over)/Under provision in prior years: Malaysian income tax (250) 614 4 31
206,020 241,729 153 97
Deferred tax (Note 19): Relating to origination and reversal of temporary differences (20,100) (22,586) – – Over provision in prior years (3,467) (192) – –
(23,567) (22,778) – –
Total income tax expense 182,453 218,951 153 97
The Group is subject to income tax on an entity basis on the profit arising in or derived from the tax jurisdictions in which members of the Group are domiciled and operate.
Domestic current income tax is calculated at the statutory tax rate of 25% (2012: 25%) of the estimated assessable profit for the year.
Under the relevant PRC income tax law, except for certain preferential treatments available to certain PRC subsidiaries of the Group, the PRC companies are subject to corporate income tax at a rate of 25% (2012: 25%) on their respective taxable income. During the financial year, the relevant PRC tax authorities granted preferential corporate income tax rates or corporate income tax exemptions to 2 (2012: 2) PRC entities within the Group.
Subsidiaries incorporated in Vietnam, Indonesia, Singapore, Cambodia and Myanmar are subject to tax rates of 25%, 25%, 17%, 20% and 25% respectively for the financial year ended 30 June 2013.
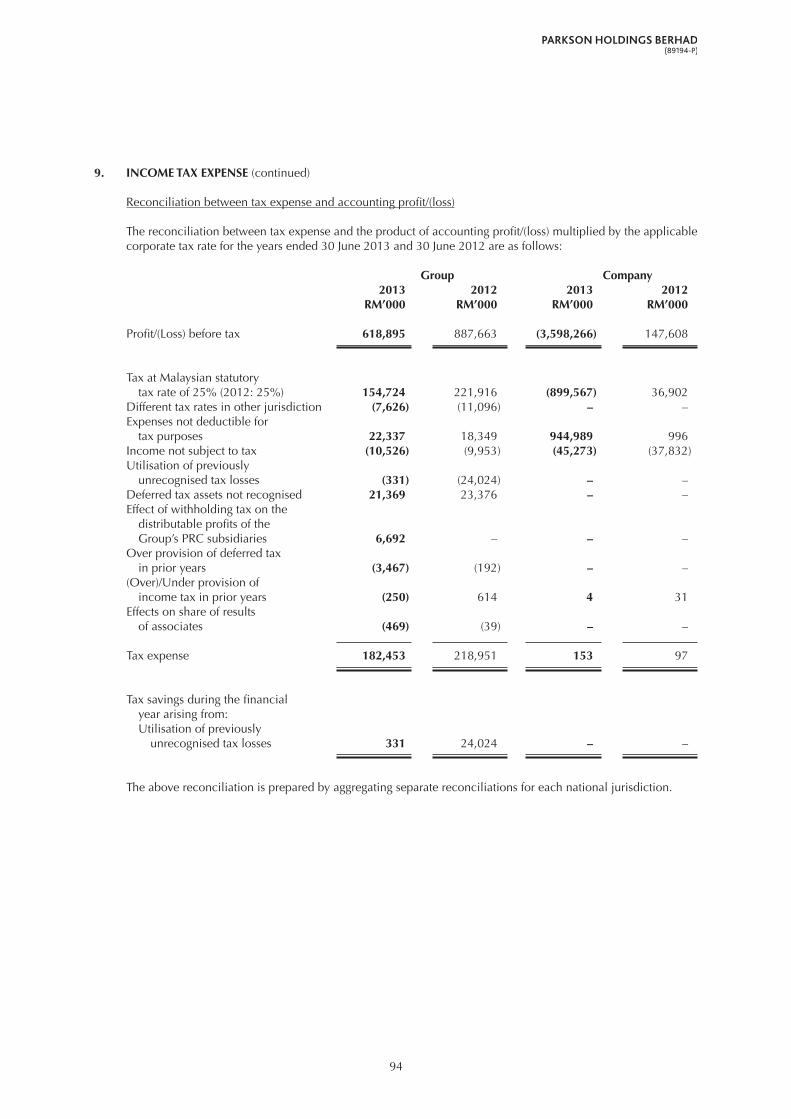
94
9. INCOME TAx ExPENSE (continued)
Reconciliation between tax expense and accounting profit/(loss)
The reconciliation between tax expense and the product of accounting profit/(loss) multiplied by the applicable corporate tax rate for the years ended 30 June 2013 and 30 June 2012 are as follows:
Group Company 2013 2012 2013 2012 RM’000 RM’000 RM’000 RM’000
Profit/(Loss) before tax 618,895 887,663 (3,598,266) 147,608
Tax at Malaysian statutory tax rate of 25% (2012: 25%) 154,724 221,916 (899,567) 36,902 Different tax rates in other jurisdiction (7,626) (11,096) – –Expenses not deductible for tax purposes 22,337 18,349 944,989 996 Income not subject to tax (10,526) (9,953) (45,273) (37,832)Utilisation of previously unrecognised tax losses (331) (24,024) – –Deferred tax assets not recognised 21,369 23,376 – –Effect of withholding tax on the distributable profits of the Group’s PRC subsidiaries 6,692 – – –Over provision of deferred tax in prior years (3,467) (192) – –(Over)/Under provision of income tax in prior years (250) 614 4 31 Effects on share of results of associates (469) (39) – –
Tax expense 182,453 218,951 153 97
Tax savings during the financial year arising from: Utilisation of previously unrecognised tax losses 331 24,024 – –
The above reconciliation is prepared by aggregating separate reconciliations for each national jurisdiction.

95
10. DIVIDENDS
Dividends in respect Dividends recognised of financial year in financial year 2013 2012 2011 2013 2012 RM’000 RM’000 RM’000 RM’000 RM’000
Single tier dividend:- Interim for 2011 (10 sen per share) (i) – – 108,005 – –- Final for 2011 (5 sen per share) (i) – – 54,393 – 54,393 - Interim for 2012 (10 sen per share) (ii) – 108,785 – – 108,785 - Second interim for 2012 (6 sen per share) (ii) – 65,133 – – 65,133 - Interim for 2013 (10 sen per share) (iii) 108,439 – – 108,439 –- Second interim for 2013 (8 sen per share) (iii) 86,702 – – 86,702 –
195,141 173,918 162,398 195,141 228,311
(i) In respect of the financial year ended 30 June 2011:
• Aninterimsingletierdividendof10%(10senpershare),amountingtoRM108,005,000waspaidon 16 December 2010; and
• Afinalsingletierdividendof5%(5senpershare),amountingtoRM54,393,000waspaidon21December 2011.
(ii) In respect of the financial year ended 30 June 2012:
• Aninterimsingletierdividendof10%(10senpershare),amountingtoRM108,785,000waspaidon 22 December 2011; and
• Asecondinterimsingletierdividendof6%(6senpershare),amountingtoRM65,133,000waspaidon 20 June 2012.
(iii) In respect of the financial year ended 30 June 2013:
• Aninterimsingletierdividendof10%(10senpershare),amountingtoRM108,439,000waspaidon 10 December 2012; and
• Asecondinterimsingletierdividendof8%(8senpershare),amountingtoRM86,702,000waspaidon 22 May 2013.
The Directors do not recommend the payment of a final dividend in respect of the current financial year.

96
11. EARNINGS PER SHARE
(a) Basic
Basic earnings per share is calculated by dividing the profit for the year attributable to owners of the parent by the weighted average number of ordinary shares in issue during the financial year.
Group 2013 2012
Profit for the year attributable to owners of the parent (RM’000) 239,708 380,076
Weighted average number of ordinary shares in issue (‘000) 1,084,037 1,088,216 Basic earnings per share (sen) 22.11 34.93
(b) Diluted
For the purpose of calculating diluted earnings per share, the profit for the year attributable to owners of the parent and the weighted average number of ordinary shares in issue during the financial year have been adjusted for the dilutive effects of all potential ordinary shares, i.e. shares granted under the Executive Share Option Scheme (“ESOS”) of the Company.
Group 2013 2012
Profit for the year attributable to owners of the parent (RM’000) 239,708 380,076
Weighted average number of ordinary shares in issue (‘000) 1,084,037 1,088,216 Effect of dilution: - ESOS (‘000) – 1
Adjusted weighted average number of ordinary shares in issue and issuable (‘000) 1,084,037 1,088,217
Diluted earnings per share (sen) 22.11 34.93
There have been no other transactions involving ordinary shares or potential ordinary shares between the reporting date and the date of authorisation of these financial statements.
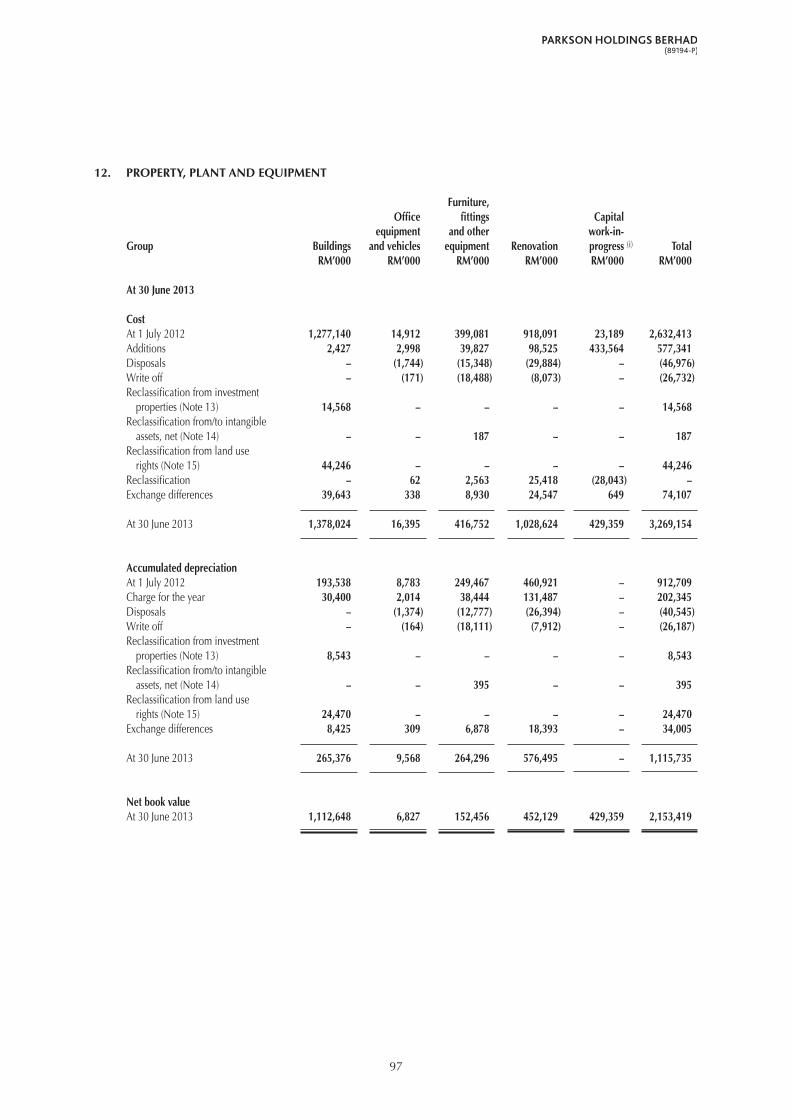
97
12. PROPERTY, PLANT AND EqUIPMENT
Furniture, Office fittings Capital equipment and other work-in-Group Buildings and vehicles equipment Renovation progress (i) Total RM’000 RM’000 RM’000 RM’000 RM’000 RM’000
At 30 June 2013
CostAt 1 July 2012 1,277,140 14,912 399,081 918,091 23,189 2,632,413 Additions 2,427 2,998 39,827 98,525 433,564 577,341 Disposals – (1,744) (15,348) (29,884) – (46,976)Write off – (171) (18,488) (8,073) – (26,732)Reclassification from investment properties (Note 13) 14,568 – – – – 14,568 Reclassification from/to intangible assets, net (Note 14) – – 187 – – 187 Reclassification from land use rights (Note 15) 44,246 – – – – 44,246 Reclassification – 62 2,563 25,418 (28,043) –Exchange differences 39,643 338 8,930 24,547 649 74,107
At 30 June 2013 1,378,024 16,395 416,752 1,028,624 429,359 3,269,154
Accumulated depreciationAt 1 July 2012 193,538 8,783 249,467 460,921 – 912,709 Charge for the year 30,400 2,014 38,444 131,487 – 202,345 Disposals – (1,374) (12,777) (26,394) – (40,545)Write off – (164) (18,111) (7,912) – (26,187)Reclassification from investment properties (Note 13) 8,543 – – – – 8,543 Reclassification from/to intangible assets, net (Note 14) – – 395 – – 395 Reclassification from land use rights (Note 15) 24,470 – – – – 24,470 Exchange differences 8,425 309 6,878 18,393 – 34,005
At 30 June 2013 265,376 9,568 264,296 576,495 – 1,115,735
Net book valueAt 30 June 2013 1,112,648 6,827 152,456 452,129 429,359 2,153,419
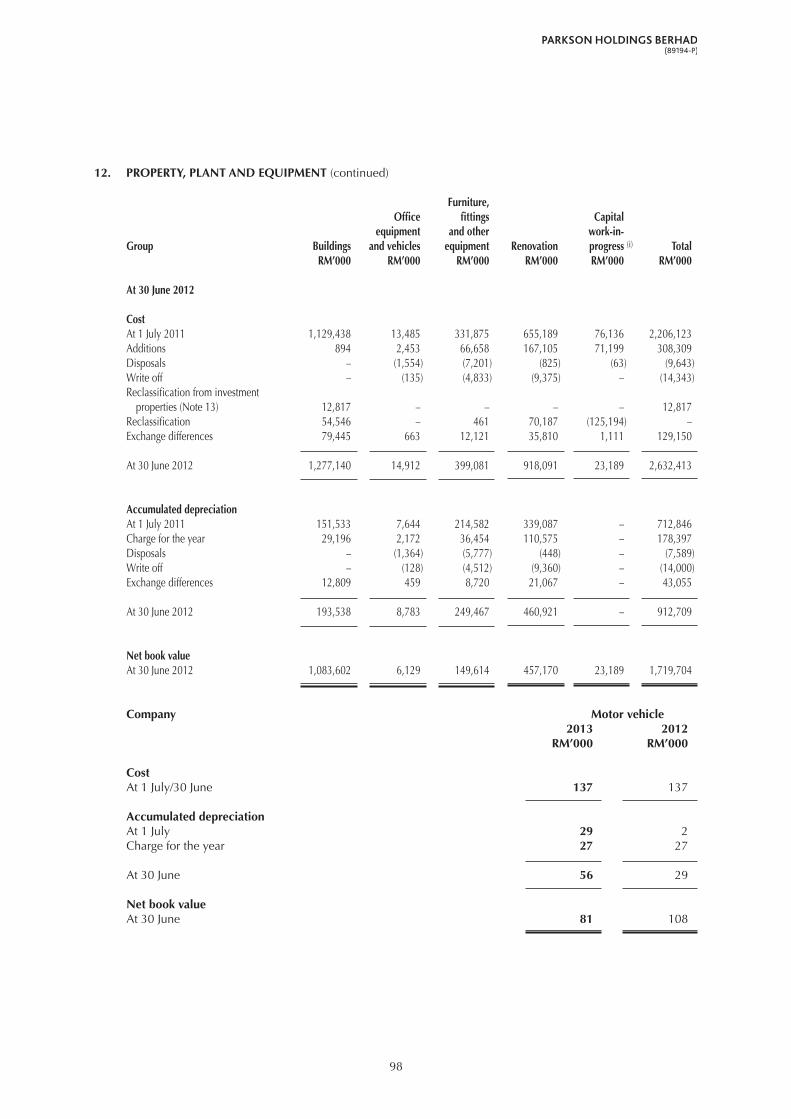
98
12. PROPERTY, PLANT AND EqUIPMENT (continued)
Furniture, Office fittings Capital equipment and other work-in-Group Buildings and vehicles equipment Renovation progress (i) Total RM’000 RM’000 RM’000 RM’000 RM’000 RM’000
At 30 June 2012
CostAt 1 July 2011 1,129,438 13,485 331,875 655,189 76,136 2,206,123Additions 894 2,453 66,658 167,105 71,199 308,309 Disposals – (1,554) (7,201) (825) (63) (9,643)Write off – (135) (4,833) (9,375) – (14,343)Reclassification from investment properties (Note 13) 12,817 – – – – 12,817 Reclassification 54,546 – 461 70,187 (125,194) –Exchange differences 79,445 663 12,121 35,810 1,111 129,150
At 30 June 2012 1,277,140 14,912 399,081 918,091 23,189 2,632,413
Accumulated depreciationAt 1 July 2011 151,533 7,644 214,582 339,087 – 712,846 Charge for the year 29,196 2,172 36,454 110,575 – 178,397Disposals – (1,364) (5,777) (448) – (7,589)Write off – (128) (4,512) (9,360) – (14,000)Exchange differences 12,809 459 8,720 21,067 – 43,055
At 30 June 2012 193,538 8,783 249,467 460,921 – 912,709
Net book valueAt 30 June 2012 1,083,602 6,129 149,614 457,170 23,189 1,719,704
Company Motor vehicle 2013 2012 RM’000 RM’000
CostAt 1 July/30 June 137 137
Accumulated depreciationAt 1 July 29 2Charge for the year 27 27
At 30 June 56 29
Net book valueAt 30 June 81 108
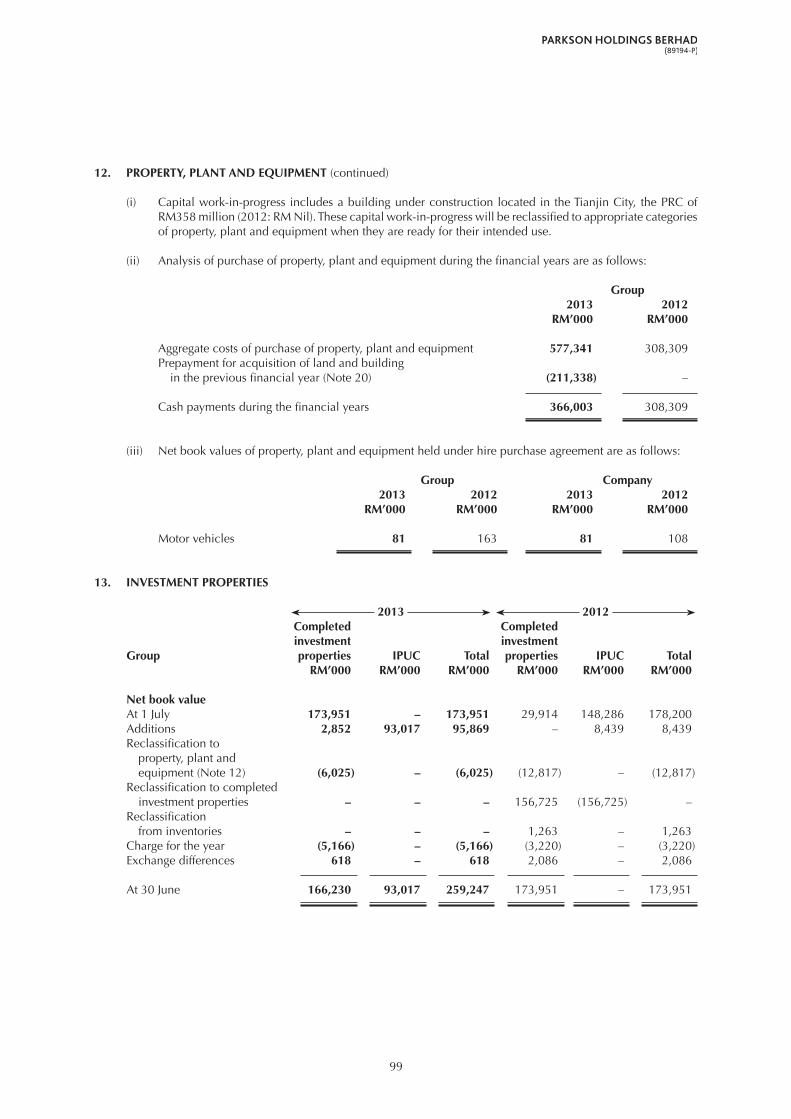
99
12. PROPERTY, PLANT AND EqUIPMENT (continued)
(i) Capital work-in-progress includes a building under construction located in the Tianjin City, the PRC of RM358 million (2012: RM Nil). These capital work-in-progress will be reclassified to appropriate categories of property, plant and equipment when they are ready for their intended use.
(ii) Analysis of purchase of property, plant and equipment during the financial years are as follows:
Group 2013 2012 RM’000 RM’000
Aggregate costs of purchase of property, plant and equipment 577,341 308,309 Prepayment for acquisition of land and building in the previous financial year (Note 20) (211,338) –
Cash payments during the financial years 366,003 308,309
(iii) Net book values of property, plant and equipment held under hire purchase agreement are as follows:
Group Company 2013 2012 2013 2012 RM’000 RM’000 RM’000 RM’000
Motor vehicles 81 163 81 108
13. INVESTMENT PROPERTIES
2013 2012 Completed Completed investment investment Group properties IPUC Total properties IPUC Total RM’000 RM’000 RM’000 RM’000 RM’000 RM’000
Net book valueAt 1 July 173,951 – 173,951 29,914 148,286 178,200Additions 2,852 93,017 95,869 – 8,439 8,439 Reclassification to property, plant and equipment (Note 12) (6,025) – (6,025) (12,817) – (12,817)Reclassification to completed investment properties – – – 156,725 (156,725) –Reclassification from inventories – – – 1,263 – 1,263Charge for the year (5,166) – (5,166) (3,220) – (3,220)Exchange differences 618 – 618 2,086 – 2,086
At 30 June 166,230 93,017 259,247 173,951 – 173,951

100
13. INVESTMENT PROPERTIES (continued)
The net book value and the estimated fair value of the investment properties of the Group are as follows:
Office premises (i) Buildings (ii) Land (iii) Total RM’000 RM’000 RM’000 RM’000
Net book value at 30 June 2013Cost 13,654 161,118 93,017 267,789 Accumulated depreciation (6,736) (1,806) – (8,542)
6,918 159,312 93,017 259,247
Estimated fair value at 30 June 2013 17,403 272,037 98,000 387,440
Office premises (i) Buildings (ii) Total RM’000 RM’000 RM’000
Net book value at 30 June 2012Cost 13,197 172,297 185,494 Accumulated depreciation (5,698) (5,845) (11,543)
7,499 166,452 173,951
Estimated fair value at 30 June 2012 30,918 207,518 238,436
(i) The fair values of the office premises were determined based on the valuations performed by an accredited independent firm of professional valuers, on a direct comparison approach.
(ii) Included in buildings is a retail mall located in Setapak, Kuala Lumpur, Malaysia. Festival City Sdn Bhd (“Festival City”), a wholly-owned subsidiary of the Company, is the beneficial owner of this retail mall and the strata title of the retail mall has yet to be issued to Festival City. The fair value of the retail mall as at 30 June 2013 was determined based on the valuations performed by an accredited independent firm of professional valuers based on the investment method.
Certain portions of the retail mall are held for own use by the Group and such portions are classified as property, plant and equipment (Note 12).
The fair value of the other building as at 30 June 2013 and 30 June 2012 were internally appraised by reference to observed market price in other similar property transactions.
(iii) The Group had on 3 September 2012 and 21 November 2012 entered into conditional sale and purchase agreement and supplemental agreement respectively to acquire 15 acres out of the 23.22 acres undivided interest of land located in Melaka, Malaysia for a cash consideration of RM93 million, as further disclosed in Note 36(d). The land has a leasehold term of 99 years.
The Group intends to develop a shopping mall on the land.
The fair value of the land as at 30 June 2013 was determined based on the valuations performed by an accredited independent firm of professional valuers, on a direct comparison approach.

101
14. INTANGIBLE ASSETS
Customer Computer Club Group Goodwill relationships software memberships Total RM’000 RM’000 RM’000 RM’000 RM’000
CostAt 1 July 2011 1,237,925 3,770 2,056 388 1,244,139 Additions – – 5,112 – 5,112 Write off (2,834) – – – (2,834)Exchange differences 72,673 (31) 108 (1) 72,749
At 30 June 2012 and 1 July 2012 1,307,764 3,739 7,276 387 1,319,166 Additions – – 3,690 – 3,690 Reclassification to/from property, plant and equipment, net (Note 12) – – (187) – (187)Exchange differences 36,771 (178) 169 1 36,763
At 30 June 2013 1,344,535 3,561 10,948 388 1,359,432 Accumulated amortisation and impairment lossAt 1 July 2011 6,550 – 1,948 107 8,605 Amortisation – 765 67 64 896 Exchange differences – 14 138 1 153
At 30 June 2012 and 1 July 2012 6,550 779 2,153 172 9,654 Amortisation – 715 2,354 – 3,069 Impairment loss 3,000 – – – 3,000 Reclassification to/from property, plant and equipment, net (Note 12) – – (395) – (395)Exchange differences – (70) 139 – 69
At 30 June 2013 9,550 1,424 4,251 172 15,397
Net carrying amount
At 30 June 2013 1,334,985 2,137 6,697 216 1,344,035
At 30 June 2012 1,301,214 2,960 5,123 215 1,309,512
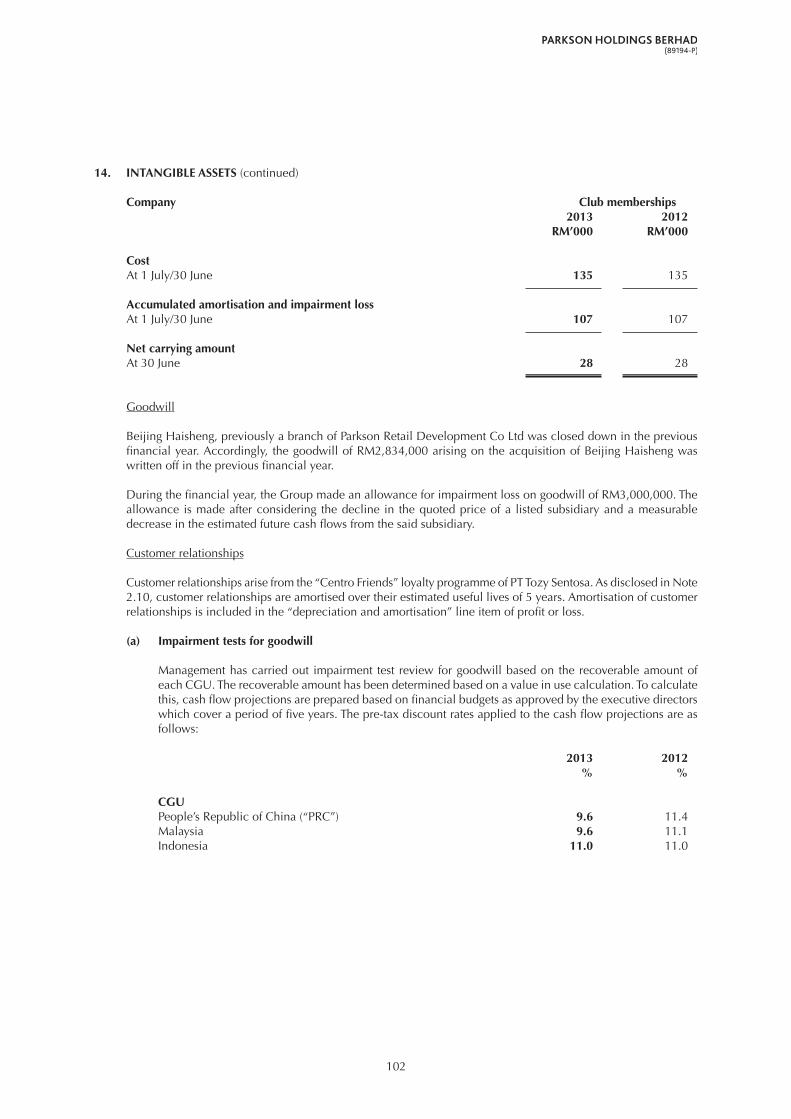
102
14. INTANGIBLE ASSETS (continued)
Company Club memberships 2013 2012 RM’000 RM’000
CostAt 1 July/30 June 135 135
Accumulated amortisation and impairment lossAt 1 July/30 June 107 107
Net carrying amountAt 30 June 28 28
Goodwill
Beijing Haisheng, previously a branch of Parkson Retail Development Co Ltd was closed down in the previous financial year. Accordingly, the goodwill of RM2,834,000 arising on the acquisition of Beijing Haisheng was written off in the previous financial year.
During the financial year, the Group made an allowance for impairment loss on goodwill of RM3,000,000. The allowance is made after considering the decline in the quoted price of a listed subsidiary and a measurable decrease in the estimated future cash flows from the said subsidiary.
Customer relationships
Customer relationships arise from the “Centro Friends” loyalty programme of PT Tozy Sentosa. As disclosed in Note 2.10, customer relationships are amortised over their estimated useful lives of 5 years. Amortisation of customer relationships is included in the “depreciation and amortisation” line item of profit or loss.
(a) Impairment tests for goodwill
Management has carried out impairment test review for goodwill based on the recoverable amount of each CGU. The recoverable amount has been determined based on a value in use calculation. To calculate this, cash flow projections are prepared based on financial budgets as approved by the executive directors which cover a period of five years. The pre-tax discount rates applied to the cash flow projections are as follows:
2013 2012 % %
CGUPeople’s Republic of China (“PRC”) 9.6 11.4 Malaysia 9.6 11.1Indonesia 11.0 11.0

103
14. INTANGIBLE ASSETS (continued)
(a) Impairment tests for goodwill (continued)
Goodwill has been allocated to the Group’s CGUs identified according to country of operation and business segment as follows:
Malaysia PRC Indonesia Total RM’000 RM’000 RM’000 RM’000
RetailingAt 30 June 2013 19,723 1,302,129 13,133 1,334,985 At 30 June 2012 19,723 1,267,647 13,844 1,301,214
(b) Key assumptions used in value in use calculations
The calculation of value in use for the CGUs are most sensitive to the following assumptions:
Revenue : the bases used to determine the future earnings potential are historical sales and expected growth rates of the relevant industry.
Gross margins : gross margins are based on the average gross margin achieved in the past two years.
Operating expenses : the bases used to determine the values assigned are the cost of inventories purchased for resale, staff costs, depreciation and amortisation, rental expenses and other operating expenses. The value assigned to the key assumption reflects past experience and management’s commitment to maintain the operating expenses to an acceptable level.
Growth rates : the forecasted growth rates are based on published industry research and do not exceed the long term average growth rate for the industries relevant to the CGUs.
Discount rates : discount rates reflect management’s estimate of the risks specific to these entities. In determining appropriate discount rates for each unit, consideration has been given to the applicable weighted average cost of capital for each unit.
(c) Sensitivity to changes in assumptions
With regard to the assessment of value in use of the respective CGU, management believes that no reasonably possible change in any of the above key assumptions would cause the carrying value, including goodwill, of the unit to materially exceed its recoverable amount.
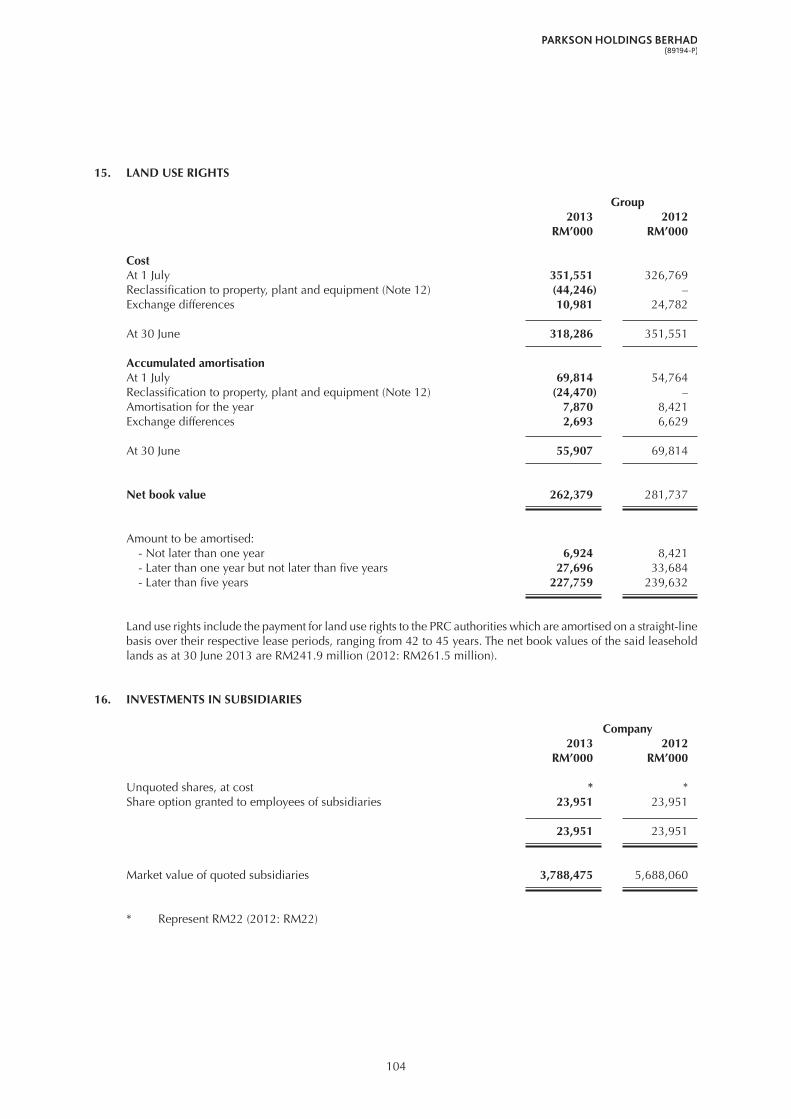
104
15. LAND USE RIGHTS
Group 2013 2012 RM’000 RM’000
CostAt 1 July 351,551 326,769 Reclassification to property, plant and equipment (Note 12) (44,246) –Exchange differences 10,981 24,782
At 30 June 318,286 351,551
Accumulated amortisationAt 1 July 69,814 54,764 Reclassification to property, plant and equipment (Note 12) (24,470) –Amortisation for the year 7,870 8,421 Exchange differences 2,693 6,629
At 30 June 55,907 69,814
Net book value 262,379 281,737
Amount to be amortised: - Not later than one year 6,924 8,421 - Later than one year but not later than five years 27,696 33,684 - Later than five years 227,759 239,632
Land use rights include the payment for land use rights to the PRC authorities which are amortised on a straight-line basis over their respective lease periods, ranging from 42 to 45 years. The net book values of the said leasehold lands as at 30 June 2013 are RM241.9 million (2012: RM261.5 million).
16. INVESTMENTS IN SUBSIDIARIES
Company 2013 2012 RM’000 RM’000
Unquoted shares, at cost * * Share option granted to employees of subsidiaries 23,951 23,951 23,951 23,951
Market value of quoted subsidiaries 3,788,475 5,688,060
* Represent RM22 (2012: RM22)
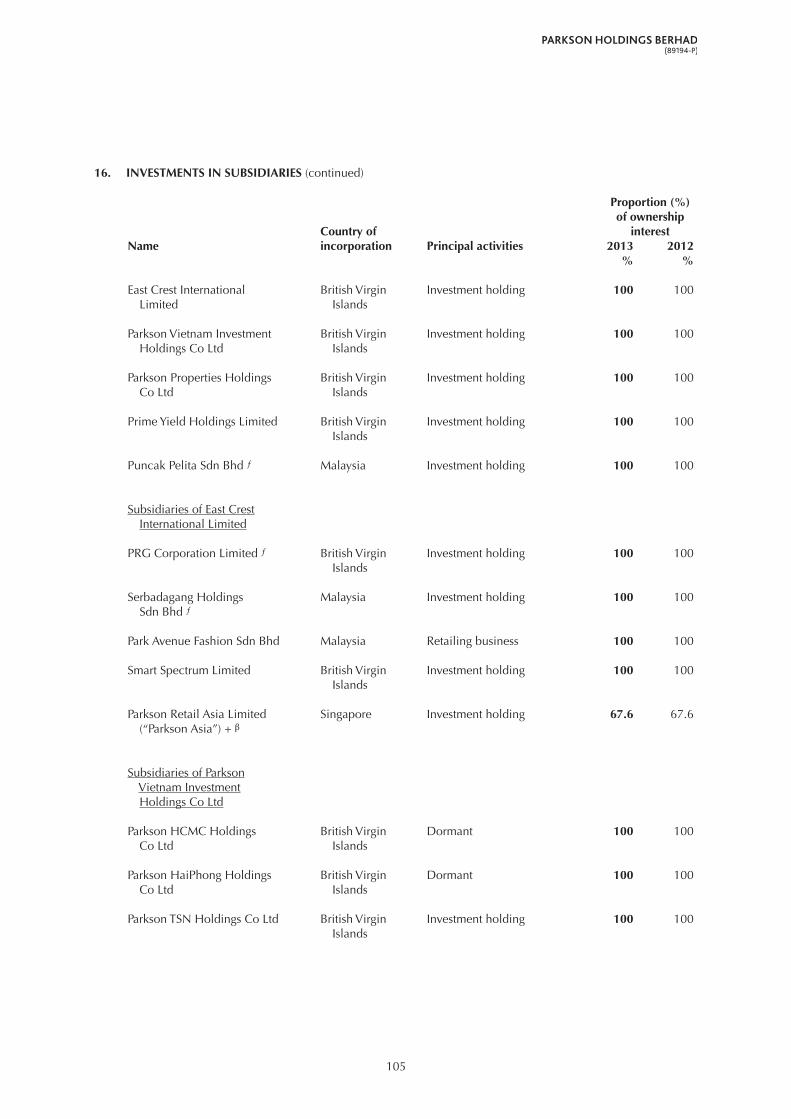
105
16. INVESTMENTS IN SUBSIDIARIES (continued)
Proportion (%) of ownership Country of interestName incorporation Principal activities 2013 2012 % %
East Crest International British Virgin Investment holding 100 100 Limited Islands
Parkson Vietnam Investment British Virgin Investment holding 100 100 Holdings Co Ltd Islands
Parkson Properties Holdings British Virgin Investment holding 100 100 Co Ltd Islands
Prime Yield Holdings Limited British Virgin Investment holding 100 100 Islands
Puncak Pelita Sdn Bhd ƒ Malaysia Investment holding 100 100
Subsidiaries of East Crest International Limited
PRG Corporation Limited ƒ British Virgin Investment holding 100 100 Islands
Serbadagang Holdings Malaysia Investment holding 100 100 Sdn Bhd ƒ
Park Avenue Fashion Sdn Bhd Malaysia Retailing business 100 100
Smart Spectrum Limited British Virgin Investment holding 100 100 Islands
Parkson Retail Asia Limited Singapore Investment holding 67.6 67.6 (“Parkson Asia”) + β
Subsidiaries of Parkson Vietnam Investment Holdings Co Ltd
Parkson HCMC Holdings British Virgin Dormant 100 100 Co Ltd Islands
Parkson HaiPhong Holdings British Virgin Dormant 100 100 Co Ltd Islands
Parkson TSN Holdings Co Ltd British Virgin Investment holding 100 100 Islands

106
16. INVESTMENTS IN SUBSIDIARIES (continued)
Proportion (%) of ownership Country of interestName incorporation Principal activities 2013 2012 % %
Subsidiaries of Parkson Properties Holdings Co Ltd
Parkson Properties NDT British Virgin Dormant 100 100 (Emperor) Co Ltd Islands
Parkson Properties Hanoi British Virgin Dormant 100 100 Co Ltd Islands
Subsidiary of Prime Yield Holdings Limited
Dyna Puncak Sdn Bhd Malaysia Investment holding 100 100
Subsidiary of PRG Corporation Limited
Parkson Retail Group Limited Cayman Investment holding 51.2 51.2 (“Parkson Retail”) + @ Islands *1 0.3 *1 0.3
Subsidiary of Parkson Retail
Grand Parkson Retail Group British Virgin Investment holding 100 100 Limited + Islands
Subsidiaries of Grand Parkson Retail Group Limited
Leonemas International British Virgin Investment holding 100 100 Limited + Islands
Malverest Property British Virgin Investment holding 100 100 International Limited + Islands
Oroleon International British Virgin Investment holding 100 100 Limited + Islands
Releomont International British Virgin Investment holding 100 100 Limited + Islands
Exonbury Limited + Hong Kong Investment holding 100 100 SAR
Parkson Investment Pte Ltd + Singapore Investment holding 100 100
Parkson Supplies Pte Ltd + Singapore Investment holding 100 100
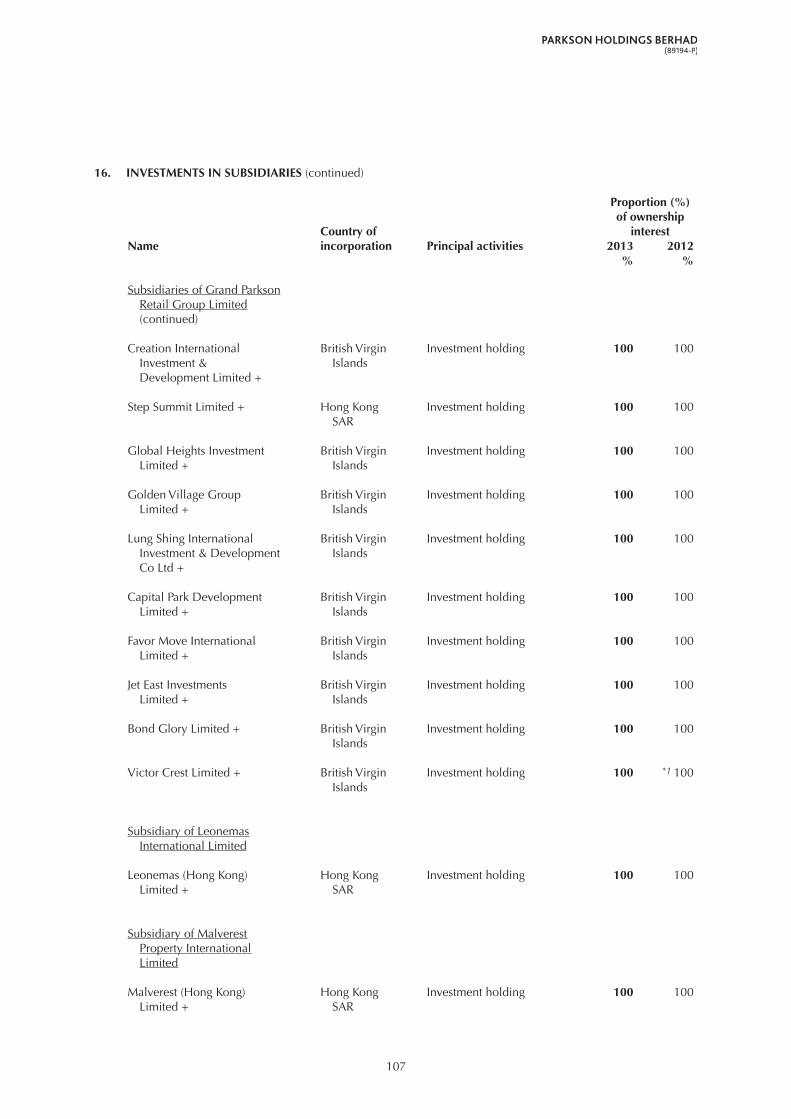
107
16. INVESTMENTS IN SUBSIDIARIES (continued)
Proportion (%) of ownership Country of interestName incorporation Principal activities 2013 2012 % %
Subsidiaries of Grand Parkson Retail Group Limited (continued)
Creation International British Virgin Investment holding 100 100 Investment & Islands Development Limited +
Step Summit Limited + Hong Kong Investment holding 100 100 SAR
Global Heights Investment British Virgin Investment holding 100 100 Limited + Islands
Golden Village Group British Virgin Investment holding 100 100 Limited + Islands
Lung Shing International British Virgin Investment holding 100 100 Investment & Development Islands Co Ltd +
Capital Park Development British Virgin Investment holding 100 100 Limited + Islands
Favor Move International British Virgin Investment holding 100 100 Limited + Islands
Jet East Investments British Virgin Investment holding 100 100 Limited + Islands
Bond Glory Limited + British Virgin Investment holding 100 100 Islands
Victor Crest Limited + British Virgin Investment holding 100 *1 100 Islands
Subsidiary of Leonemas International Limited
Leonemas (Hong Kong) Hong Kong Investment holding 100 100 Limited + SAR
Subsidiary of Malverest Property International Limited
Malverest (Hong Kong) Hong Kong Investment holding 100 100 Limited + SAR
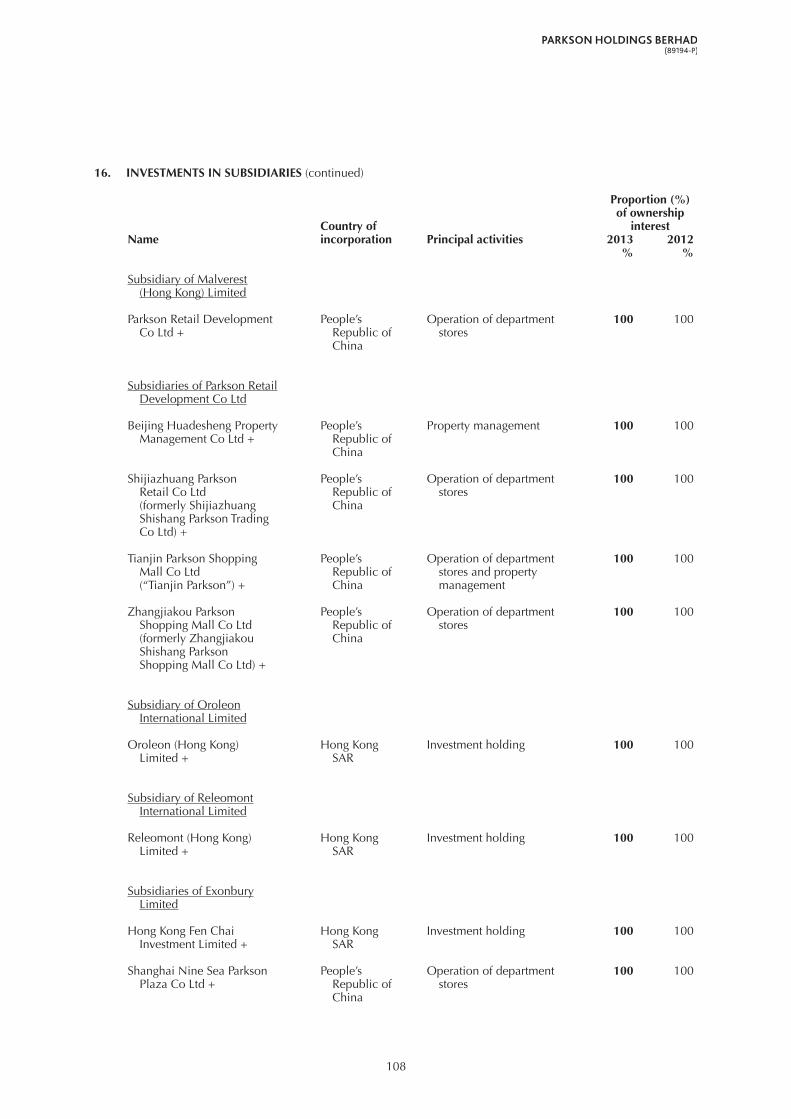
108
16. INVESTMENTS IN SUBSIDIARIES (continued)
Proportion (%) of ownership Country of interestName incorporation Principal activities 2013 2012 % %
Subsidiary of Malverest (Hong Kong) Limited
Parkson Retail Development People’s Operation of department 100 100 Co Ltd + Republic of stores China
Subsidiaries of Parkson Retail Development Co Ltd
Beijing Huadesheng Property People’s Property management 100 100 Management Co Ltd + Republic of China
Shijiazhuang Parkson People’s Operation of department 100 100 Retail Co Ltd Republic of stores (formerly Shijiazhuang China Shishang Parkson Trading Co Ltd) +
Tianjin Parkson Shopping People’s Operation of department 100 100 Mall Co Ltd Republic of stores and property (“Tianjin Parkson”) + China management
Zhangjiakou Parkson People’s Operation of department 100 100 Shopping Mall Co Ltd Republic of stores (formerly Zhangjiakou China Shishang Parkson Shopping Mall Co Ltd) +
Subsidiary of Oroleon International Limited
Oroleon (Hong Kong) Hong Kong Investment holding 100 100 Limited + SAR
Subsidiary of Releomont International Limited
Releomont (Hong Kong) Hong Kong Investment holding 100 100 Limited + SAR
Subsidiaries of Exonbury Limited
Hong Kong Fen Chai Hong Kong Investment holding 100 100 Investment Limited + SAR
Shanghai Nine Sea Parkson People’s Operation of department 100 100 Plaza Co Ltd + Republic of stores China

109
16. INVESTMENTS IN SUBSIDIARIES (continued)
Proportion (%) of ownership Country of interestName incorporation Principal activities 2013 2012 % %
Subsidiaries of Exonbury Limited (continued)
Shanghai Lion Parkson People’s Provision of consultancy 100 100 Investment Consultant Republic of and management services Co Ltd + China
Parkson Investment Holdings People’s Investment holding 70 70 Co Ltd + Republic of *2 30 *2 30 China
Jinan Parkson Retail People’s Operation of department 100 100 Co Ltd + Republic of stores China
Subsidiary of Hong Kong Fen Chai Investment Limited
Xi’an Lucky King Parkson People’s Operation of department 91 91 Plaza Co Ltd + Republic of stores *3 9 *3 9 China
Subsidiaries of Xi’an Lucky King Parkson Plaza Co Ltd
Xi’an Chang’an Parkson Store People’s Operation of department 51 51 Co Ltd + Republic of stores *4 49 *449 China
Xi’an Shidai Parkson Store People’s Operation of department 51 51 Co Ltd + Republic of stores *4 49 *449 China
Shanxi Parkson Retail People’s Operation of department 100 100 Development Co Ltd + Republic of stores China
Subsidiaries of Shanghai Lion Parkson Investment Consultant Co Ltd
Shanghai Shi Jie Fashions People’s Retail operation 100 – Co Ltd + ^ Republic of China
Beijing Century Parkson People’s Research and development – 99 E-business Co Ltd + Republic of of computer software – *51 (Dissolved on 10.7.2012) China
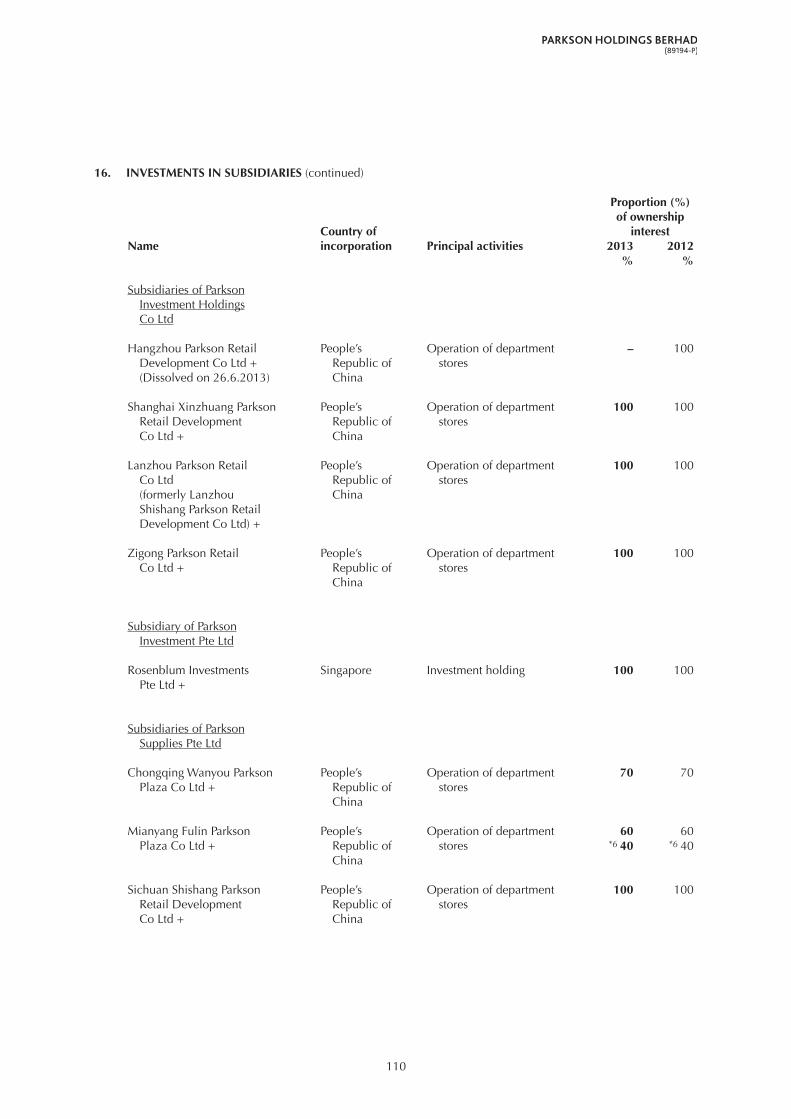
110
16. INVESTMENTS IN SUBSIDIARIES (continued)
Proportion (%) of ownership Country of interestName incorporation Principal activities 2013 2012 % %
Subsidiaries of Parkson Investment Holdings Co Ltd
Hangzhou Parkson Retail People’s Operation of department – 100 Development Co Ltd + Republic of stores (Dissolved on 26.6.2013) China
Shanghai Xinzhuang Parkson People’s Operation of department 100 100 Retail Development Republic of stores Co Ltd + China
Lanzhou Parkson Retail People’s Operation of department 100 100 Co Ltd Republic of stores (formerly Lanzhou China Shishang Parkson Retail Development Co Ltd) +
Zigong Parkson Retail People’s Operation of department 100 100 Co Ltd + Republic of stores China
Subsidiary of Parkson Investment Pte Ltd
Rosenblum Investments Singapore Investment holding 100 100 Pte Ltd +
Subsidiaries of Parkson Supplies Pte Ltd
Chongqing Wanyou Parkson People’s Operation of department 70 70 Plaza Co Ltd + Republic of stores China
Mianyang Fulin Parkson People’s Operation of department 60 60 Plaza Co Ltd + Republic of stores *640 *640 China
Sichuan Shishang Parkson People’s Operation of department 100 100 Retail Development Republic of stores Co Ltd + China
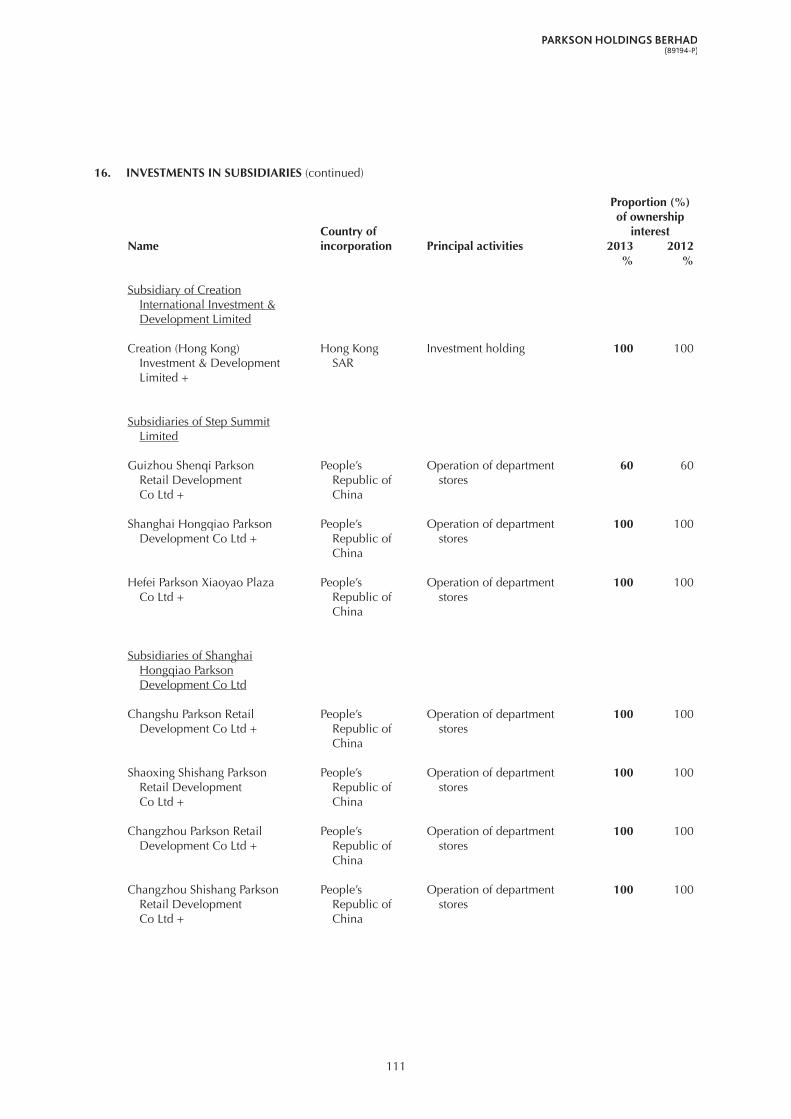
111
16. INVESTMENTS IN SUBSIDIARIES (continued)
Proportion (%) of ownership Country of interestName incorporation Principal activities 2013 2012 % %
Subsidiary of Creation International Investment & Development Limited
Creation (Hong Kong) Hong Kong Investment holding 100 100 Investment & Development SAR Limited +
Subsidiaries of Step Summit Limited
Guizhou Shenqi Parkson People’s Operation of department 60 60 Retail Development Republic of stores Co Ltd + China
Shanghai Hongqiao Parkson People’s Operation of department 100 100 Development Co Ltd + Republic of stores China
Hefei Parkson Xiaoyao Plaza People’s Operation of department 100 100 Co Ltd + Republic of stores China
Subsidiaries of Shanghai Hongqiao Parkson Development Co Ltd
Changshu Parkson Retail People’s Operation of department 100 100 Development Co Ltd + Republic of stores China
Shaoxing Shishang Parkson People’s Operation of department 100 100 Retail Development Republic of stores Co Ltd + China
Changzhou Parkson Retail People’s Operation of department 100 100 Development Co Ltd + Republic of stores China
Changzhou Shishang Parkson People’s Operation of department 100 100 Retail Development Republic of stores Co Ltd + China
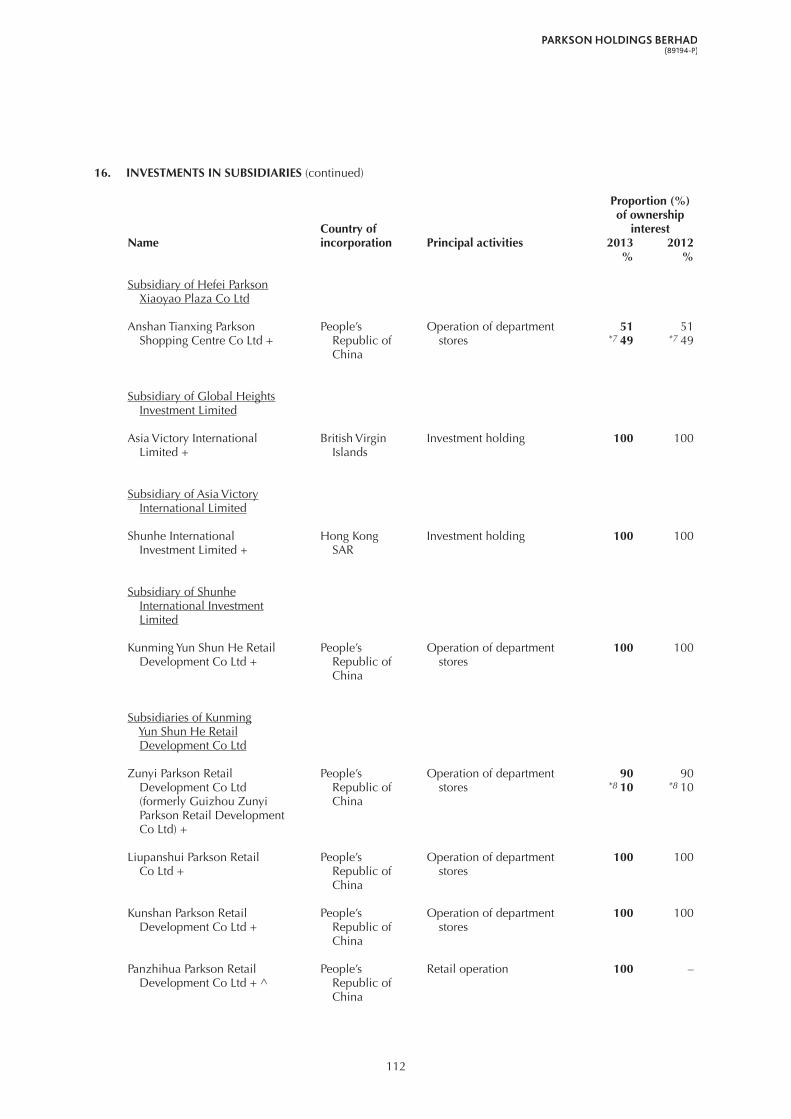
112
16. INVESTMENTS IN SUBSIDIARIES (continued)
Proportion (%) of ownership Country of interestName incorporation Principal activities 2013 2012 % %
Subsidiary of Hefei Parkson Xiaoyao Plaza Co Ltd
Anshan Tianxing Parkson People’s Operation of department 51 51 Shopping Centre Co Ltd + Republic of stores *749 *749 China
Subsidiary of Global Heights Investment Limited
Asia Victory International British Virgin Investment holding 100 100 Limited + Islands
Subsidiary of Asia Victory International Limited
Shunhe International Hong Kong Investment holding 100 100 Investment Limited + SAR
Subsidiary of Shunhe International Investment Limited
Kunming Yun Shun He Retail People’s Operation of department 100 100 Development Co Ltd + Republic of stores China
Subsidiaries of Kunming Yun Shun He Retail Development Co Ltd
Zunyi Parkson Retail People’s Operation of department 90 90 Development Co Ltd Republic of stores *810 *810 (formerly Guizhou Zunyi China Parkson Retail Development Co Ltd) +
Liupanshui Parkson Retail People’s Operation of department 100 100 Co Ltd + Republic of stores China
Kunshan Parkson Retail People’s Operation of department 100 100 Development Co Ltd + Republic of stores China
Panzhihua Parkson Retail People’s Retail operation 100 – Development Co Ltd + ^ Republic of China
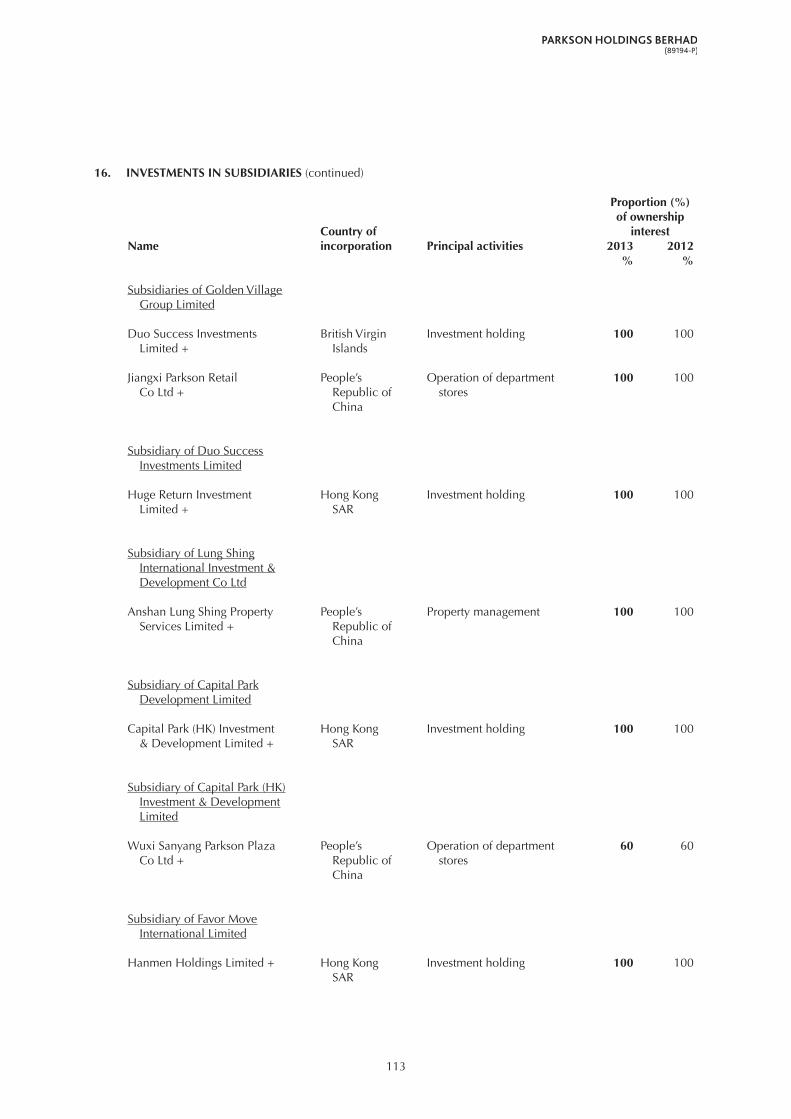
113
16. INVESTMENTS IN SUBSIDIARIES (continued)
Proportion (%) of ownership Country of interestName incorporation Principal activities 2013 2012 % %
Subsidiaries of Golden Village Group Limited
Duo Success Investments British Virgin Investment holding 100 100 Limited + Islands
Jiangxi Parkson Retail People’s Operation of department 100 100 Co Ltd + Republic of stores China
Subsidiary of Duo Success Investments Limited
Huge Return Investment Hong Kong Investment holding 100 100 Limited + SAR
Subsidiary of Lung Shing International Investment & Development Co Ltd
Anshan Lung Shing Property People’s Property management 100 100 Services Limited + Republic of China
Subsidiary of Capital Park Development Limited
Capital Park (HK) Investment Hong Kong Investment holding 100 100 & Development Limited + SAR
Subsidiary of Capital Park (HK) Investment & Development Limited
Wuxi Sanyang Parkson Plaza People’s Operation of department 60 60 Co Ltd + Republic of stores China
Subsidiary of Favor Move International Limited
Hanmen Holdings Limited + Hong Kong Investment holding 100 100 SAR

114
16. INVESTMENTS IN SUBSIDIARIES (continued)
Proportion (%) of ownership Country of interestName incorporation Principal activities 2013 2012 % %
Subsidiary of Jet East Investments Limited
Victory Hope Limited + Hong Kong Investment holding 100 100 SAR
Subsidiaries of Victory Hope Limited
Nanning Brilliant Parkson People’s Operation of department 70 70 Commercial Co Ltd + Republic of stores *9 30 *930 China
Tianjin Parkson Retail People’s Operation of department 100 100 Development Co Ltd + Republic of stores China
Subsidiary of Bond Glory Limited
Choice Link Limited + British Virgin Investment holding 100 100 Islands
Subsidiary of Choice Link Limited
Great Dignity Development Hong Kong Investment holding 100 100 Limited + SAR
Subsidiary of Great Dignity Development Limited
Shantou Parkson Commercial People’s Operation of department 100 100 Co Ltd + Republic of stores China
Subsidiary of Victor Crest Limited
Wide Crest Limited + British Virgin Investment holding 100 100 Islands

115
16. INVESTMENTS IN SUBSIDIARIES (continued)
Proportion (%) of ownership Country of interestName incorporation Principal activities 2013 2012 % %
Subsidiaries of Wide Crest Limited
Wide Field International Hong Kong Investment holding 100 100 Limited + SAR
Sea Coral Limited + Hong Kong Investment holding 100 *1 100 SAR
Parkson Venture Pte Ltd + Singapore Investment holding 100 *1 100
Subsidiary of Wide Field International Limited
Shenyang Parkson Shopping People’s Operation of department 100 100 Plaza Co Ltd + Republic of stores China
Subsidiary of Sea Coral Limited
Dalian Parkson Retail People’s Operation of department 100 100 Development Co Ltd + Republic of stores China
Subsidiary of Parkson Venture Pte Ltd
Qingdao No. 1 Parkson People’s Property development 95.9 *1095.9 Co Ltd + Republic of and operation of China department stores
Subsidiary of Serbadagang Holdings Sdn Bhd
Dalian Tianhe Parkson People’s Operation of department 60 60 Shopping Centre Co Ltd ƒ £ Republic of stores China

116
16. INVESTMENTS IN SUBSIDIARIES (continued)
Proportion (%) of ownership Country of interestName incorporation Principal activities 2013 2012 % %
Subsidiaries of Parkson Asia
Parkson Corporation Malaysia Operation of department 100 100 Sdn Bhd stores
Centro Retail Pte Ltd + Singapore Investment holding 100 100
PT Tozy Sentosa + Indonesia Operation of department 72.2 72.2 stores, supermarket and *11 27.8 *11 27.8 merchandising
Parkson Myanmar Co Singapore Investment holding 100 – Pte Ltd + ^
Subsidiaries of Parkson Corporation Sdn Bhd
Parkson Vietnam Co Ltd + Vietnam Operation of department 100 100 stores
Parkson Haiphong Co Ltd + Vietnam Operation of department 100 100 stores
Kiara Innovasi Sdn Bhd Malaysia Operation of department 60 60 stores
Parkson Cambodia Holdings British Virgin Investment holding 100 100 Co Ltd + Islands
Parkson Online Sdn Bhd Malaysia Online retailing 100 100
Subsidiaries of Parkson Vietnam Co Ltd
Parkson Vietnam Management Vietnam Operation of department 100 100 Services Co Ltd + stores
Parkson Hanoi Co Ltd + Vietnam Operation of department 70 70 stores
Subsidiary of Parkson Cambodia Holdings Co Ltd
Parkson (Cambodia) Co Ltd + Cambodia Operation of department 100 100 stores
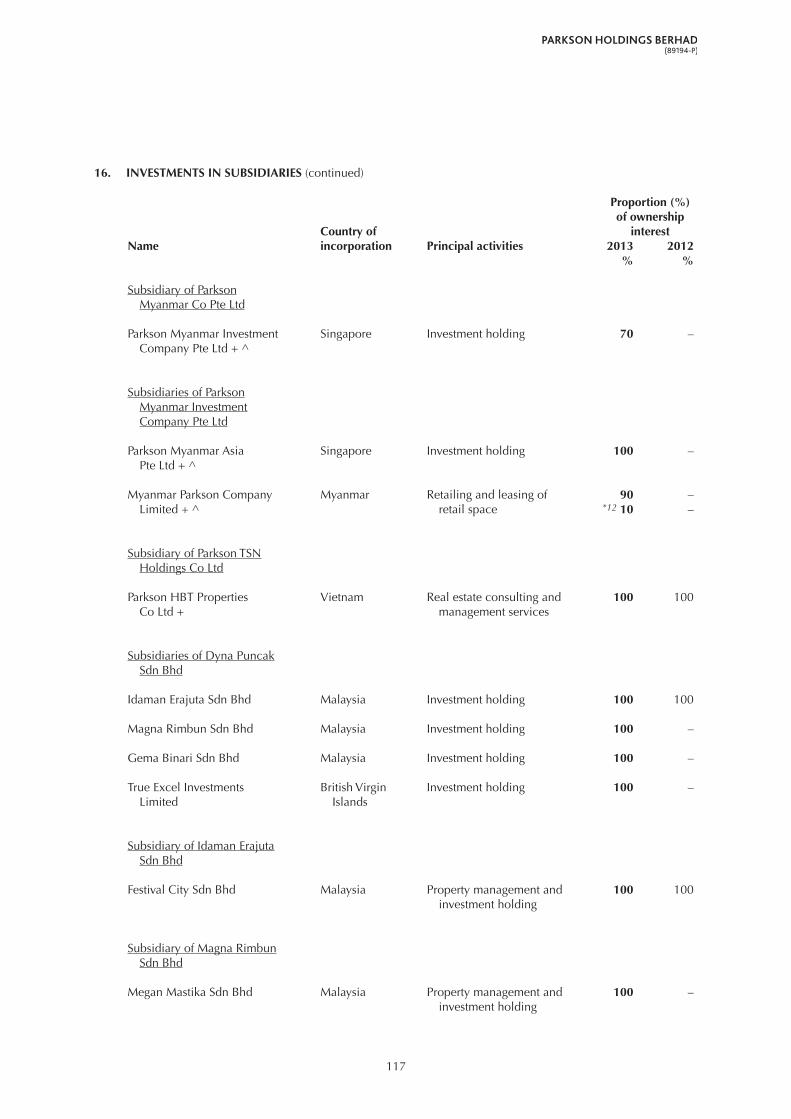
117
16. INVESTMENTS IN SUBSIDIARIES (continued)
Proportion (%) of ownership Country of interestName incorporation Principal activities 2013 2012 % %
Subsidiary of Parkson Myanmar Co Pte Ltd
Parkson Myanmar Investment Singapore Investment holding 70 – Company Pte Ltd + ^
Subsidiaries of Parkson Myanmar Investment Company Pte Ltd
Parkson Myanmar Asia Singapore Investment holding 100 – Pte Ltd + ^
Myanmar Parkson Company Myanmar Retailing and leasing of 90 – Limited + ^ retail space *12 10 –
Subsidiary of Parkson TSN Holdings Co Ltd
Parkson HBT Properties Vietnam Real estate consulting and 100 100 Co Ltd + management services
Subsidiaries of Dyna Puncak Sdn Bhd
Idaman Erajuta Sdn Bhd Malaysia Investment holding 100 100
Magna Rimbun Sdn Bhd Malaysia Investment holding 100 –
Gema Binari Sdn Bhd Malaysia Investment holding 100 –
True Excel Investments British Virgin Investment holding 100 – Limited Islands
Subsidiary of Idaman Erajuta Sdn Bhd
Festival City Sdn Bhd Malaysia Property management and 100 100 investment holding
Subsidiary of Magna Rimbun Sdn Bhd
Megan Mastika Sdn Bhd Malaysia Property management and 100 – investment holding

118
16. INVESTMENTS IN SUBSIDIARIES (continued)
Proportion (%) of ownership Country of interestName incorporation Principal activities 2013 2012 % %
Subsidiary of Gema Binari Sdn Bhd
Dimensi Armani Sdn Bhd Malaysia Property management and 100 – investment holding
Subsidiary of True Excel Investments Limited
True Excel Investments Cambodia Dormant 100 – (Cambodia) Co Ltd + ^
All the companies are audited by Ernst & Young Malaysia except for those marked (“+”) which the company or group companies are audited by a member firm of Ernst & Young Global in the respective countries, and those marked (“ƒ”) which are audited by other firms.
*1 Held by East Crest International Limited.
*2 Held by Parkson Investment Pte Ltd.
*3 Held by Huge Return Investment Limited.
*4 Held by Parkson Retail Development Co Ltd.
*5 Held by Shanghai Nine Sea Parkson Plaza Co Ltd.
*6 Held by Shanghai Hongqiao Parkson Development Co Ltd.
*7 Held by Creation (Hong Kong) Investment & Development Limited.
*8 Held by Parkson Investment Holdings Co Ltd.
*9 Held by Hanmen Holdings Limited.
*10 50% held by Parkson Venture Pte Ltd and 45.9% held by Serbadagang Holdings Sdn Bhd.
*11 Held by Centro Retail Pte Ltd.
*12 Held by Parkson Myanmar Asia Pte Ltd.
^ Subsidiaries which were newly incorporated during the financial year.
β Listed on the Singapore Exchange Securities Trading Limited.
@ Listed on The Stock Exchange of Hong Kong Limited.
£ In financial year 2005, the Group ceased to have management control over Dalian Tianhe Parkson Shopping Centre Co Ltd. Accordingly, the investment was accounted as Investment Securities (Note 22(i)).

119
16. INVESTMENTS IN SUBSIDIARIES (continued)
(a) Acquisition of subsidiaries
(1) During the financial year, the Group acquired the following subsidiaries for a total consideration of RM11:
Consideration RM
Magna Rimbun Sdn Bhd 2 Megan Mastika Sdn Bhd 2 Gema Binari Sdn Bhd 2 Dimensi Armani Sdn Bhd 2 True Excel Investments Limited 3
11
No disclosure on the fair values of the acquired assets and liabilities of the combined entities as the acquisition of these subsidiaries have no material effects on the Group’s financial results and financial position.
(2) In the previous financial year, the Group acquired the following subsidiaries for a total consideration of RM4:
Consideration RM
Puncak Pelita Sdn Bhd 2 Parkson Online Sdn Bhd 2
4
No disclosure on the fair values of the acquired assets and liabilities of the combined entities as the acquisition of these subsidiaries have no material effects on the Group’s financial results and financial position.
(b) Increase in shareholdings in a subsidiary
In the previous financial year, the Group acquired 1,500,000 ordinary shares of HK$0.02 each in Parkson Retail at an average price of HK$8.51 per share, amounting to a total consideration of RM5,229,000 which represented 0.05% of the then equity interest of Parkson Retail.
(c) Dilution of interest in subsidiaries
(1) During the financial year, East Crest International Limited, a wholly-owned subsidiary of the Company, completed the disposal of its entire equity interest in Victor Crest Limited (“Victor Crest”) to Grand Parkson Retail Group Limited, a wholly-owned subsidiary of Parkson Retail, which is in turn a subsidiary of the Company, as further disclosed in Note 36(c). On completion of the disposal, the Group’s effective interest in Victor Crest was diluted from 100% to 51.5%.
(2) In the previous financial year, following the listing of and quotation for Parkson Asia shares on the Main Board of the Singapore Exchange Securities Trading Limited on 3 November 2011, the Group’s equity interest in Parkson Asia was diluted from 90.1% to 67.6%.
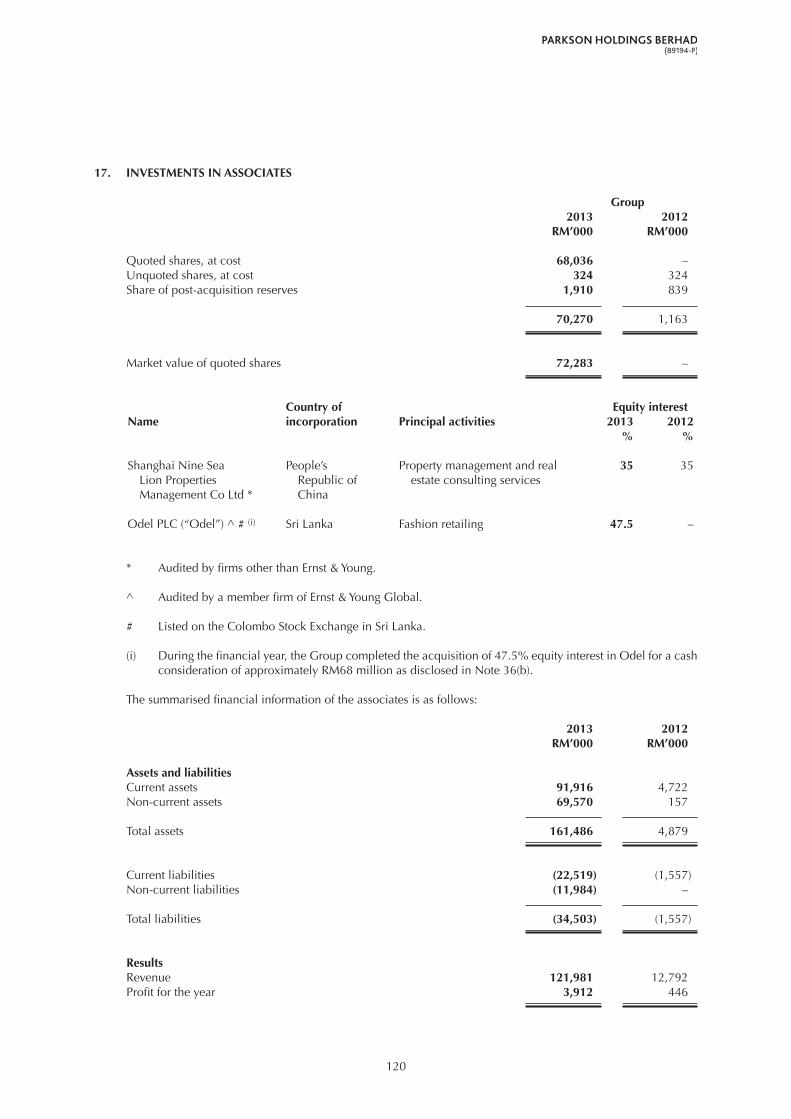
120
17. INVESTMENTS IN ASSOCIATES
Group 2013 2012 RM’000 RM’000
Quoted shares, at cost 68,036 –Unquoted shares, at cost 324 324 Share of post-acquisition reserves 1,910 839
70,270 1,163
Market value of quoted shares 72,283 –
Country of Equity interestName incorporation Principal activities 2013 2012 % %
Shanghai Nine Sea People’s Property management and real 35 35 Lion Properties Republic of estate consulting services Management Co Ltd * China
Odel PLC (“Odel”) ^ # (i) Sri Lanka Fashion retailing 47.5 –
* Audited by firms other than Ernst & Young.
^ Audited by a member firm of Ernst & Young Global.
# Listed on the Colombo Stock Exchange in Sri Lanka.
(i) During the financial year, the Group completed the acquisition of 47.5% equity interest in Odel for a cash consideration of approximately RM68 million as disclosed in Note 36(b).
The summarised financial information of the associates is as follows:
2013 2012 RM’000 RM’000
Assets and liabilitiesCurrent assets 91,916 4,722 Non-current assets 69,570 157 Total assets 161,486 4,879
Current liabilities (22,519) (1,557)Non-current liabilities (11,984) –
Total liabilities (34,503) (1,557)
ResultsRevenue 121,981 12,792 Profit for the year 3,912 446

121
18. INVESTMENT IN A JOINTLY CONTROLLED ENTITY
Details of the jointly controlled entity are as follows:
Country of Equity interestName incorporation Principal activities 2013 2012 % %
Xinjiang Youhao Parkson People’s Operation of department stores 51 51 Development Co Ltd ** Republic of China
** Although the Group has ownership indirectly through subsidiary of more than half of the voting power of the subject entity, the joint venture agreement established joint control over the subject entity. The joint venture agreement ensures that no single venturer is in a position to control the activity unilaterally.
The entity forms part of the Parkson Retail group of companies, which is audited by a member firm of Ernst & Young Global.
The Group’s aggregate share of assets, liabilities, income and expenses of the jointly controlled entity, which are included in the consolidated financial statements, are as follows:
2013 2012 RM’000 RM’000
Assets and liabilitiesCurrent assets 62,988 60,466Non-current assets 4,077 3,053
Total assets 67,065 63,519
Current liabilities (45,579) (40,425)Non-current liabilities (533) (575)
Total liabilities (46,112) (41,000)
Income and expensesRevenue 48,835 45,809 Other income 4,121 3,626 Purchase of goods and changes in inventories (14,310) (12,201)Operating expenses (19,442) (17,191)Finance income 2,935 2,971Finance costs – (434)
Profit before tax 22,139 22,580 Income tax expense (2,519) (2,062)
Profit for the year 19,620 20,518
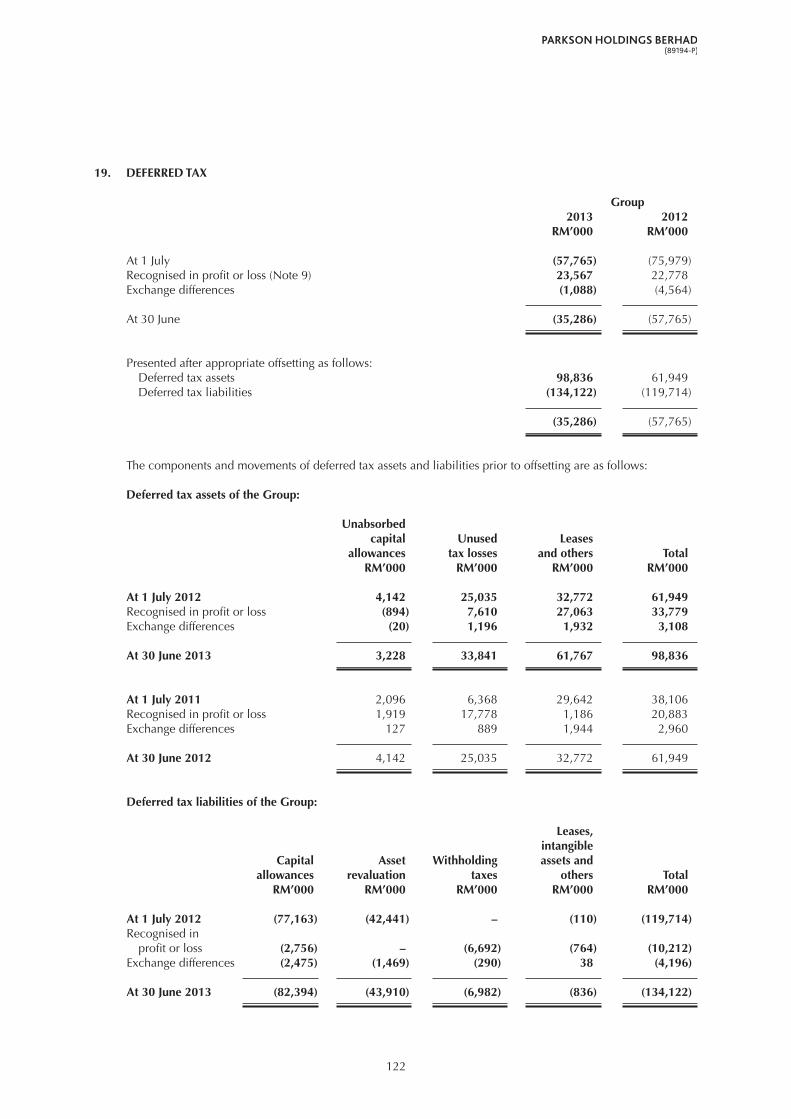
122
19. DEFERRED TAx
Group 2013 2012 RM’000 RM’000
At 1 July (57,765) (75,979)Recognised in profit or loss (Note 9) 23,567 22,778 Exchange differences (1,088) (4,564)
At 30 June (35,286) (57,765)
Presented after appropriate offsetting as follows: Deferred tax assets 98,836 61,949 Deferred tax liabilities (134,122) (119,714)
(35,286) (57,765)
The components and movements of deferred tax assets and liabilities prior to offsetting are as follows:
Deferred tax assets of the Group:
Unabsorbed capital Unused Leases allowances tax losses and others Total RM’000 RM’000 RM’000 RM’000
At 1 July 2012 4,142 25,035 32,772 61,949 Recognised in profit or loss (894) 7,610 27,063 33,779 Exchange differences (20) 1,196 1,932 3,108
At 30 June 2013 3,228 33,841 61,767 98,836
At 1 July 2011 2,096 6,368 29,642 38,106 Recognised in profit or loss 1,919 17,778 1,186 20,883 Exchange differences 127 889 1,944 2,960
At 30 June 2012 4,142 25,035 32,772 61,949
Deferred tax liabilities of the Group:
Leases, intangible Capital Asset Withholding assets and allowances revaluation taxes others Total RM’000 RM’000 RM’000 RM’000 RM’000
At 1 July 2012 (77,163) (42,441) – (110) (119,714)Recognised in profit or loss (2,756) – (6,692) (764) (10,212)Exchange differences (2,475) (1,469) (290) 38 (4,196)
At 30 June 2013 (82,394) (43,910) (6,982) (836) (134,122)

123
19. DEFERRED TAx (continued)
Deferred tax liabilities of the Group: (continued)
Leases, intangible Capital Asset assets and allowances revaluation others Total RM’000 RM’000 RM’000 RM’000
At 1 July 2011 (73,494) (39,648) (943) (114,085)Recognised in profit or loss 1,062 – 833 1,895 Exchange differences (4,731) (2,793) – (7,524)
At 30 June 2012 (77,163) (42,441) (110) (119,714)
Deferred tax assets have not been recognised in respect of the following items:
Group 2013 2012 RM’000 RM’000
Unused tax losses 202,582 116,104 Unabsorbed capital allowances 1,060 2,062
The availability of the unused tax losses and unabsorbed capital allowances for offsetting against future taxable profits of the subsidiaries is subject to approval from the taxation authority of the country in which the losses originate.
Deferred tax assets have not been recognised in respect of the unused tax losses and unabsorbed capital allowances as it is not probable that taxable profit will be available against which the unused tax losses and unabsorbed capital allowances can be utilised, considering that the relevant subsidiaries have been incurring losses and there are no other tax planning opportunities or other evidence of recoverability in the near future. If the Group was able to recognise all unrecognised deferred tax assets, the Group’s profit would have been RM50.9 million (2012: RM29.5 million) higher.
Pursuant to the PRC Corporate Income Tax Law, a 10% withholding tax is levied on dividends declared to foreign investors from the foreign investment enterprises established in the PRC. The requirement is effective from 1 January 2008 and applies to earnings after 31 December 2007. A lower withholding tax rate may be applied if there is a tax treaty between the PRC and the jurisdiction of the foreign investors. The Group has intermediate investment holding companies incorporated in Hong Kong or Singapore which qualify for a preferential withholding tax rate at 5%.
20. OTHER ASSETS
Group 2013 2012 RM’000 RM’000
Deposits 62,046 60,351 Lease prepayments (i) 48,428 38,000 Deferred lease expenses (ii) 71,969 54,702 Prepayment for acquisition of land and building (iii) – 211,338
182,443 364,391

124
20. OTHER ASSETS (continued)
(i) Lease prepayments represent long term portion of the prepaid lease rental paid to lessors.
(ii) Deferred lease expenses relate to the differences between fair value of non-current rental deposits recognised on initial recognition and the absolute deposit amount, which are amortised on a straight-line basis over the lease terms ranging from 5 to 20 years (2012: 5 to 20 years).
The movement in deferred lease expenses is as follows:
Group 2013 2012 RM’000 RM’000
At 1 July 54,702 32,475 Additions during the year 19,426 23,563Recognised in profit or loss (Note 8) (2,597) (2,233)Exchange differences 438 897
At 30 June 71,969 54,702
(iii) This amount represents a prepayment of Rmb422.8 million (equivalent to approximately RM211.3 million) for the acquisition of the land use right and the building ownership right of a shopping complex located in the Tianjin City, the PRC. The acquisition was completed during the financial year.
21. AMOUNTS DUE FROM/TO SUBSIDIARIES
Company 2013 2012 RM’000 RM’000
Non-currentAmount due from a subsidiary 7,643,799 7,863,067 Less: Allowance for impairment loss (3,777,000) –
3,866,799 7,863,067
During the financial year, the Company has made an allowance for impairment loss on the amount due from East Crest International Limited, a wholly-owned subsidiary which holds 51.5% equity interest in Parkson Retail. The allowance is made after considering the decline in the quoted price of Parkson Retail and a measurable decrease in the estimated future cash flows from Parkson Retail.
The non-current portion of the amount due from a subsidiary represents the amount which the Company does not intend to demand repayment within twelve months from the reporting date.
Current
The amounts due from/to subsidiaries are unsecured, interest free and repayable on demand.

125
22. INVESTMENT SECURITIES
Group 2013 2012 RM’000 RM’000
Non-currentAvailable-for-sale financial assets: Outside Malaysia - Unquoted shares At cost (i) 21,296 21,296 Accumulated impairment loss (21,296) (21,296)
– – - Quoted shares, at market value (ii) – 13,183
– 13,183
In Malaysia - Unquoted shares, at cost (iii) 233 233
233 13,416
Held-to-maturity investment: - Unquoted shares, at amortised cost 30,000 30,000
Total investment securities 30,233 43,416
(i) As disclosed in Note 16, the Group ceased to have management control over Dalian Tianhe Parkson Shopping Centre Co Ltd. Accordingly, the investment was accounted as available-for-sale financial assets.
(ii) The quoted shares were disposed of during the financial year.
(iii) Represents a 7% equity interest in Lion Insurance Company Limited, a related party of the Group. The relationship of the related party with the Group is further disclosed in Note 34.

126
23. DERIVATIVE
Group 2013 2012 RM’000 RM’000
Option to purchase additional shares in Kiara Innovasi Sdn Bhd (“Kiara Innovasi”) (“Option”) 52 52
The derivative relates to the fair value of an irrevocable option (“Option”) granted by Galaxy Point Sdn Bhd (“Galaxy Point”), the 40% shareholder of Kiara Innovasi, to Parkson Corporation Sdn Bhd (“PCSB”) to purchase Galaxy Point’s entire shareholding in Kiara Innovasi at the proportionate net tangible assets of Kiara Innovasi. PCSB may exercise the Option at any time for a period of three years from the date of business commencement of Kiara Innovasi. The Option is renewed every three years. Further details of the Option are disclosed in Note 38(a).
24. INVENTORIES
Group 2013 2012 RM’000 RM’000
At costs: Merchandise inventories 280,070 269,768 Properties held for sale 5,295 5,118 Consumables 6,883 5,021
292,248 279,907 At net realisable value: Merchandise inventories 222 569
292,470 280,476
During the financial year, the amount of inventories recognised as an expense in cost of sales of the Group was RM1,142,908,000 (2012: RM1,098,829,000).

127
25. TRADE AND OTHER RECEIVABLES
Group Company 2013 2012 2013 2012 RM’000 RM’000 RM’000 RM’000
CurrentTrade receivables 12,659 16,867 – –Less: Allowance for impairment loss (574) (571) – –
12,085 16,296 – –
Sundry receivables (i) 194,876 159,607 8 2 Less: Allowance for impairment loss (3,223) (3,553) – –
191,653 156,054 8 2
Deposits (ii) 322,800 84,471 7 7 Less: Allowance for impairment loss – (500) – –
322,800 83,971 7 7
Amounts due from related parties (iii) 17,798 18,910 17,798 18,900 Lease prepayments (iv) 211,165 164,105 – –Prepayments 82,834 73,187 – –
311,797 256,202 17,798 18,900
Total trade and other receivables 838,335 512,523 17,813 18,909
Total trade and other receivables (as above) 838,335 512,523 17,813 18,909 Add: Deposits, cash and bank balances (Note 26) 3,044,017 3,030,992 21,918 28,961 Add: Long term deposits (Note 20) 62,046 60,351 – –Less: Lease prepayments (211,165) (164,105) – – Prepayments (82,834) (73,187) – –
Total loans and receivables 3,650,399 3,366,574 39,731 47,870
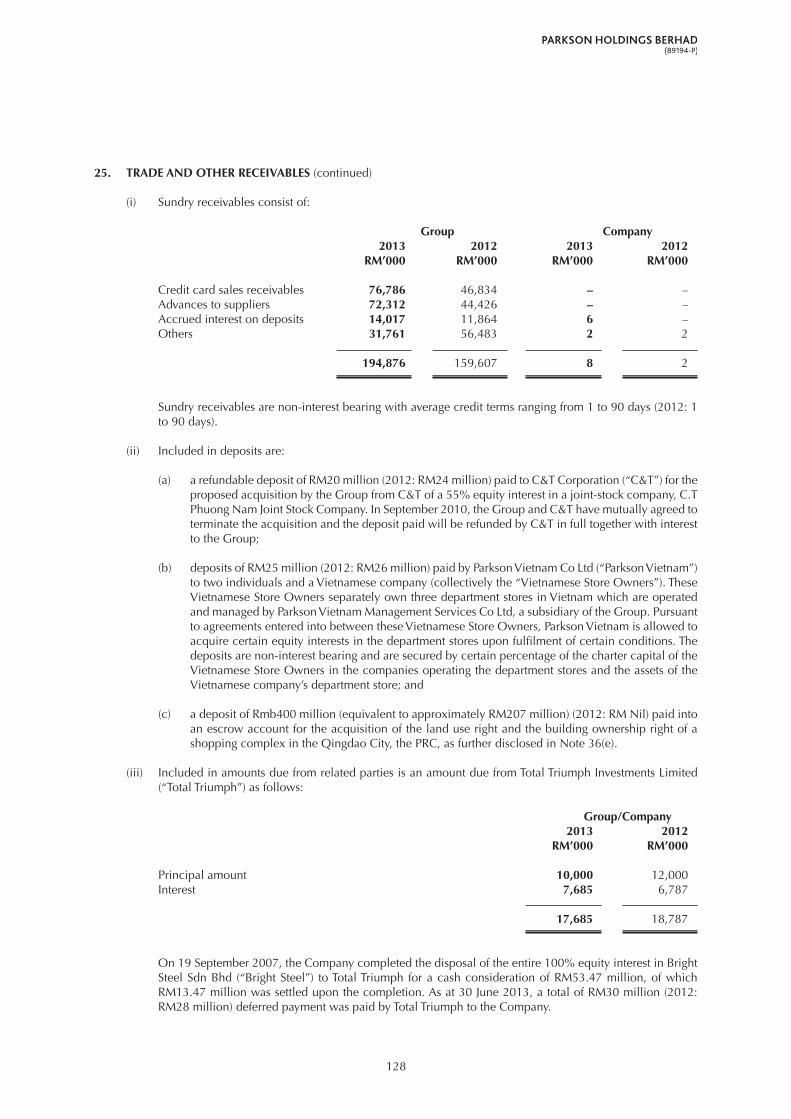
128
25. TRADE AND OTHER RECEIVABLES (continued)
(i) Sundry receivables consist of:
Group Company 2013 2012 2013 2012 RM’000 RM’000 RM’000 RM’000
Credit card sales receivables 76,786 46,834 – –Advances to suppliers 72,312 44,426 – –Accrued interest on deposits 14,017 11,864 6 –Others 31,761 56,483 2 2 194,876 159,607 8 2
Sundry receivables are non-interest bearing with average credit terms ranging from 1 to 90 days (2012: 1 to 90 days).
(ii) Included in deposits are:
(a) a refundable deposit of RM20 million (2012: RM24 million) paid to C&T Corporation (“C&T”) for the proposed acquisition by the Group from C&T of a 55% equity interest in a joint-stock company, C.T Phuong Nam Joint Stock Company. In September 2010, the Group and C&T have mutually agreed to terminate the acquisition and the deposit paid will be refunded by C&T in full together with interest to the Group;
(b) deposits of RM25 million (2012: RM26 million) paid by Parkson Vietnam Co Ltd (“Parkson Vietnam”) to two individuals and a Vietnamese company (collectively the “Vietnamese Store Owners”). These Vietnamese Store Owners separately own three department stores in Vietnam which are operated and managed by Parkson Vietnam Management Services Co Ltd, a subsidiary of the Group. Pursuant to agreements entered into between these Vietnamese Store Owners, Parkson Vietnam is allowed to acquire certain equity interests in the department stores upon fulfilment of certain conditions. The deposits are non-interest bearing and are secured by certain percentage of the charter capital of the Vietnamese Store Owners in the companies operating the department stores and the assets of the Vietnamese company’s department store; and
(c) a deposit of Rmb400 million (equivalent to approximately RM207 million) (2012: RM Nil) paid into an escrow account for the acquisition of the land use right and the building ownership right of a shopping complex in the Qingdao City, the PRC, as further disclosed in Note 36(e).
(iii) Included in amounts due from related parties is an amount due from Total Triumph Investments Limited (“Total Triumph”) as follows:
Group/Company 2013 2012 RM’000 RM’000
Principal amount 10,000 12,000 Interest 7,685 6,787
17,685 18,787
On 19 September 2007, the Company completed the disposal of the entire 100% equity interest in Bright Steel Sdn Bhd (“Bright Steel”) to Total Triumph for a cash consideration of RM53.47 million, of which RM13.47 million was settled upon the completion. As at 30 June 2013, a total of RM30 million (2012: RM28 million) deferred payment was paid by Total Triumph to the Company.

129
25. TRADE AND OTHER RECEIVABLES (continued)
(iii) (continued)
On 30 September 2013, a repayment of RM2 million was further made by Total Triumph with the remaining balance to be paid by instalments.
The amount due from Total Triumph bears interest of 1% (2012: 1%) above base lending rate per annum and is secured against shares in Bright Steel.
Other than the above, the amounts due from other related parties are unsecured, interest free and repayable on demand.
The relationship of the related parties with the Group and the Company are further disclosed in Note 34.
(iv) Lease prepayments are non-interest bearing except for an amount of approximately RM126 million (2012: RM50 million) paid to landlords by subsidiaries in the PRC which bore interests ranging from 6% to 8% per annum (2012: 7% per annum).
The Group has no significant concentration of credit risk that may arise from exposure to a single debtor or to a group of debtors, other than the deposit paid for the acquisition of the land use right and the building ownership right mentioned in (ii)(c) above.
Credit terms of trade receivables range from payment in advance to 90 days (2012: payment in advance to 90 days).
Other information on financial risks of trade and other receivables are disclosed in Note 39.
Ageing analysis of trade receivables
The ageing analysis of trade receivables is as follows:
Group 2013 2012 RM’000 RM’000
Neither past due nor impaired 7,497 11,028
1 to 30 days past due not impaired 1,421 2,524 31 to 60 days past due not impaired 497 689 61 to 90 days past due not impaired 332 283 More than 91 days past due not impaired 2,338 1,772
Past due but not impaired 4,588 5,268 Impaired 574 571
12,659 16,867
Receivables that are neither past due nor impaired
Receivables that are neither past due nor impaired are creditworthy debtors with good payment records with the Group. None of the Group’s receivables that are neither past due nor impaired have been renegotiated during the financial year.
Receivables that are past due but not impaired
Receivables that are past due but not impaired are unsecured in nature. Management is confident that these receivables are recoverable as these accounts are still active.

130
25. TRADE AND OTHER RECEIVABLES (continued)
Receivables that are impaired
The Group’s trade and other receivables that are impaired at the reporting date are principally on delinquent accounts and the movement of allowance accounts used to record the impairment loss are as follows:
Group 2013 2012 RM’000 RM’000
Individually impairedTrade receivables - nominal amounts 574 571Less: Allowance for impairment loss (574) (571)
– –
Sundry receivables - nominal amounts 3,223 3,553 Less: Allowance for impairment loss (3,223) (3,553)
– –
Deposits - nominal amounts – 509 Less: Allowance for impairment loss – (500)
– 9
Movement of allowance accounts is as follows:
Trade SundryGroup receivables receivables Deposits Total RM’000 RM’000 RM’000 RM’000
At 1 July 2012 571 3,553 500 4,624 Charge for the year – 160 – 160Reversal of impairment loss – (484) (491) (975)Exchange differences 3 (6) (9) (12)
At 30 June 2013 574 3,223 – 3,797
At 1 July 2011 563 3,306 – 3,869 Charge for the year – 654 487 1,141 Reversal of impairment loss – (424) – (424)Exchange differences 8 17 13 38
At 30 June 2012 571 3,553 500 4,624
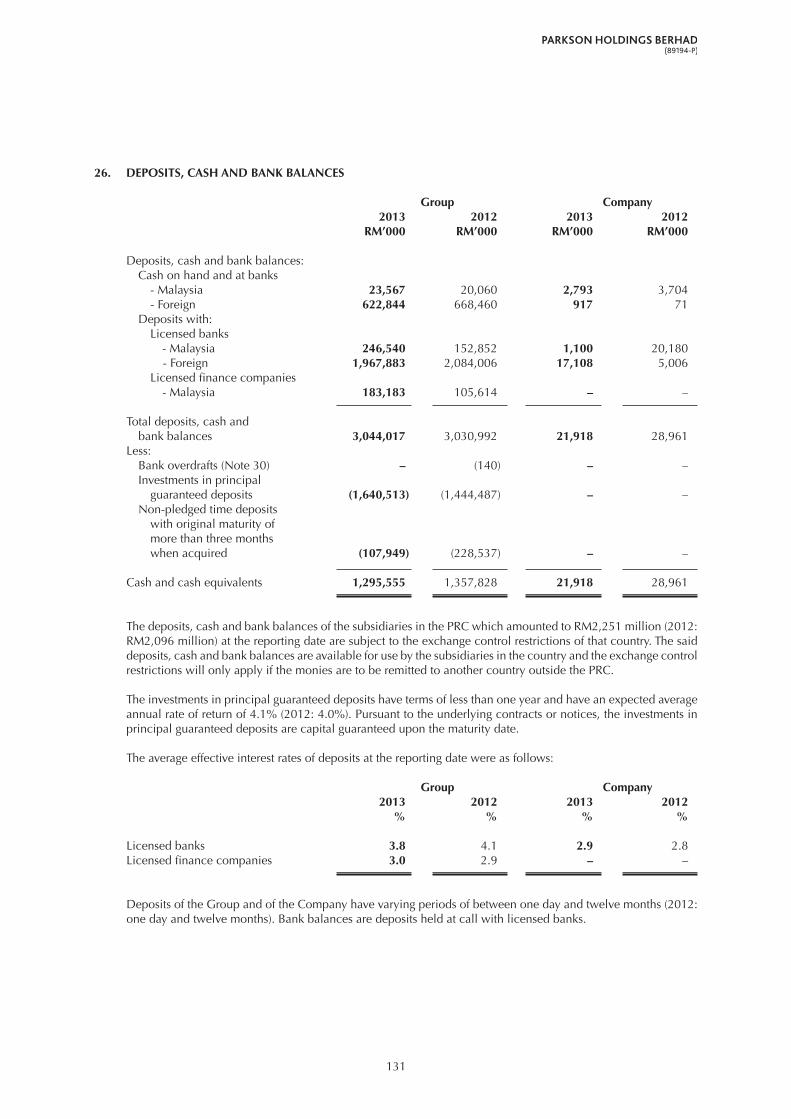
131
26. DEPOSITS, CASH AND BANK BALANCES
Group Company 2013 2012 2013 2012 RM’000 RM’000 RM’000 RM’000
Deposits, cash and bank balances: Cash on hand and at banks - Malaysia 23,567 20,060 2,793 3,704 - Foreign 622,844 668,460 917 71 Deposits with: Licensed banks - Malaysia 246,540 152,852 1,100 20,180 - Foreign 1,967,883 2,084,006 17,108 5,006 Licensed finance companies - Malaysia 183,183 105,614 – –
Total deposits, cash and bank balances 3,044,017 3,030,992 21,918 28,961 Less: Bank overdrafts (Note 30) – (140) – – Investments in principal guaranteed deposits (1,640,513) (1,444,487) – – Non-pledged time deposits with original maturity of more than three months when acquired (107,949) (228,537) – –
Cash and cash equivalents 1,295,555 1,357,828 21,918 28,961
The deposits, cash and bank balances of the subsidiaries in the PRC which amounted to RM2,251 million (2012: RM2,096 million) at the reporting date are subject to the exchange control restrictions of that country. The said deposits, cash and bank balances are available for use by the subsidiaries in the country and the exchange control restrictions will only apply if the monies are to be remitted to another country outside the PRC.
The investments in principal guaranteed deposits have terms of less than one year and have an expected average annual rate of return of 4.1% (2012: 4.0%). Pursuant to the underlying contracts or notices, the investments in principal guaranteed deposits are capital guaranteed upon the maturity date.
The average effective interest rates of deposits at the reporting date were as follows:
Group Company 2013 2012 2013 2012 % % % %
Licensed banks 3.8 4.1 2.9 2.8Licensed finance companies 3.0 2.9 – –
Deposits of the Group and of the Company have varying periods of between one day and twelve months (2012: one day and twelve months). Bank balances are deposits held at call with licensed banks.

132
27. SHARE CAPITAL, SHARE PREMIUM AND TREASURY SHARES
Number of ordinary shares of RM1.00 each Amount
Share Share Total capital capital share (Issued (Issued capital and fully Treasury and fully Share and share Treasury Group/Company paid-up) shares paid-up) premium premium shares ‘000 ‘000 RM’000 RM’000 RM’000 RM’000 (a) (a) (b) At 1 July 2012 1,093,902 (9,303) 1,093,902 3,731,416 4,825,318 (45,684)Purchase of treasury shares – (3,087) – – – (12,488)
At 30 June 2013 1,093,902 (12,390) 1,093,902 3,731,416 4,825,318 (58,172)
At 1 July 2011 1,093,673 (3,017) 1,093,673 3,729,979 4,823,652 (13,707)Employee share options exercised 229 – 229 1,437 1,666 –Purchase of treasury shares – (6,286) – – – (31,977)
At 30 June 2012 1,093,902 (9,303) 1,093,902 3,731,416 4,825,318 (45,684)
Number of ordinary shares of RM1.00 each Amount 2013 2012 2013 2012 ‘000 ‘000 RM’000 RM’000
Authorised share capitalAt 1 July/30 June 4,500,000 4,500,000 4,500,000 4,500,000
(a) Issue of shares
In the previous financial year, the issued and paid-up share capital of the Company was increased from RM1,093,673,250 to RM1,093,902,050 by the issuance of 228,800 new ordinary shares of RM1.00 each at an issue price of RM5.31 per share for cash pursuant to the Executive Share Option Scheme (“ESOS”) of the Company.
The new ordinary shares issued ranked paripassu in all respects with the then existing ordinary shares of the Company.
(b) Treasury shares
This amount relates to the acquisition cost of treasury shares. The Directors of the Company are committed to enhancing the value of the Company for its shareholders and believe that the repurchase plan can be applied in the best interests of the Company and its shareholders.
During the financial year, the Company repurchased a total of 3,086,400 of its issued ordinary shares from the open market at an average price of RM4.05 per share. The total consideration paid for the repurchase including transaction costs was RM12.49 million. The repurchase transactions were financed by internally generated funds. The shares repurchased are being held as treasury shares in accordance with Section 67A of the Companies Act, 1965.
As at 30 June 2013, the number of outstanding ordinary shares in issue after the set off of 12,389,631 (2012: 9,303,231) treasury shares held by the Company is 1,081,512,419 (2012: 1,084,598,819) ordinary shares of RM1.00 each.

133
28. OTHER RESERVES
Premium on Available- acquisition for-sale Exchange Share Asset of non- investment fluctuation option revaluation Capital Merger Hedging controlling revaluation Group reserves reserve reserve reserves deficit reserve interests reserve Total RM’000 RM’000 RM’000 RM’000 RM’000 RM’000 RM’000 RM’000 RM’000 (a) (b) (c) (d)
2013
At 1 July 2012 51,237 11,408 64,764 66,619 (2,694,683) 12,953 (3,843) (853) (2,492,398)
Other comprehensive income/ (loss) for the yearNet gain/(loss) on available-for- sale financial assets: - Gain on fair value changes – – – – – – – 5,809 5,809 - Transfer to profit or loss upon disposal – – – – – – – (4,096) (4,096)Loss on fair value changes in hedging instruments on cash flow hedges – – – – – (26,007) – – (26,007)Foreign currency translation 77,309 502 4,349 4,672 – 870 – (58) 87,644 Less: Non-controlling interests (39,251) (243) (2,108) (2,265) – 12,184 – (802) (32,485)
38,058 259 2,241 2,407 – (12,953) – 853 30,865
Transactions with ownersTransfer to capital reserves – – – 2,294 – – – – 2,294 Dilution of interest in subsidiaries – – – 7,357 – – – – 7,357 Employee share options lapsed – (11,217) – – – – – – (11,217)Employee share options exercised – (1) – – – – – – (1)Transfer from retained profits – – – – 436,616 – – – 436,616 Equity-settled share option arrangements granted by a subsidiary – 8,180 – – – – – – 8,180
– (3,038) – 9,651 436,616 – – – 443,229
At 30 June 2013 89,295 8,629 67,005 78,677 (2,258,067) – (3,843) – (2,018,304)

134
28. OTHER RESERVES (continued)
Premium on Available- acquisition for-sale Exchange Share Asset of non- investment fluctuation option revaluation Capital Merger Hedging controlling revaluation Group reserves reserve reserve reserves deficit reserve interests reserve Total RM’000 RM’000 RM’000 RM’000 RM’000 RM’000 RM’000 RM’000 RM’000 (a) (b) (c) (d)
2012
At 1 July 2011 (48,747) 31,191 60,440 64,338 (2,876,086) (3,070) – 47 (2,771,887)
Other comprehensive income/ (loss) for the yearLoss on fair value changes on available-for-sale financial assets – – – – – – – (1,753) (1,753)Gain on fair value changes in hedging instruments on cash flow hedges – – – – – 31,520 – – 31,520 Foreign currency translation 173,624 1,436 8,270 8,704 – (420) – 6 191,620 Less: Non-controlling interests (73,491) (699) (4,014) (4,223) – (15,074) – 847 (96,654)
100,133 737 4,256 4,481 – 16,026 – (900) 124,733
Transactions with ownersTransfer from capital reserves – – – (2,272) – – – – (2,272)Acquisition of interest in a subsidiary (149) 12 68 72 – (3) (3,843) – (3,843)Employee share options lapsed/terminated – (20,288) – – – – – – (20,288)Employee share options exercised – (451) – – – – – – (451)Transfer from retained profits – – – – 181,403 – – – 181,403 Equity-settled share option arrangements granted by the Company – 207 – – – – – – 207
(149) (20,520) 68 (2,200) 181,403 (3) (3,843) – 154,756
At 30 June 2012 51,237 11,408 64,764 66,619 (2,694,683) 12,953 (3,843) (853) (2,492,398)
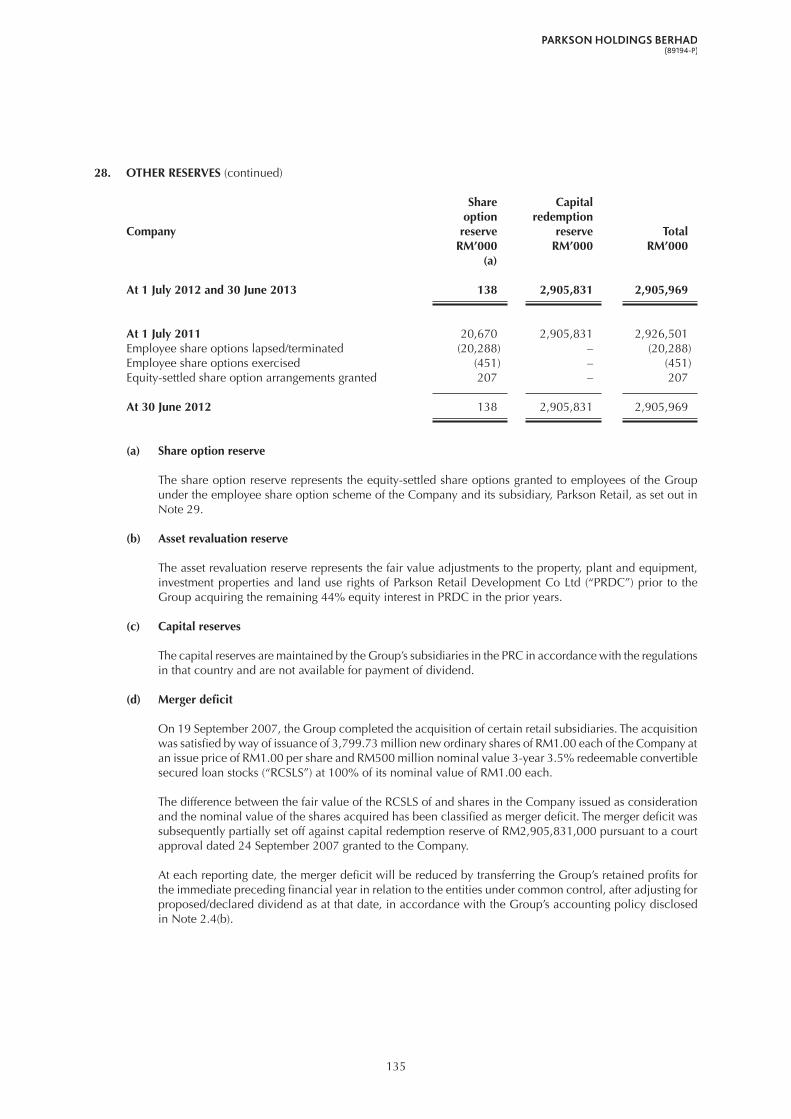
135
28. OTHER RESERVES (continued)
Share Capital option redemptionCompany reserve reserve Total RM’000 RM’000 RM’000 (a)
At 1 July 2012 and 30 June 2013 138 2,905,831 2,905,969
At 1 July 2011 20,670 2,905,831 2,926,501 Employee share options lapsed/terminated (20,288) – (20,288)Employee share options exercised (451) – (451)Equity-settled share option arrangements granted 207 – 207
At 30 June 2012 138 2,905,831 2,905,969
(a) Share option reserve
The share option reserve represents the equity-settled share options granted to employees of the Group under the employee share option scheme of the Company and its subsidiary, Parkson Retail, as set out in Note 29.
(b) Asset revaluation reserve
The asset revaluation reserve represents the fair value adjustments to the property, plant and equipment, investment properties and land use rights of Parkson Retail Development Co Ltd (“PRDC”) prior to the Group acquiring the remaining 44% equity interest in PRDC in the prior years.
(c) Capital reserves
The capital reserves are maintained by the Group’s subsidiaries in the PRC in accordance with the regulations in that country and are not available for payment of dividend.
(d) Merger deficit
On 19 September 2007, the Group completed the acquisition of certain retail subsidiaries. The acquisition was satisfied by way of issuance of 3,799.73 million new ordinary shares of RM1.00 each of the Company at an issue price of RM1.00 per share and RM500 million nominal value 3-year 3.5% redeemable convertible secured loan stocks (“RCSLS”) at 100% of its nominal value of RM1.00 each.
The difference between the fair value of the RCSLS of and shares in the Company issued as consideration and the nominal value of the shares acquired has been classified as merger deficit. The merger deficit was subsequently partially set off against capital redemption reserve of RM2,905,831,000 pursuant to a court approval dated 24 September 2007 granted to the Company.
At each reporting date, the merger deficit will be reduced by transferring the Group’s retained profits for the immediate preceding financial year in relation to the entities under common control, after adjusting for proposed/declared dividend as at that date, in accordance with the Group’s accounting policy disclosed in Note 2.4(b).
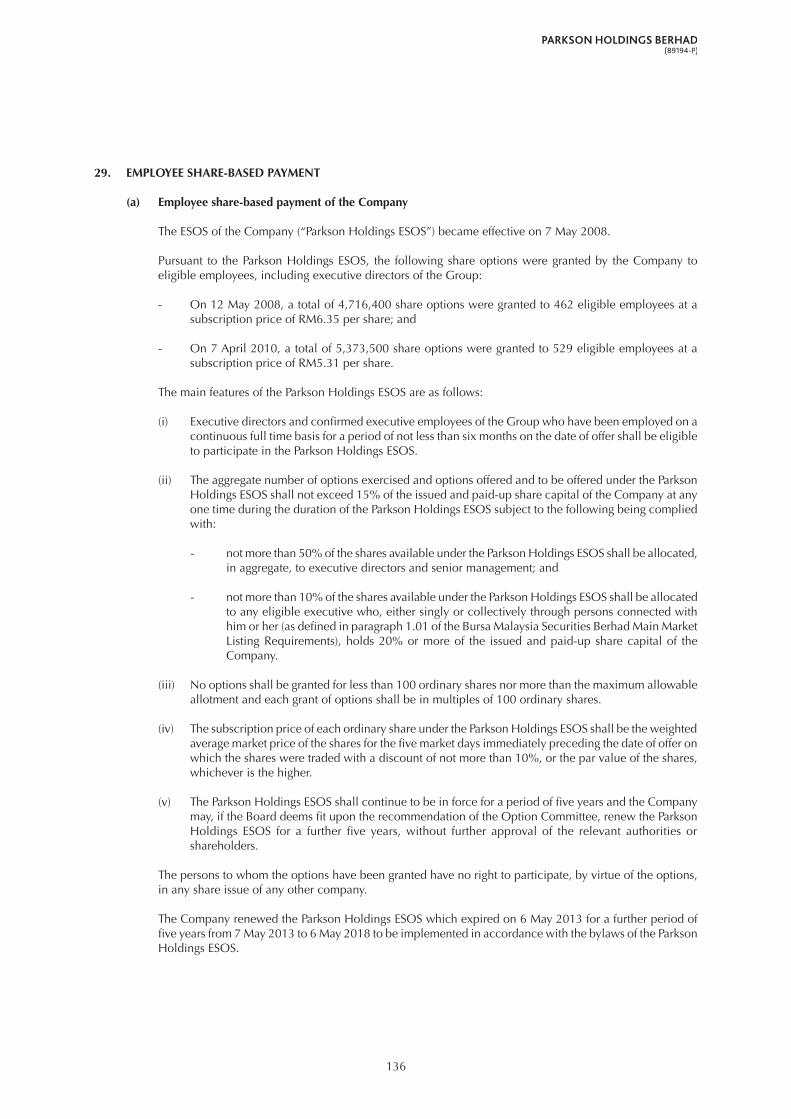
136
29. EMPLOYEE SHARE-BASED PAYMENT
(a) Employee share-based payment of the Company
The ESOS of the Company (“Parkson Holdings ESOS”) became effective on 7 May 2008.
Pursuant to the Parkson Holdings ESOS, the following share options were granted by the Company to eligible employees, including executive directors of the Group:
- On 12 May 2008, a total of 4,716,400 share options were granted to 462 eligible employees at a subscription price of RM6.35 per share; and
- On 7 April 2010, a total of 5,373,500 share options were granted to 529 eligible employees at a subscription price of RM5.31 per share.
The main features of the Parkson Holdings ESOS are as follows:
(i) Executive directors and confirmed executive employees of the Group who have been employed on a continuous full time basis for a period of not less than six months on the date of offer shall be eligible to participate in the Parkson Holdings ESOS.
(ii) The aggregate number of options exercised and options offered and to be offered under the Parkson Holdings ESOS shall not exceed 15% of the issued and paid-up share capital of the Company at any one time during the duration of the Parkson Holdings ESOS subject to the following being complied with:
- not more than 50% of the shares available under the Parkson Holdings ESOS shall be allocated, in aggregate, to executive directors and senior management; and
- not more than 10% of the shares available under the Parkson Holdings ESOS shall be allocated to any eligible executive who, either singly or collectively through persons connected with him or her (as defined in paragraph 1.01 of the Bursa Malaysia Securities Berhad Main Market Listing Requirements), holds 20% or more of the issued and paid-up share capital of the Company.
(iii) No options shall be granted for less than 100 ordinary shares nor more than the maximum allowable allotment and each grant of options shall be in multiples of 100 ordinary shares.
(iv) The subscription price of each ordinary share under the Parkson Holdings ESOS shall be the weighted average market price of the shares for the five market days immediately preceding the date of offer on which the shares were traded with a discount of not more than 10%, or the par value of the shares, whichever is the higher.
(v) The Parkson Holdings ESOS shall continue to be in force for a period of five years and the Company may, if the Board deems fit upon the recommendation of the Option Committee, renew the Parkson Holdings ESOS for a further five years, without further approval of the relevant authorities or shareholders.
The persons to whom the options have been granted have no right to participate, by virtue of the options, in any share issue of any other company.
The Company renewed the Parkson Holdings ESOS which expired on 6 May 2013 for a further period of five years from 7 May 2013 to 6 May 2018 to be implemented in accordance with the bylaws of the Parkson Holdings ESOS.
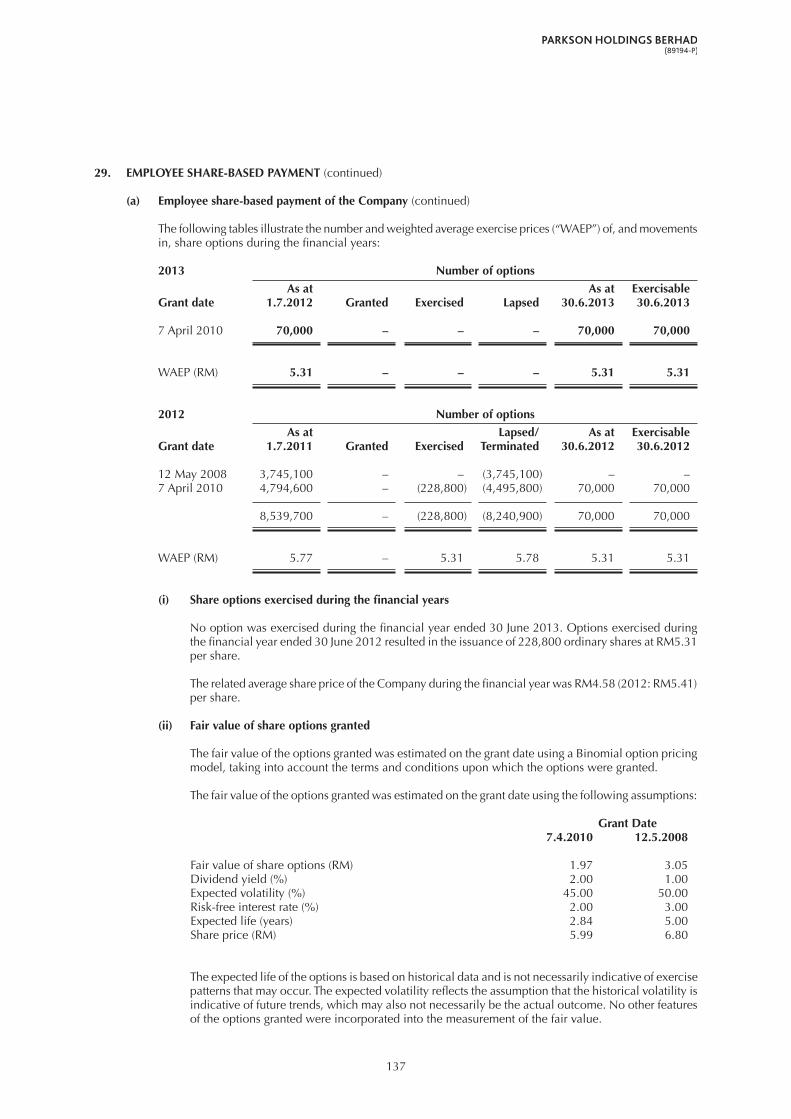
137
29. EMPLOYEE SHARE-BASED PAYMENT (continued)
(a) Employee share-based payment of the Company (continued)
The following tables illustrate the number and weighted average exercise prices (“WAEP”) of, and movements in, share options during the financial years:
2013 Number of options
As at As at ExercisableGrant date 1.7.2012 Granted Exercised Lapsed 30.6.2013 30.6.2013
7 April 2010 70,000 – – – 70,000 70,000
WAEP (RM) 5.31 – – – 5.31 5.31
2012 Number of options
As at Lapsed/ As at ExercisableGrant date 1.7.2011 Granted Exercised Terminated 30.6.2012 30.6.2012
12 May 2008 3,745,100 – – (3,745,100) – –7 April 2010 4,794,600 – (228,800) (4,495,800) 70,000 70,000 8,539,700 – (228,800) (8,240,900) 70,000 70,000
WAEP (RM) 5.77 – 5.31 5.78 5.31 5.31
(i) Share options exercised during the financial years
No option was exercised during the financial year ended 30 June 2013. Options exercised during the financial year ended 30 June 2012 resulted in the issuance of 228,800 ordinary shares at RM5.31 per share.
The related average share price of the Company during the financial year was RM4.58 (2012: RM5.41) per share.
(ii) Fair value of share options granted
The fair value of the options granted was estimated on the grant date using a Binomial option pricing model, taking into account the terms and conditions upon which the options were granted.
The fair value of the options granted was estimated on the grant date using the following assumptions:
Grant Date 7.4.2010 12.5.2008
Fair value of share options (RM) 1.97 3.05 Dividend yield (%) 2.00 1.00 Expected volatility (%) 45.00 50.00 Risk-free interest rate (%) 2.00 3.00 Expected life (years) 2.84 5.00 Share price (RM) 5.99 6.80
The expected life of the options is based on historical data and is not necessarily indicative of exercise patterns that may occur. The expected volatility reflects the assumption that the historical volatility is indicative of future trends, which may also not necessarily be the actual outcome. No other features of the options granted were incorporated into the measurement of the fair value.
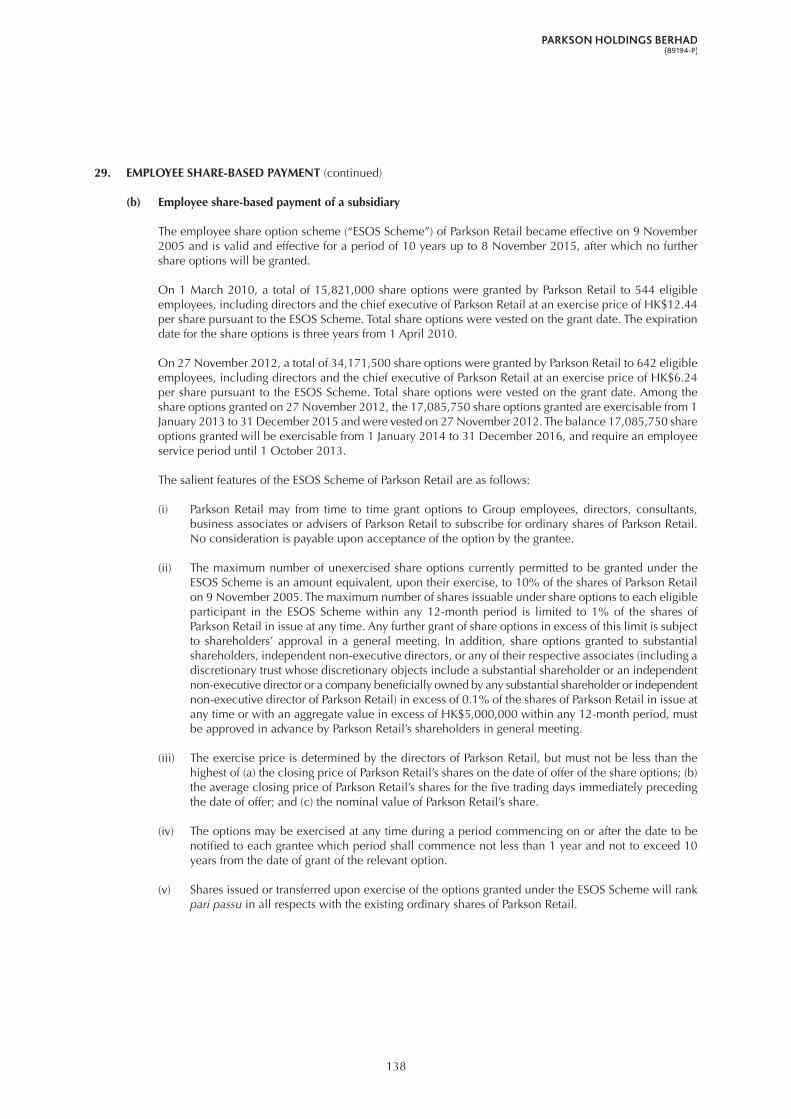
138
29. EMPLOYEE SHARE-BASED PAYMENT (continued)
(b) Employee share-based payment of a subsidiary
The employee share option scheme (“ESOS Scheme”) of Parkson Retail became effective on 9 November 2005 and is valid and effective for a period of 10 years up to 8 November 2015, after which no further share options will be granted.
On 1 March 2010, a total of 15,821,000 share options were granted by Parkson Retail to 544 eligible employees, including directors and the chief executive of Parkson Retail at an exercise price of HK$12.44 per share pursuant to the ESOS Scheme. Total share options were vested on the grant date. The expiration date for the share options is three years from 1 April 2010.
On 27 November 2012, a total of 34,171,500 share options were granted by Parkson Retail to 642 eligible employees, including directors and the chief executive of Parkson Retail at an exercise price of HK$6.24 per share pursuant to the ESOS Scheme. Total share options were vested on the grant date. Among the share options granted on 27 November 2012, the 17,085,750 share options granted are exercisable from 1 January 2013 to 31 December 2015 and were vested on 27 November 2012. The balance 17,085,750 share options granted will be exercisable from 1 January 2014 to 31 December 2016, and require an employee service period until 1 October 2013.
The salient features of the ESOS Scheme of Parkson Retail are as follows:
(i) Parkson Retail may from time to time grant options to Group employees, directors, consultants, business associates or advisers of Parkson Retail to subscribe for ordinary shares of Parkson Retail. No consideration is payable upon acceptance of the option by the grantee.
(ii) The maximum number of unexercised share options currently permitted to be granted under the ESOS Scheme is an amount equivalent, upon their exercise, to 10% of the shares of Parkson Retail on 9 November 2005. The maximum number of shares issuable under share options to each eligible participant in the ESOS Scheme within any 12-month period is limited to 1% of the shares of Parkson Retail in issue at any time. Any further grant of share options in excess of this limit is subject to shareholders’ approval in a general meeting. In addition, share options granted to substantial shareholders, independent non-executive directors, or any of their respective associates (including a discretionary trust whose discretionary objects include a substantial shareholder or an independent non-executive director or a company beneficially owned by any substantial shareholder or independent non-executive director of Parkson Retail) in excess of 0.1% of the shares of Parkson Retail in issue at any time or with an aggregate value in excess of HK$5,000,000 within any 12-month period, must be approved in advance by Parkson Retail’s shareholders in general meeting.
(iii) The exercise price is determined by the directors of Parkson Retail, but must not be less than the highest of (a) the closing price of Parkson Retail’s shares on the date of offer of the share options; (b) the average closing price of Parkson Retail’s shares for the five trading days immediately preceding the date of offer; and (c) the nominal value of Parkson Retail’s share.
(iv) The options may be exercised at any time during a period commencing on or after the date to be notified to each grantee which period shall commence not less than 1 year and not to exceed 10 years from the date of grant of the relevant option.
(v) Shares issued or transferred upon exercise of the options granted under the ESOS Scheme will rank paripassu in all respects with the existing ordinary shares of Parkson Retail.

139
29. EMPLOYEE SHARE-BASED PAYMENT (continued)
(b) Employee share-based payment of a subsidiary (continued)
The following tables illustrate the number and WAEP of, and movements in, share options during the financial years:
2013 Number of options
As at As at ExercisableGrant date 1.7.2012 Granted Exercised Lapsed 30.6.2013 30.6.2013
1 March 2010 14,413,000 – – (14,413,000) – –27 November 2012 – 34,171,500 (10,000) (156,500) 34,005,000 16,919,250
14,413,000 34,171,500 (10,000) (14,569,500) 34,005,000 16,919,250
WAEP (HK$) 12.44 6.24 6.24 12.37 6.24 6.24
2012 Number of options
As at As at ExercisableGrant date 1.7.2011 Granted Exercised Lapsed 30.6.2012 30.6.2012
1 March 2010 14,982,500 – – (569,500) 14,413,000 14,413,000
WAEP (HK$) 12.44 – – 12.44 12.44 12.44
(i) Share options exercised during the financial years
Options exercised during the financial year ended 30 June 2013 resulted in the issuance of 10,000 ordinary shares at HK$6.24 per share. No option was exercised during the financial year ended 30 June 2012.
The related average share price of Parkson Retail during the financial year was HK$5.40 (2012: HK$9.20) per share.
(ii) Fair value of share options granted
The fair value of the options granted was estimated on the grant date using a Binomial option pricing model, taking into account the terms and conditions upon which the options were granted.
The fair value of the options granted was estimated on the grant date using the following assumptions:
Grant Date 27.11.2012 1.3.2010
Fair value of share options (HK$) 1.45 3.00Dividend yield (%) 3.54 1.17Expected volatility (%) 39.01 - 45.40 52.13Risk-free interest rate (%) 0.181 - 0.234 0.95Expected life (years) 3.09 - 4.09 3.10Share price (HK$) 6.24 12.44
The expected life of the options is based on historical data and is not necessarily indicative of exercise patterns that may occur. The expected volatility reflects the assumption that the historical volatility is indicative of future trends, which may also not necessarily be the actual outcome. No other features of the options granted were incorporated into the measurement of the fair value.

140
30. LOANS AND BORROWINGS
Group Company 2013 2012 2013 2012 RM’000 RM’000 RM’000 RM’000
Short term loans and borrowingsSecured: Hire purchase liabilities (Note 31) 20 31 20 19 Unsecured: Bank overdrafts – 140 – –
Short term loans and borrowings 20 171 20 19
Long term loans and borrowingsSecured: Term loan facilities (i): Facility A loan – 780,491 – – Facility B loan and Facility C loan – 465,241 – – Bonds (ii) 1,579,600 – – – Hire purchase liabilities (Note 31) 69 90 69 90
Long term loans and borrowings 1,579,669 1,245,822 69 90
Total loans and borrowings 1,579,689 1,245,993 89 109
Total loans and borrowingsHire purchase liabilities (Note 31) 89 121 89 109 Other loans and borrowings: Bank overdrafts – 140 – – Term loan facilities (i) – 1,245,732 – – Bonds (ii) 1,579,600 – – –
1,579,689 1,245,993 89 109
Maturity of loans and borrowings (excluding hire purchase liabilities):Within one year – 140 – –More than one year and less than two years – 1,245,732 – –More than two years and less than five years 1,579,600 – – –
1,579,600 1,245,872 – –

141
30. LOANS AND BORROWINGS (continued)
The ranges of effective interest rates at the reporting date for loans and borrowings (other than hire purchase liabilities) were as follows:
Group 2013 2012 % %
Bank overdrafts – 8.6 Term loan facilities – 2.2Bonds 4.8 –
(i) On 10 November 2010, the Group entered into an agreement with a number of overseas banks to borrow a loan in order to (a) provide funding for its business expansion and other general corporate needs; and (b) redeem the notes in full. Pursuant to the loan agreement, the Group drew down the loan at a principal of US$250 million (“Facility A loan”) in two batches of US$70 million and US$180 million on 22 November 2010 and 23 December 2010, respectively. The loan bore interest at a floating rate of LIBOR (6 months) plus 2.15% per annum, payable semi-annually in arrears on 10 May and 10 November of each year, beginning on 10 May 2011. The principal of the term loan was repayable on 12 November 2013.
In order to hedge the Group’s exposure to the risks arising from the variability of interest rates and fluctuation of foreign exchange rates, the Group entered into interest rate swap and cross currency swap contracts (Note 39(c)(i)) on the respective drawdown dates. The purpose of the swap arrangement is to provide the Group with a Rmb equivalent fixed rate debt of Rmb1,665,268,000 and a fixed interest rate of 1.66% per annum.
On 29 November 2011, the Group entered into an amendment and restatement agreement with certain overseas investors (“lending banks”) to upsize the syndicated loan from the original sum of US$250 million to US$400 million in order to fund its growth strategy through acquisition of certain department stores in the PRC. Pursuant to the above loan agreement, the Group was able to draw down a loan principal of US$150 million through JPMorgan Chase Bank, N.A. Hong Kong in two batches of US$100 million (“Facility B loan”) and HK$390 million (“Facility C loan”, approximates US$50 million) on 29 November 2011, respectively. The loan bore interest at a floating rate, which was a combination of LIBOR/HIBOR (6 months), and a margin at 2.15% per year. The entire US$350 million and HK$390 million of the syndicated loan was initially due for full repayment on 12 November 2013.
Simultaneously, the Group entered into interest rate swap (Note 39(c)(ii)) agreements to hedge the risks arising from the variability of interest rate for the Facility B loan and the Facility C loan, respectively. The purpose of the swap agreements was to provide the Group with a US$100 million loan with a fixed rate of 2.98% per annum and a HK$390 million loan with a fixed rate of 2.91% per annum, respectively.
The Group has fully repaid Facility A loan, Facility B loan and Facility C loan during the financial year using the proceeds from the issuance of the Bonds, as mentioned in (ii) below.
(ii) On 3 May 2013, Parkson Retail issued the 4.5% bonds due 2018 (“Bonds”) with an aggregate principal amount of US$500 million, which are listed on The Stock Exchange of Hong Kong Limited.
The Bonds bear a fixed coupon at 4.5% per annum, payable semi-annually in arrears on 3 May and 3 November of each year and commencing on 3 November 2013. The maturity date of the Bonds is 3 May 2018 and they contain a negative pledge provision for Parkson Retail Group.
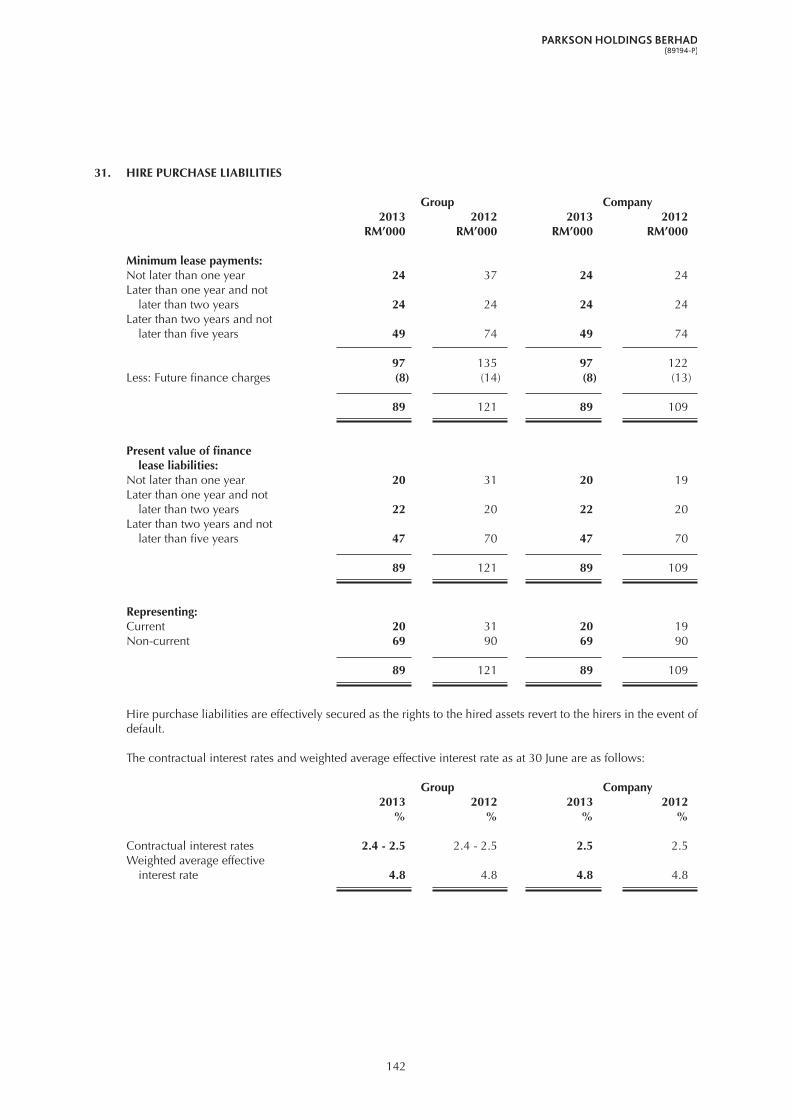
142
31. HIRE PURCHASE LIABILITIES
Group Company 2013 2012 2013 2012 RM’000 RM’000 RM’000 RM’000
Minimum lease payments:Not later than one year 24 37 24 24 Later than one year and not later than two years 24 24 24 24 Later than two years and not later than five years 49 74 49 74
97 135 97 122Less: Future finance charges (8) (14) (8) (13)
89 121 89 109
Present value of finance lease liabilities:Not later than one year 20 31 20 19 Later than one year and not later than two years 22 20 22 20 Later than two years and not later than five years 47 70 47 70 89 121 89 109
Representing:Current 20 31 20 19 Non-current 69 90 69 90 89 121 89 109
Hire purchase liabilities are effectively secured as the rights to the hired assets revert to the hirers in the event of default.
The contractual interest rates and weighted average effective interest rate as at 30 June are as follows:
Group Company 2013 2012 2013 2012 % % % %
Contractual interest rates 2.4 - 2.5 2.4 - 2.5 2.5 2.5 Weighted average effective interest rate 4.8 4.8 4.8 4.8
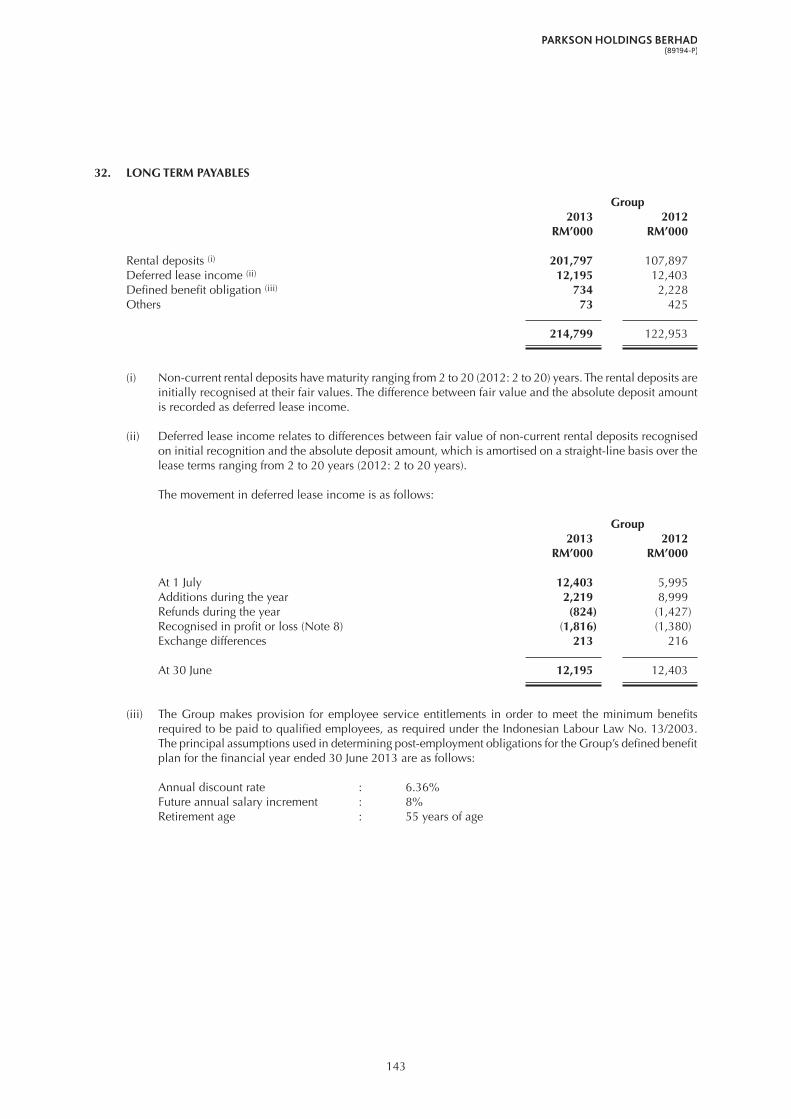
143
32. LONG TERM PAYABLES
Group 2013 2012 RM’000 RM’000
Rental deposits (i) 201,797 107,897 Deferred lease income (ii) 12,195 12,403 Defined benefit obligation (iii) 734 2,228 Others 73 425
214,799 122,953
(i) Non-current rental deposits have maturity ranging from 2 to 20 (2012: 2 to 20) years. The rental deposits are initially recognised at their fair values. The difference between fair value and the absolute deposit amount is recorded as deferred lease income.
(ii) Deferred lease income relates to differences between fair value of non-current rental deposits recognised on initial recognition and the absolute deposit amount, which is amortised on a straight-line basis over the lease terms ranging from 2 to 20 years (2012: 2 to 20 years).
The movement in deferred lease income is as follows:
Group 2013 2012 RM’000 RM’000
At 1 July 12,403 5,995 Additions during the year 2,219 8,999 Refunds during the year (824) (1,427)Recognised in profit or loss (Note 8) (1,816) (1,380)Exchange differences 213 216
At 30 June 12,195 12,403
(iii) The Group makes provision for employee service entitlements in order to meet the minimum benefits required to be paid to qualified employees, as required under the Indonesian Labour Law No. 13/2003. The principal assumptions used in determining post-employment obligations for the Group’s defined benefit plan for the financial year ended 30 June 2013 are as follows:
Annual discount rate : 6.36%Future annual salary increment : 8%Retirement age : 55 years of age
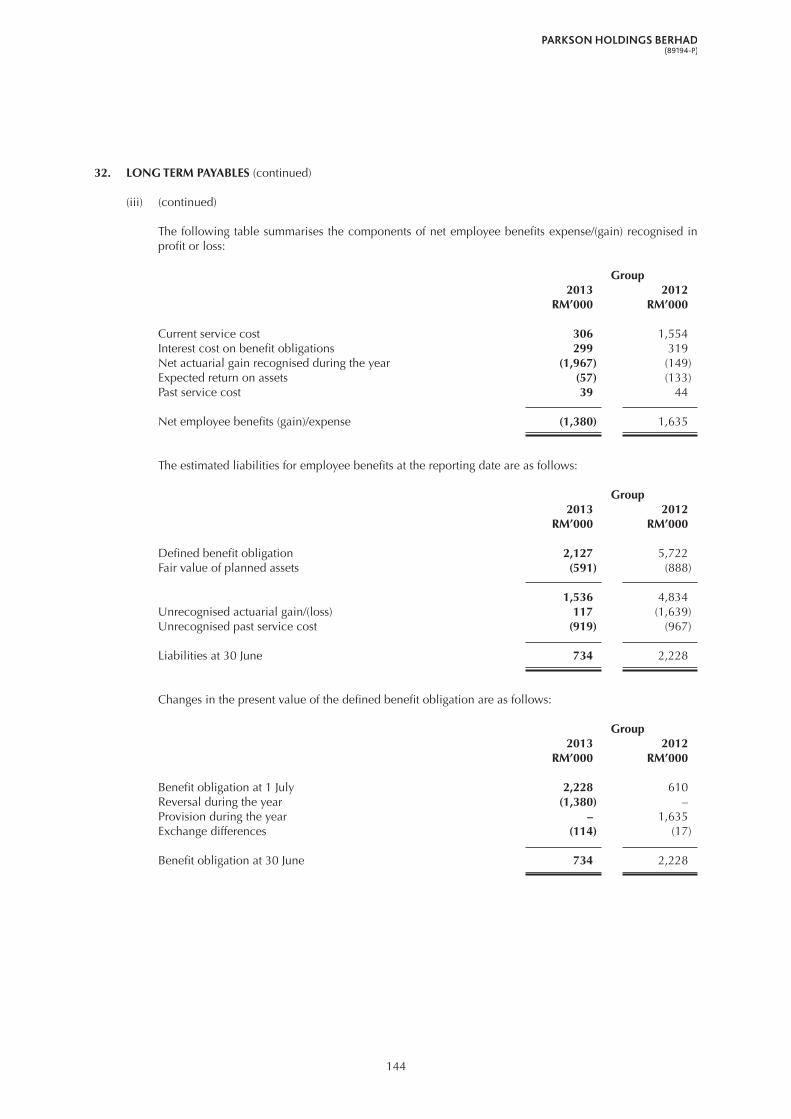
144
32. LONG TERM PAYABLES (continued)
(iii) (continued)
The following table summarises the components of net employee benefits expense/(gain) recognised in profit or loss:
Group 2013 2012 RM’000 RM’000
Current service cost 306 1,554 Interest cost on benefit obligations 299 319 Net actuarial gain recognised during the year (1,967) (149)Expected return on assets (57) (133)Past service cost 39 44 Net employee benefits (gain)/expense (1,380) 1,635
The estimated liabilities for employee benefits at the reporting date are as follows:
Group 2013 2012 RM’000 RM’000
Defined benefit obligation 2,127 5,722 Fair value of planned assets (591) (888)
1,536 4,834 Unrecognised actuarial gain/(loss) 117 (1,639)Unrecognised past service cost (919) (967)
Liabilities at 30 June 734 2,228
Changes in the present value of the defined benefit obligation are as follows:
Group 2013 2012 RM’000 RM’000
Benefit obligation at 1 July 2,228 610Reversal during the year (1,380) –Provision during the year – 1,635 Exchange differences (114) (17)
Benefit obligation at 30 June 734 2,228

145
33. TRADE AND OTHER PAYABLES AND OTHER LIABILITIES
Group Company 2013 2012 2013 2012 RM’000 RM’000 RM’000 RM’000
CurrentTrade and other payables: Trade payables (i) 1,179,120 1,134,673 – – Other payables (ii) 105,950 128,998 317 385 Amount due to a related party (iii) – 76 – 76 Deposits 74,956 92,855 – – Accruals 124,966 109,512 1,163 1,109
Total trade and other payables 1,484,992 1,466,114 1,480 1,570
Other liabilities: Deferred revenue from gift cards/vouchers sold 668,148 504,185 – – Deferred revenue from customer loyalty award (iv) 57,224 47,258 – –
725,372 551,443 – –
2,210,364 2,017,557 1,480 1,570
Total trade and other payables (as above) 1,484,992 1,466,114 1,480 1,570 Add:Long term payables 201,797 107,897 – –Loans and borrowings (Note 30) 1,579,689 1,245,993 89 109
Total financial liabilities carried at amortised cost 3,266,478 2,820,004 1,569 1,679
(i) Credit terms of trade payables granted to the Group vary from 30 to 90 days (2012: 30 to 90 days).
(ii) These amounts are non-interest bearing. Other payables are normally settled on average terms of 30 to 90 days (2012: average terms of 30 to 90 days).
(iii) The amount due to a related party, Amsteel Mills Marketing Sdn Bhd in the previous financial year was unsecured, interest free and repayable on demand.
The relationship of the related party with the Group and the Company are further disclosed in Note 34.

146
33. TRADE AND OTHER PAYABLES AND OTHER LIABILITIES (continued)
(iv) A reconciliation of the deferred revenue from customer loyalty award is as follows:
Group 2013 2012 RM’000 RM’000
At 1 July 47,258 36,619 Additions during the year 93,136 90,879 Recognised as revenue (67,923) (67,199)Lapsed amounts reversed (16,394) (15,053)Exchange differences 1,147 2,012 At 30 June 57,224 47,258
The deferred revenue from customer loyalty award is estimated based on the amount of bonus points outstanding at the reporting date that are expected to be redeemed before expiry.
Other information on financial risks of trade and other payables are disclosed in Note 39.
34. SIGNIFICANT RELATED PARTY DISCLOSURES
Related parties Relationship
Bonuskad Loyalty Sdn Bhd A company in which a Director and certain substantial shareholders of the Company have interestsPosim Marketing Sdn Bhd A company in which a Director and certain substantial shareholders of the Company have interests Posim EMS Sdn Bhd A company in which a Director and certain substantial shareholders of the Company have interestsLion Trading & Marketing Sdn Bhd A company in which a Director and certain substantial shareholders of the Company have interestsSecom (Malaysia) Sdn Bhd A company in which a Director and certain substantial shareholders of the Company have interestsWatchMart (M) Sdn Bhd A company in which a close member of a director of a subsidiary is a shareholderPT Mitra Samaya A company in which the close members of a director of a subsidiary
are shareholders PT Monica Hijaulestari A company in which the close members of a director of a subsidiary are shareholders PT Tozy Bintang Sentosa A subsidiary of PT Mitra Samaya 1st Avenue Mall Sdn Bhd A company in which a Director of the Company and a director of a subsidiary have interests. It has ceased to be a related party of the
Group since April 2012Dimensi Andaman Sdn Bhd A company in which a Director of the Company has interestTotal Triumph Investments Limited A company in which a Director and certain substantial shareholders of the Company have interestsAmsteel Mills Marketing Sdn Bhd A subsidiary of Amsteel Mills Sdn Bhd, a substantial shareholder of the CompanyLion Insurance Company Limited A company in which a Director and certain substantial shareholders of the Company have interests

147
34. SIGNIFICANT RELATED PARTY DISCLOSURES (continued)
(a) The significant related party transactions are as follows:
Group 2013 2012 RM’000 RM’000
Purchases of goods and services from:- Bonuskad Loyalty Sdn Bhd 11,415 10,281 - Posim Marketing Sdn Bhd 941 955 - Posim EMS Sdn Bhd 822 964- Lion Trading & Marketing Sdn Bhd 381 1,051 - Secom (Malaysia) Sdn Bhd 665 1,107 - WatchMart (M) Sdn Bhd 590 414 - PT Mitra Samaya – 407 - PT Monica Hijaulestari 9,767 8,377
Rental of office and warehouse space from:- PT Tozy Bintang Sentosa 747 1,027
Rental of retail space from:- 1st Avenue Mall Sdn Bhd – 1,738
Purchase of land from:- Dimensi Andaman Sdn Bhd (Note 36(d)) 93,000 –
Company 2013 2012 RM’000 RM’000
Subsidiary: Dividend income 180,000 150,000
Related party - Total Triumph Investments Limited: Finance income (Note 7) 898 1,173
The Directors of the Company are of the opinion that the above transactions have been entered into in the normal course of business and have been established on terms that are no more favourable to the related parties than those arranged with independent third parties.
Information regarding outstanding balances arising from related party transactions as at 30 June 2013 are disclosed in Note 21, Note 25 and Note 33.

148
34. SIGNIFICANT RELATED PARTY DISCLOSURES (continued)
(b) Compensation of key management personnel
The remuneration of a Director and other members of key management during the financial year were as follows:
Group Company 2013 2012 2013 2012 RM’000 RM’000 RM’000 RM’000
Short-term employee benefits 5,321 4,921 230 230 Post-employment benefits - Defined contribution plan 410 374 14 14 Employee share-based payments 1,153 – – –
6,884 5,295 244 244
The key management personnel of the Group have been granted the following number of options under the ESOS of the Company:
Group 2013 2012 ‘000 ‘000
At 1 July – 210Exercised – (42)Terminated (i) – (168)
At 30 June – –
(i) The unexercised share options granted to the key management personnel under the ESOS of the Company were terminated on 1 June 2012.
The share options were granted on the same terms and conditions as those offered to other employees of the Group.
(c) Others
Pursuant to Parkson Retail’s listing on The Stock Exchange of Hong Kong Limited in the prior years, the Company granted Parkson Retail an option/right of first refusal to acquire certain of its Parkson branded department stores located in the PRC.
Parkson Retail can exercise the option without time limit and the purchase consideration shall be negotiated on an arm’s length basis between the Company and Parkson Retail at the time of acquisition.
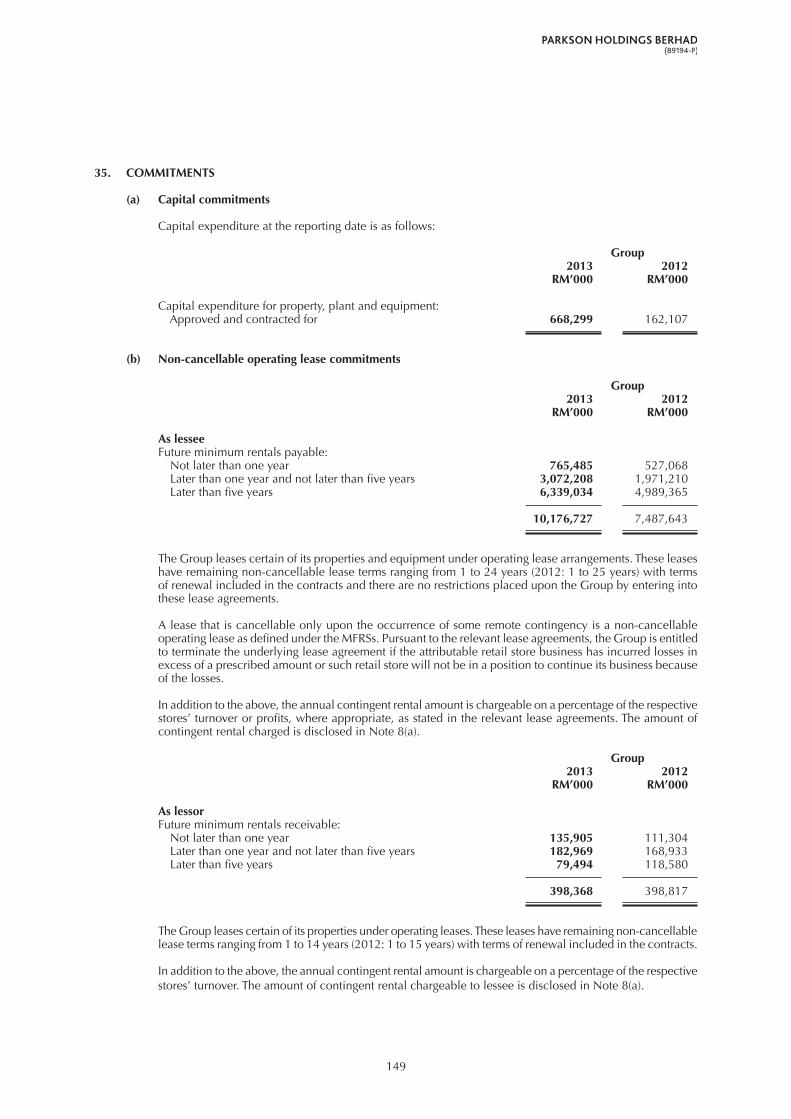
149
35. COMMITMENTS
(a) Capital commitments
Capital expenditure at the reporting date is as follows:
Group 2013 2012 RM’000 RM’000
Capital expenditure for property, plant and equipment: Approved and contracted for 668,299 162,107
(b) Non-cancellable operating lease commitments
Group 2013 2012 RM’000 RM’000
As lesseeFuture minimum rentals payable: Not later than one year 765,485 527,068 Later than one year and not later than five years 3,072,208 1,971,210 Later than five years 6,339,034 4,989,365
10,176,727 7,487,643
The Group leases certain of its properties and equipment under operating lease arrangements. These leases have remaining non-cancellable lease terms ranging from 1 to 24 years (2012: 1 to 25 years) with terms of renewal included in the contracts and there are no restrictions placed upon the Group by entering into these lease agreements.
A lease that is cancellable only upon the occurrence of some remote contingency is a non-cancellable operating lease as defined under the MFRSs. Pursuant to the relevant lease agreements, the Group is entitled to terminate the underlying lease agreement if the attributable retail store business has incurred losses in excess of a prescribed amount or such retail store will not be in a position to continue its business because of the losses.
In addition to the above, the annual contingent rental amount is chargeable on a percentage of the respective stores’ turnover or profits, where appropriate, as stated in the relevant lease agreements. The amount of contingent rental charged is disclosed in Note 8(a).
Group 2013 2012 RM’000 RM’000
As lessorFuture minimum rentals receivable: Not later than one year 135,905 111,304 Later than one year and not later than five years 182,969 168,933 Later than five years 79,494 118,580
398,368 398,817
The Group leases certain of its properties under operating leases. These leases have remaining non-cancellable lease terms ranging from 1 to 14 years (2012: 1 to 15 years) with terms of renewal included in the contracts.
In addition to the above, the annual contingent rental amount is chargeable on a percentage of the respective stores’ turnover. The amount of contingent rental chargeable to lessee is disclosed in Note 8(a).

150
36. SIGNIFICANT EVENTS
(a) On 28 November 2011, Tianjin Parkson, a wholly-owned subsidiary of Parkson Retail Development Co Ltd (“Parkson Retail Development”) which in turn is a wholly-owned subsidiary of Parkson Retail, entered into a sale and purchase agreement with Tianjin Binhai Century Plaza Co Ltd for the acquisition by Tianjin Parkson of the land use right and the building ownership right of a shopping complex located in the Tianjin City, the PRC (“Tianjin Shopping Mall”) for a total acquisition price of Rmb704.6 million (equivalent to approximately RM352.2 million).
The acquisition of the Tianjin Shopping Mall was completed during the financial year upon fulfilment of all conditions precedent.
(b) On 31 July 2012, Parkson Asia completed the acquisition of a total of 60,625,000 ordinary shares in Odel PLC (“Odel”) (“Shares”) representing 41.82% of the then issued and paid-up share capital of Odel at LKR23.50 per Share from Otara Del Gunewardene, Ruchi Hubert Gunewardene and Ajit Damon Gunewardene (collectively, the “Gunewardene Family”) for a total consideration of approximately LKR1,424.7 million (equivalent to approximately RM33.9 million) (“Acquisition”). Odel is a company listed on the Colombo Stock Exchange in Sri Lanka.
To facilitate the completion of the Acquisition, Parkson Asia had also undertaken open market purchases of an additional 525,896 Shares representing 0.37% of the then issued and paid-up share capital of Odel at a weighted average price of LKR23.46 per Share for a consideration of approximately LKR12.3 million (equivalent to approximately RM0.3 million). As a result, Parkson Asia owned 42.19% stake in Odel.
Parkson Asia was required under the Sri Lankan Company Take-Overs and Mergers Code 1995 (As amended in 2003) to make a mandatory offer (“Offer”) for all of the remaining Shares at LKR23.50 per Share, being the highest price at which Parkson Asia had acquired the Shares within the twelve-month period prior to the date of completion of the Acquisition. Parkson Asia received an irrevocable undertaking from the Gunewardene Family not to accept the Offer in respect of their remaining 60,625,000 Shares held in Odel, representing 41.82% of the then issued and paid-up share capital of Odel.
As at 11 September 2012, being the closing date of the Offer, 3,424,536 Shares representing 2.36% of the then issued and paid-up share capital of Odel had been accepted under the Offer (“Completion of the Offer”). Following the Completion of the Offer, Parkson Asia owned a total of 64,575,432 Shares representing 44.55% of the then issued and paid-up share capital of Odel.
Subsequent to the Completion of the Offer, Odel had during the financial year undertaken a one-for-one rights issue of Shares at LKR20.00 per Share (“Odel Rights Issue”), where Parkson Asia had subscribed for its full entitlement of 64,575,432 new Shares for a sum of approximately LKR1,291.5 million (equivalent to approximately RM31.2 million). Consequent upon the Odel Rights Issue, Parkson Asia owns a total of 129,150,864 Shares representing 47.46% of the issued and paid-up share capital of Odel. The funds raised under the Odel Rights Issue of LKR2,543.6 million (equivalent to approximately RM61.6 million) will be utilised to fund the development and expansion of Odel in Sri Lanka.

151
36. SIGNIFICANT EVENTS (continued)
(c) On 27 August 2012, East Crest International Limited (“East Crest”), a wholly-owned subsidiary of the Company, entered into a conditional sale and purchase agreement with Grand Parkson Retail Group Limited (“Grand Parkson”), a wholly-owned subsidiary of Parkson Retail, for the disposal by East Crest of its entire 100% equity interest in Victor Crest Limited (“Victor Crest”) to Grand Parkson for a total cash consideration of Rmb420,000,001 (equivalent to approximately RM205.8 million) (“Disposal”).
Victor Crest is the sole legal and beneficial owner of the 100% equity interest in Wide Crest Limited (“Wide Crest”), which in turn is the sole legal and beneficial owner of the 100% equity interest in Parkson Venture Pte Ltd (“Parkson Venture”), Sea Coral Limited (“Sea Coral”) and Wide Field International Limited (“Wide Field”).
Parkson Venture is the legal and beneficial owner of the 95.91% equity interest in Qingdao No. 1 Parkson Co Ltd (“Qingdao Parkson”). Sea Coral is the sole legal and beneficial owner of the 100% equity interest in Dalian Parkson Retail Development Co Ltd (“Dalian Parkson”). Wide Field is the sole legal and beneficial owner of the 100% equity interest in Shenyang Parkson Shopping Plaza Co Ltd (“Shenyang Parkson”).
The Disposal was completed during the financial year whereupon, Victor Crest and its subsidiaries namely Wide Crest, Parkson Venture, Sea Coral, Wide Field, Qingdao Parkson, Dalian Parkson and Shenyang Parkson became subsidiaries of Parkson Retail and they remain subsidiaries of the Company.
(d) On 3 September 2012, Megan Mastika Sdn Bhd (“Megan Mastika”), a wholly-owned subsidiary of the Company, entered into a conditional sale and purchase agreement (“Megan Mastika SPA”) with Dimensi Andaman Sdn Bhd (“Dimensi Andaman”), a company in which a Director of the Company has interest, for the acquisition of 15 acres out of the 23.22 acres undivided interest of land located in Melaka (“Melaka Land”) by Megan Mastika from Dimensi Andaman for a cash consideration of RM98 million (“Purchase Consideration”).
Megan Mastika had subsequently on 21 November 2012 entered into a supplemental agreement with Dimensi Andaman to vary certain terms of the Megan Mastika SPA. Pursuant to the supplemental agreement, Dimensi Andaman had among others, agreed to grant a discount of RM5 million on the Purchase Consideration, resulting in a discounted Purchase Consideration of RM93 million.
The acquisition of the Melaka Land was completed on 6 December 2012 upon fulfilment of all conditions precedent.
(e) On 20 December 2012, Beijing Huadesheng Property Management Co Ltd (“Beijing Huadesheng”), a wholly-owned subsidiary of Parkson Retail Development, entered into a cooperative agreement with Shanghai Industrial Qingdao Development Co Ltd (“Vendor”) for the acquisition by Beijing Huadesheng of the land use right and the building ownership right of a shopping complex to be constructed by the Vendor on a vacant land located in the Qingdao City, the PRC (“Qingdao Shopping Mall”), for a maximum consideration of Rmb1,570 million (equivalent to approximately RM812 million).
As at 30 June 2013, the acquisition of the Qingdao Shopping Mall has not been completed pending fulfilment of certain conditions precedent.

152
37. SUBSEqUENT EVENTS
On 13 September 2013, True Excel Investments (Cambodia) Co Ltd (“True Excel”), a wholly-owned subsidiary of the Company, entered into the following agreements on the proposed lease and acquisition of a 7-storey shopping mall together with the lower ground and accessory parcel levels in Phnom Penh, Cambodia (“Proposed Parkson Mall”):
(a) a conditional option agreement with PP.SW Development Co. Ltd (“PPSW”) wherein True Excel was granted the option to enter into a lease agreement for the lease of the lower ground floor and first floor of the Proposed Parkson Mall for a term of 50 years with automatic renewal for another 50 years, for an indicative refundable deposit of approximately US$42 million (equivalent to approximately RM138.6 million); and
(b) a conditional sale and purchase agreement with PPSW for the purchase of the second to seventh floors of the Proposed Parkson Mall for an indicative consideration of approximately US$75.09 million (equivalent to approximately RM247.8 million).
True Excel had also on 13 September 2013 entered into the following two conditional heads of terms with Parkson (Cambodia) Co Ltd (“Parkson Cambodia”), a wholly-owned subsidiary of Parkson Asia:
(a) to sub-lease to Parkson Cambodia or its nominee company, the anchor tenant space at the first floor of the Proposed Parkson Mall measuring 3,223 m2 at lease rental rate of US$10 per m2 per month or US$32,230 per month; and
(b) to lease to Parkson Cambodia or its nominee company, the anchor tenant space at the second floor and third floor of the Proposed Parkson Mall measuring 7,783 m2 at lease rental rate of US$10 per m2 per month or US$77,830 per month.
38. FAIR VALUE OF FINANCIAL INSTRUMENTS
The fair value of a financial instrument is the amount at which the instrument could be exchanged or settled between knowledgeable and willing parties in an arm’s length transaction, other than in forced liquidation or sale.
(a) Fair value of financial instruments that are carried at fair value
Fair value hierarchy
The Group classifies fair value measurement using a fair value hierarchy that reflects the significance of the inputs used in making the measurements. The fair value hierarchy has the following levels:
(i) Level 1 – Quoted prices (unadjusted) in active markets for identical assets or liabilities;
(ii) Level 2 – Inputs other than quoted prices included within Level 1 that are observable for the assets or liabilities either directly (i.e., as prices) or indirectly (i.e., derived from prices); and
(iii) Level 3 – Inputs for the assets or liabilities that are not based on observable market data (unobservable inputs).
There have been no transfer between Levels 1, 2 and 3 during the financial year.

153
38. FAIR VALUE OF FINANCIAL INSTRUMENTS (continued)
(a) Fair value of financial instruments that are carried at fair value (continued)
The following table shows an analysis of financial instruments carried at fair value by level of fair value hierarchy:
Group 2013 2012 RM’000 RM’000
Significant unobservable inputs (Level 3)
Derivative 52 52
(b) Fair value of financial instruments by classes that are not carried at fair value and whose carrying amounts are not reasonable approximation of fair value
The fair values of the Group’s and of the Company’s financial assets and liabilities approximate to their carrying amounts except for the following:
Group Company Carrying Carrying amount Fair value amount Fair value RM’000 RM’000 RM’000 RM’000
Financial assets
At 30 June 2013Unquoted shares 30,233 ^a – –Amounts due from subsidiaries – – 4,095,847 ^b
At 30 June 2012Unquoted shares 30,233 ^a – –Amounts due from subsidiaries – – 7,893,774 ^b
^a It is not practical to estimate the fair value of the non-current unquoted shares because of the lack of quoted market prices and the inability to estimate fair value without incurring excessive costs.
^b It is not practical to determine the fair values of the amounts due from subsidiaries in view of the uncertainty as to the timing of future cash flows.
The following methods and assumptions are used to estimate the fair values of the following classes of financial instruments:
(i) Financial instruments classified as current
The fair values of the Group’s and of the Company’s financial instruments, other than amounts due from/to subsidiaries/related parties, which are classified as current approximate to their carrying amounts due to the relatively short term maturity of these financial instruments.
(ii) Long term loans and borrowings
The fair value of long term loans and borrowings is estimated by discounting the expected cash flows using the current interest rates for the liabilities with similar risk profiles.
154
39. FINANCIAL RISK MANAGEMENT OBJECTIVES AND POLICIES
The Group’s principal financial liabilities, other than derivatives, comprise loans and borrowings, trade payables and other payables. The main purpose of these financial liabilities is to fund the Group’s operations. The Group has various financial assets such as deposits and other receivables, trade receivables, cash and bank balances which arise directly from its operations.
The Group had previously entered into held-to-maturity investments and derivative transactions, primarily interest rate swaps and cross currency swaps. The purpose was to manage the interest rate and currency risks arising from the Group’s operations and its sources of funds.
It is the Group’s policy that no trading in derivatives shall be undertaken other than the interest rate swaps and cross currency swaps as mentioned above. However, as at the reporting date, the Group has no outstanding contract on interest rate swaps and cross currency swaps.
The main risks arising from the Group’s financial instruments are interest rate risk, foreign currency risk, liquidity risk and credit risk. The Group reviews and agrees on policies for managing each of these risks.
The following sections provide details regarding the Group’s exposure to the above-mentioned financial risks and the objectives, policies and procedures for the management of these risks:
(a) Interest rate risk
Interest rate risk is the risk that the fair value or future cash flows of the Group’s financial instruments will fluctuate because of changes in the market interest rates.
The Group’s policy is to manage its interest rate risk using a mix of floating and fixed rate debts or structured fixed interest rate borrowings through interest rates swaps.
At the reporting date, nearly 100% (2012: 100% after taking into consideration the effect of an interest rate swap) of the Group’s borrowings are at fixed rates of interest. The effects and details of the interest rates swaps are further disclosed in (c) below.
Sensitivity analysis of interest rate risk
A reasonably possible change of 100 basis points in interest rates, with all other variables held constant, would have no material impact on the Group’s profit or loss. The assumed movement in basis points for interest rate sensitivity analysis is based on the currently observable market environment.
(b) Foreign currency risk
Foreign currency risk is the risk that the fair value or future cash flows of a financial instrument will fluctuate because of changes in foreign currency rates.
The Group is exposed to foreign currency risk as a result of the foreign currency transactions entered into by the Group in currencies other than its functional currency. As these transactions are mainly denominated in United States Dollar (“US$”), Hong Kong Dollar (“HK$”), Singapore Dollar (“SGD”) and Sri Lanka Rupee (“LKR”), the Group’s foreign currency risk is primarily due to exposure to the US$, HK$, SGD and LKR. Foreign currency exposures in transactional currencies other than functional currencies of the operating entities are kept to an acceptable level.
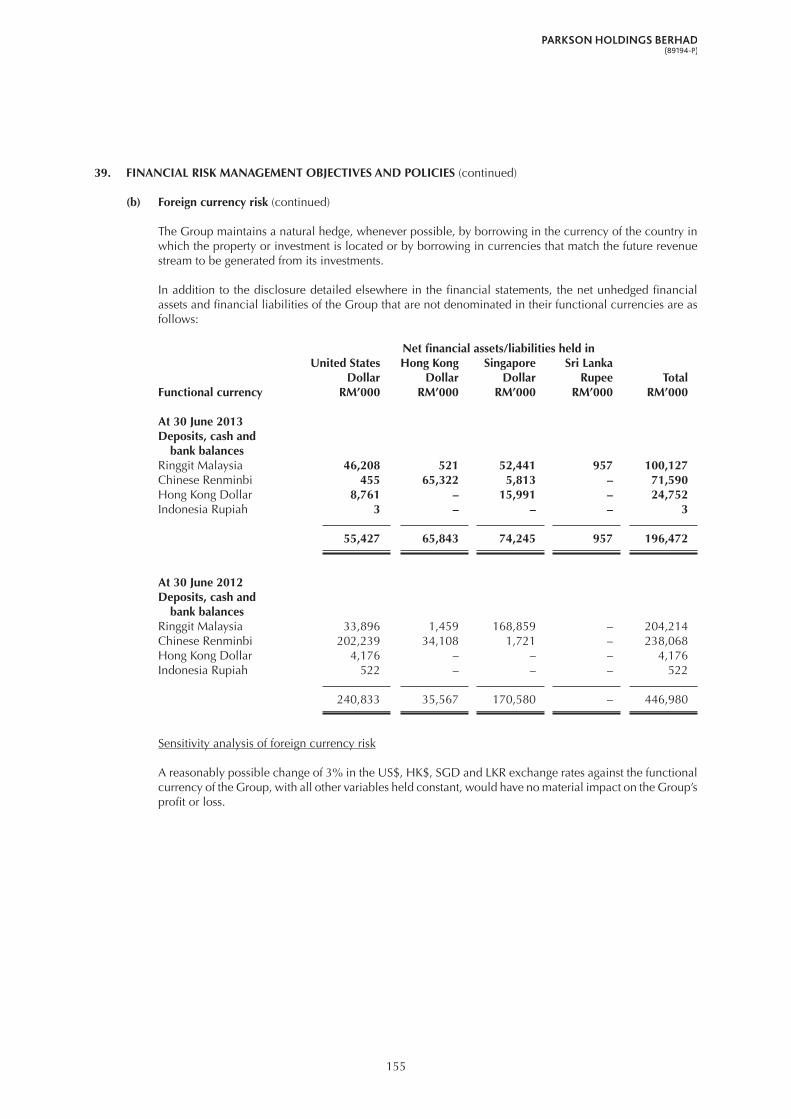
155
39. FINANCIAL RISK MANAGEMENT OBJECTIVES AND POLICIES (continued)
(b) Foreign currency risk (continued)
The Group maintains a natural hedge, whenever possible, by borrowing in the currency of the country in which the property or investment is located or by borrowing in currencies that match the future revenue stream to be generated from its investments.
In addition to the disclosure detailed elsewhere in the financial statements, the net unhedged financial assets and financial liabilities of the Group that are not denominated in their functional currencies are as follows:
Net financial assets/liabilities held in United States Hong Kong Singapore Sri Lanka Dollar Dollar Dollar Rupee TotalFunctional currency RM’000 RM’000 RM’000 RM’000 RM’000
At 30 June 2013Deposits, cash and bank balancesRinggit Malaysia 46,208 521 52,441 957 100,127 Chinese Renminbi 455 65,322 5,813 – 71,590 Hong Kong Dollar 8,761 – 15,991 – 24,752 Indonesia Rupiah 3 – – – 3 55,427 65,843 74,245 957 196,472
At 30 June 2012Deposits, cash and bank balancesRinggit Malaysia 33,896 1,459 168,859 – 204,214 Chinese Renminbi 202,239 34,108 1,721 – 238,068 Hong Kong Dollar 4,176 – – – 4,176 Indonesia Rupiah 522 – – – 522 240,833 35,567 170,580 – 446,980
Sensitivity analysis of foreign currency risk
A reasonably possible change of 3% in the US$, HK$, SGD and LKR exchange rates against the functional currency of the Group, with all other variables held constant, would have no material impact on the Group’s profit or loss.

156
39. FINANCIAL RISK MANAGEMENT OBJECTIVES AND POLICIES (continued)
(c) Hedging activities
Cash flow hedges were used to mitigate the Group’s exposure to changes in cash flows attributable to interest rate fluctuations associated with interest and principal payments on the Group’s variable rate interest-bearing loans (Note 30). There is no outstanding contract to hedge changes in cash flows as at the reporting date.
All derivative financial instruments were recorded at fair value on the statements of financial position. Effective changes in the fair values of these cash flow hedging instruments were recognised in the hedging reserve in the statements of financial position and were then reclassified from equity to profit or loss in the same period that the forecasted cash flows of the hedged items impact the profit. The ineffective portions of changes in fair values of derivatives that do not qualify for hedge accounting were recognised in profit or loss.
The hedging instruments that the Group had entered into in the previous financial year were as follows:
(i) Facility A loan
On 10 November 2010, the Group entered into a series of cross currency and interest rate swap contracts with the contracting parties to convert the Group’s US$250 million Facility A loan (Note 30(i)) which were drawn down in several tranches to a Rmb equivalent fixed rate debt of Rmb1,665 million with a fixed interest rate of 1.66% per annum.
(ii) Facility B loan and Facility C loan
On 29 November 2011, the Group entered into a series of interest rate swap contracts with the contracting parties to convert the Group’s US$100 million Facility B loan (Note 30(i)) to a US$ fixed rate loan at 2.98% per annum and the Group’s HK$390 million Facility C loan (Note 30(i)) to a HK$ fixed rate loan at 2.91% per annum, respectively.
As at 30 June 2012, these outstanding hedges were in a liability position with a total fair value of RM14,798,000 which was recorded as derivative financial instruments designated as hedging instruments in the statement of financial position. These facility loans were fully repaid by the Group during the financial year.
The Group was previously exposed to counterparty credit risk on its derivative financial instruments and only entered into derivative transactions with well-established financial institutions. Therefore, the counterparty credit risk with respect to derivative financial instruments was minimal.
(d) Liquidity risk
Liquidity risk is the risk that the Group will encounter difficulty in meeting financial obligations due to shortage of funds. The Group’s exposure to liquidity risk arises primarily from mismatches of the maturities of financial assets and liabilities. The Group’s objective is to maintain a balance between continuity of funding and flexibility through the use of stand-by credit facilities. The Group manages its operating cash flows and the availability of funding so as to ensure that refinancing, repayment and funding needs are met. As part of its overall liquidity management, the Group maintains sufficient levels of cash and bank balances to meet its working capital requirements.
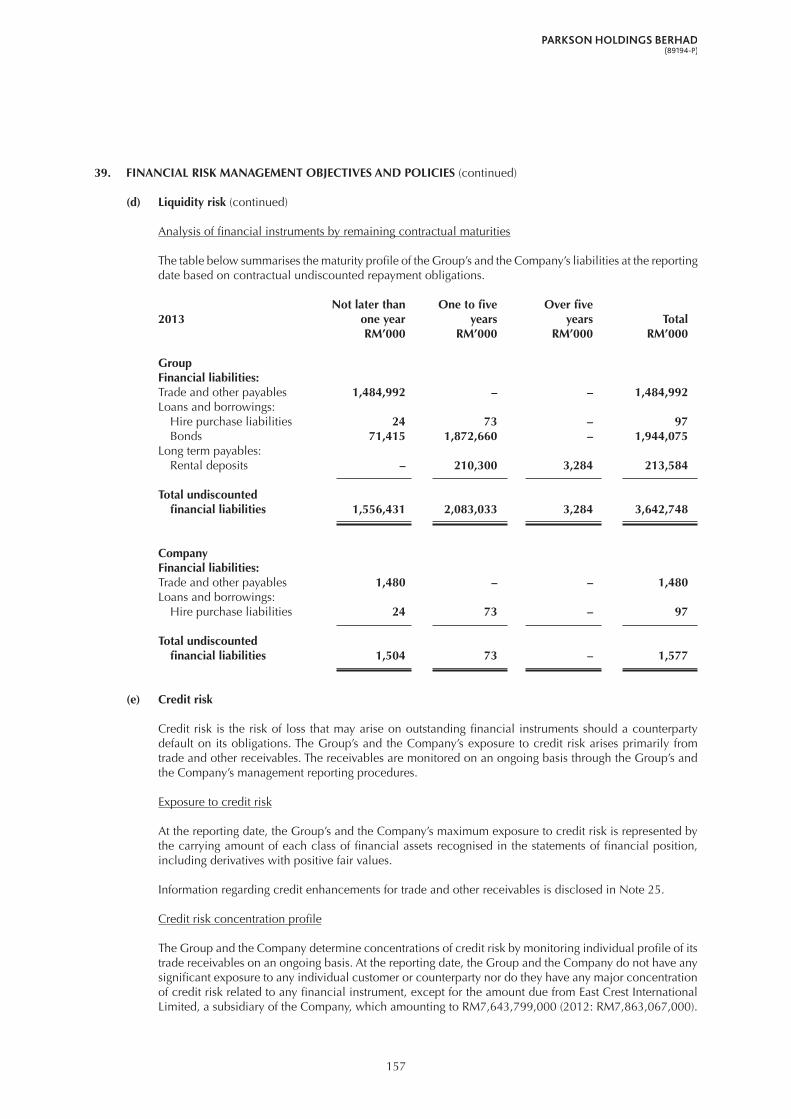
157
39. FINANCIAL RISK MANAGEMENT OBJECTIVES AND POLICIES (continued)
(d) Liquidity risk (continued)
Analysis of financial instruments by remaining contractual maturities
The table below summarises the maturity profile of the Group’s and the Company’s liabilities at the reporting date based on contractual undiscounted repayment obligations.
Not later than One to five Over five2013 one year years years Total RM’000 RM’000 RM’000 RM’000
GroupFinancial liabilities:Trade and other payables 1,484,992 – – 1,484,992 Loans and borrowings: Hire purchase liabilities 24 73 – 97 Bonds 71,415 1,872,660 – 1,944,075Long term payables: Rental deposits – 210,300 3,284 213,584
Total undiscounted financial liabilities 1,556,431 2,083,033 3,284 3,642,748
CompanyFinancial liabilities:Trade and other payables 1,480 – – 1,480Loans and borrowings: Hire purchase liabilities 24 73 – 97
Total undiscounted financial liabilities 1,504 73 – 1,577
(e) Credit risk
Credit risk is the risk of loss that may arise on outstanding financial instruments should a counterparty default on its obligations. The Group’s and the Company’s exposure to credit risk arises primarily from trade and other receivables. The receivables are monitored on an ongoing basis through the Group’s and the Company’s management reporting procedures.
Exposure to credit risk
At the reporting date, the Group’s and the Company’s maximum exposure to credit risk is represented by the carrying amount of each class of financial assets recognised in the statements of financial position, including derivatives with positive fair values.
Information regarding credit enhancements for trade and other receivables is disclosed in Note 25.
Credit risk concentration profile
The Group and the Company determine concentrations of credit risk by monitoring individual profile of its trade receivables on an ongoing basis. At the reporting date, the Group and the Company do not have any significant exposure to any individual customer or counterparty nor do they have any major concentration of credit risk related to any financial instrument, except for the amount due from East Crest International Limited, a subsidiary of the Company, which amounting to RM7,643,799,000 (2012: RM7,863,067,000).

158
39. FINANCIAL RISK MANAGEMENT OBJECTIVES AND POLICIES (continued)
(e) Credit risk (continued)
Financial assets that are neither past due nor impaired
Information regarding receivables that are neither past due nor impaired is disclosed in Note 25. Deposits with banks and other financial institutions are placed with reputable financial institutions.
Financial assets that are either past due or impaired
Information regarding financial assets that are either past due or impaired is disclosed in Note 25.
(f) Market risk
Market price risk is the risk that the fair value or future cash flows of the Group’s financial instruments will fluctuate because of changes in market prices (other than interest or exchange rates).
The Group was exposed to equity price risk in the previous financial year arising from its investment in quoted equity instrument outside Malaysia. The quoted equity instrument was listed on The Stock Exchange of Hong Kong Limited and was classified as available-for-sale financial assets. This quoted equity investment was disposed of during the financial year. The Group does not have exposure to commodity price risk.
40. CONTINGENT LIABILITY
On 25 April 2013, The Store (Terengganu) Sdn Bhd (“Plaintiff”) has filed a claim against Parkson Corporation Sdn Bhd (“Defendant”), a subsidiary of the Company in respect of unlawful interference with the Plaintiff’s tenancy agreement with a third party landlord. Amount claimed is subject to court ruling and is indeterminable at the reporting date. The subsidiary has been advised by its legal counsel that it has a strong case against the Plaintiff’s claim and accordingly no provision for any liability has been made in these financial statements.
41. SEGMENTAL INFORMATION
For management purposes, the Group is organised into business units based on their products and services, and has two reportable operating segments as follows:
(i) Retailing - Operation and management of retail stores in Malaysia, PRC, Vietnam, Myanmar and Indonesia
(ii) Property and - Operation of a retail mall in Malaysia and investment holding investment holding
Except as indicated above, no operating segments has been aggregated to form the above reportable operating segments.
Management monitors the operating results of its business units separately for the purpose of making decisions on resource allocation and performance assessment. Segment performance is evaluated based on operating profit. Group financing (including finance income and finance costs) and income taxes are managed on a group basis and are not allocated to reportable segments.
The Directors are of the opinion that all inter-segment transactions have been entered into in the normal course of business and have been established under terms and conditions that are not materially different from those obtainable in transactions with unrelated parties.
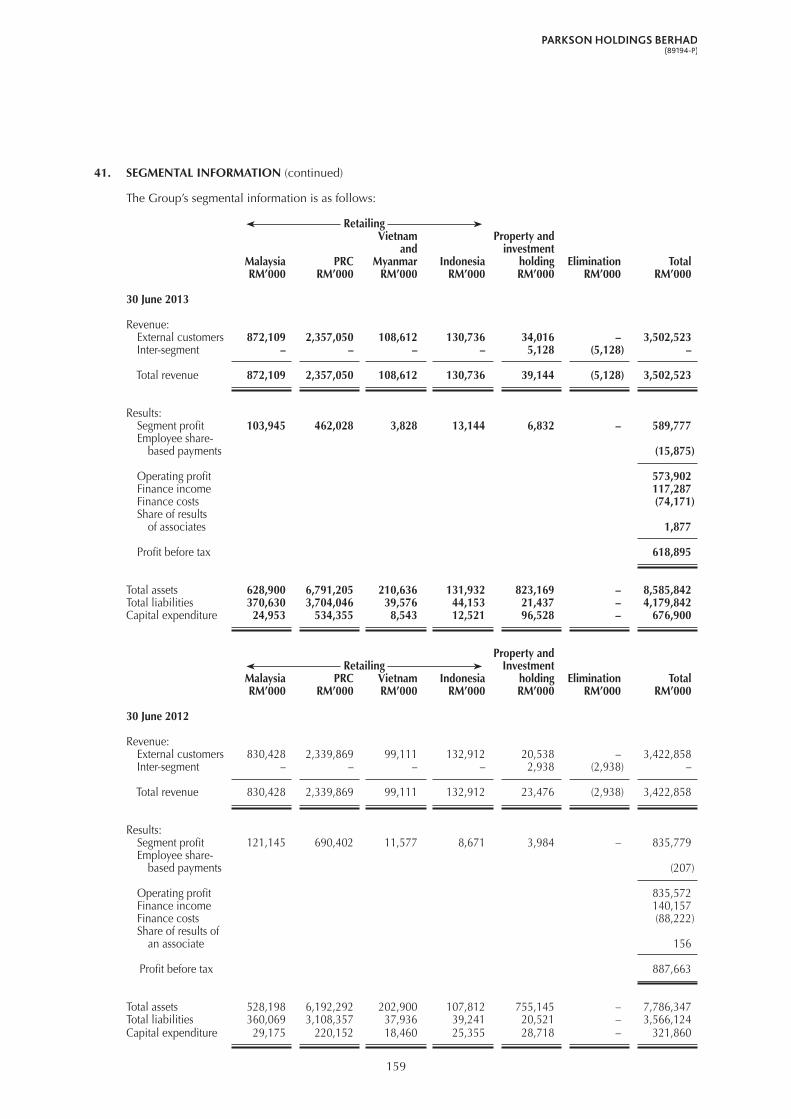
159
41. SEGMENTAL INFORMATION (continued)
The Group’s segmental information is as follows:
Retailing Vietnam Property and and investment Malaysia PRC Myanmar Indonesia holding Elimination Total RM’000 RM’000 RM’000 RM’000 RM’000 RM’000 RM’000
30 June 2013
Revenue: External customers 872,109 2,357,050 108,612 130,736 34,016 – 3,502,523 Inter-segment – – – – 5,128 (5,128) –
Total revenue 872,109 2,357,050 108,612 130,736 39,144 (5,128) 3,502,523
Results: Segment profit 103,945 462,028 3,828 13,144 6,832 – 589,777 Employee share- based payments (15,875)
Operating profit 573,902 Finance income 117,287 Finance costs (74,171) Share of results of associates 1,877 Profit before tax 618,895
Total assets 628,900 6,791,205 210,636 131,932 823,169 – 8,585,842 Total liabilities 370,630 3,704,046 39,576 44,153 21,437 – 4,179,842 Capital expenditure 24,953 534,355 8,543 12,521 96,528 – 676,900
Property and Retailing Investment Malaysia PRC Vietnam Indonesia holding Elimination Total RM’000 RM’000 RM’000 RM’000 RM’000 RM’000 RM’000
30 June 2012
Revenue: External customers 830,428 2,339,869 99,111 132,912 20,538 – 3,422,858 Inter-segment – – – – 2,938 (2,938) –
Total revenue 830,428 2,339,869 99,111 132,912 23,476 (2,938) 3,422,858
Results: Segment profit 121,145 690,402 11,577 8,671 3,984 – 835,779 Employee share- based payments (207)
Operating profit 835,572 Finance income 140,157 Finance costs (88,222) Share of results of an associate 156 Profit before tax 887,663
Total assets 528,198 6,192,292 202,900 107,812 755,145 – 7,786,347 Total liabilities 360,069 3,108,357 37,936 39,241 20,521 – 3,566,124 Capital expenditure 29,175 220,152 18,460 25,355 28,718 – 321,860

160
42. CAPITAL MANAGEMENT
The primary objective of the Group’s capital management is to ensure that it maintains the Group’s stability and growth in order to provide returns for shareholders and benefits for other stakeholders and to maintain an optimal capital structure to reduce the cost of capital.
The Group regularly reviews and manages its capital structure and makes adjustments to it, taking into consideration of changes in economic conditions, future capital requirements of the Group, prevailing and projected profitability and operating cash flows, projected capital expenditures and projected strategic investment opportunities. No changes were made in the objective, policies or processes during the financial years ended 30 June 2013 and 2012.
The Group monitors capital using a gearing ratio, which is net adjusted debt divided by total capital plus net adjusted debt. The Group’s policy is to keep the gearing ratio below 50%. The Group includes within net adjusted debt, trade and other payables and other liabilities, long term payables, loans and borrowings, less deposits, cash and bank balances. Capital includes equity attributable to the owners of the parent.
Group 2013 2012 RM’000 RM’000
Trade and other payables and other liabilities (Note 33) 2,210,364 2,017,557 Long term payables (Note 32) 214,799 122,953 Loans and borrowings (Note 30) 1,579,689 1,245,993 Less: Deposits, cash and bank balances (Note 26) (3,044,017) (3,030,992)
Net adjusted debt 960,835 355,511
Equity attributable to owners of the parent, representing total capital 2,780,664 2,686,088
Total capital and net adjusted debt 3,741,499 3,041,599
Gearing ratio 26% 12%
43. COMPARATIVE
Certain comparatives have been reclassified to conform with current year’s presentation.

161
44. SUPPLEMENTARY INFORMATION
The breakdown of the retained profits/accumulated losses of the Group and of the Company as at 30 June 2013 and 30 June 2012 into realised and unrealised profits/losses is presented in accordance with the directive issued by Bursa Securities dated 25 March 2010 and prepared in accordance with Guidance on Special Matter No. 1, DeterminationofRealisedandUnrealisedProfitsorLossesintheContextofDisclosuresPursuanttoBursaSecuritiesListingRequirements, as issued by the Malaysian Institute of Accountants and the directive of Bursa Securities.
Group 2013 2012 RM’000 RM’000
Total retained profits/(accumulated losses) - realised 34,077 395,253 - unrealised (9,661) (7,022)
Total share of retained profits from associates - realised 1,964 265
Total share of retained profits from a jointly controlled entity - realised 4,960 9,996 - unrealised 482 360
Total retained profits 31,822 398,852
The accumulated losses and retained profits of the Company as at 30 June 2013 and 30 June 2012 of RM3,515,155,000 and RM278,405,000 respectively, are realised.

162
LIST OF GROUP PROPERTIESAS AT 30 JUNE 2013
MATERIAL CONTRACTS INVOLVING THE INTEREST OFDIRECTORS AND MAJOR SHAREHOLDERS
Tenure/ Existing Use/ Net Date of Address Expiry Date for Area Description Age of Building Book Value Acquisition/ Leasehold (Year) (RM’million) Last Revaluation
1. 44-60, Zhong Shan Lu Leasehold 51,485.7 Commercial Shopping 99.7 June 2004 Shi Nan City 3.4.2045 sq metres building complex and Qingdao, China office (13)
2. 127, Renming Zhong Road Leasehold 30,498.6 Commercial Shopping 25.5 June 2004 Wuxi, China 22.4.2044 sq metres building complex and office (17)
3. 239, Dongda Street Leasehold 17,755.4 Commercial Shopping 20.5 June 2004 Xian, China 22.5.2047 sq metres building complex (16)
4. 37, Jinrong Main Road Leasehold 60,888.6 Commercial Shopping 398.0 July 2006 Xicheng District 30.10.2047 sq metres building complex and Beijing, China office (19)
5. 88, Er Dao Street Leasehold 42,574.0 Commercial Shopping 177.8 January 2008 Tie Dong District 11.5.2040 sq metres building complex Anshan City (26) Liaoning Province, China
6. No. 67, Jalan Taman Ibu Kota Leasehold 34,103.0 Commercial Shopping 207.1 May 2008 Taman Danau Kota 20.11.2106 sq metres building complex Setapak, 53300 (2) Kuala Lumpur, Malaysia
7. New Urban Area Nga Nam Leasehold 23,000.0 Commercial Shopping 57.7 June 2009 Catbi Airport 4.11.2075 sq metres building complex Ngo Quyen District (7) Hai Phong City, Vietnam
8. Block 1, No. 12 Leasehold 62,720.0 Commercial Shopping 555.0 December 2009 Qi Sheng Middle Road 30.8.2044 sq metres building complex and Chaoyang District office Beijing, China (3)
9. The Northeast Corner Leasehold 45,022.1 Commercial Shopping 358.3 March 2013 of Nanmenwai Street 10.7.2052 sq metres building complex and Shenyi Street under Heping District construction Tianjin, China
10. HSD 72191, Lot No. PT 842 Leasehold 15 Land For development 93.0 December 2012 Kawasan Bandar XLII 28.11.2111 acres of a shopping Daerah Melaka Tengah mall Melaka
Conditional Sale and Purchase Agreement dated 3 September 2012 and supplemented by a Supplemental Agreement dated 21 November 2012 entered into between Megan Mastika Sdn Bhd (“Megan Mastika”), a wholly-owned subsidiary of the Company, and Dimensi Andaman Sdn Bhd (“Dimensi Andaman”), a company wherein a Director who is also a major shareholder of the Company has interest, for the acquisition by Megan Mastika from Dimensi Andaman of 15 acres out of the 23.22 acres undivided interest of land located in Kawasan Bandar XLII, Daerah Melaka Tengah, Negeri Melaka for a cash consideration of RM93 million.

163
Share Capital as at 16 October 2013
Authorised Capital : RM4,500,000,000Issued and Paid-up Capital : RM1,093,902,050Class of Shares : Ordinary shares of RM1.00 eachVoting Rights : One (1) vote per ordinary share
Distribution of Shareholdings as at 16 October 2013
No. of % of No. of % ofSize of Shareholdings Shareholders Shareholders Shares Shares*
Less than 100 1,423 12.47 33,206 0.00100 to 1,000 2,352 20.62 1,315,122 0.121,001 to 10,000 6,260 54.88 19,648,519 1.8210,001 to 100,000 1,021 8.95 28,857,475 2.68100,001 to less than 5% of issued shares 348 3.05 800,320,387 74.235% and above of issued shares 3 0.03 227,944,110 21.15
11,407 100.00 1,078,118,819 100.00
Substantial Shareholders as at 16 October 2013
Direct Interest Indirect Interest No. of % of No. of % ofSubstantial Shareholders Shares Shares^ Shares Shares^
1. Tan Sri William H.J. Cheng 218,439,012 20.26 300,445,661 27.87
2. Lion Industries Corporation Berhad 53,779,700 4.99 171,443,017 15.90
3. LLB Steel Industries Sdn Bhd – – 171,443,017 15.90 4. Steelcorp Sdn Bhd – – 171,443,017 15.90 5. Amsteel Mills Sdn Bhd 131,170,843 12.17 40,272,174 3.74 6. GIC Private Limited 64,173,542 5.95 – –
7. Lembaga Tabung Haji 63,012,400 5.84 – –
8. Kumpulan Wang Persaraan 56,747,409 5.26 690,645 0.06 (Diperbadankan)
Notes:
* Basedontheissuedandpaid-upcapitaloftheCompanyexcludingatotalof15,783,231ordinarysharesofRM1.00eachintheCompanyboughtbackbytheCompanyandretainedastreasurysharesasat10October2013.
^ Basedontheissuedandpaid-upcapitaloftheCompanyexcludingatotalof15,792,331ordinarysharesofRM1.00eachintheCompanyboughtbackbytheCompanyandretainedastreasurysharesasat16October2013.
ANALYSIS OF SHAREHOLDINGS

164
Thirty Largest Registered Shareholders as at 16 October 2013
Registered Shareholders No. of Shares % of Shares*
1. DB (Malaysia) Nominee (Tempatan) Sendirian Berhad Pledged Securities Account - Nomura International PLC for Cheng Heng Jem 108,817,501 10.092. Lembaga Tabung Haji 62,379,200 5.793. Kumpulan Wang Persaraan (Diperbadankan) 56,747,409 5.264. UOB Kay Hian Nominees (Tempatan) Sdn Bhd Exempt AN for UOB Kay Hian Pte Ltd (A/C Clients) 53,000,000 4.925. Kenanga Nominees (Tempatan) Sdn Bhd Pledged Securities Account for Cheng Heng Jem 47,950,000 4.456. Cartaban Nominees (Asing) Sdn Bhd GIC Private Limited for Government of Singapore (C) 46,366,956 4.307. AMSEC Nominees (Asing) Sdn Bhd AmTrustee Berhad for Excel Step Investments Limited 40,169,949 3.738. AMSEC Nominees (Asing) Sdn Bhd AmTrustee Berhad for Yuanshan Holding Limited 40,000,000 3.719. AMSEC Nominees (Tempatan) Sdn Bhd AmTrustee Berhad for Amsteel Mills Sdn Bhd (CS-Amsteel0) 38,170,843 3.5410. HDM Nominees (Tempatan) Sdn Bhd Pledged Securities Account for Cheng Heng Jem (M09) 37,400,240 3.4711. Scotia Nominees (Tempatan) Sdn Bhd Pledged Securities Account for Narajaya Sdn Bhd 37,150,308 3.4512. Citigroup Nominees (Tempatan) Sdn Bhd Employees Provident Fund Board 26,619,804 2.4713. RHB Nominees (Tempatan) Sdn Bhd Pledged Securities Account for Lion Industries Corporation Berhad 23,533,000 2.1814. Cartaban Nominees (Asing) Sdn Bhd Exempt AN for State Street Bank & Trust Company (West CLTOD67) 19,576,254 1.8215. RHB Nominees (Tempatan) Sdn Bhd Industrial and Commercial Bank of China (Malaysia) Berhad Pledged Securities Account for Cheng Heng Jem 15,314,000 1.4216. Valuecap Sdn Bhd 15,200,000 1.4117. RHB Nominees (Tempatan) Sdn Bhd OSK Capital Sdn Bhd for Lion Industries Corporation Berhad 14,500,000 1.3418. Cartaban Nominees (Asing) Sdn Bhd GIC Private Limited for Monetary Authority of Singapore (H) 14,437,512 1.3419. HSBC Nominees (Asing) Sdn Bhd BBH and Co Boston for Vanguard Emerging Markets Stock Index Fund 12,102,323 1.1220. Amanahraya Trustees Berhad Public Islamic Dividend Fund 11,616,399 1.0821. Maybank Nominees (Tempatan) Sdn Bhd Pledged Securities Account for Trillionvest Sdn Bhd (ACC 1) 9,500,000 0.8822. HSBC Nominees (Asing) Sdn Bhd HSBC-FS for the Navis Asia Navigator Master Fund 8,785,500 0.8123. Cheng Yong Kim 8,309,710 0.7724. DB (Malaysia) Nominee (Tempatan) Sendirian Berhad icapital. biz Berhad 8,180,900 0.7625. Maybank Nominees (Tempatan) Sdn Bhd Asian Finance Bank Berhad for Trillionvest Sdn Bhd (SF) 7,500,000 0.7026. Maybank Nominees (Tempatan) Sdn Bhd Pledged Securities Account for Trillionvest Sdn Bhd (ACC 2) 7,500,000 0.7027. Pertubuhan Keselamatan Sosial 7,358,267 0.6828. Alliancegroup Nominees (Tempatan) Sdn Bhd Pledged Securities Account for Lion Industries Corporation Berhad (8106442) 6,700,000 0.6229. Cartaban Nominees (Asing) Sdn Bhd SSBT Fund WG12 for WGI Emerging Markets Smaller Companies Fund, LLC 6,583,400 0.6130. Cartaban Nominees (Asing) Sdn Bhd SSBT Fund OHSU for State Teachers Retirement System of OHIO 6,400,000 0.59
Note:
* Basedontheissuedandpaid-upcapitaloftheCompanyexcludingatotalof15,783,231ordinarysharesofRM1.00eachintheCompanyboughtbackbytheCompanyandretainedastreasurysharesasat10October2013.

165
Directors’ Interests in Shares in the Company and its Related Corporations as at 16 October 2013
The Directors’ interests in shares in the Company and its related corporations as at 16 October 2013 are as follows:
Nominal Value Direct Interest Indirect Interest per Ordinary No. of % of No. of % of Share Shares Shares Shares Shares
The Company
Tan Sri William H.J. Cheng RM1.00 218,439,012 20.26^ 300,751,384 27.90^
Related Corporations
Tan Sri William H.J. Cheng
Parkson Retail Group Limited HK$0.02 – – 1,448,270,000 51.59Kiara Innovasi Sdn Bhd RM1.00 – – 3,000,000 60.00Parkson Retail Asia Limited # 500,000 0.07 457,983,300 67.62Parkson Myanmar Investment Company Pte Ltd # – – 2,100,000 70.00
Investments in the People’s Indirect Interest Republic of China Rmb % Holdings
Chongqing Wanyou Parkson Plaza Co Ltd 21,000,000 70.00Dalian Tianhe Parkson Shopping Centre Co Ltd 60,000,000 60.00Guizhou Shenqi Parkson Retail Development Co Ltd 10,200,000 60.00Qingdao No. 1 Parkson Co Ltd 223,796,394 95.91Wuxi Sanyang Parkson Plaza Co Ltd 48,000,000 60.00Xinjiang Youhao Parkson Development Co Ltd 10,200,000 51.00
Indirect Interest US$ % Holdings
Investments in Vietnam
Parkson Hanoi Co Ltd 3,360,000 70.00
Notes:
^ Basedontheissuedandpaid-upcapitaloftheCompanyexcludingatotalof15,792,331ordinarysharesofRM1.00eachintheCompanyboughtbackbytheCompanyandretainedastreasurysharesasat16October2013.
# SharesincompaniesincorporatedinSingaporedonothaveaparvalue.
Other than as disclosed above, none of the other Directors of the Company had any interest in shares in the Company or its related corporations as at 16 October 2013.
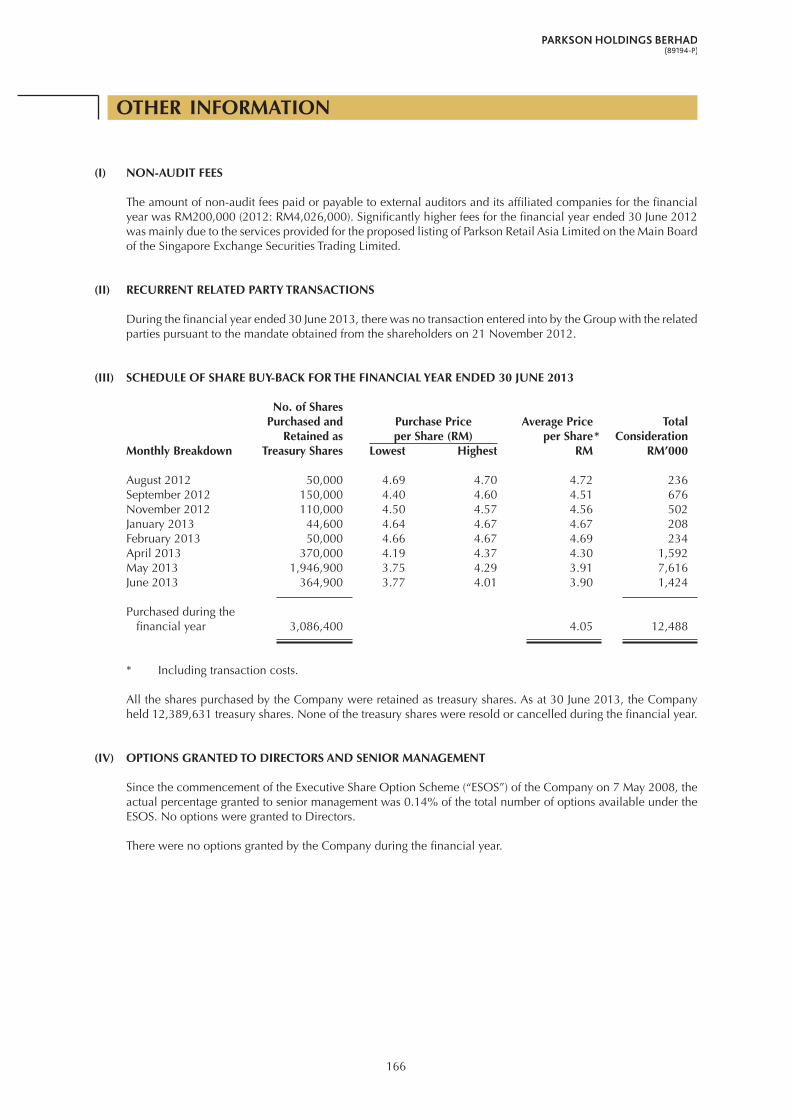
166
OTHER INFORMATION
(I) NON-AUDIT FEES
The amount of non-audit fees paid or payable to external auditors and its affiliated companies for the financial year was RM200,000 (2012: RM4,026,000). Significantly higher fees for the financial year ended 30 June 2012 was mainly due to the services provided for the proposed listing of Parkson Retail Asia Limited on the Main Board of the Singapore Exchange Securities Trading Limited.
(II) RECURRENT RELATED PARTY TRANSACTIONS
During the financial year ended 30 June 2013, there was no transaction entered into by the Group with the related parties pursuant to the mandate obtained from the shareholders on 21 November 2012.
(III) SCHEDULE OF SHARE BUY-BACK FOR THE FINANCIAL YEAR ENDED 30 JUNE 2013
No. of Shares Purchased and Purchase Price Average Price Total Retained as per Share (RM) per Share * Consideration
Monthly Breakdown Treasury Shares Lowest Highest RM RM’000
August 2012 50,000 4.69 4.70 4.72 236September 2012 150,000 4.40 4.60 4.51 676November 2012 110,000 4.50 4.57 4.56 502January 2013 44,600 4.64 4.67 4.67 208February 2013 50,000 4.66 4.67 4.69 234April 2013 370,000 4.19 4.37 4.30 1,592May 2013 1,946,900 3.75 4.29 3.91 7,616June 2013 364,900 3.77 4.01 3.90 1,424
Purchased during the financial year 3,086,400 4.05 12,488
* Including transaction costs.
All the shares purchased by the Company were retained as treasury shares. As at 30 June 2013, the Company held 12,389,631 treasury shares. None of the treasury shares were resold or cancelled during the financial year.
(IV) OPTIONS GRANTED TO DIRECTORS AND SENIOR MANAGEMENT Since the commencement of the Executive Share Option Scheme (“ESOS”) of the Company on 7 May 2008, the
actual percentage granted to senior management was 0.14% of the total number of options available under the ESOS. No options were granted to Directors.
There were no options granted by the Company during the financial year.
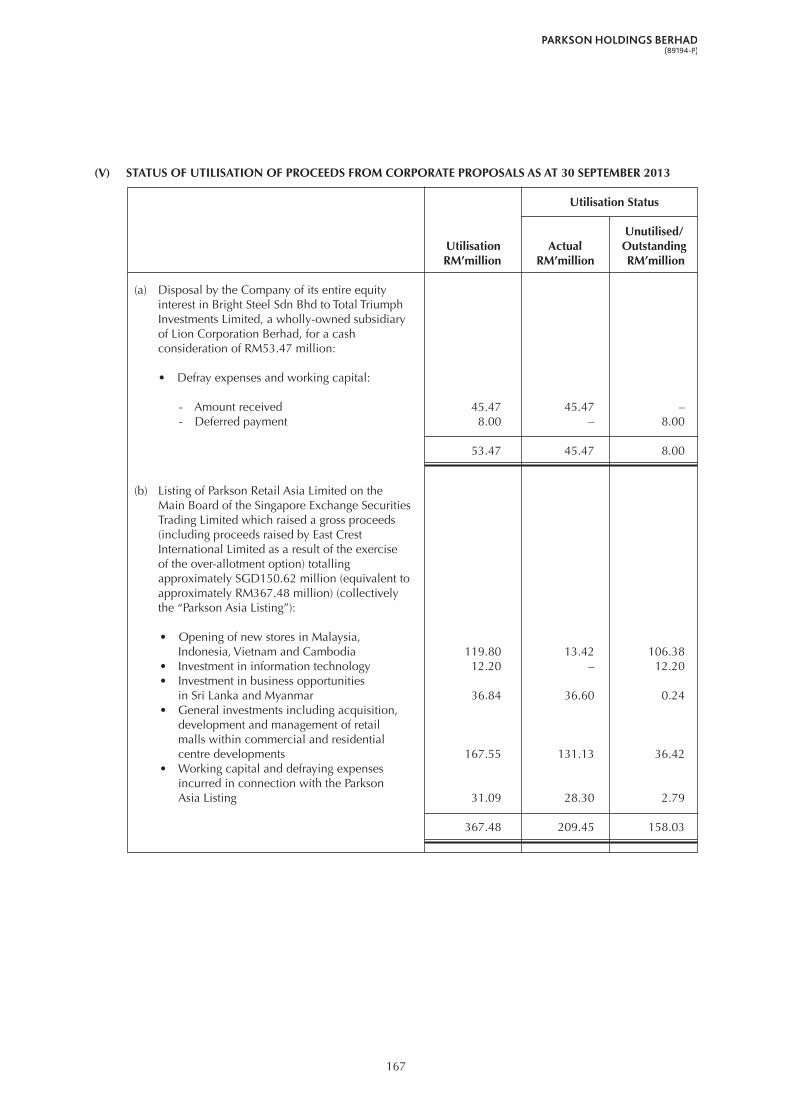
167
(V) STATUS OF UTILISATION OF PROCEEDS FROM CORPORATE PROPOSALS AS AT 30 SEPTEMBER 2013
Utilisation Status
Unutilised/ Utilisation Actual Outstanding RM’million RM’million RM’million
(a) Disposal by the Company of its entire equity interest in Bright Steel Sdn Bhd to Total Triumph Investments Limited, a wholly-owned subsidiary of Lion Corporation Berhad, for a cash consideration of RM53.47 million:
• Defrayexpensesandworkingcapital:
- Amount received 45.47 45.47 –- Deferred payment 8.00 – 8.00
53.47 45.47 8.00
(b) Listing of Parkson Retail Asia Limited on the Main Board of the Singapore Exchange Securities Trading Limited which raised a gross proceeds (including proceeds raised by East Crest International Limited as a result of the exercise of the over-allotment option) totalling approximately SGD150.62 million (equivalent to approximately RM367.48 million) (collectively the “Parkson Asia Listing”):
• OpeningofnewstoresinMalaysia, Indonesia, Vietnam and Cambodia 119.80 13.42 106.38• Investmentininformationtechnology 12.20 – 12.20• Investmentinbusinessopportunities in Sri Lanka and Myanmar 36.84 36.60 0.24• Generalinvestmentsincludingacquisition, development and management of retail malls within commercial and residential centre developments 167.55 131.13 36.42• Workingcapitalanddefrayingexpenses incurred in connection with the Parkson Asia Listing 31.09 28.30 2.79
367.48 209.45 158.03

I/We ............................................................................................................................................................................. I.C. No./Company No. ................................................................................................................................................. of.................................................................................................................................................................................. being a member/members of PARKSON HOLDINGS BERHAD, hereby appoint ......................................................... .....................................................................................................................................................................................
I.C. No. ........................................................................................................................................................................ of.................................................................................................................................................................................. or failing whom, ........................................................................................................................................................... I.C. No. ........................................................................................................................................................................ of.................................................................................................................................................................................. as my/our proxy to vote for me/us and on my/our behalf at the Thirtieth Annual General Meeting of the Company to be held at the Meeting Hall, Level 16, Office Tower, No. 1 Jalan Nagasari (Off Jalan Raja Chulan), 50200 Kuala Lumpur on 12 December 2013 at 10.30 am and at any adjournment thereof.
RESOLUTIONS FOR AGAINST
1. To approve Directors’ fees
2. To re-elect as Director, Cik Zainab binti Dato’ Hj. Mohamed
3. To re-appoint as Director, Tan Sri William H.J. Cheng
4. To re-appoint Auditors
5. Authority to Directors to issue shares
6. Proposed Shareholders’ Mandate for Recurrent Related Party Transactions
7. Proposed Renewal of Authority for Share Buy-Back
8. Proposed Amendment to the Articles of Association of the Company
Please indicate with an “X” how you wish your vote to be cast. If no specific direction as to voting is given, the proxy will vote or abstain at his discretion.
As witness my/our hand this .................. day of ...................................... 2013
No. of shares : .......................................... Signed : ...............................................
Representation at Meeting:
l In respect of deposited securities, only Members whose names appear in the Record of Depositors on 5 December 2013 shall be eligible to attend the Meeting.
l A member entitled to attend and vote at the Annual General Meeting is entitled to appoint a proxy to attend and vote instead of him. A proxy need not be a member of the Company. The instrument appointing a proxy must be in writing under the hand of the appointor or his attorney duly authorised in writing or, if the appointor is a corporation, either under seal or the hand of an officer or attorney duly authorised.
l The instrument of proxy shall be deposited at the office of the Registrar of the Company, Level 13, Office Tower, No. 1 Jalan Nagasari (Off Jalan Raja Chulan), 50200 Kuala Lumpur not less than forty-eight (48) hours before the time for holding the Meeting.
l Completed Form of Proxy sent through facsimile transmission shall not be accepted.
FORM OF PROxY CDS ACCOUNT NUMBER
✄


