PRERANA March 2012 i CONTENTS Title Author(s) Page No. Regional rural banks in India since reforms: Versha Mohindra and A study of technical efficiency Gian Kaur 1 A study on the work related stress among Rajesh C. Jampala, 13 the Banking, Finance and Insurance sector P. Adi Lakshmi and employees in Krishna District, O.A.R. Kishore Andhra Pradesh Work life conflict and flexible work Uma Seshadri and 23 arrangements that aid work life balance: Debendra Kar Perception of working women in dual career families A cross sectional analysis of student Purna Prabhakar Nandamuri 33 participation in learning process and K.V. Rao Entrepreneurial attitudes among S. Sudha and P. Shalini 39 B-school students-An empirical approach Gap analysis for skill development in Zenetta Rosaline and 51 knitwear industry - Tirupur Rupa Gunaseelan Changing role of Management Professor S. Balasubramanian 61
Transcript
PRERANA March 2012
i
Contents
title Author(s) Page no.
Regional rural banks in India since reforms: Versha Mohindra and A study of technical efficiency Gian Kaur 1
A study on the work related stress among Rajesh C. Jampala, 13 the Banking, Finance and Insurance sector P. Adi Lakshmi and employees in Krishna District, O.A.R. Kishore Andhra Pradesh
Work life conflict and flexible work Uma Seshadri and 23arrangements that aid work life balance: Debendra Kar Perception of working women in dual career families
A cross sectional analysis of student Purna Prabhakar Nandamuri 33 participation in learning process and K.V. Rao
Entrepreneurial attitudes among S. Sudha and P. Shalini 39B-school students-An empirical approach
Gap analysis for skill development in Zenetta Rosaline and 51knitwear industry - Tirupur Rupa Gunaseelan
Changing role of Management Professor S. Balasubramanian 61
PRERANA March 2012
ii
PRERANA March 2012
iii
From the executive editor
It is my pleasure to place before you the first issue of the fourth volume of 'PRERANA: Journal of Management Thought and Practice'. The objective of PRERANA is to disseminate contemporary developments in the field of management in the form of empirical research that tests, extends or builds management theory and contributes to management practice. PRERANA encourages manuscripts that present strong empirical and theoretical contributions to the management field. Preference is given to submissions that test, extend, or build strong theoretical frameworks while empirically examining issues with high importance for management theory and practice. The Journal will also enable industry in applying the most recent developments in the evolution of management thought.
PRERANA's international and multi-disciplinary review team ensures maintenance of standards of excellence with regard to the quality of contents. The current issue publishes six articles in the areas of Finance and Human Resources.
Versha Mohindra and Gian Kaur in their article have examined the performance of 14 regional rural banks during the post reform period from 1992-93 to 2008-09 using data envelopment analysis. The study reveals that technical inefficiency has slowed down in response of deregulatory policies and positive relationship exists among scale economies and bank size.
Rajesh, Adi Lakshmi and Kishore in their article examined the work related stress among the employees of Banking, Finance and Insurance sectors in Krishna District, Andhra Pradesh using HSE indicator tool. The differences among the various employees based on different demography’s including sector, gender, qualification, industry and experience has been analyzed. Results of the study reveal that private sector employees are facing more stress than public sector employees in all the seven factors of stress and bank employees experience high amount of stress compared to the other sectors.
Uma and Debendra Kar in their article have examined the perception of working women in dual career families with respect to work like conflict and flexible work arrangements that aid work life balance. The study reveals that employees have strong anticipation on organizational support for achieving work life balance, to attend advanced courses for career advancement, and permit flexible work arrangement. Results further reveal that expectation of achieving an effective work-life balance is strongly correlated to their expectations of organizational policies that permit flexible work arrangements.
Purna Prabhakar and Rao in their article have explored the nature of student participation in learning process among the three major types of school managements at secondary level. Findings reveal a strong association between the type of school management and the nature of class participation and the unaided managements excel in motivating excellent participation than the public and aided managements.
PRERANA March 2012
iv
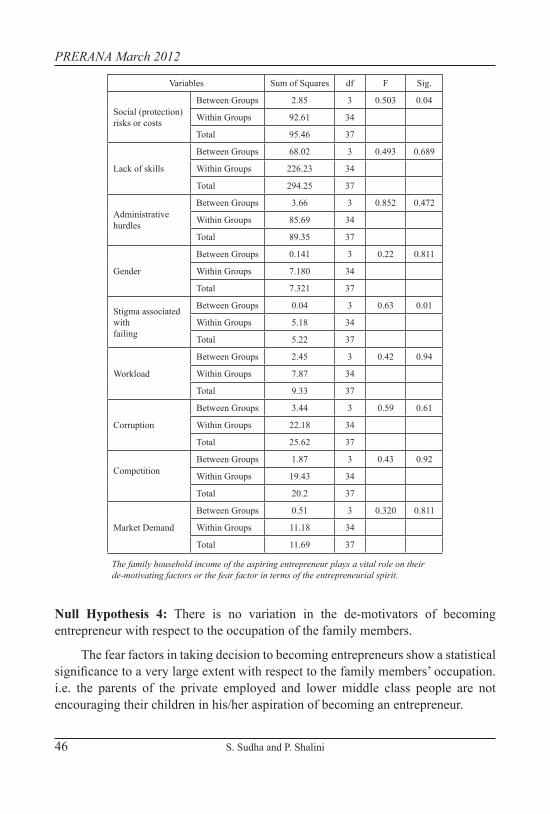
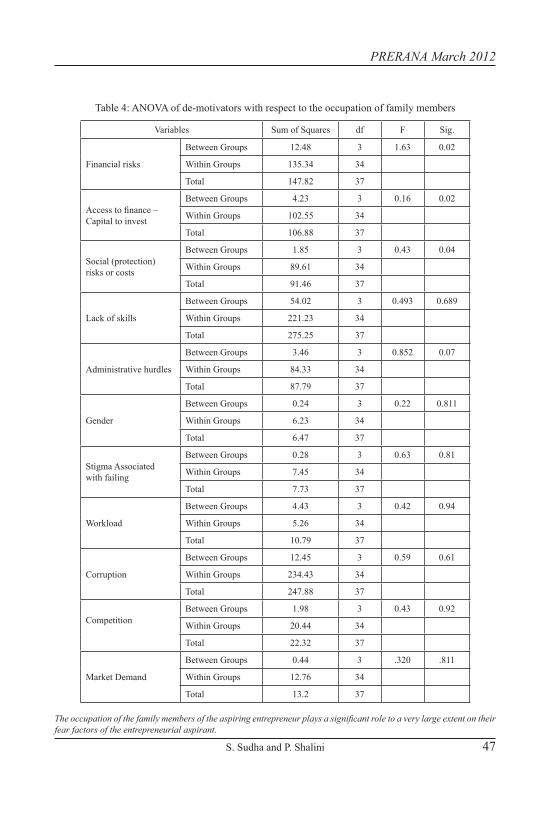
Sudha and Shalini in their article have investigated the entrepreneurial attitude among B-school students in Chennai and the perception of the motivating and de-motivating factors of entrepreneurship with respect to the demographic variables. Results of the survey reveal that the activities conducted by the management school contribute towards developing the entrepreneurial skills among the students. Zenetta and Rupa in their study have performed a gap analysis to identify the skill gap among the employees of Tiruppur Knitwear so as to identify the areas for skill improvement. This issue contains an article on “Changing Role of Management Professor” instead of the CXO talk.
I thank all the authors for their contributions towards the first issue of the fourth volume of PRERANA. I look forward for novel, insightful and crafted conceptual work that challenges conventional wisdom concerning all aspects of organizations from academicians, bureaucrats and business executives for publishing in PRERANA. The focus of the articles could be on diverse aspects of management focusing on contemporary issues and future challenges.
- Dr. B. sripirabaa
PRERANA March 2012
Versha Mohindra and Gian Kaur 1
RegionAl RuRAl BAnks in inDiA sinCe ReFoRms: A stuDy oF teChniCAl eFFiCienCy
Versha Mohindra1 and Gian Kaur2
ABstRACtThe present study attempts to empirically examine the relative efficiency of
regional rural banks during the post reform period spanning from 1992-93 to 2008-09 by using non-parametric technique of data envelopment analysis. The aforementioned conclusions portray that over the period from 1993 to 2009, regional rural banks have experienced technical efficiency to the tune of about 92 percent. Thus the banks can on an average decrease their inputs by 8 percent and still can produce the same level of output. The comparative analysis of average Overall Technical Efficiency scores of all 14 regional rural banks between distinct periods shows that the degree of input waste was 7 percent in first-generation reforms period, declined to 8 percent in second-generation reforms period. Therefore, the results imply that technical inefficiency has slowed down in response of deregulatory policies. The decomposition of overall technical efficiency into two components namely pure technical efficiency and scale efficiency provided the evidence that 8 percentage points of overall technical inefficiency is due to managerial incapabilities in utilizing critical inputs, while remaining part of the overall technical inefficiency may be attributed to the choice of sub optimal scale of operation. Besides this, the empirical findings provide the evidence of positive relationship among scale economies and bank size.
intRoDuCtionRural finance is a matter of great concern in an agrarian economy like India.
The institutional credit accounts for 60 percent of the total credit needs and rest of the 40 percent is provided by non-institutional sector (informal sector). The informal sector for rural finance is an age old. It consists primarily of rural money lenders, traders, merchants etc. It proved to be avaricious and ruinous for rural India. Realizing the fleeing of rural masses, Government of India took several initiatives to promote the growth of rural and agriculture sector. Amongst these initiatives, major was the establishment of Regional Rural Banks (RRBs). The basic idea of introducing RRBs was to look after the financial needs of rural sector with professional approach as that of commercial banks in India. RRBs also participated enthusiastically in enhancing poverty alleviation schemes especially for the drought-
2 Dr. Gian Kaur, Professor, Punjab School of Economics, Guru Nanak Dev University, Amritsar - 143 005. E-mail: [email protected], Handset: 9855674446
PRERANA March 2012
2 Versha Mohindra and Gian Kaur
prone and deserts regions. By doing this RRBs became an important and integral part of the rural credit system.
ReVieW oF liteRAtuReThe contemporary literature on banking efficiency spells out two distinct
approaches to measure efficiency (1) accounting measure (2) economic measure. Accounting measure refers to the use of various financial ratios that focus on one or more outputs and their relevant inputs to measure the performance of a banking unit. The financial ratio approach has been widely used by the researchers and working groups/committees to analyze the performance of RRBs. Most of the studies on the performance evaluation of RRBs concentrated on the banks in particular state/region. Some of the studies are: Singh (1992) analyzed the performance of RRBs banks in Punjab. Prasad (2003) evaluated the performance of RRBs in India. Moreover, Pati (2005) developed the performance of RRBs in the north-east region. The study of Bagchi and Hadi (2006) concentrated on the performance of regional rural banks in West Bengal. Few studies also exist in the literature which concentrated on the efficiency of a single regional rural bank. Some of the studies conducted so far are: Sudhaker et al., (1984) evaluated the performance of Cauvery Grameen Bank in Mysore district; Parmar (1986) assessed the performance of Banaskantha Mehsane Grameen Bank in Gujarat; Sangwan (1988) analyzed the performance of Chattanja Grameen Bank in Andhra Pradesh; Jagadeesha et al., (1990) evaluated the performance of Tungabhadra Garmeen Bank in Karnataka. Further, Hosamani (2002) explored the performance of Malaprabha Garmeen Bank in Karnataka and Yadappanvar and Nath (2003) assessed the performance of Aurangabad and Jalna Grameen Bank in Maharashtra.
Though financial accounting ratios are simple to use and relatively easy to understand, but their use to measure bank performance is plagued by various problems. As a precautionary measure, regulatory frame works (such as CAMEL rating) based on these ratios has been put in place in most of the supervisory systems across the globe. Further, Sherman and Gold (1985) noted that financial ratios do not capture the long-term performance. This measure also helps in the analysis of bank’s performance in terms of individual parameters determining the overall efficiency level as it is difficult to precisely measure the efficiency of banks. Therefore, in recent years, there is a trend towards measuring bank performance using economic measure. This measure provides accurate, composite and precise estimate of efficiency of banks comparing each bank against the top performers in the banking industry.
A scan of the existing literature on the efficiency of Indian banks provides that there exists various studies that analyzed the efficiency of Indian commercial banks using most popularly used parametric technique of Stochastic Frontier Analysis
PRERANA March 2012
Versha Mohindra and Gian Kaur 3
(SFA) and non-parametric technique of Data Envelopment Analysis. The notable studies belonging to this group are: Noulas and Ketkar (1996), Bhattacharyya et al., (1997), Das (1997), Saha and Ravisankar (2000), Mukherjee et al., (2002), Kumar and Verma (2003), De Kumar (2004), Chakrabarti and Chawla (2005), Kaur and Sharma (2005-06), Kumar and Gulati (2008), etc. To the authors knowledge, there is virtually no study except Reddy (2005), Khankhoje (2008), Sathye (2008) and Mohindra (2011) which analyzed the performance of RRBs by using Frontier and Data Envelopment Analysis approach respectively. The present study is an attempt in this direction which aims to enrich the already scant literature on the performance evaluation of RRBs using Data Envelopment Analysis. The present study is an attempt in this direction which aims to enrich the already scant literature on the performance evaluation of RRBs using Data Envelopment Analysis.
oBJeCtiVes oF the stuDyThe present study has two important objectives. The first is to measure
technical and scale efficiency of RRBs operating during the period (1993 to 2009). The study covers balanced panel data set of 14 RRBs operating in India during the study period. The study has applied two most popular Data Envelopment Analysis (DEA) models namely Charnes Cooper Rhodes (CCR) and Banker Charnes Cooper (BCC) model to accomplish the objective. Secondly, the study has explored the relationship between bank size and scale economies to see whether the size of the assets influences the level of scale economies or not.
meAsuRement oF inPut AnD outPut VARiABle in BAnkingThe first step in measuring the efficiency is to specify inputs and outputs of the
firms under consideration. The present study followed an intermediation approach to select input and output variables. The major advantage of intermediation approach over the production cost approach and user-cost approach method is the inclusion of interest costs in total costs and it assigns monetary value to specific input and output variable.
For the present study, we have considered three measures of outputs which are deposits, investment and advances and two inputs which are interest expenses and operating expenses. Further, all the output and input have been measured in millions. For calculating the efficiencies scores, the analysis has been carried out with real values of the variables (except labor) which have been obtained by deflating the nominal values by the implicit price deflator base (1999-2000 = 100). Further, the input and output variables have been normalized by dividing them by the total assets of individual banks to reduce the effects of random noise due to measurement error in the inputs and outputs.
PRERANA March 2012
4 Versha Mohindra and Gian Kaur
DAtA BAseThe study has considered 14 Regional Rural Banks operating in India during
the sample period from 1993 to 2009. The entire study period has been divided into two periods i.e. first generation reforms period (1992-1993 to 1998-99) and second generation reforms period (1999-2000 to 2008-2009) to study the impact of deregulation on the efficiency of banks since the extent of deregulation was relatively lower in former sub-period relative to later sub-period. All the 14 RRBs are being referred to as B1, B2,….B14 respectively in this article. The sample period selected is constrained to the availability of data on the input and output variables considered for the present study.
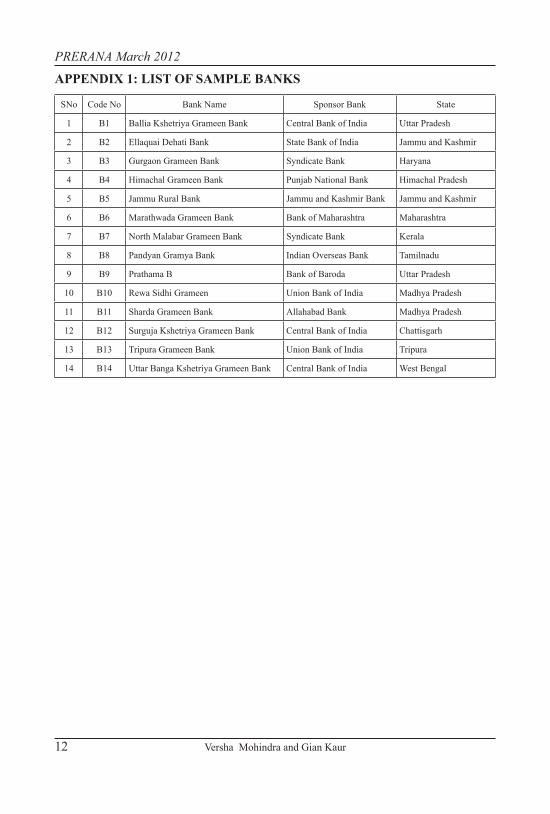
As far as, sample banks are concerned, this study has considered balanced panel data set of 14 RRBs during the period spanning from 1992-1993 to 2008-2009. Only those banks have been considered in the study which have been continuously operating since 1979 onwards to 2009 (except Caurey Gramin Bank because this bank was closed in 1992) so as to make a balanced panel data set. The list of banks included in the sample along with sponsors banks and states has been shown in Appendix 1.
The data on the input and output variables has been taken from Compact disc available on “Statistical Tables relating to Banks in India (including RRBs) 1979 to 2009” available from Reserve Bank of India, Mumbai. Further for the Annual Accounts of Banks, Report on Trend & Progress in Banking, Annual Publications of Reserve Bank of India has been used.
Results AnD DisCussionsTemporal Pattern of Efficiency Scores: It provides the results of input that how much input quantities should be reduced to produce the current level of outputs. Further, the analysis will also explore the sources of inefficiencies. Table 1 presents the results of average OTE [the term overall technical efficiency (OTE) and technical efficiency (TE) have been used interchangeably in this study] scores with standard deviation of RRBs during the period from 1993 to 2009, divided into sub-periods.
Table 1: Average Technical Efficiency Scores of Regional Rural Banks in India
Note: 1992-93 to 1998-99 shows first-generation reforms period and 1999-00 to 2008-09 shows second-generation
reforms period and 1992-93 to 2008-09 denotes entire study period. SD denotes standard deviation
The results have been obtained through running CCR model separately for each year. The empirical findings reported that average OTE has turned out to be 92 percent for RRBs with standard deviation measure of 0.034. This implies that the overall technical inefficiency [OTIE (%) = (1- OTE) X 100] of banks came out to be almost 8 percent. Thus, the banks can curtail their input expenditures on loanable funds, fixed assets and labor by 8 percent by adopting best practices. The comparative analysis of average OTE scores of all 14 regional rural banks between distinct periods show that the degree of input waste was 07 percent in first generation reforms period, declined to 8 percent in second generation reforms period. Therefore, the results imply that technical inefficiency has showed up in second generation reforms period to first generation reforms period. Sources of Overall Technical (IN) Efficiency: Temporal Trend: As mentioned earlier that OTE can be decomposed into two collectively exhaustive components viz; pure technical efficiency (PTE) and scale efficiency (SE) efficiency. PTE refers to managers’ capability to utilize resources more efficiently and get maximum possible returns, while SE refers to increasing/decreasing the scale of operations to an optimal level where constant returns to scale holds. Like overall technical
PRERANA March 2012
6 Versha Mohindra and Gian Kaur
efficiency (OTE), pure technical efficiency (PTE) also indicates the wastage of resources but PTE is devoid of scale effects unlike OTE. PTE and SE scores have been obtained through running Banker Charnes Cooper (BCC) model for each year separately. Table 2 summarizes the average PTE and SE scores with standard deviation during the period from 1993 to 2009, divided into sub-periods considered in the study. The mean PTE score estimated to be 95 percent with standard deviation measure of 0.018. The result indicates that 5 percent mean technical inefficiency (TIE) is due to the incapability of the management to utilize the resources. The rest part of the OTIE may be attributed to the fact that the banks are operating at below the optimal level.
Table 2: Average Pure Technical Efficiency and Scale Efficiency Scores of Regional Rural Banks in India
1999- 00 to 2008-09 Average 0.95 0.96SD 0.020 0.0261992-93 to 2008-09 0.95 0.96SD 0.018 0.021
Source: Author’s calculations
Note: PTE denotes pure technical efficiency and SE denotes scale efficiency. 1992-93 to 1998-99 shows first-generation reforms period and 1999-00 to 2008-09 shows second-generation reforms period and 1992-93 to 2008-09 denotes entire study period. SD denotes standard deviation.
PRERANA March 2012
Versha Mohindra and Gian Kaur 7
As mentioned earlier, SE of banks can be measured as the ratio of OTE to PTE. The value of SE equal to 1 indicates that a decision making unit (DMU) is operating at most productive scale size and value of less than one indicates that a DMU is not operating at optimal scale. The mean SE score turned to be 96 percent with standard deviation measure of 0.021 which implies that average scale inefficiency (SIE) in tune of about 4 percent is due to the choice of sub-optimal level of operation. The results also show that scale inefficiency (SIE), the main responsible factor for overall technical inefficiency (OTIE) rather pure technical inefficiency (PTIE). The comparative analysis of average PTE and SE between different periods indicate that pure technical inefficiency was in tune of about 6 percent in first generation reforms period declined to 5 percent in second generation reforms period. This in turn infers that the degree of managerial in capabilities has declined by 1 percent during these periods. On the other hand, scale inefficiency in tune of about 3 percent in first generation reforms period increased to 4 percent in second generation reforms period. The level of the scale operation of banks has declined during these periods. Inter Bank Comparison of Efficiency Scores: Table 3 provides us the average OTE scores for each bank in first generation reforms period, second generation reforms period and entire study period.Bank wise Temporal Pattern of Efficiency Analysis: Table 3 presents inter temporal comparison of efficiency of banks and depicts the best practice banks in each year. As already mentioned, those banks with efficiency score equal to one is considered to be the most efficient amongst the banks, and those banks which have efficiency score less than one is deemed to be relatively inefficient. B09 dominated during the entire study period, as this bank captured seventeen times the position on the frontier. B3 bank is found to be operating fourteen times on the frontier. B7 and B11 Bank are found to be operating eleven and nine times on the frontier respectively. These banks are considered as best practice banks and the poor performing banks should follow their practices in their working processes.
Table 3: Average DEA Efficiency Scores and Returns-to-Scale of Regional Rural Banks: 1992-93 to 2008-09
Year TE PTE SEMinimum Level
of TEMinimum Level
of PTEMinimum Level
of SE Best Practice Bank
Bank Value Bank Value Bank Value IRS DRS CRS
1992 - 93 0.907 0.928 0.974Ellaquai Dehati Bank
0.668Pandyan Grama Bank
0.789 Ellaquai Dehati Bank 0.844 7 2 5
B1,B3, B7,B9, B10
1993 - 94 0.902 0.929 0.971Pandyan Grama Bank
0.679Pandyan Grama Bank
0.680 Marathwada Gramin Bank 0.842 5 4 5
B1,B3, B7,B9, B10
1994 - 95 0.926 0.949 0.975Ellaquai Dehati Bank
0.693Ellaquai Dehati Bank
0.743Ballia Kshetriya Gramin Bank
0.930 44 6 6B3, B4, B7, B9, B10, B13
PRERANA March 2012
8 Versha Mohindra and Gian Kaur
Year TE PTE SEMinimum Level
of TEMinimum Level
of PTEMinimum Level
of SE Best Practice Bank
Bank Value Bank Value Bank Value IRS DRS CRSAverage 0.92 0. 95 0.9 6
SD 0.034 0.018 0.021
Source: Author’s calculations
Note: TE denotes technical efficiency, PTE denotes pure technical efficiency and SE denotes scale efficiency. RTS shows returns-to-scale, IRS denotes increasing returns-to-scale, DRS denote diminishing returns-to-scale and CRS denotes constant returns-to-scale. SD denotes standard deviation.
As far as banks with minimum efficiency scores are concerned, B2 Bank was found to be the bank with minimum technical efficiency score in almost all the years except the year 1993-94. Further, B2 Bank is found thirteen times to be the bank with minimum pure technical efficiency score in the year 1993-94 and 1997 onwards. B8 Bank registered on thrice times with the minimum technical efficiency score in the years 1992-93, 1993-94 and 1996-97. B4 Bank registered on four occasions the minimum scale efficiency score in the years 1991 while B6 and B2 Bank noticed three occasions minimum scale efficiency score. Therefore, the results signify that the banks having most of times the minimum efficiency scores are not yet progressive in nature. So, these banks will have to incorporate substantial changes in their policies to keep in line with international standards. After analyzing it is evident that most of the banks included in the sample are operating at below their optimal level and experiencing increasing returns to scale.
ConClusion Over the years, RRBs have proved to be the most active agencies in the process
of strengthening rural economy by purveying credit and mobilizing deposits from rural areas through their vast network even in the remotest areas of the country. Though the regional rural banks have faced a great threat initially, the introduction of financial sector reforms and other policy initiatives (including recapitalization) by Government of India, Reserve Bank of India and other agencies concerned for strengthening the financial position of regional rural banks have resulted in perceptible improvement in the functioning of these banks. Evidence from the above, regional rural banks are thus required to devote utmost attention to their performances to meet global aspirations. This study is an attempt in this direction to analyze the performance of banks in terms of technical, pure technical and scale efficiency during the post-reforms period spanning from 1992-1993 to 2008-2009 by using non-parametric technique of data envelopment analysis. The present study followed an intermediation approach to select input and output variables.
The inputs vector contains two inputs viz; interest expenses and operating expenses while output vector contains three outputs viz; deposits, investment and
Year TE PTE SEMinimum Level
of TEMinimum Level
of PTEMinimum Level
of SE Best Practice Bank
Bank Value Bank Value Bank Value IRS DRS CRS
1995 - 96 0.938 0.938 0.983Ellaquai Dehati Bank
0.768Pandyan Grama Bank
0.777 Jammu Rural Bank 0.929 4 3 7
B1,B4, B6,B7, B9, B10, B12
1996 - 97 0.937 0.962 0.973Ellaquai Dehati Bank
0.705
Sharda Grameen Bank 0.844 Ellaquai
Dehati Bank 0.873 5 2 7B1,B4, B7,B9, B10, B13
1997 - 98 0.992 0.960 0.981Ellaquai Dehati Bank
0.682Ellaquai Dehati Bank
0.693Tripura Gramin Bank 0.910 3 5 6
B1,B3, B4,B7, B9, B12
1998 - 99 0.947 0.961 0.986Ellaquai Dehati Bank
0.711Ellaquai Dehati Bank
0.714 Marathwada Gramin Bank 0.927 2 5 7
B1,B3, B4,B5, B7, B24, B9, B10
1999 - 00 0.957 0.964 0.992Ellaquai Dehati Bank
0.715Ellaquai Dehati Bank
0.744Marathwada Gramin Bank 0.950 3 3 8
B1, B3, B4, B5, B7, B9, 13
2000 - 01 0.952 0.966 0.986Ellaquai Dehati Bank
0.714Ellaquai Dehati Bank
0.728
Uttar Banga Kshetriya Gramin Bank 0.941 3 4 7
B1,B3, B4,B7, B9, B10, B13
2001 – 02 0.932 0.959 0.969Ellaquai Dehati Bank
0.616Ellaquai Dehati Bank
0.711 Ellaquai Dehati Bank 0.866 1 7 6
B3, B5, B7, B8, B9, B13
2002 – 03 0.921 0.952 0.965Ellaquai Dehati Bank
0.630Ellaquai Dehati Bank
0.706Uttar Banga Kshetriya Gramin Bank
0.865 3 6 5B4, B5, B8, B9, B13
2003 – 04 0.961 0.979 0.982Ellaquai Dehati Bank
0.779Ellaquai Dehati Bank
0.799 Jammu Rural Bank 0.914 3 3 8
B1, B3, B4, B6, B8, B9, B11, B13,
2004 – 05 0.963 0.971 0.991Ellaquai Dehati Bank
0.697Ellaquai Dehati Bank
0.706
Uttar Banga Kshetriya Gramin Bank 0.927 1 4 9
B3, B4, B5, B6, B8, B9, B10, B11, B12
2005 – 06 0.910 0.965 0.944Ellaquai Dehati Bank
0.616Ellaquai Dehati Bank
0.618 Rewa Sidhi Gramin Bank 0.843 1 7 6
B3, B4, B5, B8, B9, B49, B12
2006 – 07 0.909 0.960 0.921Ellaquai Dehati Bank
0.706Ellaquai Dehati Bank
0.717 Uttar Banga Kshetriya Gramin
0.843 1 8 5B3,B7,B8, B9, B12
2007-08 0.892 0.945 0.946Ellaquai Dehati Bank
0.626Ellaquai Dehati Bank
0.627 BankRewa Sidhi 0.849 2 8 4 B3,B8,B9
B12
2008-0 0.844 0.945 0.930
Ellaquai Dehati Bank 0.559
Ellaquai Dehati Bank 0.673
Gramin BankSharda Grameen Bank
0.812 4 6 4 B3,B8,B9B12
PRERANA March 2012
Versha Mohindra and Gian Kaur 9
Year TE PTE SEMinimum Level
of TEMinimum Level
of PTEMinimum Level
of SE Best Practice Bank
Bank Value Bank Value Bank Value IRS DRS CRSAverage 0.92 0. 95 0.9 6
SD 0.034 0.018 0.021
Source: Author’s calculations
Note: TE denotes technical efficiency, PTE denotes pure technical efficiency and SE denotes scale efficiency. RTS shows returns-to-scale, IRS denotes increasing returns-to-scale, DRS denote diminishing returns-to-scale and CRS denotes constant returns-to-scale. SD denotes standard deviation.
As far as banks with minimum efficiency scores are concerned, B2 Bank was found to be the bank with minimum technical efficiency score in almost all the years except the year 1993-94. Further, B2 Bank is found thirteen times to be the bank with minimum pure technical efficiency score in the year 1993-94 and 1997 onwards. B8 Bank registered on thrice times with the minimum technical efficiency score in the years 1992-93, 1993-94 and 1996-97. B4 Bank registered on four occasions the minimum scale efficiency score in the years 1991 while B6 and B2 Bank noticed three occasions minimum scale efficiency score. Therefore, the results signify that the banks having most of times the minimum efficiency scores are not yet progressive in nature. So, these banks will have to incorporate substantial changes in their policies to keep in line with international standards. After analyzing it is evident that most of the banks included in the sample are operating at below their optimal level and experiencing increasing returns to scale.
ConClusion Over the years, RRBs have proved to be the most active agencies in the process
of strengthening rural economy by purveying credit and mobilizing deposits from rural areas through their vast network even in the remotest areas of the country. Though the regional rural banks have faced a great threat initially, the introduction of financial sector reforms and other policy initiatives (including recapitalization) by Government of India, Reserve Bank of India and other agencies concerned for strengthening the financial position of regional rural banks have resulted in perceptible improvement in the functioning of these banks. Evidence from the above, regional rural banks are thus required to devote utmost attention to their performances to meet global aspirations. This study is an attempt in this direction to analyze the performance of banks in terms of technical, pure technical and scale efficiency during the post-reforms period spanning from 1992-1993 to 2008-2009 by using non-parametric technique of data envelopment analysis. The present study followed an intermediation approach to select input and output variables.
The inputs vector contains two inputs viz; interest expenses and operating expenses while output vector contains three outputs viz; deposits, investment and
PRERANA March 2012
10 Versha Mohindra and Gian Kaur
advancess. The aforementioned conclusions portray that over the period from 1993 to 2009, regional rural banks have experienced technical efficiency to the tune of about 92 percent. Thus the banks can on an average decrease their inputs by 8 percent and still can produce the same level of output. The comparative analysis of average OTE scores of all 14 regional rural banks between distinct periods show that the degree of input waste was 7 percent in first generation reforms period, increased to 8 percent in second generation reforms period. The results imply that technical inefficiency has showed down in response of deregulatory policies. The decomposition of overall technical efficiency into two components namely pure technical efficiency and scale efficiency provided the evidence that 5 percentage points of overall technical inefficiency is due to managerial in capabilities in utilizing critical inputs, while remaining part of the overall technical inefficiency may be attributed to the choice of sub optimal scale of operation. The empirical findings also provide the evidence of positive relationship among scale economies and bank size. The analysis also shows that most of the banks included in the sample are operating at below their optimal level and tend to enjoy scale economies. Thus, the results suggest that there is decisive need to allow the regional rural banks to grow out and face the realities of the world. These banks have to equip themselves with suitable strategies by analyzing their strengths and weakness in comparison with others players in the market. Among the various options explored included merger/amalgamation, change of sponsor banks, balance sheet strengthening and methods for improving profitability of regional rural banks. These options are just complementary to each other and are not mutually exclusive, but. In addition, banks should take concrete steps to improve managerial efficiency and increase their size through their technical efficiency and scale economies. Only then regional rural banks can capable of meeting the growing requirements of rural India.
ReFeRenCes Bagachi, K. K., and Hadi, A. (2006), Performance of Regional Rural Banks in West Bengal: An Evaluation, New Delhi: Serials Publications.
Banker, R. D., Charnes, A. and Cooper W. W. (1984), Some Models for Estimating Technical and Scale Inefficiencies in Data Envelopment Analysis. Management Science, 30(9), 1078-1092.
Bhattacharyya, A., Lovell, C. A. K. and Sahay, P. (1997), The Impact of Liberalization on the Productive Efficiency of Indian Commercial Banks. European Journal of Operational Research, 98(4), 332-345.
Chakrabarti, R. and Chawla, G. (2005), Banking Efficiency in India since the Reforms. Money and Finance, 9(2), 31-47.
Charnes, A., Cooper, W. W., and Rhodes, E. (1978), Measuring the Efficiency of Decision Making Units. European Journal of Operational Research, 2(6), 429-444.
De, P. K. (2004), Technical efficiency, Ownership and Reforms: An Econometric Study of Indian Banking Industry. Indian Economic Review, 39(1), 261-294.
Hosamani, S. B. (2002), Performance of Regional Rural Banks, New Delhi: Anmol Publications.
PRERANA March 2012
Versha Mohindra and Gian Kaur 11
Jagadeesha, D. M., Murthy, S. and Sadath, H. G. (1990), Performance of Tungabhadra Grameen Bank (Regional Rural Bank) in Karnataka-An Economic Analysis. Agricultural Banker, 13(3), 35-41.
Kaur, G. and Sharma, J. (2005-06), Technical Efficiency and Scale Economies of Commercial Banks in Pre-and Post-Liberalization Period. Indian Journal of Quantitative Economics, 15(2), 20-21.
Khankhoje, D. and Sathye, M. (2008), Efficiency of Rural Banks: The Case of India. International Business Research, 1(2), 140.
Kumar, S. and Gulati, R. (2008), An Examination of Technical, Pure Technical and Scale Efficiencies in Indian Public Sector Banks using Data Envelopment Analysis. Eurasian Journal of Business and Economics, 1(2), 33-69.
Kumar, S. and Verma, S. (2003), Technical Efficiency, Benchmarks and Targets: A Case Study of Indian Public Sector Banks. Prajnan, 31(4), 275-299.
Mohindra, V. and Kaur, G. (2011), Efficiency of Regional Rural Banks in India: An Application of Data Envelopment Analysis. Economic Affairs, 56(2), 187-196.
Mukherjee, A., Nath, P. and Pal, M.N. (2002), Performance, Benchmarking and Strategic Homogeneity of Indian Banks. International Journal of Bank Marketing, 20(3), 122-139.
Noulas, A. G., and Katkar, K.W. (1996), Technical and Scale Efficiency in the Indian Banking Sector. International Journal of Development Banking, 14(2), 19-27.
Parmar, G. D. (1986), Performance of Banaskantha Mehsana Grameen Bank in Gujarat State. Agricultural Banker, 11(3), 24-29.
Pati, A. P. (2005), Regional Rural Banks in Liberalized Environment with Special Reference to North East India. New Delhi: Mittal Publication.
Prasad, T. S. (2003), Regional Rural Banks: Performance Evaluation. Kurukshetra, 51(10), 20-24.
Reddy, A. A. (2005), Productivity Growth in Regional Rural Banks. Economic and Political Weekly, 41(11), 1079-1085.
Saha, A. and Ravishankar, T.S. (2000), Rating of Indian Commercial Banks: A DEA Approach. European Journal of Operational Research, 124,187-203.
Sangwan, S. S. (1989), Viability of Rural Credit Structure: A Case Study of Regional Rural Banks. Pranjan, 18(2), 213-223.
Sherman, H. D. and Gold, F. (1985), Bank Branch Operating Efficiency: Evaluation with Data Envelopment Analysis. Journal of Banking and Finance, 9(2), 297-315.
Singh, J. P. (1992), Performance of Regional Rural Banks-A Case Study of GSP-ASR Regional Rural Bank. Strategic Management of Rural Sector, New Delhi: Akashdeep Publishing House.
Sudhakar, H. R., Venkataraman J. V., and Nagaraj G. N. (1984), An Evolution of Performance of Regional Rural Banks in Mysore District, Karnataka. Financing Agriculture, 16(2), 28-30.
Yadappanavar, A., and Nath, B. R. (2003), Development Strategies of RRBs - A Successful Case Study of Aurangabad and Jalna Gramin Bank in Maharashtra – A Report. Anvesak, 33(13), 24-45.
PRERANA March 2012
12 Versha Mohindra and Gian Kaur
APPenDix 1: list oF sAmPle BAnks
SNo Code No Bank Name Sponsor Bank State
1 B1 Ballia Kshetriya Grameen Bank Central Bank of India Uttar Pradesh
2 B2 Ellaquai Dehati Bank State Bank of India Jammu and Kashmir
3 B3 Gurgaon Grameen Bank Syndicate Bank Haryana
4 B4 Himachal Grameen Bank Punjab National Bank Himachal Pradesh
5 B5 Jammu Rural Bank Jammu and Kashmir Bank Jammu and Kashmir
6 B6 Marathwada Grameen Bank Bank of Maharashtra Maharashtra
7 B7 North Malabar Grameen Bank Syndicate Bank Kerala
8 B8 Pandyan Gramya Bank Indian Overseas Bank Tamilnadu
9 B9 Prathama B Bank of Baroda Uttar Pradesh
10 B10 Rewa Sidhi Grameen Union Bank of India Madhya Pradesh
11 B11 Sharda Grameen Bank Allahabad Bank Madhya Pradesh
12 B12 Surguja Kshetriya Grameen Bank Central Bank of India Chattisgarh
13 B13 Tripura Grameen Bank Union Bank of India Tripura
14 B14 Uttar Banga Kshetriya Grameen Bank Central Bank of India West Bengal
PRERANA March 2012
Rajesh C. Jampala, P. Adi Lakshmi and O.A.R. Kishore 13
A stuDy on the WoRk RelAteD stRess Among the BAnking, FinAnCe AnD insuRAnCe seCtoRs emPloyees in kRishnA
DistRiCt, AnDhRA PRADeshRajesh C. Jampala1, P. Adi Lakshmi2 and O.A.R. Kishore3
ABstRACtThe Modern world, which is said to be a world of achievements, is also a
world of stress. We find stress everywhere, whether it be within the family, business organization or any other social or economic activity. Right from the time of birth till the last breath draws, an individual is invariably exposed to various stressful situations. Stress is experienced by every person of any age and gender. The interest in the issue has been rising especially in the present century which is been called as the ‘Age of Anxiety and Stress’. High Levels of Stress experienced by individuals could result in high blood pressure, accident proneness, irritability and difficulty in making decisions. The present study measures occupational stress with HSE indicator tool. The differences among the various employees based on different demography’s including sector, gender, qualification, industry and experience has been analysed. The correlations among various factors causing stress including demand, control, manager support, peer support, relation, role and change factors are explored.
intRoDuCtionOver the past three decades there been a growing belief in all sectors of
employment and in government that the experience of stress at work has undesirable consequences for the health and safety of individuals and for the health of their organizations. This belief has been reflected both in public and media interest and in increasing concern voiced by the trades unions, and professional and scientific bodies. Stress is not always negative. It has positive impact too. Each individual needs a moderate amount of stress to be alert and capable of functioning effectively. It may prove as an asset so long as it is tolerable and helps in creating healthy competition. Organizational excellence and individual success are achieved through well managed stress.
1 Rajesh C. Jampala, Professor and Head, Department of Commerce and Business Administration, P.B. Siddhartha College of Arts & Science, Vijayawada, Andhra Pradesh, India, 520 010. E-mail: [email protected], Handset: 9866806069.
2 Prof. P. Adi Lakshmi, Professor and Head, Department of Business Administration, P.V.P. Siddhartha Institute of Technology, Kanuru, Vijayawada, Andhra Pradesh, India, 520 007. E-mail: [email protected], Handset: 9491348818
3 O. A. R. Kishore, Assistant Professor, Department of Business Administration, P.V.P. Siddhartha Institute of Technology, Kanuru, Vijayawada, Andhra Pradesh, India, 520 007. E-mail: [email protected], Handset: 98856 30468
PRERANA March 2012
14 Rajesh C. Jampala, P. Adi Lakshmi and O.A.R. Kishore
The concept of Stress was introduced in the life Sciences by Hans Selye in 1936. It is a concept borrowed from the natural sciences, derived from the Latin Word ‘Stingere’. Stress was popularly used in the seventeenth century to mean hardship, strain, adversity or affliction. In Psycho-Physiology stress refers to some stimulus resulting in a detectable strain that cannot be accommodated by the organism and which ultimately results in impaired health or behaviour. Stress can arise from opportunity, demand, constraint, threat or challenge when the outcome of the event is both important and uncertain. Employees in many countries increasingly complain about high and rising levels of stress at work. As stress levels have increased, employers have faced rising medical bills, more accident insurance claims, increased absenteeism, and declining morale. Work stress and related conditions are the most commonly reported work-related ill-health problems in companies.
The average length of stress-related absences in the United States is four times higher than for absences resulting from workplace accidents and occupational diseases (Webster and Bergman, 1999). As a result, we can assume that the cost of absenteeism due to stress is correspondingly higher. Another study by Anderson et al., (2000) shows that stress accounts for the highest percentage of health insurance costs ($6.2 billion and 7.9% of health costs) among 46,026 survey respondents from six large American companies. In Great Britain, it is estimated that half a million people are suffering from work-related stress, anxiety or depression. Nearly 10% of the UK's gross national product (GNP) is lost each year due to work-related stress. An estimated 12.8 million working days were lost in Britain in 2003-04 as a result of work-related stress (Health and Safety Executive, 2004).
Service sector today is playing an important role in the nation’s development and for the substantial growth in GDP. The private sector growth in the Banking, Financial and Insurance sector changed the way of providing services. Thousands of employees were recruited and trained to market their services. The high employee turnover rate, absenteeism rates and sickness are faced by the sales executives and other employees in various hierarchical levels in service sector caused due to severe stress.
imPoRtAnCe oF the stuDy
Research in the area of stress is important for two reasons. First, stress is an independent variable influencing employee satisfaction and performance. Second, it is incumbent on management to improve quality of life of organizational members. As stress is linked to coronary heart disease, a reduction in stress is expected to improve longevity of workforce.
PRERANA March 2012
Rajesh C. Jampala, P. Adi Lakshmi and O.A.R. Kishore 15
oBJeCtiVes oF the stuDyThe general aim of the study is to find levels of work related stress among
Banking, Finance and Insurance sector employees and identify the various copying styles used by the employees. The objectives in specific are
1. To study the stress levels among the different employee groups such as men and women; qualified and unqualified; experienced and inexperienced managers
2. To indentify the differences in the stress level among public and private sector employees
ReVieW oF RelAteD ReseARChContemporary research on psychological stress emerged more than half
a century ago, stimulated by the desire to understand breakdowns in adaptive behavior observed in extreme situations. Situations that were of immediate concern at that time included military combat (Grinker and Spiegel, 1945), the concentration camp (Bettelheim, 1943), bereavement (Lindemann, 1944), and traumatic injury (Hamburg, Hamburg, and DeGoza, 1953). The disturbances in functioning that had been observed were often as dramatic as extreme situations themselves and included psychotic behavior, severe anxiety, bleeding ulcers (Paster, 1948; Swank, 1949), and hypertension. There are several studies done in various aspects of stress drawn from the theoretical aspects of stress. Some of them are discussed below. organizational structure and Change: Sheila Panchal and Susan Cartwright (2001) found that group differences in both sources and effects of stress existed and concluded that group differences in response to large-scale organizational change are prevalent and the group context of the situation should be recognized and explored by managers in change situation.interpersonal Relationships: Viswesvaran et al., (1999) confirmed the presence of three general constructs (stressors, strains and social support). Their results indicated that social support had a threefold effect on work stressor-strain relations.Role in organization: Avinash Kumar (2006) revealed strong positive correlations between each pair of ten types of role stressors except that ‘role erosion’ was not significantly related to ‘role overload’. ‘Role erosion’ was found to be the most prominent stressor. Organizational Hierarchy: Agrwal (1998) revealed that those who perceived themselves to be close to management were satisfied and less stressed than those who did not perceive themselves to be close to the top management.stress and sector differences: Study by Aminabhavi et al., (1999) revealed that the non nationalized bank employees reported significantly more stress than nationalized bank employees and the prominent stress factor is low status.
PRERANA March 2012
16 Rajesh C. Jampala, P. Adi Lakshmi and O.A.R. Kishore
stress and length of service: Bala Koteswari (2004) in his study found that total stress experienced is more in employees with less length of service and employees with less length of service face stress due to interpersonal and personal competency factors. stress and gender differences: Subbalakshmi (2002) assessed that organizational stress in male and female teachers. It was noted that the proportion of teachers high and low on organizational stress did not differ significantly as function of gender. Parker et al., (2002) found that for men, levels of gender harassment and over performance demands were lower than for women.Profession and stress: Upadhyay and Singh (1999) in their study found that the overall stress level of the groups did not differ significantly and both the groups experienced a moderate level of stress. Whereas executives experienced significantly more stress on role overload and college teachers experienced a higher level of stress on intrinsic impoverishment and low status. social support and stress: Viswesvaran, et al., (1999) in their study indicated that social support had a three fold effect on work stressor-strain relations. Social reduced the strains experienced, social support mitigated perceived stressors, and social support moderated the stressor-strain relationship
ReseARCh methoDologyThe study was descriptive in nature and Normative Survey method is chosen
by the researcher. The researcher has chosen the stratified random sampling method for the present study. Under stratified sampling the population is divided into several sub-populations that are individually more homogeneous than the total population which are called stratums and then to select items from each stratum to constitute a sample. The respondents were drawn from Banking, Finance and Insurance sectors. The size of the sample is 240. The objective of the study was to assess the stress levels. The questionnaire used for the study was HSE Indicator tool (Health and Safety Executive Indicator Tool). The HSE Indicator tool was developed by the “Health and Safety Executive” a Government organization to look after the working conditions in United Kingdom. The tool was developed by Clarke (2004). The Indicator Tool is a three point rating scale and comprises of 35-items. High rating indicates low stress while low score indicates high stress. The indicator tool comprises seven separate scales of Demand, Control, Managerial Support, Peer Support, Role and Relationships. The collected data was analyzed using statistical measures like Mean, ‘z’ test and one way ANOVA.
limitAtions oF the stuDy The survey method attempts to analyze the current phenomenon and have
short term validity. The validity of the study depends on the quality of response
PRERANA March 2012
Rajesh C. Jampala, P. Adi Lakshmi and O.A.R. Kishore 17
given by the respondents. As the sample is drawn from the select sectors, the results cannot be generalized to other sectors. Stress levels differ from place to place and culture to culture, so the results cannot be generalized to the employees of other states and nations.
AnAlysis AnD DisCussion
From the means of all the employees, it was observed that, employees are facing more stress in the areas of ‘demand’, ‘relations’ and ‘management support’. They are facing low stress in the areas of ‘role’, ‘peer support’ and ‘control’.
Table 1: Stress level among employees of public and private sector
Demand Control Managerial support Peer support Relation Role Change Total
*at 0.05 level of significance the table value is 1.960
Null Hypothesis 1: There is no significant difference between the stress levels of public and private sector employees.
It is observed from table 1 that employees of private sector are facing more stress than the employees of public sector. Significance difference in the stress levels has been observed in the demand, control, relation and role factors between the public and private sector employees.
Table 2: Stress level among employees of Banking, Finance and Insurance Sectors
Null Hypothesis 2: There is significance difference among the stress levels of employees of Banking, Insurance and Finance sector.
The employees of finance sector are facing high stress than the employees of banking and insurance sectors (table 2). The employees of banking sector are facing more stress than the employees of insurance sector. Significant difference has been observed in the demand, relation and change factors where employees working in the finance sector face more stress in the demand and relation factors and banking employees face more stress in the change factor.
PRERANA March 2012
18 Rajesh C. Jampala, P. Adi Lakshmi and O.A.R. Kishore
Table 3: Stress level among urban and rural employees
Locality Demand Control Managerial support
Peer support Relation Role Change Total
Urban Area 2.89 2.24 2.38 2.16 2.58 1.45 2.35 16.05
Rural Area 3.13 2.12 2.40 2.14 2.41 1.29 2.21 15.7
z’ test 2.28 1.21 0.16 0.17 1.27 1.92 1.21 0.74
*at 0.05 level of significance the table value is 1.960
Null Hypothesis 3: There is no significant difference between the stress levels of employees working in urban and rural areas.
Table 3 reveals that employees working in urban areas are facing little more stress than the employees working in rural areas. Significant difference has been observed in the demand factor only and employees working in rural areas face more stress than employees working in urban areas.
Table 4: Stress level among employees of varied Gender
Gender Demand Control Managerial support
Peer support Relation Role Change Total
Male 3.17 2.23 2.41 2.19 2.67 1.65 2.32 16.64
Female 2.91 2.45 2.44 2.25 2.60 1.57 2.38 16.6
z test 2.56 2.57 0.25 0.70 0.56 0.73 0.64 0.12
*at 0.05 level of significance the table value is 1.960
Null Hypothesis 4: There is no significant difference between the stress levels of male and female employees.
Table 4 reveals that men face little more stress than the women. Significant difference has been observed between men and women in the demand and control factors where men face more stress in the demand factor and women face more stress in control factor.
Table 5: Stress levels among employees of varied experience levels
Experience Demand Control Managerial support Peer support Relation Role Change Total
Less Experienced 3.29 2.38 2.39 2.21 2.85 2.01 2.33 17.46
*at 0.05 level of significance the table value of is 1.960
Null Hypothesis 5: There is a significant difference between the stress levels of experienced employees and employees with less experience.
PRERANA March 2012
Rajesh C. Jampala, P. Adi Lakshmi and O.A.R. Kishore 19
Employees with less experience face high stress than the experienced employees (table 5). Significance difference has been observed in the demand, relation and role factors between the experienced employees and employees with less experience, where employees with less experience are facing more stress.
Table 6: Stress levels among Marketing and Administrative staff
*at 0.05 level of significance the table value of is 1.960
Null Hypothesis 6: There is no significant difference between the stress levels of Marketing and Administrative staff.
It is evident from table 6 that marketing staff face high stress than the administrative staff. Significance difference has been observed in the demand and role factors only where marketing staff face more stress than administrative staff.
Table 7: Comparison of stress levels among Graduates, Post Graduates and Professional degree holders
Educational qualification Demand Control Managerial
Professional Degree 3.28 2.24 2.55 2.36 2.81 1.91 2.44 17.59
ANOVA 1.93 0.14 1.79 2.26 5.36 4.8 0.82 4.856
F (0.05,2,α) Table value is 2.9957
Null Hypothesis 7: There is a significant difference among the stress levels of graduates, post graduates and professional degree holders.
Employees having a professional degree are facing more stress than employees who are graduates and postgraduates. Graduates are facing more stress than post graduates. Significance difference has been observed among the employees having different qualifications in the role and relation factors, where the professional degree holders face more stress than their counterparts.
PRERANA March 2012
20 Rajesh C. Jampala, P. Adi Lakshmi and O.A.R. Kishore
Table 8: Correlation among various factors
Demand Control Managerial support Peer support Relation Role Change
Demand 1 0.057 -0.092 0.033 0.456** 0.055 -0.002
Control 0.057 1 0.343** 0.316** 0.189** 0.382** 0.358**
Manager Support -0.092 0.343** 1 0.522** -0.051 0.210** 0.489**
Peer Support 0.033 0.316** 0.522** 1 0.104 0.253** 0.493**
** Correlation is significant at the 0.01 level (2-tailed).
Correlation results shows that control and role factor has significant correlation with all other factors except with demand which infers that employees who can control his work and have role clarity can have more control over other factors causing stress. Demand factor has significant correlation only with relation factor which indicates demand is an independent factor that is influencing or influenced by other factors of stress.
ConClusionThe study reveals that private sector employees are facing more stress than
public sector employees in all the seven factors of stress. The highly stressed groups among the private sector are professional degree holders, employees working in banks and employees with more experience. Professional degree holders are in the top three stressed group among different variables in five out of seven factors of stress. The reason identified was the professional degree holders are having positions as team leaders who are responsible for the team performance. The low stressed groups among the variables are public sector employees who are post graduates. The marketing staffs of public sector particularly in insurance are enjoying flexibility of timings, easy targets as LIC is well known brand. Post graduates are having good peer support and relations as their stress is low in these respects. Though a minimum level of stress is essential for optimum performance, organizations must take undue care that stress lies at the threshold level and does not turn to be detrimental to the performance of the employees. Measures to combat stress like yoga, counseling sessions, motivational talks could be arranged to make employees realize the mechanism to manage stress. Recreation halls could be provided where employees could meet their peers discuss and resolve ways to manage work and their stress which in turn would pave way for team work and enhance collegiality at the work place.
PRERANA March 2012
Rajesh C. Jampala, P. Adi Lakshmi and O.A.R. Kishore 21
ReFeRenCesAgrawal, Krishna, (1998), Job satisfaction and occupational stress in relation to felt proximity with top management. Indian Journal of Psychometry and Education, 29(2), 113-114.
Ambavani, Vijayalaxmi, A., and Triveni. (2000), Variables causing occupational Stress in nationalized and non nationalized bank employees. Journal of Community Guidance and Research, 17(1), 20-29.
Avinash Kumar Srivastav (2006), Role Stress in the Public Sector: An empirical study. Management and Change. 10(1).
Anderson, D. R., Whitmer, R. W., Goetzel, R. Z., Ozminkowski, R. J., Dunn, R. L., Wasserman, J., (2000), The Relationship Between Modifiable Health Risks and Group-level Health Care Expenditures. Health Enhancement Research Organization (HERO) Research Committee. American Journal of Health Promotion 15(1), 45-52.
Balakoteswari, V. (2004), A study on the Occupational Stress and Coping measures with reference to Gender and Length of Service, Unpublished Doctorial Theses, Sri Venkateswara University.
Bettelheim, B. (1943), The informed heart: Autonomy in a mass age. New York: Free press.
Clarke, S. D. (2004), Development of an Indicator tool to support the Stress Management standards, M.Sc. Statistics Dissertton, Sheffield Hallam University.
Grinker, R.R. and Speigel, J .P. (1945), Men under stress. New York: McGraw Hill.
Hamburg, D. A., Hamburg, B., and DeGoza, S. (1953), Adaptive problems and mechanisms in severely burned patients. Psychiatry, 16, 1-20.
Health and Safety Statistics Highlights 2003/04. Available at www.hse.gov.uk /statistics/overpic. html
Lindemann, E. (1944), Symptomatology and management of acute grief. American Journal of Psychiatry, 101, 141-148.
Paster, S. (1948), Psychotic reactions among soldiers of world war II. Journal of Nervous and Mental Disease, 108, 54-66.
Robbins, S.P. (2003), Organisational Behaviour, Prentice-Hall of India Private Limited, New Delhi, 11th ed, 557.
Sheila Panchal and Susan Cartwright (2001), Group differences in post merger stress, Journal of Managerial Psychology, 16(6), 424-433.
Subbalakshmi, N. (2002). Organisational stress characteristics of Bengali Medium secondary school teachers. The Educational Review, 45(6), 97-99.
Swank, R.L. (1949) Combat exhaustion. Journal of Nervous and Mental Disease, 109, 475-508.
Viswersvaran, Chockalingam, Sanchez, Juan I. and Fisher, Jeffrey (1999), The role of social support in the process of work stress: A meta-analysis. Journal Vocational Behaviour, 54(2), 314-334.
Upadhyaya, B.K., and Singh, B. (1999), Experience of Stress: Differences between college teachers and executives. Psychological Studies, 44(3), 65-68.
Viswesvaran , C., Sanchez , J. I. and Fisher, J. (1999). The role of social support in the process of work stress: A meta-analysis. Journal of Vocational Behavior, 54(2), 314-334
Webster, T., and Bergman, B. (1999), Occupational Stress: Counts and Rates. Compensation and Working Conditions, 4(3), 38-41.
PRERANA March 2012
22
PRERANA March 2012
Uma Seshadri and Debendra Kar 23
WoRk liFe ConFliCt AnD FlexiBle WoRk ARRAngements thAt AiD WoRk liFe BAlAnCe: PeRCePtion oF WoRking
Women in DuAl CAReeR FAmiliesUma Seshadri1 and Debendra Kar2
ABstRACtWomen in India still receive strong social messages from early childhood that they
are primarily responsible for family wellbeing. The present study reveals the results of a survey among working women in dual career families in a metro/cosmopolitan city in South India. Their perceptions on work-life conflict and flexible work arrangements from employers are addressed. It is expected that accommodating such expectations provides an employer the competitive edge in attracting and retaining the best talent.
intRoDuCtion
Most people divide their time between work and family, the two main pillars of an individual's life. It is also important to note that the first ten years or so after graduation is the period when an individual simultaneously builds up the foundation of both career and family. Work-life conflict in present day nuclear family scenario in urban India has disruptive influence on both career and family. Organizational policies, if any, have been in general more in favor of working men rather than working women (Ujvala Rajadhyaksha and Swati Smita, 2004). Organizational policies that cater to the aspirations of women employees could likely provide a competitive advantage to the organization in attracting and retaining the best talent.
Family is central to the Indian society and children receive strong messages from early years reinforcing this concept. As a social manifestation, India has the lowest divorce rate in the world, signifying the role family plays in an individual's life. The crude literacy rate for females in India has increased by 12 percent as against just 8 percent for males in the last decade (i.e. 2001-11, Census, 2011). While more and more women are getting educated and entering the organized workforce in urban India, Indian women are still expected to be primarily responsible for raising the family. They grow up on such high expectations and thus face significant work-family conflict. Worldwide too, women invest more time in family related activities compared to their male colleagues (Cinamon and Rich, 2002). In India, women work force constitutes more than 40% and their work life
1 Uma Seshadri, C/o Prof. P. Seshu, Scientist-in-Charge, CSIR Center for Mathematical Modelling and Computer Simulation, NAL Belur Campus, Wind Tunnel Road, Bangalore - 560 037. E-mail: [email protected], Handset: 9620608196
PRERANA March 2012
24 Uma Seshadri and Debendra Kar
balance related issues are somewhat different from the West. Understanding Indian working women executives’ perception has therefore become an area of interest to study. Work life balance issues of career women who are part of dual earner families, has become a challenging area of study for the research community.
The aim of the present investigation on working women in dual career families is therefore to ascertain their perceptions about the organizational policies that aid achieving a better work-life balance within the Indian context. Research paper investigates in detail the factors influencing expectations of work demands, their ability to continue in work force and sustain a good work life balance. Thus, the primary purpose of this investigation is to determine the extent to which organizational support is perceived to be predictive of work life balance in a sample of working women in dual career families.
ReVieW oF liteRAtuRe
Work Life Conflict: The research study on work and family issues in India, from a psychosocial perspective, by Promilla Kapur (1970) can be considered as one of the first research works in the area of work life conflict. Her paper revealed an important issue that men were open to working women as their partners but they were not prepared to consider the changes in expectations and behavior that this called for. Study by Kala Rani (1976) revealed that the stress in Indian working women is more due to their inability to perform their traditional role in the family (as wife and home maker) due to lack of time and energy.
For dual career couples, both work and family are two important domains. Work-family conflict has been linked to many personal and organizational outcomes such as employee mental health disorders (Grzywacz and Bass, 2003) and physical health problems (Allen and Armstrong, 2006). A spouse who works longer work hours not only has less time to contribute to joint tasks at home, but can also transmit his or her higher work related stress to the other partner (Lavee and Ben-Ari, 2007).
Organizational support: Employee friendly policies and programs: In Indian traditional family framework, even dual earner couples will need to manage both home and work jobs, which include running a household and raising children. Thus women in dual-earner families tend to spend more time on household chores on workdays than do men and have to bear the major responsibility for household and childcare matters although work-life conflict is an issue for both sexes (Lee-Gosselin and Grise, 1990; Posig and Kickul, 2004). This calls for organizational support and progressive policies in order to help cope with conflicts that arise from work or family (Hall and Liddicoat, 2005). Organizations will thus need to align the needs of the business with the needs of the employees including dual career couples
PRERANA March 2012
Uma Seshadri and Debendra Kar 25
while soliciting the cooperation and commitment of all employees to help achieve the corporate objectives through employee friendly policies.
sCoPe oF the stuDyScope of the study involves gathering of opinion of working women in
dual career families on work life balance variables and organizational support required from employers. The research study is conducted to find out the influence of organizational policies on work life balance factors of working women in dual career families, in a typical metropolitan city.
oBJeCtiVes oF the stuDy1. To study the relationship between work life balance factors and
organizational flexi policies2. To identify and assess the influence of organization policies on work life
balance factors
methoDologyThe study employed a pluralist research design. Two types of respondents
were used for this research study. In the first part, qualitative interviews were administered with fifteen experienced working women who have more than 20 years of experience in managing both work and family. Aim of the interviews was to gain feedback on the questionnaire formulation and appropriate factors to be considered for work life balance. Subsequently, quantitative survey (based on anonymous questionnaire filling) was distributed to working women in a met ropol i tan c i ty. Of the 280 women who have been administered the questionnaire, 185 returned filled questionnaires with complete data indicating slightly more than two-thirds response rate. The questionnaire items were adapted from Hayman (2005) and Higgins et al., (2008) after modifying them appropriately to suit the Indian family context. Participants indicated their response on a five-point Likert scale ranging from (1) strongly disagree to (5) strongly agree. The work-life conflict variables used in the questionnaire and the items used for flexibility in work arrangement are given in Tables 1 and 2.
Table 1: Work Life Conflict (WLC) Variables
WLC1 Personal life will not suffer because of office work
WLC2 Will have happy personal life because of my job
WLC3 Work hard towards managing both job and family
WLC4 Spend more time on family responsibilities and be happy
WLC5 Family life will not drain me of energy for job
WLC6 Office work will not suffer because of personal life
PRERANA March 2012
26 Uma Seshadri and Debendra Kar
Table 2: Organizational policies promoting Flexi Work Arrangements (FWA)
FWA1 Paid leave whenever required
FWA2 Interrupt office work for family reasons and then go back to office
FWA3 Change office work hours if required
FWA4 Provide flexibility to arrange different work schedule (i.e. Shifts, overtime) to meet Personal/family commitments
FWA5 Policies to support attending course or conference if required
FWA6 Working home at home whenever children get back from school
FWA7 Support some of regular work day working from home
FWA8 On-site day care (child care facility supported by office)
FWA9 Child care referral service as a scheme
FWA10 Elder care referral service
FWA11 Support flexible job / work arrangements
FWA12 Tele-work arrangements
FWA13 Supportive relocation policies in case spouse is working in a different city
FWA14 Unpaid LOA (leave of absence)
FWA15 Psychological/health care counseling
AnAlysis AnD DisCussion
Null Hypothesis: There is no relationship between organizational policies promoting flexi work arrangements and work life conflict of working women in dual career families.
As shown in Table 3, the respondents who have joint family structure contributed to just about 20%, indicating the prevalence of nuclear families and families with elderly care responsibilities predictably contributed about 20%. Women who have had both their parents working constitute only about 25%, while this percentage would be much higher for current generation. Thus high prevalence of dual career couples is a recent phenomenon and together with the breakdown of joint family structure and simultaneous emergence of nuclear family structure, work-life balance issues are brought into sharper focus.
Working women do consider family to be a crucial component of their life. While an overwhelming 93% of the respondents agree to varying extents that they would work hard to manage both work and family, a marginally smaller percentage (88.6%) would not mind spending more time on fulfilling their family responsibilities as they perceive this as a source of individual's happiness. This is indicative of the strong feminism in Indian social fabric, especially among women. However working women are well aware of the demanding nature of family life and hence the respondents are divided and less enthusiastic about whether fulfilling family responsibilities still leaves them with enough energy for office work.
PRERANA March 2012
Uma Seshadri and Debendra Kar 27
Table 3: Demographic Variables
Dual Career Parents Joint family Elderly Care
Yes No Yes No Yes No
25% 75% 19.8% 80.2% 20.4% 79.6%
Table 4: Correlation between Work Life Conflict and Flexible Work Arrangements
Expectation of achieving an effective work-life balance is strongly correlated to their expectations of organizational policies that permit flexible work arrangements. In the Indian context, family is not limited to just the married couple or their children but includes even the elders in the family and often relatives too. Even with the emergence of nuclear families, the sense of responsibility to take care of elders in the family is still prevalent. In particular, employees' anticipated work-life balance is strongly predicated on their ability to interrupt office work to attend to family matters and return to work; ability to arrange a convenient work schedule; provision to work partially from home; provision to take leave whenever needed; provision of child care as well as elderly care facilities etc. The analysis of their responses has shown a strong association between these variables which is significant at 0.05 level as indicated in Table 4.
More than 90% of the dual career working women who participated in the survey indicated their expectation that the organization would permit them to attend advanced courses and/or conferences. This is suggesting strongly that they would like to continuously advance their knowledge and skill set after their college days and remain professionally active. They expect to strike an appropriate work-life
PRERANA March 2012
28 Uma Seshadri and Debendra Kar
balance and expect that their organization will support them achieve this through progressive HR policies.
Less than two-thirds of the respondents expect that their prospective employer would permit them to take paid leave whenever they need. Nearly 90% of the respondents expect to have some form of child-care schemes / facilities provided by their prospective employer. Nearly three-fourths preferred to have the flexibility to return to office work after temporary interruption to attend to familial responsibility. However, about 45% of the respondents seek sufficient unpaid leaves to be permitted to take care of contingencies. Nearly 90% of the respondents also expect their prospective employers to provide for some form of elderly care facility, indicative of the social milieu to which they belong and the societal expectations/demands on an Indian family.
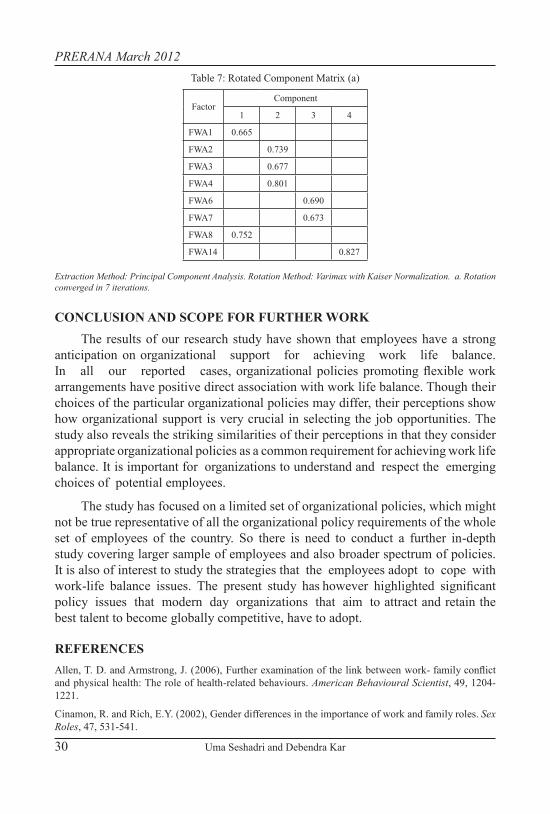
The underlying message that the present generation working women expect to be actively engaged in professional pursuits while taking care of their families is hard to miss. This is also corroborated by their response to the item on whether they expect to be at home when their children get back from school, a typical role-identifier for mothers in Indian society. Nearly half of the respondents are ambivalent in their response ("rarely-sometime-often" rather than a strong "very often"). Moreover, nearly 70% of the respondents expect to be permitted to change their work-hours or have flexibility in work schedule to suit changing demands at home rather than a rigid 9-5 workday.Factor analysis: The factors of the organizational policies were treated to factor analysis. Factor analysis, a statistical analysis tool, was used as a data reduction method. KMO and Barlett test was conducted to reveal adequacy of sampling and validity of factor analysis. The results revealed a Chi-square value of 833.588 with 105 as degrees of freedom and 0.000 level of significance. Kaiser-Meyer-Olkin measure of sampling adequacy value was 0.833 revealing the validity of factor analysis. The results are shown in Table 5. Extraction was done using principal component analysis whereas rotation was done using varimax with Kaiser normalisation techniques. Results of factor analysis are depicted in Tables 6 and 7. Based on factor analysis reduction method, factors are classified into four components. They are as follows:
1. Two components were loaded on factor one. It has been labeled as External Support
2. Three components were loaded on factor two. It has been labeled as Time Flexibility
3. Two components were loaded on factor three. It has been labeled as Work from Home
4. One component was loaded on factor one. It has been labeled as Unpaid leave support
PRERANA March 2012
Uma Seshadri and Debendra Kar 29
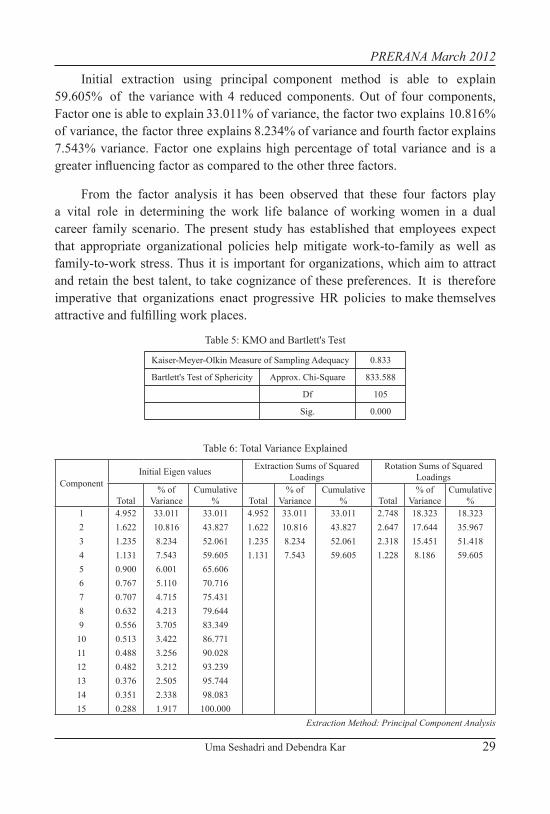
Initial extraction using principal component method is able to explain 59.605% of the variance with 4 reduced components. Out of four components, Factor one is able to explain 33.011% of variance, the factor two explains 10.816% of variance, the factor three explains 8.234% of variance and fourth factor explains 7.543% variance. Factor one explains high percentage of total variance and is a greater influencing factor as compared to the other three factors.
From the factor analysis it has been observed that these four factors play a vital role in determining the work life balance of working women in a dual career family scenario. The present study has established that employees expect that appropriate organizational policies help mitigate work-to-family as well as family-to-work stress. Thus it is important for organizations, which aim to attract and retain the best talent, to take cognizance of these preferences. It is therefore imperative that organizations enact progressive HR policies to make themselves attractive and fulfilling work places.
Table 5: KMO and Bartlett's Test
Kaiser-Meyer-Olkin Measure of Sampling Adequacy 0.833
Bartlett's Test of Sphericity Approx. Chi-Square 833.588
Df 105
Sig. 0.000
Table 6: Total Variance Explained
ComponentInitial Eigen values Extraction Sums of Squared
Extraction Method: Principal Component Analysis. Rotation Method: Varimax with Kaiser Normalization. a. Rotation converged in 7 iterations.
ConClusion AnD sCoPe FoR FuRtheR WoRkThe results of our research study have shown that employees have a strong
anticipation on organizational support for achieving work life balance. In all our reported cases, organizational policies promoting flexible work arrangements have positive direct association with work life balance. Though their choices of the particular organizational policies may differ, their perceptions show how organizational support is very crucial in selecting the job opportunities. The study also reveals the striking similarities of their perceptions in that they consider appropriate organizational policies as a common requirement for achieving work life balance. It is important for organizations to understand and respect the emerging choices of potential employees.
The study has focused on a limited set of organizational policies, which might not be true representative of all the organizational policy requirements of the whole set of employees of the country. So there is need to conduct a further in-depth study covering larger sample of employees and also broader spectrum of policies. It is also of interest to study the strategies that the employees adopt to cope with work-life balance issues. The present study has however highlighted significant policy issues that modern day organizations that aim to attract and retain the best talent to become globally competitive, have to adopt.
ReFeRenCesAllen, T. D. and Armstrong, J. (2006), Further examination of the link between work- family conflict and physical health: The role of health-related behaviours. American Behavioural Scientist, 49, 1204-1221.
Cinamon, R. and Rich, E.Y. (2002), Gender differences in the importance of work and family roles. Sex Roles, 47, 531-541.
PRERANA March 2012
Uma Seshadri and Debendra Kar 31
Grzywacz, J. G., and Bass, B. L. ( 2003), Work, family, and mental health: Testing different models of work–family fit, Journal of Marriage and Family, 65, 248–261.
Hall, L., and Liddicoat, L. (2005), Challenges to developing effective family friendly work practices: Findings from New Zealand. Research and Practice in Human Resource Management, 13(1), 1-17.
Hayman, J. (2005), Psychometric Assessment of an Instrument Designed to Measure Work Life Balance. Research and Practice in Human Resource Management, 13(1), 85-91.
Higgins, C., Duxbury, L., and Lyons, S. (2008), Report 5: Reducing Work-Life Conflict: What Works? What Doesn’t? Ottawa: Health Canada.
Kala Rani (1976), Role Conflict in Working Women, Chetana Publications, New Delhi.
Kapur, P. (1970), Marriage and the Working Women in India, Vikas Publications, New Delhi.
Lavee, Y. and Adital Ben-Ari (2007), Relationship of Dyadic Closeness With Work- Related Stress: A Daily Diary Study. Journal of Marriage and Family, 69(4), 1021–1035.
Lee-Gosselin, H. and Grise, J. (1990), Are Women Owner-Managers Challenging our Definitions of Entrepreneurship? An In-Depth Survey. Journal of Business Ethics, 9, 423-35.
Posig, M. and Kickul, J. ( 2004), Work-role expectations and work family conflict: Gender differences in emotional exhaustion. Women in Management Review, 19(7), 373-386.
Ujvala Rajadhyaksha and Swati Smita (2004), Tracing a Timeline for Work and Family Research in India. Economic and Political Weekly, April 24.
PRERANA March 2012
32
PRERANA March 2012
Purna Prabhakar Nandamuri and K.V. Rao 33
A CRoss seCtionAl AnAlysis oF stuDent PARtiCiPAtion in leARning PRoCess
Dr. Purna Prabhakar Nandamuri1 and Dr. K. V. Rao2
ABstRACtStudent’s academic performance is influenced by many exogenous as well as
endogenous factors. To ensure that children reach their full potential, it is important for educational systems to provide appropriate and equitable learning opportunities to students from all backgrounds. This paper is an integral part of the doctoral dissertation – ‘A study of Management Practices of Secondary Schools’. The principal objective of the study is to explore the nature of student participation in learning process among the three major types of school managements at secondary level. A sample of 188 secondary schools – about 34% of the population in Krishna district of Andhra Pradesh, was selected through stratified sampling and the data is analyzed with Chi square test. The findings reveal a strong association between the type of school management and the nature of class participation. The unaided managements excel in motivating excellent participation while the public and aided managements lag behind.
intRoDuCtionAfter many years in the comfort of general public trust, education has come
under scrutiny and the think tanks, commissions, business forums and government reviews have decried the state of public education and prophesied grave future unless rapid change is initiated. Educating children eventually produces more educated adults, and many economists have suggested that this type of investment raises incomes in developing countries more than in others. This opinion is backed by the Nobel prize-winning research of Schultz (1989). Investment in human capital has caused economic growth in East Asia (McMahon, 1998). A year of education is associated with a 3 to 14% increase in wages and productivity in Sub-Saharan Africa (Simon, 2000). Educational attainment is perceived as one of the main vehicles to improve living standards in developing countries and to spur on nation-wide economic growth. Educators are under pressure to show the public that what they are doing is working, and governments everywhere have seized on education as a cornerstone for their political agendas. In most countries it is assumed that students are prepared for quite different societies than what their parents have experienced.
1 Dr. Purna Prabhakar Nandamuri, Assistant Professor, ITM Business School, Hunter Road, Warangal -506001, Andhra Pradesh. E-mail: [email protected]; [email protected], Handset: 9440661551
2 Dr. K. V. Rao, Professor, Department of Commerce & Business Administration, Acharya Nagarjuna University, Nagarjuna Nagar – 522510, Andhra Pradesh. E-mail: [email protected], Handset: 9441493983
PRERANA March 2012
34 Purna Prabhakar Nandamuri and K.V. Rao
In such a situation of national priority given to education, simply investing in the system and letting it develop in its own way and produce the results as a natural output will not be the spirit of management.
Student performance in academic score is accepted internationally to be one of the indicators of quality of the schooling system. However, student performance is influenced by an array of exogenous as well as endogenous factors. Identifying the variables that influence the achievement of young individuals is of great importance for two different purposes. On one hand, it is an essential tool for the public authorities in charge of the definition of optimal and efficient education policies. On the other hand, this kind of analysis can help the educational institutions to improve the quality of their programmes. Given the vast resources invested in education, understanding what factors influence student learning is of crucial importance. A majority of the prior studies on student performance have focused on the role of exogenous factors in determining the levels of success in the classroom. Very few studies have probed on the endogenous determinants.
The score a student receives on an achievement test is influenced by multiple factors such as earlier learning, family background, test measurement error, and the actual contribution of his schooling in the year tested. But a test score at one point in time captures the effect of all these, not simply that of the school. Many studies found that resources and/or funding levels are not significant determinants of student performance on standardized tests. Students’ learning is influenced by interplay of their individual, family and school characteristics. Such differences influence children’s readiness to learn even before they come to school. To ensure that children reach their full potential, it is important for educational systems to provide appropriate and equitable learning opportunities to students from all backgrounds. The present study attempts to contribute to the hither to less explored area of the nature of student participation in learning process which is a result of many endogenous factors of the schools.
ReVieW oF liteRAtuReAvinashilingam and Sharma (2005) found that classroom factors play a major
role in affecting the students’ academic performance, followed by environmental factors and developmental factors. Study by Dwivedi’s (2005) confirmed that the students from schools with enriched environment had significantly better academic achievement than the students from poor school environments. The positive and significant relationship between parental involvement and academic achievement was proved by the study of Vamadevappa (2005). Sahu and Sood (2005) found a significant relationship between students’ perception of teachers’ attitude towards them and their academic achievement. Study by Kingdon and Teal’s (2002) revealed strong evidence that performance-related pay in the private sector impacts
PRERANA March 2012
Purna Prabhakar Nandamuri and K.V. Rao 35
the student achievement positively, but no such evidence of a similar relationship in public schools is found. Pada’s (2000) in his study of class IX students found that all categories of school differed significantly from one another regarding the academic achievement of the learners. Mohan (1998) reported that achievement was highest in Navodaya Vidyalayas followed by the unaided schools.
The Government schools did not represent among the high academic achiever category in Kottayam District in the State of Kerala. Rao and Kanth (1997) found that teachers’ interaction with pupils, parents and elders in the community had the positive effect on enrolment and regular attendance. Asthana (1993) reported that adjustment with examination and curriculum, parental encouragement, family atmosphere, lack of facilities, and poverty were the prominent reasons among the school dropouts at senior basic level.
Though, some studies have probed into the school level factors of student performance while a vast majority concentrated on the external environment. Hence, this study is an attempt to identify the quality of student participation which is a direct result of the internal factors at the school.
oBJeCtiVe oF the stuDyThe objective of the study is to identify the nature of student participation
in learning process at the secondary schools operated under three major types of managements.
methoDologyThe study is descriptive in nature. Stratified sampling has been utilized to
draw the sample from the finite universe of 557 secondary schools operating under three major types of management in Krishna District of Andhra Pradesh in India. The sample has been made largely representative by selecting around 34% of the population. The primary data was collected through self designed questionnaire and interview schedules from the Headmasters/Principals of the select secondary schools. The data was analyzed through Chi-Square Test with the help of SPSS-19 to establish goodness of fit of the data and to understand the strength and pattern of association of the responses.
AnAysis AnD DisCussionMany a time, parents are unhappy with their school going children on the point
of class participation. However, equitable class participation does not necessarily mean that all students are expected to participate in the same way or even the same amount. Rather, the goal is to make sure that students are able to participate in class in ways that will help them achieve the learning goals. Student engagement in class is greatly influenced by the school’s internal environment in addition to many exogenous factors. The responses regarding the nature of student participation in learning process are analyzed and presented in the following section.
PRERANA March 2012
36 Purna Prabhakar Nandamuri and K.V. Rao
goodness of Fit: The responses of the school heads about the quality of participation in learning process in the class room are collected on a three point scale – excellent, good and average. First, the responses are processed with Chi square test for establishing the goodness of fit of the data for further analysis.
Table 1: Test Statistics for goodness of fit
Nature of participation in learning process
Chi-Square 15.202a
df 2
Asymp. Sig. 0.000
0 cells (.0%) have expected frequencies less than 5. The minimum expected cell frequency is 62.7.
The chi square value of 15.202 with a p value of 0.000 is statistically significant indicating that the obtained frequencies differ significantly from those that would be expected if all cell frequencies were equal in the population, thus establishing the goodness of fit of the responses collected.
Association and pattern: After establishing the goodness of fit, the data is tested to analyze the nature of association between the two categorical variables taken for the study - type of school management and the nature of student participation in learning process and cross tabulated to understand the pattern of the results.
Table 2: School Management and Class Participation cross-tabulation
Category of school managementNature of student participation in learning process Average/Poor Good Excellent Total
Public Sector
Count 68 41 8 117Expected Count 51.0 41.7 24.3 117.0% within Category of management 58.1% 35.0% 6.8% 100.0%% of Total 36.2% 21.8% 4.3% 62.2%
Private Aided
Count 10 12 4 26
Expected Count 11.3 9.3 5.4 26.0
% within Category of management 38.5% 46.2% 15.4% 100.0%
% of Total 5.3% 6.4% 2.1% 13.8%
Private Unaided
Count 4 14 27 45
Expected Count 19.6 16.0 9.3 45.0
% within Category of management 8.9% 31.1% 60.0% 100.0%
% of Total 2.1% 7.4% 14.4% 23.9%
Total
Count 82 67 39 188
Expected Count 82.0 67.0 39.0 188.0
% within Category of management 43.6% 35.6% 20.7% 100.0%
% of Total 43.6% 35.6% 20.7% 100.0%
PRERANA March 2012
Purna Prabhakar Nandamuri and K.V. Rao 37
Table 3: Chi-Square test Results
Value df Asymp. Sig. (2-sided)
Pearson Chi-Square 64.016 4 0.000
N of Valid Cases 188
The participation quality of around 35% of students in public sector is good where as 58% was rated as average or poor while the participation of only 7% of the students were rated as excellent. The good rating (46%) reigns major in the case of private aided schools, while the average or poor rating declines to around 38% and the excellent participants account for about 16%. The participation quality of about 60% of the students of private unaided schools is rated as excellent followed by another 31% as good. The poor participants are very less (9%) in unaided schools. The average of the entire sample for ‘excellent’ participation is around 21%; for ‘good’ about 35% and ‘average or poor’ accounts for the majority (44%). The student participation in the private unaided schools stands comparatively better than the group average. However, the same in the public sector and the aided categories is much below the average statistics. Thus the private unaided category of schools excels in motivating and maintaining good student participation in learning process to achieve better results. The results indicate a strong association between the type of school and the quality of student participation. A highly statistically significant x2 = 64.016 and p = 0.000 provides evidence that category of school management matters in nature of student participation.
stRength oF AssoCiAtion:Table 4: Symmetric Measures
Value Approx. Sig.
Cramer's V .413 0.000
N of Valid Cases 188
Cramer's V is used as post-test tool to determine strength of association after chi-square has determined significance. The highly significant Chi-square value (64.016) implies that there is a significant relationship between variables, but it does not say just how significant and important this is. Cramer's V value facilitates this additional information. In the present sample, the Cramer's V value is 0.413 and p =0.000 which indicates a strong association.
ConClusionThe statistical analysis supports the relationship as well as the strength of
association between the type of school management and the nature of student participation in learning process, it can be concluded that the discouraging levels
PRERANA March 2012
38 Purna Prabhakar Nandamuri and K.V. Rao
of students’ class participation are adversely impacting the academic achievement of the students. The managements of these category of schools obviously fail to motivate the students and attract good participation in school process and thus to achieve better results in the form of learning outcomes. There might be an influence of some exogenous factors such as the students’ community background, parents’ educational as well as socio-economic status, which hinder the quality of student participation. However, this may be countered by the fact that the provision of the service is free of cost and supported by the government whereas the same in case of unaided schools is paid. But, this doesn’t stand as an excuse for the failure. Hence, the educational bureaucracy and the school managements are suggested to put more efforts for motivating the students for better class participation to ensure better results.
ReFeRenCesAsthana, M. (1993), A study of socio-psychological correlates of drop-outs of senior basic level, Rohilkand University, India.
Avinashilingam and Sharm, G. (2005), Identification of factors influencing the students’ academic performance. Journal of Educational Research and Extension, 42(1), 25-32.
Dwivedi, R.D. (2005), Influence of school environment and approval motive on academic achievement of students. Journal of Education, 2(2), 101-107.
Kingdon Geeta Gandhi and Francis Teal (2002), Does performance related pay for teachers improve student performance? Some evidence from India. The Centre for the Study of African Economies Working Paper 165, USA, The Berkeley Electronic Press.
McMahon (1998), Education and growth in East Asia. Economics of Education Review, 17(2),159-172.
Mohan, R. (1998), Academic achievement and certain selected variables: A suggested discriminant function model. Perspectives in Education, 14, 161-171.
Pada, M. (2000), Analysis of relationship between academic achievement and school interventions of Class IX students. Journal of Educational Research and Extension, 37(4),1-8.
Rao, S. and Kanth, R.R. (1997), Teacher’s role in influencing enrolment and attendance in primary schools. The Primary Teacher, 22, 7-13.
Sahu, L.P. and Sood, R. (2005), Impact of students’ perception of their teachers’ attitude towards them and its relationship with their self-perception and academic achievement. Journal of Education, 2(2), 53-57.
Schultz Theodore, W. (1989), Investing in people: Schooling in low-income countries. Economics of Education Review, 8(3), 219-223.
Simon Appleton (2000), Education and health at the household level in sub-Saharan Africa. CID Working Paper 33, Center for International Development, Harvard University. Cambridge, MA.
Vamadevappa, H.V. (2005), Study of the effectiveness of parental involvement on academic achievement
among higher primary students. Journal of Educational Research and Extension, 42(2), 23-32.
PRERANA March 2012
S. Sudha and P. Shalini 39
entRePReneuRiAl AttituDes Among B-sChool stuDents-An emPiRiCAl APPRoACh
S. Sudha1 and P. Shalini2
ABstRACtAn entrepreneur is a person who has possession of a new enterprise, venture
or idea and is accountable for the inherent risks and the outcome. The term was originally a loanword from French and was first defined by the Irish-French economist Richard Cantillon. The field has started to gain importance in the minds of people in recent times. Research studies reveal that with the globalization of the world economy, interest in international entrepreneurship has increased rapidly over the past decade. One of the most important features in the global economy is the growing role of young entrepreneurial new ventures. It is to note that students especially from B-schools do posses an aim of becoming entrepreneurs. Hence the study is focused on this area. The main objective of the study is to know about the entrepreneurial attitude among the B-school students and how much does the management school contributes towards developing these entrepreneurial skills to the students’ aspirants.
intRoDuCtionEntrepreneur is a person who shifts resources from an area of lower to an area
of higher productivity and greater yield. He is a person who has possession of a new enterprise, venture or idea and is accountable for the inherent risks and the outcome. He is a person who makes lot of significant difference from other people. He thinks differently, looks out for cross functional combinations asks the questions like “why” and “what it”. He is person who is ready to face challenges, consider approaches never thought before, observes disruptive people and problem they face, cross pollinate ideas and brain storm with others frequently. Entrepreneurs are said to be the backbone of the economy. India being a divergent country has an enormous population base which has given birth to a number of entrepreneurial personalities. India is one of the developing entrepreneurial industries in the field of outsourcing, education, hotel and catering etc.
While looking in to the entrepreneurship in America, it remains a beacon of entrepreneurialism. Between 1996 and 2004 it created an average of 550,000 small businesses every month (The Economist, 2009). The world famous Wal-Mart was founded in the year 1962 (The Economist, 2009). America has found the
1 S. Sudha, Assistant Professor, Vels University, Pallavaram, Chennai. E-mail: [email protected]
2 P. Shalini, Assistant Professor, Vels University, Pallavaram, Chennai.
PRERANA March 2012
40 S. Sudha and P. Shalini
transition to a more entrepreneurial economy easier than its competitors because entrepreneurialism is so deeply rooted in its history.
The history of Entrepreneurship runs long in a country like China. Until the 1980s, entrepreneurship consisted of very small-scale activities in retail and services such as street vendors, businesses known as getihu. For this group, business was a means of subsistence. The second group emerged in the late 1980s, with more highly educated individuals, often engineers or State Owned Enterprise [SOE] managers, operating on a larger scale out of choice rather than necessity. These businesses, known as siying qiye, operated in all sectors, ranging from restaurants to transportation to manufacturing, especially the production of inputs for SOEs (State Owned Enterprises). The third type is the foreign educated or trained Chinese [Overseas] returning to China to start businesses. This type of entrepreneurship has been evident recently in the Internet sector. The total Chinese entrepreneurial activity averages to around 14.1%.
Looking into the entrepreneurial story of Australia it has the world’s best renowned entrepreneurs. Australians like to have their own business instead of being a working employee. The latest survey also shows that in 2006, for every 100 males there are 70 females engaged in business start-ups, although this figure has varied considerably in the past (Science alert).
The story of the Indian entrepreneurship is replete with paradoxes and surprises. During the pre-colonial and colonial era, the entrepreneur was seen more as a trader, money lender, bound rigidly by caste affiliations and religious, cultural and social forces ranging from the philosophy of Karma to the system of joint family. Entrepreneurship as we understand it today was definitely not forthcoming from this social segment. A number of political, economic factors too had an inhibiting effect on the spirit of enterprise among Indians. Lack of political unity and stability, absence of effective communication systems, existence of custom barriers and oppressive tax policies, prevalence of innumerable currency system – all these combined together to restrict the growth of native entrepreneurship until around the third decade of the 19th century. Looking in to the statistics presented by the World Bank from 2004-2009 it is interestingly to know that the number of people who run their business has increased to a greater extent.
BACkgRounDThe subject of entrepreneurship continues to play a vital role among
academicians and policy makers to the extent that many B-schools now include entrepreneurship studies as part of their graduate and undergraduate curricula. Various studies on entrepreneurship referred to above, draw from Ajzen’s (1991) social psychology theory of planned behavior and Shapero and Sokol’s (1982) intentions theory, developed specifically for entrepreneurship. Briefly stated, Ajzen’s
PRERANA March 2012
S. Sudha and P. Shalini 41
theory posits that three variables, namely (1) attitude towards a given behavior, (2) subjective norms and (3) perception of control over the behavior precede the formation of intention. For their part, Shapero and Sokol posit that the intention to go into entrepreneurship is predicated on perceived desirability and feasibility of entrepreneurship as a career resident in an individual and his or her propensity to act.
Adding to the above research on attitudes of students for entrepreneurship there are various factors that influence the attitudinal behavior and the impact of education has recognized as one of the crucial factors that help young people to understand and foster an attitude of entrepreneurship (Gorman, Hanlon, and King, 1997; Kourilsky and Walstad, 1998). Attitudes and knowledge of entrepreneurship are likely to shape students’ inclination to start their own business in the future (Wang and Wong, 2004).Attitude toward entrepreneurship: Entrepreneurship is a part of the company management processes in which the focus is on investment into new ventures, creating a new venture, building new organization departments, and supplying new products and services. Entrepreneurial attitude can be described according to the following four statements of Carter et al., (2003): 1) Attitude is an individual’s viewpoint about a specific thing and environment. It is a person’s inclination toward persistence and consistency. In addition, this inclination can be inferred from the individual’s behavior. However, the intention in an attitude is not discerned only through behavior. Attitude encompasses general knowledge and comprises the cognitive, emotions, and actions. 2) The attitude must have a target. The target of an attitude is a concrete person or thing and can also be an abstract idea or thought. 3) Attitude is analogous to inclination. When people hold a positive attitude toward a given target, they will hold the same positive attitude towards a similar target. 4) The person’s cultural traditions, family environment, and educational environment are the environmental factors that affect the formation of attitude. In general, an attitude is a collection of personal traits that can be learned. In summary, attitude is a mentally prepared state for any known subject. It is a subjective consciousness that is affected by the environment. Attitude is a kind of lasting inclination. It can be an idiosyncrasy that could be shaped or changed via experience or study. Attitude toward entrepreneurship is an individual’s concept about entrepreneurship, assessment, and inclination towards entrepreneurial behavior or self-employment. If the individual has a strong inclination to start a new venture, the relationship between attitude and behavior will be strong. Therefore, this individual has a strong inclination towards entrepreneurship.
According to Greenberger and Sextoe (1988), the authors ranks the factors that influences the entrepreneurial attitude of the students in order as 1) it is the chance or challenges in the market, 2) the managerial skills, 3) the use of managerial skills in the development of the enterprise, 4) starting an enterprise and its option and
PRERANA March 2012
42 S. Sudha and P. Shalini
5) the factors that influences are family, friends or family tradition. Carter et al., (2003) identified the main reasons that individuals have an inclination to start an enterprise as self-realization, financial success, perception of their own likely success in the role of a successful entrepreneur whom they choose to imitate, innovation, recognition, and independence. Gender, family experience with business, and educational level were found to be significant factors in entrepreneurial interests by Wang and Wong (2004) when they investigated the determinants of interest in entrepreneurship among university students in Singapore.
A study conducted by Francisco (2004) among Andalusian university states that attitude is one of the main factors which influences the students to choose entrepreneurship as the career. Study by Pihie, and Bagheri, (2011) states that influential factors affecting intention to become an entrepreneur, entrepreneurial attitude orientation and self-efficacy of students have been one of the main focuses of entrepreneurship research in Malaysia. When analyzing on the entrepreneurial attitudes among the students of various countries like India, China, Thailand and Australia by Jason and Even (2005) entrepreneurial attitudes are significant in explaining career decisions in all four countries with some variation in the relative importance of each of these attitudes. Entrepreneurship being the career for certain students it becomes important for the B-schools to concentrate on the strategies need to be implemented for the career formation of these students. It also becomes important to understand whether male and female students have a very strong intention to become an entrepreneur. The study by Lans et al., 2010) reveals that entrepreneurial intentions depend on gender differences because it depends on the world of work, rethinking, approach, aim and behavior. When analyzing the different views of entrepreneurship say between faculty and students the opinion differs a lot. A survey taken among 317 students in North Carolina by Shinnar et al., (2009) reveals that the views between faculty and students differ in terms of students occupational aspirations and interest among non-business students and suggests a significant opportunity to formally expand entrepreneurship-related education beyond the business school; and in contrast to previous researchers, the authors identified no significant differences between male and female students regarding interest in entrepreneurship.
Study by Henry and Lorna (2010) points out the relationship between entrepreneurship and employability skills. Results of the study revealed that entrepreneurship enhances employable skills and also posses the ability to deliver much other skill required for the business purposes. Angeles, Marta and Ana (2009) emphasizes on the importance of individual skills, the important resources to be chosen i.e. technical and physical resources and experience in developing the entrepreneurial activities. The Economist (2004) stated that the main factor is the fear of starting an own business and secondly the cost of failure in entrepreneurship is very high.
PRERANA March 2012
S. Sudha and P. Shalini 43
oBJeCtiVes oF the stuDyThe main objective of the study is to investigate the entrepreneurial attitude
among the B-school students and how much does the management school contributes towards developing these entrepreneurial skills to the students’ aspirants. The study also aims to find out the entrepreneurial skills which are inborn within the student and how much each student can be pruned towards being an entrepreneur and the various qualities which are required for an entrepreneur.
methoDologyThe study is descriptive in nature. Based on the literature review, the main
research hypothesis of the present study was to investigate the attitude of B-school students towards entrepreneurship and the factors that de-motivates an individual to become an entrepreneur. Since review of literature clearly states that there is relationship between entrepreneurship and attitude of B-school students. The questionnaire consisted of two parts. The first part of the questionnaire concentrates on the profile of the students. The second part comprises of variables like financial risk, access to finance, social risks, lack of skills, administrative hurdles, gender, stigma associated with failing, workload, corruption, competition, market demand, education skills and training were included in the questionnaire to elicit responses from the students.
The study relied on primary data collected through a questionnaire from post graduate students in different B-schools in and around Chennai city. In Chennai city there are 25 top listed B-schools out of which 5% of the B-schools were chosen at random (using lottery method). The study adopted convenience sampling method to choose respondents for the study. Questionnaires were distributed to 100 post graduates students and 74 questionnaires were returned out of which all were valid. Data was collected from January to March 2011. The collected data was analyzed using SPSS V-15.
AnAlysis AnD DisCussion Analysis of variance was carried out to find out if there exists variation in
the positive factors of becoming entrepreneur with respect to the demographic variables. Null Hypothesis 1: There is no variation in the positive factors of becoming entrepreneur with respect to the family household income.
Positive factors of becoming entrepreneurs namely Innovation, Access to Finance, Social and Cultural Attitude, Business Support and Physical Infrastructure show a statistical significance with respect to the family members’ occupation i.e. Higher the household income of the family it boosts up the positive morale to the aspiring entrepreneur.
PRERANA March 2012
44 S. Sudha and P. Shalini
Table 1: ANOVA of positive factors with respect to family household income
Variables Sum of Squares df F
Patience
Between Groups 16.848 3 2.046
Within Groups 134.473 34
Total 151.321 37
Risk Taking Attitude
Between Groups 5.231 3 0.816
Within Groups 104.655 34
Total 109.887 37
Innovation
Between Groups 2.853 3 0.503
Within Groups 92.618 34
Total 95.472 37
Access to Finance
Between Groups 68.018 3 0.493
Within Groups 2253.227 34
Total 2321.245 37
Government Regulations
Between Groups 4.466 3 0.852
Within Groups 85.647 34
Total 90.113 37
Social / Cultural Attitude
Between Groups .141 3 0.320
Within Groups 7.180 34
Total 7.321 37
Business Support & Physical Infrastructure
Between Groups 0.11 3 0.320
Within Groups 6.14 34
Total 6.25 37
The family household income of the aspiring entrepreneur plays a vital role on their positive factors of the entrepreneurial spirit.Null Hypothesis 2: There is no variation in the positive factors of becoming entrepreneur with respect to the occupation of the family members.
Positive factors of becoming entrepreneurs particularly factors like Risk Taking Attitude, Access to Finance, Business Support and Physical Infrastructure show a statistical significance with respect to the family members occupation. i.e. the Government Employee family members show a positive sign to the aspiring entrepreneur in all these aspects.
Table 2: ANOVA of positive factors with respect to the occupation of family members
Variables Sum of Squares df F Sig.
Patience
Between Groups 13.45 3 2.04 0.21
Within Groups 133.56 34
Total 147.01 37
PRERANA March 2012
S. Sudha and P. Shalini 45
Variables Sum of Squares df F Sig.
Risk Taking Attitude
Between Groups 4.2 3 0.72 0.05
Within Groups 102.56 34
Total 106.76 37
Innovation
Between Groups 2.82 3 0.49 0.04
Within Groups 90.62 34
Total 93.44 37
Access to Finance
Between Groups 63.45 3 0.53 0.03
Within Groups 2244.33 34
Total 2307.78 37
Government Regulations
Between Groups 4.33 3 0.92 0.72
Within Groups 80.67 34
Total 85 37
Social / Cultural Attitude
Between Groups 0.11 3 0.43 0.03
Within Groups 5.33 34
Total 5.44 37
Business Support & Physical Infrastructure
Between Groups 0.141 3 0.320 0.02
Within Groups 7.18 34
Total 7.321 37
The occupation of the family members of the aspiring entrepreneur plays a vital role on their positive factors of the entrepreneurial spirit.
Null Hypothesis 3: There is no variation in the de-motivators of becoming entrepreneur with respect to the family household income.
Almost all the de-motivating factors from becoming entrepreneurs show a statistical significance with respect to the family members’ occupation. i.e. the lower the household income of the family the aspiration of becoming an entrepreneur is very less as students are not supported by their family members to take risk which is the primary quality of becoming an entrepreneur.
Table 3: ANOVA of de-motivators with respect to family house hold income
Variables Sum of Squares df F Sig.
Financial risks
Between Groups 14.48 3 1.46 0.01
Within Groups 133.43 34
Total 147.91 37
Access to finance – Capital to invest
Between Groups 5.231 3 0.816 0.02
Within Groups 104.655 34
Total 109.887 37
PRERANA March 2012
46 S. Sudha and P. Shalini
Variables Sum of Squares df F Sig.
Social (protection) risks or costs
Between Groups 2.85 3 0.503 0.04
Within Groups 92.61 34
Total 95.46 37
Lack of skills
Between Groups 68.02 3 0.493 0.689
Within Groups 226.23 34
Total 294.25 37
Administrative hurdles
Between Groups 3.66 3 0.852 0.472
Within Groups 85.69 34
Total 89.35 37
Gender
Between Groups 0.141 3 0.22 0.811
Within Groups 7.180 34
Total 7.321 37
Stigma associated with failing
Between Groups 0.04 3 0.63 0.01
Within Groups 5.18 34
Total 5.22 37
Workload
Between Groups 2.45 3 0.42 0.94
Within Groups 7.87 34
Total 9.33 37
Corruption
Between Groups 3.44 3 0.59 0.61
Within Groups 22.18 34
Total 25.62 37
CompetitionBetween Groups 1.87 3 0.43 0.92
Within Groups 19.43 34
Total 20.2 37
Market Demand
Between Groups 0.51 3 0.320 0.811
Within Groups 11.18 34
Total 11.69 37
The family household income of the aspiring entrepreneur plays a vital role on their de-motivating factors or the fear factor in terms of the entrepreneurial spirit.
Null Hypothesis 4: There is no variation in the de-motivators of becoming entrepreneur with respect to the occupation of the family members.
The fear factors in taking decision to becoming entrepreneurs show a statistical significance to a very large extent with respect to the family members’ occupation. i.e. the parents of the private employed and lower middle class people are not encouraging their children in his/her aspiration of becoming an entrepreneur.
PRERANA March 2012
S. Sudha and P. Shalini 47
Table 4: ANOVA of de-motivators with respect to the occupation of family members
Variables Sum of Squares df F Sig.
Financial risks
Between Groups 12.48 3 1.63 0.02
Within Groups 135.34 34
Total 147.82 37
Access to finance – Capital to invest
Between Groups 4.23 3 0.16 0.02
Within Groups 102.55 34
Total 106.88 37
Social (protection) risks or costs
Between Groups 1.85 3 0.43 0.04
Within Groups 89.61 34
Total 91.46 37
Lack of skills
Between Groups 54.02 3 0.493 0.689
Within Groups 221.23 34
Total 275.25 37
Administrative hurdles
Between Groups 3.46 3 0.852 0.07
Within Groups 84.33 34
Total 87.79 37
Gender
Between Groups 0.24 3 0.22 0.811
Within Groups 6.23 34
Total 6.47 37
Stigma Associated with failing
Between Groups 0.28 3 0.63 0.81
Within Groups 7.45 34
Total 7.73 37
Workload
Between Groups 4.43 3 0.42 0.94
Within Groups 5.26 34
Total 10.79 37
Corruption
Between Groups 12.45 3 0.59 0.61
Within Groups 234.43 34
Total 247.88 37
CompetitionBetween Groups 1.98 3 0.43 0.92
Within Groups 20.44 34
Total 22.32 37
Market Demand
Between Groups 0.44 3 .320 .811
Within Groups 12.76 34
Total 13.2 37
The occupation of the family members of the aspiring entrepreneur plays a significant role to a very large extent on their fear factors of the entrepreneurial aspirant.
PRERANA March 2012
48 S. Sudha and P. Shalini
Influence of Education to become Entrepreneur: The influence of education for the students to become entrepreneurs and their mean ranks are categorized according to Friedman's test.
Table 5: Results of Friedman’s test
Variables Mean Rank
Educational Institutions I attended 5.45
Influenced my entrepreneurial spirit positively 5.39
Strongly supported my Entrepreneurial 5.38
Had a negative influence on my entrepreneurial career 5.47
Impeded my entrepreneurial career 5.58
Had no influence on my entrepreneurial career -----
The above test explains clearly that majority of the students are being inspired by their college where they have studied. The key factor for this inspiration may be the various programs conducted by the B-schools.
ConClusionIn recent years the attitude to become an entrepreneurship among B-school
students has been in an increasing mode. This is because due to influence in various internal and external factors and various programs conducted by organizations from different part of society. The study reveals that families with higher income and better salaried parents encourage their children to take up entrepreneurial activity, while parents of lower household income and private employed and lower middle class families do not encourage their children to take up entrepreneurial activity because of the fear of the risks involved, administrative hurdles, corruption, competition, lack of administrative skills. Results of Friedman’s test reveals that majority of the students are being inspired by their college where they have studied. The key factor for this inspiration may be the various programs conducted by the B-school such as ED Cell activities, Entrepreneurship Awareness Camps, Motivating & Mentoring Sessions of Entrepreneurs, etc. To inculcate the spirit of entrepreneurship among the students B-schools in association with agencies like NEN, CII etc could conduct activities to stimulate the spirit of entrepreneurship and render assistance to start up entrepreneurial ventures.
ReFeRenCes Ajzen, I. (1991), Theory of planned behavior. Organizational Behavior and Human Decision
Colette Henry, Lorna Treanor (2010), Entrepreneurship education and veterinary medicine: enhancing employable skills. Education and Training, 52(8), 607-623.
Francisco Liñán, Alcalde, Juan Carlos Rodriguez Cohard (2004), Entrepreneurial attitudes of Andalusian university students
PRERANA March 2012
S. Sudha and P. Shalini 49
Jason Fitz Simmons, Evan J. Douglas (2005), “Entrepreneurial Attitudes and Entrepreneurial Intentions: A Cross-Cultural Study of Potential Entrepreneurs in India, China, Thailand and Australia
Lans Thomas, Gulikers Judith, Batterink Maarten (2010), Moving beyond traditional measures of entrepreneurial intentions in a study among life-sciences students in the Netherlands. Research in Post-Compulsory Education, 15(3), 259-274.
Montoro-Sánchez Ángeles, Ortiz-de-Urbina-Criado Marta, Romero-Martínez, Ana (2004), The Decision to Use Alliances as Corporate Entrepreneurship: The Role of Resources and Skills. Group Decision & Negotiation, 18(5), 431-444.
Pihie, Z.A.L. and Bagheri, A. (2011), Malay secondary school students Entrepreneurial attitude orientation and entrepreneurial self-efficacy: A descriptive study, Journal of Applied Science, 11, 316-322.
Say, J.B. (2009), A special report on entrepreneurship the united states of entrepreneurs America still leads the world, March 12, 2009
Shapero, A. and Sokol, L. (1982), Social Dimensions of Entrepreneurship, In Kent, C., Sexton, D. and Vesper, K. Eds, The Encyclopedia of Entrepreneurship, Englewood Cliffs, PrenticeHall, 72-90.
PRERANA March 2012
50
PRERANA March 2012
Zenetta Rosaline and Rupa Gunaseelan 51
gAP AnAlysis FoR skill DeVeloPment in knitWeAR inDustRy -tiRuPuR
Zenetta Rosaline1 and Rupa Gunaseelan2
ABstRACtThe demand for management skills, both within the managerial occupational
group and beyond, has increased significantly in recent years. The nature of management skills required is also changing, with the management skill set becoming increasingly broad and demanding in response to the extent of structural change occurring across all sectors. A significant proportion of employers have identified management skills as being amongst the most important in terms of future skills needs contributing to the society at large. Tirupur Knitwear suffers from availability of technically qualified managerial level manpower like professional knitting master/merchandisers/marketing personnel for selling in the international market/ designers etc. Though Apparel Export and Promotion Council [AEPC] has started an Apparel Training And Development Centre [ATDC] and Tirupur Exporters Association [TEA] has Collaborated with National Institute of Fashion Technology [NIFT] offering various technical and fashion designing courses, the turnout of graduates, does not seem to be sufficient to reduce the prevailing managerial skill gap in the knitwear industry, at Tirupur. A gap analysis is not simply about finding the shortcomings of a business, but about looking at solutions to overcome these shortcomings-in that sense, a gap analysis is about the process of constant improvement.
intRoDuCtion Managerial skills are a set of behaviours that lead to effective job performance
and without them in many cases the knowledge of managers does not have any effects. Katz [2002] defined managerial skills as the manager’s ability to transform information and knowledge in to practice. Whetten, and Cameron [2002] two famous researchers in an article as "most-common skills of effective managers", classify the basic skills of managers in two groups, personal and communication skills. They have divided managerial skills into three groups in their newest work namely: Personal Skill like self-awareness, stress management, problem solving skills; Interpersonal Skills like, communication skills, power of influencing others, conflict management, skills of motivating people and Group Skills like Empowerment, team building and authority delegation. Betly [1999] provided a list of managerial skills.
1 Zenetta Rosaline, Assistant Professor, GRG School of Management Studies, Peelamedu, Coimbatore – 641 004. E-mail: [email protected], Handset: 9159546102
2 Dr. Rupa Gunaseelan, Associate Professor, BSMED, Bharathiar University, Coimbatore- 641 046. E-mail: [email protected], Handset: 9488166255
PRERANA March 2012
52 Zenetta Rosaline and Rupa Gunaseelan
These skills depend directly or indirectly on the activities and roles of managers and these skills in conclusion include the following components. Communication skill like, expression technique, letter writing, effective listening, reporting, power of interaction and negotiation techniques power, power of designing mental models and conclusion power. Skills Related to Creativity like courage in new thinking, capability in idealizing, inappeasable, risk taking, and imagination power. Blanchard and Heresy consider competency, equivalent to skill. They believe that there are competencies or skills in the work of leadership. Diagnosis is the ability to understand the position that the person wants to influence in it. Adment is the ability to match ones behavior and other personal resources for dealing with possible conditions. Contact is the ability to create a way that people easily understand it.
Lobankin and Viga (1999) in their research identified the most important skills for managers, mentioned skills such as; negotiation, eloquence, expression technique and communication as the most important skills. In Druckers' point of view, some of the most important skills that are required for the manager include; time management, authority delegation, establishing effective communication, problem solving and decision-making and leadership. In other words managers should get adequate knowledge regarding work, methods and styles through education and learning. Interpersonal Skills are needed to motivate and seek co-operation. To maintain informal relation is necessary to enhance organization's performance. There is a strong need to develop skills to understand his people and have regular contact with his subordinates. Conceptual Skills are the ability to understand the complexities of the overall organization, capable to think in abstract, analyze work situation and his creature innovative ability to access the environment. In short he should understand environment, organization and his own job, so that he can stand to obtain organization goal. Analytical and Decision Skills as rightly said by Peter Drucker, is the manager's ability to take decisions. Manager should develop ability to solve the problems logically, objectively and scientifically and use modern techniques to arrive at right and optimal solution.
ReVieW oF liteRAtuRe
Academy of Management Executive (2004) explains that when employees perform poorly, they should seek feedback from managers. In return, managers should give constructive feedback to employees, so that they can improve their performance. However, this kind of meaningful exchange about employee performance is often precluded by managers themselves. Some managers have an overly supportive style and feel uncomfortable giving negative feedback. Other managers are intolerant of failure and react harshly to feedback-seeking from poor performers. This causes employees to stop asking for feedback or even to avoid discussing performance with their managers entirely.
PRERANA March 2012
Zenetta Rosaline and Rupa Gunaseelan 53
Anne (1998) elaborates that in his 1995 bestseller, Emotional Intelligence, psychologist Daniel Goleman drew on a wealth of new research to argue persuasively that what we usually think of as intelligence - as measured by Intelligent Quotient - IQ is far less important as a predictor of a person's path in life than one's supply of attributes he calls emotional intelligence. In his sequel, working with Emotional Intelligence, he zeroes in on how these qualities, or the lack of them, can make or break your career. In an interview, Goleman talks about way emotional intelligence is more essential now than ever - and how to tell whether your emotional intelligence could stand some improvement.
Avolio et al., (1989) in this article examines how individual characteristics (age, experience) and organizational characteristics (department, level) influence the skill requirements rated as being important for managerial jobs. One hundred ninety-seven managerial employees completed a survey composed of 20 skill dimensions pertinent to supervisory positions in the mining industry.
Carmeli (2007) in this paper examines the extent to which the managerial skills possessed by top management teams affect the performance of municipal organizations in Israel. Managerial skills are a good predictor of performance measures that can be changed in the short term rather easily. There are also many private organizations that provide training in specific skills, such as project, communication and leadership skills, and organization development.
Chatani (2010) in this paper suggests skills development strategies that are fitted to the local context and conducive to sustainable development of Aceh. The intended readers of the paper include policymakers for regional development and skills development as well as skills training providers. The paper identifies skills that are most likely to be in demand and compares them against the current supply of skills training in order to recognize gaps between demand and supply.
Cooke (1989) explains that the Management Effectiveness Profile System (MEPS) provides managers with feedback on fifteen different task skills, people skills, and personal factors hypothesized to be related to their overall job performance. Davy (2002) emphasizes that a model of effective management is developed based on criticism of prior two-factor models. We identify six specific skills and explore their theoretical contributions. Both self-and others' evaluations of the skills are incorporated. The model was tested using both employees' attitudes and performance as measures of managerial effectiveness.
De Villiers (2006) elaborates about health service managers in the Western Cape requested a skills audit of medical officers in district hospitals to identify a possible gap in competencies that may impact on service delivery. Francois (2009) tries to explain Managerial Skills Acquisition and the Theory of Economic Development. Micro level studies suggest managerial skills play a key role in the adoption of modern technologies.
PRERANA March 2012
54 Zenetta Rosaline and Rupa Gunaseelan
Hay (2003) in his paper showed the results of a detailed skills audit and skills gap analysis among some 380 people from 38 small or medium sized companies in the South East of England, UK. Most participants reported that their own abilities were consistent with the needs of their jobs in most areas of basic software use but not presentation and graphics. Hopkins (1991) stated that strategic managers, those who are able to command high levels of organization performance, must be fully involved in and committed to the strategic management process, like being able to overseeing the entire organization and balancing its myriad activities as well as proficient in a variety of managerial skills.
Jane (1994) explains that managers are needed for effective functioning of the organization. Managers provide guidance, motivation, and control over the outcome of the work/services the employees perform. Managers provide the stability and order required to make an organization successful.
Latif (2002) explains that although researchers differ concerning the importance they place on various attributes of managerial effectiveness, three basic components are critical: appropriate behaviors, motivation, and skills. This paper focuses on the management skills component of managerial effectiveness. It reviews the relevant management literature related to what effective management skills are, why they are important, and describes one model, based on empirical research, for teaching management skills to pharmacy students.
oBJeCtiVes oF the stuDy1. To study and understand the various types of job skills prevalent in the
Tirupur knitwear Industry2. To understand and enumerate the conceptual framework of skill gap
analysis and the relevance of the same with respect to knitwear industry in Tirupur
3. To assess the skills gap if any, that is prevailing among the various categories of managerial skills in the Tirupur knitwear industry.
sCoPe oF the stuDyConsidering the large number of employees required to be trained with only
limited number of training institutions which has less capacity to train people at a time, possible reluctance of the employees to undergo formal training is prevalent. So the need has arisen to train them in their work place itself, using the available resources, in co-operation with employers who are interested to take up such support. Therefore, this study on skill gap analysis for skill development in the knitwear industry – Tiurpur gives a clear insight into the level of skill gap prevailing in the Tirupur knitwear industry. This study would envisage the possibilities of how the prevailing skill gap could be effectively narrowed, through priority based focused training programs.
PRERANA March 2012
Zenetta Rosaline and Rupa Gunaseelan 55
ReseARCh methoDology The study is to examine the skills gap prevailing among the managers in the
Tirupur Knitwear Industry. A list of exporters registered with Tirupur Exporters Association (TEA) was collected for this purpose.
Table 1: Categorisation of the export units based on annual turnove(
S.No. Turnover ( in Rupees)Exporters Category Number of Firms
1 Up to Rs.10 Crore Micro 350
2 Rs.10 Crore-Rs. 50 Crores. Small 300
3 Rs.50 Crore-Rs. 100 Crore Medium 30
4 Rs.100 Crore and above Large 20
Total 700
Source: Tirupur Cluster Study, 2009
It was identified, that there are totally 700 units doing export, spread over Tirupur District. The exporters are of four categories namely units with turnover upto 10 Crore, 10 to 50 Crore, 50–100 Crore and above 100 Crore per annuum as per the Table 1. Thus the sample selected for the study by adopting the method of judgment sampling is fairly representative. As per expert opinion, and based on identification by officers at Apparel Export and Promotion Council (AEPC) in Tirupur the best performing top ten export companies were shortlisted and enumerated. From the selected companies a census method was used to select the respondents. Through this method the total population of middle level and supervisory level of managers were addressed.
AnAlysis AnD DisCussionWeighted average score analysis: The weighted average score analysis deals with the respondents managerial skill gap prevalence. The factors considered in the group as opinion factors are:
1. Work skill2. Communication skill3. People skill4. Customer skill5. Leadership skill6. Business skill7. Analytical skillIn this section, the managerial skill gap, for each company and each department
was determined and the results are given in the following tables with suitable interpretations.
PRERANA March 2012
56 Zenetta Rosaline and Rupa Gunaseelan
Table 2: Weighted average score- dimensions of managerial skill gap organisation wise
S.No Company Work skills
Communica-tion skills
People skills
Customer skills
Leadership skills
Business skills
Analyti-cal skills
1 SP APPAREL 38 2.53 35 2.33 48 48 52 47 45
2 POPPYS 68 70 60 67 59 49 2.33 69
3 DEECEE 45 38 31 2.21 41 42 36 51 3.64
4 FASHION 45 3.46 38 34 39 33 2.54 42 40
5 GEENA 48 3.43 32 37 2.64 38 47 3.36 40
6 PREMDURAI 90 98 91 108 3.48 109 3.52 103 97
7 SCM 56 51 60 3.33 52 56 53 52
8 MERIDIEN 64 74 64 71 66 74 77
9 TUBEKNIT 54 44 45 47 43 46 44
10 EASTMAN 53 65 48 52 60 54 50 2.63
Figure 1: Weighted average score-dimensions of managerial skill gap organisation wise
PRERANA March 2012
Zenetta Rosaline and Rupa Gunaseelan 57
inFeRenCe YY Weighted score for work skills was highest 3.46 at Fashion knits. At fashion knits
they have very strict work skill norms when compared to other knitwear units. The managers at fashion knits are much skilled in their work. The work skill is at its least 2.53 in SP Apparels, hence it is important that they find methods of filling this gap.
YY The score for communication skills is highest 3.43 at Geena Garments. At Geena garments, one among the leading export units in Tirupur, they have very good internal communication systems. They conduct regular interdepartmental meetings. The managers, supervisors and workers are constantly updated about the company decisions and future plans. The communication skill at SP Apparel is at the least 2.33. The communication skill is at its least in SP Apparels, hence it is important that they plan strategies to fill this gap.
YY The people skills rated 3.33 highest at SCM textiles. The people skills include interpersonal skills, group-co-ordination skills, and team building skills. At SCM the people skills are highest. SCM gives more priority to allowing its employees to work in teams. The managers are constantly motivated to conduct weekly departmental meetings. The people skills are at the least 2.21 at DEE CEE Exports, they have to try to patch this gap by training and development.
YY The customer skills 3.48 in Prem Durai exports. This company has performed the best in the year 2009 -2010, and the leading exporter in Tirupur. The company annual turnover is 400 crores, with thirty three branch offices in Tirupur district. With their export market being so high, they have definitely identified that the customer is their target. They have designed and implemented good customer skill practices to keep their customers constantly updated. The customer skills are the least in Geena garments with a score of 2.64. They have to device methods to address this gap.
YY Leadership skills were identified to be highest at Prem Durai exports with a score of 3.52. Good leadership leads a company to success. Inevitably the leadership skills are best at Prem Durai. The score is 2.54 the least at Fashion knits. This gap has to be bridged with proper skill development practices.
YY The business skills are at the best at Geena garments with a score of 3.36 the export market is finely tuned and they concentrate only in the European market. Since they have a select target market the business skills are well planned and executed. The least score of 2.33 at Poppys, has started a thought for improvement in the business skills.
YY The analytical skills are highest in score 3.64 at Dee cee exports. The managers here are very experienced senior people with nearly 15 to 20 years of experience. Hence their experience in the textile industry proves right to make appropriate decision on the balance sheets and profit analysis statements. 2.63 at Eastman
PRERANA March 2012
58 Zenetta Rosaline and Rupa Gunaseelan
is the least score paving way to start a new line of thinking in improving the analytical skills.
From the above explanations it is clear that each of these identified managerial skills are essential, but not equally distributed among all the companies. This research is intentionally performed to identify the skill gap and recommend ways and means of how these relevant managerial skills can be developed and implemented uniformly in all the export units.
suggestions A managerial skill gap exists when a manager finds themselves in a position
where he or she does not possess the requisite managerial knowledge or skills necessary to perform at a high level. When organizations allow ‘Management skills gap ‘to exist they will be forced to undergo various difficulties like,
1. Improperly trained managers will not be able to achieve performance goals for the organization.
2. There would be frequent loss of productivity at a time when other competitors tend to clamor to improve on their productivity.
3. When the managers are not properly trained a host of negative people issues generally emerge including loss of team work/co-operation, communication, breakdowns, a degeneration of morale and increased work place stress.
ConClusionToday is a world of “Survival of the fittest”. We are in the race for time,
competition, excellence and empowerment. So if we are looking forward to an enjoyable, sustainable and profitable business in the knitwear industry the time is just right to make a decision about revamping the current training and development facilities and attitudes towards the same. Without proper attention training and development efforts will be ignored and delayed inconsistently, or ineffectively implemented widening the Managerial skills gap in the knitwear organizations. Without a supportive organizational culture management training and development efforts can easily be neglected. In the ultra competitive world of business failure to develop and train the managers in the organization could prevent one from getting the competitive advantage, and put one in a competitive disadvantage.
ReFeRenCesAACSB (The International Association for Management Education). (1999). Continuous improvement symposium continues to draw a crowd. Newsline, 30(1), 10-13.
Abiodun, E. J. A. (1999), Human Resources management, an overview. Concept Publication, Shomolu, Lagos, 110-121.
PRERANA March 2012
Zenetta Rosaline and Rupa Gunaseelan 59
Adelaide Wilcox King (2001), Managing organizational competencies for competitive advantage: The middle-management edge. The Academy of Management Perspectives , 15(2), 95-106.
Adeniyi, O.I. (1995), Staff training and development in Ejiogu, A; Achumba, I. Asika (eds). Reading in Organizational Behaviour in Nigeria, Lagos. Maltho use Press Ltd, 159-167.
Argyris, C. (2004), Action science and organizational learning. Journal of Managerial Psychology, 10, 20-26.
Arikewuyo, M.O. (1999), Improving teachers’ productivity in Nigeria, in Adesemowo, P.O. (Ed). Basic of Education, Lagos Triumph Books Publishers, 102-109.
Ashford, S. J., and Taylor, M. S. (1990), Adaptation to work transitions: An integrative approach. In G. R. Ferris and K. M. Rowland (Eds.), Research in personnel and human resources management, Greenwich, CT: JAI Press, 8,1-39.
Ashforth, B. E., and Fugate, M. (2001), Role transitions and the life span. In B. E. Ashforth (Ed.), Role transitions in organizational life: An identity-based perspective. Mahwah, NJ: Lawrence, 225-257.
Basu, A. (2004), Entrepreneurial aspirations among family business owners: an analysis of ethnic business owners in the UK. International Journal of Entrepreneurial Behaviour and Research, 10 (1/2), 12-33.
Berzonsky, M. D. (1990), Self-construction over the life-span: A process perspective on identity formation. In G. J. Neimeyer and R. A. Neimeyer (Eds.), Advances in personal construct theory , 1, 155-186.
Booth, S. and Hamer, K. (2007), Labour turnover in the retail industry: Predicting the role of individual, organizational and environmental factors. International Journal of Retail and Distribution Management, 35 (4), 280-307.
Bosworth, D.L. (1990), The Extent and Intensity of Skill Shortages, International Journal of Manpower, 13, 3-42.
Broadbridge Adelina (2002), Rationalizing retail employment: a view from the outside looking in. International Journal of Retail and Distribution Management, 30(11), 536-543.
Campbell, M., and Baldwin, S. (1993), Recruitment Difficulties and Skill Shortages: An Analysis of Labour Market Information in Yorkshire and Humberside. Regional Studies, 27, 271 -280.
Carmeli Abraham (2006), The relative importance of the top management team's managerial skills; Tishler, Asher, International Journal of Manpower, suppl. Leadership in organizations, 27(1), 9-36.
Chan, D. (2000), Understanding adaptation to changes in the work environment: Integrating individual difference and learning perspectives. In G. R. Ferris (Ed.), Research in personnel and human resources management Stamford, CT: JAI Press, 18, 1-42.
Chatterjee, Samir Ranjan (2009), Managerial ethos of the Indian tradition: relevance of a wisdom model. Journal of Indian Business Research, 1(2/3), 136-162.
Clinton O. Longenecker, Laurence S. Fink (2006), Closing the management skills gap: a call for action, Development and Learning in Organizations, 20(1), 16-19.
Daft, R.L. and Weick, K.E. (1984), Toward a model of organizations as interpretation systems. Academy of Management Review, 9, 284-295.
PRERANA March 2012
60
PRERANA March 2012
S. Balasubramanian 61
ChAnging Role oF mAnAgement PRoFessoRS. Balasubramanian
Creating business leaders to meet the challenges of the changing business scenario would need management professors to undergo not only a significant change in their mindsets, but change in their methods of teaching, methods of updating knowledge and skills and methods of dealing with an entirely new breed of students.
Economic liberalisation, global business opportunities, increasing competition, onslaught of technological innovations, and emergence of global communication networks have impacted businesses in a large way. The changing business scenario has necessitated changes in management thinking. There are some major shifts in paradigms. We now speak of “leaders” and not “managers”. The career aspirations and expectations from work of employees are changing dramatically. Abraham Maslow’s Theory of Need Hierarchy or Douglas McGregor’s Theory X&Y may not be able to fully answer the questions that have arisen in recent times on what motivates an employee. We would need newer concepts and newer theories to explain the new phenomenon.
Today’s generation of students is aware of the changes, thanks to the internet and communication revolution. I believe that the risk-propensity of these students is reasonably high and many of them would not be averse to “experiment” and become entrepreneurs. The expectations of these students from their management professors are also changing.
All the changes enumerated above demand that the new crop of management professors adopt an integrated approach to teaching. Management professors would need to update their knowledge and skills constantly, deliberately and consciously. Years have to become months, months become weeks and weeks become days. Technology is changing the world at a frightening speed. Management professors, therefore, should develop skills in teaching courses that are not only based on sound and proven theories, concepts and frameworks, but also laced with practical and contemporary issues and dimensions. They need to be “leaders” themselves. They should possess and demonstrate qualities and characteristics that they would advocate as being signals of success. From effective time management to self-awareness to self-organisation to self-confidence to updation of knowledge to net-working to effective communication skills – all these should be not only be mere precepts and concepts, but possessed and practised and demonstrated by a management professor in his own daily work and life.
As mentioned earlier, technology is driving business today. Digitalisation of information is becoming the order of the day. Education is increasingly being made available over the Internet and distance-education is assuming a different
PRERANA March 2012
62 S. Balasubramanian
status. More and more students are seeking higher education through net-based programmes. Thus, classrooms are being replaced by “virtual chat rooms”. The management professor of today, therefore, would need to adapt the new technology with enthusiasm and zeal.
I believe that the role of the management professor is no longer limited to one of an “academic guru”. He is no longer expected to be a mere repository of theories, concepts and other bookish knowledge. He would need to demonstrate his contemporary knowledge and deep understanding of the complexities of today’s business by providing extensive examples from current business practices and problems to support his theories and concepts. It saddens me to hear that many of our management professors do not engage themselves in active applied research or consultancy assignments. Such situations will only result in the management professor getting further alienated from the realities of business.
In conclusion, if a Harvard or Stanford or MIT or Kellogg in the U.S.A. can not only attract but also retain professors of international acclaim and acceptance, I am sure that India can also do it, provided that we adapt our mindsets as required. Management schools would need to revisit their compensation and reward systems, process of recruitment and selection, and continuous improvement programmes if only to succeed in talent acquisition and retention.
Prof. S. Balasubramanian is the Director of GRG School of Management School, Coimbatore. He can be contacted on [email protected]. The views expressed are his own and do not represent the institution.
This article was originally published in Business Today in 2004 and has been revised since.