AcknowledgementsThe assistance of the Key Stage 3 Strategy pilot LEAs in developing these materials isgratefully acknowledged.
Images of Microsoft products are reprinted with permission from the MicrosoftCorporation.
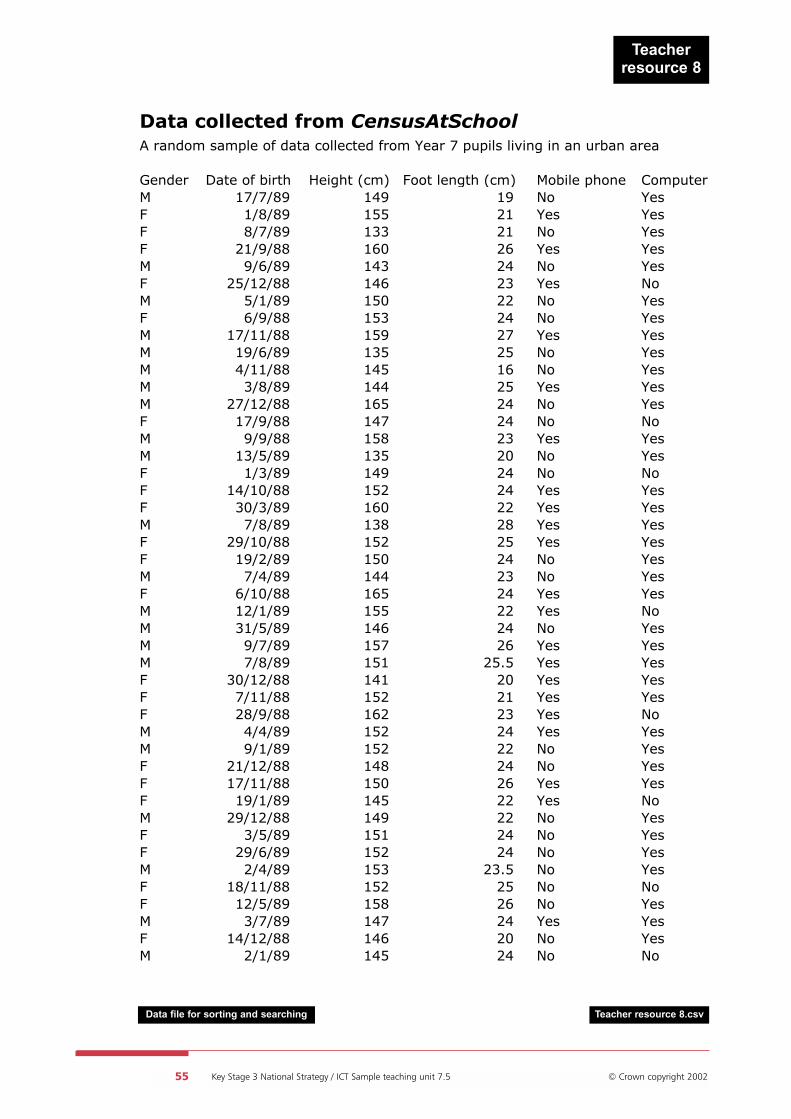
The data in the files Pupil resource 7.csv and Teacher resource 8.ppt are reproducedwith the permission of the CensusAtSchool Project, RSS Centre for Statistical Education,(www.censusatschool.ntu.ac.uk) based at Nottingham Trent University.
Logos and information from National Curriculum in Action, National Statistics and theDepartment for Transport are used with the permission of the organisations concerned.
All company logos and images are used with permission.
DisclaimerThe Department for Education and Skills wishes to make clear that the Department andits agents accept no responsibility for the actual content of any materials suggested asinformation sources in this document, whether these are in the form of printedpublications or on a website.
In these materials icons, logos, software products and websites are used for contextualand practical reasons. Their use should not be interpreted as an endorsement ofparticular companies or their products.
Contents
About the ICT sample teaching units for Key Stage 3 4
7.5 Data handling: unit overview 5
ICT Framework objectives 5
Timing 5
Task 5
Resources 6
Prior learning 7
Subject knowledge needed by teachers 7
Lesson outlines 8
Lesson plans
Lesson 1 Evaluating and interrogating an existing data set 10
Lesson 2 Presenting information in different formats to test hypotheses 17
Lesson 3 Designing a questionnaire to collect data 23
Lesson 4 Creating a questionnaire and designing a data handling
file structure to answer a key question 30
Lesson 5 Entering, checking and testing data 36
Lesson 6 Drawing conclusions and selecting data to support them 41
Resources
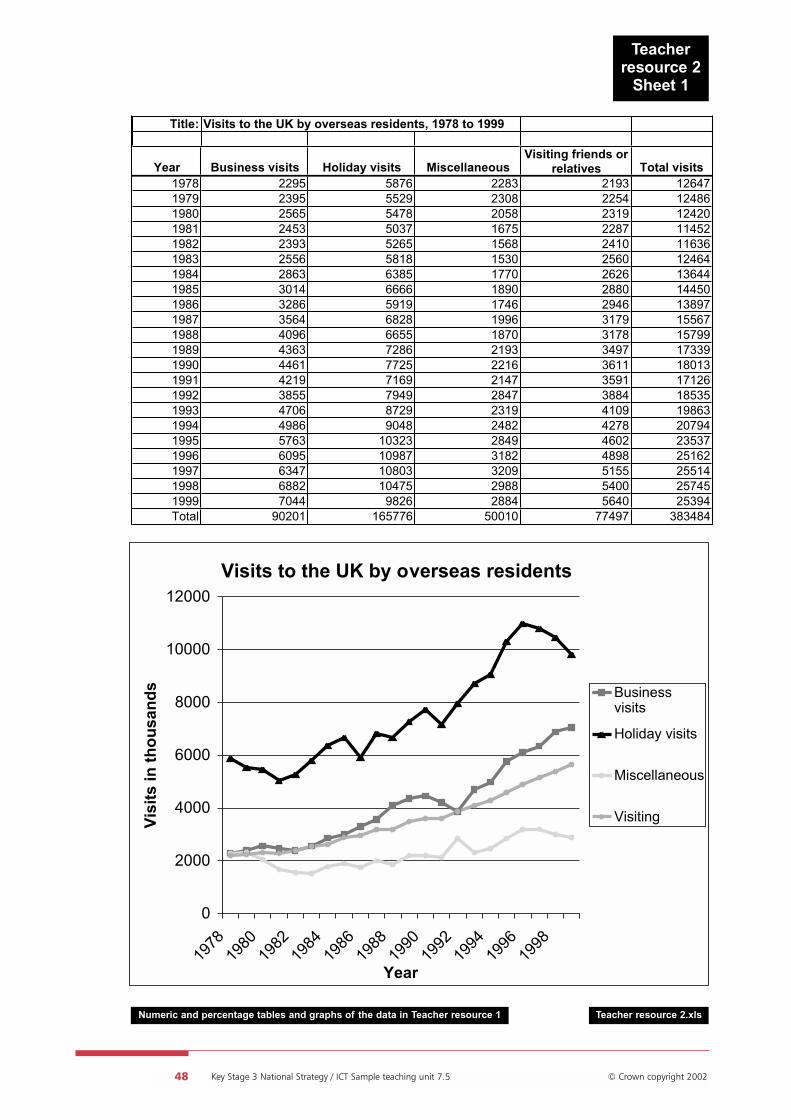
Teacher resource 1 Visits to the UK by overseas residents, 1978 to 1999 47
Teacher resource 2 Numerical and percentage tables and graphs of the
data in Teacher resource 1 48
Teacher resource 3 Some question types and possible responses 50
Teacher resource 4 National travel survey, Trips to school per
child per year 51
Teacher resource 5 Sample questions for a questionnaire 52
Teacher resource 6 Questionnaire: Survey of means of travel to school 53
Teacher resource 7 Data with errors and inconsistencies 54
Teacher resource 8 Data collected from CensusAtSchool 55
Teacher resource 9 Data from CensusAtSchool 56
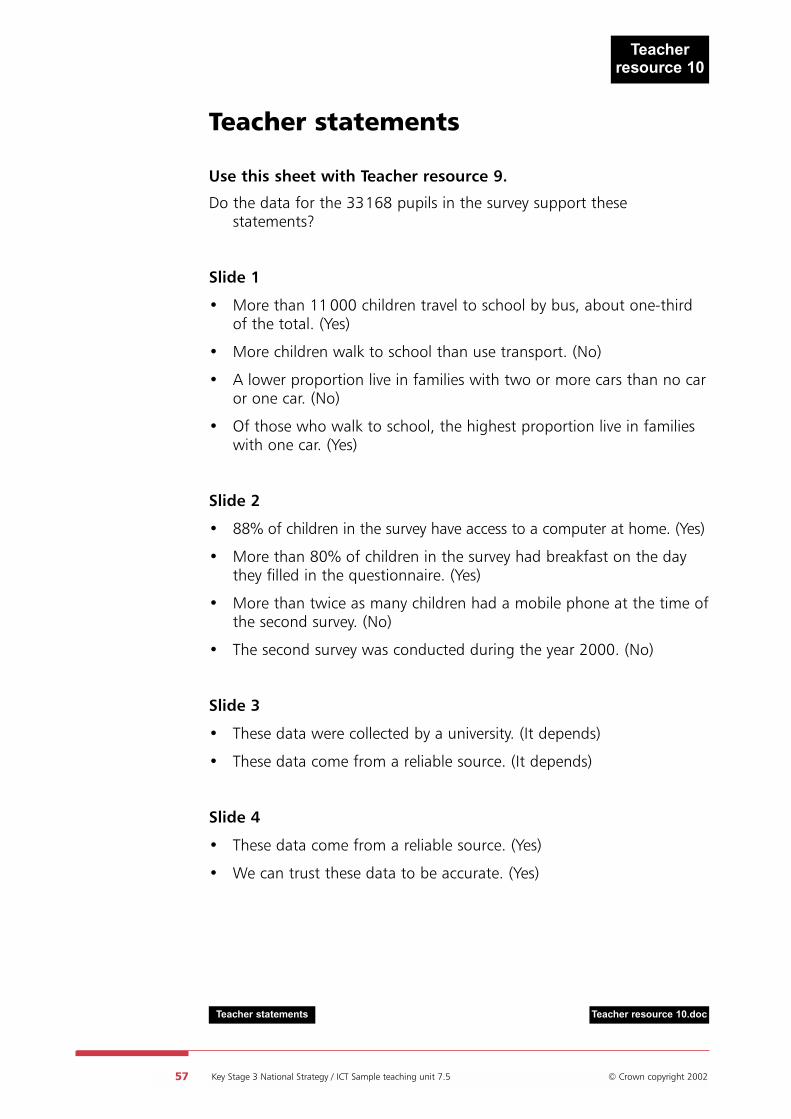
Teacher resource 10 Teacher statements 57
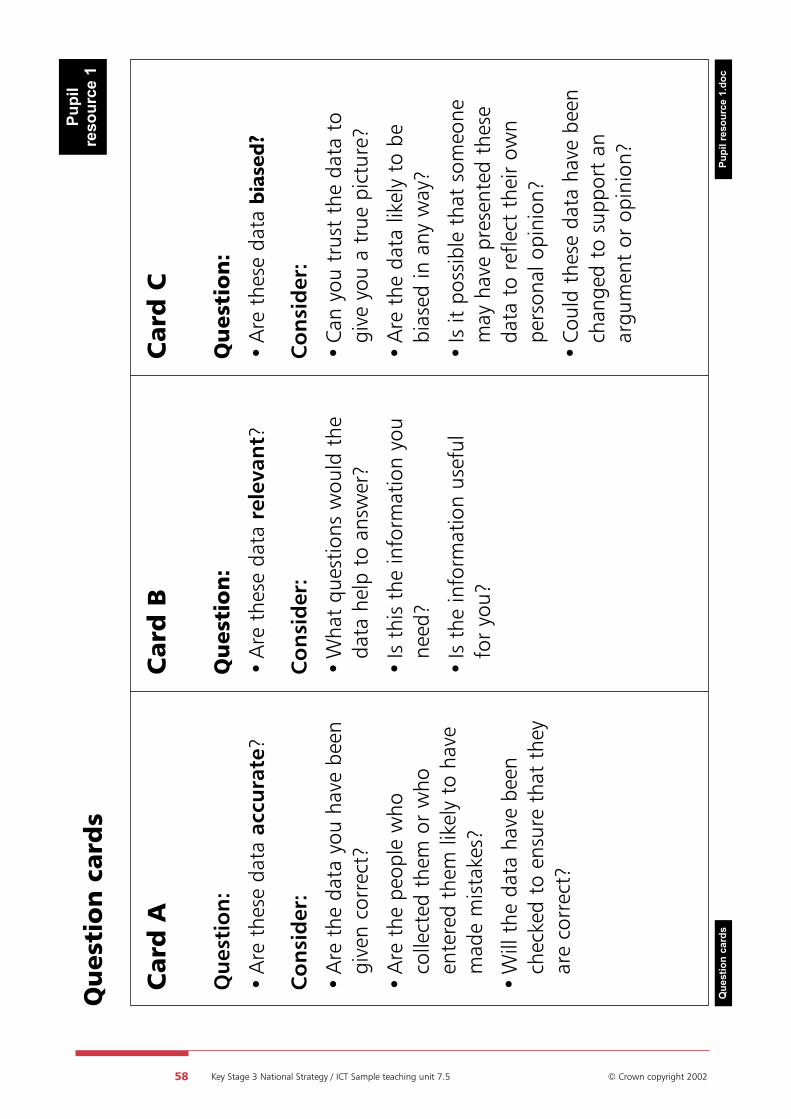
Pupil resource 1 Question cards 58
Pupil resource 2 Visits to the UK by overseas residents, 1978 to 1999 59
Pupil resource 3 Visits to the UK by overseas residents, 1978 to 1999
(question sheet) 60
Pupil resource 4 Evaluating a data file structure 61
About the ICT sample teaching units for Key Stage 3
This unit is one of a series illustrating how objectives from the Framework for teachingICT capability: Years 7, 8 and 9 can be taught.
There is no requirement to use the units. They contain sample lesson plans that youcan amend to suit your local circumstances and the needs of your pupils. For example,you may decide to use different activities to teach objectives or to teach the unit to adifferent year group. Microsoft Word versions of the lesson plans are being publishedon the Key Stage 3 website at www.standards.dfes.gov.uk so that if you wish youcan download the plans to modify them.
The units contain plans for lessons of 60 minutes. Each activity in the lessons has aguide time. This will help you to fit activities into lessons that are longer or shorterthan 60 minutes. For example, the activities in one of the unit’s lessons could betaught over two of the school’s lessons, with extra starter and plenary activities added.
The ICT Framework recommends that schools offer one hour each week, or 38 hoursper year, for dedicated ICT lessons. The sample teaching units for a year, if taughtwithout amendment, need less teaching time than 38 hours. This leaves time forlessons of your own design at suitable points. For example, you could revisit objectivesto consolidate learning, use the time for informal assessment, or insert an extra skills-based lesson to teach particular aspects of more complex software.
The sample lesson plans are intentionally very detailed to give busy teachers a fullpicture of how each lesson might be taught. Teachers’ own plans would probably bemuch less comprehensive.
Apart from sample teaching unit 7.1, which is an introductory unit to be used beforeany of the others, the order in which the units for Year 7 are taught is not important.
About this sample teaching unitUnit 7.5 is a unit about data handling for Year 7. It allows you to review pupils’learning from Key Stage 2 and to introduce them to some of the ICT Frameworkobjectives in the theme ‘Finding things out’.
Since handling data is one of the National Curriculum attainment targets inmathematics, you should consult the mathematics department about what aspects ofdata handling have been taught in Year 7 mathematics lessons, including the use ofICT. The handling data section of the supplement of examples in the Framework forteaching mathematics: Years 7, 8 and 9, included on the CD-ROM accompanying thisunit, illustrates the kind of work that pupils in Years 7, 8 and 9 will do in theirmathematics lessons.
Using data and information sources• Identify the purpose of an information source and whether it is likely to be
biased.
• Identify what information is relevant to a task.
• Understand how someone using an information source could be misled bymissing or inaccurate information.
Searching and selecting• Narrow down a search to achieve more relevant results.
Organising and investigating• In an investigation:
– design and use an appropriate data handling structure to answer questionsand draw conclusions;
– design a questionnaire or data collection sheet to provide relevant data;
– check data efficiently for errors;
– investigate relationships between variables;
– use software to represent data in simple graphs, charts or tables, justifying the choice of representation;
– derive new information from data;
– check whether conclusions are plausible;
– review and amend the structure and its data to answer further questions.
Timing
This unit is expected to take six lessons of 60 minutes. Each activity has a guide time sothat you can alter the number and duration of lessons to suit your own timetable.
Task
In this unit pupils will consider how to collect relevant data to answer a question. Theywill design a file to handle the data and will check their entries for accuracy. Finally, theywill use the database functions in a spreadsheet package, such as Microsoft Excel, tointerrogate their data and consider the plausibility of the conclusions they have drawn.
The lessons are designed for pupils working at levels 4 and 5, with extension work forpupils working at higher levels. Adaptations and extra material are suggested for lessexperienced pupils or for pupils working at lower levels.
• Software, such as Microsoft Office, for data handling, wordprocessing and slidepresentations
• Printer
• A display of the data handlingcycle as in the Key Stage 3Strategy Numeracy across thecurriculum pack (This is availableas a poster in the Strategy’s packInteracting with mathematics inKey Stage 3: Year 8 handlingdata, which contains six copiesfor each school.)
• Teacher resources on the CD-ROM for the unit:
– HD maths.pdf file of the ‘Handling data’ section of the supplement ofexamples in the mathematics Framework, for reference
– HD vocab cards.doc Flash cards of the key vocabulary used in this unit
– Teacher resource 1.xls A simple table of travel statistics, Visits to the UK byoverseas residents, 1978 to 1999
– Teacher resource 2.xls Numeric and percentage tables and graphs of thedata in Teacher resource 1.xls
– Teacher resource 3.doc Question types
– Teacher resource 4.xls National travel survey, Trips to school per child per year
– Teacher resource 5.ppt Sample questions for a questionnaire
– Teacher resource 6.doc Blank questionnaire grid
– Teacher resource 7.doc Data with list of errors and inconsistencies
– Teacher resource 8.csv Data file for sorting and searching
– Teacher resource 9.ppt Data from CensusAtSchool
– Teacher resource 10.doc Teacher statements
• Pupil resources on the CD-ROM for the unit:
– Pupil resource 1.doc Question cards
– Pupil resource 2.xls A simple table of travel statistics, Visits to the UK byoverseas residents, 1978 to 1999 (this is identical toTeacher resource 1.xls)
– Pupil resource 3.doc Question sheet for Pupil resource 2
– Pupil resource 4.doc List of key questions
– Pupil resource 5.xls Data with errors
– Pupil resource 6.doc Cards for ‘Statements’ game
• load and save work in a shared area, using the file name conventions of the school;
• use the knowledge, skills and understanding set out in the ‘Finding things out’section of the Key Stage 2 programme of study, including:
– gathering information from a variety of sources: for example, people and databases;
– entering and storing information in a variety of forms;
– retrieving information that has been stored;
• use the knowledge, skills and understanding set out in the ‘Developing ideas and making things happen’ section of the Key Stage 2 programme of study for ICT,including:
– using tables to develop their ideas;
– selecting from and adding to information they have retrieved for particular purposes;
• use the knowledge, skills and understanding set out in the ‘Reviewing, modifyingand evaluating work as it progresses’ section of the Key Stage 2 programme ofstudy for ICT, including:
– reviewing what they have done to help them develop their ideas;
– talking about what they might change in future work.
It would be useful to ask teachers in the mathematics department to indicate whichaspects of data handling have been taught in Year 7 mathematics lessons, includingthe use of ICT, and what types of graphs and charts pupils are familiar with.
Subject knowledge needed by teachers
To teach this unit, teachers will need to know how to:
• load and save work in a shared area;
• use a large screen display, such as an interactive whiteboard;
• use presentation, wordprocessing and spreadsheet software;
• use the Internet to find information and download it;
• use data handling software and create data files;
• sort and make selective searches of data in a data file, and produce a range ofgraphs and charts from data files;
• explain the differences between different forms of data, including alphanumericand numeric data.
Using data and information sources• Identify the purpose of an information source and whether it is likely to be
biased.
• Understand how someone using an information source could be misled bymissing or inaccurate information.
Organising and investigating• In an investigation:
– use software to represent data in simple graphs, charts or tables, justifying the choice of representation;
– derive new information from data.
Key vocabulary
From Year 6: accurate, bar chart, data, download, Internet, pie chart, table
From Year 7: database, field, information source, numeric data, origin, reliable,uniform resource locator (URL), value
From Year 8: bias, interrogate
Preparation and planning• Clarify from pupils‘ records the type of data handling activities they have
experienced in Key Stage 2. Modify your questions in the starter activity of thelesson to take account of these experiences.
• Copy and cut up a sufficient quantity of Pupil resource 1.doc for pupils to haveone card (A, B or C) per pair. Shuffle the cards to ensure that roughly equalnumbers of each card are distributed.
• Make sure that the file Pupil resource 2.xls is available in the shared area.
• Copy Pupil resource 3.doc in sufficient numbers for pupils to have one copybetween two.
• Check that the website http://www.statistics.gov.uk is available. In particular,check that the access sequence described on page 14 still works – thewebsite may have been updated since these notes were written.
• Create a wall display of key vocabulary for the unit, which can be added to eachweek. If you wish, you could create a complete set of vocabulary cards from thefile HD vocab cards.doc.
1 Starter: Checking pupils’ knowledge and understanding
Explain that in this lesson pupils will learn how to use graphs and percentages toderive new information from a collection of data. They will find out how to decidewhether data are reliable or biased in any way, and whether people could bemisled by the data. Refer pupils to the displayed objectives for the lesson.
Ask pupils to tell you briefly about previous occasions where they have used adatabase. Ask these questions.
• What did you use the database for?
• What did you find out?
• Why was a database useful on that occasion?
Use pupils’ answers to check their levels of understanding and the range ofvocabulary they use.
10 minutesUnit 2 Considering critically the information in an existing data set
Load Teacher resource 1.xls, which is a simple table of travel statistics, Visits tothe UK by overseas residents, 1978 to 1999. Show the table on the large display.Do not reveal or discuss the source of the data at this stage.
Explain that you are using the database functions in a spreadsheet package andthat pupils are looking at an example of a single table of data that can beinterrogated, just like a flat file database.
Explain briefly the meaning of each of the fields (categories), pointing out that thenumbers are very large and have been recorded in thousands. Ask pupils if theycan see now that the spreadsheet software and data are being used as adatabase.
Check pupils’ understanding by choosing one or two values and asking them totell you how many actual visits each number represents (for example, in 1978,under ‘Holiday visits’, 5876 represents 5 876 000 visits). It may be useful to checkpupils’ understanding of the actual values represented by asking them to read thenumbers, in words, so that ‘5876’ holiday visits in 1978 would be read as ‘fivemillion, eight hundred and seventy-six thousand’.
Teacherresource 1
Teacher resource 1.xlsA simple table of travel statistics
• Why are the numeric data (numbers) entered in a short form?
For example, large numbers can often be rounded to a suitable multiple of 10,100, 1000, … where the result would be sufficiently accurate for the purpose.Entering the data in a shortened form makes the numbers easier to read andeasier to compare. In the same way, numbers or measurements might belimited to whole numbers or to a particular number of decimal places. Forexample, the weather forecaster gives temperature readings to whole degrees.
• Give me some examples of what general information the data in this tableprovide.
For example, every year there are more holiday visits than business visits.
• What might be included in the ‘Miscellaneous’ category?
For example, a passenger in transit between countries.
20 minutesUnit 3 Interrogating an existing data set
Use this activity, with questions similar to those in activity 2, to identify pupilswho may benefit from extra support during activity 4.
Ask pupils to work in pairs. Distribute question cards copied from Pupil resource 1.Use roughly equal numbers of cards A, B and C, giving one card to each pair. Askeach pair to consider the data on the screen and to discuss their answers to thequestions shown on their card. Tell them that you will ask for their answer after 3 minutes.
Now ask this question of the pairs with cards A, B and C in turn.
• Do you think the data are accurate/relevant/biased? Why?
For example, if pupils with card A think the data are accurate, they should sayhow they know this to be the case.
When discussing answers to the question about relevance on card B, make surethat pupils understand that the purpose of collecting data is to gatherinformation to answer a question. This means that they would need to knowwhat the original question was to know if the data were relevant.
Card A
Question:
• Are these data accurate?
Consider:
• Are the data you have beengiven correct?
• Are the people whocollected them or whoentered them likely to havemade mistakes?
• Will the data have beenchecked to ensure that theyare correct?
When discussing answers to the question about bias on card C, discuss the need forfurther information about the data. For example, extend the questioning like this.
• You’re right. We can’t tell if the data are biased unless we know more aboutthe data and their source. What more do we need to know?
For example, the source of the data, the method of collection, the consistencyor regularity of collection.
To provide the extra information, display the source of the data by accessing thewebsite http://www.statistics.gov.uk which is an official government site. Thisis shown by the URL (.gov.uk) and the information on the main page.
Discuss the website and establish who has produced it. Ask pupils to identify theinformation that indicates the source or origin of the data.
Then:
• from the drop-down menu ‘Select Theme’ on the left-hand side, select‘Transport, Travel and Toursim’;
• select ‘Travel and tourism’, then ‘Domestic tourism’, and finally ‘Visits to the UKby overseas residents’;
• scroll down and select ‘Overseas residents visits and spending in the UK 1978to 1999’.
Point out the heading for the data set and the extra information it provides aboutthe data collected and their source. Then:
• select ‘display complete dataset’;
• select ‘See Product details’.
Discuss the extra information this provides and whether it supports pupils’conclusions about the accuracy, validity and reliability of the information.
15 minutesUnit 4 Generating graphs
Ask pupils to load the data file Pupil resource 2.xls, which is a simple table oftravel statistics, Visits to the UK by overseas residents, 1978 to 1999.
Distribute copies of the question sheet, Pupil resource 3, while they are doing this.
Pupilresource 2
Pupil resource 2.xlsA simple table of travel statistcs
Ask pupils to use the table of travel statistics to answer questions 1 to 5 on thelist. As an extension activity, pupils who finish quickly can discuss with each othertheir answers to questions 6, 7 and 8. Collect the sheets so that you can checkpupils’ answers and identify pairs who may need further assistance in later lessons.
Show the data file Teacher resource 1.xls again on the large display. Demonstratehow to produce a graph to show the number of business visits each year.
Now change the type of graph to show that some formats are more effectivethan others as tools for interpreting data, even though they may not look ascolourful or as complex. Remind pupils that the purpose of a graph is to assist thereader to interpret the data, or to communicate conclusions, not to demonstratethe pupils’ own skills in using the software.
Name: ………………..............………………… Date: ………………
Visits to the UK by overseas residents,1978 to 1999Remember that in the table all the values are in thousands.
For example, the number 12647 (the total number of visits in 1978)represents 12647000, more than twelve million visits.
Answer questions 1 to 5.
1 In 1985, how many visits were made to theUK for business purposes?
2 In which year did the number of holidayvisits first exceed 8 000 000?
3 In 1999, there were more holiday visits thanfor any other category.Is that true for every year?
Pupilresource 3
5 minutesUnit 5 Plenary: Considering everyday uses of graphical data
Ask the class to suggest what data might be represented in a graph and wherethey might find them (for example, a graph of average monthly temperatures in atravel brochure, trends in house prices in a newspaper). Use a whiteboard orflipchart to list their suggestions quickly. Sources will probably includenewspapers, magazines, the Internet, television programmes (especially news andcurrent affairs), reference books (such as atlases), advertisements and reports.
Taking each example in turn, ask pupils these questions.
• Can you assume that the data represented in the graph would be reliable andunbiased? Could anyone be misled?
For example, factual data such as measurements of temperature maysuperficially appear to be accurate but could be biased because the sample ofmeasurements was not representative. Pupils may consider that an advertisingfeature presenting graphical data could be biased. A newspaper report mayseem less likely to be biased but may actually present data in a particular wayto support a viewpoint or argument. A government, research or academicreport may be considered more reliable.
Round off the lesson by reminding pupils that in this lesson they have learnedhow important it is to check the reliability of data. They have also begun toconsider how to use graphs and charts to display data in different ways, in orderto give new information. Refer pupils to the key vocabulary chart and the newwords that they have learned. Explain that you will add more new words to thechart each week.
Homework: Considering the clarity of information represented graphically
Explain that when data are displayed graphically it is important to consider whetherthe graph conveys information as clearly as possible, given its purpose and likelyreaders. Ask pupils to collect two or three different types of graph from newspapersor magazines, or downloaded from the Internet. They should note which graphthey think conveys information most clearly and give reasons for their choice.
Provide suitable newspapers or magazines for pupils doing homework in ahomework club or centre.
2Presenting information in differentformats to test hypotheses
ICT Framework objectives
FINDING THINGS OUT
Organising and investigating• In an investigation:
– use an appropriate data handling structure to answer questions and drawconclusions;
– use software to represent data in simple graphs, charts or tables, justifying the choice of representation;
– check whether conclusions are plausible.
Key vocabulary
From Year 7: data type, hypothesis, viewpoint
Other: plausible
Preparation and planning• Make sure that the file Pupil resource 2.xls is available in the shared area.
• Copy (in colour, if possible) the two graphs on sheets 1 and 2 of Teacher resource2.xls in sufficient numbers for pupils to have one copy between two.
• Provide a form for pupils to use to record their homework data, similar to the oneshown on page 22 (optional).
• If necessary, provide a wall display showing pupils how to use the network system.
• If necessary, prepare guidance to help pupils with the software they will be usingin the lesson.
• Add new vocabulary to the wall display.
• Display the lesson’s objectives in a prominent position, phrased in a way thatpupils can understand.
Ask pupils to think back to the last lesson, which focused on checking data to makesure that they are reliable as a source of information. Prompt them if necessary.
• Remind me quickly how you might check data for reliability.
For example, find out the source, consider its reliability, check entries foraccuracy, use a graph or chart to spot inaccuracies or inconsistencies, comparewith another source.
Ask them about the homework they did after the previous lesson.
• What features help to make sure that the information in a graph or chart ortable is presented clearly and can be easily understood, from a reader’s point ofview?
For example, a title, labels for the axes, careful use of colour, easily readabletext in a suitable size, not too much information to be taken in, a simple formof presentation that highlights key features in the data.
Explain that in this lesson pupils will consider what information can be providedby the data about visits to the UK that they used in the last lesson.
Remind pupils that a hypothesis is a statement that might be proved or disproved.Point out the word on the wall display. Explain that they will propose a hypothesisor question to be answered and, having checked the reliability of the data in theprevious lesson, they will now use the data to test their hypotheses or answertheir questions. Tell them that that they will also learn how to present the data indifferent ways so that they can derive new information and test their hypothesesmore easily.
25 minutesUnit 2 Proposing and testing hypotheses
Ask pupils to load the data file Pupil resource 2.xls, which is a simple table oftravel statistics, Visits to the UK by overseas residents, 1978 to 1999. Show thedata file Teacher resource 1.xls (the same table) on the large display.
Teacherresource 1
Teacher resource 1.xlsA simple table of travel statistics
• Can you propose a hypothesis that could be tested using these data?
For example, the number of people visiting the UK for business has increasedevery year between 1978 and 1999.
Choose one hypothesis, keeping it straightforward at this stage. Show how toproduce a graph to test it. For example, for the hypothesis above, produce agraph to show the number of business visits each year.
Ask for more suggestions and choose (or suggest, if necessary) a more complexhypothesis (for example, the number of visits to see friends or relatives hasincreased at the same rate as the visits for business purposes). Demonstrate howto select separate rows or columns and how to produce a chart to comparevalues and trends.
Ask pupils, in pairs, to propose a hypothesis that they could test, and to jot itdown to use later. Allow about 2 minutes for this. Use the time to help one ortwo pairs of pupils who need support in thinking of their own hypotheses.
Ask some pairs to propose their hypotheses and to say what data they wouldneed to find in order to test them.
Ask pupils to use their loaded data files to produce graphs to test their hypotheses.
Differentiation
Work with pupils whom you identified earlier as likely to benefit from extrasupport during this activity. You may wish to group four or five pupils together atthis point so that you can work with them around one computer.
For an extension activity, ask more-able pupils to list a couple of more complexhypotheses to test, using their data. They should write a short statement againsteach hypothesis to explain how the data either prove or disprove it.
15 minutesUnit 3 Using percentages to derive new information
Load Teacher resource 2.xls, numeric and percentage tables and graphs of thedata, Visits by overseas residents to the UK, 1978 to 1999. This data file containstwo worksheets. Start by displaying the table on sheet 1.
Explain that there is a limit to the usefulness of the information shown. It listssimple, numeric values that show how many visits there were in each category. It does not show whether the proportion of visits in each category has changedwhen compared with the total number of visits in a year.
Now display sheet 2, which shows the number of visits in each category as apercentage of the total number of visits for each year.
Ask pupils about this method of presentation.
• What advantages are there in presenting the information as percentages ratherthan actual numbers of visitors?
For example, it makes it easier to compare the different proportions or tocompare one distribution with another.
Scroll down sheet 2 to show the graph. Distribute copies of the two graphsprinted from sheets 1 and 2 of Teacher resource 2.xls.
Ask pairs of pupils to use the graphs to test the hypotheses they wrote down inactivity 2. Tell them to use the percentage figures rather than the numeric valuesto test their hypotheses.
Continue to work with the group that requires extra support, as in activity 2.
Ask pupils to collect some data they will need in the next lesson.
Ask them to consider how they travel to school, giving the most usual way if itvaries, and to find out how they used to travel to primary school. Ask them tocollect the same information from a friend or family member for each of theprevious two generations: for example, a parent and a grandparent.
You could if you wish provide a simple form for pupils to complete, similar to theone below.
Ask as many pairs as possible in the time available to describe what they did. Askeach pair these questions.
• What was your original hypothesis and what was your conclusion?
• Do the graphical data support your hypothesis or not?
• Did using percentages make a difference to your conclusion?
Invite the rest of the class to consider whether the conclusion reached by eachpair is plausible and to justify their viewpoint. Point out the words ‘plausible’ and‘viewpoint’ on the wall display and explain their meanings if necessary.
End the lesson by summarising what pupils have learned about using percentagedata, and graphs and charts, to gain new information and to test a hypothesis.Tell them that, in the next lesson, they will learn more ways of collecting data andwill find out how to design a questionnaire.
3Designing a questionnaire to collectdata
ICT Framework objectives
FINDING THINGS OUT
Using data and information sources• Identify what information is relevant to a task.
Organising and investigating• In an investigation:
– design a questionnaire or data collection sheet to provide relevant data;
– check whether conclusions are plausible.
Key vocabulary
From Year 6: questionnaire
From Year 7: data type, numeric
From Year 8: alphanumeric, sample, sample composition, sample size
Preparation and planning• Write on a whiteboard or flipchart the question, ‘Does a pupil’s age affect their
method of travel to school?’
• Prepare a table, similar to the example below, on the whiteboard or flipchart. Youcan use it to tally data from pupils’ homework, tailoring it to your localcircumstances and pupils’ likely answers.
• Prepare a homework sheet based on the table shown on page 29 (optional).
• If necessary, provide a wall display showing pupils how to use the network system.
• If necessary, prepare guidance to help pupils with the software they will be usingin the lesson.
• Add new vocabulary to the wall display.
• Display the lesson’s objectives in a prominent position, phrased in a way thatpupils can understand.
Resources• Computer with large screen display
• Whiteboard or flipchart
• Software for data handling and wordprocessing
• Teacher resources:
– Teacher resource 3.doc Question types
– Teacher resource 4.xls National travel survey, Trips to school per child peryear
• A display of the data handling cycle (available as a poster in the Key Stage 3Strategy pack Interacting with mathematics in Key Stage 3: Year 8 data handling,which contains six copies for each school – see page 6)
Lesson outline 60 minutes
1 Starter: Introducing questions Whole-class discussion 10 minutesto be answered
2 Considering what data are Small-group discussion 5 minutesrequired Whole-class feedback
3 Framing the questions for a Small-group work 10 minutesquestionnaire Whole-class feedback
4 Considering answers to Demonstration 15 minutesquestions on a questionnaire Paired discussion
Whole-class questioning
5 Plenary: Comparing local and Whole-class questioning 20 minutesnational data Summary of lesson
Point out the displayed objectives for the lesson. Remind pupils that although theyhave already learned a lot about using data effectively, they have not spent muchtime thinking about gathering data. Explain that this lesson will help them tounderstand why it is important to consider what data they need, and how tocollect them, so that the information gathered is as useful as possible. They willfocus on preparing questions for a questionnaire to collect data.
Tell pupils that the starting point for any investigation that uses data should be aspecific, overall question that needs an answer. Explain that they will need toconsider what questions might be asked of any information they collect, beforethey can decide what data to collect and how much data they will need. Use theposter of the data handling cycle to support your explanation.
Stress that this approach should give them enough information to find the answer totheir original question and will allow them to ask further questions, if they want to.
Check that pupils remember what a hypothesis is, referring to the wall display ofvocabulary. Give them an example and ask for some of their own suggestions.Then ask:
• How could you test that hypothesis to find out if it is correct?
For example, a hypothesis that dark-haired people will have brown eyes can betested by collecting information about eye colour and hair colour from asample of people.
Tell pupils that the starting point for today’s investigation is the question on theflipchart.
• Does a pupil’s age affect their method of travel to school?
Ask the class how they could investigate this.
• In relation to today’s question, propose a hypothesis that could be tested oncethe necessary data have been collected.
For example, ‘Pupils of primary age are more likely to walk to school thanpupils in our class’, or ‘Primary pupils and secondary pupils are equally likely totravel to school by bus’, or ‘Pupils in our class are more likely to come to schoolin different ways on different days than pupils in primary schools’.
5 minutesUnit 2 Considering what data are required
Ask pupils, working in small groups, to consider what kind of information theywould need to collect to answer the question on the flipchart. Allow a couple ofminutes for pupils to discuss and jot down their ideas.
Take feedback from pupils and use the flipchart to collate a list of useful datatypes, such as age of pupil, method of travel.
If pupils throw in ‘red herrings’, ask them whether that particular informationwould be useful or relevant, and remind them of the question they are trying toanswer. It may help pupils if you underline, circle or highlight the words ‘age’ and‘method of travel’ in the question on the flipchart.
10 minutesUnit 3 Framing the questions for a questionnaire
Explain that the next stage in answering the question is to find a way of collectingthe data. Ask pupils to think how to find out the information they want.
• What questions could you ask people, to collect the information you need?
Allow a few minutes for discussion in small groups. To encourage all pupils toparticipate, invite the less-confident pupils to make the first contributions. Thiswill allow them to offer the most-obvious suggestions first (for example, ‘How oldare you?’, ‘How do you travel to school?’), leaving more-confident pupils tosuggest less-obvious questions (for example, ‘Do you always travel to school in thesame way?’, ‘Did you travel to your primary school in a different way?’).
List their suggestions quickly on a whiteboard or flipchart. If they suggestquestions that would provide additional information, ask:
• Would this information be useful? If so, why?
For example, a question relating to gender could provide useful data about anydifference between methods of travel for boys and girls.
Remind pupils that it is common to use a questionnaire to gather data. Whenthey collected information for their last homework they were applying a similarapproach, by asking questions to get the data they needed.
15 minutesUnit 4 Considering answers to questions on a questionnaire
Display Teacher resource 3.doc, which lists some question types and possibleresponses. Go through the different questions, stressing the range of possibleanswers and the different data types for each one.
Refer back to the flipchart list created in activity 3 and discuss the responses. Startoff with an example, such as the question: ‘How do you travel to school?’ Explainthat respondents might answer with similar methods of travel, such as ‘coach’ or‘bus’. Ask pupils these questions.
• How could you deal with this? Will you record ‘coach’ and ‘bus’ as the same ordifferent methods of travel? What about ‘van’ and ‘car’?
• What will you do if a pupil uses two or more methods of travel to school? Apupil may walk all the way, take the bus, or get a lift in the family car to thebus stop.
Some question types and possibleresponses
Question Possible responses Data type
What is your name? Name Free text (alphanumeric)
Are you male or female? Choice of options Limited texte.g. male or female (alphanumeric)
How old are you? A range of whole numbers Free range of numbers or limited range (numeric)
How do you usually travel Free text Free text to work? (alphanumeric)
How do you usually Choice of options Limited text travel to work? e.g. car, train, bus, walk (alphanumeric)
How do you usually Choice of options Limited characters or l k? i b lk b
For example, you could allow respondents to choose two forms of travel andtick two boxes, but the data will be more manageable if you ask them tochoose only their main form of transport for the journey. Similarly, a pupil mayuse different forms on different days. Again, electing for only one, their usualform, will simplify the data.
• Will you record the information as numbers, words or symbols such as ticks orcrosses? Why?
Give pupils 5 minutes in pairs to discuss the range of answers they might receivefor each of the other questions on the flipchart list. Circulate and help pupils toresolve any issues.
Bring the whole class together to discuss common issues.
20 minutesUnit 5 Plenary: Comparing local and national data
Remind pupils that the information they collected for their homework, about howthey and two previous generations travelled to school, is specific to them. Theyrepresent only a very small section of one community. Tell them that you aregoing to show them some national data so that they can decide how closely theirown situations match national patterns.
Display Teacher resource 4.xls, a national travel survey, Trips to school per childper year.
Return to the original question: ‘Does a pupil’s age make a difference to theirmethod of travel to school?’ Allow a few moments for pupils to study the dataand then ask appropriate questions.
• What answers do the national data provide to our original question?For example, younger pupils are more likely to walk to school.
Extend the thinking, particularly of able pupils, at this point.
• Is this what you expected? Why?
• What could explain your conclusion?For example, look at the average distance between school and home in row 21.
Ask pupils about the difference between age groups when transport by car or vanis considered.
• Why this might be?For example, parents’ fears for the safety of their children.
Trips to and from school per child per year: by main mode, 1985–1986 and 1998–2000
Source: National travel survey, Department for Transport, Local Government and the Regions
Age 5–10 Age 11–16
Trips to school account for around one-quarter of all trips for under 16 year olds. They usually take place at the same time each morning and evening, and as such can have an impact on levels of congestion in residential areas. For example, it is calculated that at the morning peak of 8:50 am 16% of all cars on the road are taking children to school. This table shows that the majority of children aged 5–10 still walk to school, although the proportion fell from 67% in 1985–86 to 56% in 1998–2000. However, only 43% of young people aged 11–16 now travel to school on foot. One factor in these trends is the distance children live from their school. The average journey distance to school for children in Great Britain is 3.6 kilometres.
Percentages Percentages
Teacherresource 4
Teacher resource 4.xlsNational travel survey: Trips to school per child per year
• Can you suggest why this figure increased between 1985 and 2000?For example, it might be due to an increase in the proportion of familiesowning two cars.
Now ask for a quick show of hands to collate the results of homework findingsand record these on the whiteboard or flipchart, like this.
Ask pupils these questions.
• What differences do you notice between the data for yourselves and the datafor two generations back? What would explain these differences?
For example, differences between the generations in lifestyle and ownership ofprivate transport.
• Are there any differences between your own data from the previous twogenerations and the national data? Why do you think this is?
For example, our local area is rural/suburban/city, whereas the whole country isa mix of these.
• Do you think that the data you have collected are more or less reliable than thenational data?
For example, the data are less reliable because the sample is smaller and is notrepresentative of all people nationally.
• Would it be reasonable to conclude that your results, based on your local data,would be the same as results across the whole country?
For example, they may or may not be the same. It will depend on the extent towhich our sample is representative of the whole country.
Round off the lesson by telling pupils that they have been thinking about how tocompose a questionnaire to collect relevant data. They have learned why it is soimportant to consider what data they need and how to collect the informationbefore they design a structure to handle the data.
Say that in the next lesson they will complete a questionnaire and begin work ona data handling structure.
Tell pupils that in the next lesson they will investigate whether local transportprovision is adequate to meet the needs of young people who live in the area. Ask them to gather some information about the types of journey that they make,to provide background information for this investigation.
Ask pupils to record the actual journeys they have made during the last week,including the weekend. For each journey, they should record the day of the week,whether the journey was to school, for social reasons or for another purpose,such as family shopping. They should state the approximate distance, the mainmethod of travel and why they used this form of transport.
You could if you wish provide a chart, similar to the one below, for pupils tocomplete, or you may prefer them to design their own table.
Journey Day Purpose of Distance Method of Reason fornumber journey (km) travel choosing method
1
2
3
4
5
6
7
8
9
4Creating a questionnaire anddesigning a data handling filestructure to answer a key question
ICT Framework objectives
FINDING THINGS OUT
Organising and investigating• In an investigation:
– design an appropriate data handling structure;
– design a questionnaire to provide relevant data.
Key vocabulary
From Year 6: classify, questionnaire, sort
From Year 7: data structure, field, numeric, value
Preparation and planning• Make sure that you are familiar with the presentation software you will be using.
• Make sure that you are confident with the data handling software that pupils will useand that you know how to print from it. Prepare examples to demonstrate to pupilshow to create their own data file structure. If necessary, prepare guidance to helpindividual or pairs of pupils with the data handling software they will use in thelesson.
• For activity 1, you could write the questions on the whiteboard or flipchart. Youcould also prepare a reminder like the example below, on a flipchart or help sheet,to support less-confident pupils in framing their lists of questions.
Think about:
• precise wording;
• all the possible answers;
• the order of questions.
• For activity 2, prepare a short questionnaire based on the simple grid in Teacherresource 6.doc. Keep the questionnaire simple, as pupils will need to complete itduring the lesson. Enter your choice of questions in the central column of the grid butleave open at this stage the form of response (for example, ‘Yes’ or ‘No’, or ‘Choosefrom: A. car, B. train, C. bus’). You may wish to include questions such as these.
– Are you male or female?
– On how many days last week did you use local transport?
Before the start of the lesson, load the presentation Teacher resource 5.ppt, sothat it is ready to run.
Remind pupils that in the last lesson they considered how a questionnaire couldbe used to gather data about modes of transport. Refer them to the displayedobjectives for today’s lesson. Tell pupils that in this lesson they will learn moreabout framing questions for a questionnaire. They will also design their own datahandling structure so that, in the next lesson, they can enter some data on aspreadsheet and interrogate them.
Show the slide 1 of the presentation Teacher resource 5.ppt.
Slide 1
Ask pupils:
• What key pieces of information will you need to collect in order to answer thequestion on the slide?
Pupils’ suggestions may be offered as statements or questions as this stage, forexample, ‘We need to know how many young people travel on publictransport and how many don’t. If they don’t, we need to know why.’ or ‘Whydo we and our friends never use the local buses?’
Explain that the designer of a questionnaire has to consider the best way to framequestions, to gather the information needed. Show slide 2, which lists a set ofsample questions. Go through the questions one by one, stressing how thewording might affect the answer given.
This question is very open. It might be interpreted as, ‘Have you ever usedpublic transport in your whole life?’ or ‘Do you usually use public transport?’ Italso leaves some doubt about what might be classified as ‘public transport’. Forexample, is a taxi public transport?
2 Have you ever used public transport?
Again, this is a very open question that is hard to answer in a useful way. It islikely to receive a positive answer even if the respondent has not used publictransport for the last five years. Its value depends on the information you aretrying to collect, whether there is a follow-up question and what hypothesisyou are trying to prove.
3 Have you used public transport in the last week?
This is a much more precise question to which there can only be a ‘yes’ or ‘no’answer.
4 Do you usually use public transport at least once a week?
This question may yield useful information, but it could still cause somedifficulty for the person trying to answer it. What does ‘usually’ mean?
5 Do you travel by bus at least once a week?
This question is more precise. Because it asks specifically about bus travel, it willhave a ‘yes’ or ‘no’ answer. However, a respondent who travels by bus at leastonce a week except in holiday periods may not be sure how to answer.
6 What forms of public transport do you use?
This question might gather useful information. However, it has two mainweaknesses: what period of time are we asking people to consider, and do weallow them a free choice of methods or offer a selection such as ‘bus/tram/train’? The latter would result in answers that are easier to process as data.
Flip back to slide 1 of the presentation. Ask pupils in pairs to list some questionsthey could use in a questionnaire to collect information to answer the question onslide 1.
While pupils draft their questions, circulate and prompt them by asking thesequestions.
• How could you refine your wording to make your questions more precise?
• Might any groups of people have difficulty in answering that question?
• Have you thought of all the possible ways in which people might answer thatquestion?
• Will you restrict answers to that question? If so, how?
• How do you intend to classify the answers you will get? Will they answer ‘yes’or ‘no’, choose one from a list or tick all the relevant boxes?
• Have you considered the best order for your questions?
Display your prepared questionnaire based on Teacher resource 6.
Working with the whole class, ask pupils to comment on particular questions andthe structuring of possible answers. Ask:
• How should we structure the possible answers for this question? How will thisstructure help to make the data more useful?
For example, respondents will answer by choosing their method of transportfrom a list labelled A, B, C and so on. The list will limit the range of transportby grouping some methods: for example, category B will include both bus andcoach. This will make the data easier to sort and classify.
• Should we simplify the way data will be entered? Why? What difference will itmake when the data for a whole class are entered?
For example, limiting the number of key presses for each entry, by using ‘y’ for‘yes’ and ‘n’ for ‘no’, would reduce the time taken for data entry.
Give each pupil a copy of the questionnaire to complete. They should base theirresponses on the data they collected for their previous homework about thejourneys they made in a complete week.
If any pupils have not completed the homework, they can think about thejourneys they have made over the last week and base their responses on theirrecollections.
Name: ………………..............………………… Date: ………………
Questionnaire: Survey of means oftravel to school
Number Question Response
1
Teacherresource 6
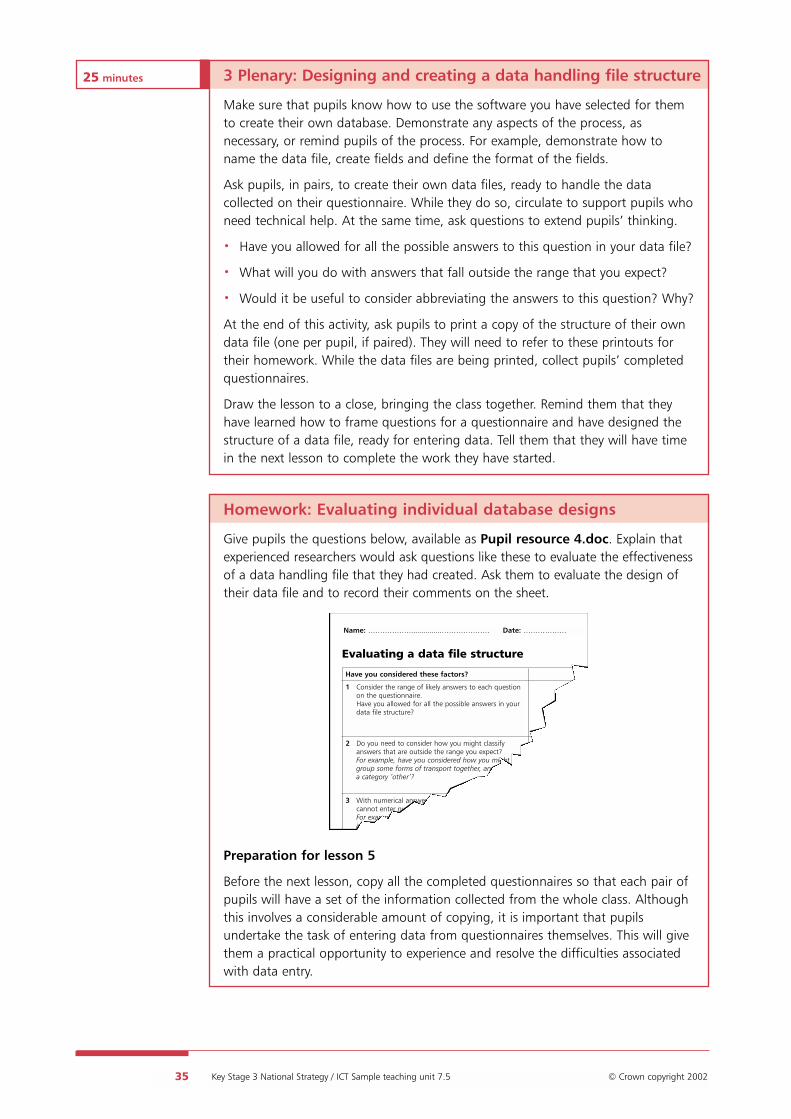
25 minutesUnit 3 Plenary: Designing and creating a data handling file structure
Make sure that pupils know how to use the software you have selected for themto create their own database. Demonstrate any aspects of the process, asnecessary, or remind pupils of the process. For example, demonstrate how toname the data file, create fields and define the format of the fields.
Ask pupils, in pairs, to create their own data files, ready to handle the datacollected on their questionnaire. While they do so, circulate to support pupils whoneed technical help. At the same time, ask questions to extend pupils’ thinking.
• Have you allowed for all the possible answers to this question in your data file?
• What will you do with answers that fall outside the range that you expect?
• Would it be useful to consider abbreviating the answers to this question? Why?
At the end of this activity, ask pupils to print a copy of the structure of their owndata file (one per pupil, if paired). They will need to refer to these printouts fortheir homework. While the data files are being printed, collect pupils’ completedquestionnaires.
Draw the lesson to a close, bringing the class together. Remind them that theyhave learned how to frame questions for a questionnaire and have designed thestructure of a data file, ready for entering data. Tell them that they will have timein the next lesson to complete the work they have started.
Homework: Evaluating individual database designs
Give pupils the questions below, available as Pupil resource 4.doc. Explain thatexperienced researchers would ask questions like these to evaluate the effectivenessof a data handling file that they had created. Ask them to evaluate the design oftheir data file and to record their comments on the sheet.
Preparation for lesson 5
Before the next lesson, copy all the completed questionnaires so that each pair ofpupils will have a set of the information collected from the whole class. Althoughthis involves a considerable amount of copying, it is important that pupilsundertake the task of entering data from questionnaires themselves. This will givethem a practical opportunity to experience and resolve the difficulties associatedwith data entry.
Evaluating a data file structure
Have you considered these factors?
3 With numerical answers, have you made sure that youcannot enter numbers outside the expected range? For example, if a field contains the distance travelledin km, have you restricted entries to numbers
2 Do you need to consider how you might classifyanswers that are outside the range you expect?For example, have you considered how you mightgroup some forms of transport together, and includeda category ‘other’?
1 Consider the range of likely answers to each questionon the questionnaire.Have you allowed for all the possible answers in yourdata file structure?
Searching and selecting• Narrow down a search to achieve more relevant results.
Organising and investigating• In an investigation:
– check data efficiently for errors;
– investigate relationships between variables;
– use software to represent data in simple graphs, charts or tables, justifying the choice of representation.
Key vocabulary
From Year 7: effectively, efficiently, enquiry, improve, numeric, revise, sort, variable
Preparation and planning• Copy Pupil resource 5.xls, one copy per pair of pupils.
• If you did not copy all the questionnaires at the end of the last lesson, copy a fullset now, one set per pair, so that pupils have a large quantity of data to enter inthe spreadsheet.
• Print a copy of Teacher resource 7.doc for your own reference during activity 1.
• Prepare your own key questions for the demonstration of data searches, usinggraphs and charts in activity 3.
• Make sure that pupils’ data handling files from lesson 4 are available.
• Import the data file Teacher resource 8.csv into the data handling software thatpupils will be using.
• If you intend to use it, enter the data from Pupil resource 5.xls into your own datahandling software for activity 3.
• Prepare your own key questions for the demonstration of data sorting andsearches using AND/OR in activity 4.
• If necessary, prepare a wall display showing pupils how to use the network system.
• If necessary, prepare guidance to help pupils with the software they will be usingin the lesson.
• Add the key vocabulary to the wall display.
• Display the lesson’s objectives in a prominent position, phrased in a way thatpupils can understand.
Point out the displayed objectives for the lesson. Explain that in this lesson pupilswill find out how easy it is to make small errors when they enter their own data.They will learn how to check data for errors and inconsistencies by using graphsand charts, and how to sort their data and make selective searches.
Distribute copies of Pupil resource 5.xls, data with errors.
Set pupils a time challenge. Ask them to study the data on Pupil resource 5.xls.Tell them that it includes several examples of incorrectly-entered data. Give them 3 minutes to identify any errors or inconsistencies, circling them on the sheet andnoting what the error is. You could refer to Teacher resource 7, which lists theerrors and inconsistencies in the data.
After 3 minutes, take feedback. As pupils identify each error or inconsistency, askthem to explain how they could resolve the problem.
Record Age in Hair colour Height number years in cm
1 8 Blonde 152
2 7 red 148
3 8 Blonde 146
4 8 Blond 140
5 9 dark 152
6 9 black 153
7 8 brown 165
8 8 brown 1.55
9 8 black 134
10 7 blonde 161
11 7 light brown 157
12 7 dark 162
13 78 black 150
14 8 brown 133
15 9 brown 152
16 7 fair 147
17 8 fair 165
18 8 fair 130
19 7 blond 133
20 9 brown 141
21
22 8 light brown 135
23 9 mixed 1143
24 8 light brown 157
25 8 black 162
26 7 blonde 150
27 7 brown 133
28 8 brown 152
29 9 light brown 138
Key points to highlight: Accuracy and consistencyof data entry
Record number 21 is blank. This may affect functionssuch as the calculations of averages or percentages asthe number of records may be counted by the software.This record should be deleted.
From the data entered in the field ‘Age’ it appears thatthe range is from 7 to 9 years. The entry in record 13 isclearly incorrect and is likely to be a typing error.
In the ‘Height’ field there are two likely errors of entry. In record 8, the information has probably been entered inmetres rather than centimetres. In record 23, the figure‘1’ may have been typed twice. In both cases the valuesare considerably outside the range normally expected.
The field ‘Hair colour’ has much potential forinconsistency of data entry. Both the spelling(blond/blonde) and the use of upper/lower case areinconsistent. This will not allow effective analysis of thedata as entries such as ‘blond’ and ‘blonde’ will beregarded as different by the software. Another point toconsider is in record 23 – what does the term ‘mixed’mean?
Teacherresource 7
Teacher resource 7.docData with list of errors and inconsistencies
Give each pair of pupils a full set of the completed questionnaires from theprevious lesson.
Ask pupils, in pairs, to load their data handling file from the previous lesson andto enter the data from the questionnaires, checking carefully for errors as they go.One pupil from each pair should read out the data from the questionnaire andthe other should enter it, using the keyboard. While pupils are working, circulateand ensure that each pupil is involved. Suggest that the pupils change roles whenthey have entered half the data.
When they have completed the task, ask pupils to check carefully for anyinconsistencies, errors or missing data.
10 minutesUnit 3 Creating graphs and charts for initial data analysis
Use the large display, with your chosen data handling software, to demonstratehow graphs and charts can be used to check for accuracy and consistency. Forexample, you could use the information in Pupil resource 5.xls to produce a graphof heights. The two data-entry errors should stand out clearly.
Ask pupils to check their own sets of data and to use graphs and charts to spotpossible errors and inconsistencies in their entries.
15 minutesUnit 4 Sorting data and using selective searching
Display Teacher resource 8.csv, imported into the data handling software thatpupils will use. Demonstrate to the whole class how to sort data. Using the sortoptions available to you, show how to find the range of foot sizes and then therange of pupils’ heights (both in centimetres).
Demonstrate how to use AND/OR to make combined searches.
• Find those pupils who have a computer AND Internet access.
• Find those pupils who have either a mobile phone OR Internet access.
Teacherresource 8
Teacher resource 8.csvData file for sorting and searching
Show more confident pupils how to narrow a search down and combine three fields.
• Find those pupils who are female AND have a computer AND have a mobilephone.
Now ask pupils to carry out some initial sorting and searching of their own data, usingAND/OR where appropriate. Remind them that they are trying to answer the question:‘Is there adequate public transport to meet the needs of young people in thiscommunity?’ The ways in which pupils will be able to sort and select from their datawill depend on the fields they have set up and the information they have entered.
5 minutesUnit 5 Plenary: Recognising the need to collect extra data to draw conclusions
Ask the whole class these questions.
• What are your provisional conclusions, based on the data available?
For example, girls in our class are more likely to travel by car than boys are;pupils in our class do not use buses much at weekends.
• Did you spot any connections between variables?
Draw out the need to collect extra data – or different data – to draw further ormore detailed conclusions. Discuss briefly the extra information or questionspupils would need to ask, to enable them to collect the extra data. For example,to find out whether pupils living close to the town centre are more likely to walkinto town, they would need to collect information about the distances from hometo the town centre.
Pupils should realise that that the answer to the question is a complex one, andthe reasons why young people choose to travel in a particular way need exploringfurther. For example, girls may travel in a family car because of parental concernfor their welfare, not because there is inadequate public transport; there may be abus every 5 minutes, but young people may choose to walk to get the exercise.
Round off the lesson by summarising the important data handling skills the pupilshave practised during the lesson – checking, sorting and selectively searching data.
Homework: Improving data collection to avoid pitfalls
Ask pupils to consider the problems or difficulties they have met during the lastthree lessons. Ask them to think about how they could have improved theprocesses of:
• designing a questionnaire to collect data;
• entering those data into their database.
Ask them to make notes under the heading: ‘How to avoid pitfalls whendesigning and using a questionnaire to gather data and entering data into a datahandling structure.
Give them a few suggestions:
• You may want to say something about the kinds of question to use, or how tomake sure that the data entered into a database are consistent and accurate.
• Perhaps you will want to make a note about checking techniques, such asusing graphs and charts.
6Drawing conclusions and selectingdata to support them
ICT Framework objectives
FINDING THINGS OUT
Organising and investigating• In an investigation:
– investigate relationships between variables;
– check whether conclusions are plausible;
– review and amend the structure and its data to answer further questions.
Key vocabulary
From Year 7: enquiry, record, search method, variable, viewpoint
Preparation and planning• Copy and cut out the cards from Pupil resource 6.doc, allowing one set of three
cards for each pupil.
• Print a copy of Teacher resource 10.doc for your own reference in the lessonstarter.
• Have available pupils’ data handling files from lessons 4 and 5.
• Prepare and duplicate a writing frame to support activity 3 (optional).
• If necessary, provide a wall display showing pupils how to use the network system.
• If necessary, prepare guidance to help pupils with the software they will be usingin the lesson.
• Add new vocabulary to the wall display.
• Display the lesson’s objectives in a prominent position, phrased in a way thatpupils can understand.
1 Starter: Ways of checking the plausibility of conclusions
Remind pupils they have already learned how to interrogate data to answer aquestion and to draw a conclusion. Explain that in this lesson they are going tolearn to consider whether their conclusions are plausible and how to chooseevidence to uphold their conclusions.
Distribute the cards from Pupil resource 6, giving each pupil a full set of threecards.
Display the first slide of Teacher resource 9.ppt on the large screen.
Explain how to play the ‘Statements’ game.
For each statement that you make, pupils must judge its plausibility and hold upone of their three cards: ‘Yes‘, ‘No’ or ‘It depends’. Pupils who hold up the ‘Itdepends’ card may be asked to explain what it depends on.
Explain that, in this version of the game, the statements that you make will beconclusions that may – or may not – be supported by the data shown. Give pupilsa few moments to familiarise themselves with the layout and content of the datadisplayed in slide 1.
Read out the statements from Teacher resource 10, one at a time, as you workthrough the slides in the presentation. After each statement, ask whether the datasupport the conclusion and wait for pupils to hold up one of their cards. If pupilshold up their ‘It depends’ card, ask them to explain.
For example, it depends on how reliable you know the source to be.
Move the game along as rapidly as possible so that pupils have to think quickly.
The activity will give you (or an extra adult) a good opportunity to observe pupils’current levels of understanding and to identify those whose responses indicateconfusion. Check these points.
• Do some pupils take longer than others to make their choice and still make anincorrect decision?
• Be aware that some pupils may take longer to hold up their cards because theyare thinking carefully and considering a range of possibilities.
• Pupils who hold up their cards quickly may be making rushed guesses.
• Some pupils may hold up their cards only when they can see what choiceothers are making.
If you want to extend the activity slightly, give pupils 2 or 3 minutes to devisetheir own statements. Play the game again, with pupils making the statementsabout the data, for example, a large proportion of those who come to school bycar live in families with two cars.
Load Teacher resource 5.ppt and display the first slide. Tell pupils that they nowhave a chance to consider the plausibility of the conclusions that they drew inlesson 5.
Slide 1
Teacher statements
Use this sheet with Teacher resource 9.
Do the data for the 33168 pupils in the survey support thesestatements?
Slide 1
• More than 11000 children travel to school by bus, about one-thirdof the total. (Yes)
• More children walk to school than use transport. (No)
• A lower proportion live in families with two or more cars than no caror one car. (No)
• Of those who walk to school, the highest proportion live in familieswith one car. (Yes)
Ask these questions to encourage pupils to consider their own data.
• How many people took part in our survey?
• Why might local data vary from national data?
For example, patterns of domestic travel in rural areas will vary considerablyfrom those in inner cities. Both will vary from the national data becausenational data are averaged.
The issues raised by pupils in this discussion will vary according to localcircumstances. Ask pupils:
• What differences in travel habits would there be between inner city and ruralareas?
For example, some city areas will have modes of transport, such as trams orrapid transit systems, that are not available in others. The length and frequencyof journeys will also vary because travel in rural areas may depend on theavailability of a car and someone to drive it, whereas in an urban area theremay be a wider and more frequent public transport system. In an urban area,facilities such as shops, cinemas and doctors’ or dentists’ surgeries will bewithin walking distance; this is not always the case in rural areas.
Remind pupils about the question: ‘Is there adequate public transport to meet theneeds of young people in this community?’ They have already collected andinterrogated data and have drawn up some provisional conclusions. They shouldnow use the skills and techniques they have learned over the last few lessons toexplore their data in more detail and come to their final conclusions.
During this activity, circulate and ask pupils these questions.
• Should you consider whether changing the way the data are presented wouldmake them more useful? For example, would it be helpful to represent anydata as percentages rather than as numbers?
• Would it help to represent at least one field of data graphically?
• Would your conclusions be different if you considered boys and girls separately?
20 minutesUnit 3 Providing evidence to support conclusions and checking for plausibility
Ask pupils in pairs to produce an outline of a report to present their conclusions,supporting them with evidence from their own data files. You could provide less-confident pupils with a writing or reporting frame for this activity.
Work either with pupils who would benefit from your help in supporting theirconclusions or with more-able pupils, intervening as appropriate to challenge theirthinking. For example, ask more-able pupils for extra or more detailed supportingevidence, or ask them to explain how the evidence supports their conclusions.
10 minutesUnit 4 Plenary: Relating conclusions to original questions
Ask each pair to tell you their conclusions. Note each response briefly on thewhiteboard or flipchart. Ask some pairs to tell you what information they have tosupport their conclusions.
Review the conclusions that pupils have reached. Discuss any anomalies.
End the lesson by telling pupils that what they have learned today will be veryuseful and relevant in other subjects. It is always important to check whether aconclusion is plausible and to be able to justify it, using available evidence.
Homework: Extending the investigation or preparing for the next unit
Set one of these alternatives.
• Provide a task to prepare pupils for the next unit of work.
• Ask pupils to describe how they would extend their investigation by listing:– the extra information they would need;– the questions they would ask in a questionnaire to gather this information;– how they would structure responses from the people that they asked.
Numeric and percentage tables and graphs of the data in Teacher resource 1
Some question types and possibleresponses
Question Possible responses Data type
What is your name? Name Free text (alphanumeric)
Are you male or female? Choice of options Limited texte.g. male or female (alphanumeric)
How old are you? A range of whole numbers Free range of numbers or limited range (numeric)
How do you usually travel Free text Free text to work? (alphanumeric)
How do you usually Choice of options Limited text travel to work? e.g. car, train, bus, walk (alphanumeric)
How do you usually Choice of options Limited characters or travel to work? e.g. car, train, bus, walk numbers,
(tick boxes) e.g. a, b, c, d, e (alphanumeric)
Notes on data types• Free text (alphanumeric)
Text may be entered in any combination of words, numbers or letters. This is thehardest type of data to use since every entry may be different. Data handlingsoftware will be unable to sort or classify the entries. This form of entry is generallyused to allow people to add extra information which they consider useful.Someone will need to read the text and draw conclusions from it.
• Limited text (alphanumeric)This may also be a mixture of letters and numbers but is limited in some way toallow a choice of options such as male/female.
• Free range of numbers or limited range (numeric)This data type includes only numbers. These may be integers or include decimalfractions. The important point is that there are no other characters. One commonmistake is the inclusion of units (such as cm). This would change the data type intoalphanumeric and mean that data handling software could not manipulate thevalues to calculate, for example, a mean.
• Limited characters or numbers, e.g. a, b, c, d or 1, 2, 3 (alphanumeric)This is often used to reduce the amount of data to be entered. Using a characterto represent a string of text means that the response or value can be entered withjust one key stroke rather than a whole word or sentence.
Key points to highlight: Accuracy and consistencyof data entry
Record number 21 is blank. This may affect functionssuch as the calculations of averages or percentages asthe number of records may be counted by the software.This record should be deleted.
From the data entered in the field ‘Age’ it appears thatthe range is from 7 to 9 years. The entry in record 13 isclearly incorrect and is likely to be a typing error.
In the ‘Height’ field there are two likely errors of entry. In record 8, the information has probably been entered inmetres rather than centimetres. In record 23, the figure‘1’ may have been typed twice. In both cases the valuesare considerably outside the range normally expected.
The field ‘Hair colour’ has much potential forinconsistency of data entry. Both the spelling(blond/blonde) and the use of upper/lower case areinconsistent. This will not allow effective analysis of thedata as entries such as ‘blond’ and ‘blonde’ will beregarded as different by the software. Another point toconsider is in record 23 – what does the term ‘mixed’mean?
Teacherresource 7
Teacher resource 7.docData with list of errors and inconsistencies
1 In 1985, how many visits were made to theUK for business purposes?
2 In which year did the number of holidayvisits first exceed 8 000 000?
3 In 1999, there were more holiday visits thanfor any other category.Is that true for every year?
4 In which year was the highest number ofholiday visits recorded?
5 How many visits to the UK for businesspurposes were recorded in total from 1978to 1999?
6 From 1980 to 1995 the number of visits tofriends or relatives roughly doubled from 2 319000 to 4602000.Did the number of miscellaneous visitschange in the same way?
7 Look at the numbers of miscellaneous visits.They changed very little over the period ofthis survey.Suggest a reason for this.
8 Since 1996 the number of holiday visits tothe UK has dropped.Why do you think that this happened?
Pupilresource 3
Pupil resource 3.docQuestion sheet for Pupil resource 2