CONTINUATION OF SURFACE WATER QUALITY MONITORING TO SUPPORT THE IMPLEMENTATION OF THE LAMPASAS RIVER WATERSHED PROTECTION PLAN Final Report TSSWCB Project # 19-54 Prepared by Texas A&M AgriLife Research Funding provided through a state nonpoint source grant from the Texas State Soil and Water Conservation Board.
Transcript
CONTINUATION OF SURFACE WATER QUALITY
MONITORING TO SUPPORT THE
IMPLEMENTATION OF THE LAMPASAS RIVER
WATERSHED PROTECTION PLAN Final Report TSSWCB Project # 19-54 Prepared by Texas A&M AgriLife Research
Funding prov ided through a s tate nonpoint source grant f rom the Texas S tate S oi l and Water Conservat ion Board .
2 | P a g e
Table of Contents
Table of Contents ............................................................................................................................ 2
List of Tables .................................................................................................................................... 4
List of Figures .................................................................................................................................. 5
Figure 28 Station 18334, North Fork Rocky Creek at FM 963 on August 11, 2020. ...................... 40
Figure 29 TCEQ's site specific standards for North Fork Rocky Creek. .......................................... 41
7 | P a g e
Acronyms
AgriLife Research Texas A&M AgriLife Research
BRA Brazos River Authority
BMP Best Management Practice
CFS Cubic feet per second
cfu/100mL colony forming units per 100 milliliters.
CRP Clean Rivers Program
DSLP Days since last precipitation
FM Farm to Market
HWY Highway
mg/L milligram per liter
Partnership Lampasas River Watershed Partnership
QAPP Quality Assurance Project Plan
SWQMIS Surface Water Quality Monitoring Information System
TCEQ Texas Commission on Environmental Quality
TIAER Texas Institute of Applied Environmental Research
TKN Total Kjeldahl Nitrogen
TP Total Phosphorus
TSSWCB Texas State Soil and Water Conservation Board
WPP Watershed Protection Plan
WQMP Water Quality Management Plans
8 | P a g e
Introduction
The Lampasas River watershed lies within the Brazos River Basin in Central Texas (Figure 1),
which drains to the Gulf of Mexico. The Lampasas River’s headwaters are in eastern Mills County
and it flows southeast for 75 miles, passing through Hamilton, Lampasas, Burnet and Bell
counties. In Bell County the river turns northeast and is dammed five miles southwest of Belton
to form Stillhouse Hollow Lake. Stillhouse Hollow Lake is the primary drinking water supply for
much of the surrounding area. Although the watershed encompasses 798,375 acres across
Mills, Hamilton, Coryell, Lampasas, Burnet, Bell, and Williamson Counties, it is primarily a rural
watershed with few urban centers. The cities of Lampasas and Kempner are wholly within the
watershed boundaries, while the cities of Copperas Cove and Killeen are only partially in the
watershed.
Figure 1 The Lampasas River watershed is a primarily rural watershed, located in Central Texas in the Brazos River basin.
9 | P a g e
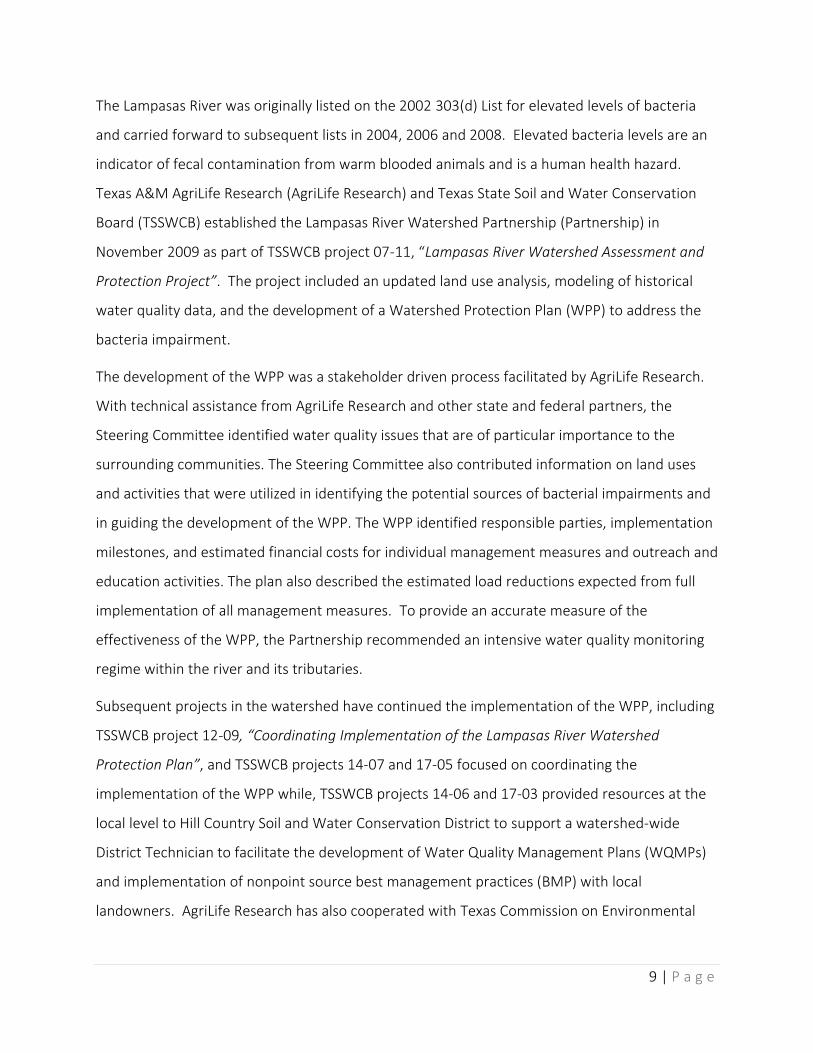
The Lampasas River was originally listed on the 2002 303(d) List for elevated levels of bacteria
and carried forward to subsequent lists in 2004, 2006 and 2008. Elevated bacteria levels are an
indicator of fecal contamination from warm blooded animals and is a human health hazard.
Texas A&M AgriLife Research (AgriLife Research) and Texas State Soil and Water Conservation
Board (TSSWCB) established the Lampasas River Watershed Partnership (Partnership) in
November 2009 as part of TSSWCB project 07-11, “Lampasas River Watershed Assessment and
Protection Project”. The project included an updated land use analysis, modeling of historical
water quality data, and the development of a Watershed Protection Plan (WPP) to address the
bacteria impairment.
The development of the WPP was a stakeholder driven process facilitated by AgriLife Research.
With technical assistance from AgriLife Research and other state and federal partners, the
Steering Committee identified water quality issues that are of particular importance to the
surrounding communities. The Steering Committee also contributed information on land uses
and activities that were utilized in identifying the potential sources of bacterial impairments and
in guiding the development of the WPP. The WPP identified responsible parties, implementation
milestones, and estimated financial costs for individual management measures and outreach and
education activities. The plan also described the estimated load reductions expected from full
implementation of all management measures. To provide an accurate measure of the
effectiveness of the WPP, the Partnership recommended an intensive water quality monitoring
regime within the river and its tributaries.
Subsequent projects in the watershed have continued the implementation of the WPP, including
TSSWCB project 12-09, “Coordinating Implementation of the Lampasas River Watershed
Protection Plan”, and TSSWCB projects 14-07 and 17-05 focused on coordinating the
implementation of the WPP while, TSSWCB projects 14-06 and 17-03 provided resources at the
local level to Hill Country Soil and Water Conservation District to support a watershed-wide
District Technician to facilitate the development of Water Quality Management Plans (WQMPs)
and implementation of nonpoint source best management practices (BMP) with local
landowners. AgriLife Research has also cooperated with Texas Commission on Environmental
10 | P a g e
Quality (TCEQ) to begin addressing potential failing on-site sewage systems through several
projects.
It is important to note that the Lampasas River was removed from the 2010 303(d) list. The
delisting of the river occurred because additional data had not been collected for assessment
between 2000 and 2009; existing historical data no longer met the TCEQ criteria to be included
in assessment. North Rocky Creek (Segment 1217D) was identified as impaired for depressed
dissolved oxygen in 2006, however a TCEQ study conducted in 2009 showed high aquatic life.
Biological data collected from North Fork Rocky Creek indicates that it supports a relatively
healthy biological community, better than that which would be expected based upon the results
of the dissolved oxygen monitoring. In 2010, the TCEQ adopted revised, site-specific standards
for dissolved oxygen in Rocky Creek which then received EPA approval. Although the site specific
standards had been approved for the segment, a minimum of ten additional data points was
necessary to assess against the new standards. TSSWCB Project 16-06 collected five of those
data points.
Over the years, other tributaries have been placed on and removed from the Integrated Reports
as concerns based on screening levels. A portion of Sulphur Creek (Assessment Unit (AU)
1217B_02) had a screening level concern for depressed dissolved oxygen, while Clear Creek (AU
1217G_01) had a screening level concern for nitrate in 2014 Integrated Report. The 2016
Integrated Report also included a new listing for Sulphur Creek (Segment 1217B_02) for not
meeting the state contact recreation standard. The most recent Integrated Report (2020) carries
forward the depressed dissolved oxygen impairment for North Fork Rocky Creek as the only
impairment in the watershed. However, there were several segments with concerns for use
attainment and screening levels. Assessment unit 1217_05 (portion of Lampasas River from
confluence with Bennett Creek upstream to its headwaters in Mills County) has a concern for
near-nonattainment of the TSWQS based on numeric criteria (CN) for bacteria in the water and a
concern for water quality based on screening levels (CS) for Chlorophyll-a in water. Assessment
unit 1217B_02 (from the spring source located in the City of Lampasas upstream to the
confluences with Bean Creek and East Fork Sulphur Creek west of Lampasas in Lampasas County)
has a CS for depressed dissolved oxygen in water.
11 | P a g e
Project Overview
AgriLife Research coordinated with Texas Institute of Applied Environmental Research (TIAER) to
implement the recommended water quality monitoring regime which was outlined in the WPP.
Historically surface water quality data was collected by the Brazos River Authority (BRA) and
TCEQ through the Clean Rivers Program (CRP) on a quarterly basis.
The sampling sites were selected by the Partnership for long term sampling (Figure 2). The
Partnership deemed these ten sites as “critical” for evaluating the effects of implementation.
These sites were identified because they will yield a dataset that is all encompassing of areas
where implementation will be focused and is spatially representative of the watershed. They felt
that uninterrupted, routine, monthly monitoring would be key to providing accurate data to
reflect changes within the watershed.
TIAER conducted routine ambient monitoring at ten sites monthly collecting field, conventional,
flow, and bacteria parameter groups. TIAER collected monthly routine flow samples over a
period of 14 months, from October 2019 through November 2020. Spatial and seasonal
variations were captured across the sampling period (Table 1). The sites included 5 mainstem
sites and 5 sites across 3 tributaries.
12 | P a g e
Figure 2 Ten monitoring sites were selected within the Lampasas River watershed for routine and biased flow monitoring. Station 18334 was added in 2018 to collect 24-hr dissolved oxygen samples.
TIAER also conducted biased flow monitoring at the 10 sites once per quarter/season under wet
weather conditions, collecting field, conventional, flow, and bacteria parameter groups. If a
13 | P a g e
routine sampling event happened to capture wet weather conditions, an additional wet weather
sample was not collected that quarter.
In addition to sampling efforts at the 10 mainstream and tributary sites, the workplan included
the collection of five 24-hr DO samples at station 18334, North Fork Rocky Creek at FM 963. This
was collected to provide the necessary data for the segment to be assessed with the TCEQ
approved revised site-specific standards.
Table 1 Samples were collected at 10 sites during routine and storm flow conditions over a 14-month period, in addition to 24-hr DO samples at station 18334.
TCEQ Station ID
Station Description Monitoring
Type Total RT RTBA
15762 Lampasas River at US 84 13 3 16
15770 Lampasas River at Lampasas CR 2925 13 3 16
16404 Lampasas River at FM 2313 13 3 16
11897 Lampasas River at US 190 13 3 16
11896 Lampasas River at HWY 195 13 3 16
18782 Sulphur Creek at Naruna Rd 13 3 16
15781 Sulphur Creek at Lampasas CR 3010 13 3 16
15250 Sulphur Creek at Lampasas CR 3050* 13 3 16
18759 Reese Creek at FM 2670 13 3 16
21016 Clear Creek at Oakalla Rd 13 3 16
18334 North Fork Rocky Creek at FM 963 5 NA 5
* The roadway name for Station 15250 changed from CR 8 to CR 3050 and the SWQM description has changed to reflect that. The QAPP utilizes the CR 8 description, but it will be referred to as CR 3050 throughout this report.
Project Highlights
Data Collection and Submittal Data collected through this project was collected under an approved Quality Assurance Project
Plan (QAPP) that was reviewed in September 2020 and updated to reflect the current project
timeline. The objective of the quality assurance task was to develop and implement data quality
objectives and quality assurance/control activities to ensure data of known and acceptable
14 | P a g e
quality are generated through this project. The QAPP was recertified in September 2020 by
project staff to ensure it accurately reflected the data collection and handling.
Highlights and Evaluation of Water Quality Monitoring Data TIAER conducted routine ambient monitoring at 10 sites monthly, collecting field, conventional,
flow, and bacteria parameter groups. The objective of the routine monitoring was to provide
sound water quality data to more accurately assess the status of the Lampasas River by
enhancing current routine ambient monitoring regimes. Analyzing this water quality data can
show trends and the effectiveness of a WPP. TIAER and AgriLife Research coordinated with other
entities, TCEQ and BRA, to avoid overlapping of resources, which allowed those agencies to focus
their limited resources in other waterbodies. TIAER’s laboratory also conducted the sample
analysis. Field parameters were pH, temperature, conductivity, and dissolved oxygen.
Conventional parameters were total suspended solids, turbidity, nitrate + nitrite nitrogen, Total
Kjeldahl Nitrogen (TKN), chlorophyll-a, pheophytin, and total phosphorus (TP). Flow parameters
were collected by electric, mechanical, or Doppler, including severity. Bacteria parameter is E.
coli. A full list of parameters and field codes can be found in Table 2.
15 | P a g e
Table 2 Measurement performance specifications of parameters collected.
PARAMETER UNITS MATRIX METHOD
PARA-
METER
CODE AWRL LOQ
LOQ CHECK
STD
%Rec
PRECISION
(RPD of LCS/LCS
dup)
BIAS
(%Rec.
of LCS) Lab
Field Parameters
pH pH/ units water SM 4500-H+ B. and
TCEQ SOP, V1 00400 NA NA NA NA NA Field
DO mg/L water SM 4500-O G. and
TCEQ SOP, V1 00300 NA NA NA NA NA Field
Specific
Conductance
µS/cm water SM 2510 and
TCEQ SOP, V1 00094 NA NA NA NA NA Field
Temperature oC water SM 2550 and
TCEQ SOP, V1
00010 NA NA NA NA NA Field
Flow cfs water TCEQ SOP, V1 00061 NA NA NA NA NA Field
Days since
precipitation event
days water TCEQ SOP V1 72053 NA NA NA NA NA Field
Flow measurement
method
1-gage
2-electric
3-mechanical
4-weir/flume
5-doppler
water TCEQ SOP, V1 89835 NA NA NA NA NA Field
Flow severity 1-no flow
2-low
3-normal
4-flood
5-high 6-dry
water TCEQ SOP, V1 01351 NA NA NA NA NA Field
Flow Estimate cfs water TCEQ SOP, V1 74069 NA NA NA NA NA Field
Maximum pool
width at time of
study1
meters other TCEQ IGD 89864 NA NA NA NA NA Field
Maximum pool
depth at time of
study1
meters other TCEQ IGD 89865 NA NA NA NA NA Field
Pool length1 meters other TCEQ IGD 89869 NA NA NA NA NA Field
% pool coverage in
500-meter reach1
meters other TCEQ IGD 89870 NA NA NA NA NA Field
Conventional and Bacteriological Parameters
TSS mg/L water SM 2540 - D 00530 4 4 NA NA NA TIAER
Chlorophyll-a,
spectrophotometric
method
µg/L water SM 10200 - H 32211 3 3 NA NA NA TIAER
16 | P a g e
Pheophytin,
spectrophotometric
method
µg/L water SM 10200 - H 32218 3 3 NA NA NA TIAER
E. coli, modified
mTEC CFU/100mL water EPA 16032 31648 1 1 NA 0.53 NA TIAER
Total Kjeldahl
Nitrogen mg/L water SM 4500 – NH3 G 00625 0.2 0.2 70-130 20 80-120 TIAER
Nitrate+Nitrite-N,
total mg/L water SM 4500 – NO3 F 00630 0.05 0.05 70-130 20 80-120 TIAER
Total Phosphorus mg/L water EPA 365.4 00665 0.06 0.06 70-130 20 80-120 TIAER
Data Summaries Routine and Storm Samples Beginning October 17, 2019 through November 10, 2020, monthly routine sampling events were
conducted. During the first 5 months of sampling, site 15762, the most upstream sites, was
routinely pooled, or dry. During that same period, 5 routine events had pools insufficient to
collect samples from. Additionally, although storm samples were collected at all other sites on
February 12, 2020, site 15762 remained insignificantly pooled to collect a sample. From March
through July, all sites were flowing or had pools significant enough to collect samples from.
During the routine sampling event on August 11, 2020, site 15762 was not flowing and had an
insignificant pool and therefore not sampled. During the same sampling event, site 15770 was
not flowing, but did have a significant pool, so a sample was collected.
The 3 remaining mainstem sites had routine flow, as did the 5 tributary sites during the sampling
period.
Dissolved Oxygen Events TIAER collected 24-hr DO measurements at station 18334 during five events over the project
period. The 24-hr monitoring was done in conjunction with routine monthly monitoring, spaced
throughout the year and allowing at least a month separation between 24-hr events. Two
samples were collected in the Non-Index Period (January – March 14 and October 16 –
December), while three were collected during the Index Period (March 15 – October 15). Of the
three collected during the Index Period, two were collected during the Critical Period (July 1 –
October 15).
17 | P a g e
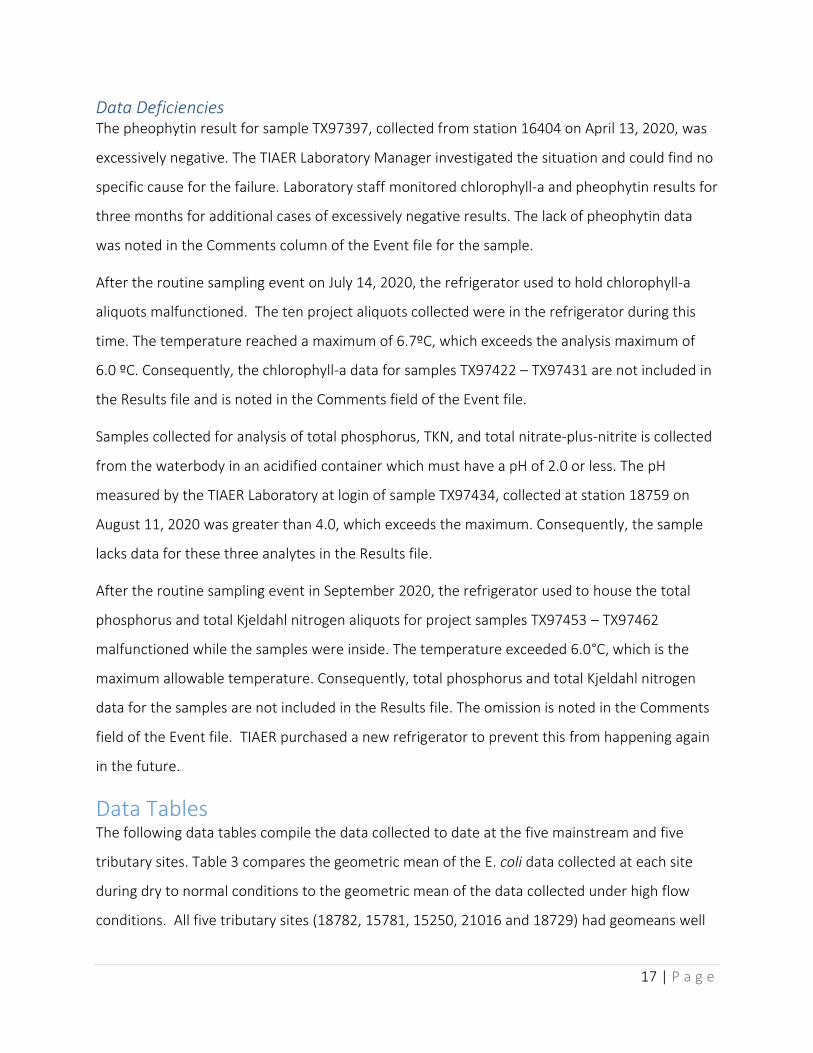
Data Deficiencies The pheophytin result for sample TX97397, collected from station 16404 on April 13, 2020, was
excessively negative. The TIAER Laboratory Manager investigated the situation and could find no
specific cause for the failure. Laboratory staff monitored chlorophyll-a and pheophytin results for
three months for additional cases of excessively negative results. The lack of pheophytin data
was noted in the Comments column of the Event file for the sample.
After the routine sampling event on July 14, 2020, the refrigerator used to hold chlorophyll-a
aliquots malfunctioned. The ten project aliquots collected were in the refrigerator during this
time. The temperature reached a maximum of 6.7ºC, which exceeds the analysis maximum of
6.0 ºC. Consequently, the chlorophyll-a data for samples TX97422 – TX97431 are not included in
the Results file and is noted in the Comments field of the Event file.
Samples collected for analysis of total phosphorus, TKN, and total nitrate-plus-nitrite is collected
from the waterbody in an acidified container which must have a pH of 2.0 or less. The pH
measured by the TIAER Laboratory at login of sample TX97434, collected at station 18759 on
August 11, 2020 was greater than 4.0, which exceeds the maximum. Consequently, the sample
lacks data for these three analytes in the Results file.
After the routine sampling event in September 2020, the refrigerator used to house the total
phosphorus and total Kjeldahl nitrogen aliquots for project samples TX97453 – TX97462
malfunctioned while the samples were inside. The temperature exceeded 6.0°C, which is the
maximum allowable temperature. Consequently, total phosphorus and total Kjeldahl nitrogen
data for the samples are not included in the Results file. The omission is noted in the Comments
field of the Event file. TIAER purchased a new refrigerator to prevent this from happening again
in the future.
Data Tables The following data tables compile the data collected to date at the five mainstream and five
tributary sites. Table 3 compares the geometric mean of the E. coli data collected at each site
during dry to normal conditions to the geometric mean of the data collected under high flow
conditions. All five tributary sites (18782, 15781, 15250, 21016 and 18729) had geomeans well
18 | P a g e
within the state’s standards for Contact Recreation 1 during routine monitoring events as did the
three most downstream sites on the mainstem of the Lampasas River (16404, 11897, 11896).
19 | P a g e
Table 3 Concentrations of E. coli during routine and biased flow conditions at all sites.
TCEQ Station Description
Monitoring Type
Routine Mainstem or Tributary Sample Biased flow Sample Total
1Number of samples collected. 2Percent change in pollutant between wet and dry flows. Positive change indicates an increase in pollutant load with rainfall. Negative change indicates that rainfall is diluting the base flow pollutant concentration
Table 4 shows the mean of the concentrations of total phosphorus (TP) at the routine sites.
Although at no time or under any flow conditions did the mean exceed the screening
concentration of 0.69 milligrams per liter, there was a significant increase in total phosphorus
during wet weather conditions at all but 1 site, Clear Creek at Oakalla Rd., which showed a
decrease in high flow.
20 | P a g e
Table 4 Concentrations of Total Phosphorus during routine and biased flow conditions at all sites.
1Number of samples collected. 2Percent change in pollutant between wet and dry flows. Positive change indicates an increase in pollutant load with rainfall. Negative change indicates that rainfall is diluting the base flow pollutant concentration
21 | P a g e
Table 5 is the mean of the concentrations of Total Kjeldahl Nitrogen at the routine sites. There was a
decrease during high flow conditions at all sites.
Table 5 Concentrations of Total Kjeldahl Nitrogen (TKN) under low to normal and high flow conditions at all monitoring sites.
1Number of samples collected. 2Percent change in pollutant between wet and dry flows. Positive change indicates an increase in pollutant load with rainfall. Negative change indicates that rainfall is diluting the base flow pollutant concentration
22 | P a g e
Lampasas River Mainstem Stations
15762: Lampasas River at US 84 The Lampasas River at US Hwy 84 monitoring site (station 15762, Error! Reference source not
found. and Figure 5) is located in the northern portion of the watershed in western Hamilton
County and is the most upstream sampling location. The upstream drainage area is primarily
rangeland and is approximately 56 square miles. From November 2019 thru February 2020, no
samples were collected due to insufficient pool size per TCEQ SWQM standards. Out of 13
routine samples collected during the project period, 3 were collected in pools and 6 events
collected no samples due to insufficient pool size. In addition, 1 biased flow sample was not
collected due to an insignificant pool as well.
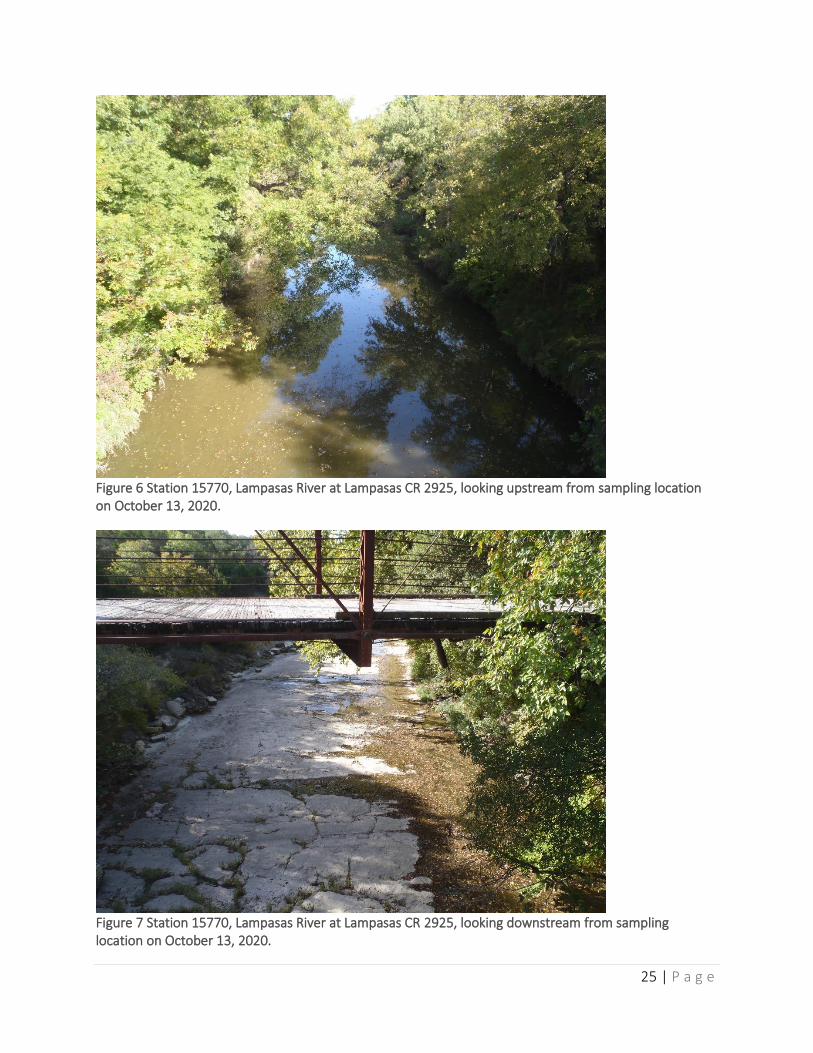
15770: Lampasas River at CR 2925 The Lampasas River at Lampasas County Rd 2925 monitoring station (station 15770, Error! R
eference source not found. and Figure 7) is located in northern Lampasas County approximately
2.5 miles downstream of the Bennett Creek confluence. The upstream drainage area is primarily
rangeland and is 279 square miles. Like the station upstream, flows at this site were typically low
during the summer and early fall months. However, the stream was flowing for all 13 routine
sample collections, except for the sample collected on August 11, 2020.
16404: Lampasas River at FM 2313 The Lampasas River at FM 2313 monitoring station (station 16404, Figure 8 and Figure 9) is
located in southern Lampasas County approximately 2.8 miles upstream of the Sulphur Creek
confluence. The upstream drainage area is primarily rangeland and encompasses 614 square
miles. Due to the larger drainage area, this station was flowing during collection of all 13 routine
sampling events.
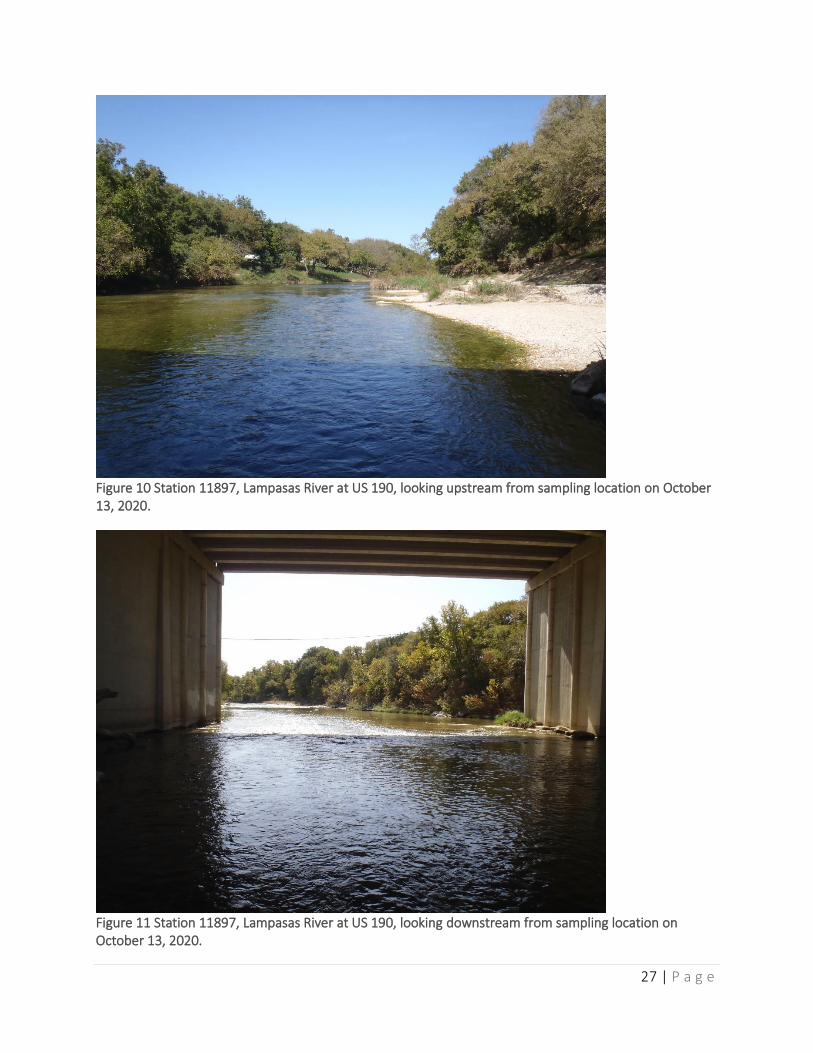
11897: Lampasas River at US 190 The Lampasas River at US HWY 190 monitoring station (station 11897, Figure 10 and Figure 11) is
located in southern Lampasas County approximately 0.8 miles downstream of its confluence
with Sulphur Creek. The upstream drainage area is primarily rangeland although its summer
23 | P a g e
flows are heavily influenced by Sulphur Creek, which includes the city of Lampasas. The total
upstream drainage area for this site is 816 square miles.
11896: Lampasas River at HWY 195 The Lampasas River at State HWY monitoring station (station 11896, Figure 12 and Figure 13) is
located in eastern Bell County, approximately 7 miles upstream of its confluence with Stillhouse
Hollow Lake. The upstream drainage area is primarily rangeland, but the area also includes
drainage from tributaries that encompass the Cities of Lampasas, Kempner, Copperas Cove, and
Killeen. This is the most downstream station for the Lampasas River. The total drainage area for
this station is 1,195 square miles. This site was flowing for all 13 routine sampling events for this
project.
24 | P a g e
Figure 4 Station 15762, Lampasas River at US 84, looking upstream from sampling location on October 13, 2020.
Figure 5 Station 15762, Lampasas River at US 84, looking downstream from sampling location on October 13, 2020.
25 | P a g e
Figure 6 Station 15770, Lampasas River at Lampasas CR 2925, looking upstream from sampling location on October 13, 2020.
Figure 7 Station 15770, Lampasas River at Lampasas CR 2925, looking downstream from sampling location on October 13, 2020.
26 | P a g e
Figure 8 Station 16404, Lampasas River at Lampasas FM 2313, looking upstream from sampling location on October 13, 2020.
Figure 9 Station 16404, Lampasas River at Lampasas FM 2313, looking downstream from sampling location on October 13, 2020.
27 | P a g e
Figure 10 Station 11897, Lampasas River at US 190, looking upstream from sampling location on October 13, 2020.
Figure 11 Station 11897, Lampasas River at US 190, looking downstream from sampling location on October 13, 2020.
28 | P a g e
Figure 12 Station 11896, Lampasas River at HWY 195, looking upstream from sampling location on October 13, 2020.
Figure 13 Station 11896, Lampasas River at HWY 195, looking downstream from sampling location on October 13, 2020.
29 | P a g e
Analysis of Lampasas River Mainstem Data for Trends Although a 13-month sampling period is not temporally robust enough for most statistical
analysis, it is interesting to look at the relationship between E. coli and the Days Since Last
Precipitation (DSLP) parameters. The following figures (A-E) illustrate the (log of) E. coli sample
collected plotted on the X axis against the number of days since last precipitation on the Y axis.
The red line illustrates the state standard of 126 cfu/100mL). As you move downstream, the
number of samples that exceed 126 cfu/100mL during drier periods (more than 7 days since last
precipitation) decreases. This may indicate that as baseflow increases, the E. coli concentration
decreases. This same trend was seen while analyzing the data collected during the previous
project as well.
(A)
Lampasas River
at US 84
Station 15762
(B)
Lampasas River
at Lampasas CR 2925
Station 15770
30 | P a g e
(C)
Lampasas River
at FM 2313
Station 16404
(D)
Lampasas River
at US 190
Station 11897
(E) Lampasas River
at HWY 195 Station 11896
Figure 14A-E Log of E. coli plotted against DSLP for each sample on the mainstem of the Lampasas River.
31 | P a g e
Major Tributary Stations
18782: Sulphur Creek at Naruna Road The Sulphur Creek at Naruna Rd monitoring station (station 18782, Error! Reference source not f
ound. and Error! Reference source not found.) is located in southern Lampasas County. This
station is upstream from the city of Lampasas, although the upstream drainage area is primarily
rangeland. The drainage above this station is 81 square miles.
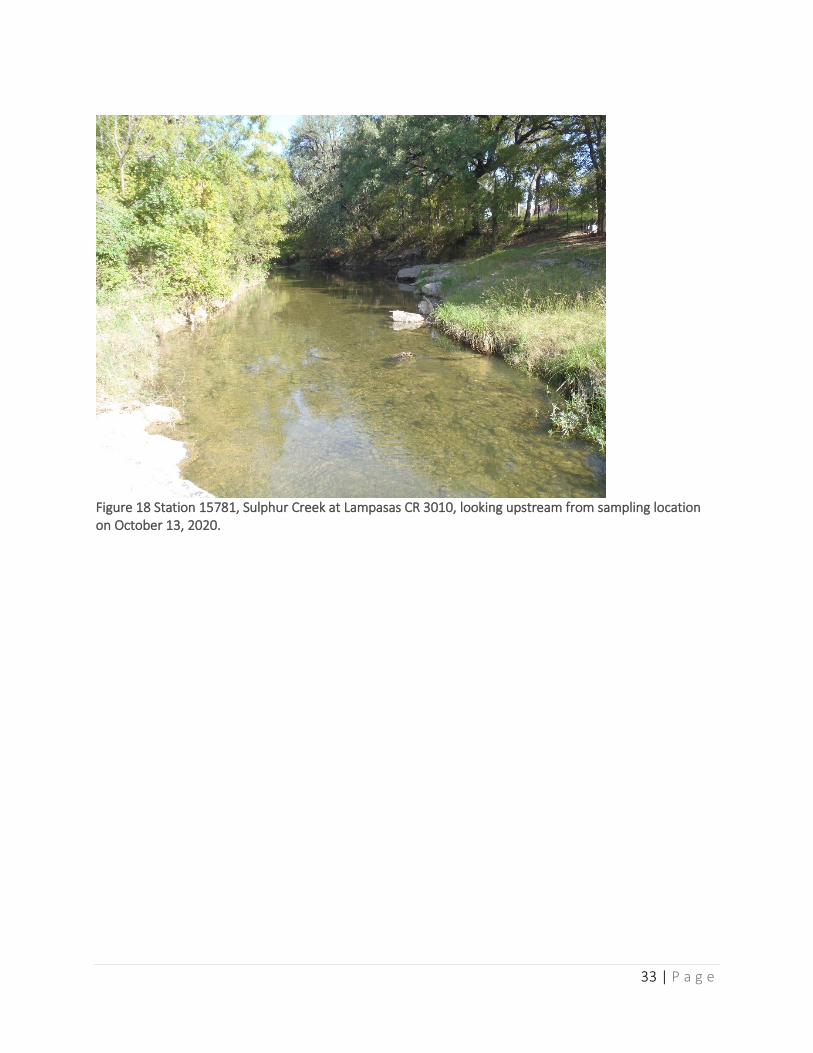
15781: Sulphur Creek at CR 3010 The Sulphur Creek at Lampasas County Rd 3010 monitoring station (station 15781, Figure 18 and
Figure 19) is located in southern Lampasas County, several miles east of the city of Lampasas.
This station is down stream from station 18782 and has a drainage area of 107 square miles.
15250: Sulphur Creek at CR 3050 The Sulphur Creek at CR 3050 monitoring station (station 15250, Figure 20 and Figure 21) is
located in southern Lampasas County, approximately 1.5 miles upstream from Sulphur Creek’s
confluence with the Lampasas River. This station the most downstream site on Sulphur Creek
and has a drainage area of 130 square miles.
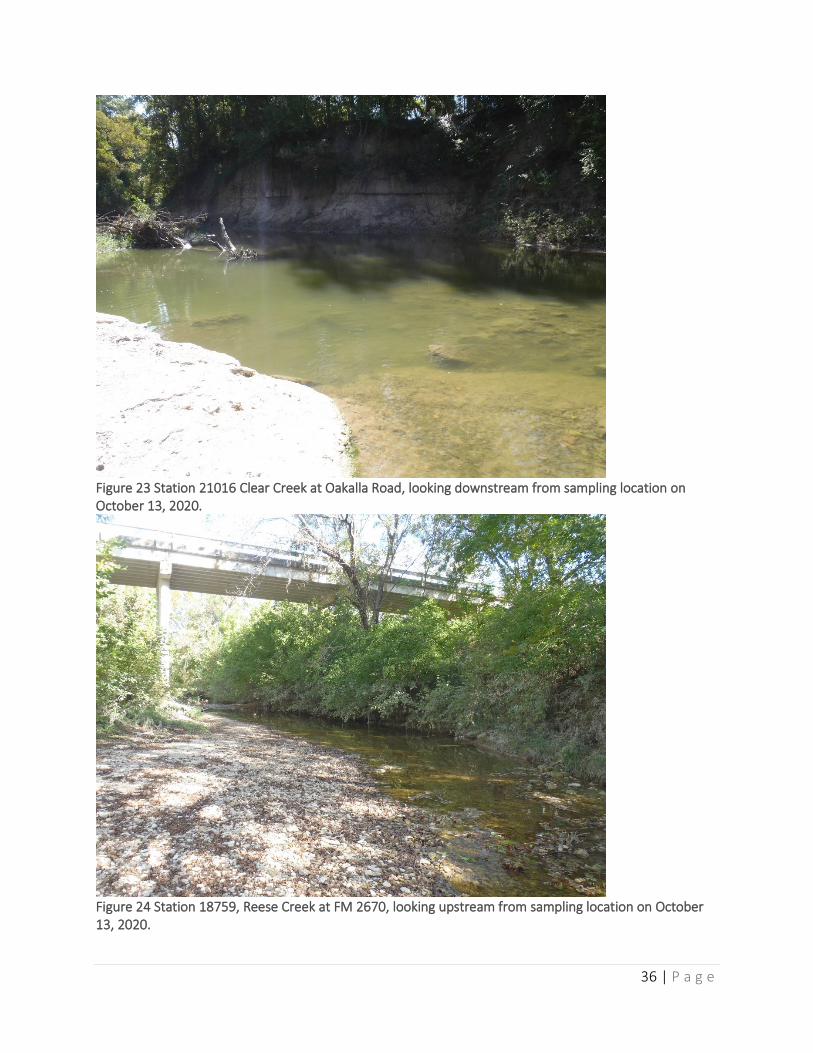
21016: Clear Creek at Oakalla Road The Clear Creek at Oakalla Road monitoring station (station 21016, Figure 22 and Figure 23) is
located in eastern Burnet County, approximately 0.5 miles upstream from its confluence with the
Lampasas River. Clear Creek originates in southwestern area of the city of Copperas Cove and is
partially residential/urban and partially rangeland land use. The drainage area for this station is
30 square miles.
18759: Reese Creek near FM 2670 The Reese Creek near FM 2670 monitoring station (station 18759, Figure 24 and Figure 25) is
located in western Bell County, approximately 0.4 mile upstream from its confluence with the
Lampasas River. Reese Creek originates in southwestern area of the city of Killeen and is partially
residential/urban and partially rangeland land use. The drainage area for this station is 29
square miles.
32 | P a g e
Figure 16 Station 18782, Sulphur Creek at Naruna Road, looking upstream from sampling location on November 10, 2020.
Figure 17 Station 18782, Sulphur Creek at Naruna Road, looking downstream from sampling location on November 20, 2020.
33 | P a g e
Figure 18 Station 15781, Sulphur Creek at Lampasas CR 3010, looking upstream from sampling location on October 13, 2020.
34 | P a g e
Figure 19 Station 15781, Sulphur Creek at Lampasas CR 3010, looking downstream from sampling location on October 13, 2020.
Figure 20 Station 15250, Sulphur Creek at CR 3050, looking upstream from sampling location on October 13, 2020.
35 | P a g e
Figure 21 Station 15250, Sulphur Creek at CR 3050, looking downstream from sampling location on October 13, 2020.
Figure 22 Station 21016 Clear Creek at Oakalla Road, looking upstream from sampling location on October 13, 2020.
36 | P a g e
Figure 23 Station 21016 Clear Creek at Oakalla Road, looking downstream from sampling location on October 13, 2020.
Figure 24 Station 18759, Reese Creek at FM 2670, looking upstream from sampling location on October 13, 2020.
37 | P a g e
Figure 25 Station 18759, Reese Creek at FM 2670, looking downstream from sampling location on October 13, 2020.
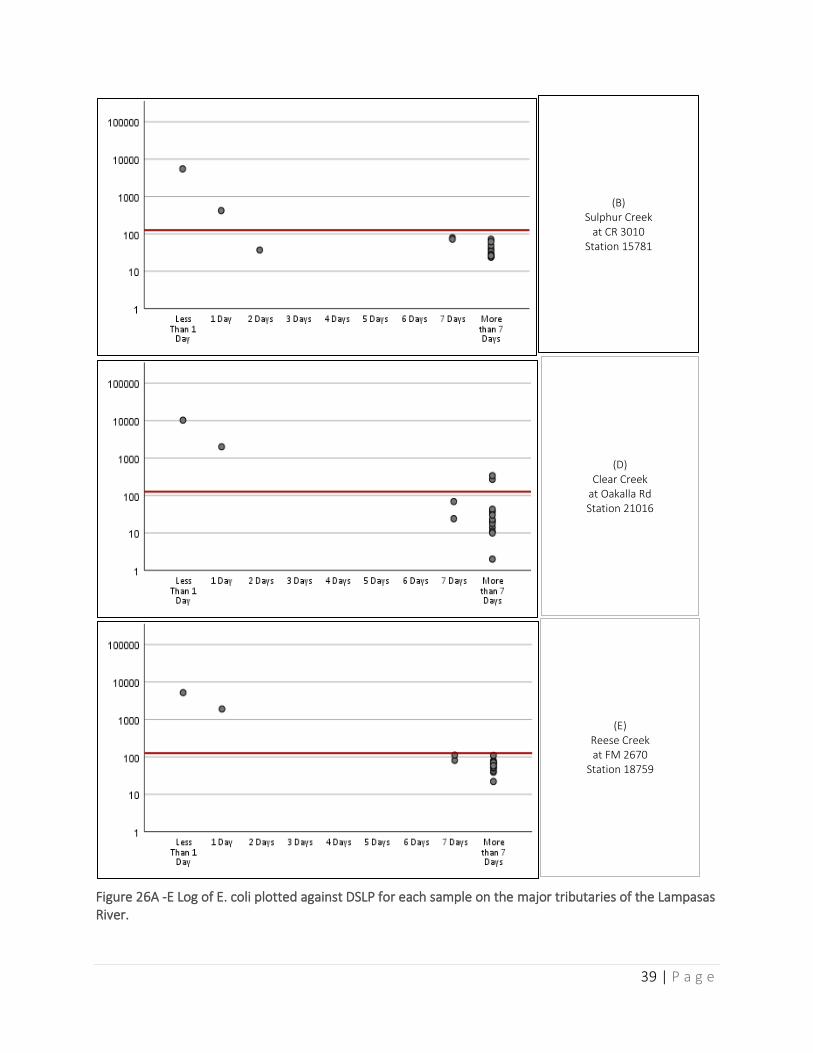
Analysis of Major Tributary Stations Data for Trends Again, a 13-month data period is not temporally robust enough for significant statistical tests,
but it is interesting to look at the relationship between E. coli and the Days Since Last
Precipitation (DSLP) parameters. The following Figure 26 (A-E) illustrates the (log of) E. coli
samples collected plotted on the X axis against the number of days since last precipitation on the
Y axis. The red line illustrates the state standard of 126 cfu/100mL). Those stations on Sulphur
Creek, the only station with sampling points above 126 cfu/100mL is the most upstream station,
18782. As you move downstream, there are no samples that exceed 126 cfu/100mL during drier
periods (more than 7 days since last precipitation). Additionally, when looking at the stations on
Clear Creek and Reese Creek, only Clear Creek has sampling points above the state standard
during the drier periods.
38 | P a g e
(A) Sulphur Creek at Naruna Rd Station 18782
(C) Sulphur Creek
at CR 3050 Station 15250
39 | P a g e
Figure 26A -E Log of E. coli plotted against DSLP for each sample on the major tributaries of the Lampasas River.
(B) Sulphur Creek
at CR 3010 Station 15781
(D) Clear Creek
at Oakalla Rd Station 21016
(E) Reese Creek at FM 2670
Station 18759
40 | P a g e
Analysis of 24 HR DO Sampling
As mentioned in the project overview, the collection of five 24-Hr DO samples at North Fork
Rocky Creek (station 18334, Figure 27) was included in this project. North Fork Rocky Creek was
a part of a special study conducted by TCEQ in 2009. TCEQ evaluated sources of oxygen-
demanding materials and their impacts on dissolved oxygen in the creek. In addition to the
collection of 24-hour dissolved oxygen data over a two-year period between August 2002 and
September 2004, biological data was also collected. Data indicated that it supports a relatively
healthy biological community, better than that which would be expected based on the results of
the dissolved oxygen monitoring. In 2010, the TCEQ adopted revised, site-specific standards for
dissolved oxygen in Rocky Creek.
Figure 27 Station 18334, North Fork Rocky Creek at FM 963 on August 11, 2020.
Although the standards were adopted (Figure 28), no additional data had been collected within
the segment to be used in assessment until the previous Lampasas SWQM project (TSSWCB #16-
06). Project partners were able to reallocate funds that had been earmarked for biased flow
samples to allow collection of 24-Hr DO samples to be used in future assessments. This project
41 | P a g e
collected an additional 5 samples to be used in future assessments. Table 6 is a summary of the
sample events collected during both projects; samples highlighted in blue were collected in this
project.
Figure 28 TCEQ's site specific standards for North Fork Rocky Creek.
Station 18334 Flow
Dissolved Oxygen Specific Conductance Temp pH
Deployment Retrieval Min Max Average Min Max Average Min Max Average Min Max