Geological Society of America North-Central Section 49 th Annual Meeting Madison, Wisconsin May 20, 2015 County Geologic Atlas and State Special Appropriations of the Minnesota Legislature and LCCMR Continued work on using the horizontal-to-vertical spectral ratio (HVSR) passive seismic method for determining Quaternary sediment thickness in Minnesota Val W. Chandler and Richard S. Lively, Minnesota Geological Survey, 2609 Territorial Rd. , St. Paul, MN 55114 [email protected]USGS STATEMAP PROGRAM
Transcript
Geological Society of America
North-Central Section
49th Annual Meeting
Madison, Wisconsin
May 20, 2015
County Geologic Atlas and State Special
Appropriations of the Minnesota Legislature
and LCCMR
Continued work on using the horizontal-to-vertical spectral ratio (HVSR) passive seismic method for determining Quaternary
sediment thickness in Minnesota
Val W. Chandler and Richard S. Lively, Minnesota Geological Survey, 2609 Territorial Rd. , St. Paul, MN 55114 [email protected]
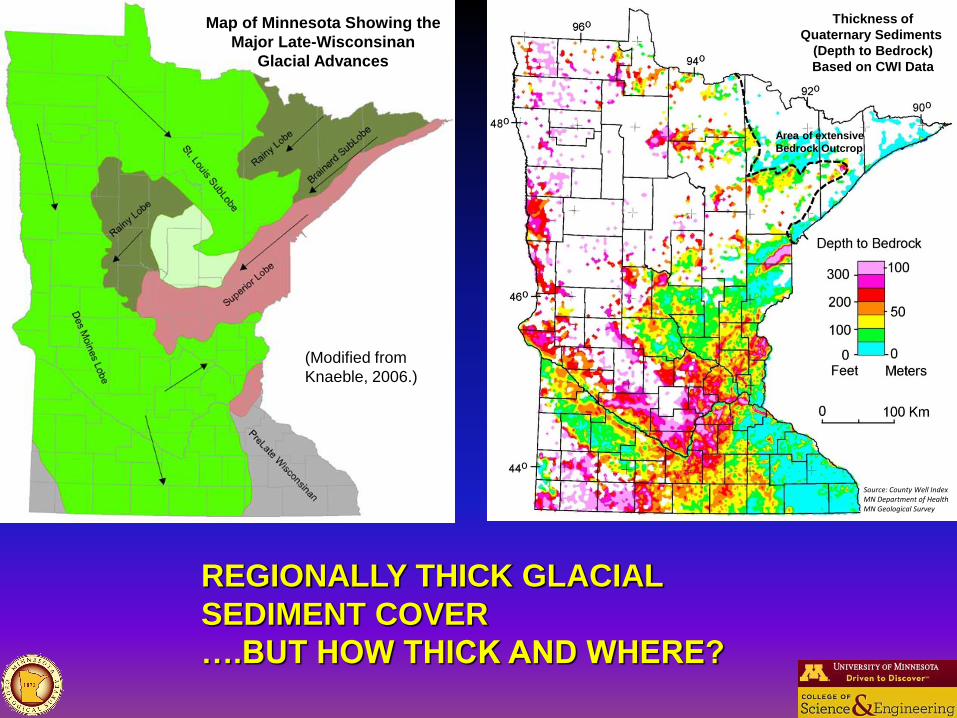
Source: County Well Index MN Department of Health MN Geological Survey
Map of Minnesota Showing the
Major Late-Wisconsinan
Glacial Advances
(Modified from
Knaeble, 2006.)
REGIONALLY THICK GLACIAL
SEDIMENT COVER
….BUT HOW THICK AND WHERE?
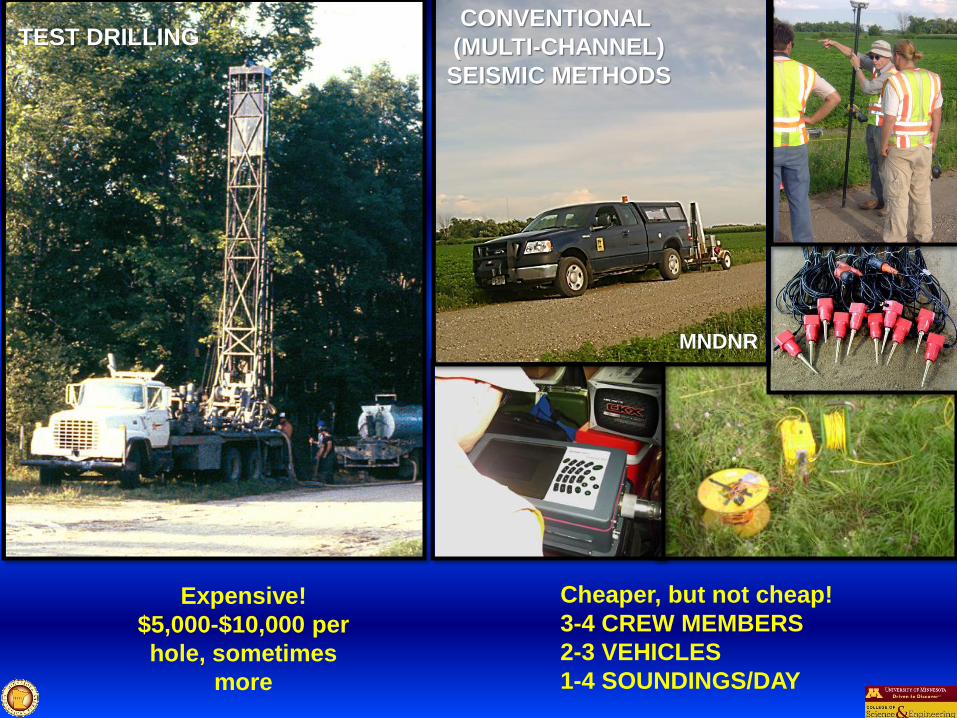
CONVENTIONAL
(MULTI-CHANNEL)
SEISMIC METHODS
MNDNR
TEST DRILLING
Cheaper, but not cheap!
3-4 CREW MEMBERS
2-3 VEHICLES
1-4 SOUNDINGS/DAY
Expensive!
$5,000-$10,000 per
hole, sometimes
more
PASSIVE SEISMIC
DATA ACQUIRED BY
THE MGS AS OF
05/15/2015
1431 Stations acquired,
446 of which are within
200m of a Bedrock
control point
Twin Cities
Metro Area
South-
Central
Area
WaBeHuCa
Area Arrowhead
Area
HVSR CALIBRATION: METRO AREA
41 control stations selected for
calibration shown as white circles
Afton
Pkf=9.69 Hz
Dbr=25 ft.
Hugo
Pkf=2.89 Hz
Dbr=92 ft.
Moundsview
Pkf=1.56 Hz
Dbr=204 ft.
Inver Grove Hts.
Pkf=1.02 Hz
Dbr=450 ft.
Afton
Moundsview Hugo
Inver Grove Hts.
- Convenient
- On-going Projects
- Potential Demand
- Simple Glacial Strat.
- Flat-lying Bedrock
Log HVSR Peak Frequency (Hz)
Lo
g O
bs
erv
ed
Dep
th t
o B
ed
roc
k (
m)
HVSR CALIBRATION: METRO AREA
Ibs-von Seht and Wohlenberg, 1999
z=a*frb
41 Control stations selected for
calibration shown as white circles Percent Error:
26 (63%) within +/- 15%
37 (90%) within +/-25%
Estimated Vs (m/sec)
Dep
th (
m)
Estimated Average
Shear-Wave Velocity
Velocity curve based
on Power relationship,
as given above
Points based on
VS=4*z*fHVSR
a=129
b=-1.295
R=0.968
Narrow Buried Valley Problem,
Washington County, Minnesota
Bedrock
Topography
Cottage Grove Area
Small Dots=Wells with DBR
Red Circles=HVSR stations
Narrow Buried Valley Problem,
Washington County, Minnesota
Bedrock
Topography
Lake Elmo Area
Small Dots=Wells with DBR
Red Circles=HVSR stations with DBR
CALIBRATION OF HVSR RESULTS
FOR RIVERENE SEDIMENTS
Shear-Wave Velocity (m/sec)
Dep
th (
m)
H/V Peak Frequency (Hz)
Ob
se
rve
d D
ep
th t
o B
ed
roc
k (
m)
Percent Error:
16 (47%) within +/- 15%
28 (82%) within +/-25%
Some Excellent
HVSR Curves!
Riverene Curve
a = 83
b = -1.232
R=0.952
Velocity curve based
on Power relationship,
as given above
Points based on
VS=4*z*fHVSR
Metro Velocity
Curve
34 “Riverene”
Control Points
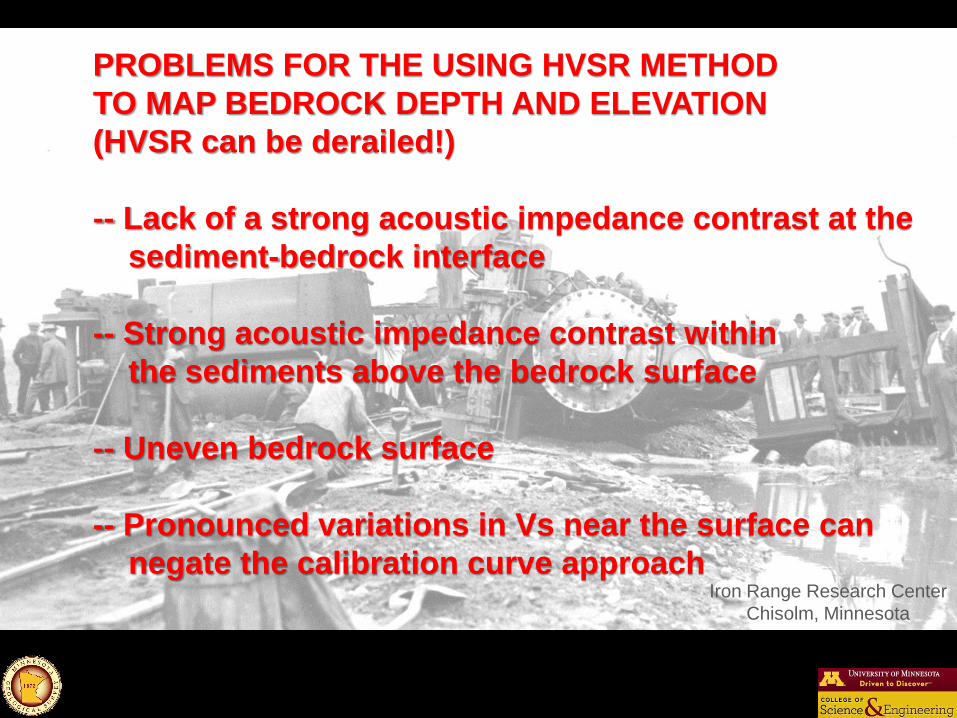
PROBLEMS FOR THE USING HVSR METHOD
TO MAP BEDROCK DEPTH AND ELEVATION
(HVSR can be derailed!)
-- Lack of a strong acoustic impedance contrast at the
sediment-bedrock interface
-- Strong acoustic impedance contrast within
the sediments above the bedrock surface
-- Uneven bedrock surface
-- Pronounced variations in Vs near the surface can
negate the calibration curve approach
Iron Range Research Center
Chisolm, Minnesota
Soft sediment?
Hard Bedrock?
RED = WELLS ENCOUNTERING
FRESH BEDROCK
BLACK=WELLS ENCOUNTERING
SOFT BEDROCK (CRETACEOUS
SEDIMENTS, SAPROLITE)
Cretaceous Strata Nicollet County, MN Dale Setterholm Photo
Bedrock Saprolite Renville County, MN Northern Con Ag Photo
Split core of Old Gray till Renville County, MN Al Knaeble Photo
Source: County Well Index MN Department of Health MN Geological Survey
Some Results Good,
Some Not So Good
WRR1_271951
GIBBON_PARK WRR1
GIB
MCLE1
DNR_770442
MCLE
DNR
HVSR CALIBRATION IN
SOUTH CENTRAL MINNESOTA:
Log HVSR Peak Frequency (Hz)
Lo
g O
bs
erv
ed
Dep
th t
o B
ed
roc
k (
m)
HVSR CALIBRATION: SOUTH CENTRAL AREA
Ibs-von Seht and Wohlenberg, 1999
z=a*frb
41 control stations selected for
calibration shown as white circles
White Circles:
29 “Ideal” Points
(No Cretaceous,
no saprolite) used
for calibration
a=135.92
b=-1.2364
R=0.95365
Ideal Combined = RED
Ideal Peak Only = Blue
(GT 100 M)
Log HVSR Peak Frequency (Hz)
Lo
g O
bs
erv
ed
De
pth
to
Bed
roc
k (
m)
Ideal bedrock = Open white
Saprolith bedrock = Orange
Cretaceous bedrock = Green
a=135.92
b=-1.2364
R=0.95365
HVSR TIME HISTORY
HORIZONTAL TO VERTICAL SPECTRAL RATIO (HVSR)
UNEVEN BEDROCK SURFACE:
ARROWHEAD PROJECT
NORTHERN ISABELLA AREA
STATION AR137
1/4 Mile Green polygons = outcrops
DIRECTIONAL HVSR
Station AR137
Using Calibration Curves: Beware of near-surface
Velocity variations!
Case in point: The Arrowhead Project
Loon Poo:
(Organic Deposits)
Extremely Low Vs
Outwash and
Fluviolacustrine
Deposits:
Low to Intermediate
Vs
Dense, Rocky Till:
High Vs
Photo-Griffin Williams
Photo-Carrie Jennings
Photo-Mark Jirsa
HVSR Frequency (Hz)
Depth
to B
edro
ck (
m)
Shear-Wave Velocity (m/sec) D
epth
to B
edro
ck (
m)
METRO AREA CALIBRATION AND VELOCITY CURVES
HORIZONTAL TO VERTICAL SPECTRAL RATIO (HVSR)
ARROWHEAD AREA
NEAR ISABELLA
DENSE, ROCKY TILL NEAR SURFACE
Well 243109 118 ft. of a gravely, bouldery till over fresh bedrock
Station CDC-9 HVSR Peak = 4.61 Hz. Est. Dbr = 60 ft. Vs_est = 663 m/sec
Photo-Mark Jirsa
Station CDC-9 Exposure of dense, rocky till,
Mesabi Range
Red dots= HVSR Stations
1 Mile
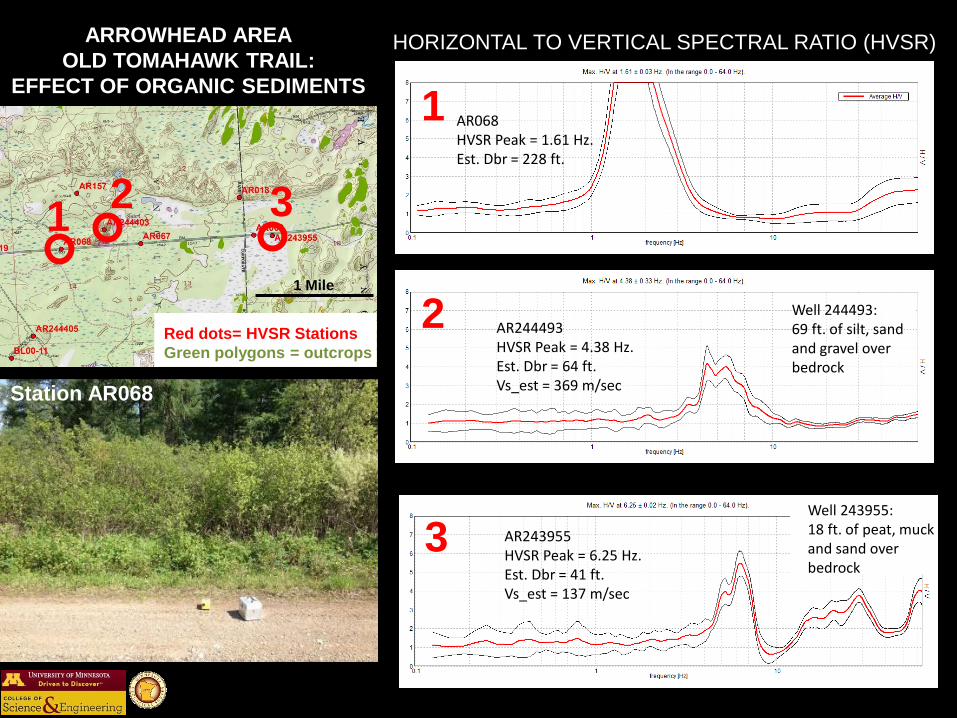
HORIZONTAL TO VERTICAL SPECTRAL RATIO (HVSR) ARROWHEAD AREA
OLD TOMAHAWK TRAIL:
EFFECT OF ORGANIC SEDIMENTS
AR068 HVSR Peak = 1.61 Hz. Est. Dbr = 228 ft.
Well 244493: 69 ft. of silt, sand and gravel over bedrock
AR244493 HVSR Peak = 4.38 Hz. Est. Dbr = 64 ft. Vs_est = 369 m/sec
Well 243955: 18 ft. of peat, muck and sand over bedrock
AR243955 HVSR Peak = 6.25 Hz. Est. Dbr = 41 ft. Vs_est = 137 m/sec
1 2 3
1
2
3
Red dots= HVSR Stations
Green polygons = outcrops
Station AR068
1 Mile
Log
Bed
rock
Dep
th (
M)
Log HVSR (Hz.)
Arrowhead Project Area HVSR Depth Calibration at 17 Bedrock Drill-holes
CONTROL POINTS: Blue – Outwash , Fluviolacustrine and Ice-Contact Deposits Red – Supra- and Sub-Glacial Tills
Isabella Sub-Area
Babbitt Sub-Area
6 miles
Northern Becker County: Compilation of a Color-Coded HVSR Section
(1) z=a*frb Where:
a=127
b=-1.264
(2) Bdrk Elev=Surf. Elev-z Convert HVSR Spectra
Point-by-point to surface
elevations using the two
following calculations:
Grid the converted
Spectra to produce a
HVSR section
10 km
Elev
atio
n (
m)
Elev
atio
n (
m)
Itasca Moraine
Vertical Exaggeration =50X
Black Diamonds=HVSR Bedrock Picks
White Diamonds=Well Control
Intra-glacial horizon?
Conclusions on using the HVSR passive seismic method for determining Quaternary sediment thickness in Minnesota: Strengths of the HVSR Method -It’s Cheap -It’s Fast -It seems to thrive in culturally noisy areas -It should be useful to a variety of geological and geo-engineering investigations Limitations of the HVSR Method -It’s only for rough estimates -Conditions within the sediments or at the bedrock surface can complicate or even preclude useful results -It should never be used blindly, always consult local geology and conduct readings at control sites
Further Work: -Continue applying the method in a variety of geological conditions (MGS) -Investigate the effect of ambient noise levels (MGS?) -Independent studies of shear-wave velocities for local materials (Help!) -Investigate processing of passive seismic data to improve results (Help!) -Use the method to investigate the thickness of very near-surface materials like fill or organic sediments (MGS?)