43
CONTINUING DISCLOSURE 2013 Annual Report for the City of Amesbury, Massachusetts Prepared by Financial Advisor

CONTINUING DISCLOSURE 2013
Annual Report for the
City of Amesbury, Massachusetts
Prepared by
Financial Advisor

1
THE CITY
The City of Amesbury was established in 1668 and has a population of approximately 16,500. The City is locatedon the Merrimack River in northern Essex County approximately 42 miles north of Boston. Amesbury is bordered bythe Town of Merrimac on the west, the Town of South Hampton, New Hampshire on the north, the Town of Salisburyon the east, the City of Newburyport and the Town of West Newbury on the south. Interstate Route 95 passes throughthe City from north to south and Interstate 495 intersects Interstate 95 at Amesbury in a southwesterly direction.
Services
The City provides general governmental services for the territory within its boundaries, including police and fireprotection, disposal of garbage and rubbish, public education in grades kindergarten through twelve, water and sewerservices, sewage disposal, street maintenance, library, parks and recreational facilities. The Whittier RegionalVocational School District provides vocational-technical training for students in grades nine through twelve. TheAmesbury Housing Authority provides housing for eligible low-income families, the elderly and handicapped persons.The City is a member of the Merrimack Valley Regional Transit Authority which provides fixed route service betweenneighboring communities.
Principal Municipal Facilities
The following is a list of the City’s principal facilities.
Assessed
Facility Date Built (Remodeled) Valuation
High School 1968 (2008) $22,617,000
Middle School 1946 (1967, 1996, 1998) 25,635,600
Amesbury Elementary School 1968 (1997) 5,893,100
Cashman Elementary School 1975 (1997, 2002, 2005) 7,915,600
Horace Mann School 1901 (1974) 847,300
Wastewater Treatment Plant 1974 (2005) 3,955,400
Water Treatment Plant 1985 (2012) 5,254,100
City Hall 1900 1,204,900
City Hall Ordway 1900 856,000
Public Library pre-1900's 1,022,500
Fire Stations Headquarters 1927 1,206,900
Elm Street Fire Station early 1900's 650,500
Public Works Garage 1939 253,400
Public Works Garage 2012 881,300
Police Station 1920's 1,076,500
Governing Bodies and Officers
The City voted on November 8, 2011 to adopt a new charter with a Council-Mayor form of government. Thelegislative branch is the City Council, which consists of nine councilors. There are six councilors, one from eachdistrict, and three councilors at large. The councilors are elected to serve two-year terms of office. The Mayor iselected for a two-year term of office to serve as the chief executive officer of the City. The Mayor also serves as theseventh member and chairperson of the six member elected school committee.
The water and sewer departments are managed by the superintendent of Public Works who is appointed by theMayor. Local taxes are assessed by a board of three assessors who are also appointed by the Mayor.
Local school affairs are administered by a committee of seven persons elected for staggered four-year terms.

2
Principal Executive Officers
The following is a list of the principal executive officers within the City.
Mayor Thatcher W. Kezer, III Elected 2 years 1/2/2014
City Council Anne R. Ferguson, President Elected 2 years 1/2/2014
Robert W. Lavoie Elected 2 years 1/2/2014
Allen R. Neale Elected 2 years 1/2/2014
James Kelcourse Elected 2 years 1/2/2014
Christian Scorzoni Elected 2 years 1/2/2014
Donna McClure Elected 2 years 1/2/2014
Robert L. Gilday Elected 2 years 1/2/2014
Joseph W. McMilleon Elected 2 years 1/2/2014
Derek T. Kimball Elected 2 years 1/2/2014
Chief Financial Officer Michael W. Basque Appointed 3 Years 9/30/2016
Treasurer/Collector Donna Cornoni Appointed Indefinite N/A
Assessor Jason DiScipio Appointed Indefinite N/A
City Clerk Bonnijo Kitchin Appointed Indefinite N/A
Superintendent of Schools Michelle Robinson Appointed 3 Years 6/30/2014
Director of Public Works Robert Desmerais Appointed Indefinite N/A
Director of Community Development Joseph Fahey Appointed Indefinite N/A
Town Counsel Kopelman & Paige Appointed Indefinite N/A
Collective Bargaining
City and town employees (other than managerial employees) are entitled to join unions and to bargain collectivelyby representatives of their choice on questions of wages, hours and other terms and conditions of employment. TheCity has approximately 425 full-time employees and 200 part-time employees of whom approximately 72 percent offull-time employees belong to unions or other collective bargaining groups. The following table sets forth thecollective bargaining groups.
Contract
Union Department Members Expires
AFL-CIO Local 939 Public Works 22 6/30/2015
AFL-CIO Local 1783 Fire 32 6/30/2015
Amesbury Police Officers Association Police 30 6/30/2015
AFL-CIO Local 1033 School - Teachers 163 8/31/2015
AFL-CIO Local 939 School - Cafeteria 2 8/31/2015
AFL-CIO Local 1033 School - Tutors 19 8/31/2015
AFL-CIO Local 1033 School - Custodian/Maintenance 10 6/30/2015
O.P.E.I.U. Local 6 Gen. Govt. Non-Dept. Heads 29 6/30/2015
Total: 307
Other Data
The following tables set forth income levels, age characteristics, housing characteristics, population trends, andemployment figures for the City of Amesbury, Essex County, and the Commonwealth of Massachusetts.

3
Per Capita Income
Amesbury Essex County Massachusetts
Year Amount % Change Amount % Change Amount % Change
2011 5-year estimates $41,142 70.7% $34,858 32.2% $35,051 35.1%
1999 24,103 56.3 26,358 49.9 25,952 50.7
1989 15,423 134.7 17,586 129.2 17,224 131.0
1979 6,571 0.0 7,673 0.0 7,457 0.0
% Below Poverty Level (2011 5-year estimates) 3.9% 10.6% 10.7%
_________________________
Source: U.S. Department of Commerce
Median Family IncomeAmesbury Essex County Massachusetts
Income for Families Families Percent Families Percent Families Percent
Less than $10,000 39 0.9% 6,967 3.7% 57,867 3.6%
10,000 - 24,999 149 3.4 16,759 8.9 133,136 8.3
25,000 - 49,999 537 12.3 31,735 16.8 264,129 16.5
50,000 - 74,999 719 16.4 29,924 15.8 261,052 16.3
75,000 - 99,999 836 19.1 27,348 14.5 242,747 15.1
100,000 - 149,999 1,286 29.4 38,706 20.5 330,690 20.6
150,000 or more 811 18.5 37,741 19.9 314,319 19.6
Total 4,377 100.0% 189,180 100.0% 1,603,940 100.0%
Median Income $94,946 $83,047 $83,371
_________________________
Source: U.S. Department of Commerce
Household Income
Amesbury Essex County Massachusetts
Income for Households Households Percent Households Percent Households Percent
Less than $10,000 217 3.3% 18,505 6.5% 164,071 6.5%
10,000 - 24,999 722 11.0 39,124 13.7 341,431 13.5
25,000 - 49,999 1,016 15.5 55,088 19.3 477,788 18.9
50,000 - 74,999 1,124 17.2 45,724 16.0 416,286 16.5
75,000 - 99,999 1,049 16.0 36,987 13.0 337,712 13.4
100,000 - 149,999 1,481 22.6 46,878 16.5 418,394 16.6
150,000 or more 934 14.3 42,634 15.0 366,727 14.5
Total 6,543 100.0% 284,940 100.0% 2,522,409 100.0%
Median Income $79,293 $65,785 $65,981
_________________________
Source: U.S. Department of Commerce

4
Median AgeAmesbury Essex County Massachusetts
Age Number Percent Number Percent Number Percent
Under 5 Years 1,040 6.4% 43,451 5.9% 367,252 5.6%
5 Years to 19 Years 2,808 17.3 149,387 20.2 1,262,333 19.4
20 Years to 64 Years 10,545 64.8 442,904 59.9 3,991,339 61.3
65 Years and Over 1,874 11.5 103,763 14.0 891,303 13.7
Total 16,267 100.0% 739,505 100.0% 6,512,227 100.0%
Median Age 41 40 39
Median Age (2000) 36.7 37.5 36.5
_________________________
Source: U.S. Department of Commerce
Median Value Owner - Occupied Housing Units
Amesbury Essex County Massachusetts
Units Number Percent Number Percent Number Percent
Less than $100,000 147 3.1% 4,880 2.6% 49,369 3.1%
100,000 - 199,999 542 11.4 15,335 8.3 189,878 11.8
200,000 - 299,999 1,291 27.1 41,247 22.3 389,385 24.3
300,000 - 499,999 2,164 45.4 78,886 42.6 627,185 39.1
500,000 - 999,999 577 12.1 38,719 20.9 291,521 18.2
1,000,000 or more 46 1.0 5,918 3.2 57,135 3.6
Total 4,767 100.0% 184,985 100.0% 1,604,473 100.0%
Median Value $327,200 $362,300 $343,500
_________________________
Source: U.S. Department of Commerce
Age of Housing Units
Amesbury Essex County Massachusetts
Year Built Number Percent Number Percent Number Percent
2000 or later 543 7.7% 19,563 6.4% 187,003 6.7%
1980 to 1999 1,404 19.8 53,184 17.4 508,434 18.2
1940 to 1979 2,324 32.8 112,969 36.9 1,111,838 39.7
1939 or Earlier 2,808 39.7 120,301 39.3 992,082 35.4
Total 7,079 100.0% 306,017 100.0% 2,799,357 100.0%
_________________________
Source: U.S. Department of Commerce
Unemployment
Unemployment Rate
Calendar Year(1) Labor Force Employment City County State US
2013 (August) 8,951 8,359 6.6% 7.2% 6.8% 7.3%
2012 8,761 8,226 6.1 7.1 6.7 8.1
2011 8,671 8,074 6.9 7.8 6.8 8.9
2010 8,849 8,112 8.3 8.9 8.5 9.6
2009 8,731 8,032 8.0 8.8 8.2 9.3
_________________________
Source: Massachusetts Department of Employment & Training
(1) Full year averages except for 2013 which is for the month indicated.

5
Population
Amesbury Essex County Massachusetts
Year Number % Change Number % Change Number % Change
2012 estimate 16,535 1.5% 755,618 1.7% 6,646,144 1.5%
2010 16,283 -1.0 743,159 2.7 6,547,629 3.1
2000 16,450 9.7 723,419 8.0 6,349,097 5.5
1990 14,997 7.3 670,080 5.8 6,016,425 4.9
1980 13,972 0.0 633,632 0.0 5,737,037 0.0
_________________________
Source: U.S. Department of Commerce for actuals and estimates,
Massachusetts Institute for Social & Economic Research for projections.
Employment and Payrolls
Calendar Year Average
Employment by Industry 2012 2011 2010 2009 2008
Construction & Natural Resources 293 262 249 309 347
Manufacturing 690 668 668 770 882
Trade, Transportation & Utilities 675 658 671 639 635
Financial Activities 179 170 173 170 172
Professional & Business Services 531 563 496 485 427
Education & Health Services 822 804 822 641 568
Leisure & Hospitality 593 614 567 556 564
Information & Other Services 263 269 249 223 261
Public Administration -0- -0- -0- -0- -0-
Total Employment 4,778 4,730 4,707 4,587 4,657
Number of Establishments 462 466 474 468 453
Total Annual Wage (000) $204,238 $194,073 $192,049 182,984 $185,474
Average Weekly Wage 822 789 785 767 766
_________________________
Source: Massachusetts Department of Employment & Training
Community Development
Over four decades ago Amesbury introduced a program of revitalization and economic development. During thoseyears, over three hundred thousand square feet of mill space has been redeveloped into commercial, office, residentialand manufacturing uses. The Central Business District (CBD) received a $4.4 million reconstruction includingroadways, sidewalks and utility work. Period lighting, street trees, brick sidewalks, a plaza and park were addedthrough that effort. Concurrently, using City and grant funds, a neighborhood rehabilitation effort was begun updatingthe infrastructure including streets and sidewalks in the neighborhoods surrounding the CBD. Well over $3,000,000has been spent on this program and work continues to this day.
During that time, a mill complex of eight buildings with over one hundred fifty thousand square feet of space hasbeen renovated into a mixed use complex of residential, office, restaurant and commercial spaces. This area, referredto as the Upper Millyard, spurred the redevelopment effort throughout the CBD which has included the construction ofthree new multi story, mixed use buildings and the renovation of several others.
With the success of the Upper Millyard, the City began work on another complex of mills to the southeast of theCBD, referred to as the Lower Millyard. Redevelopment is already underway in the area spurred by the sale of tax titleproperties to developers who have created residential loft housing, office, and artisan live-work space. After lobbyingby the City, the Merrimac Valley Regional Transit Authority (MVRTA) agreed to locate a regional transportationcenter in the Lower Millyard. Construction on the $5.8 million facility has been completed and the facility houses theCity’s Senior Center among other City offices.

6
New zoning has been approved for the area in order to facilitate the redevelopment effort. That zoning resulted inone property owner proposing a mixed use project valued at over fifty million dollars upon completion. Interesteddevelopers continue to approach the property owner on the project which will include over two hundred units ofhousing.
Another property owner has renovated over seventy thousand square feet of Mill space into office space and isleasing to over 22 small businesses including R&D, design and computer programming companies. That owner is inthe process of designing and permitting a thirty thousand square foot $4.5 million addition.
Also within the Lower Millyard, a developer has purchased a forty thousand (40,000) sq. ft. mill building and hasreceived permits to rehabilitate it into forty five residential units estimated to be valued at 7 million dollars. In order tosupport the interest in the redevelopment effort, the City has undertaken improvements in the area to further encourageprivate investment. A dilapidated cluster of buildings being used by the Public Works Department is proposed for saleto a private developer. To realize that goal, the City has appropriated $5.9 million to move the DPW to a new locationfor the facility. A portion of the vacated DPW property is planned for a $1.2 million Heritage Park which will includea canoe and kayak launch which the State has committed to fund. In addition, engineering and design funding has beensecured for the expansion of the above ground parking deck servicing the area. The City is also completing a $1.4million reconstruction of Elm Street, the major access route to the Lower Millyard. This project is funded through theState funded MassWorks program.
In another area of the City, adjacent to Interstates 495 and 95, lie 135 acres of land zoned for mixed development.Several years ago, the City completed a $100,000 study of the land identifying opportunities and constraints todevelopment. Since that time the City has re-zoned the area and approved an MGL 43G designation as a prioritydevelopment site with an expedited permitting process. Under that provision the City has approved a permitapplication for a ninety unit hotel, a retail building and most recently a regional veterinarian hospital and clinic.
Finally, along the Route 110 corridor, plans were submitted and approved for a new CVS Pharmacy, and a mixed-use building which have been built. The City has also permitted a large expansion for a food distribution business andthe installation of a commercial solar array in that area, while a real estate investment company continues to convert ahundred thousand square foot manufacturing building into rental space for high tech tenants.
Overall, through zoning, planning, infrastructure improvement and professional planning, the City is wellpositioned for expanded economic development opportunity in the future.
Principal Employers
The following table lists the largest employers in the City of Amesbury and the approximate number of employeesof each, exclusive of the City itself.
Current
Company Nature of Business Employees
Cardocaire/Munters Dehumidification units 314
Harborside Health Care Nursing and rehabilitation center 154
Super Stop and Shop Grocery store 151
Mariner Health Care Long-term care and rehabilitation facility 148
ARC Tech Microwave absorbable materials 130
Amesbury Health Center Healthcare 113(1)
Maptech, Inc. Navigation software, digital and paper data 82
Shaheen Bros., Inc. Grocery store 68
LeBaron Bonney Company/Hampton Coach Auto upholstery/materials/hardware 65
Innovative Technologies Glove box systems 62
TEK-Coating Company, Inc. Powder coating, spray painting, silkscreen 57
printing
Amesbury Chair Company Manufacturer/distributor of wood furniture 25
(1) Does not include private physician offices.

7
Building Permits
Below is a list of the building permits issued and their estimated values for the following calendar years.
For Calendar Year
2013(1) 2012 2011 2010 2009
Residential:
Number…………………… 430 502 382 418 445
Value……………………… $ 7,898,417 $ 9,567,667 $ 5,533,053 $ 14,326,728 $ 5,249,756
Non-Residential:
Number…………………… 34 38 75 74 28
Value……………………… $ 4,576,604 $ 3,830,592 $ 1,888,347 $ 5,808,945 $ 484,861
(1) Through September 2013.
Public School Facilities
The City operates two elementary schools (Pre-K through four), one middle school (grades five through eight) anda senior high school (grades nine through twelve). In 1997, the City completed various remodeling and repair projectstotaling $1,500,000 to the Cashman and Amesbury Elementary schools. A $19,850,000 project for the construction ofan addition to and remodeling of the middle school was completed and the City issued general obligation bonds inSeptember 1998. The City completed a construction and remodeling project totaling $5,000,000 to the CashmanElementary School in calendar year 2005.
The City also authorized a project totaling $29,070,000 for planning, constructing an addition to and forremodeling, reconstructing and making extraordinary repairs to the Amesbury High School which has been completed.The following tables list public school facilities, current and projected enrollment figures, and student - teacher ratiosfor the City as of the most recent October 1.
Date Added to Current
Name Grade Built (Remodeled) Capacity Enrollment(1)
Amesbury Elementary PreK-4 1968 (1997) 630 427
Charles Cashman Elementary PreK-4 1975 (1997, 2002, 2005) 700 538
Amesbury Middle 5-8 1946 1967 (1998) 1,000 731
Amesbury High 9-12 1968 (2005-2008) 900 643
Totals: 3,230 2,339
(1) As of October 1, 2013.
Public School EnrollmentsActual(1)
2005-06 2006-07 2007-8 2008-09 2009-10 2010-11 2011-12 2012-13 2013-14
Elementary 992 973 1,004 1,006 987 995 969 969 965
Middle 766 751 714 722 763 751 749 730 731
High 745 709 697 679 674 640 610 637 643
Totals: 2,503 2,433 2,415 2,407 2,424 2,386 2,328 2,336 2,339
___________________________
(1) Source: Massachusetts Department of Education - As of October 1, each school year.

8
Student-Teacher Ratios
Elementary - 13:1 Middle - 13:1 High - 15:1
Total Number of Teachers & Teachers Aides 254
Total Number of Administrative Staff 8
Total: 262
Educational AttainmentAmesbury Essex County Massachusetts
Years of School Completed Number Percent Number Percent Number Percent
Less than 9th Grade 276 2.4% 27,306 5.4% 215,977 4.9%
9th to 12th Grade, No Diploma 470 4.1 31,039 6.2 274,938 6.2
High School Graduate 3,158 27.3 133,751 26.6 1,161,382 26.3
Some College, No Degree 1,913 16.5 86,497 17.2 718,047 16.2
Associate's Degree 970 8.4 41,006 8.2 337,921 7.6
Bachelor's Degree 2,944 25.4 110,083 21.9 977,354 22.1
Graduate or Professional Degree 1,851 16.0 72,862 14.5 733,672 16.6
Total 11,582 100.0% 502,544 100.0% 4,419,291 100.0%
High School Graduate or Higher 10,836 93.6% 444,199 88.4% 3,928,376 88.9%
Bachelor's Degree or Higher 4,795 41.4 182,945 36.4 1,711,026 38.7
_________________________
Source: U.S. Department of Commerce

9
INDEBTEDNESS
The general debt limit of the City of Amesbury consists of a normal debt limit and a double debt limit. The normaldebt limit is 5.0 percent of the valuation of taxable property as last equalized by the State Department of Revenue. TheCity can authorize up to $98,036,995 without state approval and up to twice this amount ($196,073,990 – double debtlimit) with the approval of the Municipal Finance Oversight Board composed of the State Treasurer, the State Auditor,the Attorney General and the Director of Accounts.
There are many categories of general obligation debt which are exempt from and do not count against the GeneralDebt Limit. Among others, these exempt categories include revenue anticipation notes and grant anticipation notes;emergency loans; loans exempted by special laws; certain school bonds, sewer bonds, solid waste disposal facility bondsand economic development bonds supported by tax increment financing; and subject to special debt limits, bonds for water(limited to 10 percent of equalized valuation), housing, urban renewal and economic development (subject to various debtlimits), and electric, gas, community antenna television systems, and telecommunications systems (subject to separatelimits). Revenue bonds are not subject to these debt limits. The General Debt Limit and the special debt limit for waterbonds apply at the time the debt is authorized. The other special debt limits generally apply at the time the debt is incurred.
As of November 1, 2013, the City of Amesbury had total outstanding and authorized unissued general obligationdebt of $50,720,199, of which $30,695,715 was outside, and $20,024,484 was subject to its general debt limit. Theadditional debt which could be authorized within the normal 5.0 percent debt limit was $78,012,511. The additionaldebt which could be authorized within the double debt limit was $176,049,506.
Authorization of General Obligation Bonds and Notes
Bonds and notes are generally authorized on behalf of the City by vote of two-thirds of all the members of theCity Council with the approval of the Mayor. Provision is made for a referendum on the filing of a petition bearing therequisite number of signatures. Borrowings for certain purposes require state administrative approval. Temporaryloans in anticipation of current revenues and certain state and county reimbursements are generally authorized bymajority vote but provision is made for temporary loans in anticipation of federal grants and for other purposes incertain circumstances without City Council authorization.
Refunding bonds and notes are authorized by the City Council. Borrowings for some purposes require Stateadministrative approval.
When serial bonds or notes have been authorized, bond anticipation notes may be issued by the officers authorized toissue the serial bonds or notes. Temporary debt in anticipation of the revenue of the fiscal year in which the debt is incurredor in anticipation of authorized federal and state aid generally may be incurred by the treasurer with the approval of themayor.
Types of Obligations
General Obligations. Massachusetts cities and towns are authorized to issue general obligation indebtedness of thesetypes:
Serial Bonds and Notes. These are generally required to be payable in annual principal amounts beginning no laterthan the end of the next fiscal year commencing after the date of issue and ending within the terms permitted by law. Alevel debt service schedule, or a schedule that provides for a more rapid amortization of principal than level debt service, ispermitted. The principal amounts of certain economic development bonds supported by tax increment financing may bepayable in equal, diminishing or increasing amounts beginning within 5 years after the date of issue. The maximum termsof serial bonds and notes vary from one year to 40 years, depending on the purpose of the issue. The maximum termspermitted are set forth in the statutes. In addition, for many projects, the maximum term may be determined in accordancewith useful life guidelines promulgated by the State Department of Revenue (“DOR”). Serial bonds and notes may beissued for the purposes set forth in the statutes. In addition, serial bonds and notes may be issued for any other public workimprovement or asset not specifically listed in the Statutes that has a useful life of at least 5 years. Bonds or notes may bemade callable and redeemed prior to their maturity, and a redemption premium may be paid. Refunding bonds or notesmay be issued subject to the maximum applicable term measured from the date of the original bonds or notes and mustproduce present value savings over the debt service of the refunded bonds. Generally, the first required annual payment ofprincipal of the refunding bonds cannot be later than the first principal payment of any of the bonds or notes being refunded

10
thereby, however, principal payments made before the first principal payment of any of the bonds or notes being refundedthereby may be in any amount.
Serial bonds may be issued as “qualified bonds” with the approval of the state Municipal Finance Oversight Boardcomposed of the State Treasurer, the State Auditor, the Attorney General and the Director of Accounts, subject to suchconditions and limitations (including restrictions on future indebtedness) as may be required by the Board. Qualified bondsmay mature not less than 10 nor more than 30 years from their dates and are not subject to the amortization requirementsdescribed above. The State Treasurer is required to pay the debt service on qualified bonds and thereafter to withhold theamount of the debt service paid by the State from state aid or other state payments; administrative costs and any loss ofinterest income to the State are to be assessed upon the city or town.
Tax Credit Bonds or Notes. Subject to certain provisions and conditions, the officers authorized to issue bonds ornotes may designate any duly authorized issue of bonds or notes as “tax credit bonds” to the extent such bonds and notes areotherwise permitted to be issued with federal tax credits or other similar subsidies for all or a portion of the borrowing costs.Tax credit bonds may be made payable without regard to the annual installments required by any other law, and a sinkingfund may be established for the payment of such bonds. Any investment that is part of such a sinking fund may mature notlater than the date fixed for payment or redemption of the applicable bonds.
Bond Anticipation Notes. These generally must mature within two years of their original dates of issuance but may berefunded from time to time for a period not to exceed five years from their original dates of issuance, provided that for eachyear that the notes are refunded beyond the second year they must be paid in part from revenue funds in an amount at leastequal to the minimum annual payment that would have been required if the bonds had been issued at the end of the secondyear. For certain school projects, however, notes may be refunded from time to time for a period not to exceed seven yearswithout having to pay any portion of the principal of the notes from revenue funds. The maximum term of bonds issued torefund bond anticipation notes is measured (except for certain school projects) from the date of the original issue of thenotes.
Revenue Anticipation Notes. These are issued to meet current expenses in anticipation of taxes and other revenues.They must mature within one year but, if payable in less than one year, may be refunded from time to time up to one yearfrom the original date of issue.
Grant Anticipation Notes. These are issued for temporary financing in anticipation of federal grants and state andcounty reimbursements. Generally, they must mature within two years but may be refunded from time to time as long asthe municipality remains entitled to the grant or reimbursement.
Revenue Bonds. Cities and towns may issue revenue bonds for solid waste disposal facilities, for projects financedunder the Commonwealth’s Water Pollution Abatement or Drinking Water Revolving Loan Programs and for certaineconomic development projects supported by tax increment financing. In addition, cities and towns having electricdepartments may issue electric revenue bonds and notes in anticipation of such bonds, subject to the approval of the StateDepartment of Telecommunications and Energy.
Revenue Anticipation Borrowing
Revenue anticipation notes are issued to meet current expenses in anticipation of taxes and other revenues. Theamount borrowed in each fiscal year by the issue of revenue anticipation notes is limited to the tax levy of the prior fiscalyear, together with the net receipts in the prior fiscal year from the motor vehicle excise and certain payments made by theCommonwealth in lieu of taxes. The fiscal year ends on June 30. Notes may mature in the following fiscal year, and notesmay be refunded into the following fiscal year to the extent of the uncollected, unabated current tax levy and certain otheritems, including revenue deficits, overlay deficits, final judgments and lawful unappropriated expenditures, which are to beadded to the next tax levy, but excluding deficits arising from a failure to collect taxes of earlier years. (See “Taxation toMeet Deficits” under “Property Tax” below.) In any event, the period from an original borrowing to its final maturitycannot exceed one year. The City has not issued revenue anticipation notes in the last five fiscal years.

11
Debt SummaryAuthorized
Unissued
Outstanding Bonds
11/1/2013 11/1/2013
Long-Term Indebtedness (1)(2)(3)(4)
Within the General Debt Limit:
Sewers & Drains ……………………… $ 2,862,808 $ 29,500(5)
Land Acquisition ……………………… 95,000 -0-
Schools ………………………………… 5,651,290 79,886(5)
Other Building ………………………… 80,000 10,356,000(6)
Architectural & Engineering Services … -0- 450,000(7)
Athletic & Recreational Facilities …….. 90,000 -0-
Other Inside General ………………….. -0- 330,000(7)
Total Within the General Debt Limit …… $ 8,779,098 $ 11,245,386
Outside the General Debt Limit:
Sewers ………………………………… $ 6,715,531 $ 2,079,979(8)
Schools ……………………………….. 3,877,120 -0-
Other Outside General ……………….. 12,744 -0-
Water …………………………………. 15,018,342 2,992,000(9)
Total Outside the General Debt Limit ….. $ 25,623,737 $ 5,071,979
Total Long-Term Indebtedness …………. $ 34,402,834 $ 16,317,365
Outstanding
Outstanding After This
11/1/2013 Issue Maturity
Short-Term Indebtedness
Revenue Anticipation Notes ………….. $ -0- $ -0-
Grant Anticipation Notes …………….. -0- -0-
Bond Anticipation Notes ……………… 7,678,000 7,474,000 9/12/14; 12/12/14
Total Short-Term Indebtedness …………. $ 7,678,000 $ 7,474,000
_________________________
(1) Principal amount only. Excludes lease and installment purchase obligations, overlapping debt, unfunded pension liability
and other post employment benefit liabilities.
(2) At the present time the normal General Debt Limit is $98,036,995 and the Double General Debt Limit is $196,073,990.
(3) $ 9,169,864 has been exempted from the provisions of Proposition 2 1/2.
(4) $24,471,760 is self-supporting.
(5) This amount is not expected to be issued.
(6) Of this amount, $4,400,000 is included in this issue. $2,400,000 for public safety buildings, $5,900,000 for the DPW building
and $1,500,000 for leasehold improvements will be permanently financed in fiscal year 2015. The balance of $556,000 for
remodeling to the public safety buildings will be permanently financed in December 2013.
(7) Included in this issue of Notes.
(8) Amount remaining from a completed sewer project totaling $15,788,000 and this balance is not expected to be issued
(9) Of this amount, $1,654,000 will be permanently financed in December 2013, $1,203,000 is included in this issue of Notes and
the balance of $135,000 will be paid with available funds.
Authorized Unissued Bonds and Prospective Financing
The City has $16,317,365 outstanding in authorized unissued debt. A total amount of $2,189,365 representingunexpended balances of authorized and completed projects for water and school are not expected to be issued. TheCity expects to permanently finance $2,188,000 for water projects in December 2013. The City will have outstandingafter this issue a total of $7,474,000 bond anticipation notes; $1,600,000 for DPW facility construction, $1,203,000 forwater projects, $1,500,000 for leasehold improvements, $2,400,000 for public safety buildings remodeling, $330,000for parking garage and snow dump projects and $441,000 for planning and design. The City expects to proceed withconstruction in the spring of the remaining $4,300,000 for the DPW facility. The remaining balance of $166,000represents principal payments for various projects to be paid on December 13, 2013.

12
Five Years Outstanding DebtAs of June 30
2013 2012 2011 2010 2009
Long-Term Indebtedness(1)
Within the General Debt Limit:
Sewers & Drains ……………………… $ 3,143,873 $ 3,510,148 $ 3,870,788 $ 4,229,224 $ 4,584,356
Land Acquisition ……………………… 110,000 125,000 140,000 155,000 170,000
Schools ……………………………….. 6,166,190 6,686,090 7,205,990 7,726,960 8,249,100
Other Building ………………………… 90,000 104,950 119,923 134,771 149,683
Athletic & Recreational Facilities …….. 135,000 180,000 225,000 279,842 334,815
Other Inside General …………………. -0- -0- -0- 105,000 210,000
Total Within the General Debt Limit …… $ 9,645,063 $ 10,606,188 $ 11,561,701 $ 12,630,797 $ 13,697,954
Outside the General Debt Limit:
Sewers ………………………………… 7,372,455 8,010,788 8,641,530 9,261,365 9,874,466
Schools ……………………………….. 4,852,960 5,833,060 6,817,615 7,815,405 8,826,440
Other Outside General ……………….. 15,294 17,844 20,393 22,943 25,493
Water …………………………………. 15,943,452 16,460,422 7,139,154 3,954,102 4,356,352
Total Outside the General Debt Limit ….. $ 28,184,160 $ 30,322,114 $ 22,618,693 $ 21,053,815 $ 23,082,751
Total Long-Term Indebtedness ……….. $ 37,829,223 $ 40,928,302 $ 34,180,393 $ 33,684,612 $ 36,780,705
Short-Term Indebtedness
Revenue Anticipation Notes ………….. $ -0- $ -0- $ -0- $ -0- $ -0-
Grant Anticipation Notes …………….. -0- -0- -0- -0- -0-
Bond Anticipation Notes ……………… 7,678,000 5,740,000 10,311,481 4,401,000 3,452,000
Total Short-Term Indebtedness ……….. $ 7,678,000 $ 5,740,000 $ 10,311,481 $ 4,401,000 $ 3,452,000
Total Outstanding Indebtedness ……..… $ 45,507,223 $ 46,668,302 $ 44,491,874 $ 38,085,612 $ 40,232,705
_________________________
(1) Principal amount only. Excludes lease and installment purchase obligations, overlapping debt and unfunded pension liability.
Bonded Debt vs. Population, Valuations and IncomeAs of June 30
2013 2012 2011 2010 2009
Amount (1) ……………………………… $37,829,223 $40,928,302 $34,180,393 $33,684,612 $36,780,705
Per Capita (2) ……………………………. 2,287.83 2,475.25 2,082.77 2,068.70 2,201.38
Percent of Assessed Valuation (3) ………. 2.13% 2.22% 1.85% 1.77% 1.86%
Percent of Equalized Valuation (4) ……… 1.93 1.97 1.64 1.49 1.62
Per Capita as a percent of
Personal Income (2) per capita ………… 5.56 6.02 5.06 5.03 5.35
_________________________
(1) Principal amount only. Excludes lease and installment purchase obligations, overlapping debt and unfunded pension liability.
(2) Source: U.S. Department of Commerce, Bureau of the Census - Latest applicable actuals or estimates.
(3) Source: Board of Assessors - Assessed valuation as of the prior January 1.
(4) Source: Massachusetts Department of Revenue - Equalized valuation in effect for that fiscal year
(equalized valuations are established for January 1 of each even-numbered year).

13
Principal Repayment ScheduleBonds Estimated Total Total Cumulative
Fiscal Outstanding 11/01/13 (1)(2)(3) Dated Bond Debt MSBA Net Debt % Principal
Year Principal Interest 12/3/2013 Interest (4) Service Payments (5) Service Retired
2014 $ 74,740 $ 617,363 $ -0- $ 35,555 $ 727,659 $ -0- $ 727,659 0.2%
2015 3,536,851 1,125,998 183,000 68,136 4,913,984 766,765 4,147,219 10.4
2016 3,566,198 973,072 170,000 62,400 4,771,671 766,765 4,004,906 20.6
2017 3,455,875 822,418 160,000 57,038 4,495,331 766,765 3,728,566 30.5
2018 3,371,547 689,615 155,000 51,919 4,268,080 766,765 3,501,315 40.1
2019 2,439,312 591,732 155,000 46,881 3,232,925 -0- 3,232,925 47.2
2020 2,119,799 490,333 140,000 42,088 2,792,220 -0- 2,792,220 53.4
2021 2,153,114 420,178 140,000 37,538 2,750,830 -0- 2,750,830 59.6
2022 2,171,713 352,190 140,000 32,988 2,696,891 -0- 2,696,891 66.0
2023 2,180,601 270,073 140,000 28,438 2,619,112 -0- 2,619,112 72.3
2024 1,614,786 202,183 140,000 23,888 1,980,857 -0- 1,980,857 77.1
2025 1,244,273 161,673 140,000 19,338 1,565,284 -0- 1,565,284 80.9
2026 1,259,071 125,764 135,000 14,869 1,534,704 -0- 1,534,704 84.7
2027 834,183 98,832 130,000 10,562 1,073,577 -0- 1,073,577 87.3
2028 794,606 81,607 130,000 6,338 1,012,551 -0- 1,012,551 89.8
2029 805,370 64,295 130,000 2,112 1,001,777 -0- 1,001,777 92.4
2030 771,470 47,901 -0- -0- 819,372 -0- 819,372 94.5
2031 787,914 32,307 -0- -0- 820,222 -0- 820,222 96.7
2032 604,140 18,387 -0- -0- 622,527 -0- 622,527 98.6
2033 617,270 6,173 -0- -0- 623,443 -0- 623,443 100.0
Total $ 34,402,834 $ 7,192,094 $ 2,188,000 $ 540,088 $ 44,323,016 $ 3,067,060 $ 41,255,956
_________________________
(1) Excludes revenue anticipation notes, grant anticipation notes, bond anticipation notes, lease and installment purchase obligations,
overlapping debt, unfunded pension liability and other post employment benefits liability.
(2) Principal totaling $9,169,864 and interest totaling $1,913,126 has been exempted from the provisions of Proposition 2 ½, subject to
the provisions of Chapter 44, Section 20 of the General Laws.
(3) Principal totaling $24,471,760 and interest totaling $5,174,811 is self-supporting.
(4) Interest for this issue is estimated at 3.25%.
(5) Annual appropriation of debt service reimbursement from the Massachusetts School Building Authority.
Overlapping Debt
In addition to direct debt, the City is indirectly liable for a portion of the debt and other expenses incurred by variousoverlapping governmental authorities and agencies.
Counties. County expenses including debt service on county bonds are assessed upon the cities and towns within thecounty in proportion to their taxable valuation as last equalized by the State Commissioner of Revenue. (The expenses ofSuffolk County are borne by the City of Boston alone.) Legislation was enacted in 1997 abolishing the county governmentsof Franklin and Middlesex counties as of July 1, 1997, with their assets, functions, debts and other obligations beingassumed by the Commonwealth. The abolishment of the Middlesex county government was in part in response to defaultby the county in the payment of general obligation notes of the county. The legislation also abolished the countygovernments of Hampden and Worcester counties as of July 1, 1998. Legislation enacted in 1998 abolishes the countygovernments of Hampshire, Essex and Berkshire counties as of January 1, 1999, July 1, 1999 and July 1, 2000,respectively. The legislation also requires the state secretary for administration and finance to establish a plan to recover theCommonwealth’s expenditures for the liabilities and other debts assumed and paid by the Commonwealth on behalf of anabolished county. Unless these provisions are changed by further legislation, the state treasurer shall assess upon each cityand town within the jurisdiction of an abolished county an amount not to exceed or equal to the county tax paid by eachsuch city and town for the fiscal year immediately prior to the abolishment of the county until such expenditures by theCommonwealth are recovered. It is possible that similar legislation will be sought to provide for the abolishment of countygovernment in all the remaining counties.
Regional School Districts. Towns may organize regional school districts to carry out general or specialized educationalfunctions. Pursuant to special laws a number of cities may also participate in regional school districts, primarily forvocational education. The operating expenses and debt service of regional school districts are apportioned among the

14
member municipalities in accordance with the agreements establishing the districts subject to the provisions of theEducation Reform Act of 1993.
The City is a member of the Whittier Regional Vocational Technical School District. The Whittier RegionalVocational Technical School District has no outstanding bonded debt as of October 15, 2013. The City’s assessment forfiscal year 2014 is $829,206, which represents approximately 6.5% of the District’s operating budget. The other membertowns in the District are Haverhill, Newburyport, Merrimac, Georgetown, Ipswich, Groveland, West Newbury,Newbury, Rowley and Salisbury.
The City is not a member of the Essex North Shore Agricultural and Technical School District, and as a result is notapportioned and is not responsible for the District’s debt. The City’s payment for tuition-in students for fiscal year 2014 is$125,532.
Regional Transit Authorities. These are transportation authorities which have been established outside the Boston area.It has been state practice in recent years to provide a portion of their net cost of service, including debt service on theirbonds. In addition to the other sources of funds provided by Massachusetts General Laws Chapter 161B from which theregional transit authorities may obtain monies for the payment of the principal of and interest on their obligations, suchpayment will be further secured by the Commonwealth, which is required to pay to the regional transit authorities amountsduly certified by the administrator of the authority as necessary to pay any principal or interest due or about to come due forsuch purpose. The remainder of the net cost of service is assessed upon the member cities and towns in proportion to theamount of the net cost incurred on routes within each city or town. The aggregate amount of such assessments is generallynot permitted to increase by more than 2.5 percent per year. The City pays an annual assessment to the Merrimack ValleyRegional Transit Authority. The budgeted amount for fiscal year 2014 is $221,901. The City’s 1.65% share is based onmileage incurred by the MVRTA buses operating in Amesbury versus the system’s total mileage charged to the City.Membership in the MVRTA includes the City and fourteen other communities. Financing of $2,000,000 for theMcGovern Transportation Center was obtained through the Massachusetts Development and Finance Agency in theform of a revenue bond dated July 1, 2004 payable through July 2025. The bond is secured by all net revenuesgenerated by the parking garage. The MVRTA issued $12,000,000 Revenue Anticipation Notes dated June 21, 2013maturing June 20, 2014 to meet operating expenses for the fiscal year beginning July 1, 2014 pending the receipt ofrevenues of the MRVTA including the payment of Federal Transit Administration operating subsidies and state net costof service payments.
Other Regional Districts. Regional districts that include cities and towns, or parts thereof, may be organized under theGeneral Laws for certain other purposes, including water pollution abatement and solid waste disposal. Regional districtshave also been established under special laws for sewer and water purposes. The apportionment of operating expenses anddebt service of such districts is sometimes prescribed specifically by the laws under which they are organized; for othersuch districts the apportionment is determined in accordance with the agreements establishing the districts.
Capital Improvement Program
The City has a capital improvements program providing for annual financing of capital requests. The following isa list of capital outlay projects completed and those anticipated over the following fiscal years.
Fiscal Year
Department/Project 2014 2015 2016 2017 2018
General Government………. $ 239,720 $ 50,290 $ 47,090 $ 50,000 $ 50,000
Engineering………………… 780,000 2,300,000(1) 150,000 50,000 50,000
Fire………………………. 152,000 282,000 82,000 682,000 100,000
Community & Economic Dev. 40,000 125,000 100,000 100,000 100,000
Police…………………….. 240,000 210,000 140,000 150,000 150,000
Public Works……………… 1,600,000 5,300,000(2) 2,646,250(3) 1,020,250 916,100
Schools……………………. 149,300 360,000 135,000 150,000 500,000
Totals: $ 3,201,020 $ 8,627,290 $ 3,300,340 $ 2,202,250 $ 1,866,100
(1) $1,500,000 is for the replacement of a structurally deficient bridge.
(2) $2,000,000 is for the construction of the Riverwalk pedestrian path expected to be funded by state and federal grants. $3,300,000
is for the reconstruction of Hillside Avenue which is expected to be funded by state and federal grants.
(3) Includes various road maintenance projects, vehicle purchases and $861,000 for a replacement main along Market St.
15
PROPERTY TAXATION
The principal revenue source of the City is the tax on real and personal property. The amount to be levied in eachyear is the amount appropriated or required by law to be raised for municipal expenditures less estimated receipts fromother sources and less appropriations voted from available funds. The total amount levied is subject to certain limitsprescribed by law; for a description of those limits, see “Property Tax Limitation” below. As to the inclusion of debtservice and judgments, see “THE NOTES – Securities and Remedies” above. The estimated receipts for a fiscal yearfrom other sources may not exceed the actual receipts during the preceding fiscal year from the same sources unlessapproved by the State Commissioner of Revenue. Excepting special funds, the use of which is otherwise provided forby law, the deducting for appropriations voted from available funds for a fiscal year cannot exceed the “free cash” as ofthe beginning of the prior fiscal year as certified by the State Director of Accounts plus up to nine months’ collectionsand receipts on account of earlier years’ taxes after the date. Subject to certain adjustments, free cash is surplusrevenue less uncollected overdue property taxes from earlier years. Although an allowance is made in the tax levy forabatements (see “Overlay” below) no reserve is generally provided for uncollectible real property taxes. Since some ofthe levy is inevitably not collected, this creates a cash deficiency which may or may not be offset by other items (see“Taxation to Meet Deficits”) below.
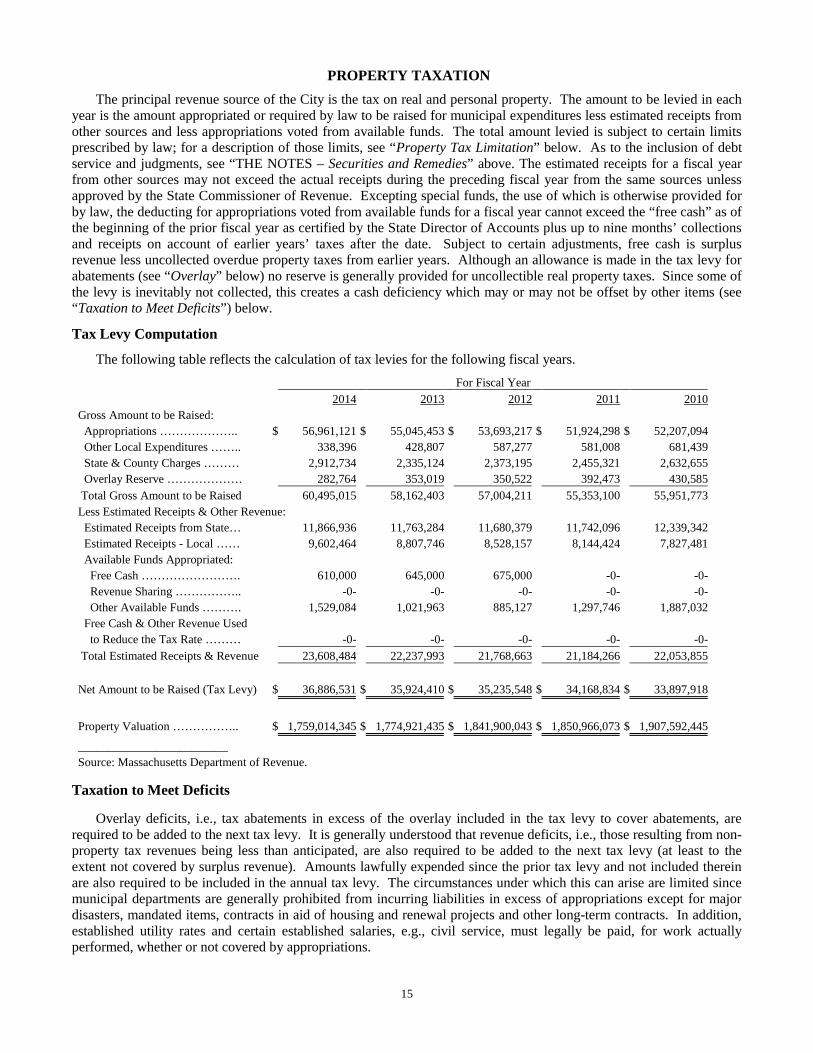
Tax Levy Computation
The following table reflects the calculation of tax levies for the following fiscal years.
For Fiscal Year
2014 2013 2012 2011 2010
Gross Amount to be Raised:
Appropriations ……………….. $ 56,961,121 $ 55,045,453 $ 53,693,217 $ 51,924,298 $ 52,207,094
Other Local Expenditures …….. 338,396 428,807 587,277 581,008 681,439
State & County Charges ……… 2,912,734 2,335,124 2,373,195 2,455,321 2,632,655
Overlay Reserve ………………. 282,764 353,019 350,522 392,473 430,585
Total Gross Amount to be Raised 60,495,015 58,162,403 57,004,211 55,353,100 55,951,773
Less Estimated Receipts & Other Revenue:
Estimated Receipts from State… 11,866,936 11,763,284 11,680,379 11,742,096 12,339,342
Estimated Receipts - Local …… 9,602,464 8,807,746 8,528,157 8,144,424 7,827,481
Available Funds Appropriated:
Free Cash ……………………. 610,000 645,000 675,000 -0- -0-
Revenue Sharing …………….. -0- -0- -0- -0- -0-
Other Available Funds ………. 1,529,084 1,021,963 885,127 1,297,746 1,887,032
Free Cash & Other Revenue Used
to Reduce the Tax Rate ……… -0- -0- -0- -0- -0-
Total Estimated Receipts & Revenue 23,608,484 22,237,993 21,768,663 21,184,266 22,053,855
Net Amount to be Raised (Tax Levy) $ 36,886,531 $ 35,924,410 $ 35,235,548 $ 34,168,834 $ 33,897,918
Property Valuation …………….. $ 1,759,014,345 $ 1,774,921,435 $ 1,841,900,043 $ 1,850,966,073 $ 1,907,592,445
_________________________
Source: Massachusetts Department of Revenue.
Taxation to Meet Deficits
Overlay deficits, i.e., tax abatements in excess of the overlay included in the tax levy to cover abatements, arerequired to be added to the next tax levy. It is generally understood that revenue deficits, i.e., those resulting from non-property tax revenues being less than anticipated, are also required to be added to the next tax levy (at least to theextent not covered by surplus revenue). Amounts lawfully expended since the prior tax levy and not included thereinare also required to be included in the annual tax levy. The circumstances under which this can arise are limited sincemunicipal departments are generally prohibited from incurring liabilities in excess of appropriations except for majordisasters, mandated items, contracts in aid of housing and renewal projects and other long-term contracts. In addition,established utility rates and certain established salaries, e.g., civil service, must legally be paid, for work actuallyperformed, whether or not covered by appropriations.

16
Cities and towns are authorized to appropriate sums, and thus to levy taxes, subject to any overall limits on taxlevies, to cover deficits arising from other causes, such as “free cash” deficits arising from a failure to collect taxes.This is not generally understood, however, and it has not been the practice to levy taxes to cover free cash deficits.Except to the extent that such deficits have been reduced or eliminated by subsequent collections of uncollected taxes(including sales of tax titles and tax possessions), lapsed appropriations, non-property tax revenues in excess ofestimates, other miscellaneous items or funding loans authorized by special act, they remain in existence.
Property Tax Limitation
Chapter 59, Section 21C of the General Laws, known as “Proposition 2 ½”, imposes two separate limits on theannual tax levy of a city or town.
The primary limitation is that the tax levy cannot exceed 2½ percent of the full and fair cash value. If a city ortown exceeds the primary limitation, it must reduce its tax levy by at least 15 percent annually until it is in compliance,provided that the reduction can be reduced in any year to not less than 7½ percent by majority vote of the voters, or toless than 7½ percent by two-thirds vote of the voters.
For cities and towns at or below the primary limit, a secondary limitation is that the tax levy cannot exceed themaximum levy limit for the preceding fiscal year as determined by the State Commissioner of Revenue by more than2½ percent, subject to exceptions for property added to the tax rolls or property which has had an increase, other thanas part of a general revaluation, in its assessed valuation over the prior year’s valuation.
This “growth” limit on the tax levy may be exceeded in any year by a majority vote of the voters, but an increasein the secondary or growth limit under this procedure does not permit a tax levy in excess of the primary limitation,since the two limitations apply independently. In addition, if the voters vote to approve taxes in excess of the “growth”limit for the purpose of funding a stabilization fund, such increased amount may only be taken into account forpurposes of calculating the maximum levy limit in each subsequent year if the board of selectmen of a City or theMunicipal Council of a city votes by a two-thirds vote to appropriate such increased amount in such subsequent year tothe stabilization fund.
The applicable tax limits may also be reduced in any year by a majority vote of the voters.
The State Commissioner of Revenue may adjust any tax limit “to counterbalance the effects of extraordinary,non-recurring events which occurred during the base year”.
The statute further provides that the voters may exclude from the taxes subject to the tax limits and from thecalculation of the maximum tax levy (a) the amount required to pay debt service on bonds and notes issued beforeNovember 4, 1980, if the exclusion is approved by a majority vote of the voters, and (b) the amount required to pay debtservice on any specific subsequent issue for which similar approval is obtained. Even with voter approval, the holders ofthe obligations for which unlimited taxes may be assessed do not have a statutory priority or security interest in the portionof the tax levy attributable to such obligations. It should be noted that Massachusetts General Laws Chapter 44, Section 20requires that the taxes excluded from the levy limit to pay debt service on any such bonds and notes be calculated based onthe true interest cost of the issue. Accordingly, the Department of Revenue limits the amount of taxes which may be leviedin each year to pay debt service on any such bonds and notes to the amount of such debt service, less a pro rata portion ofany original issue premium received by the city or town that was not applied to pay costs of issuance.
Voters may also exclude from the Proposition 2½ limits the amount required to pay specified capital outlayexpenditures or for the city or town’s apportioned share for certain capital outlay expenditures by a regional governmentalunit. In addition, the Municipal Council of a city, with the approval of the mayor if required, or the board of selectmen orthe Municipal Council of a City may vote to exclude from the Proposition 2½ limits taxes raised in lieu of sewer or watercharges to pay debt service on bonds or notes issued by the municipality (or by an independent authority, commission ordistrict) for water or sewer purposes, provided that the municipality’s sewer or water charges are reduced accordingly.
In addition, Proposition 2½ limits the annual increase in the total assessments on cities and towns by any county,district, authority, the Commonwealth or any other governmental entity (except regional school districts, the MWRA andcertain districts for which special legislation provides otherwise) to the sum of (a) 2½ percent of the prior year’sassessments and (b) “any increases in costs, charges or fees for services customarily provided locally or for servicessubscribed to at local option”. Regional water districts, regional sewerage districts and regional veterans districts mayexceed these limitations under statutory procedures requiring a two-thirds vote of the district’s governing body and either

17
approval of the local appropriating authorities (by two-thirds vote in districts with more than two members or by majorityvote in two-member districts) or approval of the registered voters in a local election (in the case of two-member districts).Under Proposition 2½ any State law to take effect on or after January 1, 1981 imposing a direct service or cost obligation ona city or town will become effective only if accepted or voluntarily funded by the city or town or if State funding isprovided. Similarly, State rules or regulations imposing additional costs on a city or town or laws granting or increasinglocal tax exemptions are to take effect only if adequate State appropriations are provided. These statutory provisions do notapply to costs resulting from judicial decisions.
Analysis of Property Tax Levies and Levy Limits
The following table reflects the calculation of levy limits for the following fiscal years.
For Fiscal Year
2014 2013 2012 2011 2010
Primary Levy Limit (1) ………… $ 43,975,359 $ 44,373,036 $ 46,047,501 $ 46,274,152 $ 47,689,811
Prior Fiscal Year Levy Limit …… $ 36,591,777 $ 35,387,755 $ 34,095,111 $ 32,642,326 $ 31,595,764
2.5% Levy Growth ……………. 914,794 884,694 852,378 816,058 789,894
New Growth (2) ……………….. 360,140 319,328 440,266 636,727 256,668
Overrides ………………………. -0- -0- -0- -0- -0-
Growth Levy Limit ……………. 37,866,711 36,591,777 35,387,755 34,095,111 32,642,326
Debt Exclusions ………………… 1,094,002 1,172,074 1,244,439 1,317,296 1,401,696
Capital Expenditure Exclusions … -0- -0- -0- -0- -0-
Other Adjustments …………….. -0- -0- -0- -0- -0-
Tax Levy Limit ………………… $ 38,960,713 $ 37,763,851 $ 36,632,194 $ 35,412,407 $ 34,044,022
Tax Levy ……………………….. 36,886,531 35,924,410 35,235,548 34,168,834 33,897,918
Unused Levy Capacity (3) …….. $ 2,074,182 $ 1,839,441 $ 1,396,646 $ 1,243,573 $ 146,104
Unused Primary Levy Capacity (4) $ 6,108,648$ 7,781,259$ 10,659,746$ 12,179,041$ 15,047,485
_________________________
Source: Massachusetts Department of Revenue.
(1) 2.5% of assessed valuation.
(2) Allowed increase for new valuations (or required reduction) - certified by the Department of Revenue.
(3) Tax Levy Limit less Tax Levy.
(4) Primary Levy Limit less Growth Levy Limit.
Pledged Taxes
Taxes on certain property in designated development districts may be pledged for the payment of costs of economicdevelopment projects within such districts and may therefore be unavailable for other municipal purposes (see “TAXINCREMENT FINANCING FOR DEVELOPMENT DISTRICTS” below).
Initiative Petitions
Various proposals have been made in recent years for legislative amendments to the Massachusetts Constitution toimpose limits on state and local taxes. To be adopted such amendments must be approved by two successive legislaturesand then by the voters at a state election.
Tax Rates and Valuations
Property is classified for the purpose of taxation according to its use. The legislature has in substance created threeclasses of taxable property: (1) residential real property, (2) open space land, and (3) all other (commercial, industrial andpersonal property). Within limits, cities and towns are given the option of determining the share of the annual levy to beborne by each of the three categories. The share required to be borne by residential real property is at least 50 per cent of itsshare of the total taxable valuation. The effective rate for open space must be at least 75 per cent of the effective rate forresidential real property and the share of commercial, industrial and personal property was limited to not more than 175 percent of their share of the total valuation. A city or town may also exempt up to 20 percent of the valuation of residential real

18
property (where used as the taxpayer’s principal residence) and up to 10 percent of the valuation of commercial realproperty (where occupied by certain small businesses). Property may not be classified in a city or town until the StateCommissioner of Revenue certifies that all property in the city or town has been assessed at its fair cash value. Suchcertification must take place every three years or pursuant to a revised schedule as may be issued by the Commissioner.
Related statutes provide that certain forest land, agricultural or horticultural land (assessed at the value it has for thesepurposes) and recreational land (assessed on the basis of its use at a maximum of 25 percent of its fair cash value) are all tobe taxed at the rate applicable to commercial property. Land classified as forest land is valued for this purpose at fivepercent of fair cash value but not less than ten dollars per acre. The following table reflects the breakdown of assessedvaluation by classification for the following fiscal years.
For Fiscal Year
2014 2013 2012 2011 2010
Real Property(1) ………………. $ 1,697,886,640 $ 1,712,518,670 $ 1,774,630,440 $ 1,789,017,540 $ 1,871,450,780
Personal Property(1) …………… 61,127,705 62,402,765 67,269,603 61,948,533 36,141,665
Total ………………………….. $ 1,759,014,345 $ 1,774,921,435 $ 1,841,900,043 $ 1,850,966,073 $ 1,907,592,445
Equalized Value(2) …………….. $ 1,960,739,900 $ 1,960,739,900 $ 2,078,441,100 $ 2,078,441,100 $ 2,266,894,100
Percent of Total Assessed
to Equalized Valuation ……….. 89.7% 90.5% 88.6% 89.1% 84.2%
_________________________
Source: Massachusetts Department of Revenue.
(1) As of the prior January 1st.
(2) Based on the equalized valuation in effect for each year.
In order to determine appropriate relative values for the purposes of certain distributions to and assessments uponcities and towns, the Commissioner of Revenue biennially makes his own redetermination of the fair cash value of thetaxable property in each municipality. This is known as the “equalized value”.
The following table reflects the trend in assessed valuations, equalized valuations and percentage of total assessedvaluation to equalized for the following fiscal years.
Fiscal 2014 % of Total Fiscal 2013 % of Total Fiscal 2012 % of Total
Assessed Assessed Assessed Assessed Assessed Assessed
Type of Property Valuation Valuation Valuation Valuation Valuation Valuation
Residential ……. $ 1,464,593,499 83.3% $ 1,478,695,853 83.3% $ 1,543,369,026 83.8%
Open Space …… -0- 0.0 -0- 0.0 -0- 0.0
Commercial …… 138,203,916 7.9 138,642,632 7.8 136,957,354 7.4
Industrial ……… 95,089,225 5.4 95,180,185 5.4 94,304,060 5.1
Personal ………. 61,127,705 3.5 62,402,765 3.5 67,269,603 3.7
Total $ 1,759,014,345 100.0% $ 1,774,921,435 100.0% $ 1,841,900,043 100.0%
_________________________
Source: Massachusetts Department of Revenue.
The following shows the actual rates per $1,000 of assessed valuation, and the full value rate as follows:
For Fiscal Year
Type of Property 2014 2013 2012 2011 2010
Residential and Open Space…..…… $20.97 $20.24 $19.13 $18.46 $17.77
Commercial, Industrial and Personal.. 20.97 20.24 19.13 18.46 17.77
Average Tax Rate …………….. $20.97 $20.24 $19.13 $18.46 $17.77
Full Value Tax Rate(1) …………. $18.81 $18.32 $16.95 $16.44 $14.95
_________________________
Source: Massachusetts Department of Revenue.
(1) Based on the equalized valuation in effect for each year.

19
Largest Taxpayers
The following is a list of the ten largest taxpayers for fiscal year 2013. All taxpayers are current in their taxpayments.
2013 % of
Assessed Amount Assessed
Name Nature of Business Valuation of Tax Valuation
New England Power Utility $ 27,143,410 $ 549,383 1.53%
National Grid Utility 15,656,170 316,881 0.88
Carriagetown Market Place Strip Mall 15,236,180 308,380 0.86
Ernest Cherry Residential Apartments 11,510,230 232,967 0.65
Ashley Abbot Residential Apartments 11,281,811 228,344 0.64
RRAB LTD Industrial 9,300,000 188,232 0.52
Zell Riverwalk Residential Apartments 8,374,110 169,492 0.47
New England Tel Telecom 7,524,100 152,288 0.42
Cargocaire Engineering Industrial 7,415,050 150,081 0.42
Henry Gagnon Residential Apartments 7,044,861 142,588 0.40
Total: $ 120,485,922 $ 2,438,636 6.79%
Tax Levies and Collections
The taxes for each fiscal year generally are due in two installments on November 1 (subject to deferral if tax billsare sent out late) and May 1. The City has accepted a statute, providing for quarterly tax payments; under that statute,preliminary tax payments are to be due on August 1, and November 1, with payment of the actual tax bill (after credit isgiven for the preliminary payments) in installments on February 1 and May 1 if actual tax bills are mailed by December31. Interest accrues on delinquent taxes currently at the rate of 14 percent per annum from the due date. Real property(land and buildings) is subject to a lien for the taxes assessed upon it (subject to any paramount federal lien and subjectto bankruptcy and insolvency laws). If the property has been transferred an unenforced lien expires on the fourthDecember 31, after the end of the fiscal year to which the tax relates. If the property has not been transferred by thefourth December 31, an unenforced lien expires upon a later transfer of the property. Provision is made, however, forcontinuation of the lien where it could not be enforced because of legal impediment. The persons against whom real orpersonal property taxes are assessed are personally liable for the tax (subject to bankruptcy and insolvency laws). Inthe case of real property, this personal liability is effectively extinguished by sale or taking of the property.
The following table reflects the total tax levy, the reserve for abatements, the net tax levy, and the amount of levycollected during the fiscal year payable. The total tax levy for fiscal year 2014 is expected to be $37,058,608, with anoverlay reserve for abatements of $350,000 resulting in the net tax levy of $36,708,608.
For Fiscal Year
2013 2012 2011 2010 2009
Total Tax Levy ………………… $ 35,924,410 $ 35,235,548 $ 34,168,834 $ 33,897,918 $ 32,683,452
Overlay Reserve for Abatements 353,019 350,522 392,473 430,585 411,631
Net Tax Levy(1) ……………… $ 35,571,391 $ 34,885,026 $ 33,776,361 $ 33,467,333 $ 32,271,822
Amount Collected
During Fiscal Year Payable(2) … $ 35,105,368 $ 33,988,254 $ 33,015,570 $ 32,843,410 $ 31,768,664
Percent of Net Tax Levy ……….. 98.7% 97.4% 97.7% 98.1% 98.4%
_________________________
(1) Net after deductions of overlay reserve for abatements.
(2) Actual collections of levy less refunds and amounts refundable but including proceeds of tax titles
and tax possessions attributed to such levy but not including abatements or other credits.
Overlay
The City is authorized by law to increase each tax levy by an amount approved as reasonable by the StateCommissioner of Revenue for an “overlay” to provide for tax abatements. If abatements are granted in excess of the

20
applicable overlay reserve, the resultant “overlay deficit” is required to be added to the next tax levy. Abatements aregranted where real or personal property has been overvalued or disproportionately valued. The assessors may alsoabate uncollectible personal property taxes. They may abate real and personal property taxes on broad grounds(including inability to pay) with the approval of the State Commissioner of Revenue. Uncollectible real property taxesare ordinarily not written off until they become municipal tax titles (either by purchase at the public sale or by taking),at which time the tax is written off in full by reserving the amount of tax and charging surplus. The following tablereflects the total tax levy, the reserve for abatements, the amount of abatements granted during the fiscal year of thelevy.
For Fiscal Year
2013 2012 2011 2010 2009
Total Tax Levy ………………… $ 35,924,410 $ 35,235,548 $ 34,168,834 $ 33,897,918 $ 32,683,452
Overlay Reserve for Abatements 353,019 350,522 392,473 430,585 411,631
Percent of Tax Levy(1) ……… 1.0 % 1.0 % 1.1 % 1.3 % 1.3 %
Abatements Granted:
During Fiscal Year Payable(2) … $ 155,703 $ 147,322 $ 231,948 $ 229,790 $ 295,537
Percent of Tax Levy ……….. 0.4 % 0.4 % 0.7 % 0.7% 0.9%
_________________________
(1) Net after deductions of overlay reserve for abatements.
(2) Actual collections of levy less refunds and amounts refundable but including proceeds of tax titles
and tax possessions attributed to such levy but not including abatements or other credits.
Taking and Sale
Massachusetts law permits a municipality either to sell by public sale (at which the municipality may become thepurchaser) or to take real property for non-payment of taxes thereon. In either case the property owner can redeem theproperty by paying the unpaid taxes, with interest and other charges, but if the right of redemption is not exercisedwithin six months (which may be extended an additional year in the case of certain installment payments) it can beforeclosed by petition to the land court. Upon foreclosure, a tax title purchased or taken by the municipality becomes a“tax possession” and may be held and disposed of like any land held for municipal purposes. Cities and Citys areauthorized to sell delinquent property tax receivables by public sale or auction, either individually or in bulk.
Taxes Outstanding
Massachusetts law permits a municipality either to sell by public sale (at which the municipality may become thepurchaser) or to take real property for non-payment of taxes thereon. In either case the property owner can redeem theproperty by paying the unpaid taxes, with interest and other charges, but if the right of redemption is not exercisedwithin six months (which may be extended an additional year in the case of certain installment payments) it can beforeclosed by petition to the land court. Upon foreclosure, a tax title purchased or taken by the municipality becomes a“tax possession” and may be held and disposed of like any land held for municipal purposes. Cities and towns areauthorized to sell delinquent property tax receivables by public sale or auction, either individually or in bulk. Thefollowing table sets forth the amount of overdue property taxes, tax titles and possessions outstanding at the end of thelast five fiscal years.
The following table sets forth the amount of overdue property taxes, tax titles and possessions outstanding at theend of the last five fiscal years.
For Fiscal Year
2013 2012 2011 2010 2009
Aggregate(1) ………………………. $ 976,850 $ 1,012,321 $ 837,397 $ 764,488 $ 950,039
Tax Titles …………………………. 1,607,159 1,434,972 1,408,653 1,489,363 1,118,219
Tax Possessions (2)……………….. 990,827 956,781 891,196 897,347 890,681
Tax Anticipation Notes Outstanding -0- -0- -0- -0- -0-________________________________________________
(1) Excludes tax titles, tax possessions and abated taxes. Includes taxes in litigation, if any.
(2) The City has taken real property for nonpayment of taxes and foreclosed by petition to the Land Court. Upon foreclosure, the tax
title becomes a tax possession which the City may sell by public sale or dispose of in the same manner as other land held for
municipal purposes.

21
Community Preservation Act
The Massachusetts Community Preservation Act (the “CPA”) permits cities and towns that accept its provisions tolevy a surcharge on its real property tax levy and to receive state matching funds for the acquisition, creation,preservation, rehabilitation and restoration of open space, historic resources and affordable housing. The provisions ofthe CPA must be accepted by the voters of the city or town at an election after such provisions have first been acceptedby either a vote of the legislative body of the city or town or an initiative petition signed by 5% of its registered voters.
A city or town may approve a surcharge of up to 3% of the real property tax levy, and it may accept one or moreexemptions to the surcharge under the CPA, including an exemption for low-income individuals and families and forlow and moderate-income senior citizens, an exemption for $100,000 of the value of each taxable parcel of residentialreal property, and an exemption for commercial and industrial properties in cities and towns with classified tax rates.The surcharge is not counted in the total taxes assessed for the purpose of determining the permitted levy amount underProposition 2½ (see “Tax Limitations” under “PROPERTY TAXATION” above). A city or town may revoke itsacceptance of the provisions of the CPA at any time after 5 years from the date of such acceptance and may change theamount of the surcharge or the exemptions to the surcharge at any time, provided that any such revocation or changemust be approved pursuant to the same process as acceptance of the CPA.
Any city or town that accepts the provisions of the CPA will receive annual state matching grants to supplementamounts raised by its surcharge on the real property tax levy. The state matching funds are raised from certainrecording and filing fees of the registers of deeds. Those amounts are deposited into a state trust fund and aredistributed to cities and towns that have accepted the provisions of the CPA, which distributions are not subject toannual appropriation by the state legislature. The amount distributed to each city and town is based on a statutoryformula which requires that 80% of the amount in the state trust fund be used to match an equal percentage of theamount raised locally by each city and town, and that the remaining 20% of the amount in the fund be distributed onlyto those cities and towns that levy the maximum 3% surcharge based on a formula which takes into account equalizedproperty valuation and population, resulting in larger distributions to those communities with low valuations and smallpopulations. The total state distribution made to any city or town may not, however, exceed 100% of the amount raisedlocally by the surcharge on the real property tax levy.
The amounts raised by the surcharge on real property taxes and received in state matching funds are required to bedeposited in a dedicated community preservation fund. Each city or town that accepts the provisions of the CPA isrequired to establish a community preservation committee to study the community preservation needs of thecommunity and to make recommendations to the legislative body of the city or town regarding the communitypreservation projects that should be funded from the community preservation fund. Upon the recommendations of thecommittee, the legislative body of the city or town may appropriate amounts from the fund for permitted communitypreservation purposes or may reserve amounts for spending in future fiscal years, provided that at least 10% of the totalannual revenues to the fund must be spent or set aside for open space purposes, 10% for historic resource purposes and10% for affordable housing purposes.
The CPA authorizes cities and towns that accept its provisions to issue bonds and notes in anticipation of thereceipt of surcharge revenues to finance community preservation projects approved under the provisions of the CPA.Bonds and notes issued under the CPA are general obligations of the city or town and are payable from amounts ondeposit in the community preservation fund. In the event that a city or town revokes its acceptance of the provisions ofthe CPA, the surcharge shall remain in effect until all contractual obligations incurred by the city or town prior to suchrevocation, including the payment of bonds or notes issued under the CPA, have been fully discharged. The City ofAmesbury has not accepted the provisions of the Community Preservation Act.

22
ADDITIONAL INFORMATION
Budget and Appropriation Process
Within one hundred seventy days after the annual organization of the City government (normally on the first day ofthe year), the Mayor submits to the Municipal Council the annual budget in the form of a statement of the amountsrecommended for the proposed expenditures of the City for the next fiscal year. The annual budget is classified anddesignated so as to show separately with respect to each officer, department or undertaking for which an appropriationis recommended.
The Municipal Council may by majority vote make appropriations for the purpose recommended and may reduceor reject any amount recommended but, except on recommendation of the Mayor, may not increase any amount in orthe total of the annual budget, nor add thereto any amount for the purpose not included therein (except by two-thirdsvote for certain purposes deemed necessary by the Council no earlier than seven days after the Council has taken aformal vote requesting the inclusion of said addition).
If the Council fails to take action with respect to any amount recommended in the annual budget, either byapproving, reducing or rejecting the same, within forty five days after the receipt of the budget, such amount withoutany action of the Council becomes a part of the appropriations for the year and is available for the purpose specified.
If, upon the expiration of one hundred seventy days after the annual organization of the City government, theMayor has not submitted the annual budget, the Municipal Council is authorized to prepare said budget.
The school budget is limited to the total amount appropriated by the Municipal Council, but the school committeeretains full power to allocate the funds appropriated.
State and county assessments, the overlay for abatements in excess of overlays, principal and interest not otherwiseprovided for and final judgments are included in the tax levy whether or not included in the budget. Revenues are notrequired to be set forth in the budget but estimated non-tax revenues are taken into account by the assessors in fixingthe tax levy. (See “Property Taxation” above).
Operating Budget Trends
The following table sets forth the operating budgets for the following fiscal years as voted by the MunicipalCouncil. As such, said budgets reflect neither revenues nor state and county assessments and other mandatory itemsnor supplemental budget appropriations. See “Budget and Appropriation Process” above. Similarly, the budgetssummarized below exclude expenditures for “non-operating” or extraordinary items authorized by additional orders ofthe municipal council.
Water and Sewer operations are being accounted for in separate enterprise accounts and are excluded from thetable below.
Appropriated Appropriated Appropriated Appropriated Appropriated
Fiscal Year Fiscal Year Fiscal Year Fiscal Year Fiscal Year
2014 2013 2012 2011 2010
General Government…………….… $ 2,504,994 $ 3,033,239 $ 2,466,182 $ 2,504,438 $ 2,526,959
Public Safety………………………. 6,946,468 6,846,825 6,656,939 6,486,146 6,540,318
Health and Sanitation……………… 1,040,897 1,153,908 1,132,079 1,115,861 955,597
Public Works……………………… 1,583,277 1,534,547 1,488,091 1,474,200 1,380,605
Schools……………………………. 28,177,702 27,217,686 26,636,105 25,657,976 25,758,055
Library……………………………. 768,713 707,994 691,213 642,036 595,047
Parks and Recreation……………… 304,684 293,463 265,627 236,376 236,376
Veterans…………………………… 441,360 406,005 372,649 340,652 307,916
Debt and Interest…………………. 2,251,222 2,321,861 2,317,094 2,448,187 2,548,871
Insurance………………………….. 278,300 278,300 278,300 278,300 278,360
Employee Benefits……………….. 4,805,967 4,678,822 4,990,146 4,504,938 4,463,885
Council on Aging…………………. 137,182 125,297 104,085 88,966 81,639
Totals: $ 49,240,766 $ 48,597,947 $ 47,398,510 $ 45,778,076 $ 45,673,628

23
Water and Sewer Rates and Services
The City uses enterprise funds to account for its water and sewer enterprise activities. Water and sewer operationsare offset by estimated receipts from rates and fees charged for services provided by the departments. All revenues andexpenditures are accounted for in the fund and any fund balance remains within the funds.
The Amesbury water treatment facility was built in 1985 and recently upgraded in March of 2012. The Cityprovides water services to 95% of its residents. Charges for water are based on actual metered consumption at aresidential rate of $6.40 per cubic ft. and bills are issued on a quarterly billing cycle. The operating expenses of thewater department are fully supported by user charges.
The City owns and operates a wastewater treatment facility of which the operating expenses are fully supportedby user charges. Sewer services are provided to 80% of residents and are billed on a quarterly basis. The residentialsewer rate is $6.39 per cubic ft. and the commercial sewer rate is $6.39 per cubic ft.
Retirement Plan
The Massachusetts General Laws provide for the establishment of contributory retirement systems for stateemployees, for teachers and for county, city and town employees other than teachers. Teachers are assigned to a separatestatewide teachers’ system and not to the city and town systems. For all employees other than teachers, this law is subjectto acceptance in each city and town. Substantially all employees of an accepting city or town are covered. If a City has apopulation of less than 10,000 when it accepts the statute, its non-teacher employees participate through the county systemand its share of the county cost is proportionate to the aggregate annual rate of regular compensation of its coveredemployees. In addition to the contributory systems, cities and towns provide non-contributory pensions to a limited numberof employees, primarily persons who entered service prior to July 1, 1937 and their dependents. The Public EmployeeRetirement Administration Commission (“PERAC”) provides oversight and guidance for and regulates all state and localretirement systems.
The obligations of a city or town, whether direct or through a county system, are contractual legal obligations and arerequired to be included in the annual tax levy. If a city or town, or the county system of which it is a member, has notestablished a retirement system funding schedule as described below, the city or town is required to provide for the paymentof the portion of its current pension obligations which is not otherwise covered by employee contributions and investmentincome. “Excess earnings,” or earnings on individual employees’ retirement accounts in excess of a predetermined rate, arerequired to be set aside in a pension reserve fund for future, not current, pension liabilities. Cities and towns may voluntarilyappropriate to their system’s pension reserve fund in any given year up to five percent of the preceding year’s tax levy. Theaggregate amount in the fund may not exceed ten percent of the equalized valuation of the city or town.
If a city or town, or each member city and town of a county retirement system, has accepted the applicable law, it isrequired to annually appropriate an amount sufficient to pay not only its current pension obligations, but also a portion of itsfuture pension liability. The portion of each such annual payment allocable to future pension obligations is required to bedeposited in the pension reserve fund. The amount of the annual city or town appropriation for each such system isprescribed by a retirement system funding schedule which is periodically reviewed and approved by PERAC. Eachsystem’s retirement funding schedule is designed to reduce the unfunded actuarial pension liability of the system to zero bynot later than June 30, 2030, with annual increases in the scheduled payment amounts of not more than 4.5 percent. Thefunding schedule must provide that payment in any year of the schedule is not less than 95 percent of the amountappropriated in the previous fiscal year. City, town and county systems which have an approved retirement fundingschedule receive annual pension funding grants from the Commonwealth for the first 16 years of such funding schedule.Pursuant to recent legislation, a system (other than the state employees’ retirement system and the teachers’ retirementsystem) which conducts an actuarial valuation as of January 1, 2009, or later, may establish a revised schedule whichreduces the unfunded actuarial liability to zero by not later than June 30, 2040, subject to certain conditions. If theschedule is so extended under such provisions and a later updated valuation allows for the development of a revisedschedule with reduced payments, the revised schedule shall be adjusted to provide that the appropriation for each yearshall not be less than that for such year under the prior schedule, thus providing for a shorter schedule rather thanreduced payments.
City, town and county systems may choose to participate in the Pension Reserves Investment Trust Fund (the “PRITFund”), which receives additional state funds to offset future pension costs of participating state and local systems. If a localsystem participates in the PRIT Fund, it must transfer ownership and control of all assets of its system to the Pension

24
Reserves Investment Management Board, which manages the investment and reinvestment of the PRIT Fund. Cities andtowns with systems participating in the PRIT Fund continue to be obligated to fund their pension obligations in the mannerdescribed above. The additional state appropriations to offset future pension liabilities of state and local systemsparticipating in the PRIT Fund are required to total at least 1.3 percent of state payroll. Such additional state appropriationsare deposited in the PRIT Fund and shared by all participating systems in proportion to their interests in the assets of thePRIT Fund as of July 1 for each fiscal year.
Cost-of-living increases for each local retirement system may be granted and funded only by the local system, andonly if it has established a funding schedule. Those statutory provisions are subject to acceptance by the local retirementboard and approval by the local legislative body, which acceptance may not be revoked.
Substantially all employees in the City (except for public school teachers and certain administrators who aremembers of the Commonwealth’s Teachers Contributory Retirement System to which the City does not contribute) aremembers of the Amesbury Contributory Retirement System (“ACRS”), a cost-sharing multiple-employer definedbenefit pension plan. Eligible employees must participate in the ACRS. The pension plan provides pension benefits,deferred allowances and death and disability benefits.
Plan members of the System are required to contribute at rates ranging from 5% to 11% of annual coveredcompensation. The City is required to contribute at actuarially determined rates as accepted by the Public EmployeeRetirement Administration Commission (“PERAC”). The contributions of plan members and the City are governed byChapter 32 of the Massachusetts General Laws.
The City’s contributions to the System for the last four fiscal years and the amount budgeted for fiscal year 2014are set forth below.
For Fiscal Year
2014(1) 2013 2012 2011 2010
Contributory…………….……. $3,303,592 $3,088,759 $2,982,902 $2,837,492 $2,730,354
(1) Budgeted.
The foregoing data does not include the retirement system costs or liabilities attributable to employees of theCounty or the retirement system costs or liabilities of any other entity of which the City is a constituent part.
As of January 1, 2012, Amesbury’s total estimated actuarial accrued liability in the contributory retirement systemwas $78,002,515, and the actuarial value of its assets were $38,865,235, leaving an estimated unfunded actuarialaccrued liability of $39,137,280. The ratio of system’s assets to total liability was 49.8%. The principal actuarialassumptions used in the valuation are an investment rate of return of 8.25% and a rate of salary increase of 4.0%.
Teachers of the City are covered by the Massachusetts Teachers Retirement System (“MTRS”). The MTRS isfunded by contributions from covered employees and the Commonwealth of Massachusetts. The City is not required tocontribute. In fiscal year 2012, the Commonwealth of Massachusetts contributed $4,772,492 to the MTRS on behalf ofthe City.
Other Post-Employment Benefits
In addition to pension benefits, cities and towns may provide retired employees with health care and life insurancebenefits. The portion of the cost of such benefits paid by cities or towns is generally provided on a pay-as-you-gobasis. The Governmental Accounting Standards Board (“GASB”) recently promulgated its Statement Nos. 43 and 45,which will for the first time require public sector entities to report the future costs of these non-pension, post-employment benefits in their financial statements. These new accounting standards do not require pre-funding thepayment of these costs as the liability for such costs accrues, but the basis applied by the standards for measurement ofcosts and liabilities for these benefits is conservative if they continue to be funded on a pay-as-you-go basis and willresult in larger yearly cost and liability accruals than if such benefits were pre-funded in a trust fund in the samemanner as traditional pension benefits. Cities and towns that choose to self-insure all or a portion of the costs of thehealth care benefits they provide to employees and retirees may establish a trust fund for the purposes of paying claims.On January 10, 2009, Massachusetts enacted Chapter 479 of the Laws of 2009 which permits municipalities toestablish a trust fund for the purpose of pre-funding this liability.

25
The City adopted the requirements of GASB Statement 45 which required public sector entities to report the futurecosts of these non-pension, post-employment benefits in their financial statements. The Citys annual other post-employment benefit cost is calculated based on the annual required contribution of the employer (“ARC”), an amountactuarially determined in accordance with the parameters of GASB statement No. 45. The ARC represents a level offunding that, if paid on an ongoing basis, is projected to cover normal costs each year and amortize any unfundedactuarial liabilities (or funding excess) over a period not to exceed thirty years.
Using the services of an actuary, the City has finalized its current obligation/liability for other post-employmentbenefits for active and retired employees following the GASB Statements 43 and 45 (including health care and lifeinsurance) as of June 30, 2013 in the amount of $87,212,371. The annual required contribution (ARC) ofapproximately $5,116,705 assumes a 4.00% investment rate of return for fiscal year 2013. Although there is not acurrent requirement to fund the ARC, various funding strategies are under discussion in the City that move to reducefuture benefit costs. Funding discussions will be ongoing as requirements and liabilities change.
Contributions made to the plan in the past three years are as follows:
Annual
Fiscal Year Required Net OPEB
Ended June 30 Contributions (ARC) Contribution Obligation
2013 $5,116,705 $2,706,193 $15,445,398
2012 6,170,235 2,377,352 12,955,792
2011 5,891,102 3,053,628 9,137,325
Contractual Obligations
Municipal contracts are generally limited to currently available appropriations. A city or town generally hasauthority to enter into contracts for the exercise of any of its corporate powers for any period of time deemed to serveits best interests, but generally only when funds are available for the first fiscal year; obligations for succeeding fiscalyears generally are expressly subject to availability and appropriation of funds. Municipalities have specific authority inrelatively few cases to enter long-term contractual obligations that are not subject to annual appropriation, includingcontracts for refuse disposal and sewage treatment and disposal. Municipalities may also enter into long-term contractsin aid of housing and renewal projects. There may be implied authority to make other long-term contracts required tocarry out authorized municipal functions, such as contracts to purchase water from private water companies.
Municipal contracts relating to solid waste disposal facilities may contain provisions requiring the delivery ofminimum amounts of waste and payments based thereon and requiring payments in certain circumstances withoutregard to the operational status of the facilities.
Pursuant to the Home Rule Amendment to the Massachusetts Constitution, cities and towns may also beempowered to make other contracts and leases.
The City of Amesbury has a five year long-term contract which expires in 2018 with G. Mello Disposal Corp. forthe transportation, disposal of solid waste and the expense of recycling totaling approximately $990,000 annually. TheCity also has a contract with Salter Transportation for school busing with expires in 2015 for an annual expense of$524,538.
Excluding the above, the City does not have any additional significant long-term contracts or lease-purchaseagreements.
State Aid
In addition to grants for specified capital purposes (some of which are payable over the life of the bonds issued for theprojects), the Commonwealth provides financial assistance to cities and towns for current purposes. Payments to cities andtowns are derived primarily from a percentage of the State’s personal income, sales and use, and corporate excise taxreceipts, together with the net receipts from the State Lottery. A municipality’s state aid entitlement is based on a number ofdifferent formulas, of which the “schools” and “lottery” formulas are the most important. Both of the major formulas tendto provide more state aid to poorer communities. The formulas for determining a municipality’s state aid entitlement are

26
subject to amendment by the state legislature and, while a formula might indicate that a particular amount of state aid isowed, the amount of state aid actually paid is limited to the amount appropriated by the state legislature. The state annuallyestimates state aid, but the actual state aid payments may vary from the estimate.
In the fall of 1986, both the State Legislature (by statute, repealed as of July 1, 1999) and the voters (by initiativepetition) placed limits on the growth of state tax revenues. Although somewhat different in detail, each measure essentiallylimited the annual growth in state tax revenues to an average rate of growth in wages and salaries in the Commonwealthover the three previous calendar years. If not amended, the remaining law could restrict the amount of state revenuesavailable for state aid to local communities.
The following table represents state aid estimated receipts, net of estimated charges, for the following fiscal years:
For Fiscal Year
2014(1) 2013 2012 2011 2010
School Operating Aid……………… $8,577,441 $8,517,266 $8,422,786 $8,377,810 $8,897,607
Other State Aid……………………. 2,522,730 2,479,253 2,490,828 2,597,521 2,674,970
Total Receipts………………….. 11,100,171 10,996,519 10,913,614 10,975,331 11,572,577
Less Estimated Charges…………… -2,912,734 -2,335,124 -2,373,195 -2,455,321 -2,632,655
Net State Aid……..………………. $8,187,437 $8,661,395 $8,540,419 $8,520,010 $8,939,922
___________________________
(1) Estimated.
Federal Aid
The following table represents federal aid estimated receipts for the following fiscal years:
For Fiscal Year
2014(1) 2013 2012 2011 2010
Total Federal Aid………………….. $ 2,000,000 $ 2,354,987 $ 906,229 $ 2,086,275 $ 1,862,403
___________________________
(1) Estimated.
Motor Vehicle Excise
An excise is imposed on the registration of motor vehicles (subject to exemptions) at the rate of $25 per $1,000 ofvaluation. The excise is collected by and for the benefit of the municipality in which the motor vehicle is customarily kept.Valuations are determined by a statutory formula based on manufacturers’ list price and year of manufacture. Bills not paidwhen due bear interest at 12 percent per annum. Provision is also made, after notice to the owner, for suspension of theowner’s operating license or registration by the registrar of motor vehicles.
The City collects the motor vehicle excise tax from bills prepared by the Massachusetts Registry of MotorVehicles. The following table reflects motor vehicle excise receipts for each of the last five fiscal years.
For Fiscal Year
2013 2012 2011 2010 2009
Motor Vehicle Excise……….. $1,630,580 $1,657,739 $1,542,432 $1,532,597 $1,613,436
Other Taxes
Three additional sources of revenue for local governments are the room occupancy tax, local meals excise tax and theaviation tax. All the taxes take effect only where accepted by individual municipalities. Under the room occupancy excisetax, local governments may tax the provision of hotel, motel, lodging house and bed and breakfast rooms at a rate not toexceed six percent of the cost of renting such rooms. The tax is paid by the operator of each establishment to the StateCommissioner of Revenue, who in turn pays the tax back to the municipality in which the rooms are located. The Cityvoted to impose the room occupancy excise tax at a rate of 6%. The City’s distribution for fiscal year 2013 was $81,942.

27
The local meals excise tax, effective for sales of restaurant meals on or after October 1, 2009, is a three-fourths percenton the gross receipts of a vendor from the sale of restaurant meals. The tax is paid by the vendor to the State Commissionerof Revenue, who in turn pays the tax to the municipality in which the meal was sold. The City voted on May 14, 2013 toaccept the local meals excise tax. The estimated annual revenue is expected to be approximately $200,000.
The aviation fuel tax is a five percent tax (with a minimum of five cents per gallon) on the sale or use of jet fuel to or byjet aircraft. The tax is paid by the seller/user of the fuel to the Commissioner of Revenue, who in turn, rebates the tax backto the municipality in which the fuel being taxed was transferred to an aircraft. The City has not voted to accept the aviationfuel tax.
State School Building Assistance Program
Under its school building assistance program, the Commonwealth of Massachusetts provides grants to cities,towns and regional school districts for school construction projects. Until July 26, 2004, the State Board of Educationwas responsible for approving grants for school projects and otherwise administering the program. Grant amountsranged from 50% to 90% of approved project costs. Municipalities generally issued bonds to finance the entire projectcost, and the Commonwealth disbursed the grants in equal annual installments over the term of the related bonds.
Pursuant to legislation which became effective on July 26, 2004, the state legislature created the MassachusettsSchool Building Authority (the “Authority”) to finance and administer the school building assistance program. TheAuthority has assumed all powers and obligations of the Board of Education with respect to the program. In addition tocertain other amounts, the legislation dedicates a portion of Commonwealth sales tax receipts to the Authority tofinance the program.
Projects previously approved for grants by the State Board of Education are entitled to receive grant paymentsfrom the Authority based on the approved project cost and reimbursement rate applicable under the prior law. TheAuthority has paid and is expected to continue to pay the remaining amounts of the grants for such projects either inannual installments to reimburse debt service on bonds issued by the municipalities to finance such projects, or as lumpsum payments to contribute to the defeasance of such bonds.
Projects on the priority waiting list as of July 1, 2004 are also entitled to receive grant payments from theAuthority based on the eligible project costs and reimbursement rates applicable under the prior law. With limitedexceptions, the Authority is required to fund the grants for such projects in the order in which they appear on thewaiting list. Grants for any such projects that have been completed or substantially completed have been paid and areexpected to continue to be paid by the Authority in lump sum payments, thereby eliminating the need for the Authorityto reimburse interest expenses that would otherwise be incurred by the municipalities to permanently finance theAuthority’s share of such project costs. Interest on debt issued by municipalities prior to July 1, 2004 to finance suchproject costs, and interest on temporary debt until receipt of the grant, is included in the approved costs of suchprojects. Grants for any such projects that have not yet commenced or that are underway have been and are expected tocontinue to be paid by the Authority as project costs are incurred by the municipality pursuant to a project fundingagreement between the Authority and the municipality, eliminating the need for the municipality to borrow even on atemporary basis to finance the Authority’s share of the project costs in most cases.
The range of reimbursement rates for new project grant applications submitted to the Authority on or after July 1,2007 has been reduced to between 40% and 80% of approved project costs. The Authority promulgated newregulations with respect to the application and approval process for projects submitted after July 1, 2007. TheAuthority expects to pay grants for such projects as project costs are incurred pursuant to project funding agreementsbetween the Authority and the municipalities. None of the interest expense incurred on debt issued by municipalities tofinance their portion of the costs of new projects will be included in the approved project costs eligible forreimbursement.
Tax Increment Financing for Development Districts
Under recent legislation, cities and towns are authorized to establish development districts to encourage increasedresidential, industrial and commercial activity. All or a portion of the taxes on growth in assessed value in such districtsmay be pledged and used solely to finance economic development projects pursuant to the city or town’s developmentprogram for the district. This includes pledging such “tax increments” for the payment of bonds issued to finance suchprojects. As a result of any such pledge, tax increments raised from new growth properties in development districts are notavailable for other municipal purposes. Tax increments are taken into account in determining the total taxes assessed for

28
the purpose of calculating the maximum permitted tax levy under Proposition 2½ (see “Tax Limitations” under“PROPERTY TAXATION” above).
Investments
Investments of funds of cities and towns, except for trust funds, are generally restricted by Massachusetts GeneralLaws Chapter 44, §55. That statute permits investments of available revenue funds and bond and note proceeds in termdeposits and certificates of deposits of banks and trust companies, in obligations issued or unconditionally guaranteed bythe federal government or an agency thereof with a maturity of not more than one year, in repurchase agreements with amaturity of not more than 90 days secured by federal or federal agency securities, in participation units in the MassachusettsMunicipal Depository Trust (“MMDT”), or in shares in SEC-registered money market funds with the highest possiblerating from at least one nationally recognized rating organization.
MMDT is an investment pool created by the Commonwealth. The State Treasurer is the sole trustee, and the funds aremanaged under contract by an investment firm under the supervision of the State Treasurer’s office. According to the StateTreasurer the Trust’s investment policy is designed to maintain an average weighted maturity of 90 days or less and islimited to high-quality, readily marketable fixed income instruments, including U.S. Government obligations and highly-rated corporate securities with maturities of one year or less.
Trust funds, unless otherwise provided by the donor, may be invested in accordance with §54 of Chapter 44, whichpermits a broader range of investments than §55, including any bonds or notes that are legal investments for savings banksin the Commonwealth. The restrictions imposed by §§54 and 55 do not apply to city and town retirement systems.
Free Cash
Under Massachusetts law, an amount known as “free cash” is certified as of the beginning of each fiscal year bythe State Bureau of Accounts and this, together with certain subsequent tax receipts, is used as the basis for subsequentappropriations from available funds, which are not required to be included in the annual tax levy. Subject to certainadjustments, free cash is surplus revenue less uncollected and overdue property taxes from prior years. Free cash as ofthe beginning of the fiscal year, together with collections of prior years’ taxes through March 31, is available undercurrent law for appropriation to reduce the following fiscal years’ tax levy. The following table reflects the certifiedfree cash for the following fiscal years.
For Fiscal Year Beginning July 1
2013 2012 2011 2010 2009
Free Cash ………………………….. $729,690 $1,274,364 $1,159,328 $1,009,160 $77,599
_________________________
Source: Massachusetts Department of Revenue - Subject to certain adjustments, free cash is surplus revenue less
uncollected and overdue property taxes from prior years.
Undesignated General Fund Balance and Stabilization Fund Balance
Under Section 5B of Chapter 40 of the Massachusetts General Laws, the City may for the purpose of creating astabilization fund, appropriate in any year an amount not exceeding ten percent of the amount raised in the precedingyear by taxation of real estate and tangible personal property or such larger amount as may be approved by theEmergency Finance Board. The aggregate amount in the fund at any time shall not exceed ten percent of the equalizedvaluation of the City and any interest shall be added to and become a part of the fund. The stabilization fund may beappropriated in a City at a City meeting and also at a special City meeting by a two-thirds vote for any lawful purpose.The following table reflects the Undesignated General Fund Balance and the Stabilization Fund Balance for thefollowing fiscal years.
For Fiscal Year Ending June 30
2013 2012 2011 2010 2009
Undesignated General Fund Balance(2) $2,582,647(1) $2,685,470(1) $2,353,805 (1) $1,583,800 $761,875
Stabilization Fund Balance ….….. 1,182,608 1,145,445 1,108,375 1,070,824 1,034,358
(1) Unassigned Fund Balance as a result of GASB 54.
(2) Based on financial statements.

29
Financial Statements
Comparative balance sheets and revenues and expenditures have been extracted from the City’s financialstatements for the fiscal years ending June 30, 2008 through 2012 prepared by Melanson Heath & Company PC,Certified Public Accountants and are included as Appendix A. The City’s financial statements for the fiscal year endedJune 30, 2013 will be filed separately. Also attached is the City’s unaudited Combined Balance Sheet as of June 30,2013.
Litigation
In the opinion of the City, there is no litigation pending which, either individually or in the aggregate, is likely toresult in final judgments against the City which would materially affect the City’s financial position or its ability to payits obligations.
CITY OF AMESBURY,MASSACHUSETTS
By: /s/ Donna CornoniTreasurer

30
CITY OF AMESBURY, MA APPENDIX ACOMPARATIVE BALANCE SHEETS(1)GENERAL FUNDAS OF JUNE 30,
2012(2) 2011(2) 2010 2009 2008
Assets:
Cash and Short-Term Investments $ 4,807,337 $ 4,689,469 $ 5,352,268 $ 3,793,839 $ 4,239,480
Investments 1,205,622 1,165,980 - - -
Receivables:
Property Taxes 1,825,946 1,651,990 1,690,775 1,558,023 1,218,678
Excise Taxes 374,802 423,807 379,871 379,637 500,392
Intergovernmental - - - - 49,173
Other assets - 140,133 - - -
Due to Other Funds 60,611 28,707 - - 48,662
Total Assets 8,274,318 8,100,086 7,422,914 5,731,499 6,056,385
Liabilities:
Warrants Payable 149,319 - 655,478 1,257,575 1,469,986
Accrued Liabilities 1,427,638 1,950,660 - - -
Deferred Revenues 2,200,747 2,075,797 2,070,646 1,937,660 2,296,763
Accrued Expenditures - - 2,965,288 1,694,513 1,768,243
Other liabilities 26,376 6,678 - - -
Total Liabilities 3,804,080 4,033,135 5,691,412 4,889,748 5,534,992
Fund Balance (Deficit):
Reserved for Encumbrances - - 147,702 79,876 63,320
Reserved for debt service - - - - 28,373
Unreserved:
Designated - - - - -
Undesignated - - 1,583,800 761,875 429,700
Committed 1,205,622 1,165,980 - - -
Assigned 579,146 547,166 - - -
Unassigned 2,685,470 2,353,805 - - -
Total Fund Balances 4,470,238 4,066,951 1,731,502 841,751 521,393
Total Liabilities and Fund Balances $ 8,274,318 $ 8,100,086 $ 7,422,914 $ 5,731,499 $ 6,056,385
______________________(1) Extracted from annual financial statements.
(2) The City has adopted the provisions of GASB Statement No. 54, Fund Balance Reporting and Governmental Fund
Type Definitions in 2011.

31
CITY OF AMESBURY, MACOMPARATIVE STATEMENTS OF REVENUES AND EXPENDITURES(1)GENERAL FUNDAS OF JUNE 30,
2012(2) 2011(2) 2010 2009 2008
Revenues:
Property Taxes $ 34,867,582 $ 34,001,996 $ 33,475,486 $ 32,118,079 $ 30,247,105
Excise Taxes 1,751,958 1,641,421 1,607,295 1,695,664 1,758,552
Interest, Penalties and other Taxes 228,633 248,863 149,735 170,726 126,543
Charges for Services 181,103 395,731 272,686 255,833 202,238
Intergovernmental 16,248,933 15,489,839 16,043,695 15,512,403 16,418,149
Licenses and Permits 373,177 356,662 261,020 268,343 223,462
Fines and Forfeitures 118,682 106,883 113,950 153,276 138,320
Interest Earnings 50,692 50,241 30,290 70,751 197,038
Miscellaneous 67,778 26,285 81,377 44,839 331,310
Total Revenues 53,888,538 52,317,921 52,035,534 50,289,914 49,642,717
Expenditures:
General Government 1,930,294 1,507,124 2,080,477 2,256,007 2,373,116
Public Safety 6,792,274 6,610,231 7,060,056 6,474,357 6,421,903
Education 30,596,656 29,271,975 29,359,439 27,613,130 27,527,679
Public Works 2,507,608 2,792,139 2,308,071 2,925,147 2,782,589
Human Services 917,367 853,207 744,109 654,106 595,251
Culture and Recreation 688,960 639,871 590,108 585,639 551,064
Employee Benefits 5,003,297 4,645,157 4,550,127 4,656,906 4,583,510
Debt Service 2,260,542 2,443,350 2,542,728 2,037,505 2,235,681
Intergovernmental 3,281,415 3,122,141 3,353,693 3,421,459 3,679,539
Total Expenditures 53,978,413 51,885,195 52,588,808 50,624,256 50,750,332
Excess of Revenues Over (Under)
Expenditures (89,875) 432,726 (553,274) (334,342) (1,107,615)
Other Financing Sources (Uses):
Operating Transfers In 840,127 769,276 1,443,025 654,700 663,300
Operating Transfers (out) (346,965) - - - (538,000)
Total Other Financing Sources 493,162 769,276 1,443,025 654,700 125,300
Excess of Revenues And Other Financing
Sources Over (Under)Expenditures And
Other Financing Uses 403,287 1,202,002 889,751 320,358 (982,315)
Fund Balance (Deficit), Beginning of Year 4,006,951 2,864,949(3) 841,751 521,393 1,503,708
Fund Balance (Deficit), End of Year $ 4,410,238 $ 4,066,951 $ 1,731,502 $ 841,751 $ 521,393
________________________(1) Extracted from annual financial statements.
(2) The City has adopted the provisions of GASB Statement No. 54, Fund Balance Reporting and Governmental Fund
Type Definitions in 2011.
(3) As restated.

City of Amesbury,MA BALANCE SHEET AS OF JUNE 30, 2013GENERAL FUND
ASSETS LIABILITIES AND RESERVESCASH-INVESTMENTS PROVISION FOR ABATEMENTS
Cash 4,303,386.64$ Abatements 2013 197,315.99$Abatements 2012 185,711.16$
ACCOUNTS RECEIVABLE: TAXES Abatements 2011 160,372.60$Personal Property 2013 12,184.79$ Abatements 2010 200,794.72$Personal Property 2012 11,466.99$ Abatements 2009 53,066.07$Personal Property Prior 16,869.56$ Abatements Prior 950,996.04$ 1,748,256.58$
Real Estate 2013 806,857.84$Real Estate 2012 30,697.70$Real Estate Prior 98,773.64$ 976,850.52$
Tax Deferrals 178,969.66$ REVENUE RESERVEDTax Liens 1,607,158.58$ Deferred Revenue - Taxes (771,406.06)$Tax Foreclosure 990,827.37$ Deferred Revenue - Deferral 178,969.66$Tax Litigation 77,343.74$ Deferred Revenue - Advanced -$
Deferred Revenue - Liens 1,607,158.58$EXCISE TAX: Deferred Revenue - Foreclosures 990,827.37$
Motor Vehicle 2013 264,676.70$ Deferred Revenue - Excise 486,349.40$Motor Vehicle 2012 40,563.64$ Deferred Revenue - Litigation 77,343.74$ 2,569,242.69$
Motor Vehicle 2011 19,962.64$Motor Vehicle 2010 15,035.92$Motor Vehicle Prior 113,988.50$ 454,227.40$
LIABILITIESBoat 2013 10,797.00$ Accrued Expenditures 1,079,804.72$Boat 2012 6,184.00$ Other Liabilities 438,705.68$ 1,518,510.40$
Boat Prior 15,141.00$ 32,122.00$
DESIGNATED FUND BALANCEReserved for Expenditures -$
Reserved for Encumbrances 202,229.74$Undesignated Fund Balance 2,582,646.50$
8,620,885.91$ 8,620,885.91$

City of Amesbury,MA BALANCE SHEET AS OF JUNE 30, 2013SEWER FUND
ASSETS LIABILITIES AND RESERVESSEWER FUND SEWER FUND
Cash 154,288.92$ Deferred Revenue 191,946.46$Accounts Receivable 191,946.46$ Notes Payable -$Amounts to be Provided 10,381,501.22$
BONDS PAYABLE
Title 5 Septic Program 15,293.86$
SRF 95-11 13,877.86$
SRF 95-32 120,512.71$
SRF 95-33 178,578.79$
SRF 98-83 120,000.00$
SRF 01-13 5,070,000.00$
2003 Sewer Cedar St 585,000.00$
2003 Sewer Improvements 510,000.00$
2003 Sewer Plant 385,000.00$
2003 SRF CW02-17A 1,196,787.00$
2003 SRF CW02-17B 291,499.00$
2005 Sewer Plant Refunding 446,190.00$
2005 Sewer Refunding 118,585.00$
2007 SRF CW02-17C 700,177.00$
2008 Sewer Plant 630,000.00$ 10,381,501.22$
Other Liabilities 4,556.81$
Reserved for Encumbrances 5,990.78$Reserved for Capital -$Retained Earnings 143,741.33$Undesignated Fund Balance -$
10,727,736.60$ 10,727,736.60$

City of Amesbury,MA BALANCE SHEET AS OF JUNE 30, 2013WATER FUND
ASSETS LIABILITIES AND RESERVESWATER FUND WATER FUND
Cash 856,719.87$ Deferred Revenue 279,593.72$Accounts Receivable 279,593.72$ Notes Payable -$Amounts to be Provided 15,943,451.51$
BONDS PAYABLE
2003 Water Cedar St 165,000.00$
2003 Water Intake 550,000.00$
2003 Water Improvements 520,000.00$
2005 Water Mains Refunding 298,155.00$
2005 Reservoir Refunding 744,345.00$
2005 Water Refunding 163,455.00$
2008 Water Plant 340,000.00$
2008 Water Equipment 15,000.00$
2010 SRF 08-21 Water 3,005,349.51$
2012 SRF 08-20 Water 10,142,147.00$ 15,943,451.51$
Other Liabilities 9,475.28$Reserved for Encumbrances 17,200.00$
Reserved for Capital -$
Retained Earnings 830,044.59$
17,079,765.10$ 17,079,765.10$
LANDRY STADIUM
LANDRY STADIUM LANDRY STADIUMCash 17,269.04$ Retained Earnings 17,269.04$

City of Amesbury,MA BALANCE SHEET AS OF JUNE 30, 2013SPECIAL REVENUE
ASSETS LIABILITIES AND RESERVESSPECIAL REVENUE SPECIAL REVENUE
Cash 3,760,558.35$ CDBG 23,903.88$PD Seized 12,225.18$Cultural Center 4,730.81$Click it or Ticket 3,518.98$Health Grant 4,030.36$Fire Safe 5,452.48$Safe House 21,089.76$Emergency Management 7,164.52$Fire Recovery System 4,363.75$Clean Energy 839.20$Urban Self Help 31,262.70$RTE 110 Development 5,006.45$Pond Hill Road 10,000.00$Bullet Proof Vest 17,965.58$Cultural Council 11,454.93$Kiosk 5,945.00$State Aid to Library 15,872.32$COA Grants 26,125.13$Upper Millyard Study 4,552.00$Gifts General 6,929.28$Homeland Sec. Fire 14,078.93$LEPC 6,061.37$Homeland Sec. Police 35,575.31$Library Gift / Grant 54,721.87$Conservation Com Gift 10,290.65$Youth Grant 15,255.95$School Title I 23,498.90$School Title II 1,290.00$Mass Tiered Systems -$Quality Kinder (7,233.00)$Early Mental Health 183.24$

City of Amesbury,MA BALANCE SHEET AS OF JUNE 30, 2013ASSETS SPECIAL REVENUE LIABILITIES AND RESERVES
SPECIAL REVENUE SPECIAL REVENUESupport Access 4,124.40$Project Support (84,750.94)$ECAP 1,775.60$Academic Support (2,544.00)$School Health 2,979.95$Inst. Savings 5,644.28$K-12 Literacy -$Race to the Top 8,549.80$Health Agreement 58,642.40$Cable Access 57,669.20$Ambulance Receipts 835,461.05$Cemetery Lots 14,010.00$Waterways 35,988.33$COA Receipts 10,623.06$Planning Board Fees 299,687.35$Con. Com. Fees 67,652.27$ZBA Fees -$Insurance Receipts 1,819.19$Cell Damage 806.34$School Lunch (71,501.76)$Library Grant 6,698.77$School Choice 694,685.76$School Tuition 364,975.61$School Transportation 2,200.24$Circuit Breaker 13,801.39$School Gifts 7,670.06$Preschool 26,196.91$School Activity 93,010.85$Lost Books 4,019.85$

City of Amesbury,MA BALANCE SHEET AS OF JUNE 30, 2013SPECIAL REVENUE
SPECIAL REVENUE ASSETS SPECIAL REVENUE LIABILITIES AND RESERVESProfessional Development 15,330.85$Athletics 156,443.41$Vending Machines 21,080.16$School Ins. 7,383.30$School Use 126,312.80$Woodsom Farm Use 26,260.61$Youth Fund 523,284.91$Golden Triangle 18,086.74$Mass Casualty Trailer 3,209.95$Host Community Waste 27,114.13$
TOTAL 3,760,558.35$ 3,760,558.35$
TRUST FUNDS
NON EXPENDABLE NON EXPENDABLECash 1,888,434.13$ Health Care 653,737.97$
Library 257,851.10$Library Restricted 49,815.82$AHS 50th 181,938.59$Misc Scholarships 439,479.92$Mt. Prospect Cemetery 119,075.52$Union Cemetery 170,096.97$Old Corner Cemetery 3,214.34$Misc. 13,223.90$ 1,888,434.13$
EXPENDABLE EXPENDABLECash 1,861,763.62$ Pond Hill 46,936.85$
Stabilization 759,537.97$Smart Growth Stabilization 423,070.80$Health Care 288,471.40$Library 51,888.31$Library Restricted 15,821.68$Misc Scholarships 131,084.13$

City of Amesbury,MA BALANCE SHEET AS OF JUNE 30, 2013ASSETS TRUST FUNDS
LIABILITIES AND RESERVESAHS 50th 59,042.15$Misc. 33,096.17$Mt. Prospect Cemetery 5,776.82$Union Cemetery 9,127.77$Old Corner Cemetery 2,015.21$Medical Fund 35,894.36$
TOTAL 1,861,763.62$ 1,861,763.62$
AGENCY
AGENCY AGENCYCash (27,854.37)$ Off-Duty Police (20,746.83)$
Off-Duty Fire (7,107.54)$ (27,854.37)$
CAPITAL PROJECTSGEN. OBLIGATION GEN. OBLIGATION
Cash 493,116.65$ Woodsom Farm 1,184.14$Capital Fund 221,980.20$Park Improvements 125,000.00$Lake Gardner Dam 18,062.17$Recode Bylaw 1,035.00$Market St Culvert 15,907.47$Recreation Facilities 8,156.11$MVRTA Center -$Storm Repairs 99,925.83$Stormwater Discharge 1,865.73$ 493,116.65$

City of Amesbury,MA BALANCE SHEET AS OF JUNE 30, 2013CAPITAL PROJECTS
ASSETS LIABILITIES AND RESERVESCHAPTER 90 CHAPTER 90
Cash (644,748.23)$ Fund Balance (644,748.23)$
PUBLIC SAFETY BUILDING PUBLIC SAFETY BUILDINGCash 38,637.67$ Bond Anticipation Note 806,000.00$Amounts to be Provided 806,000.00$ 844,637.67$ Fund Balance 38,637.67$ 844,637.67$
DPW FACILITY DPW FACILITYCash (103,741.01)$ Bond Anticipation Note 1,970,000.00$Amounts to be Provided 1,970,000.00$ 1,866,258.99$ Fund Balance (103,741.01)$ 1,866,258.99$
MVRTA BUILDING MVRTA BUILDINGCash 106,047.10$ Bond Anticipation Note 1,500,000.00$Amounts to be Provided 1,500,000.00$ 1,606,047.10$ Fund Balance 106,047.10$ 1,606,047.10$
WATER ST PARKING WATER ST PARKINGCash 53,761.59$ Bond Anticipation Note 410,000.00$Amounts to be Provided 410,000.00$ 463,761.59$ Fund Balance 53,761.59$ 463,761.59$
WATER PROJECTS WATER PROJECTSCash 67,431.41$ Bond Anticipation Note $2,992,000.00Amounts to be Provided 2,992,000.00$ 3,059,431.41$ Fund Balance $67,431.41 $3,059,431.41

City of Amesbury,MA BALANCE SHEET AS OF JUNE 30, 2013DEBT SERVICE
NET BONDED DEBT PROJECT BONDS PAYABLEOutstanding Debt 11,504,270.00$ 2003 Landry Stadium 135,000.00$
2003 Library Planning 110,000.00$2003 Town Hall Rehab. 90,000.00$2005 Build Remodel Refunding -$2005 Middle School Refunding 4,804,432.00$
2005 Middle School Refunding 48,528.00$
2005 Hunt Brook Refunding 150,120.00$2005 Cashman Refunding 446,190.00$2008 Amesbury High School 5,720,000.00$
Total Debt Service 11,504,270.00$ 11,504,270.00$
GRAND TOTAL 63,121,333.56$ 63,121,333.56$

Page 2 of 9

CITY OF AMESBURY
COMBINED BALANCE SHEET JUNE 30,2013
(Unaudited)
Governmental Funds Types Totals
Special Capital Trust and General Long- (Memorandum
General Revenue Projects Enterprise Agency Term Debt Only)
ASSETS
Cash and short-term investments 4,303,387 3,760,558 10,505 1,028,278 3,722,343 12,825,071
Receivables:
Property taxes 3,831,150 3,831,150
Excises 486,349 486,349
User fees 676,093 471,540 1,147,633
Departmental 0
Amount to be provided for
retirement of long term debt 7,678,000 26,324,953 11,504,270 45,507,223
Total Assets $8,620,886 $4,436,651 $7,688,505 $27,824,771 $3,722,343 $11,504,270 $63,797,426
LIABILITIES AND FUND EQUITY
Liabilities:
Warrants payable 0
Deferred revenues 4,317,499 676,093 471,540 5,465,132
Accrued expenditures 1,079,805 1,079,805
Notes payable 7,678,000 7,678,000
Bonds payable 26,324,953 11,504,270 37,829,223
Other liabilities 438,705 14,032 452,737
Total Liabilities 5,836,009 676,093 7,678,000 26,810,525 0 11,504,270 52,504,897
Fund Balances
Retained earnings 991,055 991,055
Reserved for endowments 1,888,434 1,888,434
Reserved for expenditures 0
Reserved for encumbrances 202,230 23,191 225,421
Reserved for capital 0
Unreserved:
Undesignated 2,582,647 3,760,558 10,505 1,833,909 8,187,619
Total Fund Equity 2,784,877 3,760,558 10,505 1,014,246 3,722,343 0 11,292,529
Total Liabilities and Fund Equity $8,620,886 $4,436,651 $7,688,505 $27,824,771 $3,722,343 $11,504,270 $63,797,426


