Child Development, January/February 2001, Volume 72, Number 1, Pages 1–21
Continuity and Discontinuity of Behavioral Inhibition and Exuberance: Psychophysiological and Behavioral Influences across
the First Four Years of Life
Nathan A. Fox, Heather A. Henderson, Kenneth H. Rubin, Susan D. Calkins, and Louis A. Schmidt
Four-month-old infants were screened (
N
�
433) for temperamental patterns thought to predict behavioral in-hibition, including motor reactivity and the expression of negative affect. Those selected (
N
�
153) were as-sessed at multiple age points across the first 4 years of life for behavioral signs of inhibition as well as psycho-physiological markers of frontal electroencephalogram (EEG) asymmetry. Four-month temperament wasmodestly predictive of behavioral inhibition over the first 2 years of life and of behavioral reticence at age 4.Those infants who remained continuously inhibited displayed right frontal EEG asymmetry as early as 9months of age while those who changed from inhibited to noninhibited did not. Change in behavioral inhibi-tion was related to experience of nonparental care. A second group of infants, selected at 4 months of age forpatterns of behavior thought to predict temperamental exuberance, displayed a high degree of continuity overtime in these behaviors.
INTRODUCTION
There are multiple reports in the research literatureof the behavioral and physiological correlates of thetemperamental pattern known as behavioral inhibi-tion. Inhibited toddlers and preschool children arecharacterized as displaying vigilant behaviors andmotor quieting when confronted with novelty. Theyare unlikely to approach unfamiliar adults (Calkins,Fox, & Marshall, 1996), show little spontaneous posi-tive social initiation when placed with unfamiliarpeers (Rubin, Hastings, Stewart, Henderson, & Chen,1997), and are thought of by parents and peers asanxious and fearful (Garcia-Coll, Kagan, & Reznick,1984; Rubin, Nelson, Hastings, & Asendorpf, 1999). Inaddition, there appears to be a unique pattern ofphysiology associated with this group. Reports indi-cate that they display high and stable heart rate, ele-vated home baseline cortisol, amplified EMG ampli-tude to a startle stimulus, and right frontal EEGactivation (Calkins et al., 1996; Fox, Schmidt, Calkins,Rubin, & Coplan, 1995; Kagan, Reznick, & Snidman,1987; Schmidt, Fox, & Schulkin, 1999).
In addition, there have been a number of studiesthat have described the antecedents and develop-mental trajectories of behaviorally inhibited children.For example, Kagan, Reznick, Clarke, Snidman, andGarcia-Coll (1984) reported on 43 4-year-old children,22 of whom were identified as inhibited at 21 monthsof age. At age 4, the 22 inhibited children were moresocially inhibited with unfamiliar peers and more vig-ilant and hesitant during cognitive testing comparedto the 21 children identified as uninhibited. At 5
½
years of age, the same 22 children were more inhibited
with peers in both laboratory and school settings(Reznick et al., 1986). Kagan et al. (1987) subsequentlyreported on the original and a second cohort of chil-dren who were selected in either the second or thirdyear of life as being behaviorally inhibited or uninhib-ited. At 6 years of age, the inhibited children contin-ued to be more cautious and vigilant during their in-teractions with peers and with an experimenter andthey exhibited signs of physiological stress. Yet it wasthe case that 40% of the inhibited children from theseoriginal groups became less inhibited by 5
½
years ofage, while fewer than 10% of the children originallyidentified as uninhibited became more inhibited withage. They further noted that boys were more likelythan girls to become less inhibited over time. In sum-mary, among the two original cohorts from Kagan’sstudies (Kagan et al., 1987) there appears to be somecontinuity as well as a good deal of discontinuity inthe extreme forms of temperamental inhibition acrossthe preschool and elementary school years.
In an attempt to examine infant predictors of be-havioral inhibition, Kagan and colleagues selectedinfants at 4 months of age who displayed either highor low levels of motor arousal and negative affect inresponse to a series of novel visual and auditory stim-uli (Kagan & Snidman, 1991). One-third of the highreactive infants were inhibited at either 14 or 21months of age. In contrast, very few infants whowere selected based on their low levels of reactivitywere inhibited at later ages. High reactive infants also
showed greater sympathetic reactivity than did lowreactive infants (Snidman, Kagan, Riordan, & Shannon,1995). In a follow-up of these selected infants, 46% ofthe children who had been high reactive at 4 monthsof age were classified as inhibited at 4
½
years of age(Kagan, Snidman, & Arcus, 1998). In contrast, only10% of children who had been low reactive as infantswere classified as inhibited. Thirteen percent of thehigh reactive infants seen at 4
½
years of age had beenconsistently inhibited at each of the assessment pointsover the 4-year period. Sixty-seven percent of the lowreactive children, but only 27% of the high reactivechildren, were classified as uninhibited with peers.Kagan et al. (1998) argued that this pattern of datasupports the notion that negative reactivity is a tem-peramental trait and an antecedent in the develop-ment of behavioral inhibition.
One of the issues in the study of the continuity ofinhibition is the characterization of its form across de-velopment. In his Handbook chapter, Caspi (1998) de-scribes five different types of continuity of personal-ity to be considered in the study of developmentalchange. Four of these (differential, absolute, struc-tural, ipsative) refer to homotypic continuity, which iscontinuity of similar behaviors or phenotypic at-tributes over time. The fifth, heterotypic continuity,refers to continuity of an inferred genotypic attributepresumed to underlie diverse phenotypic behaviors.It is this latter type of continuity that characterizes de-velopmental change in behavioral inhibition. Theterm behavioral inhibition is used to describe temper-amental differences in infants’ and young children’sinitial reactions to a range of novel stimuli includingpeople, objects, contexts, and challenging situations(Kagan et al., 1987). Inhibition is assessed in youngchildren by recording their latencies to approach var-ious novel stimuli. It has been measured in older chil-dren by examining their latency to spontaneously in-teract with an experimenter during cognitive testing,and with unfamiliar peers in laboratory play sessions.Measures of reluctance to interact with unfamiliaradults and/or peers reflect a specific aspect of behav-ioral inhibition, that is, reactivity to unfamiliar people.The change in emphasis from assessment of reactivityto novel stimuli to assessment of the child’s social re-sponse to unfamiliar peers reflects the type of stimu-lus situation expected to elicit behavioral inhibition inolder children. Older children are unlikely to displayinhibition to novel objects but are likely to exhibit in-hibition to novel social situations. This may reflect thechild’s increasing perceived control over the nonso-cial environment. Unfamiliar objects may elicit inhi-bition in infants and young children because of theirnovelty and the child’s lack of control over their ac-
tions (e.g., Gunnar, 1978, 1980). As children enter pre-school they have more experience with a range ofnovel and unfamiliar toys and their perceived controlover these objects may increase as well. In contrast,peers and adults may continue to elicit inhibition dueto the level of their unpredictability in social situa-tions. The change in the nature of the eliciting stimu-lus conditions from inanimate
and
social situationsto social situations specifically warrants the intro-duction of different terminology for the behaviors inolder children.
Fox and Rubin have used the term social reticenceto reflect behavioral inhibition in social situations.They and their colleagues have conducted detailedobservations of children’s behaviors during free play,speech-making, and cooperative tasks with unfamil-iar peers in order to study social reticence (e.g., Foxet al., 1996; Rubin, Coplan, Fox, & Calkins, 1995).Using a variety of observational taxonomies, includ-ing the Play Observation Scale (Rubin, 1989), these re-searchers have derived a measure of socially wary,anxious, and reticent behaviors in the preschool playgroup. This measure, comprising observed reticenceand anxiety during free play and an inclination toavoid making a speech in the presence of unfamiliarpeers, has been found to be contemporaneously asso-ciated with maternal reports of both dispositionalshyness and internalizing behavior problems (e.g.,Coplan, Rubin, Fox, & Calkins, 1994). In contrast,other forms of nonsocial play have been described inwhich children are simply more focused on objectsthan on people, and this form of solitary play does notshow contemporaneous relations with measures ofdistress or anxiety. Thus, reticence is conceptually re-lated to behavioral inhibition based on the commonunderlying motivation to avoid novelty due to thenegative affect elicited by novel stimuli. Reticence re-flects a specific form of nonsocial behavior, one that isaccompanied by signs of anxiety and wariness (Asen-dorpf, 1990; Coplan et al., 1994). Despite variation inthe specific behaviors across different ages, reticenceand behavioral inhibition provide age-appropriatemeasures of a common psychological state.
A number of studies using parent report measuresof temperament to identify inhibited children havealso found moderate continuity in this trait. Sanson,Pedlow, Cann, Prior, and Oberklaid (1996) reportedfindings from the Australian Temperament Project inwhich they assessed 501 children longitudinally, be-ginning at 4 to 8 months of age and continuingthrough 5 to 6 years of age. The authors found few re-lations among the measures of inhibition from the in-fancy period to later ages. However, the magnitude ofthe correlations increased significantly when continu-
Fox et al. 3
ity was examined between the second year of life and5 to 6 years of age. Rubin et al. (1999) reported mod-erate continuity in both mothers’ and fathers’ ratingsof shyness among Canadian children from 2 to 4 yearsof age. Broberg (1993) also reported modest continu-ity in maternal reports of behavioral inhibition in asample of Swedish first-born children assessed at 16,28, and 40 months of age. Scarpa, Raine, Venables,and Mednick (1995) reported modest continuity inbehavioral inhibition based on a longitudinal studyof 1,800 Mauritian children assessed at 3, 8, and 11years of age. The children were classified as high,middle, or low in inhibition at each of the three agesbased on a combination of parental reports and be-havioral observations. Children who were highly in-hibited at 3 years of age displayed greater inhibitionat 8 years of age, and those who were highly inhibitedat 8 years of age were more inhibited than were otherchildren at 11 years of age.
In each of the aforementioned studies of inhibition,the emphasis has been on continuity. Yet given themodest correlations reported, there are clearly manychildren who do not remain inhibited across the earlyyears of life. We know little about these children orthe factors that may contribute to the changes in theirbehavior over time.
One factor that may contribute to the continuity ofinhibition over time is the physiological dispositionof infants to express negative affect and withdrawalin response to novelty. A variety of data suggests thatthe pattern of the resting electroencephalogram(EEG) may reflect an individual bias to respond withpositive or negative affect to stressful situations.Davidson and colleagues (Tomarken, Davidson, &Henriques, 1990) reported that increased resting rightfrontal EEG activation was associated with adults’self-reports of higher levels of global negative affect(fear, disgust, sadness, and anger) while watchingfilm clips selected to elicit negative emotions (disgust,sadness, and anger). The relation between restingfrontal asymmetry and self-reported negative affectwas particularly strong for the subjects’ ratings offear. In contrast, resting frontal asymmetry was notrelated to the adults’ ratings of global positive affect(happiness, amusement, and interest) when viewingfilm clips selected to elicit positive emotion. Davidsonand Fox (1989) found that 10-month-old infants whocried during a 1-minute period of maternal separa-tion showed significant right frontal asymmetry dur-ing a baseline recording that took place before themother left the room. In contrast, infants who did notcry during the separation period displayed signifi-cant left frontal asymmetry during the baseline re-cordings. In a separate study, Fox, Bell, and Jones
(1992) replicated this finding and found the frontalEEG pattern to be stable across the second half of thefirst year of life. Henriques and Davidson (1990, 1991)reported that adults with clinical depression, as wellas adults who were depressed and currently in remis-sion, displayed this pattern of right frontal EEGasymmetry. Together, these findings suggest that pat-terns of right frontal EEG asymmetry may serve as amarker of an underlying disposition rather than sim-ply reflecting current affective state. For example,Davidson (1992) has argued that this EEG pattern re-flects a diathesis around which stressful events maytrigger the expression of negative affect or depressivesymptomatology.
In addition to being related to specific affectivestates, Fox and his colleagues have found relationsbetween EEG asymmetry and shyness in adults andreticence in children. Specifically, adults who ratedthemselves as high in shyness displayed right frontalEEG asymmetry (Schmidt & Fox, 1994). Preschooland elementary school age children who displayedsocial reticence in a peer situation were more likely todisplay right frontal EEG asymmetry as well (Fox etal., 1995; Fox et al., 1996). And Calkins et al. (1996) re-ported that infants displaying high motor arousal andnegative affect at four months of age were more likelyto display right frontal EEG activity at nine monthsof age and behavioral inhibition at 14 months of age.A recent study by Schmidt et al. (1999) illustratesthese relations. Seven-year-old children, observed tobe shy in a peer situation, exhibited right frontal EEGasymmetry during baseline conditions compared totheir nonshy counterparts. When placed in an emo-tionally evocative situation, the shy children dis-played signs of anxiety that were accompanied byincreases in the magnitude of their right frontalasymmetry scores.
The following study reports on two cohorts of in-fants, some of whom were selected at four months ofage for characteristics thought to predict behavioralinhibition. These infants were high in negative reac-tivity. A second group of infants who were high inpositive reactivity, as well as a low reactive group,were also recruited. All infants were seen at 9, 14, 24,and 48 months of age in the laboratory. Measures ofbrain electrical activity were recorded at each of theseages and behavioral observations were made at 14,24, and 48 months. At 14 and 24 months, childrenwere seen in a standard behavioral inhibition para-digm. At 48 months of age, children were observed insame-gender, unfamiliar peer quartets, and measuresof reticence and social play were coded. In this paper,we examined the degree to which infant reactivitypatterns predicted later behavioral inhibition and ret-
4 Child Development
icence. We also compared the degree of continuity ininhibition based on patterns of infant reactivity. Inaddition, we examined relations among observed be-havior and EEG to determine if frontal EEG asymme-try was related to patterns of continuity in behavioralinhibition. The group of infants displaying high mo-tor reactivity and high positive affect in response tonovel stimuli were unlike Kagan’s low reactive groupin that these infants displayed high motor reactivitybut positive affect in their responses. We predictedthat this group would present with its own uniquedevelopmental trajectory and pattern of physiologi-cal response including lack of fear or inhibition, highsociability, and left frontal EEG asymmetry. It is im-portant to distinguish this group from noninhibitedchildren who may simply show less fear or inhibitionin response to challenge. Indeed, we expected thatexuberant, uninhibited children would be differentfrom noninhibited controls.
The data in the current paper reflect two cohorts ofchildren. Children in each cohort were selected at 4months of age and each cohort was seen at the identi-cal age points through age 4. Data on the patterns ofEEG activity at 9 months and behavioral inhibition at14 months of age for the first cohort have previouslybeen reported in Calkins et al. (1996). Data on thecombined two cohorts and a follow-up to 4 years ofage have not been reported elsewhere. Combiningthese two cohorts allowed the subgroup analyses foundin the current paper.
METHOD
Participants
To select infants thought likely to display behav-ioral inhibition later in infancy and early childhood, atotal of 433 4-month-old infants were screened for mo-tor reactivity and emotional reactivity in response tonovel sights and sounds. The infants recruited camefrom two separate cohorts with identical screeningprocedures. Details of the screening procedure havebeen described previously (Calkins et al., 1996; Kagan& Snidman, 1991).
Families with young infants were initially con-tacted by mail using commercially available lists ofnames and addresses compiled from the birth recordsof area hospitals. Interested parents were asked tocomplete a brief background survey. Families wereexcluded from further participation if any of the fol-lowing were true: (1) the infant was preterm (less than36 weeks gestation), (2) the infant had experiencedany serious illnesses or problems in developmentsince birth, (3) the infant was on any long-term medi-
cation, or (4) either of the parents were left-handed.Families who did not meet any of these exclusion cri-teria were contacted by phone and given more infor-mation regarding the study. Home visits were sched-uled for interested families (
N
�
433).Home visits took place when the infant was 4
months of age (
�
14 days). While in an infant seat andin a quiet and alert state, the infant was presentedwith two sets of novel visual (brightly colored mo-biles) and auditory (taped sentences and nonsensesyllables) stimuli. Each set of stimuli consisted of a se-ries of visual presentations followed by a series of au-ditory presentations. The first series of visual stimuliconsisted of three mobiles differing in the number ofhanging characters (1, 3, or 6 characters). Each mobilewas presented for 20 s, and the presentations wereseparated by a 10-s intertrial interval. The series of threemobiles was repeated three times for a total of ninetrials. Each mobile was displayed at the infant’s eyelevel and approximately 12 inches from the face. Thefirst series of auditory stimuli consisted of 8 short sen-tences. Each sentence was approximately 6 s in dura-tion, followed by a 2-s intertrial interval. The sen-tences were presented in pairs. The pairs differed inthe number of voices speaking and, as a result, the vol-ume of the presentation. The first pair was spoken bya single voice, the second pair by two voices, the thirdpair by three voices, and the fourth pair by four voices.
The second set of novel stimuli was similar to thefirst except that the characters on the mobiles weredifferent, and the auditory stimuli were nonsense syl-lables (ma, ga, pa) rather than sentences. The series ofthree mobiles was presented in exactly the same fash-ion as in the first set, for a total of nine trials. Eachnonsense syllable was presented in three consecutive10-s trials, with 5-s intertrial intervals.
The stimuli were presented to the infants in anidentical order (mobiles 1, auditory 1, mobiles 2, au-ditory 2). Infants who began to cry during an episodewere allowed to cry for a continuous period of nomore than 20 s after which the mother was asked tointervene and calm her infant. Once sufficient calmwas restored, the session was continued. If an infantwas unable to continue with a session, scores wereprorated for the amount of time (number of episodes)that the infant missed. All sessions were videotaped,allowing for the later coding of infant reactivity.
Infants from both cohorts were selected based onthe amount of motor reactivity as well as positive andnegative affect expressed during the presentation ofthe novel sights and sounds. The methods of codingand quantifying reactivity varied slightly betweenthe two cohorts. In the first cohort, coding was basedon the procedures described previously by Calkins et
Fox et al. 5
al. (1996) and Kagan and Snidman (1991). Specifically,the frequencies of the following behaviors werecoded during stimulus presentation: (1) Motor Activ-ity (arm and leg movements greater than 45
�
fromresting position, burst of two or more arm and legmovements, back arches, hyperextension of arms andlegs); (2) Positive Affect (smiling and neutral or posi-tive vocalizations); and (3) Negative Affect (fussing,fretting, and crying). Interrater reliability was com-puted on approximately 20% of the sample. Pearsoncorrelations between pairs of raters ranged from .78to .86.
Infants who were extreme on the dimensions ofmotor activity and affect were selected for participa-tion in the study. The criteria for selection were estab-lished based on the reactions of the first 25% of thescreened sample. Three groups were selected: (1) thoseabove the mean on motor activity and negative affect(High Negative), (2) those above the mean on motoractivity and positive affect (High Positive), and (3)those below the mean on motor activity, positive, andnegative affect (Low Reactive). Of the 208 infantsscreened in the first cohort, 29 were identified as HighNegative, 22 as High Positive, and 30 as Low Reactive.Consistent with the selection criteria, a MANOVAcomparing the three temperament groups on thethree reactivity dimensions was significant,
p
�
.001.Specifically, the High Negative group had signifi-cantly higher negative affect scores than both theHigh Positive and Low Reactive groups,
F
(2, 78)
�
19.24,
p
�
.001; Tukey’s HSD, both
p
s
�
.001. The HighPositive group had significantly higher positive affectscores compared to both the High Negative and theLow Reactive groups,
F
(2, 78)
�
37.40,
p
�
.001;Tukey’s HSD, both
p
s
�
.001. The Low Reactive grouphad significantly lower motor activity scores thanboth the High Negative and the High Positive groups,
F
(2, 78)
�
11.38,
p
�
.001; Tukey’s HSD,
p
�
.001 and
p
�
.01, respectively.In the second cohort, coders used 7-point Likert-
type scales to rate the infant’s motor, positive, andnegative reactions to each of the visual and auditorypresentations. Thus, each infant had a total of threeratings on each session (visual 1, auditory 1, visual 2,auditory 2) for a total of 12 ratings. On the MotorScale, a score of 7 indicated intense gross motor activ-ity including back arching, body twisting, and hyper-extensions of the arms and legs. A score of 1 indicatedvery little or no motor activity. A score of 7 on the Pos-itive Affect Scale was used to describe infants who re-sponded with many positive vocalizations, and manyinstances of gurgling, cooing, and smiling (at eitherthe stimulus or the experimenter). Neutral vocaliza-tions were also considered in scoring positive affect;
however, neutral vocalizations on their own were notsufficient for a high score on the Positive Affect Scale.A score of 1 on the Positive Affect Scale was reservedfor infants who did not smile at all or make more thantwo neutral or low-intensity positive vocalizationsduring the presentation. On the Negative AffectScale, a score of 7 indicated a high degree of intensenegative affect and described infants who cried orfussed continuously during the majority of the stimu-lus presentations. A 1 on the scale indicated an ab-sence of negative affect across the different stimulusevents. Three coders rated the tapes. Estimates ofinter-rater reliability were computed for pairs of cod-ers, based on 20% of the sample. Pearson correlationsranged from .62 to .95, with a mean correlation of .68on the motor scale, .69 on the Positive Affect Scale,and .95 on the Negative Affect Scale.
Classifications into each of the three temperamentgroups (High Negative, High Positive, Low Reactive)were made based on the frequency of “high” scoresacross the four stimulus conditions. To be classified asHigh Negative, an infant had to receive a score of 4 ormore on Motor Activity for both the visual and audi-tory presentations in either the first or second set ofpresentations. In addition, the infant had to have ascore of 4 or more for Negative Affect during the sameset of stimuli presentations. To be classified as HighPositive, an infant had to have a score of 4 or more onMotor Activity for both the visual and auditory pre-sentations in either the first or second set, as well as ascore of 4 or more on Positive Affect during the samepresentations. The Low Reactive group was com-prised of infants who had scores of 3 or less on MotorReactivity, Positive Affect, and Negative Affect dur-ing both the first and second sets of presentations.Also, an infant had to have seven scores (out of a pos-sible 12) of 1 to be identified as low reactive.
Of the 225 infants screened in the second cohort, 27were classified as High Negative, 23 as High Positive,and 22 as Low Reactive. Consistent with the selectioncriteria, these three groups differed significantly oneach of the three reactivity dimensions. Specifically,the High Negative group was rated as significantlyhigher in negative affect compared to the other twogroups,
F
(2, 67)
�
63.29,
p
�
.001; Tukey’s HSD, both
p
s
�
.001. The High Positive group was scored as hav-ing significantly more positive affect than the othertwo groups,
F
(2, 68)
�
23.83,
p
�
.001; Tukey’s HSD,both
p
s
�
.001. The Low Reactive group was rated asdisplaying significantly less motor activity than theother two groups,
F
(2, 69)
�
23.83,
p
�
.001; Tukey’sHSD, both
p
s
�
.001.To examine the comparability of the two selection
systems, we double coded the cohort originally se-
6 Child Development
lected using the 7-point scale system utilized byCalkins et al. (1996) and Kagan and Snidman (1991).We then utilized the selection criteria outlined above(using the 7-point scales) to place infants from the ini-tial cohort into each of the three temperament groups.We computed observed percent agreement and Co-hen’s
�
between the two selection/classificationoutcomes. Observed percent agreement was 80.3%whereas Cohen’s
�
was .66. This suggests that therewas good agreement between the two classificationsystems (Fleiss, 1981).
As a further check, we examined whether the tem-perament groups within the two cohorts differed onany of the major outcome measures (behavioral inhibi-tion, social reticence, EEG asymmetry). They did not.
Procedure
Following the initial selection, families were in-vited to the laboratory when their infants were 9, 14,24, and 48 months of age. When the infants were9 months of age, brain electrical activity (EEG) wasrecorded and mothers completed a temperament sur-vey. At each of the subsequent ages, EEG was re-corded, mothers completed age-appropriate tempera-ment surveys, and children’s reactions to unfamiliarstimuli were observed in the laboratory.
Measures
EEG data collection.
Several procedures were usedduring EEG data collection to help maximize thechances that the infants would sit quietly and main-tain a steady, attentive state. At 9, 14, and 24 months,infants were seated in front of a table. At 9 months, in-fants sat on their mothers’ laps to help minimize fuss-ing and movement, and at 14 and 24 months infantssat alone in an infant seat with their mothers just off toone side. At each of these ages, a metal bingo wheelwas placed on the table directly in front of the infant.An experimenter placed different numbers ofbrightly colored balls (1, 3, or 7) in the wheel and spunthe wheel for a series of six trials each lasting 20 s.These trials were separated by 10-s intervals inwhich the experimenter tapped the balls on the out-side of the bingo wheel to keep the infant’s atten-tion between trials. EEG was recorded for the entire3-min period.
When the children were 4 years of age, the EEGcollection room was decorated to resemble a spaceshuttle (see Fox et al., 1996, for a complete descriptionof the testing room). The child sat in the space chair (achair covered in silver fabric) and the mother sat on
a sofa across the room. EEG was collected as the childwatched a computer-generated video. In addition,the child was asked to sit quietly and (1) look at a toyspaceship that was placed approximately 18 inchesfrom his/her face and then (2) sit with his/her eyesclosed. The eyes-opened and eyes-closed segmentseach lasted for one minute. The eyes-open/eyes-closed conditions are similar to those used to collectbaseline measures of EEG from adult subjects (David-son, 1988).
Prior to the recording of EEG from each subject, a50
�
V 10 Hz signal was input into each of the chan-nels and this amplified signal was recorded. This sig-nal of known frequency and amplitude was laterused for calibration purposes. At each age, the exper-imenter began preparing for EEG collection by mea-suring the circumference of the child’s head in orderto select a Lycra stretch cap of appropriate size. Thestretch caps have electrodes for EEG recording sewninto the fabric according to the 10–20 system of elec-trode placement (Jasper, 1958). Thus, the electrodecap allows for a noninvasive, efficient, yet accurate,method of electrode placement. In order to ensurethat the cap stayed in place during the recording, elas-tic straps on each side of the cap were snapped onto acotton vest worn by the infant. At 9, 14, and 24 months,the cap was further secured with an elastic headband.
A small amount of abrasive gel (Omni-prep) wasinserted into each of the six active sites on the cap (F3,F4, P3, P4, O1, and O2) as well as the reference site atthe vertex (CZ). Using the blunt end of a Q-tip, eachsite was gently abraded. Following abrasion, a smallamount of electrolyte gel was inserted in each site.The blunt end of a Q-tip was again used to ensure thatthe gel was making contact with the scalp in the areabelow each electrode site. Impedances were mea-sured at each site and were considered acceptable ifthey were at or below 5 K ohms.
One channel of EOG was recorded from the righteye using two Beckman mini-electrodes, one placedat the outer canthus and the second placed at the su-pra orbit position. The EEG and EOG were amplifiedby separate Grass AC bio-amplifiers (7p511) with thehigh pass setting at 1 Hz and the low pass at 100 Hz.The data were digitized online using a HEM A/Dboard and acquisition software. The digitized datawere stored for later analyses.
During EEG recording, a second experimenterpressed a button switch at the onset and offset of eachstimulus condition. The output of the button switchwent to one A/D channel, and was used to synchro-nize the stimulus times with the EEG.
EEG data reduction.
The EEG data were digitized ata rate of 512 Hz. The EEG data were then re-referenced
Fox et al. 7
via software so that the data could be analyzed withan average reference configuration. The digitized EEGdata were then displayed graphically for artifact scor-ing. Portions of the EEG record marked by eye move-ment or motor movement artifact were removed fromall channels of the EEG record prior to subsequentanalysis.
The re-referenced, artifact-scored EEG data weresubmitted to a discrete Fourier transform analysisthat utilized a Hanning window with 50% overlap.The result of this analysis was to produce power inpicowatt ohms (or microvolts squared) for each chan-nel, for each of the stimulus conditions. Spectralpower data in single Hz frequency bins from 1 to12 Hz were computed for each of the stimulus condi-tions at each of the collection sites. At 9 months of age,power in the 4–6 Hz frequency band was computedfor each site by summing the single hertz bins in thesethree frequencies for each of the stimulus conditions(1, 3, and 7 balls). At 14 and 24 months of age, powerwas computed in the 6–8 Hz band for each site bysumming the single hertz bins in these three frequen-cies for each of the stimulus conditions (1, 3, and 7balls). At 4 years of age, power in the 6–8 Hz bandwas computed separately for the eyes-closed andeyes-opened conditions. Again, power in the 6–8 Hzband was computed by summing the single hertzbins in the three frequencies. The use of different fre-quency bands at the different ages reflects observeddevelopmental changes in the EEG. Specifically, at 9months of age the majority of power was localized tothe 4–6 Hz frequency range, while at older ages therewas a clear shift in the locus of power to 6–8 Hz. Pre-vious research with human infants has documentedthis shift in spectral power across the first years of life(Fox & Bell, 1990; Schmidt & Fox, 1998; Stroganova,Orekhova, & Posikera, 1999). The data used in analy-ses were the log power data from both the frontal andparietal regions, as well as laterality scores that werecomputed for each region at each age. Power and ac-tivation are thought to be reciprocally related (David-son, 1988; Lindsley & Wicke, 1974). High power re-flects low activation at a particular electrode site whilelow power reflects high activation. Laterality scores(ln right–ln left) are used to reflect the relative powerin the right and left hemispheres. A positive scorereflects greater R-power (or increased L-activation),whereas a negative score reflects greater L-power (orincreased R-activation).
Observed behavioral inhibition.
At 14 and 24 months,the infant’s reactions to unfamiliar stimuli in the lab-oratory were coded to provide an index of behavioralinhibition (see Calkins et al., 1996; Kagan et al., 1987;Reznick, Gibbons, Johnson, & McDonough, 1989). At
14 months, the unfamiliar stimuli consisted of (1) anunfamiliar room/environment, (2) an adult stranger,and (3) a novel toy/object. At 24 months, the infantwas presented with identical stimuli, and in addition,the infant’s reactions to an adult stranger dressed in aclown costume were recorded, as well as his/her will-ingness to crawl through an inflatable tunnel whenencouraged to do so by the experimenter.
At the beginning of the visit, the infant and motherentered an unfamiliar playroom with some toys onthe floor. Mothers were instructed to work on ques-tionnaires and to let infants play on their own. Theywere told to respond as they normally would if theinfants attempted to get their attention. The free-playperiod lasted 5 min. Following the free-play session,the toys were removed from the room and an unfa-miliar female research assistant entered the roomwith a toy dump truck and some blocks. The strangersat quietly for 1 min, played with the truck for 1 min,and then (if the child had not yet approached) invitedthe child to join her in play for 1 min. After the thirdminute, the stranger took the truck out of the roomand returned with an electronic robot. The battery-operated robot was approximately 18 inches inheight, had flashing lights, made loud noises, emittedsmoke, and moved around the room. The research as-sistant left the robot running in the room for 2 min. At24 months, the observations continued when the ex-perimenter returned to the room with an inflatabletunnel that she encouraged the child to crawl through.After she left, another female experimenter enteredthe room dressed as a clown. The clown was silent for30 s, invited the child to approach for 1 min, and thenremoved enough of her costume for the child to real-ize that she was another experimenter whom he orshe had met before.
At 14 months, an index of inhibition was com-puted based on the infant’s reactions to these unfa-miliar stimuli. Standardized scores of the followingmeasures were summed to create a single summaryindex of inhibition: (1) latency to first touch a toy dur-ing free-play, (2) latency to vocalize during free-play,(3) time spent in proximity (within arms length) tomother during free-play, (4) latency to vocalize to thestranger, (5) latency to approach the stranger, (6) timespent in proximity to mother while the stranger pre-sented the truck, (7) latency to vocalize to the robot,(8) latency to approach the robot, (9) time spent inproximity to mother during the robot episode. Thesummed index was standardized and scores on theindex of inhibition ranged from
�
1.85 to 3.00. Inter-coder reliability was computed for 15% of the sampleusing percent agreement given that all measures werebased on recordings of time. Pearson correlations be-
8 Child Development
tween pairs of coders on the individual measuresranged from .85 to 1.00.
At 24 months, a single composite measure of inhi-bition was computed by summing standardizedscores on (1) time spent in proximity (within armslength) to mother during free-play, (2) time spent inproximity to mother during the truck episode, (3) timespent in proximity to mother during the robot epi-sode, (4) time spent in proximity to mother during thetunnel episode, (5) latency to approach the strangerand/or touch the truck, (6) latency to approach and/or touch the robot, and (7) latency to pass through thetunnel. Intercoder reliability was computed for 24%of the sample using percent agreement given that allmeasures were based on recording of time. Pearsoncorrelations between pairs of coders on the individualmeasures ranged from .77 to .97. The summed indexof inhibition was standardized and scores on the in-dex of inhibition ranged from
�
2.30 to 2.56.
Play with unfamiliar peers at 4 years.
Behavioral in-hibition was assessed at 4 years of age based on chil-dren’s reactions to, and interactions with, unfamiliarpeers. Four children and their mothers were sched-uled to arrive at the laboratory at the same time. Thefour children were selected so that they were of thesame age and sex. The children were also selectedbased on their observed behavioral inhibition at24 months of age, such that each group consisted ofone previously inhibited (half a standard deviation ormore above the mean), one previously noninhibited(half a standard deviation or more below the mean),and two average children (within one standard devi-ation around the mean). The children in each quartethad never met each other outside the laboratory.
Upon arriving at the laboratory, the children andmothers waited in a common area of the lab until allfour children had arrived and all parents had beenbriefed and informed consent was obtained. The fourchildren were then led into a playroom with severalage-appropriate toys spread around the room. Whilethe children were in the playroom, parents were ina waiting area where they were asked to complete a se-ries of questionnaires. Parents were able to observe theentire visit on a television monitor in the waiting area.
The visit was split into several episodes. A com-plete description of the visit may be found in Fox et al.(1995). For purposes of this study, data from the twofree-play sessions were used. In the first and secondfree-play sessions the children were left alone in theplayroom for 15 min. The entire play session was vid-eotaped for later observational coding.
Behavioral coding of play with unfamiliar peers.
Behav-iors in the first and second play sessions were codedwith Rubin’s (1989) Play Observation Scale (POS).
Ten-second intervals were coded for social participa-tion (unoccupied, on-looking, solitary play, parallelplay, peer conversation, and group play) and the cog-nitive quality of play (functional, dramatic, and con-structive play; exploration; games with rules). Thisresulted in approximately 90 coding intervals perchild in each of the two free-play sessions. For bothcohorts, three independent observers coded the POS.Intercoder reliability on a randomly selected group ofchildren totaling 30% of the two samples was calculatedbetween pairs of observers using Cohen’s kappa. Forthe full variable matrix, including social and cognitiveplay categories, kappas ranged from .81 to .94 for thefirst cohort, and .87 to .94 for the second cohort.
An index of social reticence was created by stan-dardizing the mean proportion of time spent engagedin unoccupied and onlooker behaviors across bothplay sessions (see also Coplan et al., 1994). The stan-dardized score of social reticence was used as the in-dex of inhibition at 4 years. Scores on this indexranged from
�
1.19 to 4.55.
Maternal questionnaire data.
At each assessmentpoint, mothers were asked to complete a variety ofquestionnaires including temperament reports anddemographic information. At 9 months of age, mater-nal reports of temperament were gathered using theInfant Behavior Questionnaire (IBQ; Rothbart, 1981).The IBQ is an 87-item parent rating form in whichparents are asked to rate the frequency of specific in-fant behaviors as they occurred in the previous week.Parents rate the frequency of behaviors using a 7-pointscale with an eighth option for “Does not apply.”Scaled scores are derived from the measure by takingthe mean ratings on all items in the particular scale,omitting the items marked as “Does not apply.” Ofparticular interest in this study were the scales “Fear”(distress and extended latency to approach intense ornovel stimuli), and “Smiling and Laughing.” TheFear scale has 16 items with an internal consistencyalpha of .84. The Smiling and Laughing scale has 15items with an internal consistency alpha of .73 (Roth-bart, 1981).
At 14 and 24 months, maternal reports of tempera-ment were gathered using the Toddler Behavior As-sessment Questionnaire (TBAQ; Goldsmith, 1987,1996). The TBAQ is a 111-item parent rating form inwhich parents are asked to rate the frequency of spe-cific behaviors as they occurred in the past month.The TBAQ is modeled after the IBQ and uses a similarresponse format in which parents rate the frequencyof specific behaviors using a 7-point Likert-type scale.As on the IBQ, there is an eighth option for “Does notapply.” Six scale scores are created from the measureby taking the mean of items for a particular scale,
Fox et al. 9
omitting all items answered with “Does not apply.”Of particular interest in this study were the scalesSocial Fearfulness (inhibition, distress, withdrawal,or signs of shyness in novel or uncertainty-provokingsituations) and Pleasure (smiling, laughter, and otherhedonically positive vocalizations or playful activityin a variety of nonthreatening or familiar situations)(Goldsmith, 1996). The Social Fearfulness scale con-sists of 19 items and has an internal consistency alphaof .87. The Pleasure scale consists of 19 items and hasan internal consistency alpha of .86.
During the 24-month visit, mothers completed anonparental care survey in which they were asked toreport if the child was currently or had in the pastbeen cared for on a regular basis by someone otherthan the child’s mother or father. In addition to de-scribing the type of care, mothers were asked to re-port how many children (both siblings and nonsib-lings) were cared for in the same setting. Based on thissurvey, children were classified as having been in ex-clusive home care or in nonparental care with at leastone nonsibling during the first 24 months of life.
During the 4-year visit, mothers completed theColorado Child Temperament Inventory (CCTI; Buss& Plomin, 1984; Rowe & Plomin, 1977). The CCTI is a30-item parental report that assesses six temperamentdimensions. The dimensions of interest were Shynessand Sociability. As a measure of adjustment/mal-adjustment, mothers completed the Child BehaviorChecklist (CBCL; Achenbach & Edelbrock, 1983). TheCBCL is a 113-item checklist in which parents use a3-point scale to rate how descriptive of their own childa series of behavior problems are. The CBCL yieldseight narrow-band factors that are further reduced totwo broadband factors, Internalizing and Externaliz-ing behavior problems. The prevalence of Internalizingand Externalizing behavior problems were of partic-ular interest in this study.
Attrition by temperament group.
Of the 153 infantsselected (Low Reactive,
n
�
52; High Negative,
n
�
56;High Positive,
n
�
45), 122 participated at 9 months ofage (Low Reactive,
n
�
47; High Negative,
n
�
43;High Positive,
n
�
33); 123 at 14 months of age (LowReactive,
n
�
43; High Negative,
n
�
44; High Posi-tive,
n
�
36), 125 at 24 months of age (Low Reactive,
n
�
44; High Negative,
n
�
44; High Positive,
n
�
37),and 118 at 48 months of age (Low Reactive,
n
�
39;High Negative,
n
�
44; High Positive,
n
�
35). A se-ries of chi-square analyses were computed to deter-mine whether participation across time was differen-tially related to the 4-month temperament groups.The only significant chi-square revealed that familieswith infants classified as Low Reactive at 4 monthswere more likely than families with infants classified
as either High Negative or High Positive to partici-pate in the laboratory visit at 9 months of age,
2
(2)
�
6.02,
p
�
.05. Beyond the 9-month visit, however, par-ticipation was not differentially related to tempera-ment group, (all
2
ns
).Similarly, analyses were conducted to examine
whether refusal or extreme fussiness during EEG col-lection, which prevents the collection of usable EEGdata, was differentially related to temperament group.Non-significant chi-square analyses at each age con-firmed that compliance during EEG collection wasnot differentially related to the original 4-month tem-perament classifications. In sum, despite varyingnumbers of participants across age and across por-tions of data collection, variable participation andcompliance were not directly related to the tempera-ment classifications.
RESULTS
Four-Month Temperament Group Differences across Age
The first question addressed was how children inthe 4-month temperament groups differed in their re-actions to novel situations and people as observed inthe laboratory at 14, 24, and 48 months of age. One-way ANOVAs were computed at each age with4-month temperament group as the between subjectsfactor and observed inhibition as the dependent vari-able. The inhibition measures used were the compos-ite measures of observed inhibition in the laboratoryat 14 and 24 months of age, and the social reticencecomposite from the quartet play session during the48-month visit.
At 14 months of age, the 4-month temperamentgroups differed significantly on observed inhibition,
F
(2, 120)
�
9.40,
p
� .001. Specifically, infants in theHigh Negative group displayed significantly more in-hibition in the laboratory, M � .50, SD � 1.23, n � 44,compared to infants in both the Low Reactive, M ��.12, SD � .67, n � 43, and High Positive, M � �.39,SD � .82, n � 36, temperament groups (Tukey’s HSD,p � .01 and p � .001, respectively). The 4-month tem-perament groups also differed significantly on ob-served inhibition at 24 months of age, F(2, 122) � 5.56,p � .01. Specifically, infants in the High Positivegroup displayed significantly less inhibition in thelaboratory, M � �.51, SD � .85, n � 37, compared toinfants in both the Low Reactive, M � .08, SD � .93,n � 44, and High Negative, M � .13, SD � 1.01, n �44, groups (Tukey’s HSD, p � .05 and p � .01, respec-tively). At 48 months of age, there was a nonsignifi-cant effect of 4-month temperament group on ob-
10 Child Development
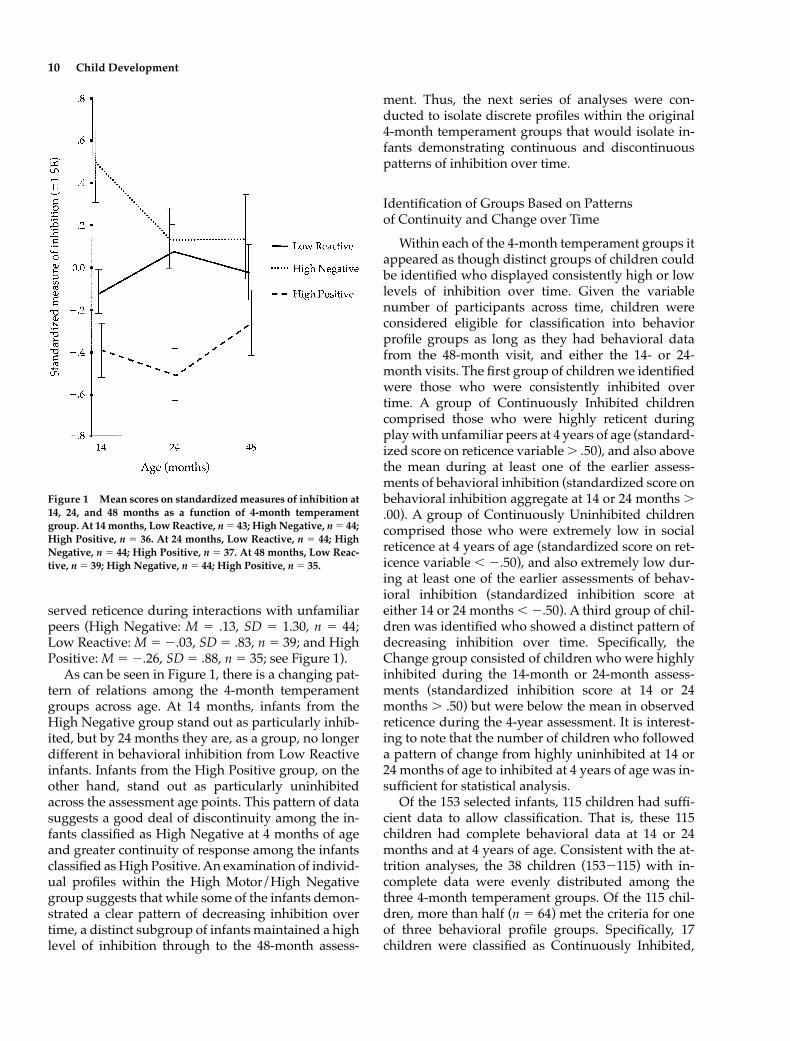
served reticence during interactions with unfamiliarpeers (High Negative: M � .13, SD � 1.30, n � 44;Low Reactive: M � �.03, SD � .83, n � 39; and HighPositive: M � �.26, SD � .88, n � 35; see Figure 1).
As can be seen in Figure 1, there is a changing pat-tern of relations among the 4-month temperamentgroups across age. At 14 months, infants from theHigh Negative group stand out as particularly inhib-ited, but by 24 months they are, as a group, no longerdifferent in behavioral inhibition from Low Reactiveinfants. Infants from the High Positive group, on theother hand, stand out as particularly uninhibitedacross the assessment age points. This pattern of datasuggests a good deal of discontinuity among the in-fants classified as High Negative at 4 months of ageand greater continuity of response among the infantsclassified as High Positive. An examination of individ-ual profiles within the High Motor/High Negativegroup suggests that while some of the infants demon-strated a clear pattern of decreasing inhibition overtime, a distinct subgroup of infants maintained a highlevel of inhibition through to the 48-month assess-
ment. Thus, the next series of analyses were con-ducted to isolate discrete profiles within the original4-month temperament groups that would isolate in-fants demonstrating continuous and discontinuouspatterns of inhibition over time.
Identification of Groups Based on Patterns of Continuity and Change over Time
Within each of the 4-month temperament groups itappeared as though distinct groups of children couldbe identified who displayed consistently high or lowlevels of inhibition over time. Given the variablenumber of participants across time, children wereconsidered eligible for classification into behaviorprofile groups as long as they had behavioral datafrom the 48-month visit, and either the 14- or 24-month visits. The first group of children we identifiedwere those who were consistently inhibited overtime. A group of Continuously Inhibited childrencomprised those who were highly reticent duringplay with unfamiliar peers at 4 years of age (standard-ized score on reticence variable .50), and also abovethe mean during at least one of the earlier assess-ments of behavioral inhibition (standardized score onbehavioral inhibition aggregate at 14 or 24 months .00). A group of Continuously Uninhibited childrencomprised those who were extremely low in socialreticence at 4 years of age (standardized score on ret-icence variable � �.50), and also extremely low dur-ing at least one of the earlier assessments of behav-ioral inhibition (standardized inhibition score ateither 14 or 24 months � �.50). A third group of chil-dren was identified who showed a distinct pattern ofdecreasing inhibition over time. Specifically, theChange group consisted of children who were highlyinhibited during the 14-month or 24-month assess-ments (standardized inhibition score at 14 or 24months .50) but were below the mean in observedreticence during the 4-year assessment. It is interest-ing to note that the number of children who followeda pattern of change from highly uninhibited at 14 or24 months of age to inhibited at 4 years of age was in-sufficient for statistical analysis.
Of the 153 selected infants, 115 children had suffi-cient data to allow classification. That is, these 115children had complete behavioral data at 14 or 24months and at 4 years of age. Consistent with the at-trition analyses, the 38 children (153�115) with in-complete data were evenly distributed among thethree 4-month temperament groups. Of the 115 chil-dren, more than half (n � 64) met the criteria for oneof three behavioral profile groups. Specifically, 17children were classified as Continuously Inhibited,
Figure 1 Mean scores on standardized measures of inhibition at14, 24, and 48 months as a function of 4-month temperamentgroup. At 14 months, Low Reactive, n � 43; High Negative, n � 44;High Positive, n � 36. At 24 months, Low Reactive, n � 44; HighNegative, n � 44; High Positive, n � 37. At 48 months, Low Reac-tive, n � 39; High Negative, n � 44; High Positive, n � 35.
Fox et al. 11
23 as Continuously Uninhibited, and 24 as Change,while 51 children were unclassifiable. A significantchi-square test revealed that the proportion of chil-dren in the behavioral profile groups, as well as thosewho were unclassifiable, was related to 4-month tem-perament, 2(6) � 30.79, p � .001 (see Table 1). Specif-ically, 66% (n � 29) of the children in the High Nega-tive temperament group met the criteria for one of thethree behavior profile groups. Approximately equalproportions of the High Negative children were clas-sified as Continuously Inhibited (n � 12) and Change(n � 13), whereas only four children from the HighNegative temperament group displayed continu-ously uninhibited behavior over time. Fifteen of theHigh Negative children were unclassifiable (i.e., therewas no clear pattern to their behavioral data overtime). Therefore, of all children in the High Negativetemperament group with sufficient data for classifica-tion, including those who could not be assigned toone of the three behavior profile groups, 27% (12 of44) were classified as Continuously Inhibited, 29% (13of 44) were classified as changing from Inhibited toNot Inhibited, 9% (4 of 44) were classified as Contin-uously Uninhibited, and 34% (15 of 44) could not beassigned into any of the three categories.
Fifty-nine percent (n � 19) of children in the HighPositive group with sufficient data for classificationmet the criteria for one of the three behavior profilegroups. Almost all of these children were classified asContinuously Uninhibited (n � 15). One child wasclassified as Continuously Inhibited and three wereclassified as changing from Inhibited to Not Inhib-ited. Thirteen children from the High Positive groupdid not show a consistent pattern of behavior overtime and were assigned to the Not Classified cate-gory. Of all children in the High Positive tempera-ment group with sufficient data for classification, 47%(15 of 32) were classified as Continuously Uninhib-ited, 3% (1 of 32) were classified as Continuously In-hibited, 9% (3 of 32) were classified as changing fromInhibited to Not Inhibited, and 41% (13 of 32) couldnot be classified into any of the three categories.
In contrast to these clear associations between theHigh Negative and High Positive 4-month tempera-ment groups and profiles of behavioral inhibition,only 41% (n � 16) of children in the Low Reactivegroup with sufficient behavioral data met the criteriafor classification into one of the three behavior profilegroups. Four were classified as Continuously Inhib-ited, four as Continuously Uninhibited and eight aschanging from Inhibited to Not Inhibited. The re-maining 23 did not show a consistent pattern of be-havior across age and were assigned to the Not Clas-sified group. Of the 39 children in the Low Reactivetemperament group, 10% (4 of 39) were classified asContinuously Inhibited, 10% (4 of 39) were classifiedas Continuously Uninhibited, 20% (8 of 39) were clas-sified as changing from Inhibited to Not Inhibited,and 59% (23 of 39) could not be classified into any ofthe three behavioral profile groups.
Comparisons between Children Who Were Continuously Inhibited and Those Who Changed from within the High Negative Group
A series of analyses was conducted to examinewhether it was possible to identify retrospectivelyfactors that might account for the divergent pathwaysfollowed by children who had been classified as HighNegative at 4 months of age (i.e., Continuously Inhib-ited versus Change). Specifically, children who wereHigh Negative and in the Continuously Inhibitedgroup were compared to children who were HighNegative and in the Change group on maternal re-ports of temperament and measures of brain electri-cal activity (frontal power and asymmetry). In addi-tion, the groups were compared in terms of their gen-der and experiences in nonparental care.
Observed Inhibition and Maternal Report of Temperament
Preliminary comparisons were conducted in orderto ensure that the Continuously Inhibited group was
Table 1 Behavior Profile Classification by 4-Month Temperament Group
not simply more reactive to novelty to begin with rel-ative to the Change group. In order to do so, the twogroups were compared on original ratings of reactiv-ity as assessed at 4 months of age. The two groups didnot differ significantly on ratings of motor, positive,or negative reactivity at 4 months of age (all ps 10).Similarly, the Continuously Inhibited and Changegroups did not differ on maternal reports on the IBQDistress to Novelty scale at 9 months of age, t(18) �.75, ns. Therefore, based on both behavioral observa-tions and maternal reports, the Continuously Inhib-ited and Change groups of infants appeared to beequally distressed by novelty during the first year oflife.
Although the two groups did not differ signifi-cantly on observed behavioral inhibition during the14- or 24-month visits to the laboratory, t(21) � �1.21,ns; t(21) � �1.05, ns, respectively, children in the Con-tinuously Inhibited group were rated as more SociallyFearful on the TBAQ at both ages compared to chil-dren in the Change group, t(21) � 4.07, p � .001 at 14months and t(20) � 2.56, p � .05 at 24 months. Simi-larly, at 4 years of age more children in the Continu-ously Inhibited group were rated as Shy, t(23) � 3.11,p � .01, and less Sociable, t(23) � �2.32, p � .05, bytheir mothers on the CCTI compared to children inthe Change group. In addition, children in the Contin-uously Inhibited group were rated by their mothers ashaving more behavior problems of an Internalizingnature than were children in the Change group, t(19) �2.71, p � .05. Table 2 presents the means and standarddeviations for the variables for each of the two groupsof children.
Together these results suggest that children inthese two groups began as equally reactive to novelevents and stimuli in the first year of life. Althoughthere were no differences in observed inhibition dur-ing either the 14- or 24-month assessments, maternalreports of temperament suggest that by 14 months ofage these children were beginning to follow differentdevelopmental pathways.
EEG Asymmetry and Power
In the next series of analyses, we wished to exam-ine whether the Continuously Inhibited and Changegroups differed in patterns of brain electrical activitybeginning from 9 months of age. At each age (9, 14, 24,and 48 months), an index of frontal asymmetry wascomputed by subtracting the natural log of F3 powerfrom the natural log of F4 power. As such, positivevalues on this metric reflect greater left frontal activa-tion, while negative values reflect greater right frontalactivation. Figure 2 graphically depicts the mean
asymmetry scores at 9, 14, 24, and 48 months for thetwo groups of children. The first two columns ofTable 3 present the means, standard deviations, andns for the Continuously Inhibited and the Changegroups at each age.
Nine months. At 9 months of age, children in theContinuously Inhibited group displayed a greater de-gree of right frontal asymmetry, M � �.25, SD � .21,n � 9, compared to children in the Change group, M ��.06, SD � .11, n � 8, t(15) � �2.81, p � .05. To exam-ine the hemispheric source of this difference in frontalpower, a repeated measures ANOVA was computedwith hemisphere as the within-subject factor (left/right) and behavior profile group as the between sub-jects factor (Continuously Inhibited/Change). Therewas a main effect of hemisphere, F(1, 15) � 14.51, p �.01; however, this was qualified by a significant inter-action between hemisphere and behavior profilegroup, F(1, 15) � 5.20, p � .05. To interpret the signif-icant interaction term, within group differences inhemispheric power were examined as well as betweengroup differences in power within each hemisphere.Infants in the Continuously Inhibited group had sig-nificantly more power (or less activation) in F3 (left)than they did in F4 (right), paired-t(8) � 3.61, p � .01,whereas F3 and F4 power did not differ for infants in
Table 2 Mean Measures of Observed Inhibition and MaternalReports of Temperament and Behavior Problems for the Contin-uously Inhibited and Change Groups
MeasureContinuously
Inhibited Change
9 monthsDistress to Novelty (IBQ)a 3.76 (.94) 3.39 (1.26)
Note: Standard deviations are given in parentheses.a n � 10 for Continuously Inhibited (CI), n � 10 for Change (Ch).b n � 10 for CI, n � 13 for Ch.c n � 12 for CI, n � 11 for Ch.d n � 11 for CI, n � 12 for Ch.e n � 10 for CI, n � 12 for Ch.f n � 12 for CI, n � 13 for Ch.g n � 12 for CI, n � 13 for Ch.h n � 11 for CI, n � 10 for Ch.
Fox et al. 13
the Change group, paired-t(7) � 1.64, ns. The Con-tinuously Inhibited and Change groups did not dif-fer in absolute power recorded from F3 or F4, t(15) �.897, ns, and t(15) � �.09, ns, respectively. A similaranalysis using log power data from the parietal re-gion revealed no asymmetry differences betweenthe Continuously Inhibited and Change groups,t(15) � .15, ns.
Fourteen months. Similarly, the Continuously In-hibited and Change groups differed significantly infrontal asymmetry scores at 14 months of age, t(16) ��2.31, p � .05. Specifically, the Continuously Inhib-ited group exhibited right frontal asymmetry, M ��.12, SD � .17, n � 6, whereas the Change groupshowed left frontal asymmetry, M � .18, SD � .29, n �12. To examine the hemispheric source of the differ-ence in asymmetry scores, a repeated measuresANOVA was computed with hemisphere as the re-peated factor (left/right) and behavior profile groupas the between subjects factor (Stable Inhibited/Change). There was a significant interaction betweenhemisphere and behavior profile group, F(1, 16) �5.35, p � .05. Follow-up comparisons revealed thatthe Change group had significantly more power (orless activation) in F4 compared to F3. There was not asignificant difference in absolute power between F3and F4 in the Continuously Inhibited group. The Con-tinuously Inhibited and Change groups did not differin absolute power recorded from F3 or F4, t(16) � .18,
ns, and t(16) � �.85, ns, respectively. The groups didnot differ in asymmetry scores based on log powerdata from the parietal region, t(16) � �.82, ns.
Twenty-four months. At 24 months of age, the Con-tinuously Inhibited group had a mean asymmetryscore of .07, SD � .33, n � 10, and the Change grouphad a mean asymmetry score of .22, SD � .23, n � 11.These means did not differ significantly, t(19) � �1.21,ns. There were also no mean differences in parietalasymmetry.
Four years. At 4 years of age, during the eyesclosed baseline condition, children in the Continu-ously Inhibited group displayed right frontal asym-metry, M � �.08, SD � .12, n � 10, compared to chil-dren in the Change group, who displayed greater leftfrontal asymmetry, M� .02, SD � .11, n � 12. The dif-ference in asymmetry scores approached significance,t(20) � �1.96, p � .06. A repeated measures ANOVAwas computed with hemisphere as the repeated fac-tor (left/right) and behavior profile group as the be-tween subject factor (Continuously Inhibited/Change). The interaction effect approached signifi-cance, F(1, 20) � 3.85, p � .06. Follow-up comparisonsrevealed that the Continuously Inhibited grouptended to have less power in F4 than they did in F3.The Change group did not differ in absolute powerbetween F3 and F4, and the Continuously Inhibitedand Change groups did not differ from each other interms of power in either F3 or F4. There were no sig-nificant differences between the groups when theywere compared on an index of asymmetry computedusing log power data from the parietal region, t(20) ��.68, ns.
Relations with Gender and Daycare Experience
To examine whether environmental variables suchas gender and nonparental care experiences were re-lated to the Continuously Inhibited versus Change
Table 3 Means, Standard Deviations, and ns for AsymmetryScores for Children in the Continuously Inhibited, Change,Comparison, and Continuously Uninhibited Groups
Age(months)
Continuously Inhibited Change Comparison
Continuously Uninhibited
9 �.25 (.21)n � 9
�.06 (.11)n � 8
.00 (.36)n � 21
.07 (.24)n � 13
14 �.12 (.17)n � 6
.18 (.29)n � 12
.13 (.28)n � 19
�.01 (.28)n � 14
24 .07 (.33)n � 10
.22 (.23)n � 11
.00 (.27)n � 18
.14 (.39)n � 14
48 �.08 (.12)n � 10
.02 (.11)n � 12
�.05 (.12)n � 21
.07 (.19)n � 14
Figure 2 Frontal EEG asymmetry scores (LnR – LnL) for Con-tinuously Inhibited and Change groups. At 9 months power wasrecorded in the 4–6 Hz frequency band. At 14, 24, and 48 monthspower was recorded in the 6–8 Hz frequency band. * p � .05;� p � .10.
14 Child Development
classifications, a series of chi-square analyses wereconducted. Although it appeared that gender of thechild was related to change in inhibition status, theFisher Exact Test was nonsignificant (p � .11). Eight ofthe 12 children in the Continuously Inhibited groupwere boys while nine of the 13 children in the Changegroup were girls.
Continuity and discontinuity of inhibition wassignificantly related to the child’s experiences innonparental care (i.e., nonparental care with at leastone nonsibling in the group) during the first two yearsof life (Fisher Exact Test, p � .05; see Table 4). Of the 12children in the Continuously Inhibited group, ninewere exclusively cared for by a parent in the homeduring the first 24 months of life. In contrast, of the13 children in the Change group nine were in non-parental care situations with at least one other child(nonsibling) during the first 24 months of life.
Comparisons between Children Classified as Continuously Inhibited and Continuously Uninhibited
To compare the temperamental and physiologicalprofiles of Continuously Inhibited and ContinuouslyUninhibited children over time, a third group was in-cluded as a comparison group. Children selected as acomparison group were those from the 4-month LowReactive group who did not meet the selection crite-ria for any of the three behavior profile groups. We se-lected this group because we believe they presentedno clear temperamental bias (they were neither HighNegative nor High Positive) and, in addition, dis-played no clear behavior pattern over age. They wereour “most average” children. A total of 23 childrencomprised this comparison group. Children fromthese three groups (Continuously Inhibited, Continu-ously Uninhibited, and Comparison) were comparedon maternal report of temperament and behaviorproblems, and on indices of frontal EEG across all ages(see Table 5 and Figure 3).
Observed inhibition and maternal reports of tempera-ment. At 9 months of age, the three groups differed on
maternal reports (IBQ) of Smiling/Laughing and Dis-tress to Novelty, F(2, 42) � 5.63, p � .01, and F(2, 42) �9.08, p � .01, respectively. Post hoc comparisons re-vealed that children in the Continuously Inhibitedgroup were rated as less positive in affect comparedto children in both the Continuously Uninhibitedand Comparison groups, Tukey’s HSD, both ps � .01,and more distressed to novelty compared to childrenin both the Continuously Uninhibited group andComparison groups, Tukey’s HSD, both ps � .001.
Similarly, at both 14 and 24 months of age, thegroups differed on maternal reports of positive affect(TBAQ Pleasure), F(2, 44) � 4.64, p � .05 and F(2, 43) �4.73, p � .05, respectively. Specifically, children in theContinuously Uninhibited group were rated as higherin Pleasure than were children in the ContinuouslyInhibited group at both ages, Tukey’s HSD, p � .05and p � .01, respectively. The groups also differed onmaternal reports of Social Fear at both 14 and 24months of age, F(2, 44) � 13.75, p � .001 and F(2, 43) �9.60, p � .001, respectively. At both ages, children inthe Continuously Inhibited group were rated as moresocially fearful than children in both the Comparisonand Continuously Uninhibited groups, all Tukey’sHSD, p � .001.
At 48 months of age children in the three groupswere rated differently by their mothers on the CCTIdimensions of Shyness, F(2, 46) � 12.82, p � .001, andSociability, F(2, 46) � 4.88, p � .01. Specifically, chil-dren in the Continuously Inhibited group were ratedas more shy than children in the Comparison group,who in turn were rated as more shy than children inthe Continuously Uninhibited group, all Tukey’sHSD, p � .05. Similarly, children in the ContinuouslyUninhibited group were rated as more Sociable thanwere children in the Continuously Inhibited group,Tukey’s HSD, p � .01.
The groups also differed on maternal reports of In-ternalizing behavior problems, F(2, 43) � 4.77, p �.05, such that children in the Continuously Inhibitedgroup were rated as having more Internalizing prob-lems compared to children in the Continuously Unin-hibited and Comparison groups, both Tukey’s HSD,p � .05. However, the groups did not differ on maternalreports of Externalizing problems, F(2, 43) � 1.49, ns.
EEG asymmetry and power. Figure 3 presents themean frontal asymmetry scores for the three groupsof children at each age. The first, third, and fourth col-umns of Table 3 present the means, standard devia-tions, and ns for the Continuously Inhibited, Compari-son, and Continuously Uninhibited groups at each age.
At 9 months of age, an ANOVA revealed a main ef-fect of group on the index of frontal asymmetry,F(2, 40) � 3.37, p � .05. Specifically, children in the
Table 4 Numbers of Children in Nonparental Care duringthe First 24 Months of Life for Continuously Inhibited andChange Groups
ContinuouslyInhibited Change
Exclusive parental care 9 4Nonparental care 3 9
Note: Fisher Exact Test, p � .05.
Fox et al. 15
Continuously Uninhibited group displayed a patternof left frontal asymmetry, M � .07, SD � .24, n � 13,whereas children in the Continuously Inhibitedgroup displayed a pattern of right frontal asymmetry,M � �.25, SD � .21, n � 9, Tukey’s HSD, p � .05. Themean asymmetry pattern for children in the Compar-ison group was close to zero or symmetry, M � .00,SD � .36, n � 21, and did not differ significantly fromeither of the other groups. To examine the hemi-spheric source of the difference in asymmetry scoresbetween the Continuously Inhibited and ContinuouslyUninhibited groups, a repeated measures ANOVA wascomputed with hemisphere as the repeated factor(left/right) and behavior profile group as the betweensubject factor (Continuously Inhibited, ContinuouslyUninhibited). There was neither a main effect of hemi-sphere nor a main effect of behavior profile group.There was, however, a significant behavior profilegroup � hemisphere interaction, F(1, 20) � 10.92, p �.01. To interpret the significant interaction term,within group differences in hemispheric power were
Figure 3 Frontal EEG asymmetry scores (LnR – LnL) forContinuously Inhibited, Comparison, and Continuously Un-inhibited groups. At 9 months power was recorded in the 4–6 Hzfrequency band. At 14, 24, and 48 months power was recorded inthe 6–8 Hz frequency band.
Table 5 Means and Standard Deviations on Measures of Observed Inhibition and Maternal Re-ports of Behavior Problems for the Continuously Inhibited, Comparison, and Continuously Unin-hibited Groups
a n � 10 for Continuously Inhibited (CI), n � 22 for Comparison (C), n � 13 for Continuously Uninhib-ited (CU).b n � 10 for CI, n � 19 for C, n � 15 for CU.c n � 12 for CI, n � 20 for C, n � 15 for CU.d n � 11 for CI, n � 22 for C, n � 15 for CU.e n � 10 for CI, n � 21 for C, n � 15 for CU.f n � 12 for CI, n � 23 for C, n � 15 for CU.g n � 12 for CI, n � 22 for C, n � 15 for CU.h n � 11 for CI, n � 20 for C, n � 15 for CU.
16 Child Development
examined as well as between group differences inpower within each hemisphere. The infants in theContinuously Inhibited group had significantly morepower (or less activation) in F3 (left) than they did inF4 (right), paired-t(8) � 3.61, p � .01, whereas F3 andF4 power did not differ significantly for infants in theContinuously Uninhibited group, paired-t(12) ��1.12, ns. The Continuously Inhibited and Continu-ously Uninhibited groups did not differ in power re-corded from F3 or F4, F(1, 20) � .55, ns and F(1, 20) �.43, ns, respectively. There were no significant groupdifferences in asymmetry scores using the log powerdata from the parietal region.
The three groups did not differ on indices of frontalasymmetry at 14 or 24 months of age. At 48 monthsof age, however, an ANOVA revealed a main effect ofgroup, F(2, 42) � 3.91, p � .05, for frontal asymmetryduring the eyes closed condition. Specifically, theContinuously Uninhibited group displayed greaterleft frontal asymmetry, M � .07, SD � .19, n � 14,compared to both the Continuously Inhibited, M ��.08, SD � .12, n � 10, and Comparison groups, M ��.05, SD � .12, n � 21, both Tukey’s HSD, p � .05. Toexamine the hemispheric source of the difference inasymmetry scores, a repeated measures ANOVA wascomputed with hemisphere as the repeated factor(left/right) and behavior profile group as the betweensubjects factor (Continuously Inhibited, Comparison,and Continuously Uninhibited). There was neither amain effect of hemisphere nor a main effect of behav-ior profile group. There was, however, a significantbehavior profile group � hemisphere interaction,F(2, 42) � 3.96, p � .05. To interpret the significant in-teraction term, within group differences in hemisphericpower were examined as well as between group differ-ences in power within each hemisphere. The childrenin the Continuously Inhibited and Comparison groupsboth showed a trend toward having more power (orless activation) in F3 (left) than they did in F4 (right),paired-t(9) � 2.01, p � .08 and paired-t(20) � 1.96, p �.06, respectively. F3 and F4 power did not differ forchildren in the Continuously Uninhibited group,paired-t(13) � �1.40, ns. The three groups did not dif-fer in absolute power recorded from F3, F(2, 42) � 1.18,ns, or F4, F(2, 42) � .37, ns, respectively. There were nosignificant group differences in asymmetry scoresusing the log power data from the parietal region.
DISCUSSION
One of the main goals of this study was to examinethe continuity of behavior over time in children se-lected during the first year of life for certain tempera-mental styles. Previous data and theory had sug-
gested that young infants who express a high degreeof motor reactivity and negative affect may be morelikely, compared to less reactive infants, to exhibit be-havioral inhibition as toddlers. In the present study, alarge group of 4-month-old infants was screened formotor reactivity and affect expression patterns. Ap-proximately 10% of these infants were identified asdisplaying high motor reactivity and high negativeaffect in response to novelty. When this select groupof infants was followed over the course of 4 years,slightly more than one quarter of them displayed apattern of continuously inhibited behavior. A similarnumber of infants in this group initially presentedwith behavioral inhibition but, over time, changed sothat by 4 years of age they were no longer inhibited.The remaining children showed no discernable pat-tern over time.
This pattern of continuity and discontinuity in tem-perament was significantly different from that foundin a group of infants selected at 4 months of age forlow reactivity. Within that group, approximately 60%of the children did not show any identifiable patternof continuity of inhibition (or lack of inhibition) overtime. Few were inhibited or reticent at 4 years of ageand fewer still were highly uninhibited at any assess-ment point across the 4-year period of the study. Thus,there appears to be a strong temperamental bias amonghigh reactive, negative infants towards the expressionof behavioral inhibition in the toddler years. The datafrom our study illustrate the notion of heterotypiccontinuity and coherence as described by Caspi (1998).Our hypothesis was that negative reactivity to nov-elty in infancy would be associated with behavioralinhibition in the toddler years and reticence in pre-school children. This applied to only a subgroup ofthe high negative children, however.
It is important to note that our ability to identifycontinuity in inhibition over age is compromised bythe unreliability of measurement at each point of ourstudy. The wide range of intercoder reliability for theselection systems at 4 months of age as well as forthe coding of behavioral inhibition at both 14 and 24months of age may each have contributed to the ap-parent variability in outcome among our tempera-ment groups.
To examine in greater detail the pattern of continu-ity and discontinuity among the High Negative group,we created two subcategories based on their behaviorover time. One group of children remained inhibitedover the first 2 years of life and was highly reticent at4 years of age. A second group was inhibited duringthe first 2 years of life but by 4 years of age did not ev-idence behaviors reflecting social reticence. Compari-son of these two groups revealed a number of impor-
Fox et al. 17
tant factors with respect to parent perceptions of thechild as well as to the underlying physiology differ-entiating these two developmental patterns. Duringthe first year of life, parents of High Negative infantsviewed their infants as highly reactive to novelty andhighly irritable. By the time infants were 14 months ofage, however, parents of infants who eventuallychanged from inhibited to noninhibited rated theirchildren as less socially fearful. Subsequently, at 24and 48 months, parents continued to rate the childrenwho changed as less fearful, less shy, and more socia-ble compared to those children who remained inhib-ited. Of interest is the fact that at 14 months of age (thefirst time parent ratings in these two subgroups dif-fered) the two subgroups of High Negative infantswere not different in their inhibition scores as derivedfrom a laboratory assessment. Parent report, how-ever, did differentiate the two groups. Parents ob-serve their children across multiple contexts and thusmay have noted important differences in their tod-dlers’ fearful or inhibited behavior that were notidentified in the lab setting. In addition, these percep-tions may have contributed to the direction of changein the children’s behavior over time.
Although our behavioral observations of the in-fants at 4 or 14 months of age did not discriminate be-tween those High Negative infants who changedfrom inhibited to noninhibited compared to thosewho remained inhibited, there were significant differ-ences in the pattern of brain electrical activity re-corded at both 9 and 14 months of age. Specifically, in-fants who were to remain inhibited over the 4-yearperiod of the study exhibited right frontal EEG asym-metry while infants who were to change exhibitedless right frontal EEG asymmetry at nine months of ageand left frontal EEG asymmetry at 14 months of age.
A similar difference in 9-month frontal EEG asym-metry between inhibited and noninhibited infantshad previously been reported in the literature (Calkinset al., 1996). That study compared the High Negativeand High Positive infants selected at 4 months of agewho were in one of the two cohorts reported in thepresent report. Data in that paper compared thesetwo groups on measures of EEG at 9 months of ageand measures of behavioral inhibition at 14 monthsof age. The current findings are based on the patternof children’s behavior over a 4-year period and withtwice the number of selected children. These findingscompare two groups of High Negative infants whodiffer in their pattern of inhibition outcome over the4-year study period (Continuously Inhibited versusChange). The group that remained stable and inhib-ited exhibited right frontal asymmetry. The group thatchanged exhibited left frontal asymmetry by 14 months
of age. This asymmetry pattern was evident at nineand 14 months of age. Although there were no differ-ences in frontal asymmetry at 24 months, there was atrend toward a similar difference in frontal asymmetrybetween groups when children were 4 years of age.
The right frontal EEG pattern observed in the con-tinuously inhibited group is similar to previous find-ings with infants (Davidson & Fox, 1989; Fox, Bell, &Jones, 1992), children (Fox et al., 1996), and adults(Davidson, 1992; Schmidt & Fox, 1994). Prior studieswith infants suggested that those infants exhibitingright frontal EEG asymmetry may be predisposed toexpress negative affect when confronted with a novel,mildly stressful situation.
The EEG measures brain electrical activity recordedfrom different scalp locations. The precise source gen-erators of the EEG are not certain. Thus, claims regard-ing relations between differences among individualsin regional brain electrical activity must be conserva-tive with regard to actual differences in neural loca-tion and activity. Nonetheless, recent research fromDavidson’s laboratory would seem to support the ad-equacy of the EEG in reflecting neural activity and therole of prefrontal cortex in emotion. In a recent paper,Davidson and coworkers (Larson et al., 1998) report asignificant correlation between glucose metabolism andEEG activity suggesting that differences in EEG powermay indeed reflect regional patterns of neural activation.
Of interest are recent studies (Davidson & Irwin,1999) utilizing functional MRI neuroimaging technol-ogy that have found a reciprocal relation betweenamygdala activity and prefrontal activation. Thesestudies suggest that prefrontal activation inhibits theamygdala in response to stimuli designed to elicit neg-ative affect. The amygdala is a structure in the limbicsystem implicated in conditioned fear responses(Davis, 1992). Greater amygdala activation has beenassociated with the potentiation of conditioned fear(Davis, Hitchcock, & Rosen, 1987). Thus, individualvariation in the degree to which prefrontal activity in-hibits amygdala may be critical for the inhibition orlack of inhibition of fear behaviors. Kagan and his col-leagues have suggested that the temperamental ori-gins of behavioral inhibition may be related to the ex-citability of certain areas of the amygdala, specificallythe central nucleus (Kagan & Snidman, 1991). This hy-pothesis is based in part on those animal studies inwhich this area has been identified as part of the “fearcircuit” (LeDoux, 1987). Specifically, animals that wereconditioned with a light and electric shock displayedheightened activation in these limbic areas and thefear responses could be dampened with ablation of se-lected brain regions within this circuit (Davis, 1992;Davis, Hitchcock, & Rosen, 1987). Based on these find-
18 Child Development
ings, Kagan argued that infants’ motor and affectivereactions to novelty might reflect activity in this fearcircuit. Specifically, infants exhibiting high degrees ofmotor arousal and negative affect in response to nov-elty may do so because of an over-activated fear cir-cuit. This over-activation would later be expressed inthe form of behavioral inhibition to the unfamiliarduring the toddler and preschool years. More recentwork of Davis and colleagues (Davis, 1998; Davis &Lee, 1998) has suggested, however, that areas immedi-ately outside the amygdala (specifically the bed nu-cleus) may be associated with nonconditioned fearand perhaps this neural center may have an importantrole in anxiety rather than fear. Irrespective of whetherthe neural circuits underlying inhibition are throughthe amygdala or bed nucleus, it is interesting to notethat outputs from either lead to changes in autonomic,neurendocrine, and behavioral/motor responses whichhave a parallel to the findings in behavioral inhibitionwork with human infants and children.
Of significance to this study was the finding thatfrontal EEG asymmetry differentiated those HighNegative infants who would remain inhibited andreticent over the 4-year period from those who wouldchange in behavior. The High Negative infants whowere stable in their inhibition displayed right frontalEEG asymmetry while the High Negative infantswho changed displayed, as a group, left frontal EEGasymmetry. This psychophysiological measure mayreflect an important marker for reticent behavior inyoung children suggesting that only a subgroup ofthe High Negative infants have a disposition towardreticence. Patterns of frontal EEG asymmetry at 9months of age may reflect the temperamental dispo-sition to regulate negative affect among these infants.Infants exhibiting left prefrontal EEG asymmetrymay be predisposed to modulate negative affect byutilizing approach behaviors whereas infants exhibit-ing right prefrontal EEG asymmetry may be lesslikely to modulate negative responses.
Examination of differences in frontal power be-tween groups might have assisted in the interpreta-tion of the different patterns of EEG asymmetry. Acti-vation measured from scalp leads over left prefrontalcortex has been associated with the expression of pos-itive affect and approach behaviors whereas activationof right prefrontal cortex has been associated with theexpression of negative affect and withdrawal behav-iors. Both Davidson (Henriques & Davidson, 1991)and Fox (Fox et al., 1995) have reported that differ-ences in frontal power are associated with these be-havioral or motivational responses. Despite signifi-cant group differences in frontal EEG asymmetry,we could find no consistent pattern of difference be-
tween groups in either left or right frontal EEGpower/activation.
Examination of factors associated with change ininhibition over time indicated that early childcare en-vironments might be important in understanding thepatterns of continuity and change in the expression ofbehavioral inhibition. Infants originally selected asHigh Negative at 4 months of age but who wereplaced in nonparental care situations during the first2 years of life were more likely to change their behav-ior than were similarly reactive infants who remainedin the exclusive care of their parents. There are a num-ber of possible explanations for this relation. First, itmay be that High Negative infants who were placedin nonparental care were temperamentally different(i.e., less reactive) compared to those who stayed athome. However, inspection of group means on 4-monthscores for motor reactivity as well as positive andnegative affect did not reveal any differences. Norwere there differences in maternal reports of negativereactivity when the infants were 9 months of age. Sec-ond, early infant temperament may influence a par-ent’s decision to place a child in nonparental care. It isinteresting to note that High Negative infants, as agroup, were less likely to be placed in nonparentalcare compared to infants from the two other 4-monthtemperament groups, 2(2) � 7.24, p � .05. Third, theexperience of nonparental care, and/or the family en-vironments experienced by children in nonparentalcare, may contribute to change in the phenotypic ex-pression of the temperament. Because detailed de-scriptions of the home and nonparental care environ-ments were not available, it is not possible to isolatethe precise characteristics of these environments thatcontributed to patterns of continuity or change in in-hibition. It could be that children in nonparental caresituations had more experience interacting withpeople outside the immediate family unit, not onlywhile in nonparental care but in the home as well. Orthe relation might be due more directly to the experi-ences children have while in nonparental care. For ex-ample, it is possible that infants in nonparental careare more likely to interact with other infants and chil-dren and are less likely to have their immediate needsmet in the same manner as are infants who stay athome. Increased exposure to different children andless immediate attention to individual reactions mayhave led to an increase in independence and decreasein fearfulness in the High Negative infants. Alterna-tively, personality characteristics of parents whochoose to keep their children in their exclusive care,as expressed through parenting behaviors, may con-tribute to the continuity of inhibition. For example,previous reports by Arcus, Gardner, and Anderson
Fox et al. 19
(1992) and Park, Belsky, Putnam, and Crnic (1997) in-dicated that inhibited infants who experienced lesssolicitous caregiving were more likely to exhibit de-creased inhibition over time.
The data from this study suggest, as well, thatthere may be a second important temperamental sub-group of children who can be identified by their be-havioral and psychophysiological patterning duringthe first year of life. At 4 months of age, we recruitedinfants who exhibited high motor reactivity and highpositive affect. This group is different from the groupselected by Kagan and Snidman (1991) as a compari-son for the High Negative infants at 4 months of age.Whereas Kagan and Snidman recruited a sample ofLow Reactive infants as a comparison group, the cur-rent study included both a Low Reactive and a HighPositive group of infants. Follow-up of these latterinfants revealed that close to one half maintained aprofile of exuberance across the 4-year period of thestudy. These children displayed high sociability, lackof fear, and high approach relative to the continuouslyinhibited children. From the youngest age, these in-fants appeared to exhibit exuberance for novelty andsocial interaction that was unique and different fromtheir inhibited counterparts. Parental report of infanttemperament confirmed these observations. At 9,14,and 24 months of age the exuberant infants weremore sociable and less distressed compared to thecontinuously inhibited infants. At age 4, parents ratedthese preschoolers as highly sociable and not shy orfearful. Although exuberant, these children did notappear to be hard to manage, nor did they exhibitmaladaptive behaviors. They were not rated as higherin behavior problems of either an internalizing or anexternalizing nature compared to the other children.Thus, while positive and social in their behavior, theywere not dysregulated in their behavioral patterns.
This group of exuberant children displayed theirown unique pattern of brain electrical activity. At 9months of age they exhibited left frontal asymmetry.This same pattern was again evident at 4 years of age.Left frontal EEG has been previously associated withthe tendency to express positive affect or emotions as-sociated with approach tendencies and has beenthought to underlie successful modulation of positiveaffect (Fox, 1994). Thus, the evidence suggests that asearly as 9 months of age there is a physiological pat-tern reflecting the disposition toward sociability andapproach among this subgroup of infants. The highdegree of continuity found within the High Positivegroup may be a result of the degree to which parentsin our sample value expressions of positive affect, so-ciability, and exuberance in their children. Certainly,these are traits that in Western culture are valued in
young children. Infants with a disposition to expresspositive affect might be reinforced for this tempera-mental style and encouraged in their sociability. Thehigh degree of continuity and little change over timewould seem to indicate that these behaviors are re-warded. The relative consistency of behavior withinthis group compared to the other 4-month tempera-ment groups suggests that early positive reactivityshould be studied on its own as an important early in-fant disposition.
ACKNOWLEDGMENTS
The authors thank Ariana Shahinfar, Genevieve Erb,Stacey Barton-Bowers, and Lisa Perry for their assis-tance in data collection. They especially thank theparents of the children who participated and continueto participate in their studies. This research was par-tially supported by a grant from the John D. andCatherine T. MacArthur Foundation and by grantsfrom the National Institutes of Health (HD32666 andHD17899) to Nathan A. Fox and a Social Science andHumanities Research Council of Canada DoctoralFellowship to Heather A. Henderson.
ADDRESSES AND AFFILIATIONS
Corresponding author: Nathan A. Fox, Departmentof Human Development, 3304 Benjamin Building,University of Maryland, College Park, MD 20742;e-mail: [email protected]. Heather A. Hendersonand Kenneth H. Rubin are also at the Universityof Maryland; Susan D. Calkins is at the University ofNorth Carolina at Greensboro; and Louis A. Schmidt isat McMaster University, Hamilton, Ontario, Canada.
REFERENCES
Achenbach, T. M., & Edelbrock, C. S. (1983). Manual for theChild Behavior Checklist and Revised Child Behavior Profile.Burlington: University of Vermont.
Arcus, D., Gardner, S., & Anderson, C. (1992, April). Infantreactivity, maternal style, and the development of inhib-ited and uninhibited behavioral profiles. In Temperamentand environment. Symposium conducted at the biennialmeeting of the International Society for Infant Studies,Miami, Florida.
Asendorpf, J. B. (1990). Beyond social withdrawal: Shyness,unsociability, and peer avoidance. Human Development,33, 250–259.
Broberg, A. G. (1993). Inhibition and children’s experiencesof out-of-home care. In K. H. Rubin & J. Asendorf (Eds.),Social withdrawal, inhibition, and shyness in children. Chi-cago: University of Chicago Press.
20 Child Development
Buss, A. H., & Plomin, R. (1984). Temperament: Early develop-ing personality traits. Hillsdale, NJ: Erlbaum.
Calkins, S. D., Fox, N. A., & Marshall, T. R. (1996). Behav-ioral and physiological antecedents of inhibition in in-fancy. Child Development, 67, 523–540.
Caspi, A. (1998). Personality development across the lifecourse. In N. Eisenberg (Ed.), W. Damon (Series Ed.),Handbook of child psychology: Vol. 3. Social, emotional, andpersonality development (5th ed., pp. 311–388). New York:Wiley.
Coplan, R. J., Rubin, K. H., Fox, N. A., & Calkins, S. D.(1994). Being alone, playing alone, and acting alone: Dis-tinguishing among reticence and passive, and active soli-tude in young children. Child Development, 65, 129–138.
Davidson, R. J. (1988). EEG measures and cerebral asymme-try: Conceptual and methodological issues. InternationalJournal of Neuroscience, 39, 71–89.
Davidson, R. J. (1992). Emotion and affective style: Hemi-spheric substrates. Psychological Science, 3, 39–43.
Davidson, R. J., & Fox, N. A. (1989). The relation betweentonic EEG asymmetry and ten-month old emotional re-sponse to separation. Journal of Abnormal Psychology, 98,127–131.
Davidson, R. J., & Irwin, W. (1999). The functional neu-roanatomy of emotion and affective style. Trends in Cog-nitive Science, 3, 11–21.
Davis, M. (1992). The role of the amygdala in fear and anx-iety. Annual Review of Neuroscience, 15, 353–375.
Davis, M. (1998). Are different parts of the extendedamygdala involved in fear versus anxiety? Biological Psy-chiatry, 44, 1239–1247.
Davis, M., Hitchcock, J. M., & Rosen, J. B. (1987). Anxietyand the amygdala: Pharmacological and anatomicalanalysis of the fear-potentiated startle paradigm. In G.Bower (Ed.), The psychology of learning and motivation(Vol. 21, pp. 263–305). San Diego, CA: Academic Press.
Davis, M., & Lee, Y. (1998). Fear and anxiety: Possible rolesof the amygdala and bed nucleus of the stria terminalis.Cognition and Emotion, 12(3), 277–305.
Fleiss, J. L. (1981). Statistical methods for rates and proportions.New York: Wiley.
Fox, N. A. (1994). Dynamic cerebral processes underlyingemotion regulation. Monographs of the Society for Researchin Child Development 59(2–3, Serial No. 240).
Fox, N. A., & Bell, M. A. (1990). Electrophysiological indicesof frontal lobe development: Relations to cognitive andaffective behavior in human infants over the first year oflife. In A. Diamond (Ed.), The developmental and neuralbases of higher cognitive functions (pp. 677–698). NewYork: New York Academy of Sciences.
Fox, N. A., Bell, M. A., & Jones, N. A. (1992). Individual dif-ferences in response to stress and cerebral asymmetry.Developmental Neuropsychology, 8, 161–184.
Fox, N. A., Rubin, K. H., Calkins, S. D., Marshall, T. R., Co-plan, R. J., Porges, S. W., Long, J., & Stewart, S. (1995).Frontal activation asymmetry and social competence atfour years of age. Child Development, 66, 1770–1784.
Fox, N. A., Schmidt, L. A., Calkins, S. D., Rubin, K. H., & Co-plan, R. J. (1996). The role of frontal activation in the regu-
lation and dysregulation of social behavior during the pre-school years. Development and Psychopathology, 8, 89–102.
Garcia-Coll, C., Kagan, J., & Reznick, J. S. (1984). Behavioralinhibition in young children. Child Development, 55,1005–1019.
Goldsmith, H. H. (1987). The toddler assessment questionnaire.Unpublished manuscript. Department of Psychology,University of Oregon, Eugene, Oregon.
Goldsmith, H. H. (1996). Studying temperament via con-struction of the Toddler Behavior Assessment Question-naire. Child Development, 67, 218–235.
Gunnar, M. R. (1978). Changing a frightening toy into apleasant toy by allowing the infant to control its actions.Developmental Psychology, 14(2), 157–162.
Gunnar, M. R. (1980). Control, warning signals, and distressin infancy. Developmental Psychology, 16(4), 281–289.
Henriques, J. B., & Davidson, R. J. (1990). Regional brainelectrical asymmetries discriminate between previouslydepressed subjects and healthy controls. Journal of Ab-normal Psychology, 99, 22–31.
Henriques, J. B., & Davidson, R. J. (1991). Left frontal hypo-activation in depression. Journal of Abnormal Psychology,100, 535–545.
Jasper, H. H. (1958). The ten-twenty electrode system of theInternational Federation. Electroencephalography and Clini-cal Neurophysiology, 10, 371–375.
Kagan, J., Reznick, J. S., Clarke, C., Snidman, N., & Garcia-Coll, C. (1984). Behavioral inhibition to the unfamiliar.Child Development, 55, 2212–2225.
Kagan, J., Reznick, J. S., & Snidman, N. (1987). The physiol-ogy and psychology of behavioral inhibition in children.Child Development, 58, 1459–1473.
Kagan, J., & Snidman, N. (1991). Infant predictors of inhibitedand uninhibited profiles. Psychological Science, 2, 40–44.
Kagan, J., Snidman, N., & Arcus, D. (1998). Childhood de-rivatives of high and low reactivity in infancy. Child De-velopment, 69, 1483–1493.
Larson, C. L., Davidson, R. J., Abercrombie, H. C., Ward,R. T., Schaefer, S. M., Jackson, D. C., Holden, J. E., & Perl-man, S. B. (1998). Relations between PET-derived mea-sures of thalamic glucose metabolism and EEG alphapower. Psychophysiology, 35, 162–169.
LeDoux, J. E. (1987). Emotion. In F. Plum (Ed.), Handbook ofphysiology. Section 1: The nervous system: Vol. 5. Higherfunctions of the brain. Part 1. Bethesda, MD: AmericanPhysiological Society.
Lindsley, D. B., & Wicke, J. D. (1974). The electroenceph-alogram: Autonomous electrical activity in man andanimals. In R. Thompson & M. N. Patterson (Eds.),Bioelectric recording techniques (pp. 3–83). New York:Academic Press.
Park, S., Belsky, J., Putnam, S., & Crnic, K. (1997). Infantemotionality, parenting, and 3-year inhibition: Explor-ing stability and lawful discontinuity in a male sample.Developmental Psychology, 33, 218–227.
Reznick, J. S., Gibbons, J. L., Johnson, M. O., & McDonough,P. M. (1989). Behavioral inhibition in a normative sample.In J. S. Reznick (Ed.), Perspectives on behavioral inhibition(pp. 25–47). Chicago: University of Chicago Press.
Fox et al. 21
Reznick, J. S., Kagan, J., Snidman, N., Gersten, M., Baak, K.,& Rosenberg, A. (1986). Inhibited and uninhibited chil-dren: A follow-up study. Child Development, 57, 660–680.
Rothbart, M. K. (1981). Measurement of temperament in in-fancy. Child Development, 52, 569–578.
Rowe, D. C., & Plomin, R. (1977). Temperament in earlychildhood. Journal of Personality Assessment, 41, 150–156.
Rubin, K. H. (1989). The Play Observation Scale (POS). On-tario, Canada: University of Waterloo.
Rubin, K. H., Chen, X., & Hymel, S. (1993). Socio-emotionalcharacteristics of aggressive and withdrawn children.Merrill-Palmer Quarterly, 49, 518–534.
Rubin, K. H., Coplan, R. J., Fox, N. A., & Calkins, S. D.(1995). Emotionality, emotion regulation, and pre-schoolers’ adaptation. Development and Psychopathology,7, 49–62.
Rubin, K. H., Hastings, P. D., Stewart, S. L., Henderson,H. A., & Chen, X. (1997). The consistency and concomi-tants of inhibition: Some of the children, all of the time.Child Development, 68, 467–483.
Rubin, K. H., Nelson, L. J., Hastings, P., & Asendorpf, J.(1999). The transaction between parents’ perceptions oftheir children’s shyness and their parenting styles. Inter-national Journal of Behavioral Development, 23, 937–958.
Sanson, A., Pedlow, R., Cann, W., Prior, M., & Oberklaid, F.(1996). Shyness ratings: Stability and correlates in earlychildhood. International Journal of Behavioral Development,19, 705–724.
Scarpa, A., Raine, A., Venables, P. H., & Mednick, S. A.(1995). The stability of inhibited/uninhibited tempera-ment from ages 3 to 11 years in Mauritian children. Jour-nal of Abnormal Child Psychology, 23, 607–618.
Schmidt, L. A., & Fox, N. A. (1994). Patterns of corticalelectrophysiology and autonomic activity in adults’shyness and sociability. Biological Psychology, 38, 183–198.
Schmidt, L. A., & Fox, N. A. (1998). Electrophysiologicalstudies I: Quantitative electroencephalography. In C. E.Coffey & R. A. Brumback (Eds.), Textbook of pediatric neu-ropsychiatry: Section II. Neuropsychiatric assessment of thechild and adolescent (pp. 315–329). Washington, DC:American Psychiatric Press.
Schmidt, L. A., Fox, N. A., & Schulkin, J. (1999). Behavioraland psychophysiological correlates of self-presentationin temperamentally shy children. Developmental Psycho-biology, 35, 119–135.
Schwartz, C. E., Snidman, N., & Kagan, J. (1996). Earlychildhood temperament as a determinant of externaliz-ing behavior in adolescence. Development and Psychopa-thology, 8, 527–537.
Snidman, N., Kagan, J., Riordan, L., & Shannon, D. C.(1995). Cardiac function and behavioral reactivity dur-ing infancy. Psychophysiology, 32, 199–207.
Stevenson-Hinde, J., & Glover, A. (1996). Shy girls and boys:A new look. Journal of Child Psychology and Psychiatry, 37,181–187.
Stroganova, T. A., Orekhova, E. V., & Posikera, I. N. (1999).EEG alpha rhythm in infants. Clinical Neurophysiology,110, 1–16.
Tomarken, A. J., Davidson, R. J., & Henriques, J. B. (1990).Resting frontal brain asymmetry predicts affective re-sponses to films. Journal of Personality and Social Psychol-ogy, 59, 791–801.