32
Continuous Chain Ladder Richard Verrall Joint work with M.D. Martínez-Miranda, J.P. Nielsen and S. Sperlich
Continuous Chain Ladder Richard Verrall
Joint work with M.D. Martínez-Miranda, J.P. Nielsen and S. Sperlich

The Claims Reserving exercise
Claims are first notified and then (at a later date) settled - reporting delays and settlement delays exist.
The amount and timing of future claims is not known and this creates an uncertainty over the amount of reserves that needs to be held.
Companies have an outstanding liability for claims events that have already happened and for claims that have not yet been fully settled.

The life of an individual claim
Individual claims mechanism in the general claims process Main components in the process: Reporting delay Settlement delay (development process from reporting) Payments size
Type of claims: IBNR, RBNS and closed claims

The data
The available information matters: look at the data… Aggregated run-off triangles lead to classical collective
methods such as the popular Chain Ladder method.
Accident (underwriting) year: year in which the claim arose or was underwritten
Development year: difference between the payment (or other action) year and the accident year
Periods: years, quarters …
Data: payments, number of claims …

When you have “more data”: going granular
Micro-level data leading to individual claim loss models (among others Taylor et al. 2008, Zhao and Zhou 2010, Antonio and Platz 2012)
Large claims Small claims

It is time to modernise claims reserving methodology
Classical reserving methods rely on aggregate run-off triangles since only recently has micro-level information been available at companies.
Now the the challenge is to use micro-level information in an efficient way.
There is a growing awareness among non-life actuaries that modern statistical expert models should be used when analysing this type of data. However, there is no clear concensus on how to proceed.

Going granular in reserving… …but respecting the chain ladder approach Maybe the best approach to developing new methodology is to
first understand what already exists. We suggest reformulating the classical chain ladder method into a
modern statistical framework. Then, a natural way to improve it will come: Continuous Chain Ladder.
Some good reasons to proceed in such way: 1. Actuaries have extensive tacit knowledge. 2. When you build a system from many small
systems you get bias. Keep the chain ladder mean as a benchmark.
3. Simpler models are preferred for forecasting.
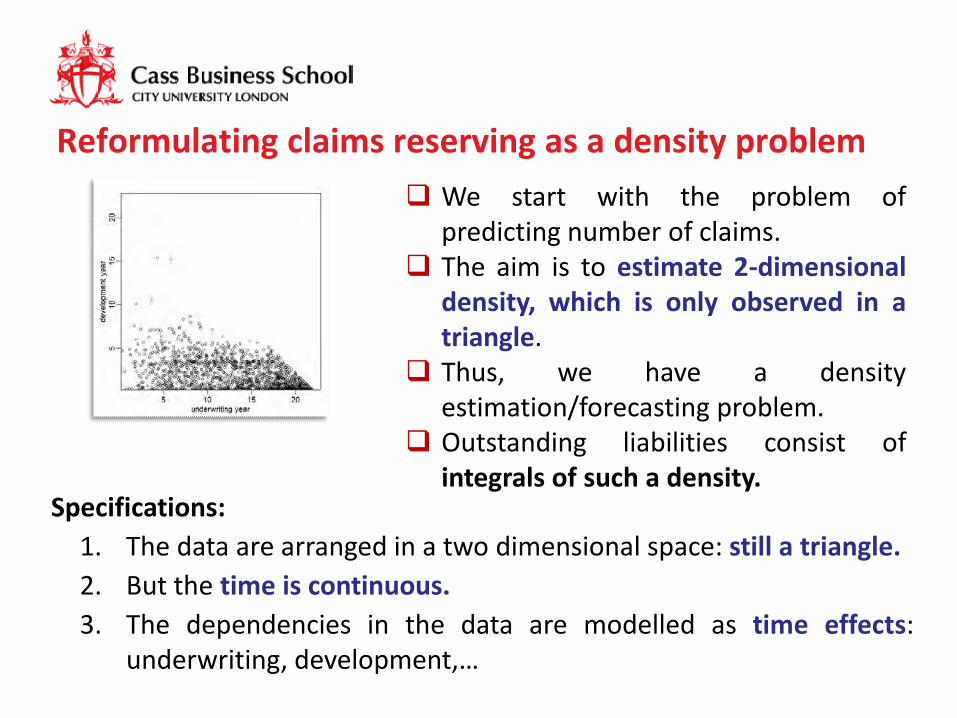
Reformulating claims reserving as a density problem We start with the problem of
predicting number of claims. The aim is to estimate 2-dimensional
density, which is only observed in a triangle.
Thus, we have a density estimation/forecasting problem.
Outstanding liabilities consist of integrals of such a density.
Specifications: 1. The data are arranged in a two dimensional space: still a triangle. 2. But the time is continuous. 3. The dependencies in the data are modelled as time effects:
underwriting, development,…

Solving the problem in two steps
1. Density estimation with a triangular support
2. Forecasting problem: the density in the whole square
Look for the best density estimator
available
Start with a simpler model: multiplicative
structure

Reformulating classical chain ladder in this framework
Chain ladder starts from a histogram of the granular data. Then this histogram is projected on a multiplicative structure for forecasting the future
Step 1
Step 2

What we can learn… 1. Chain ladder is indeed granular!
A histogram is a common graphical tool to explore, and show, the underlying distribution of a set of continuous data.
It is, maybe, the simplest density estimator.

What we can learn… 2. The multiplicative structure
Future counts are predicted assuming:
Let’s see it in more detail…

The classical Poisson model for chain ladder
We consider an incremental triangle
Assume that Nij ‘s are independently Poisson distributed with means having a multiplicative parameterization:
Then calculate the maximum likelihood estimates of the parameters: Predict the future entries as:
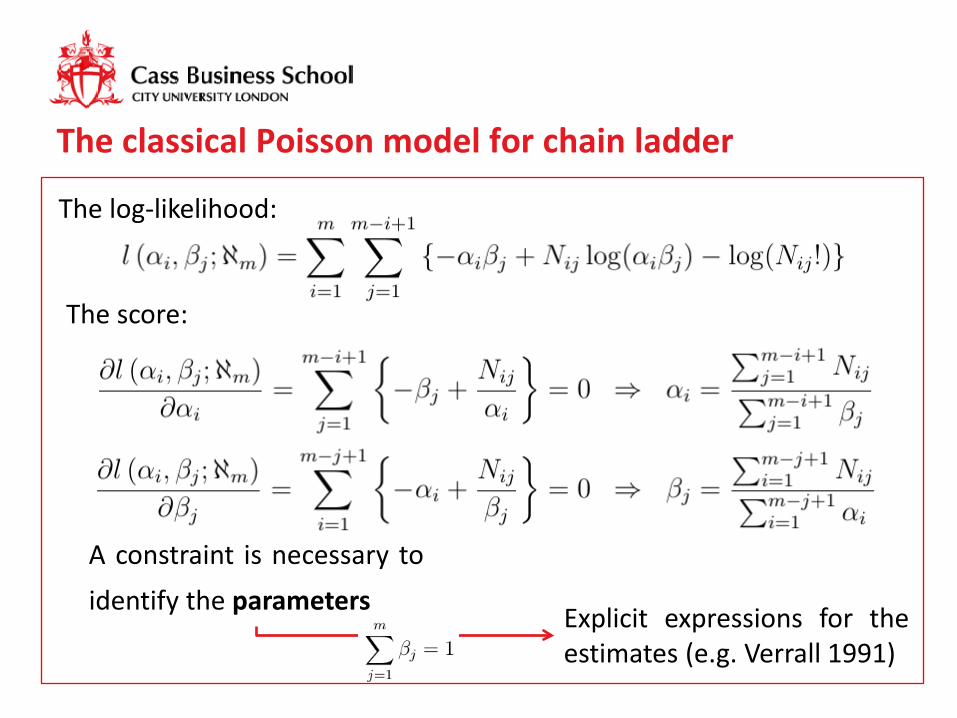
The classical Poisson model for chain ladder
The log-likelihood:
A constraint is necessary to identify the parameters
The score:
Explicit expressions for the estimates (e.g. Verrall 1991)

Reformulating the classical approach Consider a histogram estimator of the density in the triangle:
It is known that:
which justifies a GLM model with Poisson error distribution for the future counts.
Thus, the density problem is treated as a regression problem on an aggregated base (Fan and Gijbels 1995}:

Reformulating the classical approach Assume a multiplicative and parametric structure for the regression function:
This implies that the target density
From these assumptions, the equations to derive the estimates can be rewritten as:
Summary: Classical chain ladder is indeed a granular method, because the
histogram works on continuous data. Assumptions for forecasting the target density in the future:
1. A multiplicative structure for the 2-dimensional density.
2. The densities in the underwriting and development directions are piece-wise constant.
Advantages of this approach: simplicity, the problem can be treated as a parametric problem with maximum likelihood solutions.
Drawbacks: The histogram is an inefficient estimator of the density. It leads to discrete time effects.

Continuous Chain Ladder: the natural improvement
1. Replace the histogram by a kernel estimator of the density: the natural way to improve on histograms
2. Assume a multiplicative structure but with non-parametric time effects (continuous densities)

Continuous Chain Ladder: mathematical formulation
1. Density estimation with a triangular support:
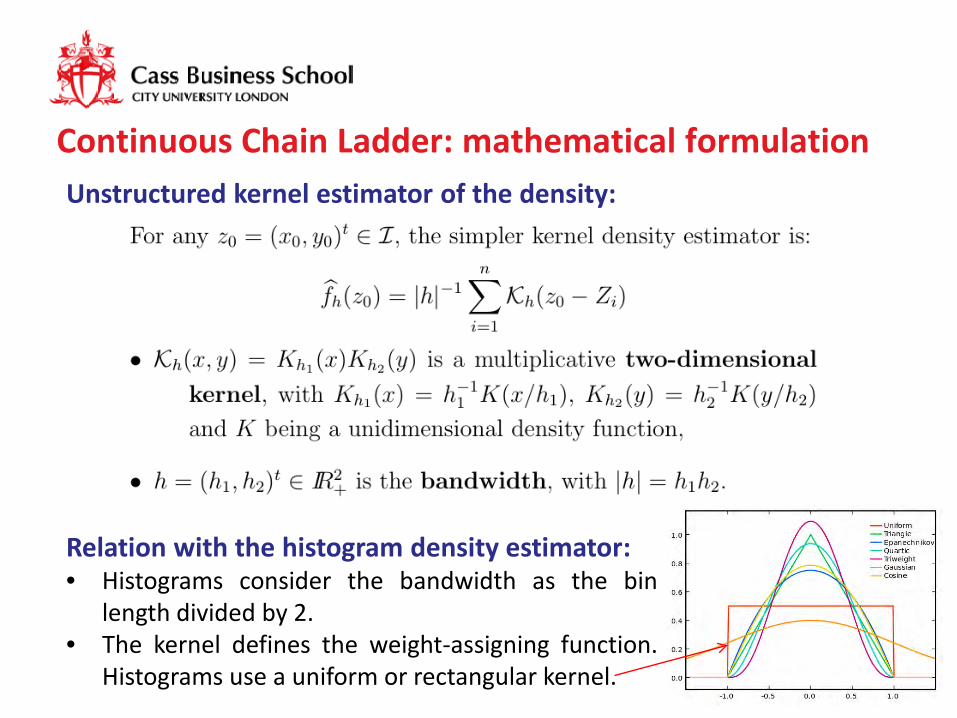
Continuous Chain Ladder: mathematical formulation Unstructured kernel estimator of the density:
Relation with the histogram density estimator: • Histograms consider the bandwidth as the bin
length divided by 2. • The kernel defines the weight-assigning function.
Histograms use a uniform or rectangular kernel.

Continuous Chain Ladder: mathematical formulation Improved kernel density estimators:
Boundary correction
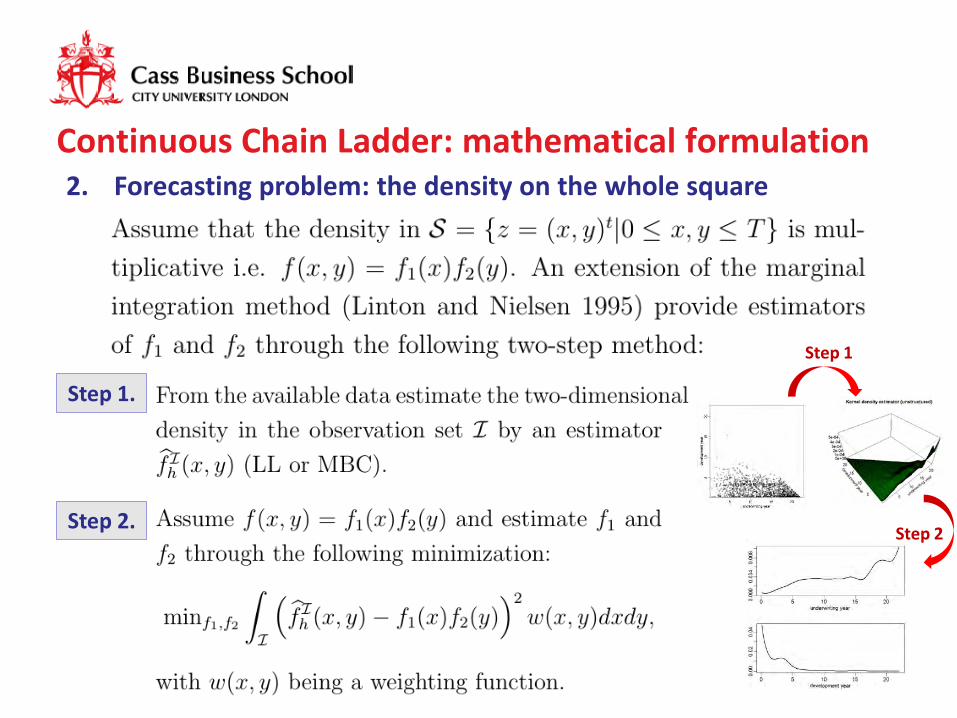
Continuous Chain Ladder: mathematical formulation 2. Forecasting problem: the density on the whole square
Step 1
Step 2
Step 1.
Step 2.
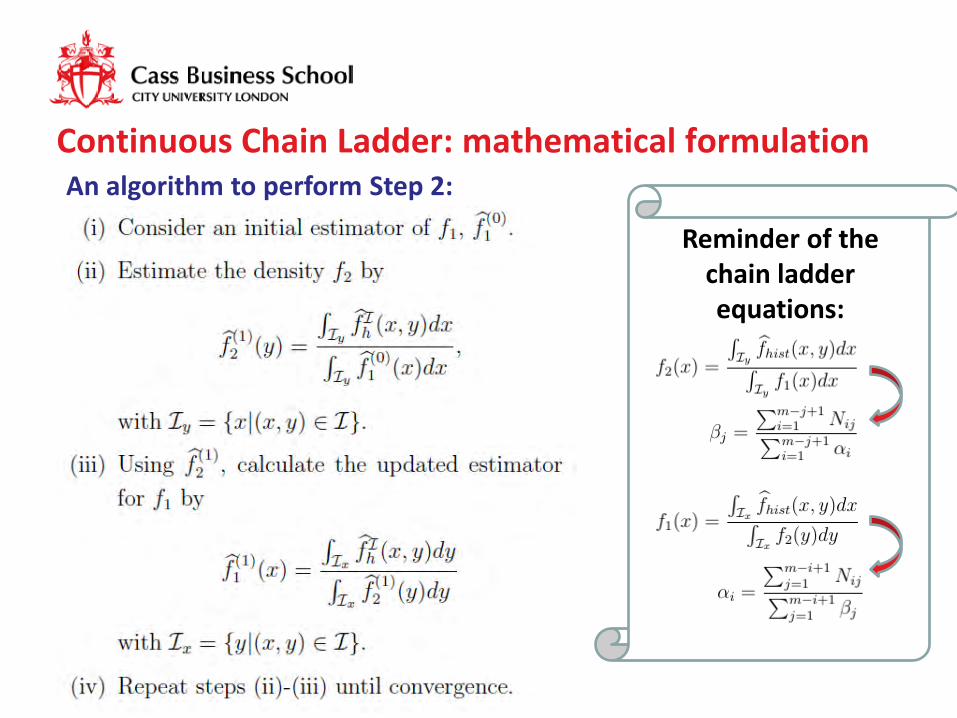
Continuous Chain Ladder: mathematical formulation An algorithm to perform Step 2:
Reminder of the chain ladder equations:
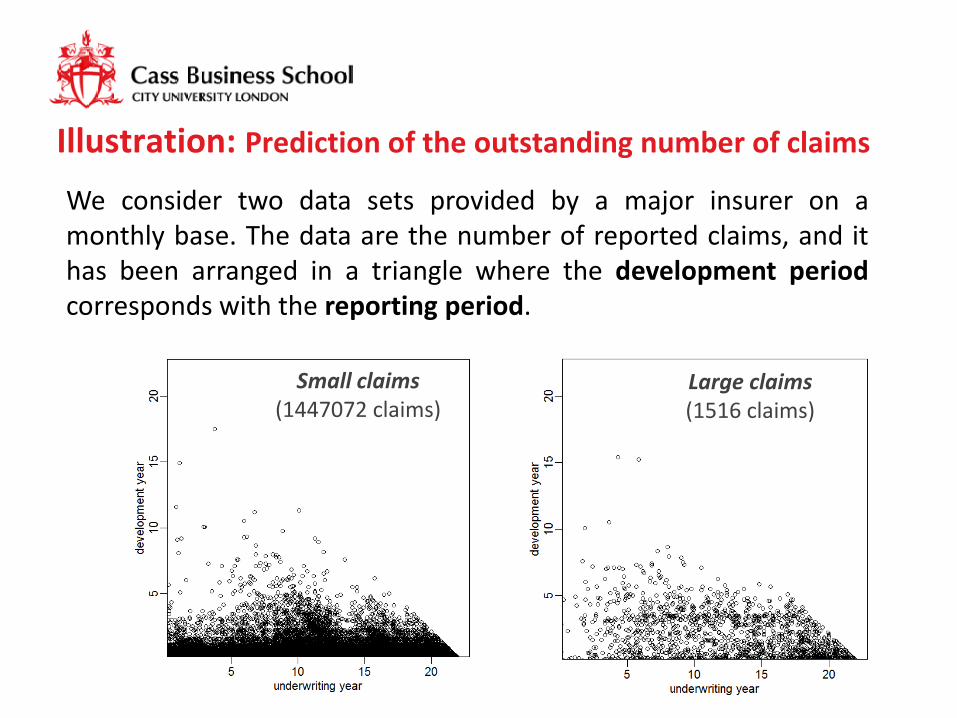
Illustration: Prediction of the outstanding number of claims
Small claims (1447072 claims)
We consider two data sets provided by a major insurer on a monthly base. The data are the number of reported claims, and it has been arranged in a triangle where the development period corresponds with the reporting period.
Large claims (1516 claims)

Illustration: Comparing four methods to solve the problem
Classical Chain Ladder from a yearly run-off triangle. Two versions of Continuous Chain Ladder with two kernel
unstructured density estimators (LL and MBC). GAM method of England and Verrall (2001): starting from the
histogram the time effects are estimated using smoothing splines
A sieve method on monthly chain ladder parameters: providing smoothed chain ladder time effects using local regression.

Illustration: results for large claims Predictions for future calendar years Estimated time effects

Illustration: results for small claims Predictions for future calendar years Estimated time effects

Illustration: testing results against experience
The validation strategy: 1. Cut c=1,2,…,5 diagonals (years) from the observed triangle. 2. Apply the four estimation methods. 3. Compare forecasts and actual values.

Illustration: testing results against experience
Three possible objectives: 1. Predictions of the individual cells
2. Predictions by calendar years
3. The prediction of the overall total

Illustration: testing results against experience
Large claims Small claims
Relative errors with respect to the classical chain ladder method (values lower than 1 indicate an improvement on chain ladder)
This work establishes a link between classical chain ladder and modern mathematical statistics.
The interpretation of classical chain ladder as a structured histogram estimator has a number of immediate implications for further developments.
“Continuous Chain Ladder” is the natural kernel smoother improving the histogram of classical chain ladder.
Further work is required to refine and extend the methods.
Bandwidth selection is not immediate in this framework.
What happens with paid data??...
Conclusions

When the aim is forecasting payments 1. Continuous chain ladder as well as classical chain ladder is a model
for counts data: the goal is just a density. 2. With paid data, the outstanding liabilities are weighted integrals of
a density. Now, a severity function plays a role in the model. 3. But also the dependencies in the data should be considered
through a more complicated model. 4. But the way is almost prepared for the extension: Continuous
Double Chain Ladder (CCL+DCL = CDCL)
Paid
Counts
Double Chain Ladder model (Martínez-Miranda, Nielsen
and Verrall 2012)


![Untitled-1 [cdn.kitsune.tools] · Industrial Ladder Scaffold FRP Stool Ladder Aluminum Ladder Aluminium Tiltable Step FRP Wall Supporting Aluminum Wall Supporting Tanker Ladder —self](https://static.documents.pub/doc/80x56/5f0ebf297e708231d440bd69/untitled-1-cdn-industrial-ladder-scaffold-frp-stool-ladder-aluminum-ladder-aluminium.jpg)