Page 1
Continuous Glucose Monitoring using Titanium
Dioxide Biosensors
A Major Qualifying Project:
Submitted to the faculty of
Worcester Polytechnic Institute
In partial fulfillment of the requirements for the
Bachelor of Science Degree
Submitted by:
________________________________
Alexander Korpacz
Date: April 2, 2015
Submitted to Project Advisor:
__________________________
Professor Hong Susan Zhou
Page 2
2
Abstract
Glioblastoma Multiforme is a form of intracranial tumor that while only affecting 2-3
people per 100,000 per year, has an extremely high death rate with only 30% of patients
surviving after two years. While early detection can extend this survival rate, GBM tumors
mimic other complications and make it very difficult to detect via magnetic resonance imaging
or computed topography scans. Therefore, an alternative detection method has been developed
by taking advantage of the cancer cell’s altered metabolism. This mutated metabolism results in
GBM patients having abnormally high lactate and low glucose levels.
One method of continuously monitoring the low glucose levels of patients is through a
biosensor. This study looks to observe the effectiveness of a titanium dioxide electrode with
copper nanoparticles deposited on the surface. Nine electrodes were synthesized from small
pieces of titanium foil to be used for experimentation. Using cyclic voltammetry in various
electrolyte solutions, the electrode’s effectiveness at detecting glucose was analyzed.
Acknowledgements
First and foremost, I would like to thank Professor Hong Susan Zhou for providing me
with this research opportunity and for providing guidance throughout the project. I would also
like to thank Zanzan Zhu for making this project possible by providing very valuable help
throughout my work in the lab whenever I needed it and for guiding me through my experiments.
Finally, I would like to thank Worcester Polytechnic Institute for the opportunity to participate in
a research project of this caliber.
Page 3
3
Table of Contents
Abstract ........................................................................................................................................... 2
Acknowledgements ......................................................................................................................... 2
Table of Contents ............................................................................................................................ 3
Table of Figures .............................................................................................................................. 6
1. Introduction ................................................................................................................................. 8
2. Background Chapter ................................................................................................................... 9
2.1 Glucose ................................................................................................................................. 9
2.1.1 Role of Glucose in the Body ........................................................................................ 10
2.1.2 Problems Caused by Glucose....................................................................................... 10
2.2 Glioblastoma Multiforme .................................................................................................... 11
2.2.1 Detecting Glioblastoma Multiforme ............................................................................ 12
2.3 Glioblastoma Multiforme Tumor Cells .............................................................................. 13
2.3.1 Growth Factor Levels in GBM Cells ........................................................................... 13
2.3.1 Metabolism in Healthy Cells ....................................................................................... 14
2.3.2 Metabolism in Cancerous Cells ................................................................................... 15
2.3.3 Glucose and Lactate Levels in GBM Cells .................................................................. 18
2.4 Monitoring Glucose Levels in the Body ............................................................................. 18
2.4.1 Problems in CGM ........................................................................................................ 19
2.4.3 Biosensors .................................................................................................................... 19
Page 4
4
2.4.4 Glucose Biosensors ...................................................................................................... 20
2.5 Implanted Glucose Biosensors ............................................................................................ 21
2.5.1 Immune Response to Implanted Biosensors ................................................................ 22
2.5.2 Problems with Enzymatic Biosensors .......................................................................... 22
2.5.3 Non-enzymatic Biosensors .......................................................................................... 23
2.5.3 Titanium as a Glucose Biosensor ................................................................................. 24
2.6 Conclusion .......................................................................................................................... 25
3. Methodology ............................................................................................................................. 26
3.1 Synthesis of Titanium Dioxide Electrodes ......................................................................... 26
3.2 Deposition of Copper Nanoparticles ................................................................................... 27
3.3 Cyclic Voltammetry Tests .................................................................................................. 28
3.4 Testing Glucose Detection .................................................................................................. 29
4. Results and Discussion ............................................................................................................. 31
4.1 Synthesis of Titanium Dioxide Electrode ........................................................................... 31
4.2 Deposition of Copper Nanoparticles ................................................................................... 32
4.3 Determination of Most Efficient Electrodes ....................................................................... 34
4.3.1 Electrode Stability Issues ................................................................................................. 36
4.4 Glucose Detection ............................................................................................................... 38
4.4.1 Complications in the Glucose Detection.......................................................................... 39
5. Conclusions and Recommendations ......................................................................................... 43
Page 5
5
References ..................................................................................................................................... 46
Page 6
6
Table of Figures
Figure 1: Healthy cell metabolism in aerobic (respiration) and anaerobic (fermentation)
conditions (Carter, “Microbial Metabolism”). .............................................................................. 15
Figure 2: Comparison of cellular metabolism in aerobic and anaerobic conditions
(Wickramasekera, “Cancer Cell Metabolism”). ........................................................................... 16
Figure 3: Glucose consumption in tumors of varying degrees of malignancy (Carter, “Microbial
Metabolism”). ............................................................................................................................... 17
Figure 4: Illustration of how biosensors work (Andrews, 2011). ................................................. 20
Figure 5: Biofouling progress on the biosensor due to the body's immune system (Yun, 2009). 22
Figure 6: Cyclic voltammetric scan of each of the nine synthesized titanium electrodes in 0.01M
PBS buffer. .................................................................................................................................... 31
Figure 7: Cyclic voltammetric scan for copper-deposited titanium electrodes using Method 1 of
deposition. ..................................................................................................................................... 33
Figure 8: Cyclic voltammetric scan for copper-deposited titanium electrodes using Method 2 of
deposition. ..................................................................................................................................... 33
Figure 9: Cyclic voltammetric scan of Electrode 1 at varying potential scan rates. ..................... 35
Figure 10: Cyclic voltammetric scan of Electrode 4 at varying potential scan rates. ................... 35
Figure 11: Cyclic voltammetric scan of Electrode 1 at varying potential scan rates after
inactivity. ...................................................................................................................................... 36
Figure 12: Cyclic voltammetric scan of Electrode 4 at varying potential scan rates after
inactivity. ...................................................................................................................................... 37
Figure 13: Repeated Cyclic Voltammetric scan of Electrode 4 in 1mM Glucose-0.1M NaOH
solution at -0.8V to 0.3V............................................................................................................... 38
Page 7
7
Figure 14: Repeated Cyclic Voltammetric scan of Electrode 4 in 1mM Glucose-0.1M NaOH
solution at -0.6V to 0.4V............................................................................................................... 39
Figure 15: Repeated Cyclic Voltammetric scan of Electrode 4 in 0.5mM Glucose-0.1M NaOH
solution at -0.8V to 0.2V............................................................................................................... 40
Figure 16: Repeated Cyclic Voltammetric scan of Electrode 4 in 0.5mM Glucose-0.1M NaOH
solution at -0.6V to 0.4V............................................................................................................... 40
Figure 17: Cyclic voltammetric scan of Electrode 4 in varying glucose concentrations.............. 41
Page 8
8
1. Introduction
Glucose is one of the most essential carbohydrates in humans, being one of the main
energy sources in the body and a precursor to countless other important substances, such as
starch and cellulose. As essential as it is in providing life in humans, it can also be a key
component in detecting or monitoring certain diseases, such as the widely spread diabetes.
Glucose levels can also be used in monitoring tumor levels, especially in the very rare, but very
deadly form of brain cancer known as Glioblastoma Multiforme, or GBM. GBM is a Grade IV
astrocytoma that originates in the star-shaped cerebrum cells called astrocytes that affects 2-3
people per 100,000 per years with a 75% death rate within the first eighteen months (Stark,
2005). Treatment of GBM usually ranges from radiotherapy to total removal of the tumor
followed by treatment with a chemotherapy drug.
It is essential that these tumors are identified as early as possible in order to increase
survival rate. However, the most common forms of tumor recognition, magnetic resonance
imaging and computed topography scans, may not always identify GBM due to how well the
tumor mimics other complications; therefore, the patient may lose valuable time in detecting the
tumor which may inevitably cost them their lives.
However, tumor cells have an altered metabolism that results in the body having
abnormally high lactate and low glucose levels. This leads to an alternative way to detect GBM
tumors—glucose monitoring. One form of continuous glucose monitoring is through the use of a
biosensor. This MQP will study the effectiveness of using a titanium dioxide electrode with
copper nanoparticles as a non-enzymatic biosensor for the detection of glucose. In order to test
efficiency, cyclic voltammetric analyses will be performed under various conditions to determine
how well the electrode can detect glucose levels.
Page 9
9
2. Background Chapter
The purpose of this chapter is to further examine the role of glucose in the body and its
role in diseases, especially the brain tumor, Glioblastoma Multiforme. Also discussed in this
chapter are different methods of monitoring a person’s metabolite levels, both inside and outside
of the body, including biosensors devices. Specifically, the focus of this work is on the use of
titanium dioxide biosensors implanted directly into the body in order to monitor glucose levels in
a patient.
2.1 Glucose
A carbohydrate, or a saccharide, is a biological compound that consists of carbon,
hydrogen, and oxygen. Carbohydrates are categorized by their complexity (a simple one chain
monosaccharide versus a large polysaccharide), reactivity (reducing or oxidizing), number of
carbons, and their carbonyl grouping. The most common carbohydrate is glucose, a simple sugar
with the chemical formula of C6H12O6 found widely in both plants and animals. Fitting the
previous categories, glucose is a simple monosaccharide, an aldohexose (or a six-carbon
molecule containing an aldehyde group), and a reducing sugar (Reusch, 2013). Glucose exists in
humans through three primary natural sources. The first is the consumption of plants, which use
sunlight to convert water and carbon dioxide to glucose and oxygen through photosynthesis. The
second is the breakdown of glycogen, a polysaccharide of glucose that is used as the main
storage of glucose in the body. And the final method is through gluconeogenesis in the liver that
creates glucose from non-carbohydrate sources when the supply of glycogen is consumed and
glucose is not being provided through diet.
Page 10
10
2.1.1 Role of Glucose in the Body
Glucose is the main energy source for the brain and nervous system, being the main
substrate in cells’ energy production cycles, such as the tricarboxylic acid cycle (also known as
the Krebs cycle or the citric acid cycle) and the mitochondrial electron transport chain. Through
glycolysis, the body takes glucose and breaks it down to pyruvate and coenzymes used for
energy (such adenosine triphosphate (ATP) and reduced nicotinamide adenine dinucleotide
(NADH)). Pyruvate is further broken down in the Krebs cycle to release more energy coenzymes
to be converted to ATP in the mitochondrial electron transfer chain.
Glucose also plays a role in synthesizing several other carbohydrates and important
substances. In most animals, glucose is a pre-cursor to ascorbic acid, or vitamin C. Glucose can
also bind to proteins or lipids in order to form glycoproteins or glycolipids. Adding glucose to
these structures assist in folding to increase stability or can act as recognition sites (New World
Encyclopedia, 2008). Also, the linkage glucose is essential in synthesizing other complex
carbohydrates.
2.1.2 Problems Caused by Glucose
While glucose is essential to human life, many complications can be attributed to glucose
levels in the body. The most well-known disease caused by glucose levels is hyperglycemia,
which is an excessive amount of glucose circulating in the blood stream. Hyperglycemia is most
common in diabetes mellitus (DM), where the glucose level is high due to the lack of inulin
being produced in the body (Type 1 DM) or the cells do not properly react to the insulin being
produced (Type 2 DM). According to the American Diabetes Association, a person with a resting
glucose concentration consistently in the range of 110-126 mg/dL (5.6-7 mmol/L), as opposed to
Page 11
11
the healthy adult rest rate of 70-110 mg/dL (3.9-5.6 mmol/L), is considered hyperglycemic while
a person over 126 mg/dL is considered diabetic (ADA, 2003).
On the opposite hand, hypoglycemia occurs when the body experiences a shortage in
glucose and consistently has a resting concentration level below 70 mg/dL (Chase, “Low Blood
Sugar”). Since the brain heavily relies on a steady income of glucose, a slight reduction in mental
effectiveness can be observed as soon as a person reaches the hypoglycemic range. Prolonged
hypoglycemia can result in neuroglycopenia, where the neurons in the brain become
nonfunctional due to the lack of glucose.
Other diseases have been attributed to glucose that do not necessarily come from the
levels of glucose. One example is von Gierke disease, or glycogen storage type I disease, where
once glucose is converted to glycogen, it cannot be converted back for energy consumption,
resulting in a buildup of glycogen in the liver and a shortage of glucose in the body (Haldeman-
Englert, 2013). Most of the previous conditions mentioned, can be counteracted by monitoring
the amount of glucose in a person’s diet. However, monitoring glucose levels can also be
beneficial to observing phenomena that occurs in the body, such as a cell metabolizing more
glucose than normal—one common trait of malignant cancer cells, specifically in Glioblastoma
Multiforme.
2.2 Glioblastoma Multiforme
Glioblastoma Multiforme (GBM) is a form of intracranial tumor that is rare amongst
people, but has rapid progression, a low survival rate, and mostly unknown etiology. GBM is a
Grade IV astrocytoma that originates in the star-shaped cerebrum cells called astrocytes that
affects 2-3 people per 100,000 per year with a 75% death rate within the first eighteen months
(Stark, 2005). In a study in 2013, observing 1645 cases of GBM, 98.4% of the patients, mostly
Page 12
12
males between the ages of 55-64, died. These cases included multiple different types of
treatments from radiotherapy to gross total removal of the tumor (Dubrow, 2013). The standard
treatment of GBM is initial radiotherapy, followed by gross total resection (often omitted in
patients older than 70 years) followed by treatment with the alkylating oral chemotherapy drug
temozolomide (Bleeker, 2012). Studies show that primary GBM tumors often recur within two
centimeters of its original size after radiotherapy in 80-90% of patients. The introduction of
temozolomide as a treatment in 2005 has increased overall survival from 12.1 to 14.6 months
and increased the likelihood of two-year-survival from 10% to 26% (Bruce, 2014). As with most
tumors, treatment is most effective when detected early. However, this is difficult due to the fact
that GBM can only be identified by clinical neuroimaging and the tumor manifests with little
evidence of precursors. A secondary form of the GBM tumor that arises from lower-grade
gliomas, but these are less common, less aggressive, and appear mostly in younger patients.
2.2.1 Detecting Glioblastoma Multiforme
Typically, patients with GBM present symptoms in some or all of three categories: focal
neurological deficit, increased cranial pressure, and seizures. Focal neurological deficits are
problems with brain, spinal, or nerve function that affects a specific location on the body, as
opposed to a general nonfocal problem (i.e. loss of consciousness) (Dugdale, “Focal neurological
deficits”). Focal neurological deficits can be demonstrated in paralysis of limbs or facial
movements, loss of muscle control, or changes in mood, speech, hearing, and vision. Once these
symptoms occur, the GBM tumor can only be detected through neurological imaging.
Magnetic resonance imaging (MRI) and computed topography (CT) scanning are the
most commons way to identify GBMs, but do not always work. As stated before, GBM tumors
have little evident malignant precursors and can form in as little as three months. Because of this,
Page 13
13
CT scans may miss small tumors if the scan is conducted in the early ages of GBM growth. MRI
scans are more adept at identifying small tumors; however, GBM tumors can often mimic other
complications, such as abscess, and can go undetected and prolong recognition (Bruce, 2014).
These flaws in MRI and CT scanning can cause a patient to lose vital time in diagnosing their
condition. Therefore, it is essential to either improve these methods or to introduce a new form of
imaging.
2.3 Glioblastoma Multiforme Tumor Cells
In GBM tumor cells, several growth factor pathways are altered from normal brain cells.
In 2010, GBM cancer cells were separated into four subtypes based on what gene was mutated:
classical, mesenchymal, proneural, and neural. In classical GBM tumors, high levels of the
surface protein EGFR (epidermal growth factor receptor) are found, which causes the cell to
divide more rapidly. The tumor suppressor gene, NF1, is most commonly mutated in
mesenchymal tumors and proneural tumors have mutated TP53 and IDH1 genes, which result in
abnormal cell growth. The fourth subtype of GBM tumor, neural, had no one mutation that stood
out more than the rest. These types also react differently to treatments, with classical having the
highest survival rate after aggressive treatment, and proneural having roughly the same survival
rate between aggressive and nonaggressive treatments (Evans, 2011). This information is vital to
treating GBM, because it allows clinicians to know more about how to specifically treat this case
and what to look for when identifying the tumor.
2.3.1 Growth Factor Levels in GBM Cells
In GBM cancer cells, high levels of growth factors are observed. For example, the
increased production of EGFR in classical GBM tumors can be monitored by the level of the
growth factor, EGF, which binds to EGFR in order to promote cell division. Other growth factors
Page 14
14
such as PDGF (platelet derived growth factor), VEGF (vascular endothelial growth factor), and
IGF (insulin-like growth factor) are also found to be abnormally high in malignant GBM cells
(ABTA, 2014). This is important in initially detecting a GBM tumor in a patient. If a growth
factor blood test shows high amounts of EGF or the other growth factors, then the patient can be
recommended for neurological imaging in order to be certain of the tumor.
2.3.2 Metabolism in Healthy Cells
One of the most crucial characteristics of all cancer cells, GBM tumors included, is that
they do not follow the same cellular metabolism as normal cells. As stated briefly in Chapter
2.1.1, in healthy cells, glucose is converted to pyruvate through glycolysis, releasing two ATP
and two NADH molecules. From here, the path of pyruvate is dependent on the amount of
oxygen available. If oxygen is present, the cell undergoes respiration where pyruvate is
converted to acetyl-CoA and acetyl-CoA enters the Krebs cycle which produces more energy
cofactors (ATP, NADH, and reduced flavin adenine dinucleotide, FADH2) that enter the
mitochondria for oxidative phosphorylation, ultimately producing an additional 34 ATP
molecules. Since oxygen is vital in oxidative phosphorylation, this process cannot occur in
anaerobic conditions. Healthy cells will take the pyruvate formed from glycolysis and convert it
to lactate (or alcohol in plants and yeast) through fermentation. Fermentation produces a
molecule of oxidized NAD which is recycled into the glycolysis stream, but no additional ATP
(Gregory, “Cellular Respiration”). These metabolic pathways are shown in Figure 1.
Page 15
15
Figure 1: Healthy cell metabolism in aerobic (respiration) and anaerobic (fermentation) conditions (Carter, “Microbial
Metabolism”).
Overall, in healthy cells, both pathways begin with glycolysis and 36 molecules of ATP are
produced in the presence of oxygen and 2 molecules are produced in the absence of oxygen.
2.3.3 Metabolism in Cancerous Cells
Cancerous cells do not follow the same pathways as normal, healthy cells. Whether the
tumor cell is in oxygen-rich or oxygen-deficient environments, it only follows fermentation
pathway, as shown in Figure 2.
Page 16
16
Figure 2: Comparison of cellular metabolism in aerobic and anaerobic conditions (Wickramasekera, “Cancer Cell
Metabolism”).
This removal of the normal aerobic pathway is the primary cause of cancer. Lactic acid
fermentation is much less energetically efficient than aerobic respiration. Instead of the 36 ATP
normally produced in oxygen-rich environments, only 2 ATP will be produced. However, lactic
acid fermentation occurs about 100 times faster than oxidative phosphorylation and,
consequentially, results in an abundancy of glycolysis byproducts. These byproducts can then be
used in other biosynthesis pathways responsible for producing the building blocks necessary for
assembling new cells, resulting in the rapid reproduction of cancerous cells (Wickramasekera,
“Cancer Cell Metabolism”). As stated by in a lecture by Dr. Otto Warburg, “cancer…has
countless secondary causes. But, even for cancer, there is only one prime cause. Summarized in a
few words, the prime cause of cancer is the replacement of the respiration of oxygen in normal
body cells by a fermentation of sugar…” (Warburg, 1956). This rapid rate of glycolysis and
absence of oxidative phosphorylation is known as the Warburg effect.
Page 17
17
Since lactic fermentation occurs much more rapidly than oxidative phosphorylation,
glucose is consumed and lactate is produced much quicker in cancerous cells than in healthy
cells. This difference becomes greater depending on the malignancy of the tumor, as shown in
Figure 3.
Figure 3: Glucose consumption in tumors of varying degrees of malignancy (Carter, “Microbial Metabolism”).
Since Glioblastoma Multiforme is a grade IV tumor, it is considered extremely malignant.
Therefore, GBM cells would be able to be detected in patients who exhibit the symptoms
mentioned in Chapter 2.2.1, the growth factor levels mentioned in Chapter 2.3.1, and most
importantly, the low glucose and high lactate levels discussed in this chapter.
Page 18
18
2.3.4 Glucose and Lactate Levels in GBM Cells
The large difference in glucose and lactate levels between healthy and cancerous cells
can be vital in identifying and treating patients with GBM. As stated in Chapter 2.1.2, the normal
resting level of glucose is in the range of 3.9-5.6 mmol/L, while the normal resting level of
lactate is in the range of 0.5-2.2 mmol/L (Dugdale, “Lactic acid test”). Patients with GBM
tumors can have lactate levels as high as 40 mmol/L (Hirschhaeuser, 2011) and glucose levels
between 1 and 2 mmol/L (Jiao, 2014). Since glucose is the prerequisite in lactic acid
fermentation, it is especially vital in monitoring GBM tumors. Glucose can be controlled through
diet and the effect of low-glucose diets has become a key focal point of GBM treatment
(Jelluma, 2006; Champ, 2014). In the Jelluma et al. study, it was concluded that while glucose
withdrawal usually results in lowered ATP production in most astrocytes, it actually increased
ATP production in GBM patients. Overall, monitoring glucose levels can be very effective at
monitoring the progression of the tumor.
2.4 Monitoring Glucose Levels in the Body
Due to the fact that high glucose levels accelerate the progression of glioblastoma
growth, it is imperative that patients monitor their glucose levels. Since diabetes is such a wide
spread condition that also requires constant glucose monitoring, there are already many ways to
go about this task. One method involves pricking one’s fingertip with a sharp needle and placing
a drop of blood on a test strip. The test strip is then placed into a meter which gives results
quickly. Newer meters allow the patient to use other test sites, such as one’s thigh, forearm, or
upper arm. However, these areas are not as accurate as the fingertip, which shows changes more
quickly—especially when levels are fluctuating such as during exercise or after eating. The
newest method removes the need to continuously perform self-testing. Continuous glucose
Page 19
19
monitoring (CGM) provides a nearly constant glucose level reading by monitoring the glucose
concentration in the interstitial fluid between cells and sending the results to a handheld receiver.
While CGM devices still need to be calibrated occasional through finger-sticking, it greatly
reduces the hassle of monitoring glucose levels by letting the person just periodically glance at a
device rather than perform a test (DHC, “How and When…”).
2.4.1 Problems in CGM
A CGM device consists of three parts: the monitor, the transmitter, and the sensor. The
monitor displays the readout, the sensor is inserted into the tissue beneath the skin, and the
transmitter relays the information from the sensor to the readout. One problem with CGM
devices is the tradeoff between high sensitivity and high specificity. Highly sensitive devices
sound an alarm every time the glucose level is outside of the normal range. This is effective at
ensuring the safety of the patient, but can often have false alarms. Highly specific devices have
fewer false alarms, but can overlook some important occurrences (Yee, 2010). Therefore,
manufacturers need to choose between tradeoffs when designing the device.
2.4.2 Biosensors
The sensor in CGM devices is an example of a glucose biosensor. A biosensor is a
compact analytical device made up of a transducer and a biological element that interacts with
the desired analyte and relays the response via an electrical signal. The biological element can be
an enzyme, a nucleotide, a protein, etc. and the transducer works in a physiochemical way to
convert, or transduce, the signal resulting from the analyte interaction to a signal that can be
quantified (Robertson, 2014). This concept is illustrated in Figure 4.
Page 20
20
Figure 4: Illustration of how biosensors work (Andrews, 2011).
The biological element of the biosensor recognizes and interacts with the desired analyte. The
transducer then takes the signal received from the interaction (heat change, electron movement,
etc.) and converts it to a measurable form.
2.4.3 Glucose Biosensors
Leland C. Clark is credited as the “father of biosensors” by publishing a paper on his
oxygen electrode in 1956. The Clark electrode, as it was named, measured the activity of oxygen
on a catalytic platinum surface. Clark wanted to find a way to make his electrode “more
intelligent” by expanding its use to measuring analytes inside the body (Setford, 2005). In 1962,
Clark added an inner oxygen semipermeable membrane, a thin layer or glucose oxidase (GOx),
and an outer dialysis membrane. Using this “enzyme electrode,” as it was named, Clark found
that the decrease in oxygen measured was proportional to the glucose concentration (Yoo, 2010).
The basic concept of glucose biosensors is that the GOx on the enzyme (along with a
redox cofactor acting as the initial electron acceptor) catalyzes the oxidation of glucose by the
following reactions:
Glucose + GOx(FAD) → Gluconolactone + GOx(FADH2) (1)
Page 21
21
GOx(FADH2) + O2→ GOx(FAD) + H2O2 (2)
The hydrogen peroxide then reacts with the platinum catalyst anode on the electrode, which
releases two electrons. The sensor then uses the total electron flow to determine the glucose
concentration. Succeeding glucose biosensors that followed this principle faced two main
problems—restricted oxygen solubility in biological fluids and other species, such as ascorbic
acid or uric acid, interfering with the electrons. In order to counteract the problems, “second-
generation” glucose biosensors changed to replace oxygen with redox mediators, such as
ferrocenes, quinines, or thionines. These mediators formed reduced mediators other than
hydrogen peroxide. Overall, the same general principle applied to both generations, but second
generation sensors removed the problems associated with oxygen and hydrogen peroxide.
Today’s biosensors are referred to as “third-generation” sensors and are attempting to become
reagentless (to avoid high toxicity mediators) and directly transfer electrons from the enzyme to
the electrode (Yoo, 2010). Due to the reduced toxicity, some of these biosensors can be
implantable, such as the CGM devices previously mentioned.
2.5 Implanted Glucose Biosensors
It has been generally described how biosensors interact with analytes in order to provide
the necessary data; however, the materials used in the biosensors are vital to the success of the
analyte detection—especially for biosensors implanted directly into the body. Since the
discovery of biosensors, there has been little success in long-term implantable sensors. Overall,
the main complications in long term use are: the body’s response to foreign bodies, the
degradative effect of the proteases in the extracellular matrix on the biosensors, enzyme
denaturation, changes in the membrane’s properties (such as density) due to time and
temperature changes, and material failures (Kotanen, 2012).
Page 22
22
2.5.1 Immune Response to Implanted Biosensors
Implantation of these devices cause the body’s immune system to react through
inflammation, blood clotting, and tissue contracting around the sensor. The body also responds
by sending macrophages, platelets, and other defense mechanisms to the infection site that
encapsulates and degrades the enzyme—this is known as biofouling. Biofouling serves as the
main cause of the biosensor’s loss in sensitivity. Biofouling can cause the biosensor to see a 50-
80% decrease in sensitivity. The biofouling process is illustrated in Figure 5.
Figure 5: Biofouling progress on the biosensor due to the body's immune system (Yun, 2009).
The immune system’s first response is to send proteins, phospholipids, peptides, etc. to surround
the biosensor. These proteins then interact with the cell, which produces tissue such as
hemoglobin, albumin, and immunoglobulin to encapsulate the biosensor and prepare for attack of
the phagocytic cells to degrade the biosensor (Yun, 2009).
2.5.2 Problems with Enzymatic Biosensors
In enzyme-based biosensors, enzyme degradation poses as a huge threat to the success of
the biosensor. Long term stability is one of the biggest problems with enzymatic glucose sensors,
which, as stated before, typically use the enzyme glucose oxidase. While glucose oxidase is
Page 23
23
relatively stable compared to most enzymes, it still faces the same problems—constant exposure
to thermal and chemical deformation, changes in temperature, pH, and toxic chemicals, and
changes in humidity levels. It has been observed that glucose oxidase loses its catalytic activity
outside of the pH range of 2-8 or temperatures above 40°C (Park, 2006). While the normal pH
level and temperature of the human body is 7.5 and 37°C, it can sometimes spike resulting in an
environment that will denature glucose oxidase, ruining the biosensor’s efficiency.
Another problem with enzymatic biosensors is the difficulty in production. In order to
attempt to preserve the enzyme’s catalytic ability for as long as possible, multiple enzyme layers
must be placed on the electrode in a carefully optimized method called enzyme immobilization
(Park, 2006). The quality of the sensors depends on the immobilization of the enzyme and
therefore it is a difficult procedure to ensure the reproducibility of each biosensor. This is a great
challenge, especially in mass manufacturing of the device.
A final problem with enzymatic biosensors is the presence of oxygen. Oxygen competes
as an electron-mediating site and can affect the activity of the sensors (Park, 2006). Some
enzymatic devices have attempted to solve this problem by having the electron transfer occur
directly on the electrode surface (third generation biosensors).
2.5.3 Non-enzymatic Biosensors
In order to combat the problems associated with enzymes, non-enzymatic catalysts have
been the focus of recent studies. Examples of non-enzymatic catalysts used in studies are metals
such gold, platinum, and copper or polymer films such as polypyrrole (Cui, 2007; Ozcan, 2008).
Each of these materials shows electrocatalytic activity towards the oxidation of glucose without
the use of an enzyme.
Page 24
24
However, while these approaches solve the problems faced by enzymatic devices, they
are not completely problem-free on their own. One of the biggest issue with using metals, as
opposed to enzymes, as an electrode is the occurrence of surface poisoning. While platinum was
found to have one of the highest catalytic activities towards glucose oxidation, it is very
susceptible to self-poisoning due to the absorption of carbon monoxide, chlorides, or other
intermediates on the surface of the catalyst (Jin, 2007). In order to improve self-poisoning
resistance, platinum was modified with heavy metals such as lead, bismuth, or tungsten trioxide
(Kokkinidis, 1984; Wittstock, 1998; Zhang, 1997). However, this now introduces the problem of
dissolution and toxins associated with these heavy metals which makes it impractical for in vivo
usage. Heavy metal toxicity is a serious problem where the heavy metals interact with oxygen in
the body and can affect normal enzymatic activity, which can affect nearly every organ system
(Adal, 2014). Therefore, tradeoffs between catalytic activity and the ability to be used in the
body must be considered.
2.5.3 Titanium as a Glucose Biosensor
Titanium has been used in surgeries since the 1950s and is currently one of the most
widely used metals in surgical implants. This is due to its high strength, low elastic modulus
(very similar to that of actual bone) and, most importantly to implant use, high corrosion
resistance and tissue compatibility (Wang, 1996). Also, since titanium is non-ferromagnetic,
patients with titanium implants can still undergo neuroimaging such as MRI (NASS, “Magnetic
Resonance Imaging”). This is imperative for patients with GMB who need to frequently monitor
tumor growth. Due to all of these reasons, titanium is an ideal candidate for use as an
implantable biosensor.
Page 25
25
Many studies have already been conducted using titanium-based biosensors for glucose
detection, both non-enzymatically (Cosnier, 1997; Ikeda, 1993; Khan, 1995) and for enzymatic
stabilization (Rahman, 2010). Overall, titanium biosensors have been found to avoid the surface
poisoning that most biosensor electrodes faced when using other metals. This results in the
titanium biosensors lasting longer in the body without losing its catalytic activity. Titanium
dioxide nanotubes were found to function as low as 5°C and as high as 50°C (Yin, 2010). This is
covers a much greater range than enzymatic biosensors and easily functions within all
biologically-possible temperatures within the human body.
The main focus of this study will be on the use of copper-deposited titanium oxide as an
electrode in glucose detection. Cyclic voltammetry will be used in order to measure the catalytic
activity between the electrode and the glucose solutions prepared.
2.6 Conclusion
Glucose, being responsible for a vast majority of the energy production in cells, is one of
the most important carbohydrates in the human body. While it is responsible for keeping the
body alive, cancerous cells such as glioblastoma multiforme, can take advantage of the cell’s
metabolism to result in a disease with a very low survival rate. It is essential to monitor GBM
tumors through neuroimaging, such as MRIs and CT scans, and continuous glucose-level
monitoring, which can be achieved by biosensors. While most biosensors use enzymes to detect
the oxidation of glucose, difficulties in stability and other problems has resulted in a push for
non-enzymatic biosensors that use modified metal or polymer electrodes. Titanium is an ideal
candidate due to its excellent biocompatibility and will be used as the focus of this study.
Page 26
26
3. Methodology
The purpose of this chapter is to describe the methods used during this experimentation.
This includes the synthesis of the titanium dioxide electrodes, the deposition of copper
nanoparticles on the surface of the electrode, and descriptions of the procedures used to test the
electrodes’ effectiveness at detecting glucose.
3.1 Synthesis of Titanium Dioxide Electrodes
The first step in creating the titanium dioxide electrodes was to oxidize titanium foil into
titanium dioxide. Small pieces of titanium foil (roughly one inch by one inch) were obtained
from the laboratory as the starting material. To ensure that the surfaces of each foil piece was
ideal, a thorough polishing process was followed. First, the titanium foil was polished by hand
using polishing paper with varying grit sizes. Each side of the foil was polished for 30 minutes
using 220 grit polishing paper, followed by 400 and 800 grit paper. This extensive polishing
procedure ensured that the foil was as smooth as could be obtained by hand polishing and that
there was no foreign material on the foil.
Following the hand polishing, the titanium foil was also chemically polished with acid.
5mL of hydrofluoric acid was added to 15mL of nitric acid in a small beaker to form the strong
acid solution to be used for polishing. This nitric-hydrofluoric acid solution is very common in
industrial descaling of stainless steel and titanium. The titanium was submerged in the acid
solution for 10 seconds until the solution turned a shade of yellow/orange and released a vapor of
the same color. The titanium was then immediately submerged in deionized water, completing
the polishing process and ensuring the highest current potential.
Following polishing, the titanium was anodized to synthesize the titanium oxide
electrodes. Anodizing thickens the natural oxide layer on the surface of the metal, which would
Page 27
27
form the titanium oxide electrode. The foil was anodized through potentiostatic anodization in an
electrolytic solution. Some electrolytic solutions that can be used to anodize titanium are a
dimethyl sulfoxide-hydrofluoric solution, a formamide-water/ammonium fluoride solution, or an
ethylene glycol-ammonium fluoride solution (Shankar 2007). Shankar et al.’s work reported that
using the ethylene glycol-ammonium fluoride solution resulted in the best nanotube array
configuration; therefore, that was the best solution to use to anodize the titanium. The titanium
anode was suspended in the electrolytic solution along with a small piece of platinum mesh to act
as the cathode. The system was then attached to a power supply at 20 volts for one hour,
continually being stirred by a magnetic stirrer set at a rotation speed of 190. After the
anodization was complete, both the titanium dioxide electrode and the platinum mesh were
washed with deionized water. Finally, the titanium was placed in a furnace set at 350°F for 1.5
hours to complete the synthesis of the titanium dioxide electrode.
3.2 Deposition of Copper Nanoparticles
It has been observed that depositing nanoparticles onto biosensors can improve its
function. A study from 2009 looked at how nanoparticles effect can affect electrochemical
biosensors (as well as optical and magnetic biosensors) and found that nanoparticles, such gold
or platinum, can increase signal amplification, minimize noise interference, or increase
sensitivity (Sanvicens 2009). Therefore, copper nanoparticles were deposited to the titanium
dioxide electrode in order to increase the effectiveness of the biosensor. The nanoparticles were
deposited through amperometric methods at two different conditions. A 15mL solution of 0.05M
CuSO4/0.5M H2SO4 was prepared. Oxygen was removed from it by slowly bubbling nitrogen
gas through the solution for 20 minutes. The titanium electrode was suspended with a platinum
counter electrode and a reference electrode in the CuSO4/H2SO4 solution and was attached to a
Page 28
28
galvanostat. An amperometric method was carried out through an Autolab computer program at
two different operating conditions to see which method was optimal. The first set of electrodes
was run at -0.4V for 220 seconds (Method 1) while the second set of electrodes was ran at -0.2V
for 100 seconds (Method 2). Once the amperometry was complete, each copper-deposited
electrode was rinsed with deionized water and dried with nitrogen gas.
3.3 Cyclic Voltammetry Tests
To test the electrodes, cyclic voltammetry was used using same three-electrode
configuration mentioned in the previous paragraph: the titanium dioxide foil as the reference
electrode, platinum as the counter electrode, and the reference electrode provided with the
galvanostat. Cyclic voltammetry measures the working electrode’s current while increasing the
current to a set point and then decreasing the current back to the starting point. Different scan
rates, potential ranges, and number of cycles can be set for each experiment. Since cyclic
voltammetry was the primary source of measuring the electrode’s efficiency, the analysis was
performed at every step of the process.
Before the copper nanoparticles were deposited on the titanium dioxide electrode, a
cyclic voltammetric analysis was performed on the pure electrode. A 15mL 0.01M phosphate
buffered saline (PBS) solution was prepared and bubbled with nitrogen gas for 20 minutes prior
to use as the electrolyte in this analysis. The three electrodes were suspended in the PBS buffer
and cyclic voltammetry was performed at a potential range of -1.4 to 0.3V at a scan rate of 0.05
V/s for 5 cycles. The same experiment was performed for the copper-deposited electrodes. In
addition to testing the copper-deposited electrodes in the PBS buffer, the experiment was
repeated using 0.1M NaOH that was bubbled with nitrogen as the electrolyte. These experiments
were used to determine which copper-deposited titanium dioxide electrodes were the most
Page 29
29
suitable to be used for glucose detection. Those electrodes were then repeated at scan rates of
0.01, 0.03, 0.05, 0.07, and 0.09 while holding the potential range constant in order to ensure that
each electrode followed the expectation that the magnitude of the current peaks should increase
with increasing scan rates. This expectation is shown by the Randles-Sevcik equation, ip =
268,600*n3/2
*A*D1/2
*C*v1/2
(where ip and v represent the current peak and the scan rate; other
variables represent the number of electrons transferred (n), the electrode area (A), the diffusion
coefficient (D), and the concentration (C)).
3.4 Testing Glucose Detection
The next step after the ideal electrodes were determined was to experiment on the
electrodes’ ability to detect glucose began. This analysis was also performed through cyclic
voltammetry using the same three-electrode system as mentioned before; however, instead of a
pure electrolyte solution of PBS or NaOH, a glucose-NaOH solution was used. A 1mM glucose-
0.1M NaOH solution was prepared for the first set of experimentation. The cyclic voltammetric
analysis was then carried out at potential ranges of -0.8 to 0.3V and -0.6 to 0.4V. Each trial was
conducted three times in order to ensure reproducibility. A large peak in the cyclic voltammetric
graph would represent the electrode detecting the oxidation of glucose.
A more diluted glucose-NaOH solution was prepared for the next round of
experimentation, this time using 0.5mM glucose. The same procedure was repeated, running the
cyclic voltammetry three times atpotential ranges of -0.8 to 0.3V and -0.6 to 0.4V. By decreasing
the concentration of glucose in the glucose-NaOH solution, the magnitude of the current peaks
would be expected to decrease since less glucose is there to oxidize and be detected by the
electrode. This expectation also corresponds with the Randles-Sevcik equation.
Page 30
30
The final experiment performed aimed to directly see the effect increasing the glucose
concentration had on the magnitude of the current peak. Three NaOH solutions were prepared
and bubbled with nitrogen—one containing no glucose, one with 1mM glucose, and one with
5mM glucose. The cyclic voltammetric analysis was performed in succession using each of the
three solutions (rinsing with deionized water between each trial) at a potential range of -0.2 to
0.8V. This final experiment would show the correlation between the magnitude of the current
peak and the concentration on a single plot and, ultimately, the electrodes effectiveness at
detecting glucose.
Page 31
31
4. Results and Discussion
This objective of this study was to develop a copper-deposited titanium dioxide electrode
that could be used as a biosensor for patients in need of continuously monitoring their glucose
levels. In order to analyze the effectiveness of the electrode, multiple cyclic voltammetry and
amperometry experiments were conducted on the electrodes in different electrolyte solutions.
This chapter will report the results from the aforementioned experiments.
4.1 Synthesis of Titanium Dioxide Electrode
The first step in developing a method for monitoring of glucose level inside of a person
was the creation of the titanium oxide electrode. Following the synthesis of titanium dioxide
nanostructures on titanium foil through anodic oxidation, nine pieces of the titanium foil
electrode were synthesized. To ensure that each electrode was developed as expected,
electrochemical analysis was performed on each foil piece. They cyclic voltammetric scans for
each of the nine titanium dioxide pieces can be seen below in Figure 6.
Figure 6: Cyclic voltammetric scan of each of the nine synthesized titanium electrodes in 0.01M PBS buffer.
Page 32
32
The main objective in analyzing each of the nine pieces was to ensure that none of the pieces
differed drastically from the rest of the electrodes. As it can be seen in the figure, each of the
nine scans adapted the same general shape, although the magnitude of the peak currents differed
slightly. Since each scan resulted in the same shape, it can be inferred that the anodization
process was generally successful, with a few exceptions.
The main discrepancy amongst the scans is that four of the electrodes (the purple, lime
green, and innermost red and blue curves) have cathodic current peaks at about 0.2V less than
the other five scans. This inconsistency can be explained due to a change in the counter electrode
during the voltammetric analysis. During experimentation, the original platinum mesh (that was
used in the four scans mentioned above) broke and became unusable. This mesh was replaced
with a platinum coil that was used as the counter electrode for the remaining five experiments.
Although the electrode changed, the scans were still similar enough to each other to believe that
all nine pieces were suitable to be used in further experimentation.
4.2 Deposition of Copper Nanoparticles
Once all nine titanium electrodes were determined to be appropriate for additional
testing, copper nanoparticles were deposited onto the nanostructures through amperometry. The
copper nanoparticles were deposited onto three of the electrodes (chosen at random) for each of
the two methods described in the Methodology chapter. The electrodes will be referred to as
Electrodes 1-3 and Electrodes 4-6, for Methods 1 and 2, respectively. Following the deposition
of the nanoparticles, another cyclic voltammetric analysis was conducted in 0.1M NaOH
solution. The scans for each of the two methods can be seen in Figures 7 and 8 on the following
page.
Page 33
33
Figure 7: Cyclic voltammetric scan for copper-deposited titanium electrodes using Method 1 of deposition.
Figure 8: Cyclic voltammetric scan for copper-deposited titanium electrodes using Method 2 of deposition.
Page 34
34
Once again, both Figures 7 and 8 illustrate that the copper-deposited titanium electrodes
maintained similarly shaped curves throughout the electrochemical analyses while the magnitude
of the peak differs. Again, this validates the assumption that the copper nanoparticles were
successfully deposited onto each of the six titanium pieces. However, since the cyclic
voltammetric analyses were conducted at differing potential ranges (-0.2V to 0.8V for Method 1
and -0.5V to 0.3V for Method 2), the two methods cannot be directly compared to each other.
However, Figures 7 and 8 seem to suggest that the two methods would result in two uniquely
shaped voltammetric curves, allowing for further analysis of which method results in the more
superior glucose detection.
4.3 Determination of Most Efficient Electrodes
Based on the experiments in pure NaOH and pure PBS, the nine electrodes were
narrowed down to two candidates to be used for the remainder of the experiments. These
electrodes (Electrodes 1 and 4) were based on which had the most prominent cathodic peaks in
the prior cyclic voltammetric scans (Figures 7 and 8). Once the two ideal titanium electrodes
were selected, a second cyclic voltammetric analysis was conducted. The goal of this analysis
was to observe how the voltammetric scan of the electrodes reacted to varying the potential scan
rate. In theory, the magnitude of both the anodic and cathodic current peaks should increase
proportionally to the square root of scan rate, as shown by the Randles-Sevcik equation, ip =
268,600*n3/2
*A*D1/2
*C*v1/2
. Both Electrode 1 and Electrode 4 underwent the voltammetric
analysis in 0.1M NaOH at a potential range of -0.8V to 0.3V while setting the scan rate to 0.01,
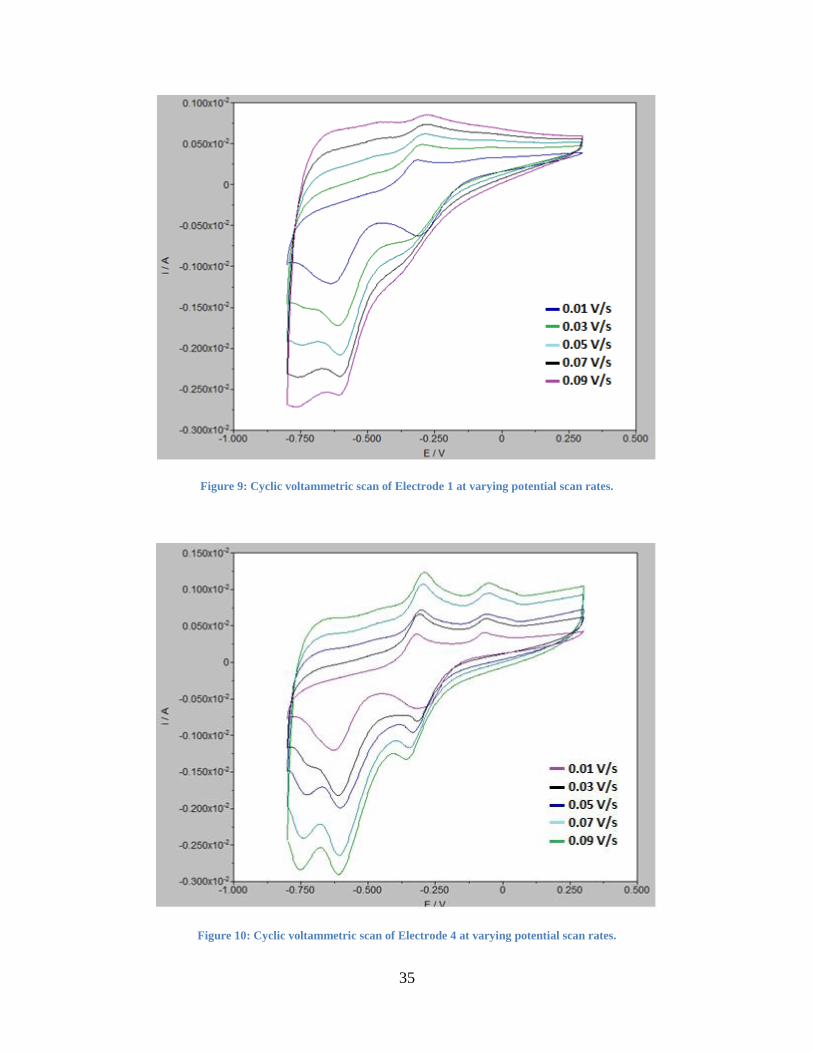
0.03, 0.05, 0.07, and 0.09V/s. The results can be seen in Figures 9 and 10.
Page 35
35
Figure 9: Cyclic voltammetric scan of Electrode 1 at varying potential scan rates.
Figure 10: Cyclic voltammetric scan of Electrode 4 at varying potential scan rates.
Page 36
36
As expected based on the Randles-Sevcik equation, the magnitude of the peaks increased as the
potential scan rate increased. This demonstrated that the electrochemical properties of Electrode
1 and Electrode 4 were behaving as would be predicted by the theory behind the
electrochemistry.
4.3.1 Electrode Stability Issues
Once the ideal two titanium electrodes were selected, no further experimentation was
conducted for approximately twelve days. Following that short break, the same experimentation
depicted in Figures 9 and 10 were repeated in order to compare results. These results can be seen
in Figures 11 and 12.
Figure 11: Cyclic voltammetric scan of Electrode 1 at varying potential scan rates after inactivity.
Page 37
37
Figure 12: Cyclic voltammetric scan of Electrode 4 at varying potential scan rates after inactivity.
The biggest observation amongst these Figures is the difference in voltammetric scans for
Electrode 1, shown in Figures 9 and 11. After the inactivity, it appeared that Electrode 1
completely lost its cathodic current peaks and almost entirely lost its anodic current peaks as
well. Because of this, it became apparent that Electrode 1 could no longer be used for
experimentation with glucose. There were two most likely reasons that this drastic change
occurred. The first reason may be that the copper nanoparticles oxidized over time due to
improper storage of the electrode or just overall poor deposition from Method 2. The second
reason could be that the titanium dioxide nanostructures changed their structure over time which
would be the fault of an imperfection during the synthesizing of the titanium electrode before the
copper deposition. When looking at the voltammetric scan of Electrode 4, it can be seen that the
change was much less drastic. While there was a slight change in the magnitude of the anodic
and cathodic peaks, the shape generally remained the same. This ultimately allowed Electrode
Page 38
38
4to be the only electrode synthesized that could be used in the further experimentation of glucose
detection.
4.4 Glucose Detection
With an ideal electrode determined, the voltammetric analyses were no longer conducted
in pure 0.1M NaOH or pure 0.01M PBS, but with glucose-NaOH solutions. The first electrolyte
solution used was 1mM glucose in 0.1M NaOH. The cyclic voltammetric scan of Electrode 4
was run in this solution at two different potential scan rates, -0.8V to 0.3V and -0.6V to 0.4V,
three times in order to ensure stability and reproducibility. The results are shown in Figures 13
and 14.
Figure 13: Repeated Cyclic Voltammetric scan of Electrode 4 in 1mM Glucose-0.1M NaOH solution at -0.8V to 0.3V.
Page 39
39
Figure 14: Repeated Cyclic Voltammetric scan of Electrode 4 in 1mM Glucose-0.1M NaOH solution at -0.6V to 0.4V.
By running each scan three times and seeing the same scan each time, it was demonstrated that
the electrode maintained its stability throughout the experiment. Figure 8 shows a noticeably
greater magnitude of cathodic and anodic current peaks, reaching approximately 0.250x10⁻²
A
and -0.700x10⁻²
A, respectively. These large peaks occur due to the reduction of glucose (or
oxidation in the case of the anodic peak). These figures illustrate the fact that Electrode 4
succeeds at detecting the oxidation and reduction of glucose when it is introduced into the
solution, which is imperative when attempting to monitor glucose levels in patients.
4.4.1 Complications in the Glucose Detection
While the electrode did detect the glucose in the 1mM glucose-0.1M NaOH solution,
some problems arose in the succeeding experiments involving the varying of the glucose
concentration. The 1mM glucose solution was further diluted to 0.5mM glucose with 0.1M
NaOH and cyclic voltammetry was repeated at the two potential ranges, again repeated three
times each for reproducibility. The resulting scans can be seen in Figures 15 and 16.
Page 40
40
Figure 15: Repeated Cyclic Voltammetric scan of Electrode 4 in 0.5mM Glucose-0.1M NaOH solution at -0.8V to 0.2V.
Figure 16: Repeated Cyclic Voltammetric scan of Electrode 4 in 0.5mM Glucose-0.1M NaOH solution at -0.6V to 0.4V.
If the electrode detected the glucose as expected, then increasing the concentration of glucose
should also increase the magnitude of the current peak. This is proportional correlation is shown
yet again by the Randles-Sevcik equation. However, as it can be seen in the two figures, this
does not occur. By decreasing the concentration of glucose to 0.5mM, most of the peaks either
Page 41
41
stay the same or actually increase in magnitude, as opposed to the expected result of
approximately halving their peaks.
One possible explanation to the phenomenon may be due to inaccurate dilution of the
glucose-NaOH solution. In order to examine the possibility of this fault, new solutions were
made from 10mM glucose and 0.1M NaOH. Once the new glucose solutions were made (this
time 1mM and 5mM glucose), another cyclic voltammetric analysis was conducted in order to
observe the behavior of increasing glucose concentration. These glucose concentrations were
chosen to observe the effect of a five-fold increase in concentration as opposed to the two-fold
increase in concentration used before. The analysis was run at a new potential scan rate in order
to account for any abnormalities that may have occurred as a result of the low potentials. The
result is seen in Figure 17.
Figure 17: Cyclic voltammetric scan of Electrode 4 in varying glucose concentrations.
Page 42
42
Once again, the expected trend is that increasing the glucose concentration would increase the
current peak. However, as it can be seen, the cathodic peak stays roughly the same while the
anodic peak decreases when the glucose concentration is increased. While this nullifies the claim
that improperly made solutions caused the unpredicted trend, it brings forth the idea that the
titanium electrode itself may have a defect that caused this occurrence.
Page 43
43
5. Conclusions and Recommendations
The results in the previous section demonstrates that although the electrode did not react
fully as expected in the detection of increasing glucose levels, many of the preliminary results
were successful. Each of the 9 titanium foil pieces underwent the anodization and copper
deposition processes and resulted in the expected formation of the titanium electrodes. The cyclic
voltammetric experiments determined that Electrodes 1 and 4 were the most effective at
developing strong cathodic and anodic current peaks. Once glucose was introduced into the
electrolyte, the electrode also proved to be effective as detecting glucose, as could be seen by
that change in peak between the pure NaOH electrolyte experiments and the glucose-NaOH
electrolyte experiments.
However, while the electrode did succeed in detecting glucose, it did not follow the
trends that the Randles-Sevcik equation predicted. Instead of the current peak increasing with the
increasing concentration of glucose, the electrode acted inversely. Whether this was due to
poorly formed electrodes or improperly made electrolyte solutions was not determined. Another
issue that arose was the instability of the electrodes. Electrode 1 changed so drastically after
inactivity that it could not be used for glucose detection; even the final electrode, Electrode 4,
altered over the inactivity, although not nearly to the same extent as Electrode 1.
In continuing this research, there are three vital recommendations to follow in order
ensure that electrodes work as expected. The first is to confirm that every electrolyte solution is
made properly. Each of the solution made for this research were made by weighing out dry
glucose and mixing it into aqueous NaOH or PBS solution to result in the desired concentration.
However, human error may have been the cause for the results coming out not quite as expected.
Page 44
44
The second recommendation is to perform each experiment over a shorter period of time.
Due to time constraints, the entirety of the experiment was spread out over the course of more
than three months, including a twelve day period of total inactivity. This time span may have
caused the electrodes to lose their effectiveness over time. As an alternative to this
recommendation, experimentation to increase the stability of these electrodes can also prove to
be vital in developing effective electrodes.
The final recommendation is to perform a greater number of glucose detection tests on
the electrodes. The electrodes in this study were only tested in a few electrolyte solutions of
differing glucose concentrations. By testing a wider range of glucose concentrations (as well as
having more electrodes to test), it can be determined whether the trend found in the results of this
study was a chance phenomenon or if every electrode would follow this same trend. This would
result in an electrode that would be more effective at detecting low levels of glucose.
There are alternative ways that continuous glucose monitoring can be studied. As
mentioned before, different combinations materials and nanoparticles can be used as biosensor
electrodes to affect the efficiency of detecting glucose. If titanium desired to be the main metal
of interest, then different nanoparticles, such as gold or silver, can be deposited on the surface.
Alternatively, different metals, such as platinum, can be studied to see how well it can be used to
detect glucose.
Overall, reducing human error, reducing inactivity, and increasing the number of
experiments would all be very beneficial in determining whether or not copper-deposited
titanium dioxide electrodes can efficiently be used as biosensors to aid in continuous glucose
monitoring. However, regardless of the selectivity of the electrode towards glucose, many more
tests must be done before it can be successfully used as an implantable biosensor. It is not
Page 45
45
enough for the biosensor to detect glucose, but it needs to be able to be to remain stable in the
conditions that are present in the human body to test if the conditions will affect the efficiency of
the biosensor. Also, it needs to be ensured the body’s immune system will not attack and break
down the biosensor too quickly. These in vivo requirements of the biosensor will also need to be
tested once the selectivity towards glucose is at a desired level.
Page 46
46
References
1. Adal, Adefris. Heavy Metal Toxicity. Medscape. 2014. Retrieved from
http://emedicine.medscape.com/article/814960-overview.
2. American Brain Tumor Association (ABTA). Glioblastoma and Malignant Astrocytoma.
ABTA. 2014. Retrieved from http://www.abta.org/secure/glioblastoma-brochure.pdf.
3. American Diabetes Association (ADA). Gestational Diabetes Mellitus. Diabetes Care.
2003. 26(1): s103-5.
4. Andrews, Samantha. Biosensors. National Science Foundation. 2011.
5. Bleeker, Fonnet E., Molenaar, Remco J., and Leenstra, Sieger. Recent advances in the
molecular understanding of glioblastoma. Journal of Neuro-Oncology. 2012. 108(1): 11-
27.
6. Bruce, Jeffrey N. Glioblastoma Multiforme Treatment & Management: Medical Care.
Medscape. 2014. Retrieved from http://emedicine.medscape.com/article/283252-
treatment.
7. Carter, Perry. Microbial Metabolism: Carbohydrate Catabolism. Midlands Technical
College. Retrieved from
http://classes.midlandstech.edu/carterp/Courses/bio225/chap05/ss4.htm.
8. Champ, C. E., et al. Targeting metabolism with a ketogenic diet during the treatment of
glioblastoma multiforme. Journal of Neuro-Oncology. 2014. 117(1): 125-31.
9. Chase, H. Peter and Banion, Carolyn. Low Blood Sugar. University of Colorado Denver.
Retrieved from
http://www.ucdenver.edu/academics/colleges/medicalschool/centers/BarbaraDavis/Docu
ments/book-understandingdiabetes/ud06.pdf.
10. Cosnier, Serge et al. Mesoporous TiO2 Films: New Catalytics Electrode Materials for
Fabricating Amperometric Biosensors Based on Oxidases. Electroanalysis. 1997. 9(18):
1387-92.
11. Cui, Hui-Fang, et al. Selective and sensitive electrochemical detection of glucose in
neutral solution using platinum-lead alloy nanoparticle/carbon nanotube nanocomposites.
AnalyticaChimicaActa. 2007. 594(2): 175-83.
12. Diabetes Health Center (DHC). How and When to Test Your Blood Sugar With Diabetes.
WebMD. Retrieved from http://www.webmd.com/diabetes/how-test-blood-glucose.
13. Dubrow, Robert, et al. Time trends in glioblastoma multiforme survival: the role of
temozolomide. Neuro-Oncology. 2013. 15(12): 1750-1761.
Page 47
47
14. Dugdale, David C., III. Focal neurological deficits. Medline Plus. 2011. Retrieved from
http://www.nlm.nih.gov/medlineplus/ency/article/003191.htm.
15. Dugdale, David C., III. Lactic acid test. Medline Plus. 2011. Retrieved from
http://www.nlm.nih.gov/medlineplus/ency/article/003507.htm.
16. Evans, Catherine. TCGA Scientists Discover Four Distinct Subtypes of Glioblastoma
Distinguished by Gene Expression Patterns and Clinical Characteristics. The Cancer
Genome Atlas. 2011. Retrieved from
http://cancergenome.nih.gov/researchhighlights/researchbriefs/foursubtypes.
17. Gregory, Michael. Cellular Respiration. SUNY: CCC. Retrieved from
http://faculty.clintoncc.suny.edu/faculty/michael.gregory/files/bio%20101/bio%20101%2
0lectures/cellular%20respiration/cellular.htm.
18. Haldeman-Englert, Chad. Von Gierke disease. Medline Plus. 2013. Retrieved from
http://www.nlm.nih.gov/medlineplus/ency/article/000338.htm.
19. Hirschhaeuser, Franizska, Sattler, Ulrike G.A., and Mueller-Klieser, Wolfgang. Lactate:
A Metabolic Key Player in Cancer. Cancer Research. 2011. 71(22): 6921-5.
20. Ikeda, Shoichiro et al. Development of a needle-type glucose sensor based on titanium
dioxide oxygen electrode for the artificial pancreas. Sensors and Actuators B: Chemical.
1993. 13(1-3): 315-8.
21. Jelluma, Nannette, et al. Glucose Withdrawals Induces Oxidative Stress followed by
Apoptosis in Glioblastoma Cells but not in Normal Human Astrocytes. Molecular Cancer
Research. 2006. 4(5): 319-30.
22. Jiao, J. T., et al. Metabolic syndrome factors and risk of postoperative depression in high-
grade glioma patients in a 1.5 year prospective study. Medical Oncology. 2014. 31(10).
23. Jin, Changchun and Chen, Zhidong. Electrocatalytic oxidation of glucose on gold-
platinum nanocomposite electrodes and platinum-modified gold electrodes. Synthetic
Metals. 2007. 157(13-15): 592-6.
24. Khan, Shahed U. M. Uses Non-reactive Semiconductor Measurement Electrode.
Duquesne University, assignee. Patent US 5387327 A. 1995.
25. Kokkinidis, G. and Xonoglou, N. Catalysis of the oxidation of monosaccharides on the
platinum surfaces modified by underpotentialsubmonolayers. Bioelectrochemisty and
Bioenergetics. 1984. 12(5-6) 485-98.
26. Kotanen, Christian, N., et al. Implantable enzyme amperometric biosensors. Biosensors
and Bioelectronics. 2012. 35: 14-26.
Page 48
48
27. New World Encyclopedia. Glucose. 2008. Retrieved from
http://www.newworldencyclopedia.org/entry/glucose.
28. North American Spine Society (NASS). Magnetic Resonance Imaging (MRI).
KnowYourBack. Retrieved from
http://www.knowyourback.org/Pages/Treatments/AssessmentTools/MRI.aspx.
29. Ozcan, L., Sahin, Y., Turk, H. Non-enzymatic glucose biosensor based on
overoxidizedpolypyrrole nanofiber electrode modified with cobalt(III)
phthalocyaninetetrasulfonate. Biosensors and Bioelectronics. 2008. 24(4): 512-7.
30. Park, S., Boo, H., and Chung, T. D. Electrochemical non-enzymatic glucose sensors.
AnalyticaChimicaActa. 2006. 556(1): 46-57.
31. Rahman, Mahbubur et al. A Comprehensive Review of Glucose Biosensors Based on
Nanostructured Metal-Oxides. Sensors. 2010. 10(1): 4855-86.
32. Reusch, William. Carbohydrates. Michigan State University. 2013. Retrieved from
https://www2.chemistry.msu.edu/faculty/reusch/virttxtjml/carbhyd.htm.
33. Robertson, Sally. What are Biosensors? News-Medical. 2014. Retrieved from
http://www.news-medical.net/health/Biosensors-What-are-Biosensors.aspx.
34. Sanvicens, Nuria et al. Nanoparticle-based biosensors for detection of pathogenic
bacteria. Trends in Analytical Chemistry. 2009. 28(11): 1243-52.
35. Setford, Steven J. and Newman, Jeffrey D. Enzyme Biosensors. Methods in
Biotechnology: Microbial Enzymes and Biotransformations. 2005. 17: 29-60.
36. Shankar, Karthik et al. Highly-ordered TiO2 nanotube arrays up to 220 µm in length: use
in water photoelectrolysis and dye-sensitized solar cells. Nanotechnology. 2007. 18(6).
37. Stark, Andreas M., et al. Glioblastoma multiforme—report of 267 cases treated at a
single institution. Surgical Neurology. 2005. 63(2): 162-9.
38. Wang, Kathy. The use of titanium for medical applications in the USA. Materials Science
and Engineering. 1996. 213(1-2): 134-7.
39. Warburg, Otto. On the Origin of Cancer Cells. Science. 1956. 123(3191): 309-14.
40. Wickramasekera, Nadi. Cancer Cell Metabolism. Roswell Park Cancer Institute.
Retrieved from
https://www.roswellpark.edu/sites/default/files/wickramasekera_9_24_13.pdf.
Page 49
49
41. Wittstock, Gunther, et al. Glucose oxidation on bismuth-modified platinum electrodes.
Journal of Electroanalytical Chemistry. 1998. 444(1): 61-73.
42. Yee, Gloria and Klonoff, David, C. Monitoring Technologies—Continuous Monitoring,
Biomarkers of Control, Artificial Pancreas. Diabetes Manager. 2010.
43. Yin, Longwei et al. Ti/TiO2 Nanotube Array/Ni Composite Electrodes for Nonenzymatic
Amperometric Glucose Sensing. Journal of Physical Chemistry C. 2010. 114(1): 4408-
13.
44. Yoo, Eun-Hyung and Lee, Soo-Youn. Glucose Biosensors: An Overview of Use in
Clinical Practice. Sensors. 2010. 10(1): 4558-76.
45. Yun, Yeo-Heung, et al. Tiny Medicine: Nanomaterial-Based Biosensors. Sensors. 2009.
9(11): 9275-99.
46. Zhang, Xin et al. Partial oxidation of glucose by a Pt|WO3 electrode. Journal of
Electroanalytical Chemistry. 1997. 430(1-2): 147-53.


![Titanium dioxide and modified titanium dioxide by silver ...cdmf.org.br/wp-content/uploads/2019/02/Titanium-dioxide...zinc oxide [6,7], titanium dioxide [8,9], hydroxyapatite and chlorhexidine,](https://static.documents.pub/doc/80x56/60ff91e8d40a2e46c9475976/titanium-dioxide-and-modified-titanium-dioxide-by-silver-cdmforgbrwp-contentuploads201902titanium-dioxide.jpg)


