NASA Technical Memorandum TM 102784 Continuous Hydroponic Wheat Production Using A Recirculating System C. L. Mackowiak L. P. Owens C. R. Hinkle The Bionetics Corporation, Kennedy Space Center, Florida R. O. Prince NASA Biomedical Operations and Research Office, Kennedy Space Center, Florida September 1989 National Aeronautics and Space Administration John F. Kennedy Space Center https://ntrs.nasa.gov/search.jsp?R=19900009537 2018-04-30T18:24:39+00:00Z
Transcript
NASA Technical Memorandum TM 102784
Continuous Hydroponic Wheat ProductionUsing A Recirculating System
C. L. Mackowiak
L. P. Owens
C. R. Hinkle
The Bionetics Corporation, Kennedy Space Center, Florida
R. O. Prince
NASA Biomedical Operations and Research Office, Kennedy Space Center, Florida
I1. MATERIALS AND METHODS ..............................................................................
III.
IV.
A. Environment ....................................................................................................
B. Nutrient Solution Delivery System .............................................................C. Nutrient Solution ............................................................................................
D. Solution and Air Sampling ...........................................................................E. Seed Germination .........................................................................................F. Harvests ...........................................................................................................
G. Statistical Analyses .......................................................................................
V. APPENDIX ...............................................................................................................VI. REFERENCES .........................................................................................................
PAGE
,,°
III
iv
V
vi
14
4445
11111212
1313283031
404O42
4547
ABSTRACT
Continuous crop production, where plants of various ages are growingsimultaneously in a single recirculating nutrient solution, is a possiblealternative to batch production in a Controlled Ecological Life Support System(CELSS). A study was conducted at John F. Kennedy Space Center (KSC)where 8 trays (0.24 m2 per tray) of Triticum aestivum L. "Yecora Rojo" were
grown simultaneously in a growth chamber at 23oc, 65% relative humidity,1000 ppm CO2, continuous light, with a continuous flow, thin film nutrient
delivery system. The same modified Hoagland nutrient solution wasrecirculated through the plant trays from an 80 L reservoir throughout the study.It was maintained by periodic addition of water and nutrients based on chemical
analyses of the solution. The study was conducted for 216 days, during which24 trays of wheat were consecutvely planted (one every 9 days), 16 of whichwere grown to maturity and harvested. The remaining 8 trays were harvested
on day 216. Grain yields averaged 520 g m-2, and had an average edible
biomass of 32%. Consecutive yields were unaffected by nutrient solution age.It was concluded that continual wheat production will work in this system overan extended period of time. Certain micronutrient deficiencies and toxicitiesposed problems in this study and must be addressed in future continuousproduction systems.
LIST OF TABLES
TABLE PAGE
1234567890123
Comparison of HydroponicSolutions........................................................... 3Chamber and Environmental Parameters ................................................... 6ExperimentalSolutionA..................................................................................9Solution Electrical Conductivity/Elemental Correlations........................... 15Mass Balance Budget for Entire Study.........................................................19Wheat Harvest Data Summary (per tray) .....................................................32Wheat HarvestData SummaryContinued................................................... 33HarvestCorrelationsof Wheat Trays at Maturity......................................... 34Growth Data From Final Harvest (multipleages)........................................ 35Total Dry Matter From Final Harvest (multipleages).................................. 35Tissue ProximateAnalyses of MatureWheat Plants.................................. 38Tissue Proximate Analyses of Immature Wheat Plants .............................39Comparison of Theoretical and Actual Nutrient Additions ........................ 42
iii
LISTOF FIGURES
FIGURE PAGE
123456789
101112131415161718192021222324
25
262728293031
System Layout................................................................................. 7Hydroponic Wheat Tray ................................................................. 8Stand Pipe Level Indicator............................................................ 10Solution pH......................................................................................14ElectricalConductivity.................................................................... 14Nitrate-nitrogenConcentrations................................................... 16Nitrate-nitrogenAcumulations...................................................... 16Phosphate-phosphorous Concentrations .................................. 18Phosphate-phosphorous Acumulations ..................................... 18Potassium Concentrations ............................................................20Potassium Acumulations ...............................................................20Calcium Concentrations ................................................................21Calcium Acumulations ...................................................................21MagnesiumConcentrations.......................................................... 22MagnesiumAcumulations............................................................. 22Iron Concentrations ........................................................................24Iron Acumulations ...........................................................................24Manganese Concentrations .........................................................25Manganese Acumulations ............................................................25Copper Concentrations .................................................................26Copper Acumulations ....................................................................26Zinc Concentrations .......................................................................27Zinc Acumulations ..........................................................................27Viable Counts of Total Microorganisms and TotalFungi in the Atmosphere of the EGC During theContinuous NFT Hydroponic Cultivation of Wheat................... 28Viable Counts (nutrient agar) of TotalMicroorganisms in the NFT Nutrient Solution Duringthe Continuous Hydroponic Cultivation of Wheat..................... 29Daily Water Usage by the System............................................... 30LeafArea Ratio (LAR)Over Time................................................. 36Single Plant Leaf Area Over Time............................................... 36Dry Weight Per Plant Over Time ..................................................37PlantHeight Over Time.................................................................. 37Photosynthetic Energy Conversion Efficiency Over Time....... 37
iv
ACKNOWLEDGMENTS
This project was conducted under the direction of Dr. William M. Knott III,Biological Sciences Officer, Life Sciences Research Office, and Dr. Albert M.Koller, Jr., Chief Programs and Planning Office, Biomedical Operations andResearch Office, John F. Kennedy Space Center under NASA Contract No.NAS10-10285.
The authors gratefully acknowledge the valuble comments and suggestions ofDr. John C. Sager, NASA Biomedical Operations and Research Office, and Dr.
Raymond M. Wheeler, The Bionetics Corp. We also appreciated the assistanceof the following people, Dr. Richard F. Strayer for microbial monitoring, TeresaL. Englert for inorganic chemical analyses, and Peter V. Chetirkin for computerprogramming.
PRODUCT DISCLAIMER
This report, in whole or in part, may not be used to state or imply theendorsement by NASA employees of a commercial product, process or service,or used in any other manner that might mislead.
vi
I. INTRODUCTION
The National Aeronautics and Space Administration (NASA) Controlled EcologicalLife Support System (CELSS) Program is a long range program of research andengineering with a goal to understand how life can be maintained in autonomoussystems during long duration spaceflights and extraterrestrial habitations. Thisprogram draws upon all aspects of the scientific community for information needed toaccomplish a working CELSS. It includes the utilization of research data accumulatedover the past twelve years by active NASNCELSS grant research efforts and theapplication of previous biological and physical data collected from various projects.
MacElroy and Bredt (1984) described the components of a CELSS and discussedsystem control and bioregenerative life support in relation to reservoirs and buffers in aspace environment. In a conceptual design option study of a CELSS, Oleson andOlson (1986) found that a volume of 56.9 m 3 per crew member will be required forgrowing crops, support equipment and access. Tibbitts and Alford (1982) comparedthe uses of various higher plants in a CELSS and developed a list of the mostpromising crop species.
The CELSS Kennedy Space Center Breadboard Project (Biomedical Operations andResearch Office, 1986) is designed to provide containment, hardware, subsystems,designs and cultural techniques for the production of biomass and oxygen, thepreparation of food and the processing of wastes in a controlled, recycling system.The project as conceived, will test and operate a "breadboard" facility to accomplishproof-of-concept evaluation. It will characterize system operations, mass budgets andenergy budgets. The biomass production component is currently receiving major effortin the CELSS Breadboard Project. A large sealed biomass production chamber(BPC) has been constructed to supply information on the following factors:
- power requirements- space (area and volume) requirements- atmospheric environment and contaminant control- propagation methods- crop nutrition- delivery and maintenance of hydroponic solutions- root zone environment control
- crop production management systemsMany of these factors are presently under study. The components will function in anopen loop at first, and in a more closed condition as knowledge is gained and fundspermit.
The first crop to be grown in the BPC will be wheat. There is extensive literature on its
culture and nutritional composition. According to Hoff et al. (1982), it ranks high inboth nutritional and cultural criteria in comparison with other conventional ci'ops.There has also been extensive environmental chamber work by Bugbee andSalisbury (1985a, 1985b, 1987a and 1987b) using wheat in hydroponic systems in theareas of photoperiodism, integrated photosynthetic photon flux (PPF) and temperatureeffects on yield.
Hydroponics is being used in the CELSS Breadboard Project to deliver nutrients to theroots of plants. Jones (1983) defines hydroponics as a nutrient solution deliverysystem which does not contain any organic or inorganic media for plant support.Hydroponics minimizes problems such as clogged irrigation nozzles, cleaning ofculture media between crops and allows for more precise control of the root zoneenvironment.
The breadboard project is using nutrient film technique (NFT) for distribution of thenutrients to the crop. Not only does this minimize the total weight of the hydroponicsystem, the rapid flow of the solution over the roots and the increased surface areaalso circumvent the need to aerate the hydroponic solution.
There are endless numbers of nutrient solutions and modified versions thereof, whichhave been published in the past 50 years. The University of California (Berkeley)agricultural experimental research station bulletin by Hoagland and Arnon (1938) isrecognized as the basis for many formulations currently being used by investigatorsand commercial firms (Table 1). Depending on the species and environmentalconditions, adjustments to the recipe are frequently made for improved growth.Fertilizer mixes, such as Peter's Hydrosol (1987) are commonly used in industrybecause they are ready-made. The slightly lower salt concentrations in Hydrosol alsoallow for nutrient manipulation as needed for the culture of a wide variety of plants.However, copper and zinc concentrations are well above the average found in manyother nutrient solutions (Table 1). For reasons of quality control and the need tomodify constituents, many researchers do not use commercial mixes.
Bugbee and Salisbury (1985a) modified the Hoagland/Arnon formula to grow wheathydroponically under high irradiance and elevated CO2 environments. The relativelylow mobility of boron (Baker 1983), calcium and magnesium lead to an increasing oftheir concentrations in the nutrient solution (Table 1, Column 4). Lowering thephosphorous concentration allowed for an increase in iron uptake by the plants.Bugbee and Salisbury (1985a) added silica to their solution to minimize micronutrienttoxicity symptoms. In addition, silica was added to their solution, in part, as a means tominimize micronutrient toxicity symptoms. Vlamis and Williams (1967) mention similarfindings in work with other grasses. With these considerations, the breadboard projectused a modified nutrient solution recipe following the macronutrient concentrations ofHoagland and Arnon (1938) and the micronutrient concentrations of Bugbee andSalisbury (1985a) Table 1, Column 5.
System stability and efficiency are paramount in the functioning of a CELSS system.Continuous use of a recirculating nutrient solution would be an efficient approach andwould promote system stability by avoiding large swings in nutrient uptake in responseto plant age. In a study using models for a lunar life support ecosystem, Rummel andVolk (1986) concluded that a large number of small batch growouts, started at timelyintervals can improve nutrient reservoir stability and CO,water condensateefficiencies. Unfortunately, published research is scarce concerning the effects ofusing a single nutrient solution with plants of different ages. Prince et al. (1981)successfully grew lettuce in a controlled environment on a continuous basis.However, they replaced the solution at weekly intervals rather than using the samenutrient solution over the course of the experiments.
2
Table 1. Comparison of Hydroponic Solutions
Hoagland Peter's Salisbury Experimental#1 Hydrosol Bugbee Solution A
Element (mM) (mM) (mM) lmM)N 15.0 3.6 15.0 15.0
P 1.0 1.5 0.2 1.0
K 6.0 5.4 3.0 6.0
Ca 5.0 * 12.0 5.0
Mg 2.0 1.3 4.0 2.0
S 2.0 1.2 2.0 2.0
(uM) (uM) (uM) (uM)Fe 50.0 50.0 100.0 100.0
Si ........ 300.0 300.0
B 46.0 46,0 80.0 80.0
Mn 9.0 9.0 8.0 8.0
Zn 0.8 2.3 0.8 0.8
Cu 0.3 2.4 0.3 0.3
Mo 0.5 1.0 0.1 0.1
*Ca is added separately to desired concentration as Ca(NO3)2.
Continual reuse of the nutrient solution for cropping is an important means ofconserving water in a CELSS since the treatment of spent nutrient solution would becostly in terms of equipment, energy and space. In a recirculating system, water andnutrients need to be replaced as they are removed by the crop but the reservoirvolume and constituents should remain constant. As with multi-aged plant systems,there are few accounts in the literature concerning growth and yield effects of usingcontinuously maintained nutrient solutions for successive, long-term cropping.Preliminary, unpublished Breadboard Project studies have found no significantdifferences in wheat yields when growing three consecutive batches on the samenutrient solution.
Many of the Breadboard Project wheat studies have used elevated atmospheric 002
concentrations, i.e. >350 ppm, as a means to increase biomass production. Strain(1978) reported that CO 2 enrichment tends to increase lateral branching and increase
3
seed yield in wheat, while Sionit et al. (1981a) reported increased total dry weight,numbers of tillers and number of heads when CO2 was elevated from 350 ppm to 1000ppm. In addition the weight and number of seeds grown with elevated CO2concentrations were significantly greater. Sionit et al. (1981b) studied the effects ofelevated CO2 at different levels of mineral nutrition. Wheat grown with 675 ppm CO2continued increasing in seed weight and number as the Hoagland solutionconcentration was increased from 1/16 to 1/2 strength. However, no gain resulted inusing Hoagland solution at the full strength concentration.
In preparation for plant growth experiments inside the BPC, a study was conducted todetermine if wheat could be grown hydroponically in a continuous mode of productionusing an elevated CO2 environment. A recirculating system containing a constantvolume of solution, which would be maintained only through replenishment ofnutrients and water, was also evaluated.
The major objectives of the study were:1. Use a hydroponic NFT system to maintain a continuous production of wheat
for 216 days (16 cycles).2. Monitor and control biological conditions in order to determine effects of
nutrient solution age on successive wheat yields.3. Create a plant growth curve and determine water and nutrient budgets
associated with the system.
I1. MATERIALS AND METHODS
A. Environment
A semi-dwarf cultivar of spring wheat (Triticum aestivum L.), 'Yecora Rojo', was usedin the study. It is grown commercially in the San Joaquin and Imperial valleys ofCalifornia and Qualset et al. (1985) mention its good protein content, good milling andexcellent baking qualities. Bugbee and Salisbury (1985a, 1985b, 1987a and 1987b)used this cultivar in numerous CELSS related studies. Our study was conducted in a1.8 m x 2.4 m walk-in growth chamber (EGC) 1. The radiation was provided by acombination of 30 Vitalite fluorescent lamps (F96T12/Vitalite/1500) 2 and 16 standard,
frosted incandescent bulbs (60 watt). The atmospheric CO 2 was monitored andcontrolled at 1000 I_mol mo1-1 using an ANARAD (AR 500) infrared gas system 3.Growth chamber conditions are given (Table 2).
B. Nutrient Solution Delivery System
Solution was delivered from a single reservoir utilizing two submersible, centrifugalpumps 4, one for each side of the chamber. Each pump delivered solution to four
trapezoidal-shaped PVC trays (51 mm deep). Solution was pumped from thereservoir, through a 64 I_M filter via 1.3 cm ID CPVC pipe, to a manifold which
1Environmental Growth Chambers, Chagrin Falls, OH2Durotest, North Bergin, NJ
3ANARAD, San Diego, CA
4Dayton Electric Mfg. Co., Chicago, IL4
distributed flow to the four trays (Fig 1). From the manifold it passed through a valvemounted at the front of each tray, then to an emitter mounted inside the back of eachtray. Each emiter consisted of a 1.3 cm ID CPVC pipe with a series of 0.2 cm holesalong its length and a cap at the end (Fig 2). The solution entered the tray via theseholes and flowed by gravity at a rate of 1.0 L min-1to a drain at the other end of thetray, exited and returned to the reservoir via a 2.5 cm ID PVC pipe. The plant supporttops were constructed from extruded "tee" strips of PVC with black/white polyethylenewings (Fig 2). Cages constructed of black plastic netting stretched across a white PVCframework, provided vertical support for the growing plants (Fig 1).
C. Nutrient Solution
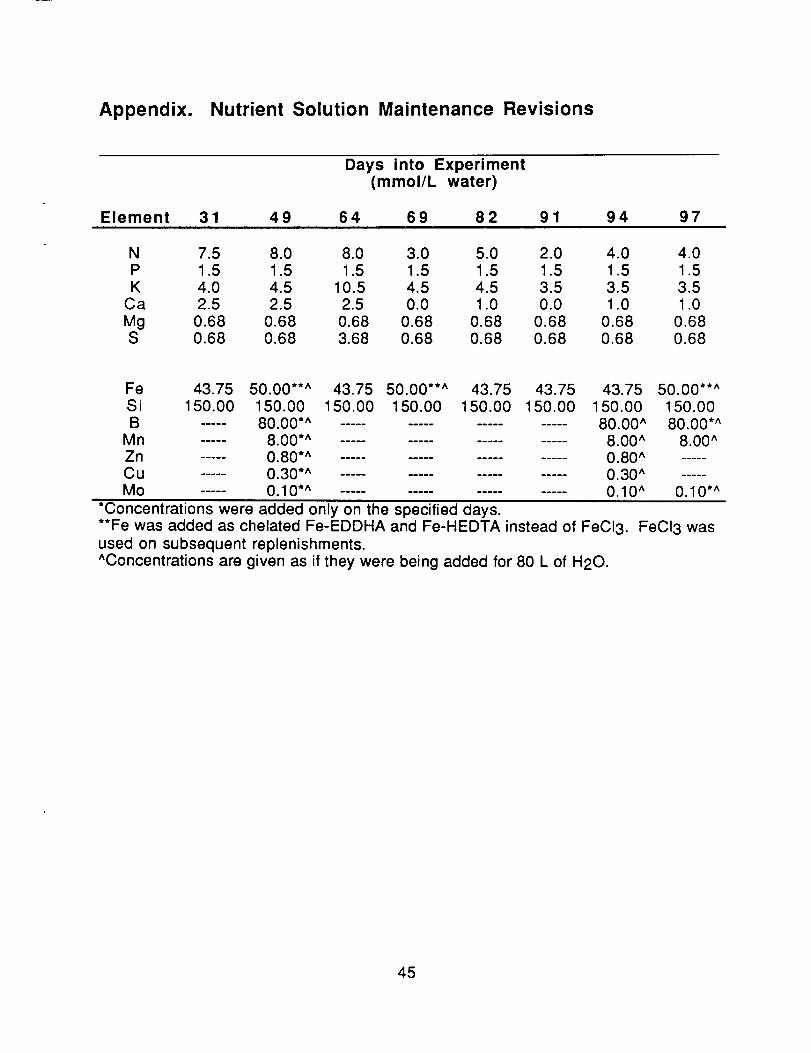
The experimental solution "A" used in this study was a combination of Hoagland'smacronutrient concentrations and Salisbury/Bugbee micronutrient concentrations(Table 1). Nutrients were added to the reservoir every three days from stock bottlescontaining 1M concentrations of the various salts. The replacement of nutrients to thereservoir was based on the estimated millimoles of each nutrient depleted per liter ofwater used in the system over each 3-day period (Table 3). Iron chelates (Fe-HEDTAand Fe-EDDHA) and the other micronutrients were added at full strengthconcentrations every 14 days. The estimated daily depletion values of the nutrientswere calculated from the solution chemical analysis of wheat grow-out studies donepreviously for the breadboard project. Concentrations of Mo, B, Si and S were notdetermined. Ongoing chemical analysis of the solution and general crop appearancewere the basis for nutrient adjustments in this study. A chronological listing of theadjustments is given in the Appendix. Control of the solution pH (between 5.5-6.0units) was automated using a pH controller and 10% (v/v) nitric acid. Daily monitoringof the solution's temperature and the dissolved oxygen (for the first 50 days of theexperiment) presented variations of less than 10% per week. It was decided tocontinue recording these values at weekly intervals, rather than daily. The level ofnutrient solution in the reservoir was monitored by using a stand pipe level indicator(transparent siphon tube, Fig 3). The solution volume was maintained by dailyaddition of deionized water to a predetermined mark on the level indicator.
D. Solution and Air Sampling
Samples of the nutrient solution were collected for inorganic chemical analyses andbacterial counts. For the chemical analyses, three (125-ml) replicates of nutrientsolution were removed from the reservoir prior to and following each replenishingexercise (every three days). Analytic methods were as follows:
* Added as full strength concentrations every 14 days.
Fig 3. STAND PIPE LEVEL INDICATOR
10
The nutrient delivery system's filters had mesh covered cores, which were cleanedevery four weeks. The cores were rinsed with deionized water, to remove particulatematter, before being placed back into the filter bodies. For determination of total viablebacterial counts, the solution was sampled twice a week. A sterile 10 ml test tube wasaseptically filled with 5 ml of nutrient solution directly from the reservoir. The samplingprocedure entailed three replicates. Serial (ten-fold) dilutions were made into sterileisotonic (phosphate-buffered) saline solution. Subsamples (0.1 ml) of appropriatedilutions were spread onto nutrient agar media for enumeration. Viable counts weremade after two to four days of incubation at 28oC. Counts were expressed as colonyforming units (CFU) per ml. Atmospheric sampling for bacterial and fungal counts wasperformed twice per week. A Matson-Garvin slit-to-air (STA) sampler was used tocollect air samples directly onto the surface of trypticase soy (TSA), for total viablemicroorganisms and inhibitory mold (IMA) for total viable fungi agar media. Flow rateof the sampling device was 1 ft 3 min -1. The sampling period lasted five minutes, inwhich time three replicates were collected.
E. Seed Germination
Four days prior to planting, 'Yecora Rojo' wheat seed were surface sterilized for 15minutes in a 3000 ppm formalin solution as suggested by Smilanski (1986). Theseeds were then cold treated (4 days at 6oC) before planting 350 onto a tray top. Theplanted tray top was placed into the chamber (position #1, Fig 1) and attached to thenutrient delivery system. Two liters of solution were placed in the tray bottom, where itremained for six days. Trays were covered with germination hoods constructed of 0.25inch white plexiglass. Each hood was 1" deep and had a lip running around theperimeter to overlap the tray bottom (Fig 2). The inside surface was covered by a layerof fiberglass screen. Both seeds and screen were sprayed with deionized water priorto placing the hood on the tray. On Day 4 the germination hood was removed andgermination counts recorded. On Day 6 the recirculating solution was started throughthe tray at 1 L min °1. A support cage was placed on the tray two weeks after planting(Fig 1). A new tray was prepared every nine days in the same manner describedabove until all eight positions were filled.
F. Harvests
Harvesting of a tray occurred on Day 72 and every nine days thereafter, (-+ 3 days ). Atharvest the solution flow to the tray was turned off. The tray was removed from thechamber. After measuring the canopy height, the root mat was cut off the stems andthe number of plants counted. Statistically determined variance from previous"in-house' wheat studies warranted the use of 67% of the plants per tray as arepresentive tray sample size. The following items were determined from eachharvest:
- number of primary heads- number of nonprimary heads- number of spikelets per head- number of seeds per head
- seed and straw fresh weights- seed, straw and root dry weights
11
Seed number and dry weights were calculated by taking two 5-gram samples,counting the number of seeds in the samples, drying them at 60oC for 48 hours andreweighing them. All other harvest data were extrapolated from the above values.Individual 100-gram (dried tissue) samples of seed, straw and roots were analyzed bya certified commercial laboratory. The laboratory has approved methods of analysisspecified by agencies such as: AOAC, USDA, USP, FDA, NF, EPA, AOCS and AACC.The seeds were analyzed for K, Ca, Mg, Fe, S, P, Cu, Mn, Zn, water soluble vitamins,sugar, amino acids and fiber. Proximate analyses, which included protein, moisture,fat, ash, fiber, carbohydrate and calories were performed on the seeds, straw androots. The straw and roots were also analyzed for the same elements. Protein wascalculated as N x 6.25. Carbohydrates were figured by subtraction. On the last day ofthe experiment (Day 216) all of the trays were removed from the chamber. Prior totheir removal, light photosynthetically activated radiation (PAR) measurments wererecorded at canopy level and below the canopy of each tray. The oldest tray (63 days)was harvested in the same manner as the previous trays. In order to harvest all eighttrays in a single day, 20% samples were taken rather than 67%. In addition to theaforementioned data, the immature plants had the following data collected;
- individual plant height- number of tillers- leaf area
G. Statistical Analysis
Descriptive statistics were calculated with the STAT80 Interactive Statistics Package s .A correlation analysis was performed to test for linear correlation between conductivityand nutrient concentration and Pearson product moment correlation coefficients andt-statistics calculated. A correlation analysis was also run to test for linear correlationbetween the various harvest parameters. Correlations between water use/conductivityand water use/nutrient use, were also analyzed, although not presented here. Linearregression analyses were run on growth data and confidence bands determined.Linear curves were plotted with Grafit/1000, a graph generation package s .
III. RESULTS
The results have been separated into phases. Phase I covers the experimental start-up (0-72 days), during which time the system was being filled with a seeded tray everynine days until all tray positions were filled. Phase II covers days 73-144, whencontinuous seeding and harvest (every nine days) occurred. Phase III (145-216 days),was when major changes occurred in the replenishment of Mn, due to the appearanceof injury symptoms on the leaves. Phases II and III had some differences in thereplenishment of other salts as well. Information concerning nutrient solutionconstituents, evapotranspiration, plant growth, harvests and tissue analyses isaddressed in this section.
A. Nutrition
5 Statware Inc. Salt Lake City, UT
6 Graphic User System, Inc., Santa Clara, CA
12
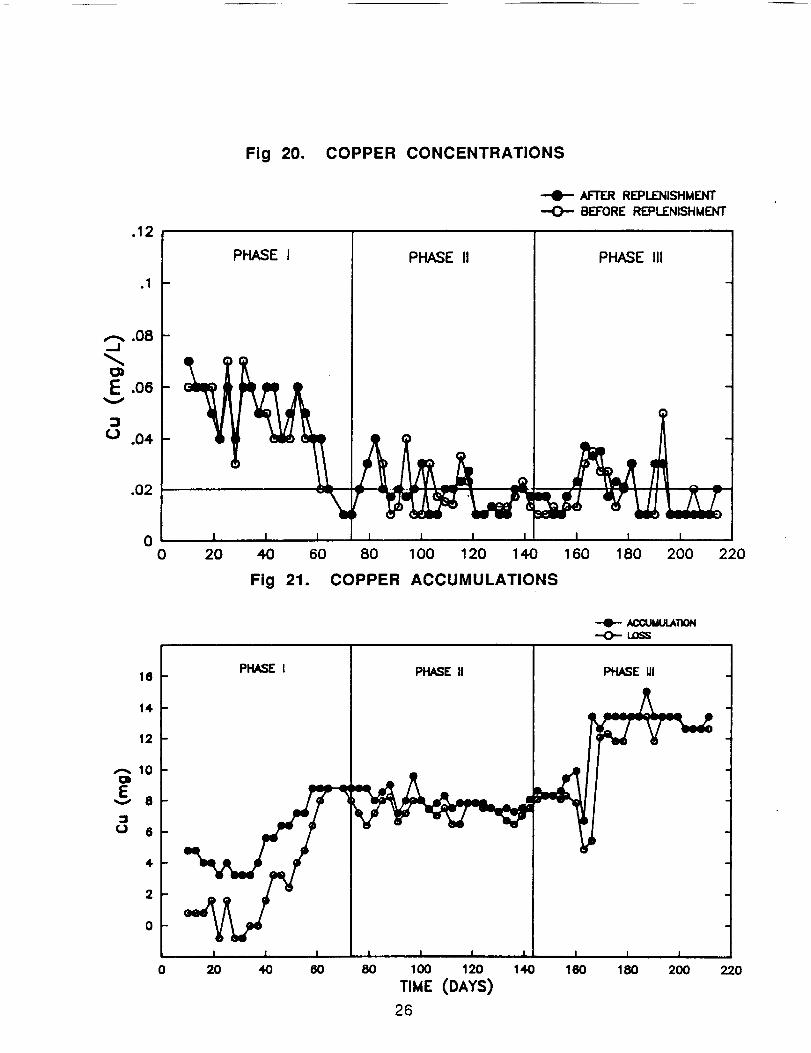
analyses of the nutrient solution. The 'loss' values were calculated by subtracting thenutrient concentration just prior to replenishment from the nutrient concentration rightafter the previous replenishment (3 days before). The 'accumulation' values werecalculated by subtracting the nutrient concentration just prior to replenishment from thenutrient concentration right after replenishment of that same day.
pH
The pH controllers kept the pH relatively uniform throughout the entire study. Valuesrecorded daily from the pH controller were closer to the optimum (5.8) than were thevalues received from the chemistry support laboratory's analyses of the nutrientsolution (Fig 4).
Conductivity
The nutrient solution conductivity was maintained at 2000 _mhos cm -1 throughout thestudy (Fig 5). Most of the variation was during Phase I, when the system's biomasswas increasing. The conductivity correlated best with NO3-N and Ca (CaNO3) 2concentrations (Table 4).
Nitrate-nitrogen
Nitrate-nitrogen concentrations fluctuated during Phase I, while the system wasgaining biomass (Fig 6). Nitrate was added in the form of nitric acid (HNO3) for pHmaintenance, however the amount added in this manner was negligible in relation tothe concentration of NO3-N added during replenishments. Although the NO3-Nconcentration was usually below the desired concentration, it was not considered toaffect the plant growth. From looking at the overlapping accumulation and loss datapoints (Fig 7), the system removed all of the NO3-N that was added as replenishment.
A total of 129.11 g of NO3-N was supplied during the study, with 112.39 g (87%) beingremoved from the system.
Phosphate-phosphorous
Beginning on Day 40, there was a rise in the PO4-P concentration which continued
through Phase II (120 mg L-1 by day 160). At Day 166, the PO4-P replenishment wasreduced by a third (Appendix), which reduced the solution concentration to 26 mg L-1(Fig 8). As shown in Figure 10, the plants removed all of the PO4-P available to them
until Day 60 and also after Day 190. A total of 75.96 g of PO4-P was added to thenutrient solution. Cumulative loss of PO4-P amounted to 74.12 g (98%, Table 5).
The preferred K concentration for this experiment was 234 mg L-1. During Phase I,replenishment of K was too low and resulted in a rapid decrease in solutionconcentration within the first 40 days (Fig 10). On Day 49, K replenishment increasedby 11% (Appendix). Peak concentrations of 319 mg L-1 and 292 mg L-1 occurred ondays 64 and 151, respectively. During Phase II and the early part of Phase III largeamounts of K were depleted from the solution between replenishment days. After Day170, the concentration declined once again because of a reduction in the replenishingsolution (Appendix). Throughout the entire study, 285.61 g of K were added and273.19 g (96%) were removed (Table 5). Between Days 20 and 60 not all available Kwas used (Fig 11 ). For the remainder of the study, the loss was equal to theaccumulation curve. The K concentration had a positive correlation with conductivity(Table 4).
Calcium
Beginning on Day-30, Ca increased from a baseline value of 200 mg L -1 to 300 mg L -1by day 64 (Fig 12). The replenishment was adjusted frequently to obtain properconcentrations by day 100 (Appendix). Calcium remained near the desiredconcentration during Phased III (Fig 12). Looking at Figure 13, Ca depletion seemedto have been a function of how much was available, since the system never removedall that was put back by replenishment. The nutrient solution always had more Cathan was removed from the solution. A total of 105.99 g of Ca were added to thesolution over time, while 89.67 g (85%) were used (Table 5). The Ca solutionconcentration had a positive correlation with the conductivity (Table 4).
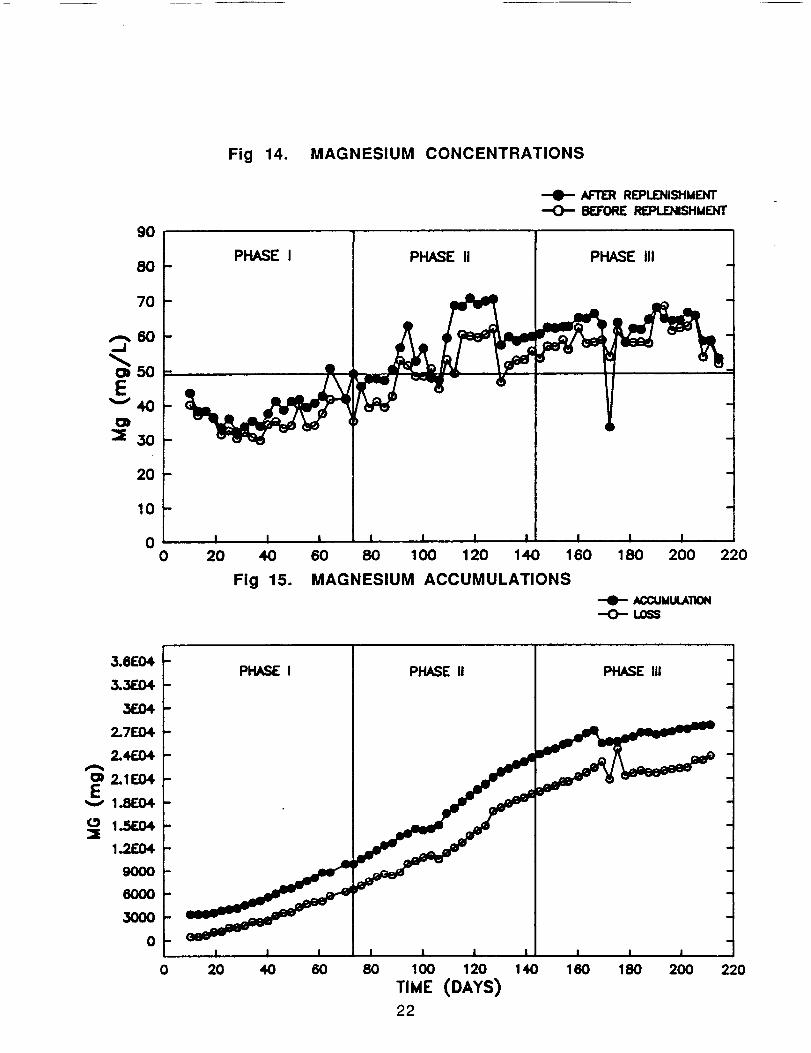
Magnesium
The Mg concentration was to be maintained at 49 mg L °1. Figure 14 shows Mg wasbelow the desired level for most of Phase I. Beginning at Day 70, it increased to levelsabove the baseline during Phase II and remained between 55 and 65 mg L-1 for theremainder of the study. The replenishment concentration was not altered until the last10 days of the study (Appendix). Uptake of Mg appears to be a function of availability(Fig 15). A total of 27.81 g of Mg was put in to the solution with 23.82 g (86%) beingdepleted (Table 5). Mg concentration had a positive correlation with the solutionconductivity (Table 4).
Iron
Fe concentrations in the nutrient solution were to be kept at 5.6 mg L -1. Figure 16shows Fe starting out low and decreasing through Phase I, until Day 90. An increasein the replenisment of chelated Fe-EDDHA and Fe-HEDTA during Phases II and III(Appendix), brought levels closer to the baseline. There were excessive amounts of
Fe at times during Phases II and III on days that chelators were added in place ofFeCI.. The accumulation and loss curves are fairly equivalent (Fig 17), which implies
that the wheat used much of the Fe that was in the solution. A total of 5.75 g was putinto the nutrient reservoir while 5.27 g (92%) was depleted (Table 5). The Feconcentration correlated with the solution conductivity (Table 4).
17
Fig 8. PHOSPHATE-PHOSPHOROUS CONCENTRATIONS
--41-- AFTER REPLENISHMENT--O-- BEFORE REPLENISHMENT
Total biomass (dry matter) produced = 8.44 kgTotal water evapotranspirated = 2430 L
*Excess in plant tissue may have been due to contamination by chamber humidifiers.
4 Analyzed by "in-house" laboratory, The Bionetics Corp., KSC, FL.5 Analyzed by Nutrition International, East Brunswick, NJ.
19
Fig 10. POTASSIUM CONCENTRATIONS
4OO
-O-- AFTER REPLENISHMENT--O- BET'OREREPLENISHMENT
PHASE I PHASE II PHASE III350 -
200 _ _'-v _o _-
10050 _ l
O I I 1 I
0 20 40 80 80 100 120 140 160 180 200 220
Fig 11. POTASSIUM ACCUMULATIONS
--.e-- ACCUMULATION-O-lOSS
3E05
2.7E05
2-4E05
2.1 E05
_'_ 1.8F.05OD
E 1.,._EOS
v 1.2E05
9E04
8E04.
3F.04.
0
0 20
PHASE I PHASE II PHASE III
40 80 80 100 120 140 180 180 200 220
TIME (DAYS)
20
Fig. 12. CALCIUM CONCENTRATIONS
4,5O
AFTER REPLENISHMENT
--CP- BEFORE REPLENISHMENT
PHASE I PHASE II PHASE Iil400-
,_, 3oo
'_ 250 ,=_/_ a "
Ev 200 _- - _ "o
(") 150 -
100
50 _-
0 !
0 20I I I ! I I I I I
40 60 80 100 120 140 160 180 200
Fig 13. CALCIUM ACCUMULATIONS
ACCUMUtATi0N
-O-LOSS
220
1.22E05
1.098E05
9.76E04.
8.54E04
oD 7.32E04.E
6.1E04,
00 4.88E04
3.66E04
2.4.4,1104.
1.22E04.
0
0 2o
PHASE I PHASE II PHASE III
I I I I
40 60 80 1O0 120 140 160 180 200
TIME (DAYS)
21
m
m
m
m
m
I
i
220
Fig 14. MAGNESIUM CONCENTRATIONS
90
8O
7O
,_, so
3o
20
10
0
AFTER REPLENISHMENT
--O-- BEFORE REPLENISHMENT
PHASE I PHASE II PHASE III
@ ,,
0
a
I I i I I I I I I I
20 40 60 80 1O0 120 140 160 180 200 220
Fig 15. MAGNESIUM ACCUMULATIONS
ACCUMULA'II_I
--O-L0SS
3.8E04
3.3F._
3E_
2.7E04
2.4EO,t
OD 2.1E04E
v 1.8E04.
(-_ 1.5E04
1.2E04,
9O0O
6000
3O0O
m
i
0 2O
PHASE I PHASE II PHASE Iil
TIME (DAYS)22
Manganese
The Mn concentration in the nutrient solution should have remained near 0.4 mg L-1.Figure 18 shows it starting out low and dropping to 0 mg L-1. The Mn was brought upto 0.55 mg L-1by replenishing often with MnSO4 (Appendix). For the remainder ofPhase II and the first half of Phase III, Mn concentrations (prior to replenishments) werebelow detection limits. As can be seen in Figure 19, the wheat used all of the Mnavailable in the solution. From a total of 0.91 g of Mn added to the solution, 0.90 g(99%) were removed (Table 5). The Mn concentration correlated with the conductivity(Table 4).
Copper
The baseline Cu concentration in the nurient solution should have been 0.02 mg L-1.Cu levels started out three times higher than baseline and remained that way throughmost of Phase I (Fig. 20). After Day 60, Cu fluctuated near 0.02 mg L-1during PhasesII and !11when the system's biomass remained the greatest (Fig. 21). During Phases IIand III the solution lost the amounts of Cu that were added through replenishment.Approximately 0.013 g of Cu was added during the study while 0.012 g (94%) wereremoved (Table 5). The concentration of Cu in solution correlated with the conductivity(Table 4).
Zinc
The desired concentration of Zn in the nutrient solution was 0.05 mg L-1. It began at0.11 mg L-_but declined through Phase I (Fig 22) and remained between 0.001 and0.01 mg L-_until Day 85. The Zn concentration reached baseline on Day 49 andexceeded it for about 20 days (Day 94-115), due to micronutrient replenishment(Appendix). For the remainder of the grow-out, Zn reached baseline afterreplenishment and rapidly dropped prior to each new replenishment. Concentrationswere below the baseline during much of Phase III. According to Figure 23, thereplenished Zn was completely removed from the nutrient solution. The data show
that 0.065 g were added while 0.066 g (101%) were depleted (Table 5).
B. Microflora
Viable counts of airborne fungi and total microorganisms (predominantly bacteria) areshown in Fig. 24. The total microbial counts were always higher than the fungalcounts, and underwent sporadic fluctuations. The range in total counts was similar to
counts in EGC chambers during batch growth of wheat (unpublished data). The fungalcounts appeared to increase between days 110 and ca. 145. The reason for thisnearly four-fold rise or the subsequent decrease are unknown. In past EGCexperiments, the growth chamber humidifier was identified as a source for total viable
counts in the early stages of wheat seedling growth, before crop evapotranspirationlead to the humidity control system being dominated by dehumidification instead ofhumidification. This effect was not observed in this experiment, but the cause(presumably, a microbiologically clean water supply for the system humidifier) has littleto do with whether the wheat was grown in batch or continuous culture.
Figure 24. Viable counts of total microorganisms (TSA mean) and total fungi (IMAmean) in the atmosphere of the EGC during the continuous NFT hydroponic cultivationof wheat (Triticum aestivum cv Yecora rojo).
8O
60
40
2O
0
IMA mean
----e.--- TSA mean
I
0 100 200
DAYS
The viable counts of total microorganisms in the nutrient solution are presented in Fig25. Both the low numbers (2 x 10⁴ to 2 x 10 s per mL) and the fluctuations in countsalso were observed in other experiments when wheat was grown in batch culture.The enumeration of microorganisms during hydroponic growth of wheat in either batchor coninuous culture has not appeared in the literature, thus comparisons cannot bemade. The low values for total counts (ca 105 per mL) indicates the relativeunimportance of the solution microbial community in relation to key ecologicalfunctions. In general, at least 106 per mL would be needed for any individual microbialspecies to have a significant impact on functions such as the carbon and nitrogencycles in solution. The relative constancy of microbial numbers over such a long timeis surprising, and suggests that the sources--i.e., root sloughing hardware biofilmsloughing, filter sloughing, and growth--and sinks--i.e., removal by root mats andfilters, attachment to inert surfaces, and death--for the solution microbial communityare in equilibrium. A complication to this interpretation is that root mats, containingroughly 2 x 10 lo per mL bacteria, were removed from the system at each tray harvest,about every nine days.
28
Figure 25. Viable counts (nutrient agar) of total microorganisms in the NFT nutrientsolution during the continuous hydroponic cultivation of wheat(_ aestivum cv Yecora rojo).
.-IE
I,I.
10 6
lOS I
10 4
, 0
!
100
DAYS
!
200
29
Fig 26. DALLY WATER USAGE BY THE SYSTEM
2O
A
,.Iv
I,U¢/)
I,UI-
3=
18
16
14
12
10
8
6
4
2
0
t 0 0
0 0 0
/ 0 000 0 0 ..
%00 0 0 0 00 O0 0" 0 0
-- O0 0 00 0 0] o ecPoO o _1 o oo o ,,J 0 0 000
00 00
o(_ o
] ° o0 000
-Io oO
• | " I " I " I " I " I " I " I " I " | "
0 20 40 60 80 100 120 140 160 180 200 220
AGE (days)
Mass Balance Budget
Table 5 summarizes quantities of nutrient elements added to and removed from thesolution, and those found in the plant tissue. Nitrogen is not included because it wasanalyzed for as NO3-N in the solution and TKN in the plant tissue. High values for Cu
and Zn in the plant tissue are shown. Other discrepancies concerning the quantities ofnutrients found in plant tissue and amounts removed from solution are within the rangeof experimental and analytical error (approximately 15%).
C. Harvests
Harvest data are summarized in Tables 6 and 7. The edible biomass index (EBI), wascalculated as seed dry weight/total biomass dry weight. The volume calculations were
based on a tray area of 0.24 m 2 and a mean plant height of 0.514 m. The trays werevariable in number of plants, yield and the EBI. Average yields for trays 1 through 16(throughout the study) were 520 g m -2 of seed (dry matter), 1546 g m -2 total plant drymatter and an edible index of 32.4% (Table 6 and 7). Heights averaged 514 mm andplants averaged 1.6 heads per plant with 14 spiklets and 9 seeds per head (Table 6).Non-primary heads were included in the spikelet and seed values• Correlationanalyses performed on the harvest data are summarized in Table 8. There were
positive correlations in all categories except mass per seed versus total heads and theratio of non-primary/primary heads versus mass per seed and total seed number.There were also negative correlations between percent root dry matter (DM) withvarious above-ground parameters (Table 8). The last day harvest data are presentedin Tables 9 and 10. No seed yield data were collected on the last day harvest sincethe wheat heads were not mature. Data collected from immature plants showed less
30
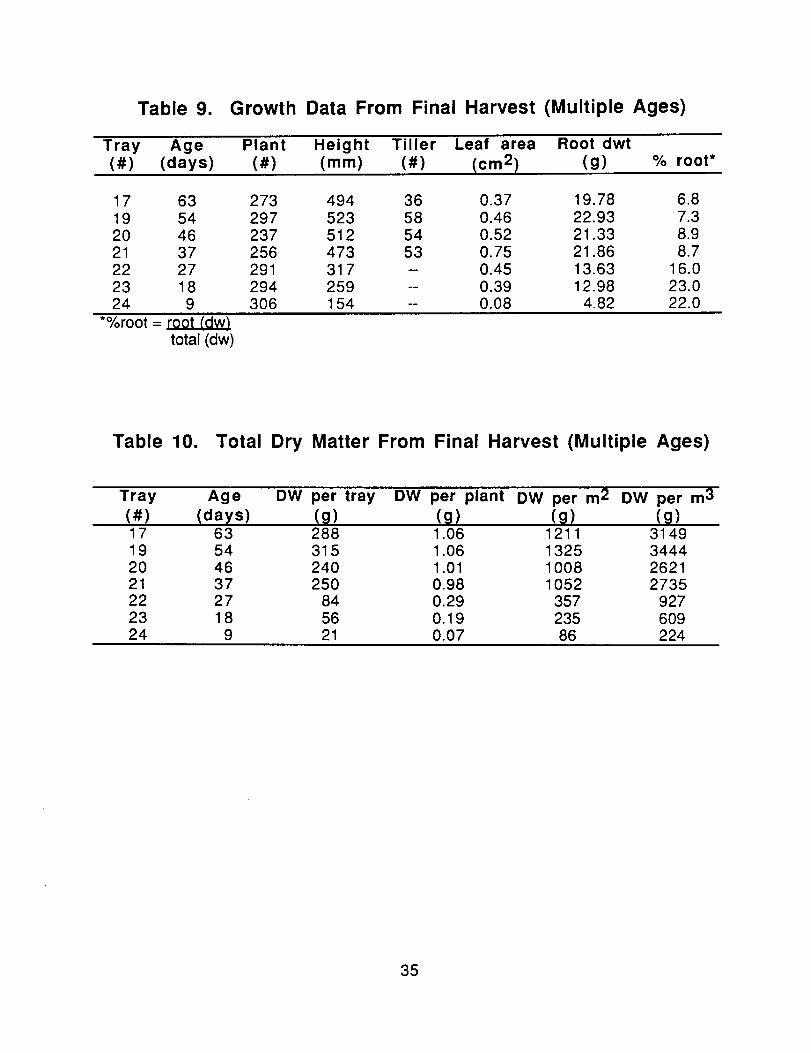
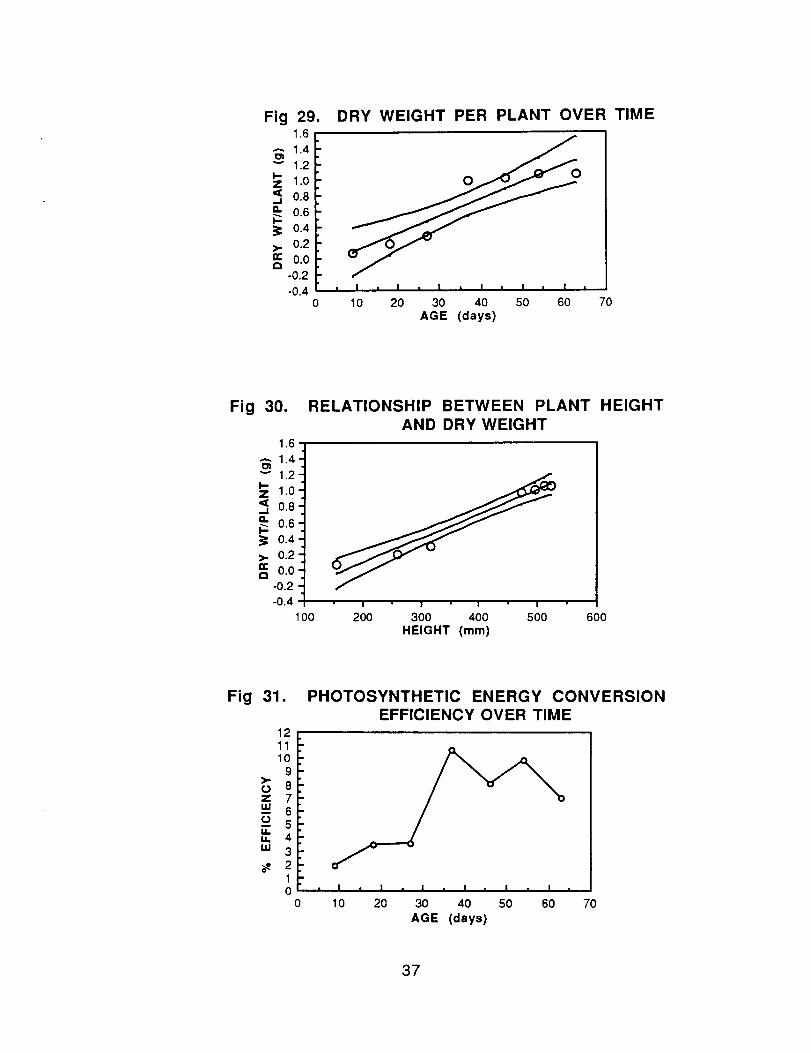
percent root (DM) once tillers and heads began appearing (Table 9). Total dry weightincreased substantially during this time (Table 10). Growth curves were developedfrom the dry weight, plant height and leaf area data that were collected from theharvest of seven trays of wheat at the conclusion of the experiment (Figs 27-31). Eachtray was a different age. Figure 27 shows the relationship between plant age and leafarea ratio (LAR). The LAR was calculated with the following equation: LA/total DM,where LA = leaf area. A polynomial equation was used to describe the relationshipbetween age and leaf area (Fig 28). Linear regression equations were developed forthe growth curves using dry weight (Fig 29) and plant height (Fig 30) data. Thesecurves were graphed with a 95% confidence interval. The photosynthetic energyconversion efficiency is depicted graphically over time (Fig 31) from the followingequation: energy in the total biomass (KJ m-2d-1)divided by energy in the PPF(KJ m-2d-l).
D Tissue Analyses
The results from the nutritional proximate and mineral analyses performed on themature wheat tissue (trays 1-16) are given in Table 11. Samples from several trayswere combined for analyses. Proximate analyses were also performed on immaturewheat plants (Table 12). Plants in trays 17 through 21 ranged in age from 37 to 63days at time of harvest, while plants in trays 22 through 24 were between 9 and 27days old. Percent protein was calculated as N x 6.25. The highest protein valueswere in the roots of all ages and in the straw of plants younger than 28 days. Thehighest carbohydrate levels were obtained from the seeds of mature plants, 63.1% byweight (Table 11 and 12). Fat levels were generally low in all tissues (less than 5%),while crude fiber was highest in the straw component.
31
Table 6. Wheat Harvest Data Summary (per tray)
TotalSeed
Tray Age Height Total Total Total Total Mass(#) (days) (mm) Plants Heads Splkelets Seeds (g)
(cal/lOOg)*The 46 Day tray (#18) was not included in the analyses._
39
IV. DISCUSSION
A. Nutrients
The pH, which was recorded daily from the pH controller, had consistantly lowerreadings than the values measured in samples delivered to the laboratory for nutrientanalyses (Fig 5). Wheat grown in past studies at KSC has not shown a sensitivity topH in the range of 5.0-7.0, so variation was not a serious concern. There are manycauses for variations in pH readings (e.g. faulty equipment, dirty probes, samplestorage time).
There were high concentrations of PO4-P, K, Mn, Cu and Mo in the wheat straw. The
nutrient solution's PO4-P concentration increased to 70% more than the desiredconcentration during the study (Fig 8). Phosphorous was being added to the solutionas KH2PO 4. Decreasing the KH2PO 4 replenishment would have reduced the K
concentration, unless another K source was substituted, such as KSO 4. It was decided
to lower the KH2PO 4 replenishment by 0.5 mmol L -1 water evapotranspirated on
Day 166, without supplementing with another K source (Appendix). Even though the Kconcentration in the solution was often at or below the desired concentration (Fig. 10),the straw contained quantities five times greater than concentrations reported forwheat by Duke and Atchley (1986). Maintenance of the K concentration in the nutrientsolution at 6 mmol L-1 water evapotranspirated was apparently too high, as measuredby the amount accumulated in the straw.
The plants appeared to be deficient in Fe and it was hypothesized that wheat mayrequire large nutrient solution concentrations (100-200 I.[m) to prevent deficiencysymptoms. Thus the concentration of Fe in the solution was allowed to increase up to180 I_M without concern. The wheat straw had concentrations of Fe in excess (Tables11 and 12) when compared to Duke and Atchley (1986). Even so, Jones (1983) statesthat it is common to measure tissue Fe in excess of hundreds of parts per million.'Yecora rojo' wheat appears to be a cultivar which can tolerate a large tissueconcentration of Fe.
Manganese in the solution was often below the desired concentration, but analyses ofthe straw tissue revealed high concentrations (Tables 11 and 12). Williams andVlamis (1957) showed that barley produced Mn toxicity symptoms when grown in a fullstrength Hoagland's solution (9 _M). When comparing different concentrations ofHoagland's solution and keeping the Mn concentration constant, the severity of thesymptoms increased in relation to an increase of the Hoagland's solutionconcentration. The concentration of Mn in their nutrient solution, which is similar to ourconcentration, produced moderate to heavy rust-colored spotting in the barley leaves.This is similar to what was seen on the wheat leaves. Williams and Vlamis (1957)suggest a nutrient solution concentration of 0.46 _M as good for barley growth, whichis 94% less than what was used in this wheat study.
Boron was not measured in the solution nor in the wheat leaves for this study, butWilliams and Vlamis (1957) found problems with B toxicity using the Hoagland'sconcentration. It was suspected that B may have been in excess along with Mn. Theysuggested using boron nutrient solution concentrations of 2.26 uM for barley, 97% less
40
than what was used in the wheat study. In their barley, B deficiency symptoms neverdeveloped, even when it was excluded from the solution. They hypothesized thatcontamination from unknown sources prevented deficiencies. Although Mo contentwas high in the straw and roots of both mature and immature plants (Tables 11 and12), it was normal in the seed. The same was true of Cu.
Besides having concern for the nutritional health of the plant, insight into theaccumulation of metals in nonedible portions of the plant is very important for aCELSS. These portions normally considered inedible (e.g. leaves, stems and roots)may be processed for consumption by people or other animal systems in CELSS.Micronutrient contamination is a common occurrence in hydroponic systems,especially the metals Cu and Zn. Based on nutrient depletion calculations from oursystem, 96% of the Cu and 73% of the Zn from the total plant tissue may have comefrom an outside source (Table 5). The most probable source of the contaminants werebrass lined humidifiers, used to humidify the growth chamber air. These humidifiersare commonly used in research facilities. The humidifiers used in this study havesince been replaced with plastic fixtures but these still contain some brasscomponents. Tissue analyses indicated that the Zn was equally distributed within theseed, straw and root tissues, whereas the Cu contaminant may have adsorbed to theplant surfaces, rather than enter the tissues. The most obvious example of adsorptionto plant tissue was with Fe, which adsorbed readily to the roots (Tables 11 and 12).This was easily seen because the chelator Fe-EDDHA used in the study is dark red,giving the roots a red to red-brown appearance. Many investigators maintain thenutrient concentrations in hydroponic solutions by adjusting the electrical conductivity.Winsor et al. (1979) and Steiner (1980) suggest this method for recirculating systems,while Neilsen (1984) recommends solution maintenance via the conductivity/pHinteraction. In this study we monitored both pH and conductivity but relied heavily onthe chemical analyses for adjusting the replenishment of the solution (Appendix).Ben-Yaakov and Ben-Asher (1983) found good correlations between the conductivityreading and the concentrations of K+ and NO3- in the solution and were able todetermine the uptake rates of those ions by monitoring the conductivity. Correlation ofconductivity with (N-NO3)was good in our study (r = 0.89) but there was a poorcorrelation with the K concentration (r = 0.43). The high correlations between thedivalent cations Ca++and Mg++with conductivity were expected but the correlationswith the micronutrients were probably coincidental (Table 4).
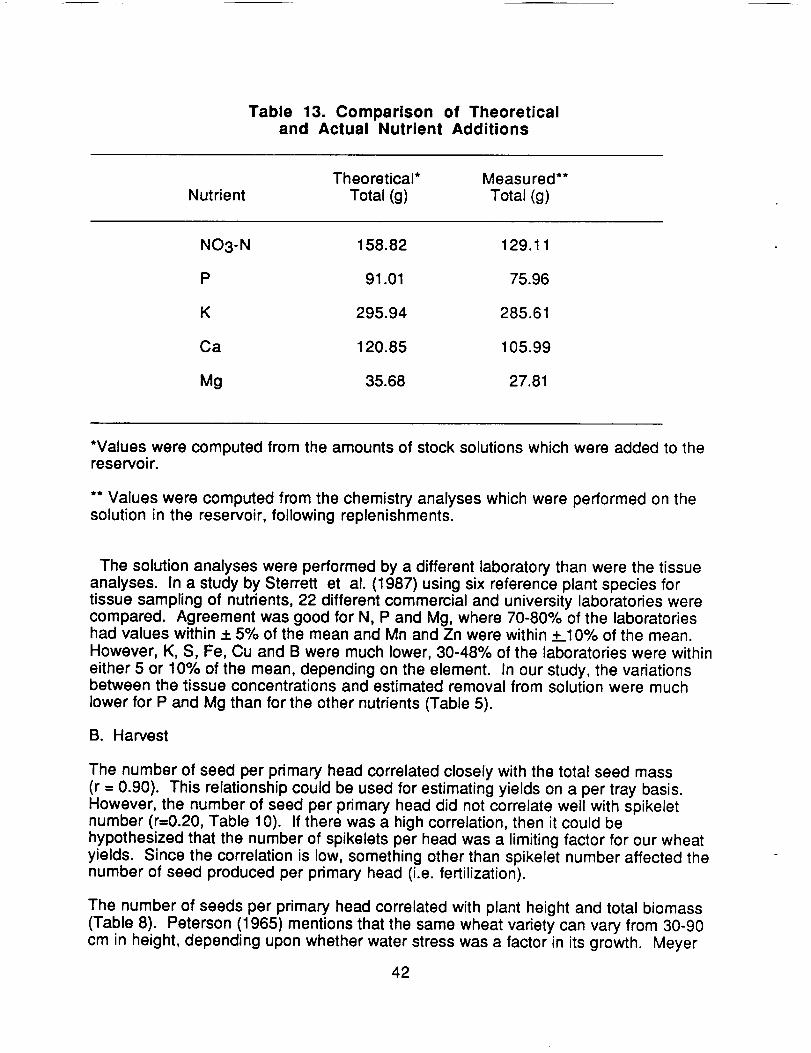
The concentrations of nutrients were determined by measuring ppm in the solutionsamples. The accumulation curves (Figs 7, 9, 11, 13, 15, 17, 19, 21 and 23) werebased on the assumption that 80 L of solution was in the reservoir at the time ofsampling. This assumption did not take into account water retained by the roots ineach tray. As the plants grew and the root mass expanded, more water was retained.For instance, by Day 80 there may have been 80 L of solution in the reservoir butanother 20 L in the trays (100 L total). This discrepancy may explain some of thevariations between what was assumed to be added to the solution and what wasmeasured (Table 13).
41
Table 13. Comparison of Theoreticaland Actual Nutrient Additions
Theoretical* Measu red**
Nutrient Total (g) Total (g)
NO3-N 158.82 129.11
P 91.01 75.96
K 295.94 285.61
Ca 120.85 105.99
Mg 35.68 27.81
*Values were computed from the amounts of stock solutions which were added to thereservoir.
** Values were computed from the chemistry analyses which were performed on thesolution in the reservoir, following replenishments.
The solution analyses were performed by a different laboratory than were the tissueanalyses. In a study by Sterrett et al. (1987) using six reference plant species fortissue sampling of nutrients, 22 different commercial and university laboratories werecompared. Agreement was good for N, P and Mg, where 70-80% of the laboratorieshad values within + 5% of the mean and Mn and Zn were within +10% of the mean.
However, K, S, Fe, Cu and B were much lower, 30-48% of the laboratories were within
either 5 or 10% of the mean, depending on the element. In our study, the variationsbetween the tissue concentrations and estimated removal from solution were much
lower for P and Mg than for the other nutrients (Table 5).
B. Harvest
The number of seed per primary head correlated closely with the total seed mass(r = 0.90). This relationship could be used for estimating yields on a per tray basis.However, the number of seed per primary head did not correlate well with spikeletnumber (r-0.20, Table 10). If there was a high correlation, then it could be
hypothesized that the number of spikelets per head was a limiting factor for our wheatyields. Since the correlation is low, something other than spikelet number affected thenumber of seed produced per primary head (i.e. fertilization).
The number of seeds per primary head correlated with plant height and total biomass
(Table 8). Peterson (1965) mentions that the same wheat variety can vary from 30-90cm in height, depending upon whether water stress was a factor in its growth. Meyer
42
and Green (1981) documented that water stress reduced stem and leaf extension inwheat and soybeans. White (1987) found that spring wheat 'Olaf", produced lessstraw and grain when roots were constricted or were given a low soil water potential(0.6 MPa). In our study, there were four trays which had particularly low yields (4, 6, 7and 16). Tray 4 had severe water stress inadvertantly placed on it at day 12 (Tables 6and 7). Other factors probably contributed to the stress of the plants in this study.Trays 6 and 7 had coinciding leaks in their tray bottoms (30-day-old and 20-day-old,respectively). The leaks were mended with PVC cement, which may have been toxicenough to reduce the wheat yields.
The low yield of tray 16 may have been due to nutritional imbalances. Beginning withDay 118, 8 umol of MnSO4was added to the reservoir every three days. The decisionto add Mn was based on the rapid depletion of Mn from the nutrient solution and theappearance of leaf symptoms similar to Mn defficiency (Appendix). As mentionedearlier, Williams and Vlamis (1957), concluded that both Mn and B produce leafspotting symptoms and reduce yields of barley when supplied at the concentrations ofa full strength Hoagland's solution. They found very little spotting when thesemicronutrients were maintained at 1/20 of the Hoagland's concentration. The wheat inour study had spotting of the leaves which appeared similar to Mn toxicity. Themaintained concentration of Mn was usually lower than Hoagland's solution (Fig 18).Referring to the harvest results (Tables 6 and 7), it appears that the last few trays of thestudy had lower yields than some of the earlier harvested trays. Increasing the Mnaddition may have had an influence on the yields. Since shoot tips must be analyzedto accurately characterize Mn in the plant, and tissue analyses were not done on shoottips, it can not be concluded that Mn toxicity actually occurred in this study. Williamsand Vlamis (1957) also deduced that symptoms of these toxicities were reduced whenthe plants were given a photoperiod, i.e. a dark cycle. The wheat in our study weregrown under continuous light, so symptoms may have been reduced if a photoperiodwas used. Continuous light in combination with warm temperatures (27oC) hastensthe life cycle of wheat, but also reduces yields (Bugbee and Salisbury, 1987a).Thorne and Wood (1987) found warmer temperatures decreased grain number andconcluded that the cause was fertilization of fewer florets. These factors may havedecreased our overall yields during this study.
The PPF exerts a direct influence on wheat growth and yield. Thorne and Wood(1987) found a doubling of radiation increased total dry weight by 80%. Polonskii andLisovskii (1980) obtained a linear type of relationship between radiation and biomassproduction for wheat. In addition to high radiation levels, the plant density in theirstudy was quite high (2000 plants m-2), to maximize space by the vertically positionedleaves which intercept light. Polonskii and Lisovskii (1980) had an approximate cropgrowth rate (CGR) of 123 g m -2 day -1 at a PPF of 1200 _mol m -2 sec -1. Bugbee andSalisbury (1987b) in an similar studies with wheat at high irradiance levels, obtainedyields of approximately 95 g m -2 day -1 at the same PPF. The CGR in this studyaveraged 21 g m -2 day -1 which is similar to results obtained by Bugbee and Salisbury(1987a) of 23 g m -2 day -1 at equivalent PPF. Our energy conversion efficiencyaveraged 7.3%, which is lower than Bugbee and Salisbury's value of approximately10%. However, their estimated efficiency was based on an extrapolated portion oftheir efficiency curve which did not contain data. Using a higher plant density in ourstudy (2000 versus 1000 plants m -2) could have increased both CGR and the energyconversion efficiency, since these values are calculated on an area basis. However, it
43
is likely that the greatest influence on total biomass production, in this study, was therelatively low PPF in the growth chamber, where this in combination with a relativelywarm temperature (23oC) produced suboptimal seed yields.
*Concentrations were added only on the specified days.**Fe was added as chelated Fe-EDDHA and Fe-HEDTA instead of FeCI3.used on subsequent replenishments.^Concentrations are given as if they were being added for 80 L of H20.
*Concentrations were added only on the specified days.**Fe was added as chelated Fe-EDDHA and Fe-HEDTA instead of FeCI3.
was used on subsequent replenishments.^Concentrations are given as if they were being added for 80 L of H20.
FeCI3
46
VI. REFERENCES
Baker, D. A. 1983. Uptake of cations and their transport within the plant, pp. 13-15. In:D.A. Robb and W. S. Pierpoint (eds.). Metals and Micronutrients Uptake andUtilization by Plants. Academic Press, New York.
Ben-Yaakov, S. and Ben-Asher, J. 1983. A method for estimating K+ and NO3+uptake rate in hydroponics by a four-electrode conductivity sensor. Scientia Hort.21:113-122.
Biomedical Operations and Research Office. 1986. CELSS "Breadboard" FacilityProject Plan. NASA John F. Kennedy Space Center. FL.
Bugbee, B. and F. B. Salisbury. 1985a. Personal communication. Plant ScienceDept. Utah State University, Logan UT.
Bugbee, B. and F. B. Salisbury. 1985b. Wheat production in the ControlledEnvironments of Space. Utah Science. Winter:145-151.
Bugbee, B. and F. Salisbury. 1987a. Studies on the maximum yield of wheat for thecontrolled environments of space. NASA Technical Memorandum # NCC2-139.Moffett Field CA.
Bugbee, B. and F. Salisbury. 1987b.the controlled environments of space.248 (abstr).
Physiological and genetic studies on wheat forOSSA: Space Life Sciences Symposium. 246-
Duke, J. A. and A. A. Atchley. 1986. Table 3 data converted to a zero-moisture basis,p376. In: J. A. Duke and A. A. Atchley (eds.). Handbook of Proximate Analysis Tablesof Higher Plants. CRC Press, Boca Raton, FL.
Hoagland, D. R. and D. I. Arnon. 1938. The water-culture method for growing plantswithout soil. Univ. Cal., Col. of Agri. Exper. Sta., Berkeley, CA. pp. 1-38.
Hoff, J. E., J. M. Howe and C. A. Mitchell. 1982. Nutritional and cultural aspects ofplant species selection for a controlled ecological life support system. NASAContractor Report # 166324. Purdue University, Purdue IN.
Jones, J. B. 1983. Soil and hydroponics, p.13-14. In: A Guide for the Hydroponic andSoiless Culture Grower. Timber Press, Portland, Oregon.
MacEIroy, R. D. and J. Bredt. 1984. Current concepts and future direction in CELSS.In NASA Conf. Pub. 2378. Life Support Systems in Space Travel.
Meyer, W. S. and G. C. Green. 1981. Plant indicators of wheat and soybean cropstress. Irrig. Sci. 2:167-176.
Nielsen, N. E. 1984. Crop production in recirculating nutrient solution according to theprinciple of Regeneration. ISOSC Proceedings:421-446.
47
Oleson, M. and R. L. Olson. 1986. Controlled Ecological Life Support Systems(CELSS) Conceptual Design Option Study. NASA Contractor Report #177421.
Peter's Fertilizer Products. 1987. Personal communication. Fogelsville, PA.
Peterson, R. F. 1965. The wheat plant and its morphological development, p. 26.N. Polunin (ed). Wheat--Botany Cultivation and Utilization. Interscience Pub. Inc.,New York.
In:
Polinskii, V. I. and G. M. Lisovskii. 1980. Net production of wheat crop under highPhAR irradiance with artificial light. Photosynthetica. 14(2):177-181.
Prince, R. P., J. W. Bartok and D. W. Protheroe. 1981. Lettuce production in acontrolled environment plant growth unit. Transactions of the ASAE. 24 (3):725-730
Qualset, C. O., H. E. Vogt, and N. E. Borlaug. 1985. Registration of "Yecora Rojo'wheat. Crop Sci. 25:1130.
Rummel, J. D. and T. Volk. 1986. A modular BLSS simulation model. COSPAR paper11.2.2. NASA-Ames Research Center and Dept. of App. Sci., New York Univ. pp. 1-9.
Sionit, N., B. R. Strain and H. Hellmers. 1981a. Effects of different concentrations ofatmospheric CO 2 on growth and yield components of wheat. J. Agric. Sci. Comb.79:335-339.
Sionit, N., D. A. Mortensen, B. R. Strain and H. Hellmers. 1981b. Growth response ofwheat to CO 2 enrichment and different levels of mineral nutrition. Ag. J. 37:1023-1027.
Smilanski, 1986. Personal communication. USDA Agricultural Research Center,Utah State University, Logan UT.
Steiner, A.A. 1980. The selective capacity of plants for ions and its importance for thecomposition and treatment of the nutrient solution. SOSC Proceedings:83-95.
Sterrett, S. B., C. B. Smith, M. P. Mascianica and K. T. Demchak. 1987. Comparisonof analytical results from plant analysis laboratories. Commun. In Soil Sci. Plant Anal.18 (3):287-299.
Strain, B. R., ed. 1978. Report of the workshop on anticipated plant responses toglobal carbon dioxide enrichment. Duke Environmental Center, Duke University,Durham, NC.
Thorne, G. N. and D. W. Wood. 1987. Effects of radiation and temperature on tillersurvival, grain number and grain yield in winter wheat. Ann. Bot. 59:413-426.
Tibbitts, T. W. and D. K. Alford. 1982. Controlled Ecological Life Support System, Useof Higher Plants. NASA Conf. Pub. 2231.
Vlamis, J. and D. E. Williams. 1967. Manganese and silicon interaction in theGramineae. Plant and Soil 27,(1):131-139.
48
White, E. M. 1987. Spring wheat growth at high and low soil water with constricted
upper roots. Soil Sci. 143, (1):44-49.
Williams, D. E. and J. Vlamis. 1957. Manganese toxicity in standard culture solutions.Plant and Soil. 8, (3):183-193.
Winsor, G. W., R. G. Hurd and D. Price. 1979. Nutrient film technique. Grower's
Bulletin No. 5. Glasshouse Crops Research Institute. Littlehampton, West Sussex,England.
49
ik_ k.]r* iih ,l, iTi,ir
Report Documentation Page
1. Report No. T2. Government Accession No.
TH t02784
4. Title and Subtitle
Continuous Hydroponic Wheat Production Usinga Recirculating System
. Author(s).Mackowiak, C°L.
_Owens Hall, L,Po?Hinkle, C.R.-Prince, R.P.9. Performing Organization Name and Address
_The Bionetics Corporation, Mail Code: BIO-3NASA Biomedical Operations and Research OfficeJohn F. Kennedy Space Center, FL 32899
12. Sponsoring Agency Name and Address
NASA/John Fo Kennedy Space Center, FL 32899
3. Recipient's Catalog No.
5. Report Date
September 1989
6. Performing Organization Code
8. Performing Organization Report No.
10. Work Unit No.
11. Contract or Grant No.
NAS10-10285
13. Type of Report and Period Covered
14. Sponsoring Agency Code
15. Supplementary Notes
16. Abstract
Continuous crop production, where plants of various ages are growing simultaneouslyin a single recirculating nutrient solution, is a possible alternative to batch
production in a Controlled Ecological Life Support System (CELSS)o 2 A study was con-ducted at John Fo Kennedy Space Center (KSC) where 8 trays (0.24 m per tray) ofTriticum aestivum L. "Yecora Rojo" were grown simultaneously in a growth chamber at
23°C, 65% relative humidity, 1000 ppm C02, continuous light, with a continuous flow,thin film nutrient delivery system. The same modified Hoagland nutrient solution wasrecirculated through the plant trays from an 80 L reservoir throughout the study. Itwas maintained by periodic addition of water and nutrients based on chemical analysesof the solution. The study was conducted for 216 days, during which 24 trays ofwheat were consecutively planted (one every 9 days), 16 of which were grown to
maturity and harvested. 2The remaining 8 trays were harvested on day 216+ Grainyields averaged 520 g m- , and had an average edible biomass of 32%. Consecutiveyields were unaffected by nutrient solution age. It was concluded that continualwheat production will work in this system over an extended period of time+ Certainmicronutrient deficiencies and toxicities posed problems in this study and must beaddressed in future continuous production systems.17. Key Words (Suggested by Author(s))
Hydroponics, recirculating, wheat,production, nutrient film technique (NFT)