71
Continuous Improvement in Mathematical Problem Solving Proficiency Keith Elementary School Walled Lake Consolidated School District
| Date post: | 18-Jul-2015 |
| Category: |
Education |
| Upload: | mrppittman |
| View: | 216 times |
| Download: | 0 times |

Continuous Improvementin Mathematical Problem
Solving Proficiency
Keith Elementary School
Walled Lake Consolidated School District

Our Mathematicians at Work
http://animoto.com/play/22XxkRE43KwMwTSxhPAHdw


Our Clear and Shared Focus


The Extra DegreeTo get what we’ve never
had, we must do what we’ve
never done.


Excellence
We are relentless in our pursuit of excellence.

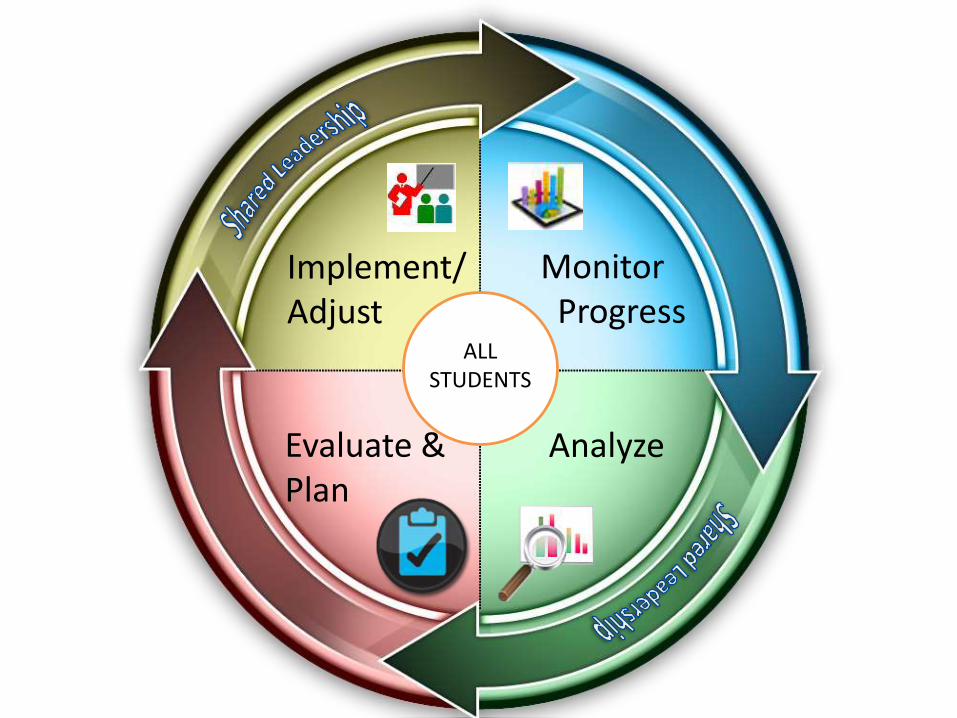
ALL STUDENTS
Implement/Adjust
Evaluate & Plan
Analyze
Monitor Progress

Implement/Adjust
Evaluate & Plan
Analyze
Monitor Progress
ALL STUDENTS

Data Sources
• MEAP Item Analysis Reports• MEAP Master File• Mastery Manager
– Grade-level Math Problem Solving Assessments– Benchmark Assessments– DRA– DWA
• Mischooldata.org– Top-to-Bottom Rankings– School Scorecards– Top 30/Bottom 30– Achievement Gaps
• PD Feedback

Initial Data Analysis
Grade Reading Math Writing Science
3rd 96% 99%
4th 99% 96% 72%
5th 96% 99% 96%
2011 Keith Elementary MEAP Results
(According to OLD Cut Scores)
The second table shows our proficiency levels according to the new cut scores.
(Note: The Writing proficiency cut scores did not change from last year to this year,
which is why our percentage proficient is the same between these first two tables.)
Obviously, the new standards are significantly higher in Reading, Math, and
Science, which means fewer of our students are considered “proficient” in those
areas.
2011 Keith Elementary MEAP Results
(According to NEW Cut Scores)

• The data team compiled MEAP data for our 2012 staff retreat. • We found that Keith students were struggling in “Connections”
(For only 49% of the MEAP items in Connections, 71% or more of our students in grades 3-5 selected the correct answer)
• The staff determined the building goal would address Connections and provide a bridge to CCSS.


Steps We’ve Taken Math GoalBeginning 2012-2013 Continuing through 2014-2015

Keith Elementary SMART Goal:By June 2015 all students will be secure in mathematical problem solving according to grade level specific assessments.
Grade level SMART goals use language from the CCSS
Example: By June 2015 all 3rd graders will be secure in solving two-step word problems using the four operations, represent these problems using equations with a letter standing for the unknown quantity, and assess the reasonableness of answers using mental computation and estimation strategies including rounding

ALL STUDENTS
Implement/Adjust
Evaluate & Plan
Analyze
Monitor Progress


The Formative Assessment Process


Learning Targets
The starting place for all effective instruction is designing and communicating clear learning goals. - Marzano (2009)
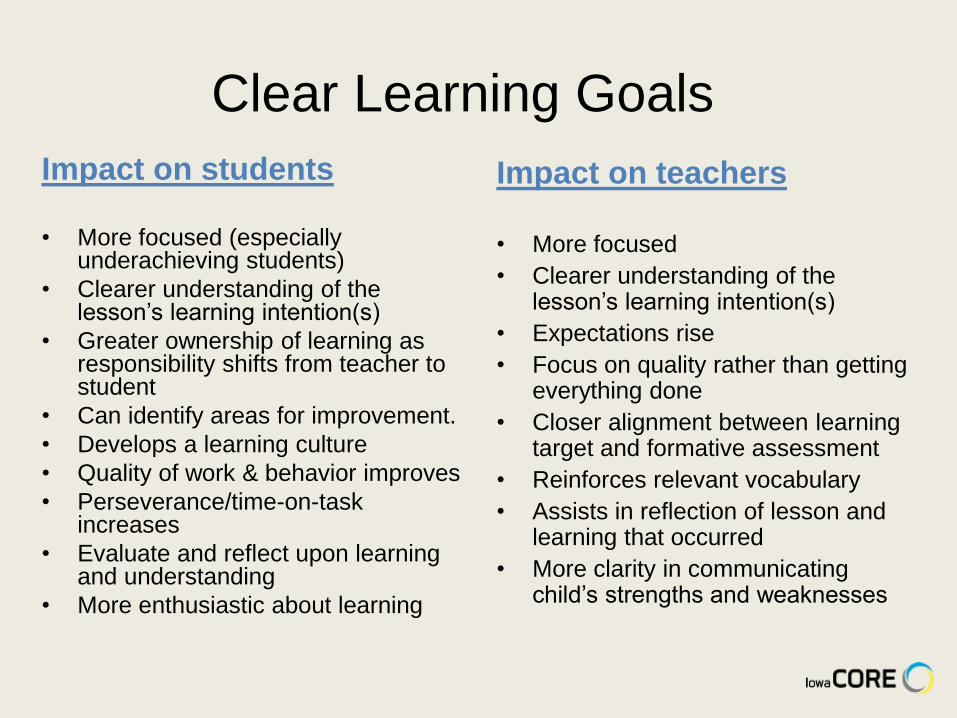
Clear Learning Goals
Impact on students
• More focused (especially underachieving students)
• Clearer understanding of the lesson’s learning intention(s)
• Greater ownership of learning as responsibility shifts from teacher to student
• Can identify areas for improvement.
• Develops a learning culture
• Quality of work & behavior improves
• Perseverance/time-on-task increases
• Evaluate and reflect upon learning and understanding
• More enthusiastic about learning
Impact on teachers
• More focused
• Clearer understanding of the lesson’s learning intention(s)
• Expectations rise
• Focus on quality rather than getting everything done
• Closer alignment between learning target and formative assessment
• Reinforces relevant vocabulary
• Assists in reflection of lesson and learning that occurred
• More clarity in communicating child’s strengths and weaknesses

WLCSD Definition of a Learning Target
An effective learning target is a statement of intended learning for one lesson that is shared, posted, and discussed in clear, student-friendly language, and is formatively assessed both
during and by the end of the lesson to inform both the teacher and student.

Qualities of an Effective Learning Target
A statement of intended learning for one lesson.
Shared and discussed in student-friendly language
Assessable during and by the end of the lesson

Targeted Instruction
• Determine where students are
• Determine what students need to move forward in their learning
• Utilize individualized, differentiated instructional tools and strategies to achieve learning goals


• Skills are specifically aligned to the state standards.
• Clearly defined learning objectives.
• Encourages students to participate through rewarding performance
• Comprehensive, detailed reports for the teacher and/or parent that track student progress as well as areas of need.

Resources for Mathematics Instruction
Everyday Mathematics Houghton Mifflin

Math Facts and Data NotebooksMath Facts Testing for
automaticity for each mathematical operation
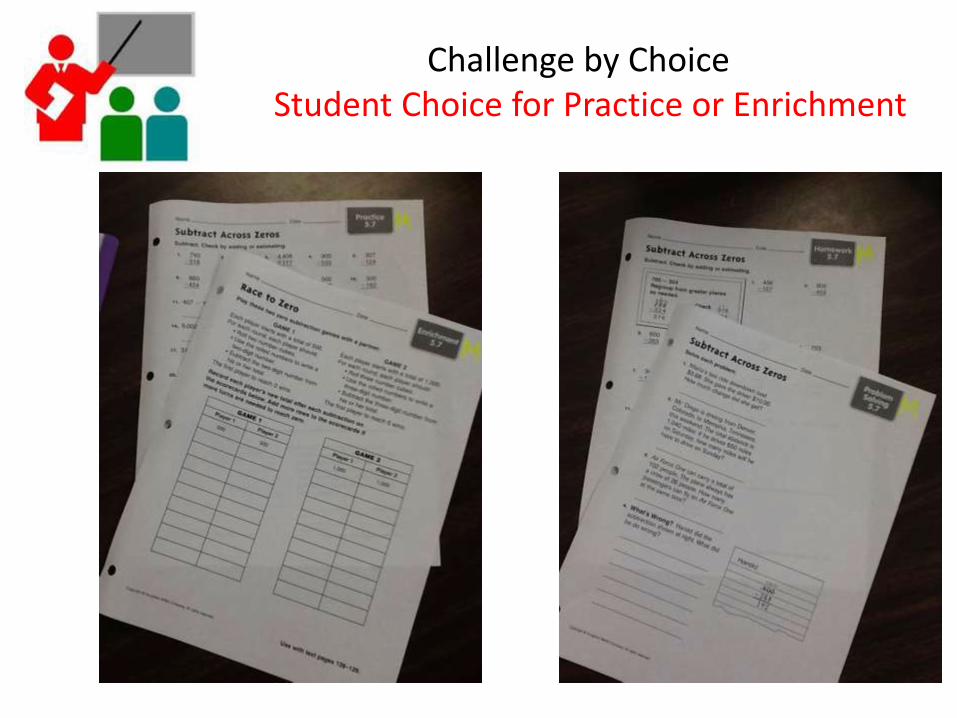
Challenge by ChoiceStudent Choice for Practice or Enrichment

Math Notebooks
Students:
• Record information
• Take notes
• Draw math problems
• Write about their thinking
• Organize information
• Articulate what they are thinking
• Practice using new vocabulary
• Reflect on learning/work
• Practice new skills and concepts
• Explain their approach to
problems

“Arithmetic is numbers you squeeze from your head to your hand to
your pencil to your paper till you get the right answer.” - Carl Sandburg

Problem of the Day /Week
Integration of problem solving and strategy lessons in math workshop for each ability group
Whole class problem of the day or week

Anchor Charts

Effective Questioning
• Effective teachers use closed-ended as well as open-ended questions, framed in such a way that invite students to form hypotheses, make connections, or challenge previously held views.
• High-quality questions encourage students to make connections among concepts or events previously believed to be unrelated and arrive at new understandings of complex materials.
Teacher Excellence and Support System

Quality of Questions/Prompts
• Questions of high quality cause students – to think and reflect. – to deepen their understanding. – to test their ideas against those of their classmates.
• When teachers ask questions of high quality, – they ask only a few of them. – they provide students with sufficient time to think about
responses. – they offer time to reflect on the comments of their
classmates. – they allow time to deepen their understanding.
Teacher Excellence and Support System

Depth of Knowledge Wheel

Depth of Knowledge Activities

Success Criteria
Defining success in relation to the learning target.

Marzano’s Levels of Understanding

Marzano’s Levels of Understanding

Marzano’s Levels of Understanding

Marzano’s Levels of Understanding

Marzano’s Levels of Understanding

Class Generated Scoring Rubrics
Using Kid-Friendly Language
K-2 Making Connections Rubric

3 - 5 Making Connections Rubric
4 Clearly and completely shows evidence of understanding and solving the problem.
3 Attempts to explain or illustrate a strategy that identifies the correct conclusion. Explains some steps of the solution strategy for each part of the problem, but the explanation might be confusing.
2 There is some evidence of understanding the problem. Attempts to explain or illustrate a strategy. The explanation or illustration might be confusing or incorrect.
1 Attempts to solve the problem. Might show some work, but there is no evidence of understanding the problem.
0 Does not attempt to solve the problem.

Actionable Feedback
• Timely
• Specific and descriptive
• Connected to learning targets, success criteria/rubrics
• Student Centered
“The students were very clear at all levels that the main aspect they wanted to get out of feedback was how to improve, and they wanted very specific information about this. There was a mixture of requests for the feedback to be both written and verbal. They also wanted to see examples of what was expected.”—John Hattie

RISE Model for Meaningful Feedback

Austin’s Butterfly
http://www.youtube.com/watch?v=hqh1MRWZjms&safety_mode=true&persist_safety_mode=1 (Turn and Talk)

ALL STUDENTS
Implement/Adjust
Evaluate & Plan
Analyze
Monitor Progress

Implement/Adjust
Evaluate & Plan
Analyze
Monitor Progress
ALL STUDENTS
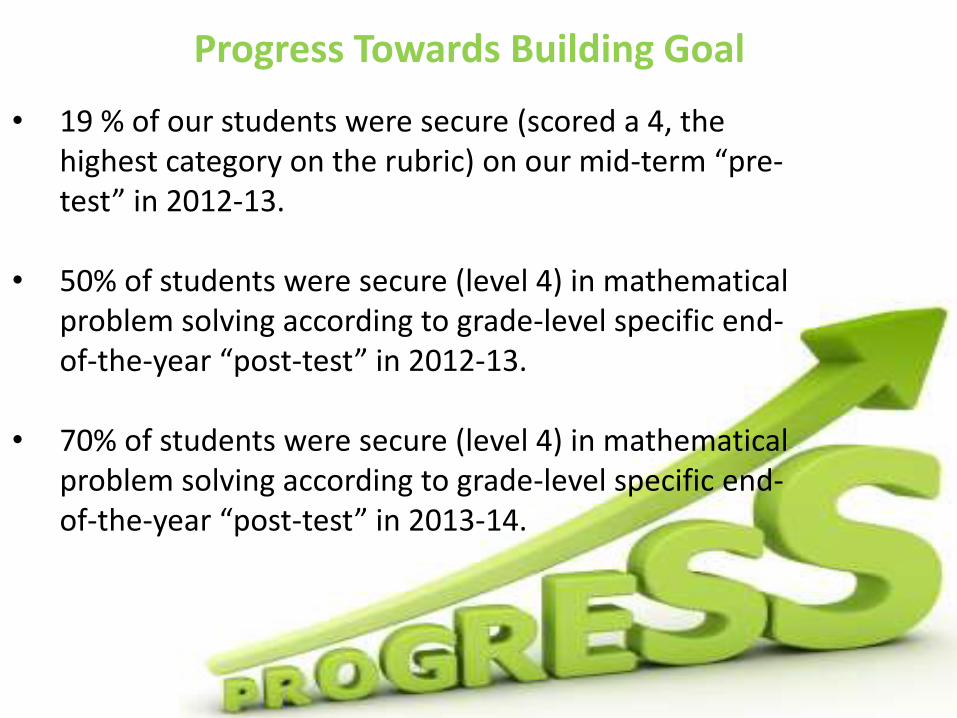
Progress Towards Building Goal
• 19 % of our students were secure (scored a 4, the highest category on the rubric) on our mid-term “pre-test” in 2012-13.
• 50% of students were secure (level 4) in mathematical problem solving according to grade-level specific end-of-the-year “post-test” in 2012-13.
• 70% of students were secure (level 4) in mathematical problem solving according to grade-level specific end-of-the-year “post-test” in 2013-14.

4th Grade Benchmark Assessment (BA) Results
• Overall achievement of the bottom third 4th grade students rose from 70.5% to 81.8% on Common Benchmark Assessments.
• The achievement gap between 4th graders from the bottom third and the top third was reduced from 29.5% to 18.2% on Common Benchmark Assessments.

Mathematics Scorecard
Upward trends in proficiency for all students as well as Bottom 30%, economically disadvantaged, ELL, and students with disabilities sub groups


MEAP Math Results: 2011-2013
We had a net gain in proficiency of 32 percentage points in MEAP mathematics from 2011 to 2013.

Longitudinal Growth in Math Proficiency from 2011-2013
Longitudinally, we have seen a net gain in proficiency in math of 17 percentage points from 2012-13 and 46 percentage points from 2011-13.

MEAP Math Data from 2011-2013 for Grades 3-5 Combined
This table shows how from 2011-2013 we have increased the percentage of students scoring at the highest level (Advanced) from 16% to 23% and we have also increased the percentage of students who are proficient (Levels 1 & 2) from 67% to 76%.

School Item Analysis Report
After two years, we have seen drastic improvement in the Connections portion of the MEAP Mathematics Test.
In 2013, for 81% (compared to 49% in 2011) of the MEAP items in Connections, 71% or more of our students in grades 3-5 selected the correct answer.

Gap Between Top 30 % and Bottom 30%
Subject Area2011-12 Gap Measure
(negatives indicate large gaps)
2012-13 Gap Measure
(negatives indicate large gaps)
Mathematics -0.91 0.06
Reading -0.41 0.54
Science 0.47 0.23
Social Studies 1.44 1.75
Writing -0.45 -0.16
Composite 0.03 0.48
is for Growth
107% improvement in reducing achievement gap in mathematics in one year.

Composite Gap 2012 vs. 2013

ALL STUDENTS
Implement/Adjust
Evaluate & Plan
Analyze
Monitor Progress


Staff PD Reflection Sheets

Professional Development Ratings

A shared direction and a sense of community means we can do more and go farther.

Contact Information
Juliann Snavely: Kindergarten
Anne Spencer: 3rd Grade
Phillip Pittman: Principal
Keith Elementary School2800 Keith Rd.West Bloomfield, MI 48324248-956-3700


