Page 1
Continuously Improving
Customer Satisfaction in an
ICT PSF
Author: T.M. Keuper
Supervisors: Dr. M.L. Ehrenhard (University of Twente)
Prof. Dr. C.C.J.M. Millar (University of Twente)
The Marketing Manager (Tijs-ICT)
Study: Masterthesis (Business Administration)
Date: 22-09-2011
Page 2
1
Colofon
Name: Tijs Keuper
Student number: s0138436
Study: Business Administration
Master Track Service Management
University of Twente
Faculty: Management & Governance
Page 3
2
Preface
"Quality is, if customers come back and not the products" (Müller, 1991)
These words, that are part of a former motto by Siemens Medicine Division (see Annual Report,
1988), represent how important customers are to service firms. The topic of this report is how to
continuously improve customer satisfaction. For firms that are service providers it is important that its
customers are satisfied and stay customers. Customer satisfaction is of paramount importance and
when customers are satisfied it is an indication of quality service. I have chosen to write my master
thesis about this subject, because I was interested in how (professional) service firms can improve its
customer satisfaction.
This master thesis is done in order to receive the title „Master of Science (MSc) in Business
Administration‟ in the track Service Management, at the University of Twente. A customer
satisfaction research has been carried out at an ICT firm that is operating in the Netherlands.
However, on request the real business name of this ICT firm is exchanged with the fictitious business
name: Tijs-ICT.
The graduation is the last phase of my study and it was a great experience for me to see how a service
firm treats its customers and tries to meet their expectations.
I would not be able to finish my study without the support, help and feedback that I have received in
doing this project. Thank you all! I want to thank: my supervisors from the University of Twente,
Prof. Dr. Carla Millar and Dr. Michel Ehrenhard. When having difficulties in my project, you always
helped me out. I also want to thank all employees of Tijs-ICT that supported me and especially my
supervisor. I had a great time in your organization and I have learned a lot. Thank you for your time
and for everything you wanted to share with me.
I want also to thank my family for your support and confidence in me. Especially I want to thank my
parents who made me able to study, gived me motivation and being always there for me to give
advice.
Tijs Keuper
Enschede, September 2011
Page 4
3
Table of contents
Preface ................................................................................................................................................. 2
Management summary ........................................................................................................................ 5
Chapter 1: Introduction ....................................................................................................................... 8
1.1 Relevance ...................................................................................................................................... 8
1.2 Research Goal + Research Question ............................................................................................. 8
1.3 Tijs-ICT ......................................................................................................................................... 9
1.4 Frame and context ......................................................................................................................... 9
1.5 Paper structure ............................................................................................................................. 13
Chapter 2: How to measure Customer Satisfaction in a PSF? ....................................................... 15
2.1 Customer Satisfaction.................................................................................................................. 15
2.1.1 Customer satisfaction and related concepts .......................................................................... 15
2.1.2 Customer Satisfaction & Service Quality ............................................................................. 16
2.2 Instruments that measure customer satisfaction in the B2B service industry ............................. 18
2.2.1 The original SERVQUAL model ......................................................................................... 18
2.2.2. Summary of the major criticism on SERVQUAL ............................................................... 18
2.3 Models generated out of the criticism ......................................................................................... 20
Chapter 3: How to respond to customer satisfaction data, for continuous improvement? .......... 23
3.1 Definitions ................................................................................................................................... 23
3.2 Goals and benefits of Continuous Improvement ......................................................................... 24
3.3 Organizing continuous improvement; existing approaches ......................................................... 27
3.3.1 Collect Feedback and React with action plans ..................................................................... 28
3.3.2 Customer Feedback Systems (CFS) ..................................................................................... 29
3.3.3 Customer Relationship Management (CRM) ....................................................................... 31
3.3.4 Complaints Management ...................................................................................................... 34
3.3.5 Organizational Learning ....................................................................................................... 35
3.4 The use of the approaches discussed in this chapter ................................................................... 37
Chapter 4: Methods ............................................................................................................................ 41
4.1 Research Design .......................................................................................................................... 41
Page 5
4
4.2 Selection and sampling ................................................................................................................ 42
4.2.1 Selection ............................................................................................................................... 42
4.2.2 Sample .................................................................................................................................. 42
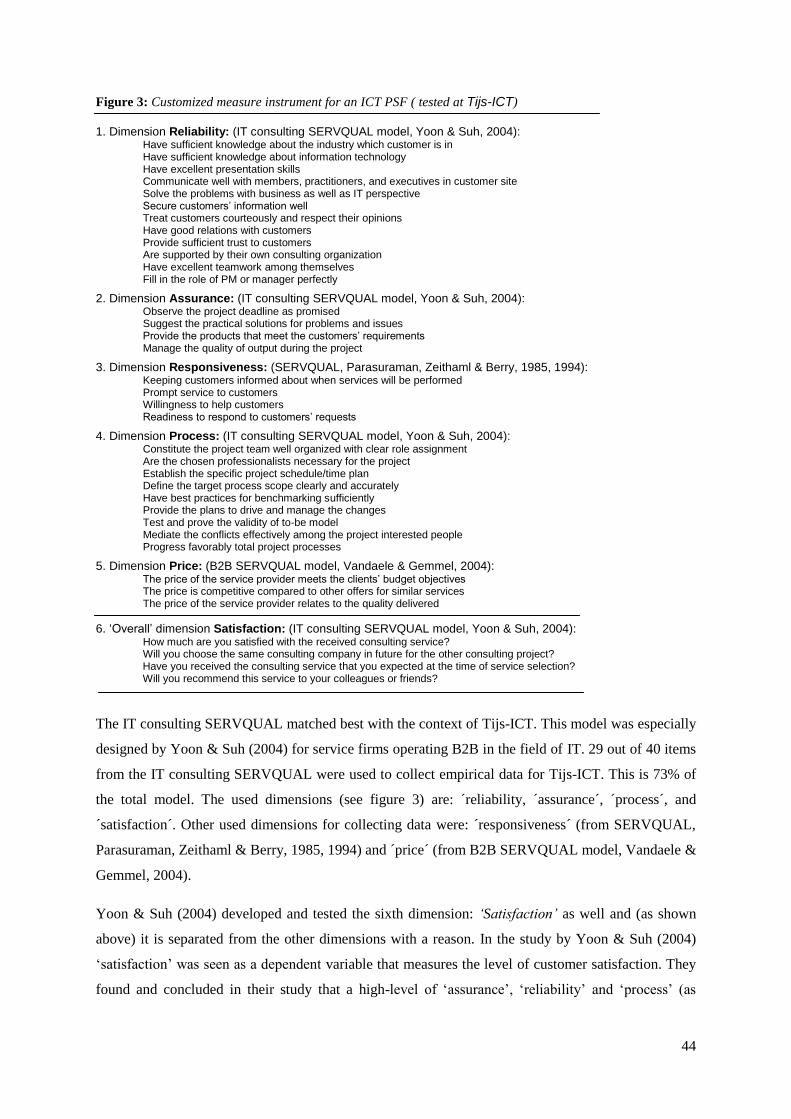
4.3 Measurement and Operationalization .......................................................................................... 43
4.3.1 Dimensions (from existing SERVQUAL mutations) ........................................................... 43
4.3.2 Final grade: Satisfaction ....................................................................................................... 47
4.3.3 Collecting priorities .............................................................................................................. 47
4.3.4 Order of importance .............................................................................................................. 47
4.3.5 Suggestions from participants ............................................................................................... 48
4.3.6 General data .......................................................................................................................... 48
4.4 Data Collection ............................................................................................................................ 48
4.5 Data analyses plan ....................................................................................................................... 50
Chapter 5: Results empirical research .............................................................................................. 52
5.1 Data and Analysis ........................................................................................................................ 52
5.1.1 ANOVA test ......................................................................................................................... 52
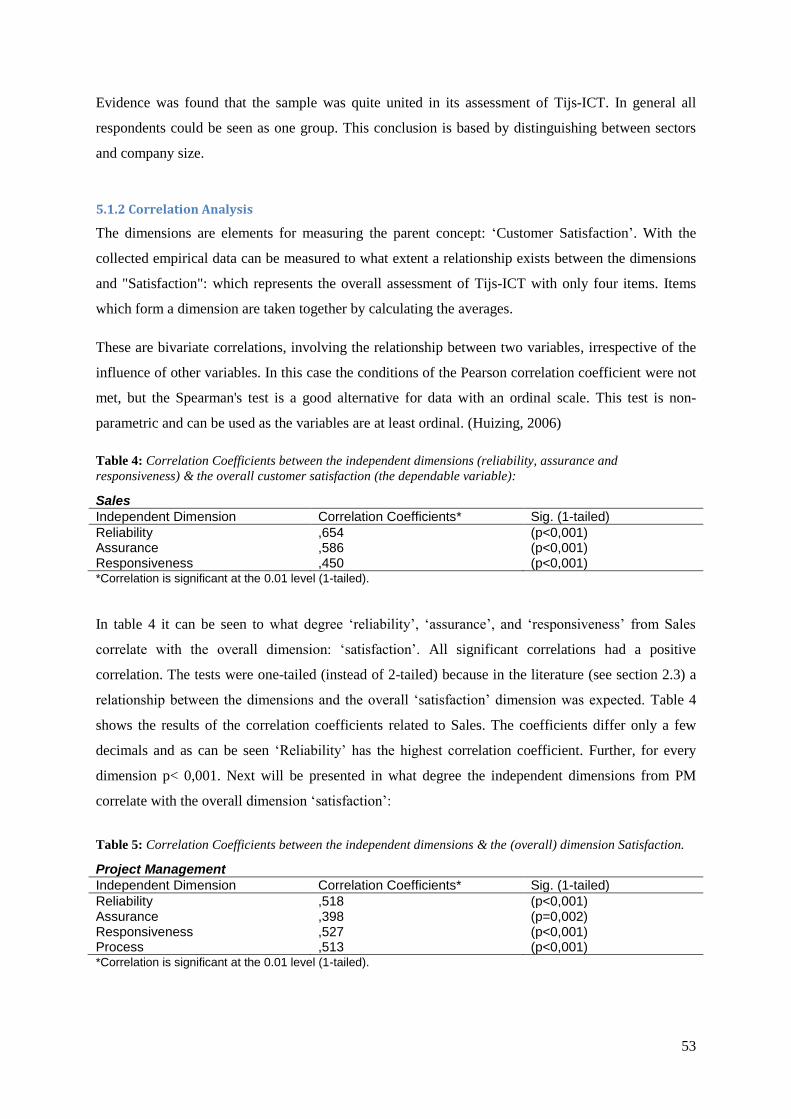
5.1.2 Correlation Analysis ............................................................................................................. 53
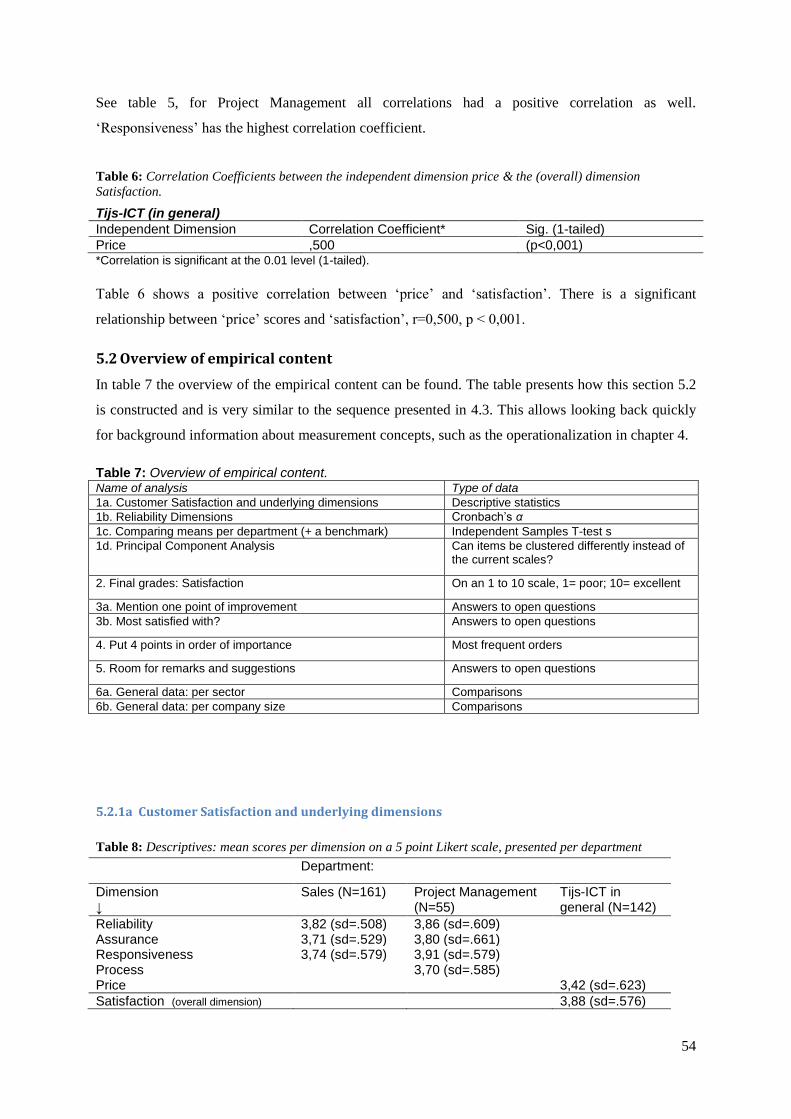
5.2 Overview of empirical content .................................................................................................... 54
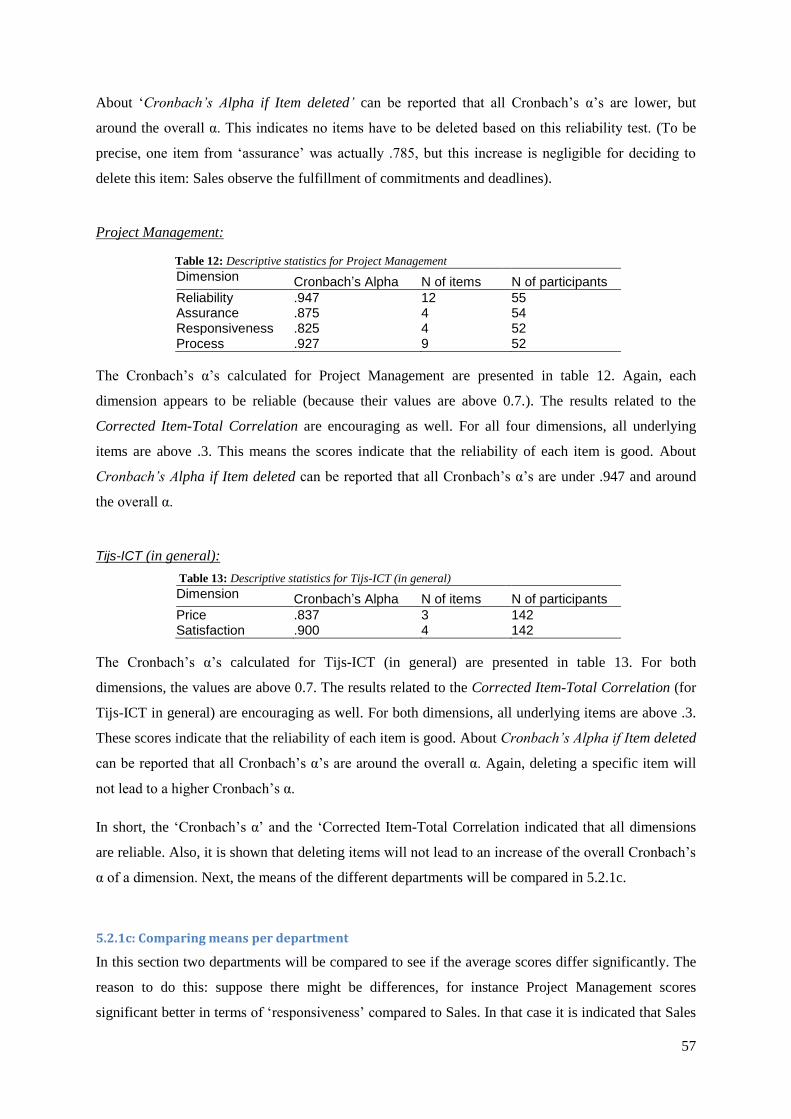
5.2.1a Customer Satisfaction and underlying dimensions ............................................................ 54
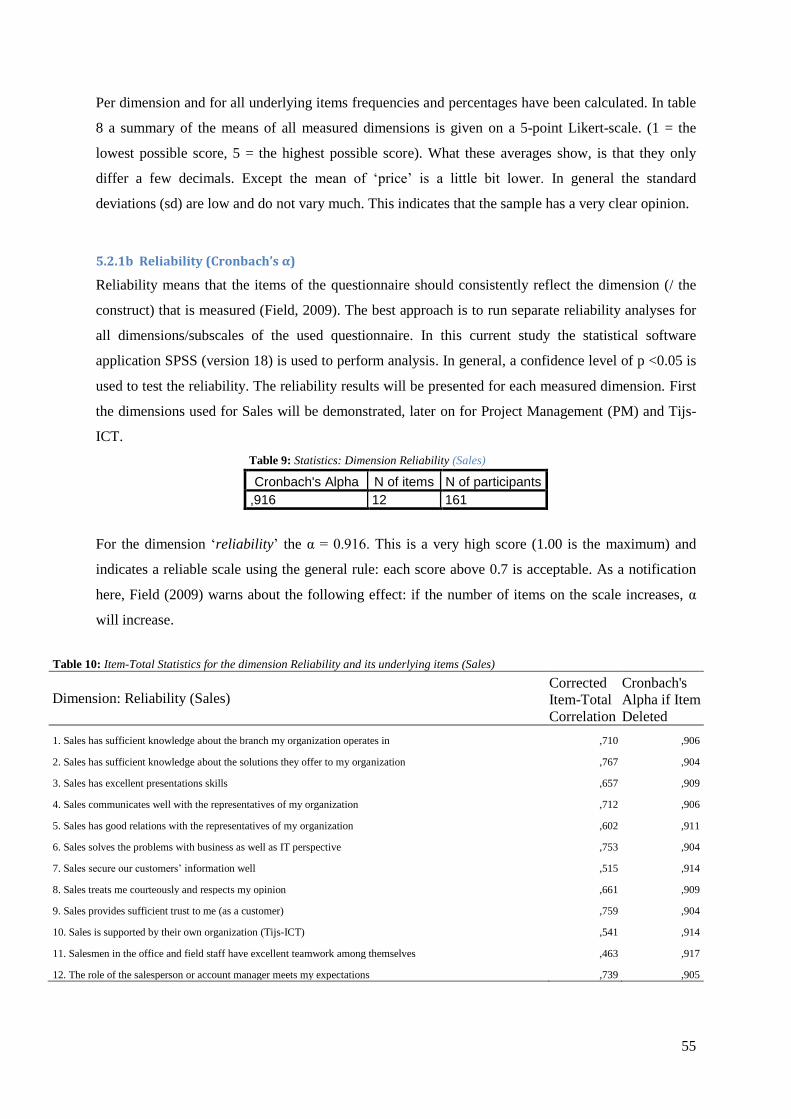
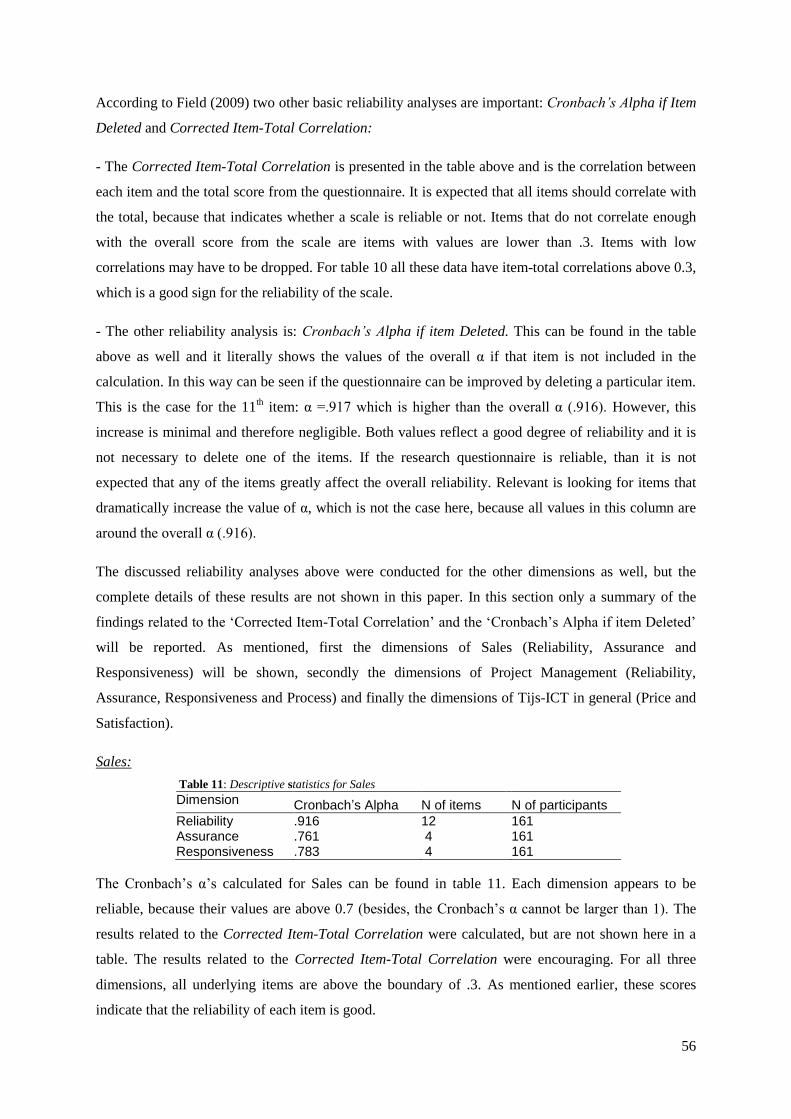
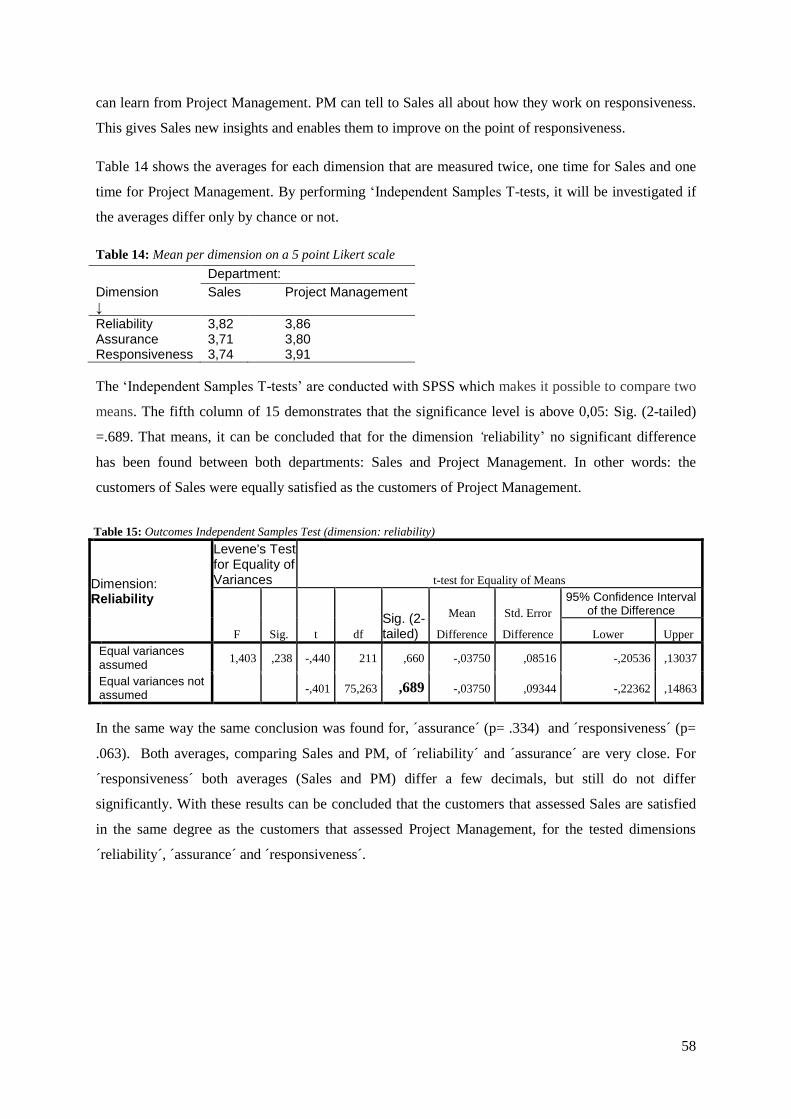
5.2.1b Reliability (Cronbach‟s α) ................................................................................................. 55
5.2.1c: Comparing means per department ..................................................................................... 57
5.2.1d: Principal Component Analysis .......................................................................................... 59
5.2.2 Final grades: Satisfaction ...................................................................................................... 63
5.2.3 Priorities ................................................................................................................................ 65
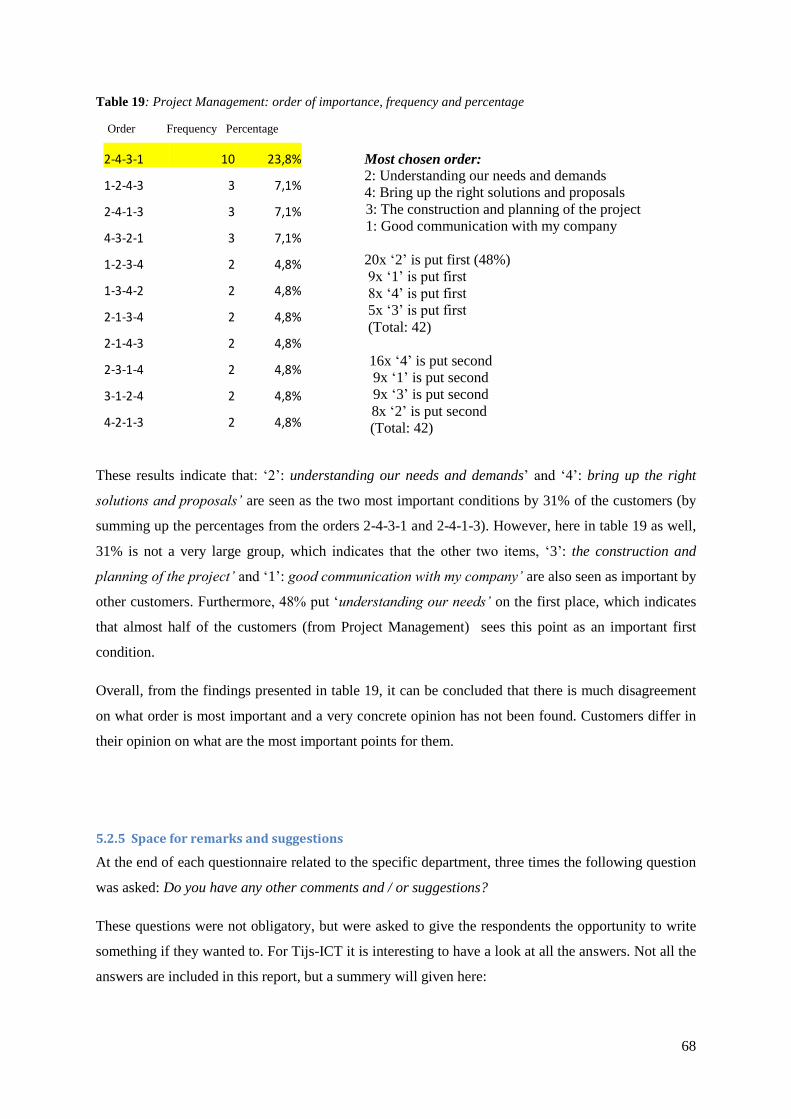
5.2.4 Put 4 points in order of importance ...................................................................................... 67
5.2.5 Space for remarks and suggestions ....................................................................................... 68
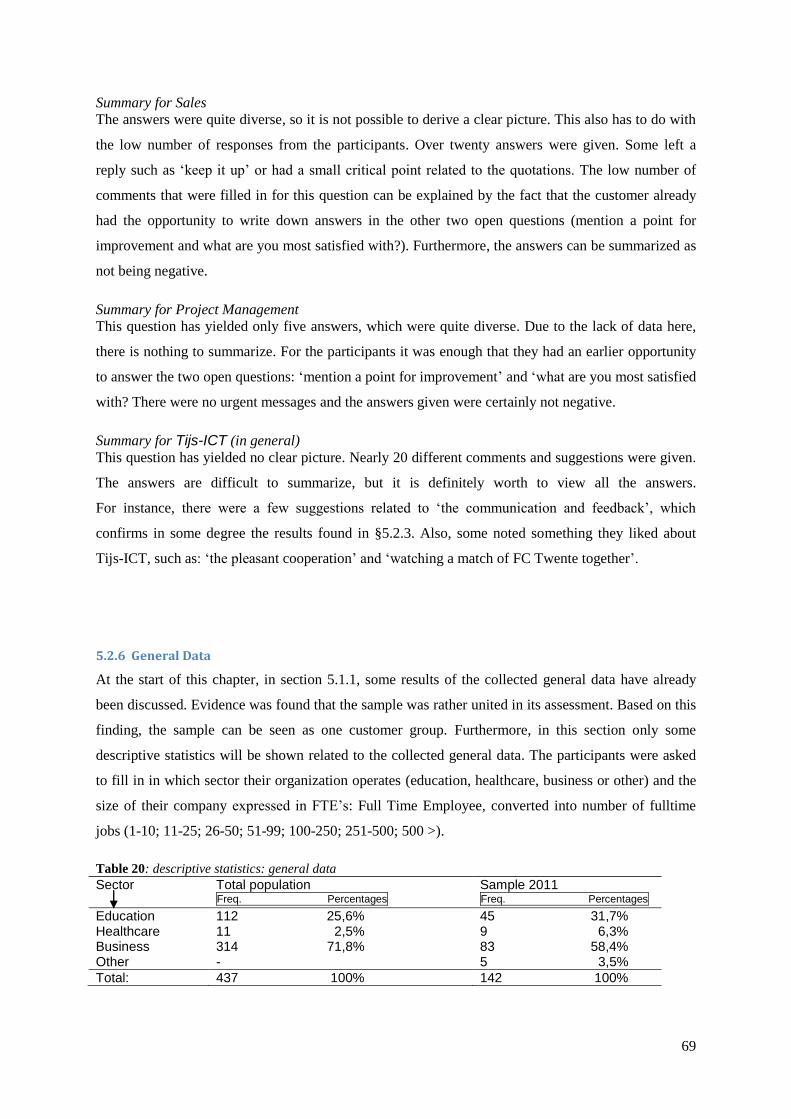
5.2.6 General Data ......................................................................................................................... 69
Chapter 6: Discussion and Conclusion.............................................................................................. 72
Chapter 7: Recommendations............................................................................................................ 79
References ……………………………………………………………………………………………85
Appendixes…………………………………………………………………………………………... 89
Page 6
5
Management summary
In order to be competitive, service-oriented firms need to continuously improve their business. In this
paper it is recommended to compete on superior customer value delivery. An essential question is:
According to the customer what can we improve in our business to better meet their expectations?
Especially in service-oriented organizations, customer satisfaction often has high priority, because
customers participate in the service production process. Each service is a unique effort of an
interaction process between the service provider and the customer. Therefore it is important to focus
on customer expectations.
Intended as a practical case, a customer satisfaction research was carried out at Tijs-ICT operating
as an ICT Professional Service Firm (B2B). By putting the voice of the customer into numerical
scores, the customer satisfaction was mapped in a concrete way. In combination with adding some
open questions as well, opportunities for improvement and priorities were identified. This customer
survey helps to increase the satisfaction and with the results and feedback the service quality can be
further optimized towards the point the customer expects. The formulated Research Question is:
How to continuously improve customer satisfaction in an ICT PSF?
It is investigated which measurement instrument could be used for this customer satisfaction research.
The IT consulting SERVQUAL matched best with the context of Tijs-ICT. This model was especially
designed by Yoon & Suh (2004) for service firms operating B2B in the field of IT, but it was
necessary to make minor adjustments to the original instrument to align with the context of Tijs-ICT
and make the tool more effective. This quantitative method has mapped in what degree customers are
satisfied about their „perceived service‟. The instrument consists of scales/constructs (reliability,
assurance, responsiveness, process, price and satisfaction) that have a strong correlation with
„customer satisfaction‟ and „service quality‟. The scales/dimensions are divided into items and these
items directly represent the questions that were asked to the customers. The customers could assess
the items by indicating to what extent they are satisfied with a particular item on a 5 point scale. With
the instrument the customers view could be identified in a reliable and valid way.
Next to the questions from the instrument a few more closed and open questions were asked. For
instance: what customers suggest to improve immediately in the services they purchase.
Measurements in this study were divided over different departments: Sales, Project Management and
Tijs-ICT (in general). This decision was made because the goal was to formulate action plans as
specific as possible and as a consequence each department will get its own results.
Page 7
6
The most important results are:
- The overall satisfaction grade assigned to Project Management and Sales is a 7.5 (on a 10 point
scale). For Tijs-ICT (in general) a 3.88 is scored on a 5 point scale. This grade is close to a „4‟,
what means that customers are satisfied. Overall, customers were satisfied with the perceived
services by Tijs-ICT. Most customers were neutral or satisfied about the ´price´ of Tijs-ICT.
- Priorities have been identified. Sales should pay more attention to the observance of
appointments and deadlines. Many customers think that a more rapid succession of bids/orders
should be possible. The communication and feedback, during customer contacts and the
communication about tasks to be performed should be improved. Besides employees did not take
care of informing the customer at any time.
- Project Management should pay more attention to the schedule/time plan. PM is not always
consistent in the communication and should take care of informing the customer at any time.
The most important implications are:
- In order to accelerate the duration of bids/orders, the persons concerned must come together to
determine whether this is possible. If this appears to be organisationally impossible, the salesmen
must be made clear that they should not promise a deadline that is too tight. In advance it should
be made clear to the customer why he may have to wait several days. Manage expectations.
- Employees have to be made aware that they should be more consistent in (proactively) informing
their customers. Tijs-ICT could use an Information System for support.
- In this research a zero measurement has been carried out, be sure that the next measure is done
exactly in the same way, so that a clear comparison is possible. When conducting the second
measurement, be sure to evaluate the effectiveness of the action plans made between the first and
second customers satisfaction research.
- Management must set a goal which grades and scores they want to achieve within the next years.
- Individual customers who scored lower than the average are a direct trigger for Tijs-ICT. Tijs-
ICT should contact these customers to discuss and improve the situation and improve customer
satisfaction. Tijs-ICT should be open to learning from them.
- Tijs-ICT should estimate the value and usability of the collected knowledge with each other and
determine the feasibility for improvement in their business. It is important that employees
involved will be informed about the most important results and that there is commitment so that
employees will act according to established plans. Tijs-ICT should have the attitude to learn from
evaluations. In the long run they should monitor and compare the outcomes of each new
customer satisfaction research.
Page 9
8
Chapter 1: Introduction
1.1 Relevance
Two studies by Homburg, Koschate & Hoyer (2005) reveal the existence of a strong, positive impact
of customer satisfaction on willingness to pay. Loyal customers generate increasingly more profits
each year they stay with a firm (Reichheld & Sasser, 1990). These two facts point out the importance
of paying attention to customers and keeping them satisfied.
In order to be competitive, (service-oriented) firms need to continuously improve their business. The
next major source for competitive advantage according to Woodruff (1997) will probably come from
more outward orientation to customers, to compete on superior customer value delivery. The focus
should be on whether customers are satisfied (enough) about their perceived services. Relevant
questions are: How do customers see us? Are they satisfied with our delivered service? According to
the customer what can we improve in our business process to better meet their expectations?
In short, the two main themes of this paper were mentioned above: (1) customer satisfaction and (2)
improving the business where the customers expects it.
1.2 Research Goal + Research Question
Service-oriented organizations, in which customer satisfaction often has high priority, would like to
have the answers on the formulated questions above. In this research „customer satisfaction‟ will be
measured and analyzed with the goal to continuously improve and manage the customer satisfaction.
From the collected scores, feedback and action plans can be formulated for the internal service-
organization. The employees must react with the aim to benefit from this valuable information. The
final objective (in the long run) is monitoring and evaluating whether an improvement has been
reached in the field of meeting customer expectations better. The Research Question addressing the
research problem is: How to continuously improve customer satisfaction in an ICT PSF?
ICT stands for Information and Communication Technology and is about the exchange of information
in several ways, such as the telephone, the internet, computers, software and other equipment.
PSF stands for Professional Service Firm. In short it is an organization providing complex services for
their customers and during the service delivery professional expertise is needed. The research
question will be operationally conducted at Tijs-ICT. It is an appropriate firm to conduct the research,
because Tijs-ICT is an ICT-company operating as a PSF (B2B) and the company is interested in the
research question. The research question is divided into three sub questions:
1. How to measure customer satisfaction in a PSF?
2. How to respond to customer satisfaction data, for continuous improvement?
Page 10
9
3. What action plans can be formulated for Tijs-ICT from the collected scores and analysis to
continuously improve customer satisfaction? (after the empirical research has been
conducted)
In order to answer the first two sub questions, mainly literature about this subject will be reviewed.
Chapter 2 will answer the first sub question and chapter 3 will focus on the second. For answering the
third sub question empirical research will be conducted at Tijs-ICT.
1.3 Tijs-ICT
Tijs-ICT, is an ICT partner for businesses and institutions in healthcare and education. Tijs-ICT offers
products, services and solutions to other companies (B2B). Its supply consists of: (1) designing an
appropriate ICT-infrastructure, (2) the delivery of ICT products, (3) the implementation and (4) the
continued maintenance and control of the ICT. Customers can choose a complete path or only a
component of the path. A Helpdesk is available for advice and support as well. Since September 2009
Tijs-ICT has also had an online web shop/portal where organizations can quickly find, compare and
order over 80.000 products such as computer soft- and hardware, information systems, notebooks, etc.
(Tijs-ICT, 2010).
1.4 Frame and context
Before starting this research the context must be framed first. The focus in this research is on firms
which operate (1) B2B, (2) are active in an ICT branche and (3) can be defined as a Professional
Service Firm. In the next part will be explained why it is necessary to make this distinction at this
point.
B2B services
As mentioned, this research focuses on firms operating B2B (Business-to-Business). A firm in this
industry offers products or services to other firms and not to private or individual customers. In this
research the term customer will be used for a buying (external) organization that receives the service
from the provider. B2B services compared to those purchased by individuals are often more complex
because the demand of a whole firm is more complicated than the needs of a single person with his
personal preferences (B2C). In B2B more often a complete team takes part in a service project that
works for the best interest of the company. Service firms differ from firms that manufacture products.
For most services, three basic characteristics can be identified (Grönroos, 2000, p. 47): „(1) services
are processes consisting of (intangible) activities or a series of activities rather than things, (2)
services are at least to some extent produced and consumed simultaneously, (3) the customer
participates in the service production process at least to some extent‟. Each service is a unique effort
Page 11
10
of an interaction process between the service provider and the customer. The uncertainty in the
service process can be large and services are often labor-intensive.
ICT services
Tijs-ICT is an ICT professional. Information and Communication Technology (ICT) or Information
Technology (IT) are two closely related concepts. „An IT professional service organization provides
consulting services, largely to help their clients implement new IT‟ (Wang & Swanson, 2007, p. 74).
ICT automation is popular because with ICT business processes from other firms can be optimized.
This can be complex, therefore expertise and support from ICT-professionals are required.
Professional service providers act as experts for customers and assist in solving (ICT) problems and
making decisions. Professional services are not only knowledge-intensive, but also customer-specific.
This means ICT-professionals like Tijs-ICT deliver whatever the customer is ordering as long as it is
within their area of expertise. This requires a flexible, responsive organization that acts in the best
interest of the customer. Clients often outsource ICT services because they can not implement an IT
infrastructure by themselves or because, by doing so, they do not need to pay a full-time employee to
perform the task, although it can be very important to support their core business. By investing in ICT
solutions customers can save time and reduce costs.
In this kind of sector, firms design, integrate, and deliver complex products and systems on a project
basis. For instance IT equipment suppliers like IBM and Sun Microsystems responded to customer
pressure in taking responsibility for supplying and installing integrated hardware and software
systems, and providing support in the long run. Brady, Davies and Gann (2005)
IS (Information Systems) providers are also characterized as adding value by providing combinations
of products and services that create unique benefits for each specific customer. The tasks of these
providers are labeled by Brady et al (2005, p. 362): „Not only do they take over responsibility and risk
for performing activities previously carried out in-house by their customers, they develop new ways
for components to work together as an integrated whole to increase the overall value of the solution
for the customer. Becoming solutions-focused means that providers have to understand how value is
created through the eyes of the customer. IS providers begin by thinking about the desired outcome
for the customer and work backwards to the products or services required to meet those needs‟.
Brady et al (2005) describe in general the process of IS-providers. At the start of each project a
contract or a first proposal will be offered. An involved project team needs to be multi-skilled and
cross-functional. Expertise from commercial management, technical design, and project management
are part of this executive project team. A customized solution will be provided. Once the contract has
been set and agreed, the project moves to the next phase: the integration phase, where the provider
establishes a project organization and implements the solution. The project team has the responsibility
to ensure that the value created by the solution in the integration and operational phases of the project
Page 12
11
meets or exceeds customers expectations. When the project is over, it does not mean the relationship
is over. The provider‟s responsibility after the project is to manage, support and improve the delivery
of the solution. Providers and customers work jointly to plan, implement the solution and monitor its
ongoing performance. Creating customer value by solving problems in turn leads to a competitive
advantage and that is a need in a competitive environment. Brady et al (2005)
KIBS (Knowledge-Intensive Business Services)
In literature we come across the term: “KIBS”, Knowledge-Intensive Business Services, and this
comes closely to what is meant in this research context. Hipp (1999, p. 94) summarizes that „KIBS are
characterized by the ability to receive information from outside the company and to transform this
information together with firm specific knowledge into useful services for their customers‟. Tijs-ICT
for instance gets ICT (related) products and technical information from their suppliers and as an
intermediary they make this ICT knowledge useful for their customers. As an experienced provider
they take care of and have knowledge about the implementation and control of ICT solutions, so that
customers can improve their business process. Hipp (1999) sees KIBS as carriers of knowledge as an
intermediary between science (knowledge creator) and their customers (knowledge user). His
empirical analysis also shows that KIBS providers are able to improve the customers' performance
and productivity and contribute to technological and structural change. KIBS combine and transform
(tacit and explicit) knowledge to create new services. For that reason KIBS are integrated in the new
mode of knowledge production, as kind of innovation (Hipp, 1999). Den Hertog (2000) made an
analysis of this role of KIBS in innovation processes and concluded that KIBS firms may provide
knowledge resources that support the innovation process in various ways. For example: providing an
expert project manager with the necessary skills to implement an innovation; providing an innovative
tailor-made software package; providing training or a written advice regarding product selection and
implementation (Den Hertog, 2000, p. 502). For KIBS the production of services is often the result of
co-production between the provider and the customer. In other words, the quality of the resulting
service product largely depends on the nature of this provider-customer interaction and the quality of
the mutual communication process. During this interaction process, they work together to find
solutions for problems and challenges. (Den Hertog, 2000, p. 505)
„Computer and information-technology-related services‟ (including software services) are mentioned
as an example of KIBS in the articles by Hipp (1999) and Den Hertog (2000). Den Hertog literally
cites IT support services as a typical example of a business that works with their customers in highly
interactive ways. This means that the characteristics of KIBS come very close to the context which is
meant in this paper. However, the term „KIBS‟ will not be used in this paper, because in both articles
there is (too) much emphasis on the innovative role of KIBS providers as far knowledge is concerned.
Not only knowledge (-intensive) services are important in the context of this paper: the services
should be seen a little bit broader, such as referred to as „Professional Services‟.
Page 13
12
PSF (Professional Service Firm)
In literature there was a lack of a definition of the term “Professional Service Firm”. A single
definition is problematic because PSF‟s have multiple distinguishing characteristics and only a few
firms meet all of those characteristics (von Nordenflycht, 2007). Law firms and Accountancies are
almost universally recognized as PSF‟s but about other PSF‟s there was little consensus in literature.
Now Von Nordenflycht (2007, 2010) has made an ordered analysis that contributes to both the
interpretation of existing research on PSFs and the design of future PSF research. Von Nordenflycht
(2010, p. 156) used fifty-two articles and books to compose a list of examples of professional services
in recent studies (e.g. Accounting, Law, Management consulting; IT consulting/design, Technology
consulting, Engineering consulting/design, Software development etc.). Based on his review, he
defined three distinctive characteristics: knowledge intensity, low capital intensity, and a
professionalized workforce.
Von Nordenflycht (2007, p. 42) also made a list (out of existing literature) to define distinctive PSF
characteristics. The most relevant characteristics for this current research (context) are highlighted
here:
- The nature of assets: highly educated, intellectual, creative and expert skills, human capital,
complex knowledge, application of specialist technical knowledge.
- The nature of the output: a service (rather than a product), intangible, advisory services /
expert services, customized/ non-routine problems (apply expertise to a client‟s specific
situation), complex output, substantial client interaction (need for input from the client
regarding her situation and needs).
- The profession-intensity (institutional context) workforce of professionals; provide
professional assistance. Professionals have a responsibility to protect the interests of clients.
- The nature of customers: business clients.
Summary of frame and context
The term PSF has been made clear above and will be used in this research (instead of KIBS) because
it best meets the context meant in this paper. The involved firm Tijs-ICT is particularly an ICT PSF
and this will also be the context in which new empirical data will be collected (see chapter 4 and 5).
The purpose of this research is to investigate where an ICT PSF can improve its business in the field
of customer satisfaction. In cases where business standards deviate from customer needs, expectations
need to be managed. Precisely this gap characterizes customized services and is why they are hard to
manage. The provider has the challenge to react quickly and be flexible to fulfill customer
expectations. Service delivery firms will need to continue fine-tuning the process, remove bottlenecks
and learn through experiences (Wirtz & Tomlin, 2000).
Page 14
13
1.5 Paper structure
Chapter 2 is a literature study conducted on „customer satisfaction‟. Several related definitions will be
discussed and it will be described how customer satisfaction can be measured and analyzed with
existing models. These models are suitable tools to be used for understanding and knowing
customers‟ expectations on services.
In chapter 3 a literature review is conducted as well, now focused on „continuous improvement‟.
There will be a discussion on how, in general, service firms can continuously improve their business.
This chapter is related to chapter 2, because with collected data about customer satisfaction firms can
use this data for (future) improvement. A lot has been written about „continuous improvement‟ and
„total quality management‟ (TQM) and about product improvement (think of Kaizen), but less about
service improvement, which is the focus in this paper. TQM is very broad: here only two elements
from TQM will be highlighted: customer focus and continuous improvement.
In chapter 4 the research design will be presented, in chapter 5 the results will be presented and in
chapter 6 the focus will be on the discussion and conclusion. Finally, chapter 7 contains a number of
recommendations.
Page 16
15
Chapter 2: How to measure Customer Satisfaction in a PSF?
Theory, part I
This chapter is the first part of the literature review and is answering the first sub question from this
research. It starts in section 2.1 with discussing a few definitions on „customer satisfaction‟. In 2.2 a
widely known measure instrument in the field of customer satisfaction: called SERVQUAL, will be
introduced. This instrument will be critically examined and the strengths and weaknesses will be
identified. A few mutations from the SERVQUAL model will be presented as well.
2.1 Customer Satisfaction
Szymanski & Henard (2001) argue that customer satisfaction has come to represent an important
cornerstone for customer-oriented businesses. If the provider delivers what the customer needs and
wants, the customer will be satisfied. The concept that is often used in literature is: Customer
Satisfaction and it has become an important element for businesses in the B2B service industry.
Parasuraman (1998) argues that customer service is especially critical in B2B markets because the
core of what is exchanged between sellers and buyers is: the service. The quality of the customer
service can contribute, as a consequence, to customer satisfaction.
First will be explained how „customers satisfaction‟ is defined in literature and finally how to measure
customer satisfaction will be discussed.
2.1.1 Customer satisfaction and related concepts
To provide further understanding of customer satisfaction a few definitions about customer
satisfaction will be given. These definitions are widely used and are especially relevant for the service
industry:
„Satisfaction is defined as pleasurable fulfillment. That is, the consumer senses that consumption
fulfills some need, desire, goal, and so forth and that this fulfillment is pleasurable. Thus, satisfaction
is the customer‟s sense that consumption provides outcomes against standard of pleasure versus
displeasure‟. (Oliver, 1999)
„Customer Satisfaction is a customer‟s positive or negative feeling about the value that was received
as a result of using a particular organization‟s offering in specific use situations. This feeling can be
a reaction to an immediate use situation or an “overall” reaction to a series of use situation
experiences‟. (Woodruff, 1996)
As Anderson, Fornell, & Lehmann (1994, p. 54, see also Johnson and Fornell, 1991) further explain:
„cumulative customer satisfaction is an overall evaluation based on the total purchase and
consumption experience with a good or service over time‟. In other words, here customer satisfaction
is not only based on the current experience but also on all past experiences.
Page 17
16
In the literature review by Anderson et al; (1994) the authors found that service/product quality,
customer expectations and price influence how satisfied the customer will be. A satisfied customer
leads to loyalty and that is what providers need. Reichheld & Sasser (1990) explain that if a firm has
strong customer loyalty, it should be reflected in the firm‟s economic returns because it ensures a
steady stream of future cash flow. Besides, satisfied customers are more willing to pay for the benefits
they receive and are more likely to be tolerant of increases in price. Satisfied customers are likely to
buy more frequently and in greater volume and purchase other goods and services offered by the firm.
(Reichheld and Sasser 1990)
A review of the literature by Taylor & Baker (1994), (using c.f. Bitner and Hubbert 1994; Cronin and
Taylor 1992; Oliver 1993a; Patterson and Johnson 1993) suggests that there does appear to be relative
consensus among marketing researchers that service quality and consumer satisfaction are separate
(i.e., unique) constructs that share a close relationship. Taylor & Baker (1994, p. 163) found in their
research that: „Service quality and customer satisfaction are widely recognized as key influences in
the formation of consumers‟ purchase intentions in service environments‟. This is important to
indicate and is in line with figure 2 (see next page), because purchase intentions finally lead to profits.
2.1.2 Customer Satisfaction & Service Quality
In order to improve customer satisfaction, a good way (not the only way) is to improve the service
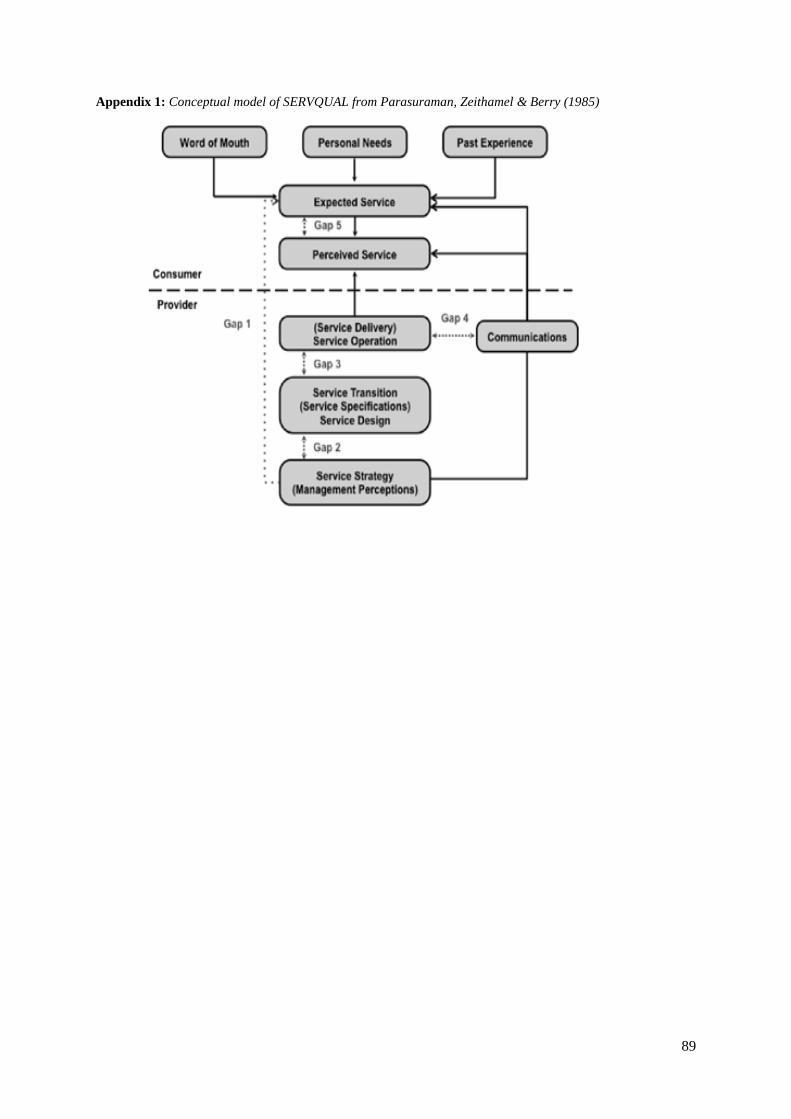
quality. Parasuraman, Zeithaml & Berry (1985) developed a model for this topic, called SERVQUAL.
The authors define service quality as: „the degree to which service quality perceptions match service
quality expectations‟. Starting point in this conceptual model is the Customer Perceived Service (in
Dutch: „door de afnemer waargenomen kwaliteit‟). This model can be used to diagnose shortcomings
and these shortcomings are direct points for improvement, which is the other theme of this paper.
Because of the difference between expectations of service quality and actually measured perceptions
of service quality, it is basically a 'gap analysis'. Originally five different gaps are identified in the
conceptual model by Parasuraman et al (1985) as can be seen in appendix 1. In this study only gap 5
will be used as an element from the SERVQUAL model. This gap 5 exactly describes the goal that
must be researched: customers must assess in what degree they are satisfied with the service quality
they perceived from the service provider. Parasuraman et al (1985) defined his concept as follows:
Gap 5: Perceived service quality gap: this gap occurs when the perceived service quality is not
consistent with the expected service quality (from the customer‟s perspective).
Woodruff (1997) adds that such gaps, like gap 5, create the potential for mistakes in an organization's
efforts to deliver value to customers. Customer-learning processes should be aimed at reducing such
gaps, so that the service quality and the customer satisfaction will increase through focus on identified
improvement points.
Page 18
17
Figure 2: Gap 5 from the SERVQUAL model: (source based on original SERVQUAL model from Parasuraman,
Zeithaml & Berry,1985)
Figure 2 demonstrates a boundary in the model between the customer and the provider. A research
can be carried out on both sides, internal (provider-side) or external (customer-side). Tijs-ICT is
interested in information about the concepts above the boundary line. An external research will be
conducted with the aim to improve customer satisfaction. The only gap Tijs-ICT likes to investigate,
is Gap 5: the gap between the expected service and the perceived service the customer gets. Tijs-ICT
wants to bridge this gap as good as possible. An external research will be conducted to measure and
analyze information. No internal employees but (external) customers will be asked how the provider
can improve the service quality Tijs-ICT is offering to them. In the figure can be seen that influences
such as word of mouth (about image or experiences from others), personal needs (or business needs),
past experiences and communications (promises from Sales & Marketing or project managers) lead to
and influence the „Expected Service‟. There is a difference between customers‟ expectations and
perceived/experienced service. The more a customer (in this case, a business) gets that meets his
expectations, the more satisfied he will be. Oppositely, the more the offering differs from what a
customer expects, the more dissatisfied he will be.
At the end of this section a few notes should be made to set things clear. Collecting (external)
information about customer satisfaction is valuable and is the focus for this research. Another
approach (not used here) is focusing on internal business improvement concerning issues as (human)
resources, knowledge and technology-expertise. Thus, there are more approaches for improving
quality. However, this research will approach quality from the customer‟s point of view with the aim
to increase customer satisfaction. This is a more market-orientated approach.
Page 19
18
2.2 Instruments that measure customer satisfaction in the B2B service industry
2.2.1 The original SERVQUAL model
SERVQUAL, stands for „Service Quality‟ and is a model that can be used as an instrument for
diagnosing how to improve the performance quality of services delivered by businesses. Next to the
definitions and gaps as presented above, the SERVQUAL model also consists of different dimensions
and underlying items to obtain valuable scores. Within the SERVQUAL method five generic service-
quality dimensions can be distinguished that are related to service quality and customer satisfaction:
(1) Reliability: ability to perform the promised service dependably and accurately.
(2) Responsiveness: willingness to help customers and provide prompt service.
(3) Assurance: knowledge and courtesy of employees and their ability to inspire trust and
confidence
(4) Empathy: caring, individualized attention the firm provides its customers.
(5) Tangibles: appearance of physical facilities, equipment, personnel, and communication
materials.
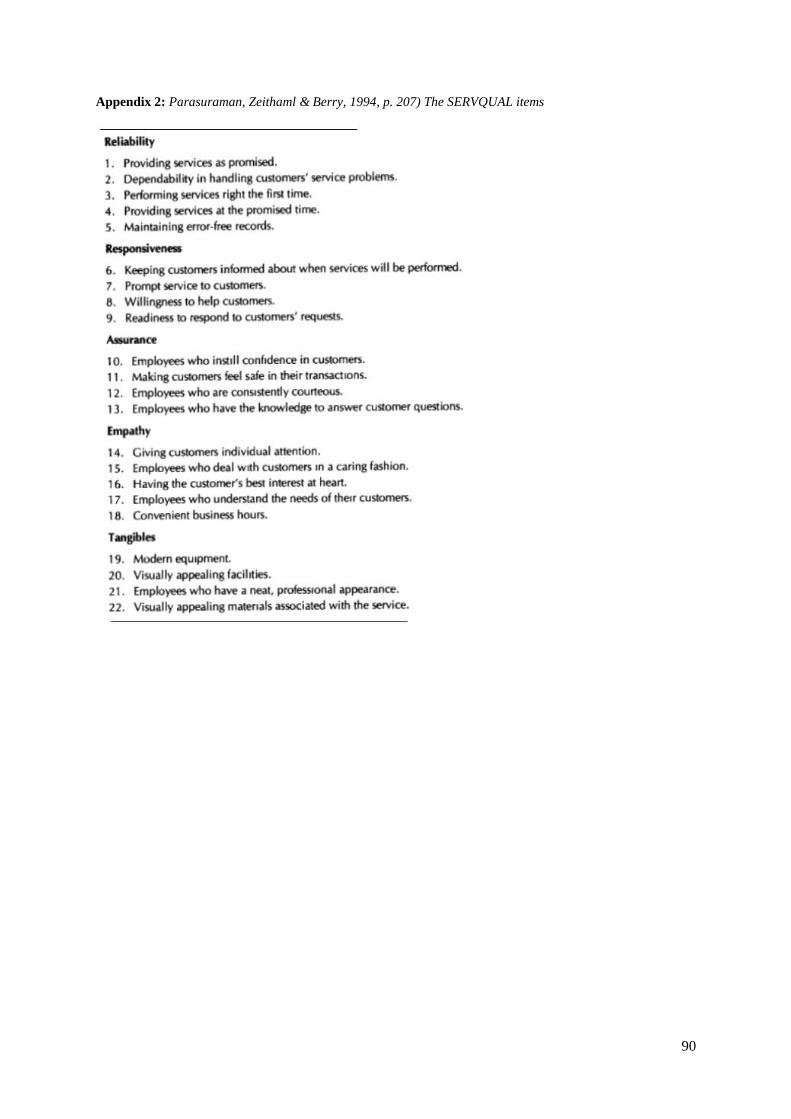
The five dimensions are scales that exist of multiple items/attributes. These items are linked to
formulated questions. The complete questionnaire can be found in appendix 2. SERVQUAL actually
consists of twenty-two items that measure the service perception and twenty-two items that measure
the service expectation. The difference between both scores of the twenty-two items represents the
gap. In this model service quality has been defined as the degree to which customer perceptions of
service quality equal customer expectations of service quality: the data will be analyzed by deducting
the average expectation rate from the average perception rate. The difference or gap score can indicate
if there are (too much) shortcomings in service quality or not. Besides, every dimension has its own
(correction) weight-score and is measured on a 5 point Likert scale (1 = very dissatisfied; 5 = very
satisfied).
2.2.2. Summary of the major criticism on SERVQUAL
SERVQUAL is an instrument that has been designed to be applicable across a broad spectrum of
services in several sectors and is therefore very much generalized. SERVQUAL is frequently and
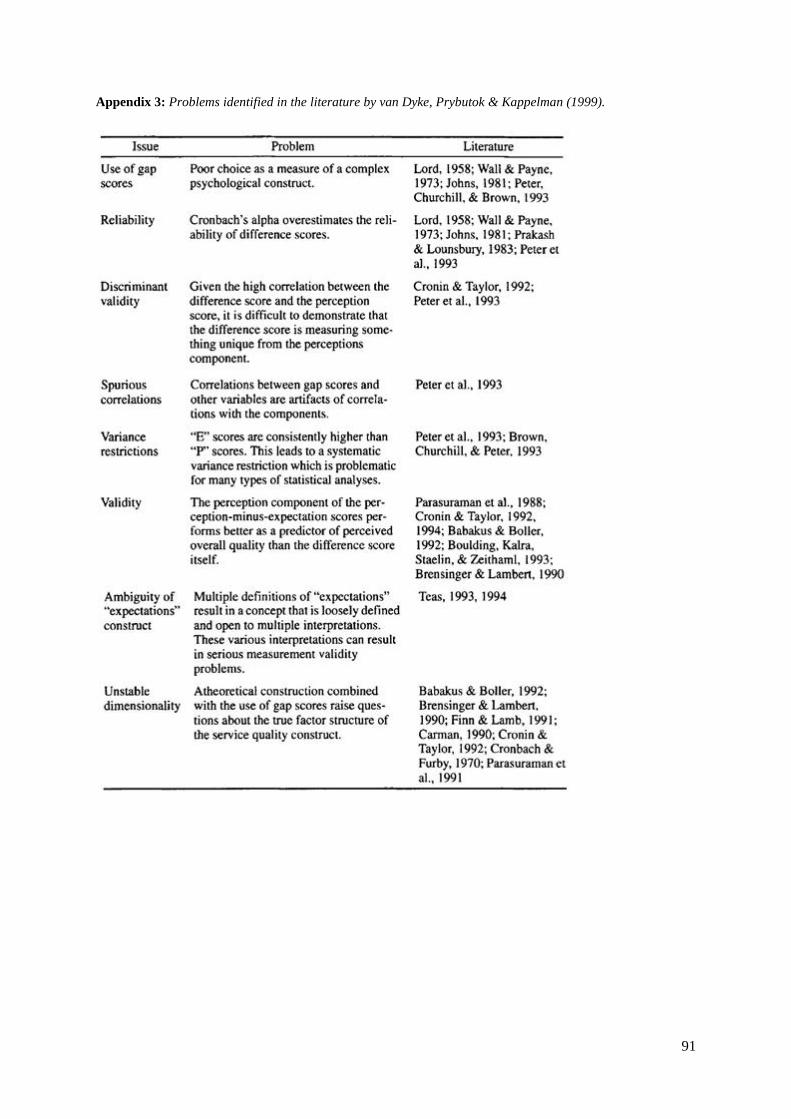
widely used in the service-industry, but at the same time also criticized in literature. Both articles by
Gounaris (2005) and by Van Dyke, Prybutok & Kappelman (1999) reviewed the most important
theoretical and empirical difficulties found by other authors in literature. The two reviews have a lot
in common. The summary by Van Dyke et al (1999) is used here and is based on secondary based
references. These references can be found in a framework in appendix 3.
The difficulties associated with the SERVQUAL measurement tool are grouped in four categories:
Page 20
19
(1) use of difference- or gap scores,
(2) poor predictive and convergent validity,
(3) ambiguous definition of the “expectations” construct, and
(4) unstable dimensionality.
(1) Use of difference- or gap scores
In general it appears that gap scores are less reliable than scores that are not based on differences.
Using gap scores is a poor choice as measurements of psychological constructs. Other difficulties
include low reliability, poor discriminant validity, variance restrictions and spurious correlations. For
example, studies demonstrate that Cronbach‟s alpha (a method of estimating reliability) is
inappropriate for gap scores, because the reliability of a gap score is dependent on the reliability of the
component scores (the dimensions) and the correlation between them. Thus, if the correlation of the
dimensions increases, the reliability of the gap scores is decreasing. As a consequence, the Cronbach‟s
alpha tends to overestimate the reliabilities of the difference scores when the component scores are
highly correlated. Also, evidence has been found that expectations about the performance of the
service changes after the service has finally been used, leading to less reliability of gap scores.
(2) Poor predictive and convergent validity
Several studies show doubts about the predictive and convergent validities of the measure. Evidence
has been found about the poor predictive validity of SERVQUAL, and the superior predictive and
convergent validity of perception-only scores was confirmed. The perception component of the
perception minus expectation (P – E) scores performs better as a predictor of perceived overall quality
than the difference score itself. In other words: studies have tested a performance-only versus
difference score operationalization, and most have found the performance-only model to be superior.
(3) Ambiguous definition of the “expectations” construct
The ambiguous definition of the SERVQUAL expectations construct results in a concept that is
loosely defined and open to multiple interpretations. This problem leads to various definitions such as
desires, wants, what a service provider should possess, and the level of service a customer hopes to
receive. These various interpretations can result in potentially serious measurement validity problems.
(4) Unstable dimensionality
Several studies have claimed that the five dimensions from the SERVQUAL instrument are unstable
and that this is not just a statistical curiosity. The scoring procedure for SERVQUAL calls for
averaging the P - E gap scores within each dimension. That means that a high expectation coupled
with a low perception for one item would be „cancelled‟ by a low expectation and high perception for
another item within the same dimension. This scoring method is only appropriate if all of the items in
that dimension are interchangeable. However, given the unstable number and pattern of the factor
structures, averaging groups of items to calculate separate scores for each dimension cannot be
justified.
Page 21
20
This summary helps being aware of the weaknesses of SERVQUAL. For instance, it is not
recommended using the perception minus expectation (P-E) scores. A better alternative is using
scores that are not based on differences by asking customers by asking customers their opinion only
after a service has been delivered. Besides SERVQUAL will not always be useful in all kinds of
branches. Mutations of SERVQUAL instruments exist that match better with the B2B PSF context
and have solved the discussed weaknesses above.
2.3 Models generated out of the criticism
A few related instruments, like SERVQUAL, that are more specifically developed for B2B service
firms will be discussed here. The comments are known and taken into account by other researchers,
for instance by Gounaris (2005). Over the years the SERVQUAL measurement tool has been
developed and customized especially for certain sectors. In the introduction was stated that there is a
difference between B2C and B2B market. B2B services are more complex in comparison with B2C
and because of the complexity more dimensions are needed for measuring service quality. These
adjustments for the B2B sector has been a trend over the last decades. Originally the SERVQUAL
model was mainly used for the B2C market.
Carman (1990) has also made an assessment of the SERVQUAL dimensions. He concluded that the
wording and subject of some individual items need to be customized to each service setting. Carman
(1990) argues that although the stability of the SERVQUAL dimensions is impressive, he found
evidence that the original dimensions are not completely generic. He concluded that items on some
dimensions should be expanded if that is necessary for reliability. Parasuraman (1998), who
developed the original model, recognizes that the measure instrument can, when necessary, be
adapted to fit the characteristics of a particular organization. This last sentence is an important fact
and for Tijs-ICT it will be investigated if it is necessary to adapt an existing measure instrument. In
literature different mutations of the SERVQUAL instrument and its dimensions can be found.
Interesting for this research are scales and models developed for measuring (professional) service
quality in the B2B context. Underneath an introduction of the models will be outlined:
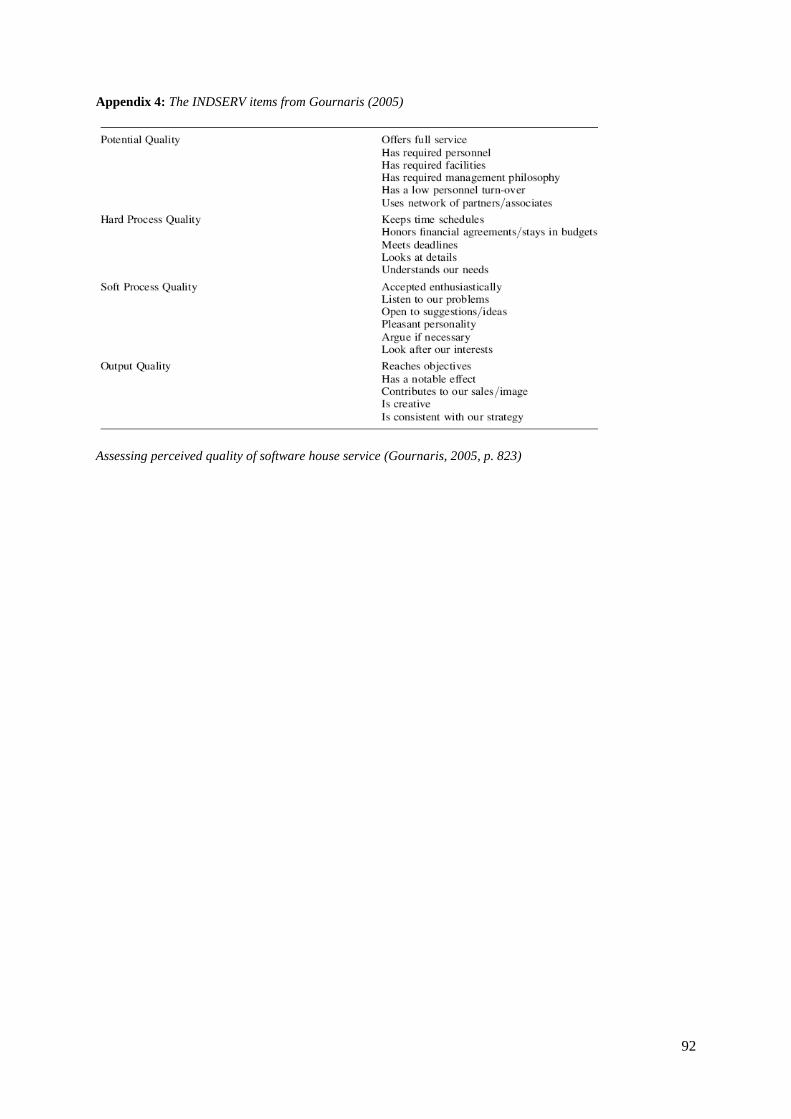
- INDSERV model by Gounaris (2005) is developed especially for the B2B market. The INDSERV
(Industrial Service) model of Gounaris took into account the major criticism on SERVQUAL.
Gounaris evaluated the SERVQUAL scale for assessing perceived quality of software house
services. His used dimensions are: potential quality, hard process quality, soft process quality and
output quality. Further details of these dimensions and related items are described in appendix 4.
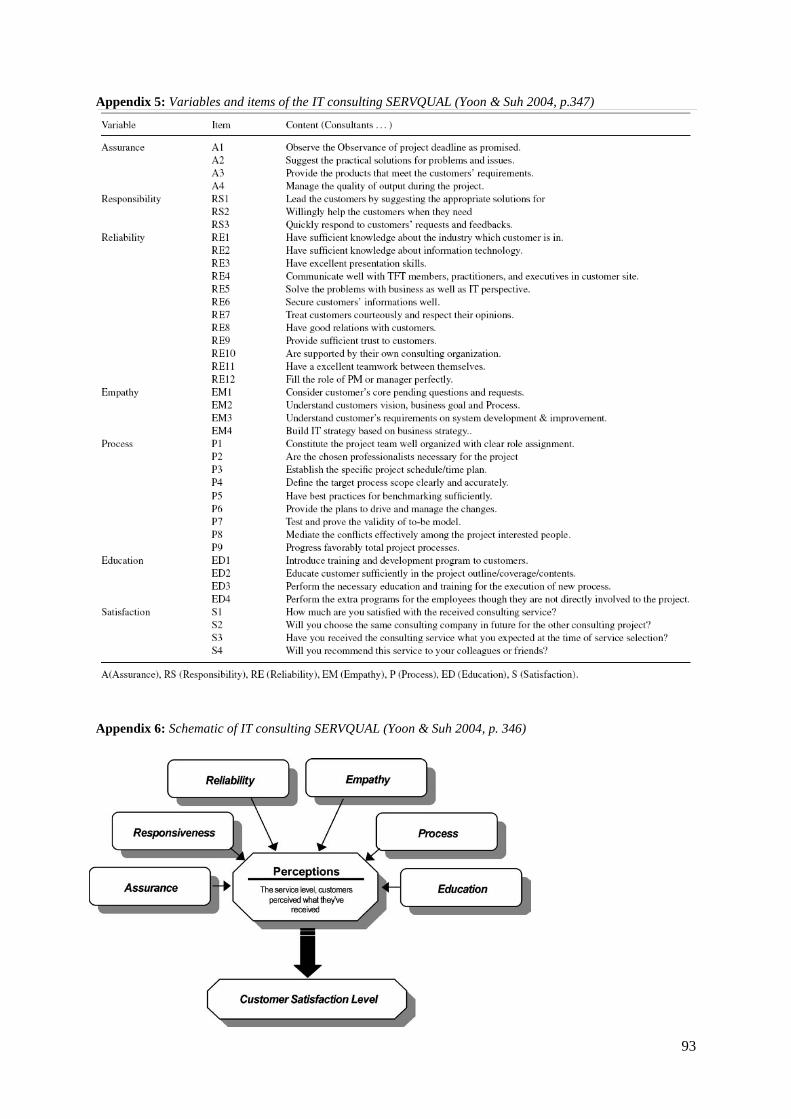
- IT consulting SERVQUAL by Yoon & Suh (2004) is a scale developed for measuring quality of
consultancy service activities within the IT-industry. Consultancy services are complex and
professional services that are often delivered within a long term relationship between the
provider and the customer (B2B). The results of this study demonstrate that the six different
Page 22
21
dimensions within the measure instrument significantly related with the level of customer
satisfaction. Yoon & Suh (2004) conclude that their model can identify problems within the
service quality and from the information of these problems plans for improvement can be
formulated. Their constructed dimensions were examined by 7 experienced consultants,
consultancy clients and two professors and were applied to 86 respondents of 42 different
organizations. All items from the IT Consulting SERVQUAL scale can be found in appendix 5.
The seven dimensions/variables are: assurance, responsiveness, reliability, empathy, process,
education and satisfaction.
- IMP INTERACTION Model by Woo & Ennew (2005). They adopted an existing model and
reexamined it in particular to investigate B2B professional service quality. This tested and
transformed model identifies six dimensions in total: four dimensions of exchange: (1)
product/service exchange, (2) financial exchange, (3) information exchange, and (4) social
exchange in a relationship. Plus two longer term aspects of that relationship: (5) cooperation and
(6) adaptation. (See appendix 7).
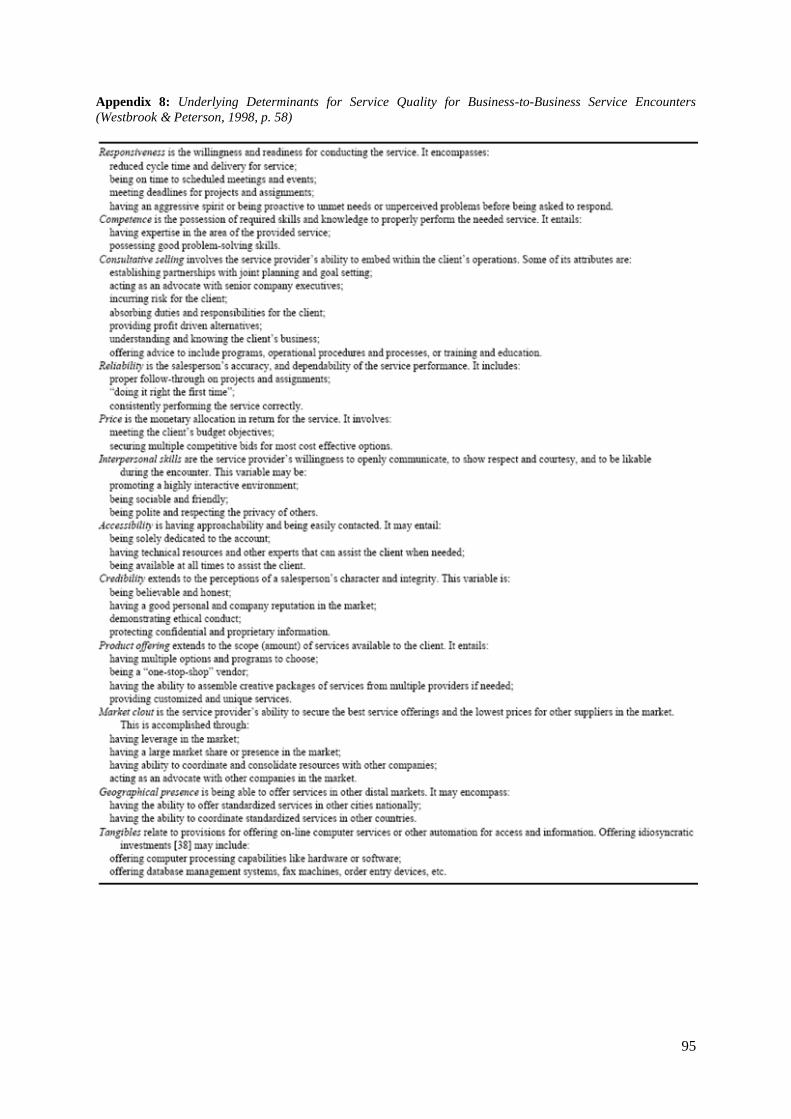
- The scale of Westbrook & Peterson (1998). In this study underlying determinants in a B2B
setting are evaluated and other explored variables are added. For instance the dimension
„consultative selling‟: sellers who actively participate in the operations of the client to include
mutual goal-setting and consulting for the improvement of the overall profitability and
operations. In total they used twelve dimensions: responsiveness, competence, consultative,
reliability, price, interpersonal skills, accessibility, creditability, product offering, market clout,
geographic presence, tangibles (see appendix 8).
- Another similar model is the one by Vandaele & Gemmel (2004) which is almost totally based on
the model by Westbrook & Peterson (1998). Vandaele & Gemmel tested a reliable and valid
instrument (the scale of Westbrook & Peterson) with the aim to measure the perceived service
quality in a B2B setting. The result of their study is called the B2B SERVQUAL scale and can be
found in appendix 9.
All these discussed measurement instruments offer dimensions that are suitable for measuring the
(professional) service quality in the B2B market. With these instruments the customers view can be
identified in a reliable and valid way. In chapter 4 a combination of these instruments will be used to
develop a customized questionnaire for Tijs-ICT for conducting a customer satisfaction research.
Before starting such a research, it is very important to keep in mind the purpose of a customer
satisfaction research: to learn and benefit from customer feedback for continuous improvement.
Therefore, a second literature search will be done (see chapter 3) on how to respond on customer
satisfaction data for continuous improvement. The knowledge collected in chapter 3 will contribute to
a good preparation of an effective customer satisfaction measurement tool. For instance, by discussing
some lessons learned from experience and by generating more relevant questions.
Page 24
23
Chapter 3: How to respond to customer satisfaction data, for
continuous improvement?
Theory, part II
In chapter 2 „customer satisfaction‟ was discussed in a B2B setting in the service industry. In addition
to a few definitions and the explanation of the relationship with „service quality‟, a few models on
how to measure customer satisfaction were summarized. The empirical research (on customer
satisfaction at Tijs-ICT) will be developed in chapter 4, but first in chapter 3 literature will be
reviewed on how firms can best benefit from collected data about their customers. The final goal of
this customer satisfaction research is to benefit from and improve services after collecting data. By
analyzing the results of this research, firms can better adjust to the expectations of customers.
Indicated data must be transformed into operational action plans for fine-tuning the relationship with
the customer. Lessons must be learned, adopted and implemented, but how can firms succeed in
improving their customer services? This will be answered in this chapter. First in §3.1 „continuous
improvement‟ will be defined, in §3.2 the goals and the benefits will be discussed and finally in §3.3
several approaches on how to respond to customer satisfaction data for continuous improvement will
be presented.
3.1 Definitions
Continuous improvement in this perspective is defined here as continual change to meet customers‟
needs. Kuhn (2000) sees continuous improvement as a paramount concern and defines it as one of the
core methodologies to sustain and guarantee quality of products and services. Issac, Rajendran &
Anantharaman (2004) add: quality improvement is not a specific destination but a continuous journey
on a long-term basis. Improvement should be viewed as an ongoing process in the sense that once
targets are met, new ones must be set, aiming for even higher levels of service efficiency.
Changes in customer requirements and expectations should correspond with changes in the process of
delivering products and services to satisfy the customer as best as possbible. These changes will act as
a continuous cycle (Issac et al, 2004). Chalmeta (2006) emphasizes that it is essential for continuous
improvement that value must be added to what is really important to customers, and not to the points
the company thinks are important.
A link should be made between customer feedback and continuous improvement. Dawes & Rowley
(1999) mention various approaches used to provide organizations with feedback on customer
perceptions of their service quality. A range of tools can be used to measure service quality: customer
surveys, suggestion boxes, complaints procedures, focus groups, participation and consultation, or
other tools of gathering feedback from customers. The most valuable information such tools provide
is often related to negative quality, and specifically to the identification of areas in which there is
Page 25
24
scope for improvement Dawes & Rowley (1999). In this research customer surveys will be used, but
also will be tried to ask customers for suggestions and give them the opportunity to complain.
The study by Phipps (2001) can be used to explain in short the relevance of continuous improvement
the way it is meant in this research. His article is originally intended for measuring service quality for
libraries, but it has a few general comments that can be used as a short introduction for this chapter.
Phipps argues that the primary focus should be on understanding customers‟ needs, learning quick and
clean methods of data gathering and analysis, improving critical processes, and developing internal
capacity to be successful in the future. For such inquiry the organization should start with what Phipps
calls: listening and acting on the voices of customers, so knowledge about customer requirements will
increase. By collecting service quality data, it should be identified what is working well and what is
not. Collecting data must be easy, meaningful, and clearly related to customer satisfaction for staff to
commit performance measures. This data can be used to develop performance and learning goals to
support continuous customer focus. Finally, the customer perspective must be integrated into planning
and decision-making, practicing the disciplines of the learning organization. This will ensure the
development of the organizational capacity to respond better to customer needs with the purpose to
continue serving customers in the future. (Phipps, 2001)
3.2 Goals and benefits of Continuous Improvement
In this section the goals and benefits of continuous improvement in the area of customer satisfaction
will be highlighted, like gathering a better competitive advantage in the market and building long-
term relations with customers. Subsequently, section 3.3 elaborates on how continuous improvement
can be applied to exploit these potential benefits.
Competitive advantage
Firms can achieve a competitive advantage by offering more value to customers. (Campbell, 2003;
Chalmeta, 2006). Improving customer experience can differentiate firms from their competitors.
Brentani & Ragot (1996) stresses that service firms must have a good understanding of their
customers' problems and they must use approaches that lead to substantially better solutions than what
competitors offer. Service firms must be the first to handle problems in a novel way, to apply new
technologies, or incorporate innovative processes. Those points are the key for achieving a
competitive advantage. According to Brentani & Ragot (1996) service providers must concentrate on
all facets of the service offering. The service offering consists of providing benefits that are perceived
as unique by customers, on creating a satisfactory experience for the customer.
Zairi (2000) mentions the same opportunity as well. He states that business organizations must put the
customer on the first place. True competitive advantage will only be established through excellence in
customer value and the ensuring relentless care and attention provided. An external customer-focused
Page 26
25
and market-oriented approach is what firms should have (Zairi, 2000). Listening well to customers is
the best way to understand customers. Results of customer feedback must be interpreted and help to
build a more customer-driven organization. The organization must respond to this customer feedback
and should make (little) changes and continuous service improvement will be driven through a
combination of quick fixes but especially for long-term organization re-engineering. (Donovan &
Samler, 1994)
Long-term Customer Policy and the role of Trust
Another benefit is explained by Rust, Zahorik and Keiningham (1995): service quality improvement
results in increased perceived quality and customer satisfaction and possibly also can result in reduced
costs. Increased customer satisfaction in turn leads to higher levels of customer retention and positive
word-of-mouth. As a consequence revenues and market share go up, driven by higher customer
retention levels and new customers attracted by the positive word-of-mouth. The increased revenues,
combined with the decreased costs, finally lead to greater profitability. (Rust et al, 1995)
Continuous improvement is policy based on the long run. Reichheld & Sasser (1990) argue that
continuous improvement in service quality should not be seen as a cost, but as an (long-term)
investment in customers that generates more profit than the margin on a one-time sale. By
consistently providing goods and services that satisfy customers, profitability should increase by
reducing failure costs (Anderson, Fornell, & Lehmann, 1994). Thus, quality has to be defined in the
same way customers do. Otherwise the wrong actions may be taken and money and time may be
poorly invested. Grönroos (2000)
The role of trust is related to long-term policy and building customer relationships. Montoya, Massy,
Khatri (2010) explain that for a service organization, performance is ultimately about customer
satisfaction and quality of service delivery. Montoya et al (2010) found in their literature review that
the importance of building relationships with customers and trust is well documented in the marketing
literature. Customer satisfaction research empowers the relationship with customers and is in a sense a
marketing tool. Providers should not ask for feedback from the same customers too often. This can be
experienced as annoying by the customer. The aim is just giving customers a signal indicating that
their wants/needs are taken seriously and that the firm uses their feedback to implement
improvements. Showing the customer that their feedback is seriously taken into account will
strengthen the relationship and is important for trust. The end of a project does not always mean the
end of a business relationship. This remark is essential because loyal customers generate increasingly
more profits each year they stay with the business. Reichheld & Sasser (1990, p. 107) illustrate this:
'many people will pay more to stay in a hotel they know or go to a doctor they trust than to take a
chance on a less expensive competitor. The company that has developed such a loyal following can
charge a premium for the customer‟s confidence in the business‟.
Page 27
26
Communication
Watson, Pitt & Kavan (1998) point to the advantage of improved communications with customers. IS
(Information Systems) managers believe that their communication through newsletters, bulletin
boards, etc., has paid off: customers know who they are and how to contact them. Both cases in this
study by Watson et al (1998) decided that enhancing communication with their customers was critical
for improving service quality. An important lesson was that service personnel must communicate
honestly, so that customers' expectations and promises coincide. A second lesson is that the CIO must
pay ongoing attention to service quality. Alsup (1993) sees customer-focused communication as the
key to total quality success: the one universal barrier is the lack of communication skills to conduct
customer-focused communication. In a high-tech world this should not be necessary according to
Alsup, because modern human communication technology exists and can help.
To develop competitive advantage firms can improve the way they communicate and handle in the
best interest of the customer. For the delivery of a service, interaction and dealing with customers is
an essential part. The customers should make clear what kind of service they expect and the provider
must react by offering a proposal what they can deliver that best matches the customers‟ demand. This
is not as easy as is described here. It is more complex because in many cases the customer does not
always know what he needs and what is in the best interest of the company. Besides, only the service
provider has the professional expertise and it is a huge task to discover what is the best solution.
Finally, Chang (2005, p. 414) describes a solution how to find out customers‟ expectations: with a
continuous improvement cycle. This cycle consists of (1) establishing customer requirements, (2)
meeting the requirements, (3) measuring success, and (4) continue check customers‟ requirements to
find areas in which improvements can be made. The greatest impact of such a total quality
performance measurement is an increased focus on customers. Performance measurement can also be
used to measure customer satisfaction. Chang indicates that customer surveys are by far the most
commonly used performance measurement technique to measure customer satisfaction and
benchmark competitors. Two relevant long term goals of TQM performance measurement are
identified in his study. Long term goals should be (1) continuous improvement in performance and (2)
maximizing customer satisfaction by adapting to change in customer requirements. (Chang, 2005)
Page 28
27
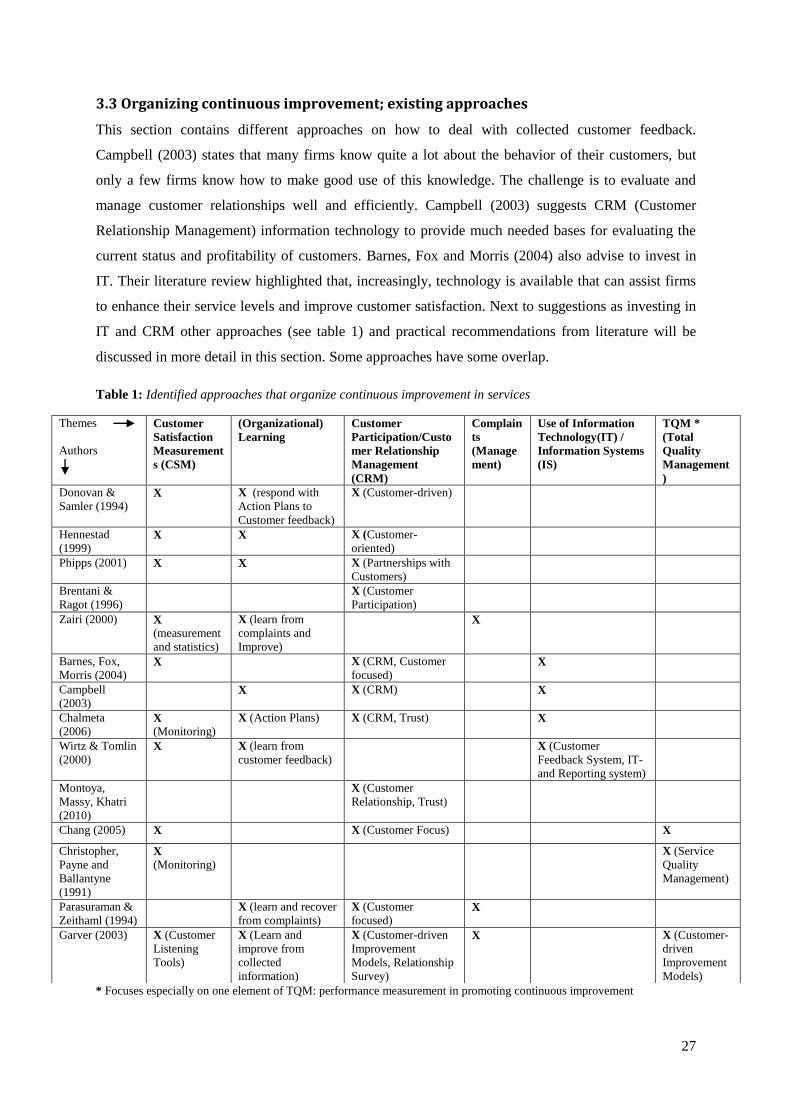
3.3 Organizing continuous improvement; existing approaches
This section contains different approaches on how to deal with collected customer feedback.
Campbell (2003) states that many firms know quite a lot about the behavior of their customers, but
only a few firms know how to make good use of this knowledge. The challenge is to evaluate and
manage customer relationships well and efficiently. Campbell (2003) suggests CRM (Customer
Relationship Management) information technology to provide much needed bases for evaluating the
current status and profitability of customers. Barnes, Fox and Morris (2004) also advise to invest in
IT. Their literature review highlighted that, increasingly, technology is available that can assist firms
to enhance their service levels and improve customer satisfaction. Next to suggestions as investing in
IT and CRM other approaches (see table 1) and practical recommendations from literature will be
discussed in more detail in this section. Some approaches have some overlap.
Table 1: Identified approaches that organize continuous improvement in services
* Focuses especially on one element of TQM: performance measurement in promoting continuous improvement
Themes
Authors
Customer
Satisfaction
Measurement
s (CSM)
(Organizational)
Learning
Customer
Participation/Custo
mer Relationship
Management
(CRM)
Complain
ts
(Manage
ment)
Use of Information
Technology(IT) /
Information Systems
(IS)
TQM *
(Total
Quality
Management
)
Donovan &
Samler (1994) X X (respond with
Action Plans to
Customer feedback)
X (Customer-driven)
Hennestad
(1999) X X X (Customer-
oriented)
Phipps (2001) X X X (Partnerships with
Customers)
Brentani &
Ragot (1996)
X (Customer
Participation)
Zairi (2000) X
(measurement
and statistics)
X (learn from
complaints and
Improve)
X
Barnes, Fox,
Morris (2004) X X (CRM, Customer
focused) X
Campbell
(2003) X X (CRM) X
Chalmeta
(2006) X
(Monitoring)
X (Action Plans) X (CRM, Trust) X
Wirtz & Tomlin
(2000) X X (learn from
customer feedback) X (Customer
Feedback System, IT-
and Reporting system)
Montoya,
Massy, Khatri
(2010)
X (Customer
Relationship, Trust)
Chang (2005) X X (Customer Focus) X
Christopher,
Payne and
Ballantyne
(1991)
X
(Monitoring) X (Service
Quality
Management)
Parasuraman &
Zeithaml (1994) X (learn and recover
from complaints)
X (Customer
focused) X
Garver (2003) X (Customer
Listening
Tools)
X (Learn and
improve from
collected
information)
X (Customer-driven
Improvement
Models, Relationship
Survey)
X X (Customer-
driven
Improvement
Models)
Page 29
28
3.3.1 Collect Feedback and React with action plans
This approach suggested by Donovan & Samler (1994) demonstrates that results of the collected
feedback must be analyzed and interpreted into action plans that can realize improvement. Valuable
feedback can help to build the organization more customer-driven. A manager or a responsible
department should be responsible for the analysis and the service improvement what leads to a higher
customer satisfaction level. The task of this responsible manager or department is making (little)
changes happen in response to the collected customer feedback. With these adjustments continuous
service improvement is driven through a combination of quick (short term) fixes and long-term
organization re-engineering (Donovan & Samler, 1994). The responsible manager should monitor the
developments carefully. Every period (for instance at the end of each month or quartile) the manager
can discuss the results with the people involved. Together they can formulate specific action plans.
For the next meeting new information can be discussed and it should also be evaluated whether
improvements worked out positively.
Donovan & Samler argue that identified survey results must be credible; action oriented; and they
must have operational implications. It must be understood by the people involved that it will not be
possible to immediately tackle all the issues raised. Actions need to identify a number of priority
issues. Tasks must be clearly assigned to individuals or responsible improvement teams, as well as the
fundamental problems that require changes to business strategy or processes (or even demand
significant new investment). The study by Donovan & Samler also warns that a firm should not
overpromise and under-deliver in its dealings with customers, employees, or other people involved.
An important (new) task for the organization is to communicate back and schedule what the
organization has learned, what it is doing as a result and what the benefits are that customers can
expect in the short term (little fixes) and in the long term. Online access to customers information
systems and databases can be an effective way of making material available quickly and consistently
to large numbers of people within or outside the organization.
Another study, by Christopher, Payne and Ballantyne (1991) also recognizes the importance of
communication and how staff can cooperate to implement practical improvements. They suggest it is
a marketing role. Christopher et al argue it is a marketing responsibility to take charge of
collaborating in service quality management. The authors explain what service quality management
is: „planning and organizing improvement continuously, as well as monitoring customer service
requirements externally and controlling the service support processes internally‟.(Christopher et al,
1991, p. 4) This collaborative role, in liaison with operations and personnel managers, is meant to get
the internal „exchange‟ processes right. Another aspect recognized by Christopher et al is concerned
with how staff work together across functional boundaries so that work is attuned to the company‟s
mission, strategy and goals. The importance of this is transparent in service organizations where, back
up support is needed for the staff interface with the customer. All members of the staff are part of a
Page 30
29
process which connects with the customer at the point of interface. The inclusion of people (staff) and
processes (work activities) has special significance. These elements can be considered as service-
quality drivers; they are elements which most underpin quality and customer service improvement.
Staff should input in idea generation and problem solving. Besides, employees should always have
self directed responsibility, which means having real commitment to quality and customer satisfaction
during the complete service delivery. (Christopher et al, 1991)
3.3.2 Customer Feedback Systems (CFS)
The key objective of a good CFS according to Wirtz & Tomlin (2000) is to learn from customer
feedback in an institutionalized, continuous manner. Key factors of (overall) satisfaction they
identified are: product quality, service quality, expected values from the image / brand; and expected
price/ budget factors. These key factors are typically shaped by different parts of the organization,
need different management approaches for improvement, and have different time horizons of
management. In other words, service quality is the result of millions of customer interactions. A CFS
systematically obtains feedback and stimulates improvement. Wirtz & Tomlin summed up seven
components of an effective CFS:
(1) service indicators, standards and performance targets;
(2) feedback collection tools and feedback process management;
(3) a reporting system;
(4) a service recovery system;
(5) an IT system;
(6) a team learning system;
(7) the organizational positioning of a CFS.
The components listed here, will not be discussed in detail. What can be learned from this list is, for
instance, the use of an IT system allowing for speedy capture and dissemination of information. To
aim at continuous improvement and learning, a reporting system should be designed to facilitate
feedback to front-line staff, process owners, department managers and top management. Wirtz &
Tomlin suggest a long term planning. It consists of three types of service performance reports:
- Monthly service performance update provides process owners with timely feedback on
customer comments and operational process performance. Here, the feedback is provided to
the process manager, who can in turn discuss them with his service staff.
- A quarterly service performance review provides process owners and branch or department
managers with trends in process performance and service quality.
- Finally, an annual service performance report gives top management a representative
assessment of the status and long-term trends in the satisfaction of customers with the firm's
services. (Wirtz & Tomlin, 2000)
Page 31
30
The most effective organizational structure for managing a customer feedback system is a centralized
Customer Feedback Unit (CFU) that owns the system and encourages the various departments to
provide inputs to the system and use the customer and process knowledge gained from it. For a
midsize organization a complete department would be undue, but a (Service) manager can take care of
such a CFS. With the contribution of a CFS valuable information can be shared, and only for people
who need the information that is relevant for them. Confronting employees with valuable customer
feedback makes employees think and act more customer-oriented. With a tool like CFS the prior tasks
that should be improved first can easily be identified. With a priority list/report it can be checked over
time if issues have been solved and any progress has been made. Customer-driven organizations
understand this process. Rather than just fix the issues raised by a tool like CFS, they pro-actively
research their former customers‟ experiences. (Wirtz & Tomlin, 2000)
Also Garver (2003) developed a CFS, but he called his system a „customer-driven improvement
model. Garver has modified traditional performance-importance analysis from literature and has
expanded customer-driven improvement models. Through qualitative research, he has developed a
guide for identifying continuous and breakthrough improvement opportunities (for best practice
companies). His customer-driven improvement model consists of six chronological steps:
(1) examine performance-importance analysis with multiple customer listening tools;
(2) conduct complementary improvement analysis;
(3) assess firm capabilities;
(4) examine improvement costs;
(5) estimate ROI of improvements;
(6) select attributes, set goals, and monitor improvement performance.
The steps summed-up above will be explained here in more detail:
- The first step consists of analyzing performance (typically used to assess performance related to
standards such as top-box performance, best competitor, and satisfaction goals) and analyzing
importance (employing a variety of statistical tools). This performance-importance analysis must be
conducted using data from multiple customer listening tools. The following listening tools are very
useful to identify continuous improvement opportunities: critical incident survey, relationship survey,
benchmark survey, customer complaints, won–lost and why survey, and customer contact employees
(these listening tools are further explained by Garver, attached in this paper in appendix 3.
- Secondly, next to the performance-importance analysis for identifying continuous improvement
opportunities also using complimentary improvement analysis must be conducted for each customer
listening tool. Garver suggests other relevant analysis as trend analysis, verbatim analysis, and delta
chart analysis. An (practice)example from an interview by Garver (2003, p. 464) suggests: „We have a
system set up now with our surveys, where we can take all of verbatim comments. We gather these up
and publish them. We send them out to the key people within the company, so they can see what the
Page 32
31
customer is saying. Now we‟re about a month away from posting all these verbatim comments from
customers on our Intranet‟.
- Thirdly, once the data has been analyzed and improvement opportunities have been identified, firms
look internally to assess their (potential) capabilities, expertise and resources to determine whether or
not it is feasible to undertake the improvement initiative. Garver suggests at this point the following
questions should be asked (Garver, 2003, p. 464):
All things considered, is it currently feasible to undertake this improvement initiative?
Do we currently have expertise in this area?
Do we want to develop expertise in this area? (strategic level)
Do we have the capabilities to make the necessary improvements?
Can we outsource the necessary capabilities and expertise?
- Fourthly, the costs of each improvement initiative must be examined in order to determine whether
or not the firm can afford to improve. At this point the firm needs to examine if the necessary
resources are available and consider if the firm can afford (in costs) to make the improvement.
- Fifthly, over time the financial impact of improving must always be evaluated by way of assessing
for example the Return on Investment (ROI) of each improvement initiative.
- Sixthly, once attributes have been selected to be improved, reasonable customer satisfaction goals
must be set and in the future improvements must be monitored. With measures and scores over time it
can be assessed whether they have led to success. Afterwards it allows the managers responsible to
assess if initiatives have been successful or have failed. This last step is sometimes overlooked, but is
particularly important for evaluation. (Garver, 2003)
An important conclusion and recommendation from this study is the importance of integrating
customer performance measures with internal performance measures to identify improvement
opportunities. Multiple customer listening tools can be used together for a better understanding of
customers and for identifying customer service attributes for improvement (Garver, 2001, 2003).
3.3.3 Customer Relationship Management (CRM)
Another approach: CRM. First of all Chalmeta‟s (2006) view will be given about handling CRM,
secondly the CRM-study by Campbell (2003) will be presented. Both studies have some overlap.
Chalmeta (2006) defines CRM as: „a set of business, marketing and communication strategies and
technological infrastructures designed with the aim of building a lasting relationship with customers,
which involves identifying, understanding and meeting their needs‟. (Chalmeta, 2006, pp. 1023-1024).
Page 33
32
Chalmeta presents a methodology for directing the process of developing and implementing a CRM
system that considers and integrates various aspects, such as defining a customer strategy, re-
engineering customer-oriented business processes, HRM, the computer system, management of
change and continuous improvement. Chalmeta advocates a customer focused form of organization,
which maximizes the value customers can expect from the company. In this context CRM refers to a
customer-focused business strategy and relational marketing. For an organization that implements
CRM must dynamically integrate sales, marketing and the customer care service to create and add
value for the company and its customers. As a result, the implementation of a CRM system will
involve changes in the organization and operations, resulting in an improvement in its performance
and competitiveness. This improvement covers for instance the corporate objective to greater
customer satisfaction, by way of offering a better service. Other corporate objectives are: (1)
increasing the effectiveness of providing customer service by having complete, homogeneous
information and (2) improving and extending customer relationships. By offering this added value in
the long term, it will be possible to improve customer satisfaction and loyalty. This competence is
essential for increasing the competitiveness of companies and achieving customer objectives. For
improving customer satisfaction, it is necessary to clearly identify customer needs and expectations
and next ensure they are met. This requires a construction of a measurement information system fed
with relevant information and stored activities. Part of this monitored information will come directly
from the customer (via for instance a customer survey) and part will be extracted from the company‟s
computer system (information the firm already has). History data within the information system will
enable staff to know at all times who the customer is and what the customer has requested before. The
CRM system must maintain an up-to-date record of all movements with customers (such as
preferences, purchases, complaints and earlier contacts with the firm). This allows more personalized
service. (Chalmeta, 2006)
A quality assurance method must be established to check if desired changes have been implemented
effectively. If necessary, quick actions must be taken as any mismatches may occur. It often happens
that managers clearly see that the organization has to change but do not manage to achieve this
properly. A manager‟s task is to make sure the organization implements and develops this change. For
example through developing a communication plan or the creation of working teams which are
responsible for making the change happen. (Chalmeta, 2006)
Campbell (2003) studied CRM as well and found that more researchers have extolled the potential of
CRM. Various researchers see CRM as an opportunity for firms to achieve a competitive advantage
by offering more value to customers (Campbell, 2003). From the market, more customers expect from
service firms that they implement CRM programs. However, Campbell found that little is known
about the internal processes that assist organization-wide learning about CR. Besides, many firms
know quite a lot about the behavior of their customers. But the problem is how can firms make good
Page 34
33
use of this knowledge and improve their service? In his study he states that firms must create a
customer knowledge competence. This can be achieved by managing CRM programs strategically. A
developed framework in the study of Campbell, is based on five different case studies (Canadian
financial services firms). These service firms got the challenge of how to evaluate and manage CR
efficiently. To achieve better access to their customers, these firms have turned to a CRM information
technology. With this technology firms provided a base for evaluating the current status and
profitability of each customer. It has proven this leads to a better understanding in order to serve
customers better. (Campbell, 2003)
For generating and integrating this customer knowledge competence four organizational processes
identified by Campbell can contribute: (1) a customer information process; (2) marketing– IT
interface; (3) senior management involvement; and (4) employee evaluation and reward systems.
In case studies by Campbell „customer feedback loops‟ were utilized in the data mining process to
enrich existing information and for use in strategy formulation. For continuous improvement
managers: „need to complement new CRM technologies with organizational processes that integrate
customer information throughout the firm; improve the strength of ties between marketing and IT
departments; signal senior management involvement; and encourage employees to adopt new
customer-focused behaviours both within the firm and with external customers. (Campbell, 2003, p.
382)
Finally Campbell concludes that gaps between customer requirements and the firm‟s offerings can be
closed only by mutual sharing. Information, ideas, and goals of the marketing and IT departments
should be shared and aligned with each other.
Viewing the customer as a partner
Brentani & Ragot (1996) view the customer as a partner and this approach corresponds widely with
CRM as discussed in the section above. Brentani & Ragot argue that developing new and improved
services is becoming increasingly important. Especially for firms that offer professional services. In
(B2B) professional services, customers frequently form an integral part of the service offering. Here
the authors go one step further than the other approaches. Brentani & Ragot say customers often
participate in the development and/or production of services. Providers have the opportunity to work
with customers as potential partners and create new service products that truly respond to customer
needs or requirements. Brentani & Ragot see customer participation as a factor with an external
orientation. This strong external orientation can be exploited. New services are superior to
competitive offerings both in terms of uniqueness and innovativeness and in that they fully take into
account the characteristics, concerns, and needs of customers.
Page 35
34
For a PSF (the) customer consideration becomes a key element. Brentani & Ragot conclude what is
important: firms must plan the right company-customer relationship, ensure excellent communication,
and train personnel in terms of communication and interaction skills.
3.3.4 Complaints Management
A different approach from CRM is: Complaints Management. First a few remarks are needed to
distinguish this approach from regular customer feedback surveys. Complaints Management is a
feedback form, however, here the initiative is taken by the customer. Complaints are only about
dissatisfaction, while customer feedback surveys also collect positive activities which can be taken to
future-projects. The goal in complaints management is the same: detect learning opportunities, (re)act
and finally improve. This topic will be discussed with studies by Garver (2003), Zairi (2000) and
Berry, Parasuraman & Zeithaml (1994).
Garver (2003) found that many firms collect customer complaints, but they rarely integrate these
complaint data with customer satisfaction data to identify improvement opportunities. The
investigated firms in the study by Garver (best practice companies) do carefully monitor complaints
successfully and track performance deficiencies that cause complaints. These firms also collect data
concerning the severity or priority of the complaints and their ability to satisfy the (complaining)
customers. Garver concluded that complaint data are very useful in combination with other listening
tools to identify customer service attributes needing improvement. (Garver, 2003)
Zairi (2000) argues that service firms must put the customer first. The main goal must be achieving
excellence in customer value and ensuing care and attention. In his study Zairi treats the issues of
complaints handling and management as essential for achieving customer retention and loyalty. Zairi
sees complaints as a way of receiving customer feedback, generating knowledge that can be used to
put into action improvement plans to optimize products and services. Complaints are useful to
measure performance and to indicate deficient areas of the business. Complaints can bring the firm
closer to the customer and can provide better understanding of when and why customers are
dissatisfied.
Zairi gives a few examples of best practice in complaints management. Encourage:
- proactive management of customer contacts and complaint resolution through joint teams;
- (team) handling of complaints is facilitated by a systematic management meeting process;
- that complaint management assessments are correlated with other customer satisfaction data
to give teams feedback on the quality of complaint management.
Zairi demonstrates some lessons learned at the National Roads and Motorists Association (NRMA, in
Australia). They use quality circles that consist of four principles: (1) satisfy your customers; (2)
Page 36
35
continually improve through small steps; (3) involve everybody in improvement and (4) control
through measurement and statistics. Next to these four principles, some more lessons are summarized:
- Gathering customer complaints: receive, log, and assign to a proper team. The assigned team
analyses, resolves, statuses and provides feedback. Finally the team closes the problem and
contacts the customer;
- The NRMA's culture of customer service is rooted in the belief that satisfying customers and
continual improvement is everyone's job. Staff and management as owners of work processes
learn continually from complaints and run the business with clearly defined customer
objectives, reviews and reporting systems supported by the right measures;
- Set up a clear intent to reward and encourage employee involvement and participation in
improving customer value and resolving problems;
- Develop a smart information infrastructure to provide easy dialogues with customers and that
information can be spread to all relevant employees to eliminate the causes of complaints.
- Analyze complaints and find out which complaints have the highest priority to be solved;
- Finally, an effective complaint system should be able to convert a dissatisfied customer into a
satisfied, loyal customer.
(Zairi, 2000)
Berry, Parasuraman & Zeithaml (1994) also investigated how to deal with complaints and thus
improve service quality (in the context of American firms). When a problem occurs, a firm must react.
The organization can make things better with the contribution of the customer. Firms should
encourage their customers to complain and firms must make it easy for them to do so. Managers can
also use proactive strategies, in which the firm contacts the customer first. This is important because
some customers may not complain, although there are serious problems. Questions such as „How can
we do better?‟ provide ideas for service improvement. Respond quickly and do not wait too long to
respond to dissatisfied customers. By responding quickly, a firm conveys a sense of urgency and
demonstrates that the customer‟s concern is taken seriously. Respond personally with a telephone call
or a visit or create another dialogue-opportunity to listen, ask questions, explain, apologize, and
provide a solution. In the area of HRM Berry et al (1994) also give a few suggestions. Personnel must
be trained how to act in problem-resolution positions. Employees should be given the authority to
solve most problems immediately. The firm should also invest in communication and information
systems for assistance and knowledge about the customer, the situation, the cause of the problem and
possible solutions.
3.3.5 Organizational Learning
Phipps‟ (2001) study deals with learning from the voices of the customers, the staff, the processes,
and the organization. He recognizes that partnerships with their customers can help to improve
Page 37
36
businesses. Phipps views this phenomenon of „organizational learning‟ in a broad perspective, namely
at the cultural level. He identifies a few aspects of cultural change: listening to the voices of the
customers by developing cooperative partnerships with them; and listening to the voice of the process
by learning continuous improvement methodologies to identify whether work processes are effective
and efficient.
Phipps made a list as well and described that a successful process improvement study largely depends
on: (1) discovering customer expectations, (2) analyzing where and why the process falls short of
those expectations, (3) creating and implementing solutions so the process will meet or exceed
customer expectations. Phipps advises to follow the famous „Plan – Do – Check – Act – cycle‟ to take
action after listening to the voices of customers. Responding to customer needs is essential for the
purposes of organizational learning and the ability to continue serving customers in the future. During
this process, personnel must adopt knowledge about how to deal best with corresponding
measurements and feedback-data. The utilization of outcome data from the customers‟ perception of
expected service quality should lead to a wider sharing and internal use of this information. This is
necessary for the purpose of improving processes and to engage in organizational learning. Further,
the application of learning can be accelerated through the utilization of teamwork. The different skills
and perspectives, from all parts of the organization, will lead to new ways of thinking and
questioning. Therefore staff is needed that is willing to commit to continuous learning. Phipps (2001)
Barnes, Fox and Morris (2004) add to this that firms must create an environment where employees are
motivated to be customer focused in their thinking. In order to achieve this, there need to be adequate
systems that reward and motivate employees who significantly contribute towards enhancing the
organization´s service quality. Encourage employees (with rewards) to forward ideas to help improve
the operations of the organization. Barnes, Fox and Morris (2004)
The last study related to organizational learning that will be discussed is by Hennestad (1999). He
confirms the previously discussed approach. His study is about infusing the organization with
customer knowledge. The study explores in practice the experiences of a company that learned to
become more customer oriented. It is about how a firm can generate learning opportunities as a
sustainable impact on its operations. The processes of joint construction are important factors in
putting the knowledge into use. Some relevant lessons from Hennestad are summarized here:
- develop quality feedback systems, allow corrections, and keep this agenda „hot‟;
- establish reward systems to sustain the interest for staff;
- integrate the follow-up into the planning, general management and meeting systems of the
company in order to secure a clear focus;
- continually report customer satisfaction measurements on a yearly basis.
Page 38
37
Hennestad suggests an internal evaluation procedure: if a negative incident is reported, it should be
included in the agenda for the next department meeting. In this meeting will be discussed what can be
done to make the customer happy, why this incident happened and how to change procedures in order
to avoid a reoccurrence. The presented case in this study has been tested in a real company and has
had positive outcomes: knowledge was generated, it was taken into use and it did have an impact.
New knowledge has been reflected in learning procedures. This case indicates that organizations can
transform themselves into a more customer-oriented firm with the help from their customers.
Hennestad (1999)
3.4 The use of the approaches discussed in this chapter
Organizations should not underestimate this second important step in customer satisfaction research,
as has been explored in literature above. Collecting customer feedback is one step, but benefitting
from the outcomes through implementing lessons is the second step an organization should take in
order to make a customer satisfaction research into a success. The discussed approaches have shown
many effective methods of how to deal with customer feedback. Service organizations that pursue
continuous improvement in the area of customer satisfaction can use these identified general
approaches. Every (ICT) PSF will have to assess for themselves which methods from literature best
suit them. The theory above contains many recommendations and advices that are interesting in the
phase after data collection and when action plans are formulated, but in this paper no research will be
done into the phases that follow. However, a few topics discussed in this chapter 3 will come back in
chapter 7: Recommendations.
It is important to realize that this current research is not set up to investigate which complete approach
(like CRM, CFS, TQM, etc.) would be the best approach for Tijs-ICT. Exploring these approaches
was done in order to be well prepared to start a customer satisfaction research. Chang (2005, p. 414)
described a solution how to find out customers‟ expectations: with a continuous improvement cycle.
This cycle consists of (1) establishing customer requirements, (2) meeting the requirements, (3)
measuring success, and (4) continue checking customers‟ requirements to find areas in which
improvements can be made. Thus, to state things clearly, for this (current) research only phase 1 of
the cycle will be investigated. (The other phases will have to be investigated in further research in the
future). Chang indicated that customer surveys are by far the most commonly used performance
measurement technique to measure customer satisfaction.
The literature review in this chapter provided knowledge that will be used for the scope of this
(current) research. To make a clear distinction what will be used and what will not here is a summing
up of what will be used from chapter 3:
Page 39
38
-Chalmeta (2006) emphasizes that it is very important for continuous improvement that value must be
added to what is really important to customers, and not to the points the company thinks are
important.
-Phipps argued that the primary focus should be on understanding customers‟ needs, learning quick
and clean methods of data gathering and analysis, and improving critical processes. For such an
inquiry Phipps advised to start with: listening to and acting on the voices of customers, so knowledge
about customer requirements will increase. By collecting service quality data, it should be identified
what is working well and what is not. Collecting data must be easy, meaningful, and clearly related to
customer satisfaction for staff to commit performance measures. This data can be used to develop
performance and learning goals to support continuous customer focus. (Phipps, 2001)
-Complaints management is an approach to collect bottlenecks and improvement points from
customers. However, in this approach the customer takes the initiative and by that time it is/may
already be too late. Therefore an approach where the organization itself takes the initiative is prefered:
a customer satisfaction survey will be used for this research. Clearly show the customer that the
organization is open for improvement and that it is appreciated when customers sound their voices.
-Dawes & Rowley (1999) mentioned various approaches used to provide organizations with feedback
on customer perceptions of their service quality. A range of tools they have discussed in their study
can be used to measure service quality. In this (current) research: customer surveys will be used, but
also customers will be asked for suggestions and will be given the opportunity to complain.
-Next to a measurement tool that will be used and selected from §2.3, Berry et al (1994) advised to
ask questions such as „how can we do better?‟ for generating ideas for service improvement.
-The approach suggested by Donovan & Samler (1994) demonstrated that results of the collected
feedback must be analyzed and interpreted into action plans that can realize improvement.
-Christopher et al (1991) advised that employees must be made aware of the importance of customer
satisfaction. All members of staff are part of a process which connects with the customer at the point
of interface. Employees should always have real commitment to quality and customer satisfaction
during the complete service delivery. Starting to create commitment directly at the beginning of the
customer satisfaction research is important for creating support at a later stage (when results and
action plans have become known). Creating support (and commitment) is the next step, following
awareness, to succeed in formulating plans. Creating support starts with the marketing department
telling the rest of the organization that and why a customer satisfaction survey is carried out. Showing
the questionnaire and asking managers for input is a first step in the right direction. At regular
Page 40
39
intervals staff has to be informed about the progress of the customer satisfaction research. Finally,
with a presentation the employees should be informed about the outcomes and follow-up plans.
Next, in chapter 4, a plan will be developed how to get customer feedback. After the results and
analysis (chapter 5) and after the conclusions (chapter 6), recommendations will be given about how
to implement lessons and realize continuous improvement. At that point, in chapter 7, the collected
knowledge of this chapter will certainly contribute in giving an advice to Tijs-ICT.
Page 42
41
Chapter 4: Methods
The theoretical knowledge as discussed in chapter 2 and 3 has shown that paying serious attention to
customer satisfaction contributes to continuous improvement. The literature review has provided
useful knowledge and serves as a strong basis for a reliable customer satisfaction research. The
literature section is a descriptive method used to broaden the knowledge before the empirical research
will be conducted (Babbie, 2004). Now, the methods used for this research will be explained:
In §4.1, a research approach is designed: the customers‟ opinion will be mapped on how satisfied they
are with the perceived service. Suggestions for improving customer satisfaction will be mapped as
well. §4.2 will make clear which customers are selected. Next, in §4.3, it will be illustrated how the
measure instrument has been constructed and in section §4.4 will be explained which procedure has
been followed to collect empirical data at Tijs-ICT (for this research Tijs-ICT can be seen as an ICT
PSF test case). Finally, in §4.5, the way the data has been analyzed will be described.
4.1 Research Design
This section describes a global outline of the empirical approach on how sub question 3 will be
prepared: What action plans can be formulated for Tijs-ICT from the collected scores and analysis to
continuously improve customer satisfaction?
With the use of the theoretical knowledge of chapters 2 and 3, an instrument can be developed that is
appropriate for measuring customer satisfaction in an ICT PSF, operating B2B. Existing models with
existing dimensions and items will be used for creating a customized measure instrument. This
quantitative method contains statements for collecting information about how satisfied customers are
after a service project. For the sake of clarity: customers are not asked what state of service quality
they expect at the start of a project. This means that gap scores (expected-perceived) will not be used
here. As found in literature (see §2.2.2) gap scores appear to be less reliable than scores not based on
differences. Besides, no double questionnaire should be filled in by the same customers (Yoon and
Suh, 2004). As found in literature search, this choice does not compromise the validity. This design
still recognizes that (service) quality is the result of a balance between expectations and experiences.
In this research, the assessment between the customers‟ expectations and experiences, will be
measured in one quantitative questionnaire. With the instrument will be measured in what degree
customers are satisfied with the perceived service quality and points for improvement will be
identified. After the empirical data will have been collected, an analysis will be done. In short, a few
more objectives are summarized here:
better understand the customers‟ requirements and expectations;
Page 43
42
collect information and scores about how satisfied customers are with the perceived service at
this moment in time;
after analyzing the results; indicate improvement opportunities and formulate action points with
the aim to benefit from the valuable information;
this first zero measurement must be the start of monitoring customer satisfaction over time.
Afterwards, it can be periodically evaluated if action plans have achieved the intended results.
The incentive is to continuously improve and work on enhancing customer satisfaction in the
future.
4.2 Selection and sampling
4.2.1 Selection
In this research the customer is the key to improvement. Profit organizations such as Tijs-ICT depend
on customers who buy their services. That is why it is important to ask the customer his point of view
on how the organization is doing. Tijs-ICT wants as many satisfied customers as possible, because:
satisfied customers are often long-term customers: they spend more, they complain less, and they
recommend Tijs-ICT to others as ambassadors who spread their satisfaction and positive opinion in
their network. This can lead to more (potential) customers in the future.
In cooperation with the Tijs-ICT Marketing department it was determined and mapped who were the
current customers that could assess the service Tijs-ICT delivers to them. In this case „the‟customer as
an individual client does not exist, since Tijs-ICT operates B2B. Therefore, the account managers of
Tijs-ICT were asked for their most important contact that could be approached to participate in this
research. All the current customers and the customers who had just finished (less than one year) a
relationship or project with Tijs-ICT were selected, because this research investigates how Tijs-ICT is
performing at this moment in time. The criteria were: a contact must be able and should have
sufficient experience with Tijs-ICT to assess the degree of satisfaction with the Sales department, or
Project Management and/or Tijs-ICT in general. In many cases a representative or a project manager
who often works together with Tijs-ICT would be asked to participate in this research.
4.2.2 Sample
The customer (a company) that needs an ICT-infrastructure, ICT products and the continued
maintenance, support and advice of an ICT provider, still forms a very broad population. In order to
collect the empirical data, the focus is on customers of one service provider: Tijs-ICT. The target
group for this empirical research are regional and national (Dutch) companies. These organizations
are institutions in healthcare or education or firms in the business market. Educational institutions are
clients spread all over the country. The complete group of customers consists of 437 companies, based
on a turnover larger than €1500 in 2010.
Page 44
43
4.3 Measurement and Operationalization
This paragraph will explain how the measure instrument is constructed. In section §2.3 was already
mentioned which models were suitable for measuring customer satisfaction. Not every existing
instrument (like SERVQUAL, the IT-consulting SERVQUAL model etc.) fits in with the context of
the organization. For Tijs-ICT it was necessary to customize (from the existing models from section
2.3) a measure instrument, because otherwise some questions/items would not make sense or might be
misunderstood by the respondent. With the aid of department managers (of Tijs-ICT) it was discussed
which existing dimensions would correspond best with the context of Tijs-ICT. Each chosen
dimension contains fixed items that must remain intact. In this way the reliability of each dimension
stays intact the way the authors have tested in their study. Some items are slightly modified in their
formulation, but the main meaning of each item is still the same.
4.3.1 Dimensions (from existing SERVQUAL mutations)
The dimensions (selected from §2.3) are indicators of service quality and customers will be asked to
assess how satisfied they are about the items, so scores can be mapped. The first three dimensions are
operationalized as follows: (defined by Parasuraman, Zeithaml and Berry, 1985):
(1) Reliability: ability to perform the promised service dependably and accurately.
(2) Assurance: knowledge and courtesy of employees and their ability to inspire trust and
confidence.
(3) Responsiveness: willingness to help customers and provide prompt service.
The other two selected dimensions are labeled as follows:
(4) Process: the approach, organization and the performance of a project
(5) Price: The monetary allocation in return for service (Westbrook & Peterson,1998).
All five selected dimensions have been tested and developed by the original authors (see figure 3). For
instance, the measurement tool by Yoon & Suh (2004) examined its own constructs and items. The
reliability of „Assurance‟, „Reliability‟ and „Process‟ was assured by Cronbach‟s α. This was
indicated in their study. (Yoon & Suh, p. 349, 2004).
A list was been set up with closed questions selected from existing models (with existing dimensions
and items discussed in §2.3). The selected dimensions that were used for the questionnaire are
summed up in figure 3; between brackets is stated from which model the dimension comes from:
Page 45
44
Figure 3: Customized measure instrument for an ICT PSF ( tested at Tijs-ICT)
1. Dimension Reliability: (IT consulting SERVQUAL model, Yoon & Suh, 2004): Have sufficient knowledge about the industry which customer is in
Have sufficient knowledge about information technology Have excellent presentation skills Communicate well with members, practitioners, and executives in customer site
Solve the problems with business as well as IT perspective Secure customers’ information well Treat customers courteously and respect their opinions Have good relations with customers Provide sufficient trust to customers Are supported by their own consulting organization Have excellent teamwork among themselves Fill in the role of PM or manager perfectly
2. Dimension Assurance: (IT consulting SERVQUAL model, Yoon & Suh, 2004): Observe the project deadline as promised Suggest the practical solutions for problems and issues Provide the products that meet the customers’ requirements Manage the quality of output during the project
3. Dimension Responsiveness: (SERVQUAL, Parasuraman, Zeithaml & Berry, 1985, 1994): Keeping customers informed about when services will be performed Prompt service to customers Willingness to help customers Readiness to respond to customers’ requests
4. Dimension Process: (IT consulting SERVQUAL model, Yoon & Suh, 2004): Constitute the project team well organized with clear role assignment Are the chosen professionalists necessary for the project Establish the specific project schedule/time plan Define the target process scope clearly and accurately Have best practices for benchmarking sufficiently Provide the plans to drive and manage the changes Test and prove the validity of to-be model Mediate the conflicts effectively among the project interested people Progress favorably total project processes
5. Dimension Price: (B2B SERVQUAL model, Vandaele & Gemmel, 2004): The price of the service provider meets the clients’ budget objectives The price is competitive compared to other offers for similar services The price of the service provider relates to the quality delivered
6. ‘Overall’ dimension Satisfaction: (IT consulting SERVQUAL model, Yoon & Suh, 2004): How much are you satisfied with the received consulting service?
Will you choose the same consulting company in future for the other consulting project? Have you received the consulting service that you expected at the time of service selection? Will you recommend this service to your colleagues or friends?
The IT consulting SERVQUAL matched best with the context of Tijs-ICT. This model was especially
designed by Yoon & Suh (2004) for service firms operating B2B in the field of IT. 29 out of 40 items
from the IT consulting SERVQUAL were used to collect empirical data for Tijs-ICT. This is 73% of
the total model. The used dimensions (see figure 3) are: ´reliability, ´assurance´, ´process´, and
´satisfaction´. Other used dimensions for collecting data were: ´responsiveness´ (from SERVQUAL,
Parasuraman, Zeithaml & Berry, 1985, 1994) and ´price´ (from B2B SERVQUAL model, Vandaele &
Gemmel, 2004).
Yoon & Suh (2004) developed and tested the sixth dimension: „Satisfaction‟ as well and (as shown
above) it is separated from the other dimensions with a reason. In the study by Yoon & Suh (2004)
„satisfaction‟ was seen as a dependent variable that measures the level of customer satisfaction. They
found and concluded in their study that a high-level of „assurance‟, „reliability‟ and „process‟ (as
Page 46
45
independent variables) will lead to a high level of (customer) satisfaction. For this current research the
items of „satisfaction‟ will be used as an overall assessment of Tijs-ICT. This allows measuring
customer satisfaction in an efficient way, with the use of only four questions. In short: the dimension
„satisfaction‟ will give an overall score of customer satisfaction and the other dimensions will provide
customer satisfaction scores in more detail. Five dimensions, „satisfaction‟ excluded, are measured
with the same numeric scale. For every item/question there were formulated answers, based on a 5
point Likert scale. The respondents could choose from:
- 1= „strongly disagree‟
- 2= „somewhat disagree‟
- 3= „agree nor disagree‟ (neutral)
- 4= „agree‟
- 5= „strongly agree‟
For „Satisfaction‟ the next scale was used:
- 1= „very unsatified‟
- 2= „unsatisfied‟
- 3= „neutral‟ (nor unsatisfied, nor satisfied)
- 4= „satisfied‟
- 5= „very satisfied‟
In 2010 a customer satisfaction research was already conducted at Tijs-ICT, but only for the
Helpdesk-department. The research was a success and provided useful information for the Helpdesk.
The next step to take for Tijs-ICT is to measure customer satisfaction for more departments that have
a lot of customer contact. The „x‟ in table 2 shows which dimensions will be measured for which
department and behind the „x‟ the number of items/questions per dimension can be found.
Table 2: Customer Satisfaction measured at different departments atTijs-ICT:
Department:
Dimension ↓
Sales Project Management
Tijs-ICT (in general)
Reliability x (12) x (12) Assurance x (4) x (4) Responsiveness x (4) x (4) Process x (9) Price x (3) Satisfaction x (4)
Sum of items per department: 20 29 7
As table 2 shows: the dimension „process‟ is not used in the questionnaire for Sales. The reason is that
the questions/items that belong to the dimension „process‟ would be difficult to understand by the
respondents in the context of the Sales department. Several managers at Tijs-ICT advised to delete
Page 47
46
this dimension for Sales, because the dimension is not relevant to them and the items (see Figure 3) do
not correspond with the tasks that Sales has in the organization. Sales has a role in preparing a project,
but the Sales department is not responsible during a project. For Project Management the dimension
„process‟ was perfect, because the underlying items of „process‟ were very relevant and similar to the
tasks conducted by Project Management (during a project).
Scales in this study were divided over different departments. This decision was made because the goal
was to formulate action plans as specific as possible and as a consequence each department will get its
own results. In this way, also comparisons can be made between departments. A disadvantage of
using this method is that many more questions should be asked and that some questions had to be
asked twice (the same questions for Sales and for PM). This might cause a respondent to drop out
earlier, before he or she has completed the questionnaire.
As mentioned, the dimension „satisfaction‟ is an overall adjustment and therefore it will be asked in
the context: „Tijs-ICT in general‟ and not for the separated departments. „Price‟ is only used for the
questionnaire related to „Tijs-ICT in general‟ as well, because Tijs-ICT expected that their customers
can assess the item „price‟ (and „satisfaction) better after a relationship or project with Tijs-ICT has
been completed.
Many questions of the customer satisfaction research in 2010 conducted for the Helpdesk were similar
to the selected items of this research in 2011. However, in 2010 Tijs-ICT did not use an existing
model with existing dimensions from literature. For this current research (2011) existing and valid
dimensions were used because with this approach the research will be more professionally and
scientifically based. Besides, afterwards comparisons can be made with findings from similar studies
in literature, for instance with the study by Yoon & Suh (2004).
However, for extra questions next to the selected dimensions, other questions were added to the
survey. These questions are recommended in the literature review or questions that provided useful
information in 2010 (during the customer satisfaction research at the Helpdesk of Tijs-ICT) can be
used again for this research. These extra questions, in addition to the questions that measure the
dimensions, are displayed in table 3. In §4.3.2 – 4.3.6 will be explained in more detail how and in
which order the questions were formulated for this research in 2011.
Page 48
47
Table 3: Summary of prepared questions for customers
Subject of the question(s) closed or open question(s)
1. Dimensions (from existing SERVQUAL mutations) closed questions (5 point Likert scale)
2. Final grade: Satisfaction closed question (1 to 10 scale, 1= poor; 10=
excellent)
3a. Mention one point of improvement open question
3b. Most satisfied with? open question
4. Put 4 points in order of importance closed question
5. Space for remarks and suggestions open question
6a General data: Sector? closed question
6b General data: Company size? closed question
4.3.2 Final grade: Satisfaction
In addition to the „overall dimension‟: Satisfaction, two closed questions ask participants to give a
final grade (on a 10 point scale) as an overall assessment of the Sales department and Project
Management:
- How satisfied, on a scale from 1 to 10 (1=poor, 10=excellent) are you about Sales?
- How satisfied, on a scale from 1 to 10 (1=poor, 10=excellent) are you about Project
Management?
4.3.3 Collecting priorities
Garver (2003, p. 463) found out in his study that „best practice companies‟ often ask open-ended
questions i.e., „How can we improve?‟ in their customer satisfaction surveys. The study confirmed
reusing these questions will be useful. Also for the Helpdesk at Tijs-ICT in 2010, this question has
shown to bring a lot of relevant information, such as customer priorities. Therefore the following open
questions were added to the list of closed questions:
- If you should write down one point of improvement for Sales, what would you suggest?
- If you should write down one point of improvement for Project Management, what would you
suggest?
- If you have to mention one point for Sales, what are you most satisfied with?
- If you have to mention one point for Project Management, what are you most satisfied with?
4.3.4 Order of importance
Another way of closed questioning, instead of a Likert scale, is asking for an order of importance: We,
as Sales, want to make improvements in our service to customers. Please, put these four points in
order of importance:
1= Good communication with my company
2= Understanding our needs and demands
Page 49
48
3= Good interaction with each other
4= Bring up the right solutions and proposals
With this question will be investigated which order customers will choose most often and which
points the customers put in the first and second place. In this way can be researched which points the
customers value most of these points. With this knowledge Tijs-ICT knows where they should put
focus first. The same question is asked for Project Management to collect priorities. Only option 3
deviates: We, as Project Management, want to make improvements in our service to customers.
Please put these four points in order of importance:
1= Good communication with my company
2= Understanding our needs and demands
3= The construction and planning of the project
4= Bring up the right solutions and proposals
4.3.5 Suggestions from participants
Also, extra space is given to the open question: Do you have any remarks or suggestions?
This question was asked three separate times: for Sales, Project Management and Tijs-ICT in general:
each time at the end of the relevant department of the questionaire. This question gives the
participants the opportunity to leave a remark or a suggestion.
4.3.6 General data
Finally two closed questions were asked for collecting general data about customers, to see if there are
any (significant) differences between categories:
- Sector in which your organization operates: education, healthcare, business or other?
- Your company size in terms of FTE (Full Time Employees) on a 7 multiple-choice scale?
4.4 Data Collection
For the data collection the following procedure was followed. With the developed questionnaire
quantitative data will be collected that deals with numbers/scales that can be measured statistically.
Characteristic for quantitative approaches are the closed-ended questions. With this procedure a large
group can be investigated at the same time. This method is widely used and very suitable for a
customer satisfaction survey.
The complete questionnaire was made available on the Internet in a digital format. The used tool was
designed by Measuremail. This tool gave the survey a professional appearance and was very useful
for sending out a questionnaire. This method is a quick and easy way for participants to fill in
Page 50
49
answers. The electronic tool is cheap and raw data can be read directly into Excel. Moreover, it is only
a small step to transport the data from Excel to SPSS.
A disadvantage of this method is that it has no possibility for finding out more about individual
thoughts and motives of participants, as can be done with qualitative research in interviews. As a
consequence, participants are limited in their answers. This problem is slightly offset by asking some
open questions as well. In this research the importance of reaching a lot of customers is greater than
reaching only a few customers for in-depth interviews. In total 60 closed questions and 7 open
questions were formulated for this research and were put into one integrated questionnaire.
The request to fill in the survey was sent per email on the 20th of April via the account managers of
Tijs-ICT who were in contact with the respective customer. The name of the Marketing Manager was
added in the e-mail to show how seriously the research was taken and how much Tijs-ICT appreciated
the participation of its customers in this research. These actions were taken with the aim to increase
the chance of a good response rate. Two extra e-mails were sent later on the 3rd
and the 12th of May as
a reminder to customers who had not opened the invitation e-mail yet, or had not (fully) completed
the survey. On the 18th of May the link was removed from the internet which was communicated with
the target group in advance.
510 customers received an e-mail with the invitation to participate. In this e-mail a direct link to the
digital questionnaire was added. This number of customers was higher than the target group, because
for some organizations more contacts were approached. Not every participant was able to assess both
departments: Sales and Project Management. For that reason the following question was integrated at
the end of the first list of questions related to Sales: Have you recently / less than one and a half years
ago, had experience with the department Project Management (of Tijs-ICT)? This closed question had
two options: „yes‟ or „no‟. The respondents who could assess Project Management got related
questions about that department as well. The participants who could not assess PM were immediately
forwarded to the questions related to „Tijs-ICT in general‟. This explains the large differences
between the numbers of respondents per department: the obtained response rates to the dimensions
were 32% for Sales, 10-11% for Project Management and 28% for Tijs-ICT in general. Despite the
large number of questions, this is a good response. For the closed questions with a 5 point scale is was
checked whether the observations (more or less) followed a normal distribution. This is important
because all the statistical techniques used to analyze the outcome variables assume that the relevant
variables are more or less normally distributed (Twisk, 2007). The observations in the histogram were
(more or less) symmetrically distributed around the average, in the form of a mountain with the
average value in top. Moreover, the averages were close to the medians, which also indicates
normally distributed observations.
Page 51
50
Not all participants, but the majority filled in an answer to the open questions. This was especially the
case to the questions related to Sales asking to „mention a point of improvement‟ and „what are you
most satisfied with‟. Furthermore, 23 subjects were deleted, because these respondents did not answer
more than 50 percent of the complete questionnaire.
Last, but not least: it should be noted here that these kind of surveys always have a risk that customers
give socially acceptable answers.
4.5 Data analyses plan
For analyzing the collected data mainly SPSS is used to execute tests. The selected dimensions can be
analyzed directly by the values depending on the 5-point Likert-scale answers. Per dimension e.g. the
mean, the standard deviation and the Cronbach‟s α can be analyzed.
For each department values will be analyzed on their contribution to customer satisfaction. With this
approach it is expected that the probability of the success of (follow-up) action plans increases. In this
way Sales, Project Management and Tijs-ICT (in general) can be advised as specific as possible. With
the final satisfaction grades (on a 10 point scale) for Sales and Project Management means can be
analyzed and compared (with an Independent Samples test).
With the question that asks to put four points ´in order of importance´, it will be analyzed what is the
most frequently chosen order and what does the majority of the participants put first or second.
For analyzing the answers to the open questions, another analyzing approach is used. All answers are
categorized and interpreted by the researcher. The most common opinions, suggestions and
appreciated points will be taken out of these answers.
It is expected that the identified disappointing statistics or scores indicate points for improvements.
With the outcomes, action plans can be formulated and Tijs-ICT can reuse the developed research
approach for monitoring customer satisfaction in the future, with the aim to continuously improve
customer satisfaction.
Next to the specific customer satisfaction questions, also a few general data questions are part of the
survey to make comparisons between different customer groups or categories.
By conducting a Principal Component Analysis (with SPSS) will be tested if items can be clustered
differently instead of the current scales. The aim is to improve the questionnaire for using it again in
the future in a more efficient version.
Page 53
52
Chapter 5: Results empirical research
In this chapter the collected data will be presented and it will be explained how the findings of this
study are interpreted. In section 5.2 an overview of the empirical content and analysis can be found.
5.1 Data and Analysis
In 5.1.1 the results related to the collected general data will be discussed first (ANOVA). In 5.1.2 the
results from the Correlation Analysis will be presented and in 5.1.3 the principle of the „Central limit
theorem‟ will be explained.
5.1.1 ANOVA test
The first test carried out was to see if different groups could be distinguished in the sample or that the
sample could be seen as one (customer) group. The aim was to look if there were significant
differences between sectors (business, education, healthcare, and other) or between company sizes
(number of FTE‟s: 1-10, 11-25, 26-50, 51-99, 100-250, 251-500, 500< ). For comparing more than
two conditions, the test: analysis of variance (ANOVA) is used. ANOVA tests whether three or more
means are the same. In other words, it tests the null hypothesis that all group means are equal in this
study. The significant level (p < 0,05) will give a conclusion:
For Sales:
No significant differences were found in all the measured dimensions: „reliability‟, „assurance‟,
responsiveness‟ and „process‟, between sectors or company sizes. As for the question: „How satisfied
are you in general about the Sales department on a 1-10 scale?‟: no significant differences were found
between sectors.
For Project Management:
No significant differences were found either in all measured dimensions: „reliability‟, „assurance‟,
„responsiveness‟ and „process‟, between sectors or company sizes. As for the question: „How satisfied
are you in general about Project Management on a 1-10 scale?‟: no significant differences were found
between sectors or company sizes.
Tijs-ICT (in general):
No significant differences were found between sectors, by testing for the dimension „satisfaction‟.
However, for the dimension „price‟ there was found a significant difference between the means (per
company size). A Post hoc test (called Bonferroni) was conducted to see where exactly this
significance difference came from. Only the averages of 11-25 (3.06) and 51-99 (3.70) differed
significantly from each other (p = 0.011). The other groups did not differ significantly from each
other.
Page 54
53
Evidence was found that the sample was quite united in its assessment of Tijs-ICT. In general all
respondents could be seen as one group. This conclusion is based by distinguishing between sectors
and company size.
5.1.2 Correlation Analysis
The dimensions are elements for measuring the parent concept: „Customer Satisfaction‟. With the
collected empirical data can be measured to what extent a relationship exists between the dimensions
and "Satisfaction": which represents the overall assessment of Tijs-ICT with only four items. Items
which form a dimension are taken together by calculating the averages.
These are bivariate correlations, involving the relationship between two variables, irrespective of the
influence of other variables. In this case the conditions of the Pearson correlation coefficient were not
met, but the Spearman's test is a good alternative for data with an ordinal scale. This test is non-
parametric and can be used as the variables are at least ordinal. (Huizing, 2006)
Table 4: Correlation Coefficients between the independent dimensions (reliability, assurance and
responsiveness) & the overall customer satisfaction (the dependable variable):
Sales
Independent Dimension Correlation Coefficients* Sig. (1-tailed)
Reliability ,654 (p<0,001) Assurance ,586 (p<0,001) Responsiveness ,450 (p<0,001) *Correlation is significant at the 0.01 level (1-tailed).
In table 4 it can be seen to what degree „reliability‟, „assurance‟, and „responsiveness‟ from Sales
correlate with the overall dimension: „satisfaction‟. All significant correlations had a positive
correlation. The tests were one-tailed (instead of 2-tailed) because in the literature (see section 2.3) a
relationship between the dimensions and the overall „satisfaction‟ dimension was expected. Table 4
shows the results of the correlation coefficients related to Sales. The coefficients differ only a few
decimals and as can be seen „Reliability‟ has the highest correlation coefficient. Further, for every
dimension p< 0,001. Next will be presented in what degree the independent dimensions from PM
correlate with the overall dimension „satisfaction‟:
Table 5: Correlation Coefficients between the independent dimensions & the (overall) dimension Satisfaction.
Project Management
Independent Dimension Correlation Coefficients* Sig. (1-tailed)
Reliability ,518 (p<0,001) Assurance ,398 (p=0,002) Responsiveness ,527 (p<0,001) Process ,513 (p<0,001) *Correlation is significant at the 0.01 level (1-tailed).
Page 55
54
See table 5, for Project Management all correlations had a positive correlation as well.
„Responsiveness‟ has the highest correlation coefficient.
Table 6: Correlation Coefficients between the independent dimension price & the (overall) dimension
Satisfaction.
Tijs-ICT (in general)
Independent Dimension Correlation Coefficient* Sig. (1-tailed)
Price ,500 (p<0,001) *Correlation is significant at the 0.01 level (1-tailed).
Table 6 shows a positive correlation between „price‟ and „satisfaction‟. There is a significant
relationship between „price‟ scores and „satisfaction‟, r=0,500, p < 0,001.
5.2 Overview of empirical content
In table 7 the overview of the empirical content can be found. The table presents how this section 5.2
is constructed and is very similar to the sequence presented in 4.3. This allows looking back quickly
for background information about measurement concepts, such as the operationalization in chapter 4.
Table 7: Overview of empirical content. Name of analysis Type of data
1a. Customer Satisfaction and underlying dimensions Descriptive statistics
1b. Reliability Dimensions Cronbach’s α
1c. Comparing means per department (+ a benchmark) Independent Samples T-test s
1d. Principal Component Analysis Can items be clustered differently instead of the current scales?
2. Final grades: Satisfaction
On an 1 to 10 scale, 1= poor; 10= excellent
3a. Mention one point of improvement Answers to open questions
3b. Most satisfied with?
Answers to open questions
4. Put 4 points in order of importance
Most frequent orders
5. Room for remarks and suggestions
Answers to open questions
6a. General data: per sector Comparisons
6b. General data: per company size Comparisons
5.2.1a Customer Satisfaction and underlying dimensions
Table 8: Descriptives: mean scores per dimension on a 5 point Likert scale, presented per department
Department:
Dimension ↓
Sales (N=161) Project Management (N=55)
Tijs-ICT in general (N=142)
Reliability 3,82 (sd=.508) 3,86 (sd=.609) Assurance 3,71 (sd=.529) 3,80 (sd=.661) Responsiveness 3,74 (sd=.579) 3,91 (sd=.579) Process 3,70 (sd=.585) Price 3,42 (sd=.623)
Satisfaction (overall dimension) 3,88 (sd=.576)
Page 56
55
Per dimension and for all underlying items frequencies and percentages have been calculated. In table
8 a summary of the means of all measured dimensions is given on a 5-point Likert-scale. (1 = the
lowest possible score, 5 = the highest possible score). What these averages show, is that they only
differ a few decimals. Except the mean of „price‟ is a little bit lower. In general the standard
deviations (sd) are low and do not vary much. This indicates that the sample has a very clear opinion.
5.2.1b Reliability (Cronbach’s α)
Reliability means that the items of the questionnaire should consistently reflect the dimension (/ the
construct) that is measured (Field, 2009). The best approach is to run separate reliability analyses for
all dimensions/subscales of the used questionnaire. In this current study the statistical software
application SPSS (version 18) is used to perform analysis. In general, a confidence level of p <0.05 is
used to test the reliability. The reliability results will be presented for each measured dimension. First
the dimensions used for Sales will be demonstrated, later on for Project Management (PM) and Tijs-
ICT.
For the dimension „reliability‟ the α = 0.916. This is a very high score (1.00 is the maximum) and
indicates a reliable scale using the general rule: each score above 0.7 is acceptable. As a notification
here, Field (2009) warns about the following effect: if the number of items on the scale increases, α
will increase.
Table 10: Item-Total Statistics for the dimension Reliability and its underlying items (Sales)
Dimension: Reliability (Sales) Corrected
Item-Total
Correlation
Cronbach's
Alpha if Item
Deleted
1. Sales has sufficient knowledge about the branch my organization operates in ,710 ,906
2. Sales has sufficient knowledge about the solutions they offer to my organization ,767 ,904
3. Sales has excellent presentations skills ,657 ,909
4. Sales communicates well with the representatives of my organization ,712 ,906
5. Sales has good relations with the representatives of my organization ,602 ,911
6. Sales solves the problems with business as well as IT perspective ,753 ,904
7. Sales secure our customers‟ information well ,515 ,914
8. Sales treats me courteously and respects my opinion ,661 ,909
9. Sales provides sufficient trust to me (as a customer) ,759 ,904
10. Sales is supported by their own organization (Tijs-ICT) ,541 ,914
11. Salesmen in the office and field staff have excellent teamwork among themselves ,463 ,917
12. The role of the salesperson or account manager meets my expectations ,739 ,905
Table 9: Statistics: Dimension Reliability (Sales)
Cronbach's Alpha N of items N of participants
,916 12 161
Page 57
56
According to Field (2009) two other basic reliability analyses are important: Cronbach‟s Alpha if Item
Deleted and Corrected Item-Total Correlation:
- The Corrected Item-Total Correlation is presented in the table above and is the correlation between
each item and the total score from the questionnaire. It is expected that all items should correlate with
the total, because that indicates whether a scale is reliable or not. Items that do not correlate enough
with the overall score from the scale are items with values are lower than .3. Items with low
correlations may have to be dropped. For table 10 all these data have item-total correlations above 0.3,
which is a good sign for the reliability of the scale.
- The other reliability analysis is: Cronbach‟s Alpha if item Deleted. This can be found in the table
above as well and it literally shows the values of the overall α if that item is not included in the
calculation. In this way can be seen if the questionnaire can be improved by deleting a particular item.
This is the case for the 11th item: α =.917 which is higher than the overall α (.916). However, this
increase is minimal and therefore negligible. Both values reflect a good degree of reliability and it is
not necessary to delete one of the items. If the research questionnaire is reliable, than it is not
expected that any of the items greatly affect the overall reliability. Relevant is looking for items that
dramatically increase the value of α, which is not the case here, because all values in this column are
around the overall α (.916).
The discussed reliability analyses above were conducted for the other dimensions as well, but the
complete details of these results are not shown in this paper. In this section only a summary of the
findings related to the „Corrected Item-Total Correlation‟ and the „Cronbach‟s Alpha if item Deleted‟
will be reported. As mentioned, first the dimensions of Sales (Reliability, Assurance and
Responsiveness) will be shown, secondly the dimensions of Project Management (Reliability,
Assurance, Responsiveness and Process) and finally the dimensions of Tijs-ICT in general (Price and
Satisfaction).
Sales:
Table 11: Descriptive statistics for Sales
Dimension Cronbach’s Alpha N of items N of participants
Reliability .916 12 161 Assurance .761 4 161 Responsiveness .783 4 161
The Cronbach‟s α‟s calculated for Sales can be found in table 11. Each dimension appears to be
reliable, because their values are above 0.7 (besides, the Cronbach‟s α cannot be larger than 1). The
results related to the Corrected Item-Total Correlation were calculated, but are not shown here in a
table. The results related to the Corrected Item-Total Correlation were encouraging. For all three
dimensions, all underlying items are above the boundary of .3. As mentioned earlier, these scores
indicate that the reliability of each item is good.
Page 58
57
About „Cronbach‟s Alpha if Item deleted‟ can be reported that all Cronbach‟s α‟s are lower, but
around the overall α. This indicates no items have to be deleted based on this reliability test. (To be
precise, one item from „assurance‟ was actually .785, but this increase is negligible for deciding to
delete this item: Sales observe the fulfillment of commitments and deadlines).
Project Management:
Table 12: Descriptive statistics for Project Management
Dimension Cronbach’s Alpha N of items N of participants
Reliability .947 12 55 Assurance .875 4 54 Responsiveness .825 4 52 Process .927 9 52
The Cronbach‟s α‟s calculated for Project Management are presented in table 12. Again, each
dimension appears to be reliable (because their values are above 0.7.). The results related to the
Corrected Item-Total Correlation are encouraging as well. For all four dimensions, all underlying
items are above .3. This means the scores indicate that the reliability of each item is good. About
Cronbach‟s Alpha if Item deleted can be reported that all Cronbach‟s α‟s are under .947 and around
the overall α.
Tijs-ICT (in general):
Table 13: Descriptive statistics for Tijs-ICT (in general)
Dimension Cronbach’s Alpha N of items N of participants
Price .837 3 142 Satisfaction .900 4 142
The Cronbach‟s α‟s calculated for Tijs-ICT (in general) are presented in table 13. For both
dimensions, the values are above 0.7. The results related to the Corrected Item-Total Correlation (for
Tijs-ICT in general) are encouraging as well. For both dimensions, all underlying items are above .3.
These scores indicate that the reliability of each item is good. About Cronbach‟s Alpha if Item deleted
can be reported that all Cronbach‟s α‟s are around the overall α. Again, deleting a specific item will
not lead to a higher Cronbach‟s α.
In short, the „Cronbach‟s α‟ and the „Corrected Item-Total Correlation indicated that all dimensions
are reliable. Also, it is shown that deleting items will not lead to an increase of the overall Cronbach‟s
α of a dimension. Next, the means of the different departments will be compared in 5.2.1c.
5.2.1c: Comparing means per department
In this section two departments will be compared to see if the average scores differ significantly. The
reason to do this: suppose there might be differences, for instance Project Management scores
significant better in terms of „responsiveness‟ compared to Sales. In that case it is indicated that Sales
Page 59
58
can learn from Project Management. PM can tell to Sales all about how they work on responsiveness.
This gives Sales new insights and enables them to improve on the point of responsiveness.
Table 14 shows the averages for each dimension that are measured twice, one time for Sales and one
time for Project Management. By performing „Independent Samples T-tests, it will be investigated if
the averages differ only by chance or not.
Table 14: Mean per dimension on a 5 point Likert scale
Department:
Dimension ↓
Sales Project Management
Reliability 3,82 3,86 Assurance 3,71 3,80 Responsiveness 3,74 3,91
The „Independent Samples T-tests‟ are conducted with SPSS which makes it possible to compare two
means. The fifth column of 15 demonstrates that the significance level is above 0,05: Sig. (2-tailed)
=.689. That means, it can be concluded that for the dimension „reliability‟ no significant difference
has been found between both departments: Sales and Project Management. In other words: the
customers of Sales were equally satisfied as the customers of Project Management.
Table 15: Outcomes Independent Samples Test (dimension: reliability)
Dimension: Reliability
Levene's Test for Equality of Variances t-test for Equality of Means
F Sig. t df
Sig. (2-tailed)
Mean
Difference
Std. Error
Difference
95% Confidence Interval of the Difference
Lower Upper
Equal variances assumed
1,403 ,238 -,440 211 ,660 -,03750 ,08516 -,20536 ,13037
Equal variances not assumed
-,401 75,263 ,689 -,03750 ,09344 -,22362 ,14863
In the same way the same conclusion was found for, ´assurance´ (p= .334) and ´responsiveness´ (p=
.063). Both averages, comparing Sales and PM, of ´reliability´ and ´assurance´ are very close. For
´responsiveness´ both averages (Sales and PM) differ a few decimals, but still do not differ
significantly. With these results can be concluded that the customers that assessed Sales are satisfied
in the same degree as the customers that assessed Project Management, for the tested dimensions
´reliability´, ´assurance´ and ´responsiveness´.
Page 60
59
5.2.1d: Principal Component Analysis
There are several ways of conducting a factor analysis. Here, the principal component analysis (PCA)
is used. (Strictly speaking a PCA is not a factor analysis, however, both procedures may often yield
similar results; Field, 2009). With a PCA can be investigated if items can be clustered in a different
way; in new components instead of the original dimensions from existing measure instruments. A
PCA is important to continue and examine the analysis of data. It can improve the questionnaire
already developed. The aim is to see if it is possible to achieve a finer measurement tool that can be
applied for the next customer satisfaction research for Tijs-ICT.
The output tables on the next pages show if items correlate with other items outside their fixed
dimension of which the item was originally part. As a general rule, each item that scores a value under
0.5 does not correlate enough to put the item in a new component (a new created dimension). To be
sure, every item with a factor loading less than 0.55 is deleted. In the matrices on the next pages the
components are numbered (1,2,3,4 etc.). The components are sorted by size and ordered from the
component that received the most items. Some items participate in more components, in that case the
component is noted for which the variable has the highest loading. In general, values between 0.8 and
0.9 are great and it depends on the researcher where the line is drawn to create new components. Here,
every item that scores above 5.5 will be selected and given a new logical name/label.
As can be seen in matrix 1, a varimax rotation is used. The results of this rotated solution were
compared with the unrotated solution matrix. Before rotation, almost all variables loaded highly onto
the first component. The remaining components did not get more than one or two variables and did
not really create a new clear factor. However, the varimax rotation has clarified things considerably
and created clear new components. Furthermore, by using varimax rotation there is the opportunity to
compare the findings with the results founded by Yoon & Suh (2004). They also applied a PCA with
Varimax rotation with Kaiser Normalization. In chapter 6, comparisons will be made and discussed.
Page 61
60
Matrix 1: Outcomes Rotated Component Matrixa for Sales
Sales Component
1 2 3 4
Sales has sufficient knowledge of the solutions they offer to my organization ,788
Sales communicates well with the representatives of my organization ,767
Sales provides sufficient trust to me (as a customer) ,750
Sales treats me courteously and respects my opinion ,718
Sales has sufficient knowledge of the branch which my organization operates in ,717
Sales solves the problems with business as well as IT perspective ,713
Sales has good relations with the representatives of my organization ,692
The role of the salesperson or account manager meets my expectations ,680
Sales has excellent presentations skills ,628
Sales suggests practical solutions for problems and issues ,621
Sales provides the products and services that meet our customers‟ requirements ,607 ,563
Sales provides the bids/ documents in time ,813
Sales always answers my questions timely ,788
Sales keeps us informed about when services will be performed ,625 ,564
Sales pays attention to the observance of appointments and deadlines ,587
Sales is always willing to help me ,587
Sales manages the preparation of the project in a proper way ,784
Salesmen in the office and field staff have excellent teamwork among themselves ,828
Sales is supported by their own organization (Tijs-ICT) ,713
Extraction Method: Principal Component Analysis.
Rotation Method: Varimax with Kaiser Normalization. a. Rotation converged in 6 iterations.
The created components can be seen as new „dimensions‟. For labeling these new factors, the next
step is to look at the content of the items that load onto the same component. In this way it is tried to
identify common themes for labeling the new constructed components. For Sales, four components
were clustered from 20 different items:
- Component 1: consists of eleven items and will be labeled as ‘project delivery’.
The outcomes can be compared with the original dimensions in §4.3.1. Nine of the eleven
items correspond with the original dimension „reliability‟ (from the IT-consulting
SERVQUAL model, Yoon & Suh, 2004) and the other two items originally come from
„assurance‟ (from the IT-consulting SERVQUAL model).
- Component 2: consists of five items and will be labeled as: ‘deadlines and timing’
Four items correspond with all the four items from the original dimension „responsiveness‟
(SERVQUAL, Parasuraman et al, 1985). (The other item originally comes from „reliability‟).
- Component 3: two of the three items participate in more components. In that case the general
rule is to note the component for which the variable has the highest loading. This means
component 3 only consists of one item: ‘preparation of the project’.
Page 62
61
- Component 4: consists of two items and will be labeled as ‘club/teamwork’. Both items are
related to how the staff of Tijs-ICT works together as a team, internally. (Both original items
come from the original model of „reliability‟).
In matrix 2, for Project Management, four components were clustered from 29 different items:
- Component 1: consists of ten items and it can be labeled as ‘Project Management tasks’.
(Six of the items are from the original „process‟ dimension (IT-consulting model, Yoon &
Suh, 2004). The other four items come from the other 3 original dimensions).
Matrix 2: Outcomes Rotated Component Matrixa for Project Management
Project Management Component
1 2 3 4
PM defines the target process scope clearly and accurately ,806
PM establishes the specific project schedule/time plan ,759
PM keeps us informed about the project and about when services will be performed ,737
PM makes good considerations to achieve a suitable approach for the project to come ,731
PM pays attention to the observance of appointments and deadlines ,722
PM provides services timely ,717
PM takes care of a favorable progress of the total project processes ,634
PM sets up the project team well organized with clear role assignment ,633
The role the project manager fills in, meets my expectations ,630 ,590
PM provides the plans to govern and manage the changes ,610 ,554
PM has sufficient knowledge about the branch which my organization operates in ,802
PM is supported by their own organization (Tijs-ICT ) ,732
PM provides sufficient trust to me (as a customer) ,665
PM solves the problems with business as well as IT perspective ,618
PM has sufficient knowledge about the solutions they offer to my organization ,616
PM has excellent presentations skills ,589
The Project Manager and engineers have excellent teamwork among themselves ,565 ,581
PM treats me courteously and respects my opinion ,710
PM has good relations with the representatives of my organization ,705
PM secures our customers‟ information well ,699
PM is always willing to help me ,675
PM always answers my questions timely ,576
PM tests and proves the reliability of potential techniques that can be used ,878
PM mediates the conflicts effectively among the project interested people ,661
Extraction Method: Principal Component Analysis.
Rotation Method: Varimax with Kaiser Normalization. a. Rotation converged in 8 iterations.
Page 63
62
- Component 2: consists of seven items and will be labeled as ‘competence and content
quality’. (Striking is that all seven items originally come from „reliability‟ (IT-consulting
model, Yoon & Suh, 2004).
- Component 3: consists of five items that are related. All five items are about how the
company treats its customers. This component can be labeled as: ‘dealing with customers
and communication of the quality’.
- Component 4: consists of two items and can be labeled as ‘effectiveness’.
Matrix 3: Outcomes Rotated Component Matrixa for Tijs-ICT in general
Tijs-ICT (in general) Component
1 2
I will recommend Tijs-ICT‟s services to others in my network ,853
How much are you satisfied with the received services by Tijs-ICT? ,842
I have received the service and advice that I expected at the time of service selection ,823
For other similar projects in the future, I will choose Tijs-ICT again ,811
The price of Tijs-ICT meets the budget objectives of my organization ,876
The price of Tijs-ICT is competitive compared to other offers for similar services ,866
The price of Tijs-ICT relates to the quality delivered ,707
Extraction Method: Principal Component Analysis.
Rotation Method: Varimax with Kaiser Normalization.
a. Rotation converged in 3 iterations.
For Tijs-ICT (in general) two components were clustered from 7 different items. The results of this
matrix is very clear. Component 1 is labeled as: ‘satisfaction’ and Component 2 as ‘Pricing’. The
two components are identical to the former dimensions: „price‟ and „satisfaction‟. This finding
confirms that the scales are strong and that the items belong together.
The PCA has provided new and better dimensions/components that can measure elements of customer
satisfaction in a quick and effective way. It is normal that with a PCA the questionnaire is reduced in
the number of items, because some items were loaded less than 0.55 to a component:
- Sales secures our customers‟ information well
- PM manages the quality of output during the project
- PM delivers the products and services that meet my requirements
- PM suggests the practical solutions for problems and issues
- PM communicates well with the representatives of my organization
- PM deploys the right expertise and professionals during the project
With the PCA new and better components were constructed for each department. For Tijs-ICT the ten
new clustered components provided new insights in the collected data as labeled above. This means,
Page 64
63
for Tijs-ICT, the new components are of greater value than the theoretical dimensions (like
„reliability‟, „assurance‟, „responsiveness‟, etc.).
In appendix 12 more information can be found about the PCA results. In the appendix findings were
compared with findings in literature.
5.2.2 Final grades: Satisfaction
In this part the results of the assigned final grades will be presented. On a scale from 1 to 10 the
customers have assessed the Sales deparment and Project Management:
Table 16: Descriptive statistics: final grades
Department:
Type of data
Sales Project Management
Mean 7,53 7,50
Std. Deviation 1,096 1,276
Minimum 4 3
Maximum 10 10
N 161 52
The results indicate that customers are positive about the departments. A 7.5 is a good grade on a
scale of 1 to 10. By comparing the two means, from Sales and Project Management, it can be seen
that this difference is negligible. This difference is so small that it can also occur by chance. The
Independent Samples Test calculated that there is no significant difference: p > 0,05 (p = .863).
Besides, the standard deviations were calculated and they only differ by a few decimals. The scores
are very close to each other, for a 10 point scale. It can be concluded that the customers of Sales were
equally satisfied as the customers of Project Management. More details are shown in the figures
demonstrated below. On the horizontal axis the grades (given by the customers) are ordered and on
the vertical axis the frequencies are presented:
Page 65
64
Figure 4: Bar chart for Project Management: final grades
Figure 5: Bar chart for Sales: final grades
Page 66
65
Table 17: Descriptive statistics for Sales and Project Management: frequency and percentages
Project Management: Sales:
The figures again show the positive assessment of the customers. Many high grades are assigned,
especially 7 and 8. Both figures have a lot in common. Not only the averages correspond, also the
median is the same: an 8. The distribution and the proportions between the data are very similar as
well (see percentages). Furthermore, customers who assigned a low final grade are a direct trigger to
contact them immediately. This offers the opportunity to improve the situation and thus improve the
customer satisfaction.
These final grades related to Sales and PM indicate that participants are positive and satisfied. This
finding can also be compared with the collected scores of the dimension: „satisfaction‟ (see 5.2.1a).
This dimension collected an overall assessment of customer satisfaction as well, but was scored for
Tijs-ICT (in general). A different scale was used and the dimension „satisfaction‟ consisted of four
items. However, both results indicate that participants are positive and satisfied.
Scientifically it is not allowed to compare both (different) scales. On a 5 point Likert scale Tijs-ICT
(in general) scored 3,88. This score multiplied by 2 = 7,76. This score only differs 2 decimals from
the 7,5 score from Sales and PM. It is not legitimate to multiply 3.88 by 2. In fact, with a 5 point
Likert scale customers could only fill in 2,4,6,8 or 10, and not 1,3,5,7,9. Although these scales cannot
be compared legitimately, both scores confirm and indicate a good overall score of (customer)
satisfaction.
5.2.3 Priorities
Participants were asked to mention one point for improvement for Sales and for Project Management.
Participants were also asked to mention one point they were most satisfied with. Open answers ask for
another method of analysis than is used for the numeric data. A qualitative method is used to draw
conclusions. All answers were clustered and categorized in groups. For example all answers from
participants that were related to „communication‟ were put together in one group. The categorized
Page 67
66
groups were interpreted by the researcher. The most important opinions, suggestions and appreciated
points will be discussed here:
Summary open question 1 (Sales): point for improvement for Sales
More than half of the participants have left a comment. The most important area for improvement
considered by the customer is „the communication and feedback‟, during customer contacts and ´the
communication about tasks to be performed‟. Moreover, many customers feel that the internal
communication and coordination (between departments) should be better. Many customers think that
a more rapid succession of bids/orders should be possible. The duration is sometimes too long. Even
worse, there are customers who sometimes have to call themselves, because they did not hear
anything back at the time that was promised by Sales. This result is related to the mentioned point:
„feedback‟. All other answers are definitely worth looking at, but the two points mentioned above:
„communication and turnaround quotes/bids‟, are points for improvement most often identified.
Furthermore, 13 comments were posted saying that sellers should identify themselves better with the
customer and should be more proactive in their thinking.
Summary open question 2 (Sales): what are you most satisfied with?
Tijs-ICT can use the response to identify service elements which customers appreciate (very) much.
The staff of Tijs-ICT should be well aware of its competences and continue with what they do best.
By far the main issue is „personal contact‟ which was mentioned very often. The customer specifies
the seller as friendly and helpful during the cooperation. A dozen customers indicated that they often
get a quick response back. In addition, the knowledge and expertise of Sales is often praised.
Notable is also that, although in the previous open question „communication‟ was often cited as a
point for improvement, there were also customers (14) who put „communication‟ here as a point they
were most satisfied with.
Summary open question 1 (PM): point for improvement for Project Management?
For PM the number of respondents was much less as compared to the sales department. As a
consequence, this also yielded fewer answers. It is a smaller group because the number of customers
that has entered into a project recently (within one and a half years ago) is less than the number of
customers that has experience with the Sales department. Actually, a few customers have written that
the 'communication' should be improved. Many other answers were filled in as well, but their themes
were very different and could not be clustered.
Summary open question 2 (PM): what are you most satisfied with?
There was no single point that stood out, in the answers given. However, four clear points were
identified. According to the customers (1) the „communication and feedback‟ by PM during a project
is ok. (2) The speed of response and the speed in which issues / problems are handled is ok as well.
Furthermore (3) the willingness and helpfulness of the staff is mentioned several times by several
Page 68
67
Frequentie Percentage
2-4-1-3 29 21,3%
1-2-4-3 12 8,8%
2-4-3-1 12 8,8%
4-1-2-3 8 5,8%
4-2-1-3 8 5,8%
1-4-2-3 7 5,1%
3-2-4-1 7 5,1%
4-2-3-1 7 5,1%
2-1-4-3 6 4,4%
3-1-2-4 6 4,4%
1-3-2-4 5 3,6%
1-3-4-2 5 3,6%
customers. Finally, (4) the expertise of Project Management was praised. The customers were very
satisfied with their solutions and support.
5.2.4 Put 4 points in order of importance
In this section the results of another question will be discussed. Both for Sales and Project
Management, the participants were asked to put four points in order of importance. The most frequent
orders, so not all chosen orders, are presented in table 18 (for Sales) and in table 19 (for PM).
Table 18: Sales: order of importance, frequency and percentage:
Most chosen order:
2: Understanding our needs and demands
4: Bring up the right solutions and proposals
1: Good communication with my company
3: Good interaction with each other
52x „2‟ is put first
35x „1‟ is put first
26x „3‟ is put first
22x „4‟ is put first
(Total: 136)
55x „4‟ is put second
42x „2‟ is put second
24x „1‟ is put second
15x „3‟ is put second
The results indicate that: „2‟: understanding our needs and demands‟ and „4‟: bring up the right
solutions and proposals‟ are seen as the two most important conditions by 30% of the customers (by
summing up the percentages from the orders 2-4-1-3 and 2-4-3-1). However, 30% is not a very large
group. Table 18 shows that a very concrete opinion on what is important has not been found. The
conclusion is that there is much disagreement about what is important. Customers were different in
their opinion about what are the most important points. This indicates that „1‟: good communication
with my company‟ and „3‟: good interaction with each other‟, are also seen as important by
customers.
Order Frequency Percentage
Page 69
68
Volgorde Frequentie Percentage
2-4-3-1 10 23,8%
1-2-4-3 3 7,1%
2-4-1-3 3 7,1%
4-3-2-1 3 7,1%
1-2-3-4 2 4,8%
1-3-4-2 2 4,8%
2-1-3-4 2 4,8%
2-1-4-3 2 4,8%
2-3-1-4 2 4,8%
3-1-2-4 2 4,8%
4-2-1-3 2 4,8%
Table 19: Project Management: order of importance, frequency and percentage
Most chosen order:
2: Understanding our needs and demands
4: Bring up the right solutions and proposals
3: The construction and planning of the project
1: Good communication with my company
20x „2‟ is put first (48%)
9x „1‟ is put first
8x „4‟ is put first
5x „3‟ is put first
(Total: 42)
16x „4‟ is put second
9x „1‟ is put second
9x „3‟ is put second
8x „2‟ is put second
(Total: 42)
These results indicate that: „2‟: understanding our needs and demands‟ and „4‟: bring up the right
solutions and proposals‟ are seen as the two most important conditions by 31% of the customers (by
summing up the percentages from the orders 2-4-3-1 and 2-4-1-3). However, here in table 19 as well,
31% is not a very large group, which indicates that the other two items, „3‟: the construction and
planning of the project‟ and „1‟: good communication with my company‟ are also seen as important by
other customers. Furthermore, 48% put „understanding our needs‟ on the first place, which indicates
that almost half of the customers (from Project Management) sees this point as an important first
condition.
Overall, from the findings presented in table 19, it can be concluded that there is much disagreement
on what order is most important and a very concrete opinion has not been found. Customers differ in
their opinion on what are the most important points for them.
5.2.5 Space for remarks and suggestions
At the end of each questionnaire related to the specific department, three times the following question
was asked: Do you have any other comments and / or suggestions?
These questions were not obligatory, but were asked to give the respondents the opportunity to write
something if they wanted to. For Tijs-ICT it is interesting to have a look at all the answers. Not all the
answers are included in this report, but a summery will given here:
Order Frequency Percentage
Page 70
69
Summary for Sales
The answers were quite diverse, so it is not possible to derive a clear picture. This also has to do with
the low number of responses from the participants. Over twenty answers were given. Some left a
reply such as „keep it up‟ or had a small critical point related to the quotations. The low number of
comments that were filled in for this question can be explained by the fact that the customer already
had the opportunity to write down answers in the other two open questions (mention a point for
improvement and what are you most satisfied with?). Furthermore, the answers can be summarized as
not being negative.
Summary for Project Management
This question has yielded only five answers, which were quite diverse. Due to the lack of data here,
there is nothing to summarize. For the participants it was enough that they had an earlier opportunity
to answer the two open questions: „mention a point for improvement‟ and „what are you most satisfied
with? There were no urgent messages and the answers given were certainly not negative.
Summary for Tijs-ICT (in general)
This question has yielded no clear picture. Nearly 20 different comments and suggestions were given.
The answers are difficult to summarize, but it is definitely worth to view all the answers.
For instance, there were a few suggestions related to „the communication and feedback‟, which
confirms in some degree the results found in §5.2.3. Also, some noted something they liked about
Tijs-ICT, such as: „the pleasant cooperation‟ and „watching a match of FC Twente together‟.
5.2.6 General Data
At the start of this chapter, in section 5.1.1, some results of the collected general data have already
been discussed. Evidence was found that the sample was rather united in its assessment. Based on this
finding, the sample can be seen as one customer group. Furthermore, in this section only some
descriptive statistics will be shown related to the collected general data. The participants were asked
to fill in in which sector their organization operates (education, healthcare, business or other) and the
size of their company expressed in FTE‟s: Full Time Employee, converted into number of fulltime
jobs (1-10; 11-25; 26-50; 51-99; 100-250; 251-500; 500 >).
Table 20: descriptive statistics: general data
Sector
Total population Freq. Percentages
Sample 2011 Freq. Percentages
Education 112 25,6% 45 31,7% Healthcare 11 2,5% 9 6,3% Business 314 71,8% 83 58,4% Other - 5 3,5%
Total: 437 100% 142 100%
Page 71
70
Not all respondents from the sample filled in in what sector their organization operates, but 142 did.
In the sample the category „other‟ was filled in 5 times: these are for instance cultural organizations.
The population and sample consist of customers based on a turnover larger than €1500, spent in 2010.
The proportions between the categories for the population and the sample display similarities. For
both, the largest group is „Business‟, the middle group is „Education‟ and the smallest group is
„Healthcare‟.
Table 21: Number of companies, categorized per size (in FTE‟s)
Company size N
1-10 20 11-25 23 26-50 20 51-99 22 100-250 25 251-500 14 500 > 18
Total 142
In table 21 can be seen that groups (in frequency) do not differ from each other in terms of absolute
numbers. Besides, the groups are well distributed. However, no calculations were available to
compare this sample with the total customer population of Tijs-ICT.
§5.2.6. was the last section of this chapter. In this chapter the most important results were presented,
analyzed and interpreted. The next chapter will integrate the empirical results with the founded
literature and will summarize the essentials of this research.
Page 73
72
Chapter 6: Discussion and Conclusion
In this chapter the discussion and conclusion of this research can be found. The essential results from
the previous section will be integrated into, the literature discussed and also the research question will
be answered. In this research a customer satisfaction survey was conducted to better understand the
needs and expectations of customers. This form of interaction with customers helps to increase the
satisfaction and with the results and feedback the service quality can be further optimized towards the
point the customer expects. This goal fits in with the intended line of continuous improvement. The
formulated research question in chapter one is repeated here:
How to continuously improve customer satisfaction in an ICT PSF?
The research question was divided into three sub questions and will be answered in the same order:
Sub question 1: How to measure customer satisfaction in a PSF?
For this answer a literature review was conducted in chapter 2. This exploring approach identified
several existing and valid measure instruments in the PSF (B2B) context. Six instruments were
identified. These quantitative instruments are structured as follows: they offer useful dimensions (such
as „reliability‟ or „assurance‟). These dimensions have a strong correlation with customer satisfaction
and service quality. The dimensions are divided into items and these items directly represent the
questions that were asked to the customers. The customers could assess the items by indicating to
what extent they are satisfied with a particular item on a 5 point scale: 1= „strongly disagree‟, 2=
„somewhat disagree‟, 3= „agree nor disagree‟ (neutral), 4= „agree‟, 5= „strongly agree‟.
The IT consulting SERVQUAL matched best with the context of Tijs-ICT. This model was especially
designed by Yoon & Suh (2004) for service firms operating B2B in the field of IT. 29 out of 40 items
from the IT consulting SERVQUAL were used to collect empirical data for Tijs-ICT. This is 73% of
the total model. The used dimensions were labeled as follows: ´reliability, ´assurance´, ´process´, and
´satisfaction´. (from IT-consulting SERVQUAL model, Yoon & Suh, 2004). Other used dimensions
for collecting data were: ´responsiveness´ (from SERVQUAL, Parasuraman, Zeithaml & Berry, 1985,
1994) and ´price´ (from B2B SERVQUAL model, Vandaele & Gemmel, 2004).
With a correlation analysis the relationship between the dimensions and the overall „satisfaction‟
dimension was tested. A significant relationship was found between all used dimensions (reliability,
assurance, responsiveness, process and price) and the overall dimension „satisfaction‟. The calculated
correlation coefficients were acceptable and all had a positive correlation.
With the „Cronbach‟s α‟ and the „Corrected Item-Total Correlation‟ was indicated with SPSS that all
dimensions were reliable. Also, it was shown that deleting items would not lead to an increase of the
overall Cronbach‟s Cronbach‟s α‟ of a dimension.
Page 74
73
Next to collecting numeric data, it was found in the literature review that it is recommended to ask
some open-ended questions as well, like: How can we improve? The research at Tijs-ICT showed that
the set of two open questions has proved to be very effective. Those questions were:
1) If you should write down one point of improvement for Sales and PM, what would you
suggest?
2) If you have to mention one point for Sales and PM, what are you most satisfied with?
The first question was meant to identify which processes could be improved as the customer expects
them to. With their knowledge about improvement points, Tijs-ICT can work on the identified points
from the research, so that customers will be pleased with those points as well in the future. The
second question was meant to identify what customers appreciate most in Tijs-ICT. By identifying
these points, staff will be aware of what they are good at.
The results of these questions are elaborated at sub question 3.
In the literature review and in the case study it was found that it is important to take into account the
context of the company in which the research will be conducted. Things are different if an
organization operates in a particular branch (like ICT instead of Architecture), or operates B2B
(instead of B2C), or only provides products instead of a complete path of services. For a PSF
operating B2B it is recommended to take one of the complete models (discussed in §2.3) that best fits
with the context of the organization that will be investigated. Ideally, it should be a model that already
exists and has been developed by well known authors; a model that is valid, reliable and has been
tested and refined by professional researchers for many years. Such theoretical model can figure as a
good outline of a customer satisfaction research or a service quality research. Initially it would have
been nice if a complete model could exactly be copied for using it in a customer satisfaction survey,
but the literature (Parasuraman, 1998) recognizes that the measure tool can, when necessary, be
adapted to fit the characteristics of a particular organization. This appeared also to be necessary for
this research. It takes into account the effectiveness of the model and it ensures that customers
understand all the questions correctly by selecting relevant dimensions. There is no best model, but it
is important which model fits the context / branch where research is done best and it is important that
customers recognize the organization in the questionnaire so they can assess the firm on those points.
The IT consulting SERVQUAL model was the instrument most related to the ICT context in which
Tijs-ICT operates. Therefore, most but not all dimensions („reliability‟, „assurance‟, „process‟ and
„satisfaction‟) were used from the IT consulting SERVQUAL model. The dimension „responsiveness‟
is exchanged with the „responsiveness‟ scale from Parasuraman et al (1985) and the dimension „price‟
(from Vandaele & Gemmel, 2004) is added. Some dimensions ('education' and 'training') did not
apply to Tijs-ICT and were therefore deleted. It can be concluded that customization by the researcher
is critical for the effectiveness in the implementation of a research for a specific company.
Page 75
74
Sub question 2: How to respond to customer satisfaction data, for continuous improvement?
Chang (2005) indicated that customer surveys are by far the most commonly used performance
measurement technique for measuring customer satisfaction. As recommended in the literature review
and shown by this research it is effective to take as a service provider (and researcher) the initiative to
collect complaints, but also compliments and points for improvement. The data was collected in the
form of a (online) customer satisfaction survey. This method is chosen instead of the method of
„Complaint Management‟ in which the researcher waits until customers will complain by themselves.
The approach suggested by Donovan & Samler (1994) demonstrated that results of the collected
feedback must be analyzed, interpreted and put into action plans that can realize improvement. An
important task is evaluating what the organization has learned from initiated plans. In a (PowerPoint)
presentation, results and outcomes were announced to the management and involved department
managers of Tijs-ICT. During the presentation results and raised issues were discussed with the
employees and a first step was taken to think on how and what improvements need to be addressed
first. The agreed follow-up is that the managers will get access to all the research data and inform
their own team in a conversation. In this conversation can be discussed with affected employees on
how to learn from the research outcomes. This approach seemed to work, because employees were
very motivated to learn. A good practical example of how to respond to customer data, is what is used
by the Tijs-ICTdirect team: invite a customer at the office with the main objective to talk about their
perceptions and experiences with Tijs-ICT. Experience showed that staff will be refreshed again on
how customers think, what his / her expectations are and what customers value most of a service or
product. Such a setting should be seen as an useful exercise or training.
Staff should also be made aware of the consequences if they overpromise more than they can deliver.
If employees under-deliver or perform less than agreed in their dealings with customers or colleagues,
this will have impact (Donovan & Samler, 1994). The impact on customer expectations is too often
underestimated. This phenomenon is also found at Tijs-ICT. It was often argued that their customers
like: a promise is a promise. If customers did not get what they expected they complain more.
Improving customer satisfaction can differentiate firms from their competitors. Firms can achieve a
competitive advantage by offering more value to customers. (Campbell, 2003; Chalmeta, 2006). For
instance, a customer from Tijs-ICT find it highly desirable that Tijs-ICT can deliver goods with its
own delivery truck. In addition, customers liked a customer relationship-day or a visit to the football
or auto sport. Furthermore, it is highly appreciated (if necessary) there is a willingness to resolve
problems even on Saturday, so the company of the customer can function smoothly again as soon as
possible. As a final example, customers appreciate it to have an extra after-call in which Tijs-ICT is
asking and checking if the delivery was delivered as promised.
Page 76
75
Sub question 3. What action plans can be formulated for Tijs-ICT from the collected scores and
analysis to continuously improve customer satisfaction? (after the empirical research has been
conducted)
Intended as a practical case, a customer satisfaction research was carried out at Tijs-ICT operating as
an ICT Professional Service Firm (B2B). By putting the voice of the customer into numerical scores,
the customer satisfaction was mapped in a concrete way. In combination with adding some open
questions as well, opportunities for improvement and priorities were identified.
In this research was found that the sample was quite united in its assessment of Tijs-ICT. In general
all respondents could be seen as one group. This conclusion is based on distinguishing customers in
sectors and company size. However, for the dimension „price‟ a significant difference was found
between company sizes (in FTE‟s). Companies with 11-25 FTE‟s were significantly less satisfatied
about the price of Tijs-ICT compared to companies with 51-99 FTE‟s. The other groups (1-10, 26-50,
100-250, 250-500, 500 <) did not differ significantly from each other. Tijs-ICT can take this finding
into account when they are dealing with companies with 11-25 FTE‟s.
An attempt was made to reduce the number of items. A review was made whether the number of
questions could be reduced without losing the character of the dimensions. This can provide a more
efficient tool, so that with less items the same results can be achieved. This test with the Cronbach‟s
„Cronbach‟s α if item deleted‟ showed that is was not possible to reduce the number of items.
With the PCA new and better components were constructed. New Sales-related components are (1)
„project delivery‟, (2) „deadlines and timing‟, (3) „preparation of the project‟ and (4) „club/teamwork‟.
New Project Management-related components are: (1) „Project Management tasks‟, (2) „competence
and content quality‟, (3) „dealing with customers and communication of the quality‟ and (4)
„effectiveness‟. For Tijs-ICT (in general) two components were indentified: (1) „satisfaction‟ and (2)
„pricing‟. For Tijs-ICT the ten new clustered components provided new insights in the collected data
as labeled above. This means, for Tijs-ICT, the new components are of greater value than the
theoretical dimensions (like „reliability‟, „assurance‟, „responsiveness‟, etc.).
The mean scores of all respondents were close together and standard deviations were quite small and
did not vary much. This indicates that the sample has a very clear opinion. It has been made clear that
a great majority is satisfied. The overall grade assigned to Project Management and Sales is a 7.5 (on
a 10 point scale). For Tijs-ICT (in general) a 3.88 is scored on a 5 point scale (using the overall
satisfaction dimension). This grade is close to a „4‟. In this research the content of a „4‟ stand for:
customers are satisfied.
With the use of the „Independent Sample T-test‟ can be concluded that the customers that assessed
Sales are satisfied in the same degree as the customers that assessed Project Management, for the
Page 77
76
tested dimensions ´reliability´, ´assurance´ and ´responsiveness´. However, different points for
improvement are identified per department (and quantitative and qualitative findings are integrated):
Sales:
- Customers were most satisfied with: the personal contact. The customer specifies the seller as
friendly and helpful during the cooperation. In addition, the knowledge and expertise of Sales is often
praised. Customers also praised:
- The good relations with Sales
- The way Sales treated them and respected their opinion
- Their willingness to help.
- Points of improvement (for Sales):
- Sales should pay more attention to the observance of appointments and deadlines.
Many customers think that a more rapid succession of bids/orders should be possible.
The duration is sometimes too long and the documentation could be better.
Communicate better when a bid/order will be supplied and why it may take longer
and if it takes longer, report this timely to the customer together with a valid
explanation / reason.
- The transfer and feedback to the customers on what has been agreed upon should be
taken very seriously. Sales must strictly adhere to agreements, which is characteristic
for what many customers demand. (a promise is a promise; an agreement is an
agreement). Prevent in future that customers have to call when a deadline is not met:
as registered in the research, always be proactive.
- Sales should improve: „the communication and feedback‟, during customer contacts
and ´the communication about tasks to be performed‟. They should take care of
informing the customer at any time. Moreover, many customers feel that the internal
communication and coordination (between departments) should be better. The
customers feel that Salesmen in the office and field staff should cooperate better.
- Identify better with the customer and their situation/perspective.
Project Management:
- Customers were most satisfied with:
- The communication and feedback
- The willingness and helpfulness of the staff; customers were satisfied about how PM treated
them and respected their opinion.
- The speed of response and the speed issues / problems are handled
- The expertise of Project Management (their solutions and support)
Page 78
77
- How PM constitutes the project team well organized with clear role assignment.
- Points of improvement (for Project Management):
1. PM should pay more attention to the specific schedule- time plan.
2. Although, a lot of customers indicated the communication was fine, not all customers
agreed on this point and they concluded that the 'communication with the customer'
should be improved. PM is not always consistent in the communication. They should
take care of informing the customer at any time.
3. PM should more effectively mediate any conflicts among people involved in the
project.
Tijs-ICT in general:
The most important finding is that: overall, customers were satisfied with the perceived services by
Tijs-ICT. Most customers were neutral or satisfied about the ´price´ of Tijs-ICT.
Benchmarking the final grades from PM and Sales
The mean: a score of 7.5, given by customers from Sales and PM on a 10 point scale can be
benchmarked with national existing scores collected by Effectory, see appendix 11. The national
average score on „general satisfaction‟ is a 7.7. This score is almost the same score as found for Tijs-
ICT and therefore the score of Tijs-ICT is an acceptable score. A comparison with leading
competitors in the specific sector in which Tijs-ICT is operating, would have been better (but average
scores about data from the ICT branche in the Netherlands were not available for free). As Chalmeta
(2006) states: quality is relative, and what matters is how well a company does things compared with
its competitors. Also Garver (2003) calls the importance of „relative performance‟: compare the
organization with a best competitor. Tijs-ICT already started a new research in the field of competitor
analysis, to compare their results.
The general conclusion can be that Tijs-ICT can be satisfied with the results of the customer
satisfaction research. Customers are satisfied (in general) and a few points for improvement were
identified specifically for different departments. The next chapter includes recommendations.
Page 80
79
Chapter 7: Recommendations
In this chapter recommendations for further research will be distinguished from recommendations that
are especially formulated for Tijs-ICT:
Recommendations formulated for further research:
In this part recommendations are given that reach further than the scope of the present study. These
recommendations are also (partly) based on the theory discussed in chapter 3. Professional Service
Firms can use these recommendations to support their customer satisfaction and for creating an
environment within the organization that increases the chances action plans will succeed.
The cited authors in the literature review warned for the essential step after results have become
known. This next step should be taken very seriously and should certainly not be underestimated.
Collecting customer feedback is one step, but benefitting from the outcomes by implementing lessons
is the second step before the organization can make a customer satisfaction research into a success. In
this current research, that step has not yet been investigated. Future research should investigate if the
following recommended steps will be effective for continuous improvement:
Take the initiative to obtain feedback
Complaints management is an approach to collect bottlenecks and improvements points from
customers. However with that approach the customer takes the initiative and by that time it is already
too late. Therefore an approach in which the organization itself takes the initiative is better. With a
customer satisfaction survey also appreciated points can be identified (next to complaints). Clearly
show to the customer that the organization is open to improvement and that it is appreciated when
customers voice their opinions. For a customer the trigger to respond critically should be high. This is
also possible through other communication channels. For example, at the end of each month project
managers could call customers to ask if there are any issues that are currently not running as they
should.
The customers must experience that they are taken seriously, which should be confirmed by the
tangible and visible improvements that are made in response to their provided feedback. If Tijs-ICT
claims it wants to improve, then Tijs-ICT must ensure and show that promises will clearly get picked
up. Dialogue in the area of customer satisfaction strengthens the relationship with the customer and is
essentially a marketing tool, because the organization signals it still is very interested in the customer.
(Montoya, Massy, Khatri, 2010). Effectory (2011) outlines in its vision: organizations that are well in
touch with their customers perform better.
Connect collected and available (rough) knowledge
Before being translated into action plans, outcomes should be linked to other relevant customer
information, such as other multiple customer listening tools. By connecting available and consistent
Page 81
80
resources, results from the customer satisfaction survey will additionally get confirmed which makes
the data stronger. In addition to complaints management, the experience (in the minds) of the staff
should also be secured into practical lessons, so colleagues can use and benefit from the knowledge
that already exists within the organization. Such an information- or a customer feedback system can
provide support to collect and report (customer) feedback.
Estimate value and usability of knowledge
The literature review indicates that knowledge should be pooled in a structured way, it should be
saved and transferred to the right people. Before the collected knowledge is distributed, all
accumulated (rough) knowledge must be valued so that useless information is filtered out. A
responsible manager (e.g. a Quality Manager or Marketing Manager) has three main tasks in the
analysis:
1) to identify bottlenecks with which the customers are dissatisfied and convert them into
learning and improvement points;
2) to identify what the customers are (very) satisfied with and focus especially on those points;
3) to review other suggestions from customers.
Determine feasibility for improvement
When all the generated input (including other information flows) has been estimated on feasibility and
priority, Garver (2003) advises that the responsible manager should take into account in the decision
making the following internal issues:
- assess what is possible within the organization, in terms of expertise and capacity
- assess if it fits in with the strategy and policy of the organization
- estimate the costs / investments for implementing improvements
- forecast the expected Return On Investment (ROI).
The responsible manager reports the findings based on set conclusions and priorities. This plan also
contains the necessary resources, the expected results, a risk analysis and a time schedule.
Change Management/ All employees must act according to established plans
Employees must be (made) aware of the importance of customer satisfaction. It must be clear why and
how this customer focus/orientation can be optimized to deliver good services that correspond with
the customers expectations. Customizable awareness applies to staff who have direct customer
contact, but also applies to the rest of the organization. One has to be informed and act upon customer
expectations. Employees should also be made aware of the consequences of promising more than one
can deliver, or if staff under-delivers or performs less than agreed upon in their dealings with
customers or colleagues (Donovan & Samler, 1994). The impact on customer expectations is too often
underestimated.
Page 82
81
After awareness creating support (and commitment) is the next step in order to succeed formulated
plans. Creating support starts by telling the rest of the organization that a customer satisfaction survey
is carried out and why it is carried out. Showing the questionnaire to the employees involved and
asking for input, is a first step in the right direction. When the results have become known, the staff
has to be informed of the outcomes and follow-up plans with a presentation. To the employees
involved it should be made clear that they must always be open to learn about optimizing customer
orientation. Staff must participate or bring in agenda items at meetings or through other channels.
They also have customer knowledge and ideas for improvement. After such a meeting, the most up-
to-date action- and attention points will be given to them by the responsible manager in order to
implement improvements in their daily work. Action plans should be set up as concrete and
operational as possible, so employees know immediately know where they should focus on.
Communication/Informations System as a success factor
Besides agenda item meetings, a continuous feedback loop should be created, so relevant information
will not be lost. Communicate overall goals and action plans in staff magazines. Sometimes the
(external) customer wants a short message of what is actually happening with their feedback. This can
be personally notified by mail or telephone, but also in an article in an external information magazine.
For the internal communication, Wirtz & Tomlin (2000) recommend to design an IT system. With this
system feedback can be transmitted in a simple and structured way to the appropriate personnel such
as process owners, departmental managers, directory management etc. The system must be ICT
supported and should make a rapid intake and distribution of (customer) information possible. Wirtz
and Tomlin suggest that existing Intranet support systems are available in the market, which are very
handy in use. With such a system staff has direct access to important information such as: type of
customer, type of feedback (compliment, suggestion or complaint), the medium through which it has
entered (face-to-face, telephone, fax, email, etc.) and the need for a follow-up or repair service. This
information can be exchanged in brief and agreed terms.
Learning from evaluations
Perhaps the most important task is evaluating what the organization has learned from initiated plans.
How is the organization doing after having responded to identified opportunities? Did customer
satisfaction increase? A good practical example of what can be used in this respect is: invite the
customer to the office with the main objective to talk about their perceptions and experiences with the
service provider. Experience shows that staff is refreshed again on how customers think, what his /
her expectations are and what customers value most from a service or product. Such a setting should
be seen as an exercise/training.
Long-term monitoring
Not every single point needs to be discussed on the agenda every month. Sometimes a quarterly
review and look for trends will be enough. An annual (or biannual) performance report or overview
Page 83
82
will give a representative assessment of the progress and long-term trends in the field of customer
satisfaction. This means, the customer satisfaction research should be repeated over time and
comparisons should be made to see if action plans really worked out as intended. This long-term
monitoring is an important process for the continuous improvement of customer satisfaction and
service quality. Clear processes are therefore necessary to periodically collect customer information,
analyze it, and respond to it effectively. During this process monitoring/control is required, reports are
required and an evaluation for each period is desirable. Where necessary, processes and practices are
adjusted if the quality is not what the organization has agreed upon with the customer. Should this not
have led to the planned improvement, action plans then should be reformulated with the personnel
involved. In all these phases, a responsible manager should take the lead.
Recommendations for Tijs-ICT:
At Tijs-ICT it can also be investigated in the future whether the recommendations above, if they are
taken into account, effectively contribute to succeed action plans (that are identified in a customer
satisfaction research). Other specific recommendations that should acted upon by Tijs-ICT will be
presented here:
1. In order to accelerate the duration of bids/orders, the persons concerned must come together to
determine whether this is possible. If this appears to be organisationally impossible, the salesmen
must be made clear that they should not promise a deadline that is too tight. In advance it should
be made clear to the customer why he may have to wait several days. Manage expectations (that
are acceptable).
2. Employees have to be made aware that they should be more consistent in (proactively) informing
their customers and in the internal communication. Tijs-ICT could use an Information System for
support. By implementing an IT system, the involved customers could log in as well to look for a
clear overview of the agreed promises and deadlines. With such an information system, all the
employees involved will be kept informed and special requirements or characteristics of the
customer can be added to the system as well, so employees can better empathize with the
customer. For instance, try to buy or develop a Customer Feedback System as discussed in
§3.3.2.
3. Now that a zero measurement has been made, be sure that the next measure is done exactly in the
same way, so that a clear comparison is possible. This means using the same dimensions, the
Page 84
83
same general data questions and the same open ended questions. Besides, next time the ten new
components can be used. As an extra: next time provide a rating of how important individual
dimensions and items are to the customers. It is essential that customers indicate their priorities
for improvements in order to help focus strategic planning directions.
4. For continuous improvement one measurement only is not sufficient and a follow-up
measurement is needed. When conducting the second measurement, be sure to measure the
effectiveness of the action plans made between the first and second customers satisfaction
research. A subsequent measurement (e.g. next year) can test and evaluate whether defined
targets actually lead to an increase of scores, less complaints and a better service quality (from
the customer‟s viewpoint).
5. Try to benchmark the results of this current research at Tijs-ICT, with leading competitors in the
specific sector in which Tijs-ICT is operating.
6. Management must set a goal which grades and scores they want to achieve within the next two
years and five years. (For instance, at least maintain and preferably improve the grades/scores
and an „8‟ as a final grade).
7. Individual customers who scored lower than the average are a direct trigger for Tijs-ICT. Tijs-
ICT should contact these customers to discuss and improve the situation and improve customer
satisfaction. Tijs-ICT should be open to learning from them.
8. Finally, this paper ends with a single comment given by a individual customer who suggests that
Tijs-ICT should: create a Service Manager function that monitors the quality of the service
provided to the customers. The service manager's role consists of: coordinating cross-
departmental activities within Tijs-ICT, monitoring the turnaround at service desk, escalation
management, and making reports about service management and exceptions. Since last year,
Tijs-ICT has already introduced the function of Quality Manager, which is almost similar to the
sketched function by the customer. The future will show whether this recommendation will lead
and contribute to real improvements in customer satisfaction and service quality.
Page 86
85
References:
Anderson, E.G., Fornell, C. & Lehmann, D.R. Customer (1994). „Customer Satisfaction, Market
Share, and Profitability: Findings From Sweden‟. Journal of Marketing. pp. 53-66.
Babbie, E. (2004). The Practice of Social Research (12th edition). Belmont: Wadsworth/Thomson.
Chapter 4.
Barnes, Fox, Morris (2004) Exploring the Linkage between Internal Marketing, Relationship
Marketing and Service Quality: a Case Study of a Consulting Organization. Total Quality
Management, vol. 15, No. 5-6, pp. 593-601.
Berry, L.L., Parasuraman A.and Zeithaml, V.A. (1994) Improving Service Quality in America:
Lessons learned Academy of Management Executive, vol. 8, no. 2, pp. 32-45.
Brady, T, Davies, A, Gann, D.M. (2005) Creating value by delivering integrated solutions.
International Journal of Project Management, vol. 23, issue 5, pp. 360-365.
Brentani, U., Ragot, E. (1996) „Developing New Business-to-Business Professional Services: What
Factors Impact Performance?‟ Industrial Marketing Management vol 25, pp. 517-530.
Carman, J.M. (1990) „Consumer Perceptions of Service Quality: An Assessment of the SERVQUAL
Dimensions‟, Journal of Retailing, vol. 66, no.1, 1990, p.33-55.
Den Hertog, P. (2000) „Knowledge-Intensive Business Services as Co-Producers of Innovation,
International Journal of Innovation Management, vol. 4, no. 4, pp. 491–528.
Chalmeta, R. (2006) Methodology for customer relationship management. The Journal of Systems and
Software, pp. 1015–1024.
Chang, H.H. (2005) The Influence of Continuous Improvement and Performance Factors in Total
Quality Organization Total Quality Management vol. 16, no. 3, pp. 413–437.
Christopher, M., Payne, A. and Ballantyne, D. (1991) „Relationship Marketing: Bringing Quality
Customer Service and Marketing together‟. Relationship Marketing, pp. 1-31.
Dawes, J., & Rowley, J. (1999) Negative evaluations of service quality – a framework for
identification and response. Journal of Marketing Practice: Applied Marketing Science, vol. 5 no. 2,
pp. 46-55.
Donavan, P., & Samler, T. (1994) Delighting Customers: The Ten-step Approach to Building a
Customer-driven Organization. Managing Service Quality, vol. 4, no. 6, pp. 38 – 43.
Page 87
86
van Dyke, T.P., Prybutok, V.R. & Kappelman, L.A. (1999) Cautions on the Use of the SERVQUAL
Measure to Assess the Quality of Information Systems Services. Decision Sciences, vol 30, no. 3, pp.
877-891.
Field, A.P. (2009) Discovering Statistics Using SPSS (3rd edition). SAGE Publications Ltd.
Garbarino, E. & Johnson, M.S. (1999). The Different Roles of Satisfaction, Trust, and Commitment in
Customer Relationships. Journal of Marketing, pp 70-87.
Garver, M.S. (2003) Best practices in identifying customer-driven improvement opportunities
Industrial Marketing Management, (32) pp. 455– 466.
Garver, M.S. (2001) Listening to customers. Mid-Am J Bus, 16 (2), pp. 41–54.
Gounaris, S. (2005) 'An alternative measure for assessing perceived quality of software house
services', The Service Industries Journal, 25: 6, pp. 803-823.
Hennestad, B.W. (1999): Infusing the Organisation with Customer Knowledge, Norwegian School of
Management, Scand. J. Mgmt. 15, pp. 17-41.
Hipp, C. (1999) Knowledge-Intensive Business Services in the New Mode of Knowledge Production.
AI & Society (Fraunhofer Institute for Systems and Innovation Research) 13: pp. 88-106.
Huizingh, E. (2006). Inleiding SPSS 14 voor Windows en Data entry. Sdu Uitgevers bv, Den Haag.
Homborg, C, Koschate, N, & Hoyer, D.H. (2005). Do Satisfied Customers Really Pay More? A Study
of the Relationship Between Customer Satisfaction and Willingness to Pay. Journal of Marketing,
vol. 69, pp. 84-96.
Johnson, M.D and Fornell, C. (1991). „‟A Framework for Comparing Customer Satisfaction Across
Individuals and Product Categories*, Journal of Economic Psychology, 12 (2), pp. 267-286.
Kuhn, J . (2000). The role of continuous improvement within globalization. International Journal of
Technology Management, 20, pp. 442– 458.
Montoya, M.M., Massey, A.P., Khatri, V. (2010). Connecting IT Services Operations to Services
Marketing Practices Measuring Information Systems Service Quality: Lessons From Two
Longitudinal Case Studies. Journal of Management Information Systems; vol. 26, issue 4, pp. 65-85.
Müller, W. (1991) Gaining Competitive Advantage Through Customer Satisfaction. European
Management Journal, vol. 9, no. 2.
Page 88
87
von Nordenflycht, A. (2007). What is a professional service firm and why does it matter? Faculty of
Business Administration, Vancouver (Canada), pp. 1-47.
von Nordenflycht, A. (2010) What is a Professional Service Firm? Toward a Theory and Taxonomy
of Knowledge-Intensive Firms, Academy of Management Review, vol. 35, no. 1, pp. 155-174.
Oliver, R.L. (1999). Whence Consumer Loyalty. Journal of Marketing. pp. 33-44.
Parasuraman, A., Zeithaml V.A. & Berry, L.L. (1985) A Conceptual Model of Service Qualtiy and its
Implications for Future Research. Journal of Marketing, vol: 49, iss: 4, pp. 41-50.
Parasuraman, A., Zeithaml V.A. & Berry, L.L. (1994). Alternative Scales for Measuring Service
Quality: A Comparative Assessment Based on Psychometric and Diagnostic Criteria. Journal of
Retailing, vol. 70, no.3, pp. 201-230.
Phipps, S. (2001) Beyond Measuring Service Quality: Learning from the Voices of the Customers, the
Staff, the Processes, and the Organization .
Reichheld, F.F. & Thomas, T., (1996). The Loyalty Effect. The Hidden Forces Behind Growth,
Profits, and Lasting Value. Boston, MA: Harvard Business School Press, (p. 39).
Issac, G., Rajendran, C. & Anantharaman, R.N. (2004). A conceptual framework for Total Quality
Management in Software Organizations. Total Quality Management, vol. 15, no. 3, pp. 307–344.
Szymanski, D.M. & Henard, D.H. (2001). Customer Satisfaction: A Meta-Analysis of the Empirical
Evidence. Journal of the Academy of Marketing Science, vol 29, no. 1, pp. 16-35.
Taylor, S.A. & Baker, T.L. (1994). An Assessment of the Relationship Between Service Quality and
Customer Satisfaction in the Formation of Consumers‟ Purchase Intentions. Journal of Retailing, 70
(2), pp 163-178.
Twisk, J.W.R. (2007). Inleiding in de toegepaste biostatistiek. Elsevier Gezondheidszorg, Maarssen.
Chapter 3.
Vandaele, D. & Gemmel, P. (2004). Development of a measurement scale for business-to-business
service quality: assessment in the facility services sector. Universiteit Gent, Faculteit Economie en
Bedrijfskunde, pp. 1-35.
Wang, P. & Swanson, E.B. (2007). Launching professional services automation: Institutional
entrepreneurship for information technology innovations Information and Organization, pp. 59-88
Watson, R.T., Pitt, L.F. & Kavan, C.B. (1998). Measuring Information Systems Service Quality:
Lessons from two longitudinal case studies, MIS Quarterly, vol. 22, iss. 1, pp. 61-79.
Page 89
88
Westbrook, K., W. & Peterson, R. M. (1998). Business-to-Business Selling Determinants of Quality
Industrial Marketing Management, pp. 51–62.
Wirtz, J. & Tomlin, M. (2000) Perspective Institutionalising customer-driven learning through fully
integrated customer feedback systems, Managing Service Quality, vol. 10, no. 4, pp. 205-215.
Woo. K. & Ennew, C.T. (2005) Measuring business-to-business professional service quality and its
consequences, Journal of Business Research (58), pp. 1178-1185.
Woodruff, R.B. (1997) Customer Value: The Next Source of Competitive Advantage. Journal of the
Academy of Marketing Science,25 (2), pp. 140-153.
Woodruff, R.B. & Gardial, S.F. (1996). Know your Customer, New Approaches to Understanding
Customer Value and Satisfaction. Blackwell Business. Chapter 1, p 20.
Yoon, S. & Suh, H. (2004) Ensuring IT Consulting SERVQUAL and User Satisfaction: A Modified
Measurement Tool, Information Systems Frontiers 6:4, pp. 341–351.
Zairi, M., (2000). Managing customer dissatisfaction, The TQM Magazine. vol. 12, no. 5, pp. 331-
335.
Page 90
89
Appendix 1: Conceptual model of SERVQUAL from Parasuraman, Zeithamel & Berry (1985)
Page 91
90
Appendix 2: Parasuraman, Zeithaml & Berry, 1994, p. 207) The SERVQUAL items
Page 92
91
Appendix 3: Problems identified in the literature by van Dyke, Prybutok & Kappelman (1999).
Page 93
92
Appendix 4: The INDSERV items from Gournaris (2005)
Assessing perceived quality of software house service (Gournaris, 2005, p. 823)
Page 94
93
Appendix 5: Variables and items of the IT consulting SERVQUAL (Yoon & Suh 2004, p.347)
Appendix 6: Schematic of IT consulting SERVQUAL (Yoon & Suh 2004, p. 346)
Page 95
94
Appendix 7: IMP INTERACTION Model Measurement items from Woo & Ennew (2005, p. 1184):
Page 96
95
Appendix 8: Underlying Determinants for Service Quality for Business-to-Business Service Encounters
(Westbrook & Peterson, 1998, p. 58)
Page 97
96
Appendix 9: Vandaele & Gemmel (2004, pp. 29-30) B2B SERVQUAL scale:
Scale is based on Westbrook and Peterson (1998). The items in italic were deleted by Vandaele & Gemmel, during their
factor analysis. (-) are negatively worded items.
Page 98
97
Appendix 10: Examine multiple customer listening tools (Garver, 2003, pp. 462 - 463)
Customer listening tools include: (1) critical incident survey, (2) relationship survey, (3) benchmark
survey, (4) customer complaints, (5) won–lost and why survey, and (6) customer contact employees:
(1) The data revealed that critical incident surveys are transaction-specific surveys,
administered immediately following a certain type of customer service interaction. For
example, assume that „„product return‟‟ is a critical incident from the customers‟ perspective.
A sample of customers who returned products would receive a survey soon after this
interaction. Participants discussed that critical incident surveys are excellent at quickly
identifying service problems and are used at primarily a tactical level. These surveys are used
to guide continuous improvement of specific processes.
(2) Relationship surveys are administered on a periodic basis, and their purpose is to capture the
customer‟s overall perception of the supplier‟s performance. These surveys gather overall
perceptions, looking across many different interactions with the supplier. Relationship
surveys are viewed as traditional customer satisfaction surveys and are the core foundation to
any program designed to listen to customers. In contrast to critical incident surveys,
relationship surveys tend to be used at more strategic levels.
(3) Data analysis revealed that benchmark surveys are periodic measurements that capture
perceptions of performance of all major competitors in the marketplace. Whereas relationship
surveys primarily sample a firm‟s current, regular customers, benchmark surveys gather
perceptions of performance from the entire market. These surveys usually gather customer
perceptions of performance about the top competitors in an industry, allowing the firm to
examine their strengths and weaknesses in the overall marketplace, not just with their
customers. Benchmark surveys are used in the strategic planning process by senior
management and executives and are the most effective tool to accurately identify the firm‟s
competitive advantage in the marketplace. While continuous improvement may be a result of
this tool, the real value should be breakthrough thinking to gain a sustainable advantage.
(4) Gathering customer complaints is standard practice for many companies, yet integrating
complaint data with customer satisfaction data to identify improvement opportunities is rarely
done. Best practice companies carefully monitor complaints and track performance
deficiencies that cause complaints. Additionally, they gather data concerning the severity of
complaints and their ability to satisfy and fix the complaint. Most important, complaint data
are used in with other listening tools to identify customer service attributes needing
improvement.
(5) Data analysis revealed that won–lost and why surveys are an excellent tool to gather
perceptions of recently won or lost customers. This tool gathers actual customer behaviors,
yet the real value is the customer‟s reasoning behind the behavior. For example, are we losing
customers because of order accuracy, damaged product, or lead time reliability? Why are we
losing strategic customers? What element of customer service is retaining or winning
customers? In the last quarter, how many customers were lost due to on-time delivery?
(6) Finally, best practice companies listen to their customer contact employees, typically
customer service representatives, service technicians, and salespeople. These employees are
often in contact with customers everyday and are customers. While employee perspectives
will likely be biased, outstanding representatives understand their customers and are often
first to recognize important customer issues.
Page 99
98
Appendix 11: Benchmark the calculated mean with scores from Effectory
The calculated mean for Sales and PM (from Tijs-ICT): a score of 7.5, can be benchmarked with
national existing scores collected by Effectory, a large professional research institution in the area of
customer satisfaction. The National Customer Satisfaction index (in Dutch: De Nationale
Tevredenheidsindex® voor klanttevredenheid) is based on outcomes from customer satisfaction
research at Dutch organizations in a wide variety in both profit and non-profit sector. The scores can
be found in the figure below. (http://www.tevredenheidsindex.nl/klanttevredenheid/actuele-indexen/)
Figure: Benchmark: De Nationale Tevredenheidsindex (Effectory B.V., 2011)
The empirical data of the research at Tijs-ICT is collected between 20th of April and 18
th of May. The
best comparison can be made with those two months.
Page 100
99
Appendix 12: Principle Component Analysis (PCA)
It is possible to compare the results of the PCA with the findings in literature. The IT consulting
SERVQUAL dimensions: „reliability, „assurance‟, „process‟ and „satisfaction‟ (from Yoon & Suh,
2004) were used for this current research. On those dimensions (in 5.2.1d) the following results were
found:
- for Sales: „reliability‟ was more or less clustered again in a component (see component 1);
- for PM: six out of nine process-items were clustered again in one component and another new
developed component consisted of seven items, all seven items were originally from the
„reliability‟ dimension;
- for Tijs-ICT in general: „satisfaction‟ has “survived” the PCA.
This confirms a well-chosen compilation of the dimensions which were reunited again, however
better and new names were given after conduction the PCA. Yoon & Suh (2004) also used the
„Extraction Method: Principal Component Analysis‟ and the „Rotation Method: Varimax with Kaiser
Normalization‟. Relevant to tell about the findings by Yoon & Suh is that all four items of the original
dimension „assurance‟ were clustered together to represent its concept correctly. The original
dimensions „reliability‟ and „process‟ were not clustered together. Those items were spread over the
new created components. „Satisfaction‟ was not tested, because in this study „satisfaction‟ was seen as
a dependent variable, and Yoon & Suh only tested the independent variables (assurance, reliability,
process, etc.).
By comparing the current findings and the findings by Yoon & Suh, it can be seen that not all the
dimensions “survived” the PCA completely. A possible explanation could be that the cause lies within
the large number of their items. The larger the number of items per dimension, the greater the chance
they get cut up. The probability that the original dimension will be split is greater for, for example
„reliability‟ which consists of twelve different items, or the dimension „process‟ which consists of 9
different items. For this test it is recommended to have around four or five or six items per dimension.
A limitation of this equation is that Yoon & Suh, next to the corresponding dimensions: 'reliability',
'assurance', 'process' and 'satisfaction', have tested other dimensions as well. Next to the 29 matching
items, also 11 other items were different. Therefore this comparison is not entirely pure.
PCA-related results about the dimension „responsiveness‟ from Parasuraman et al (1985) were not
found in literature. However, PCA-related results about the dimension „price‟ were available. The
dimension „price‟ came from the B2B SERVQUAL model, developed by Vandaele & Gemmel
(2004): They also conducted a PCA, but used a: „Factor Loading Following Oblique Rotation‟. To
make a comparison with their findings, a „Factor Loading Following Oblique Rotation‟ was
conducted with the data of this current research. There were many similarities found. In both studies
Page 101
100
all three items were clustered and reunited again in a component. Vandaele & Gemmel found high
factor loadings:
- Item: The price of the service provider meets the client‟s budget objectives: factor loading: .85
- Item: The price is competitive compared to other offers for similar services: factor loading: .91
- Item: The price of the service provider relates to the quality delivered: factor loading: .60
With the current collected data high factor loadings were found as well: (data was also tested with the
„Factor Loading Following Oblique Rotation‟):
- Item: The price of Tijs-ICT meets the budget objectives of my organization: factor loading: .85
- Item: The price of Tijs-ICT is competitive compared to other offers for similar services: factor loading: .91
- Item: The price of Tijs-ICT relates to the quality delivered: factor loading: .60
These results confirm the strength of the dimension: „price‟. In this research for the dimension „price‟,
the scores were a little lower than the other dimensions. Unfortunately, there were no results available
as to in what degree 'price' was scored on a 5 or 7 point scale in the article of Vandaele & Gemmel.
Therefore it can not be seen if Vandaele & Gemmel also has lower scores on „price‟ in comparison
with their other used dimensions. In this current research: „price‟ has slightly lower scores than the
other dimensions received, but it has not a greater impact than other dimensions on the overall
construct „satisfaction‟. 'Price' does not largely determine the score of the overall construct
'satisfaction'.
It is desired that a PCA will generate new, clear and better components. But with this method, Yoon
and Suh warn the researcher to always be aware of the following argument: „However this may cause
the partial spoilage of the validlity of IT consulting SERVQUAL, the concrete construct of
SERVQUAL validated by many previous researches and the analytic power of items would not change
the items and constructs of this tool at this research. But it is important to continue and examine the
analysis of data through factor technique because it can refine the tools already developed over the
quality assurance processes. So that finer measurement tools can be applied to the actual project site
to advance their qualities‟. (Yoon & Suh, 2004, p. 349).