HSE Health & Safety Executive Improving the safety of workers in the vicinity of mobile plant Prepared by IMC Technical Services Limited for the Health and Safety Executive CONTRACT RESEARCH REPORT 358/2001
Transcript
HSEHealth & Safety
Executive
Improving the safety of workersin the vicinity of mobile plant
Prepared byIMC Technical Services Limited
for the Health and Safety Executive
CONTRACT RESEARCH REPORT
358/2001
HSEHealth & Safety
Executive
Improving the safety of workersin the vicinity of mobile plant
IMC Technical Services LimitedBretby Business Park
Ashby RoadStanhope BretbyBurton-on-Trent
Staffordshire DE15 0YZUnited Kingdom
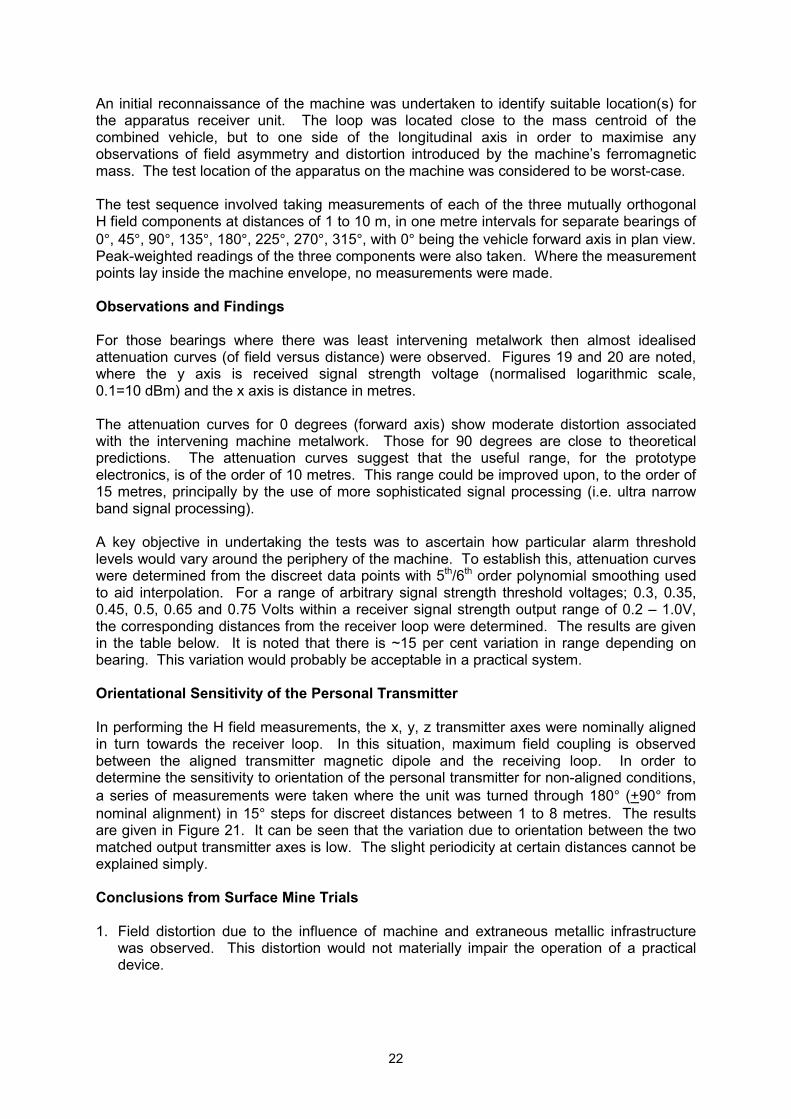
The objective of this work was to investigate possible approaches and technologies to improve thesafety of pedestrians around mobile plant. The study has considered mobile plant across three industrysectors; underground mining, surface mineral extraction and warehousing and materials handling. Thework programme has investigated vehicle ergonomics and visual task analysis, aids to improvereversing and sight lines, direct body detection techniques, conventional transponder (RFID) and VLFmagnetic dipole detection technologies. A proof-of-concept personnel detection scheme has beendeveloped, where pedestrians would be equipped with a person worn transmitter in high risk areas.The mobile plant safety system functions by detecting the transmitters with a small receiving loop, fieldinterrogation and driver warning unit suitably located on the mobile plant. By employing a threecomponent magnetic field transmitter operating at very low frequency (~30 kHz), the design intentionwas to overcome the limited polar coverage and null problems observed with many commercialtransponder systems. Open field tests indicated that the polar detection pattern of the system hasacceptable circular symmetry. Tests undertaken underground to gauge the impact of various metallicand strata structures confirmed that the polar field pattern on an operating machine was acceptable.The principle of detecting the three components of a low frequency H-field has been shown to be atechnically sound approach, providing a wide uniform field of coverage and detection around all sidesof the item of mobile plant. Further work would involve the engineering of an intrinsically safe design.Alternative worker protection systems from the US and Canada are identified and contrasted with theresearch system.
This report and the work it describes were funded by the Health and Safety Executive (HSE). Itscontents, including any opinions and/or conclusions expressed, are those of the author alone and donot necessarily reflect HSE policy.
All rights reserved. No part of this publication may bereproduced, stored in a retrieval system, or transmittedin any form or by any means (electronic, mechanical,photocopying, recording or otherwise) without the priorwritten permission of the copyright owner.
iii
CONTENTS Page
No
Executive Summary vii Section 1: Introduction, Problem Definition, Accident Statistics and Legal
Duties 1
Section 1.1: Introduction 1 Section 1.2: Accident Types and Statistics 2 Section 1.3: The Main Legal Requirements 4 Section 2: Improvements through Ergonomics, Reversing and Sight Line
Aids 7
Section 2.1: Improvements through Ergonomics 7 Section 2.2: Reversing and Sight Line Aids 10 Section 3: Object Detection and Collision Avoidance Research, Direct
Detection of Human Body Attributes 13
Section 3.1: Object Detection and Collision Avoidance Research 13 Section 3.2: Direct Detection of Human Body Attributes 15 Section 4: RFID 'Tag' Systems, Development Process, IMC Personal
Safety System and Trials 18
Section 4.1: RFID 'Tag' Systems and Development Process 18 Section 4.2: IMC Personal Safety System and Trials 19 Summary Conclusions and Observations 26 References 30 Figures 33 Appendices: Appendix 1: Ergonomic Study of Vehicles 48 Appendix 2: US NIOSH and Nautilus Ltd. Personnel Detection Systems 79 Appendix 3: Explanation of the Propagation that Occurs at Very Low
Frequencies 83
Appendix 4: Human Exposure to Low Power Non-Ionising Electromagnetic Fields
86
Appendix 5: RFID Systems 89
iv
v
Acknowledgements
IMC wishes to openly acknowledge the generous assistance offered by the following companies and staff in regard to making trial and test facilities available: R.J.B. Mining (UK) Limited Mr E. Ruck, Operations Electrical Engineer, Harworth Mr P. Davis, Electrical Engineer, Daw Mill Colliery Mr J. Ford, Deputy Electrical Engineer, Daw Mill Colliery Bass plc, National Distribution Centre, Burton-on-Trent Mr I. George, Site Manager Mr M. Scanlon, Health and Safety Manager Lansing Linde (UK) Limited Mr P. Green, Health and Safety Manager
vi
vii
EXECUTIVE SUMMARY
A selective review was undertaken of the problems and incidents which have arisen across three sectors; underground mining, surface mining and factory materials handling. The objective of the review was to establish an appreciation of the current position faced by industry. Legislative requirements and standards have been defined for the UK and selectively for a number of other countries. Accident data was sought from the mining industries of the United States, South Africa and Australia. For non-mining surface industries, data of a more general nature was obtained. The purpose behind examining overseas industries in terms of the relative occurrence and causes of accidents in the vicinity of mobile plant was to identify the ranking of problems across a larger data set, and to evaluate organisational responses including problem-specific research. For example, the South African SIMRAC research response to mobile plant accidents has included investigation of transport and tramming accidents and a fundamental review of illumination and visibility standards [SIMRAC 1996, 1999, 2000]. This work included a generic review of workplace tasks, critical visual requirements, potential visual limitations, potential hazards, illumination and sight lines. The research response in the US has primarily focussed on technological solutions and addressing training needs.
The vehicle ergonomic assessment, primarily using a visual task based methodology, confirmed that significant visibility problems remain, albeit that machine suppliers/operators address these by sight line improvement aids where possible. The types of mobile plant and workplace environments assessed lead to varying visual requirements and limitations. Zonal requirements for personal detection differ between the static (moving off) situation and the dynamic (in motion) situations. There may need to be a compromise in the interrogation zone definition, or dynamic adjustment of the zone on a speed-dependent basis in a practical system. The requirements to ensure a safe visual working environment cut across lighting variables, task variables, visual perception variables, and workplace variables. Visual environment assessment methodologies including sight-line assessment are now well established, however, visual task analysis needs to be correlated with in-depth risk assessment and review of incident causes.
The status of camera and mirror devices has been gauged by examining best available examples. Cameras and other visual aids have advanced since a last in-depth evaluation (c 1994). Lighting conditions and monitor capabilities will, however, impact on utility of cameras and visibility problems exist even after retrofit of visual aids and ergonomic assessments to correct factors such as seat height and seat positioning. Consideration needs to be given to whether a combination of techniques would provide the lowest cost solution. For example, there may be benefits in following a philosophy of improving sight lines where possible on the machine, together with using a combination of mirrors and cameras, and then using a personnel detection scheme as warranted. Equipment operators would benefit from a safety needs assessment methodology being defined.
A review of direct body sensing techniques and low cost passive transponder technologies was undertaken to determine if a low-cost personnel detection system was feasible using generic security or retail theft prevention technologies. The application of direct body sensing techniques, such as pyroelectric sensing and ultra-wideband doppler movement detection, would be unlikely to result in a system with adequate discrimination, circumferential coverage and a low false alarm rate, although significant advances continue to be made in sensor fusion and classification techniques. There is a possibility of using a multiplicity of low cost passive transponder devices carried on the person. However, such a system would not provide the required range without using high powers in the interrogation fields. There would also be a likely requirement for 3-4 sensing modules to provide appropriate coverage. In conclusion, no directly suitable commercial RFID technologies could be found. The study also considered object detection and collision avoidance
viii
research being conducted in the automotive sector. This has led to a number of radar technologies which offer a high detection probability but only within tightly defined interrogation zones. The value of this equipment is considered to be limited in off-road and mining applications. This position generally confirms that an active transmitter-transponder approach is the most technically feasible. The regulations covering a practical device concern inter alia; radio frequency approvals, EMC compliance and electromagnetic field exposure limits, together with various type approval requirements. These have been examined and reported as appropriate. In addition to the above, there is a need to further define engineering detail and, importantly, the logistics and warning-control actions initiated from the personnel detection information, for example decisions concerning the issuance of warnings to the pedestrian or driver, or the immobilisation of the machine in high risk situations. After examination of various hazards and the interaction of drivers with pedestrians, it was concluded that the system should primarily provide an alert to the driver. The provision of an alert to pedestrians within the worker safety device is technically feasible but involves additional engineering and cost. A review was undertaken of research being conducted elsewhere to develop worker safety systems, principally involving research within the United States. A system developed by the US National Institute for Occupational Safety and Health (NIOSH) is of particular note. A system has also been developed recently in Canada. Both systems are intended to reduce the risks posed to inappropriately positioned continuous miner or LHD remote-control operators. The NIOSH personnel detection process involves equipping each worker with a small transmitter (transponder) unit. The mobile plant has a loop aerial or loop aerials wound around the periphery of the plant itself, thus accommodating articulated mobile plant designs. The loop aerials on the plant are continuously energised with an interrogation field of 30-60 kilohertz, providing a magnetic field geometry which is only moderately influenced by the metallic construction of the plant or the surrounding infrastructure. The receiver unit of the wearer’s personal protection unit responds to the interrogation signal and provides a high frequency return confirmation signal when the interrogation signal exceeds a pre-defined level or amplitude. To overcome orientational sensitivity, the pedestrian unit incorporates six miniature sensing coils and associated field measurement electronics. The prototype NIOSH system is thus relatively complex but is substantially orientation independent and can be set up to provide a range of up to 30 metres. The IMC research and design philosophy represents an inversion of this topology, where the sophistication of the system is moved to the machine, keeping the pedestrian unit as simple as possible. Initial consideration was given to the feasibility of using a simple single magnetic dipole (solenoidal coil) transmitter in the wearer’s unit and providing a complex three dimensional field interrogation capability on the machine. This initial research avenue of using a single magnetic dipole transmitter was discounted due to field interpretation difficulties. The next phase of experimentation involved evaluating 2-axis and 3-axis device behaviour. The final transmitter unit employs microprocessor-based waveform synthesis with time-division transmission to generate mutually orthogonal fields from a three axis transmitter. Tests have shown that, by using a peak field detection algorithm, detection performance is substantially insensitive to orientation of the transmitter. Field interrogation and mapping tests have been undertaken to determine zonal coverage around typical mobile plant, including fork lift and free-steered articulated vehicles (FSVs), both on the surface and underground. Tests confirmed that a predictable field and consistent detection thresholds could be obtained around the test vehicles. The range of the prototype system, approximately 10 metres, could be extended to 15 metres by making improvements to the signal processing and using a transmitter diversity approach. A simple driver's warning annunciator has been constructed to give 'green', 'yellow', 'amber' and 'red' light alerts corresponding with increasing proximity to the vehicle. Extensions to the current research include consideration of an intrinsically safe version for mining application.
1
SECTION 1.1: INTRODUCTION A number of fatalities and injuries continue to occur where workers are trapped or knocked down by mobile vehicles. The problem exists in a broad spectrum of industries; surface and underground, and is most acute with fork-lift trucks, quarry haulage vehicles and free-steered vehicles underground. Over all industries, vehicles account for 25% of fatal accidents, rising to 60% in quarrying. Incident investigating committees within the United Kingdom and other countries have pointed out the difficulties drivers face in visually checking the periphery of the vehicle. These problems are caused by narrow fields of vision, obstructions caused by loads, arduous physical conditions and poor illumination away from the forward axis of vehicles. Extensive efforts have been made to improve sight lines of vehicles, and in the case of underground vehicles, these efforts have resulted in Her Majesty's Inspectorate of Mines publishing a dedicated topic report; Improving Visibility on Underground Free-Steered Vehicles,1996. Beyond the modification of vehicles to improve ergonomics and the fitment of cameras, there is a need to provide a warning where the driver has failed to notice a worker in the vehicle’s proximity. Such a system must respond both to situations where the machine is approaching the worker at speed, and where the machine is about to start and the worker is already in close proximity to the machine. It was considered that this problem could be addressed by a proximity or location system with a detection range of say from 1 to 15 metres from the machine, providing there was uniform coverage around the machine envelope (accepting that the range sideways on to the machine could probably be reduced). To achieve this coverage without having to fit an extensive array of sensors on the machine was considered technically challenging but feasible. In undertaking the research, a principal difficulty was considered to be what form of proximity detection would function in a variety of environments, in close proximity to the machine and other metallic infrastructure. Quarry and mine environments are harsh, and whatever approach was to be investigated, it needed to offer high reliability, low false alarm rate and preferably failsafe provisions, or, as a minimum, an effective self-test provision. Ideally, in addition, an engineered system would be retrofittable, low cost and intrinsically safe for use in coal mines. Any requirement to equip workers with a safety device dictated that this should be compact, rugged, low cost, ostensibly orientation-independent and resistant to removal from the person under normal circumstances. Such devices should also present negligible hazard in terms of affecting pacemakers or from exposure to any associated electromagnetic radiation, particularly if the device is transmitting continuously and worn throughout a working shift of up to 12 hours per day. Devices and their interrogation electronics would need to have a very low risk of initiation of electro-explosive devices (detonators) and should not cause electromagnetic interference with remote control systems. Direct detection of intrinsic body or workwear attributes, whilst offering simplicity, was from the outset considered unlikely to lead to a proximity detection system of adequate detection sensitivity or integrity. However given the rapid advancement of personnel detection security technologies it was considered appropriate to review advances in this field. A second field considered worthy of investigation was that associated with automotive object detection and collision prevention, this being primarily targeted at preventing front-rear and side-swipe collisions. Detection techniques here include radars, ultrasonic and laser range finders, 2-D and 3-D vision systems and flexible bumpers. The use of cameras in conjunction with wide angle convex mirrors is already widely recognised in the surface minerals industry. Camera systems offer potential improvements but costs of
SECTION 1: INTRODUCTION, PROBLEM DEFINITION, ACCIDENT STATISTICS AND LEGAL DUTIES
2
implementation in the underground environment were assessed to be high. Furthermore, underground vehicles may need to be provided with additional illumination and dual cameras/monitors to cover both the forward direction of the vehicle (to cover for example the transport of supports) and reverse direction. At the time of commencing the study there was also no suitable intrinsically safe certified camera/monitor system. A detection method which was considered feasible was the use of specialised electromagnetic devices. In concept this would require each worker to be equipped with a compact, low-cost electromagnetic safety device. The cost of these devices must be low to justify purchase. Radio frequency identification device, RFID, or ‘tagging’ devices, were considered to offer significant potential, where developments within the retail theft prevention sector are leading to low cost technologies. For this reason, an extensive review of RFID technologies was undertaken, although it was accepted that it was unlikely that a directly suitable system would be identified. Group I intrinsically safe tagging systems are available, manufactured by Davis, but have an inherently short range (<1.5 metres). A novel approach of using very low frequency magnetic dipole location techniques [Nessler and Böhler 1996, Lozak 1975] was considered to offer good technical potential, largely because a range of 20 metres or more is possible and detection is not influenced substantially by surrounding metalwork or strata. Advanced RF/ID and VLF systems were thus selected to be the principal focus of technology investigations. PROGRAMME OBJECTIVES The objectives of the work programme were broadly as follows: 1. To review driver visibility problems in ergonomic system terms across selected industries
which are representative of mobile plant type and uses, covering both surface and underground applications.
2. To determine what methods are available to improve visibility, principally concentrating on retrofit rather than redesign of mobile plant. This was to recap on available assessment methodologies, design approaches and generic technologies including cameras, mirrors, improved illumination and their potential for addressing visibility problems.
3. To ascertain what techniques and technologies were best suited to personnel proximity detection and obstacle-avoidance, and their suitability in harsh environments.
4. To demonstrate the underlying principles of a candidate technique in a representative environment.
SECTION 1.2: ACCIDENT TYPES AND STATISTICS Given the generally small data set of incidents associated with certain high hazard industries, for example the UK mining industry, it was considered appropriate to examine more general industrial statistics and those associated with operating mobile plant in other countries. A review of literature indicated that slow-moving vehicle reversing accidents constitute a major category of incidents, albeit that many are associated with relatively modest financial loss. The operation of forklift and other lift truck vehicles represents a major transport hazard in all countries, with a high level of reported accidents. Specific legislation and guidelines have been introduced in a number of countries to attempt to reduce the level of forklift and reversing vehicle incidents. The US mining industry provides data that powered haulage accidents, both in coal and non-coal mine sectors, represent the most significant category of accident. A summary of incidents from various industry sectors is provided as follows:
3
• Every year in the UK there are about 8000 lift truck accidents resulting in injury, and on average 10 of them are fatal [HSE 2000].
• Over all industries, vehicles account for 25% of fatal accidents in the workplace. This
figure rises to 60% of fatal accidents in the quarrying industry [Pearce 1998]. • In the years 1986 - 96, in the UK construction industry, there were 5,000 incidents
involving being "struck by moving vehicles". Nearly a quarter of all deaths involving vehicles at work occur whilst the vehicle is reversing [Hanson-Abbott 1997, Murray et al, 1998].
• A Parliamentary question on the compulsory introduction of vehicle reversing alarms,
16th November 1990, cited 140 deaths, 603 serious injuries and 1,774 slight injuries, totalling 2,517 accidents had occurred since 1980 involving reversing heavy goods vehicles [Hansard 1990].
• Each year in the United States, nearly 100 workers are killed and an other 20,000 are
seriously injured in forklift-related incidents [BLS 1997, 1998]. In the United States, 1,021 workers died from traumatic injuries suffered in forklift-related incidents from 1980 to 1994 [NIOSH 1999]. These fatalities resulted from the following types of incidents: (Source: US National Traumatic Occupational Fatalities (NTOF) Surveillance System)
Type of % total incident victims Fork lift overturns 22% Worker on foot struck by forklift 20% Victim crushed by forklift 16% Fall from forklift 9%
• Ruff [2000] reviewed mining mobile plant accident statistics in the US as follows. For
the 5-year period between 1994 and 1998, powered haulage accounted for the majority of fatal accidents in metal/nonmetal mines. Mine Safety and Health Administration data (MSHA Fatal Alert Bulletins, July1999) identifies approximately 20% of these fatalities are involved with off-road dump trucks used in surface mining. In 1998, 13 miners were killed in metal/nonmetal and coal mines when they were run over or pinned by mobile equipment. An average of 13 workers per year were also killed in such types of accidents in the previous 3 years. In MSHA’s judgement, half of these accidents could have been avoided if the equipment operator had been adequately warned of an impending collision. Figures for 1995-1998 are given below:
Table 1: US mining industry fatalities involving crushing by mobile equipment
Year Total No. of Fatalities (not include rollovers)
No. of fatalities that could have been avoided using collision warning system.
1998 13 6 1997 9 7 1996 15 8 1995 16 9
• Schiffbauer [1999] has also reviewed the MSHA accident database and underlying
causal or contributory factors. Between the years of 1991 to 1995, 40 people per year
4
were reported either killed or permanently disabled as a result of working near machinery, with 40 or more people per year either killed or permanently disabled as a result of working near powered haulage. There were 4,658 non-fatal days lost as a result of working near machinery and 4,302 days lost as a result of working near powered haulage. This represents 26% of 34,555 days lost in all mines during the period.
• In South Africa, Thompson et al [1998] report over the period 1994-1996 that 4,924
accidents, representing 21% of the total number of accidents, were attributed to transport and tramming activities. Of these activities, 74% of surface mine transport accidents and 56% of underground transport accidents were associated with ore transfer by haul truck, load-haul-dumper and service vehicle operation.
• In Australia, Mark and Verhoef [1999] cite 147 collisions were reported over 10 years in
New South Wales and Queensland open cut coal mining operations. They also consider that many more collisions with stationary plant and other objects have occurred but have not been reported.
SECTION 1.3: THE MAIN LEGAL REQUIREMENTS There is a variety of general legislation and guidance available on reducing risks from operating vehicles, with duties on manufacturers, suppliers, users and pedestrians. In addition to the general legislation there is industry sector specific legislation covering for example the construction industry and quarrying industry (e.g. Quarries Vehicles Regulations, SI 1970/168). General legislation and guidance is summarised here, together with a note of relevant non-EU legislation and standards. The Health and Safety at Work etc Act 1974 requires employers to provide and maintain systems of work which are, so far as is reasonably practicable, safe. The Act also requires employers to take all reasonably practicable precautions to ensure the safety of their workers and members of the public. Whilst there is no set formula to creating a safe system of work, HSE guidance notes, for example 8/94 IND(G)148L address risks from vehicles. The following lists good practice in terms of reducing transport risks and ensuring a safe system of work. The workplace should:
• Remove the need for reversing where possible. • Separate pedestrians from operation of fork-lifts and other vehicles. • Exclude people from areas in which vehicles are permitted to reverse. • Have clearly defined traffic areas and minimise the distance vehicles have to reverse. • Have speed restrictions and signs inside and outside the workplace (implementing
lower speed limits for congested areas). • Use mirrors and visual aids at corners and obscured hazards. • Have adequate lighting. • Use traffic signs/traffic control where appropriate. • Have loading areas isolated from high traffic areas. • Ensure give way rules are enforced where applicable. • Employ flexible or transparent doors where practicable. • Implement vehicle maintenance and reporting procedures. • Ensure parking areas are restricted to authorised people. • Make sure all staff are adequately trained. • Use a permit to work scheme with restrictions on vehicle key access. • Use a properly trained guide and decide how the driver is to maintain contact. • Ensure all visiting drivers are adequately briefed of hazards. • Ensure all vehicle manoeuvres are properly supervised.
5
• Increase the area the driver can see by vehicle choice or load modification. • Where load obscures forward vision, drive in reverse (except up ramps). • Fit reversing alarms and other safety devices. • Switch on warning lights when a vehicle is in use. • Identify doorways, passages or pathways where pedestrians or vehicles may
suddenly appear. • Sound warning devices when going through doorways, around blind corners or when
starting to reverse. UK Provision and Use of Work Equipment Regulations 1998 (PUWER’98) These regulations implement the EC Amending Directive to the Use of Work Equipment Directive, and introduced new provisions for the management and use of mobile work equipment. Employers must ensure the work equipment is used only for operations, and under conditions, for which it is suitable. In addition, they must ensure that all operators they employ, both new and existing, are adequately trained and, when necessary, provide for their additional or refresher training. Regulations 25 to 30 deal specifically with risks from mobile work equipment. These include risk of pedestrians being struck, crushed or run-over by self-propelled work equipment or being struck by an object falling from a vehicle. The means of dealing with these risks are given in an Approved Code of Practice. Under the Management of Health and Safety at Work Regulations 1999, where two or more employers share a workplace, even on a temporary basis, they must co-operate with each other to make sure that they both comply with their legal duties. These Regulations also require employers to carry out a risk assessment of the hazards involved and to identify the measures needed to comply with other health and safety legislation. The Lifting Operations and Lifting Equipment Regulations 1998, require employers to ensure that all lifting operations are properly planned by a competent person, appropriately supervised, and carried out in a safe manner. Lifting equipment needs to be suitable for the use it is being put to, properly maintained, marked with its safe working load and periodically thoroughly examined and inspected. The Supply of Machinery (Safety) Regulations 1992 place duties on those who supply machinery and safety components, including manufacturers, importers and others in the supply chain. The Regulations set out the essential health and safety requirements which must be met before machinery, or safety components, may be supplied. The Workplace (Health, Safety and Welfare) Regulations 1992 require the organisation of traffic routes to ensure to ensure that vehicles and pedestrians can move around safely. Council Directive 91/368/EEC of 20 June 1991 amending Directive 89/392/EEC on the approximation of the laws of the Member States relating to machinery has a number of specific requirements pertaining to mobile plant design and safety features, including: 3.2.Work stations 3.2.1.Driving position The driving position must be designed with due regard to ergonomic principles. Visibility from the driving position must be such that the driver can, in complete safety for himself and the exposed persons, operate the machinery and its tools in their intended conditions of use. Where necessary, appropriate devices must be provided to remedy hazards due to inadequate direct vision. 3.6.Indications 3.6.1.Signs and warning Without prejudice to the requirements to be observed for travelling on the public highway, machinery with a ride-on driver must have the following equipment: - An acoustic warning device to alert exposed persons…
6
European Standard EN 474-1: Earth Moving Machinery, states that the design of the operator’s place shall be such that the operator has sufficient visibility in relation to the drive and work area of the machine and that aids should be fitted. (However, current standards do not identify visibility criteria close to the machine). Legislation requires audible safety warning devices not to have unacceptable social disturbance. The Road Vehicles (Constructions & Use) Regulations 1986, Regulations 37 and 99 require that reversing alarms must not be strident and that they should not be used between 11.30pm and 7.00am on restricted roads. Other National Regulations and Standards The following is a representative cross section of other national legislation and standards: Australian Occupational Health and Safety (Plant) Regulations 1995 S.R. No. 81/1995 Australian Standard 2359, Powered Industrial Trucks. US OSHA Regulations (Standards - 29 CFR) Powered Industrial Trucks. - 1910.178, Subpart N: Materials Handling and Storage American Society of Mechanical Engineers American National Standards Institute ASME/ANSI Standard B56.1 Safety Standard for Low Lift and High Lift Trucks Canada Occupational Safety and Health Regulations SOR/86-304; Part XIV - Materials Handling Canadian Standards CSA Standard B335-94 Industrial Lift Truck Operator Training ISO Working Group (TC-127/SC2/WG3) is in the process of drafting a new international standard entitled "Earthmoving Machinery - Hazard Detection, Visual Aids and Warning Systems".
7
SECTION 2.1: IMPROVEMENTS THROUGH ERGONOMICS Detecting the presence of a potential hazard is probably the most common and also the most critical element of any driver’s task in terms of ensuring safety. An objective of this component of the study was to comparatively appraise driver visibility problems in ergonomic system terms across selected industries which are representative of mobile plant type and uses, covering both surface and underground applications. The assessment attempted to identify generic improvements offered by improved ergonomic performance. The work recapped on available assessment methodologies and the potential for generic approaches such as mirrors and improved illumination to address visibility problems.
The vehicle types selected for study were:
• Free steered Vehicles (FSVs) used primarily in the Underground Coal Mining sector.
• Large Haul Trucks typically used for surface mineral extraction and other off-highway uses.
• Counterbalance Forklift Trucks used for warehousing and general materials handling. To identify potential visual limitations and to assess the potential utility of an automated man detection system, the visual working environment and hazard detection criteria for typical examples of the three vehicle types listed above were examined. This was done using the Visual Environment Assessment Methodology described below. This methodology has been used and proven to be of value in past mining health and safety research.
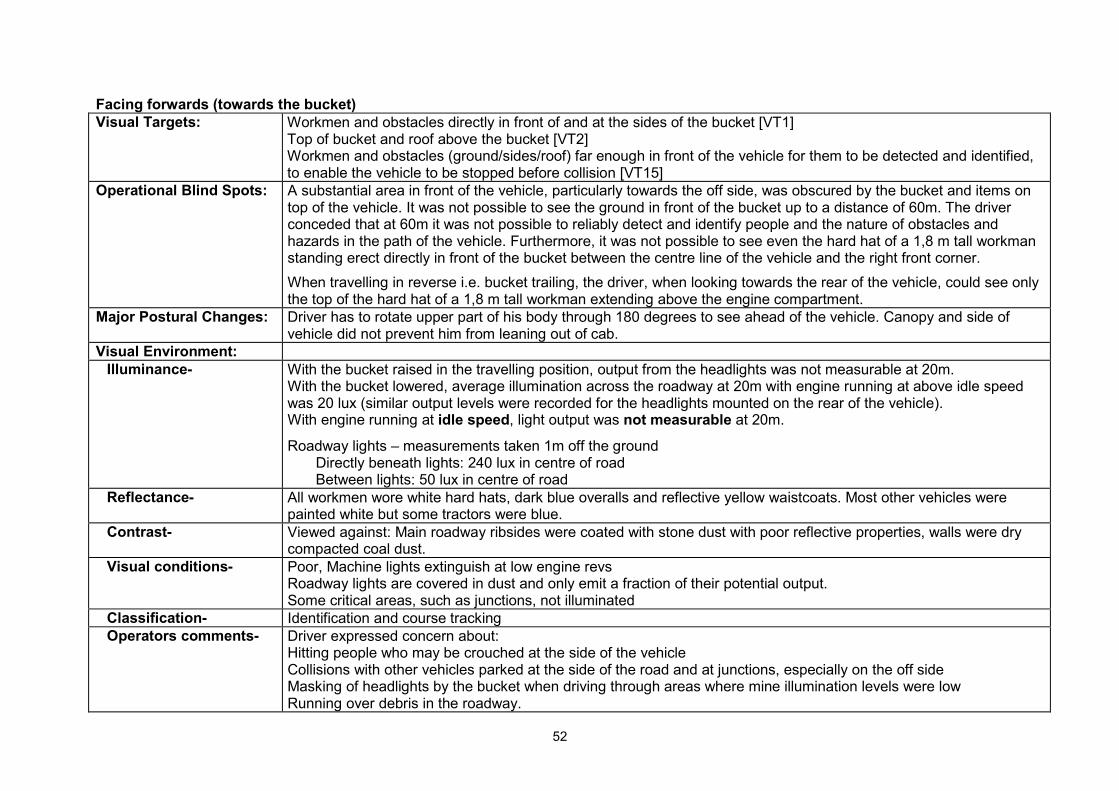
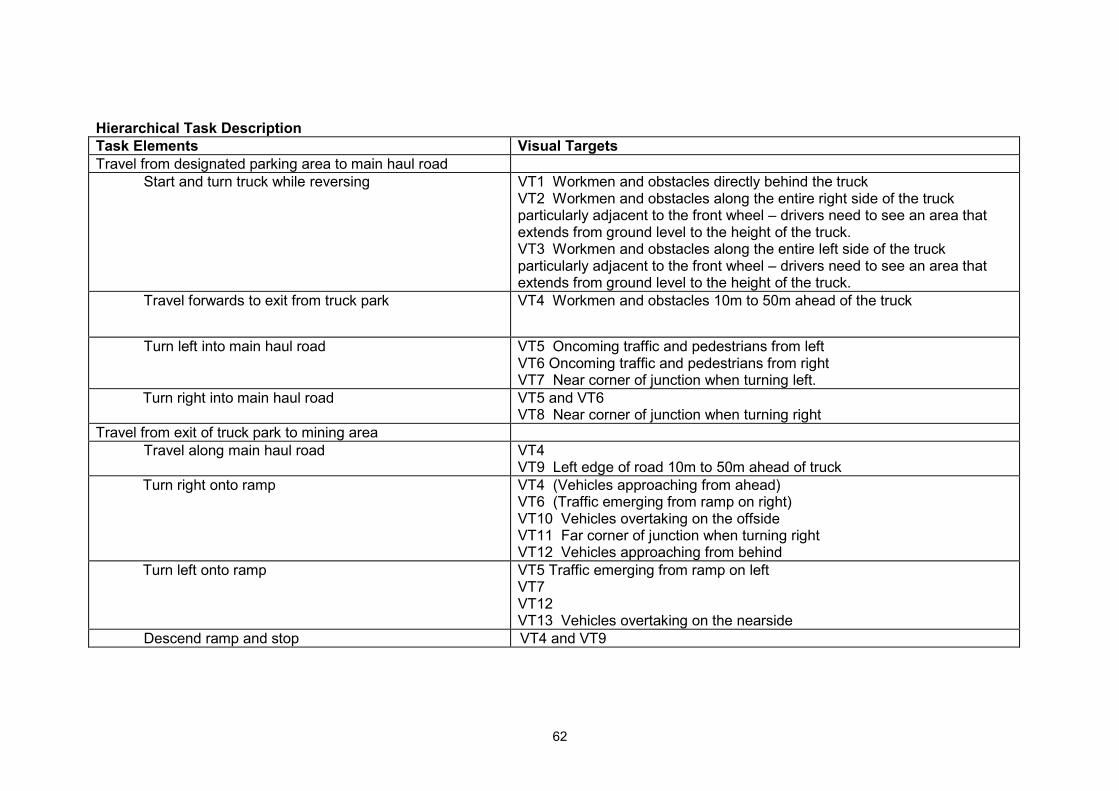
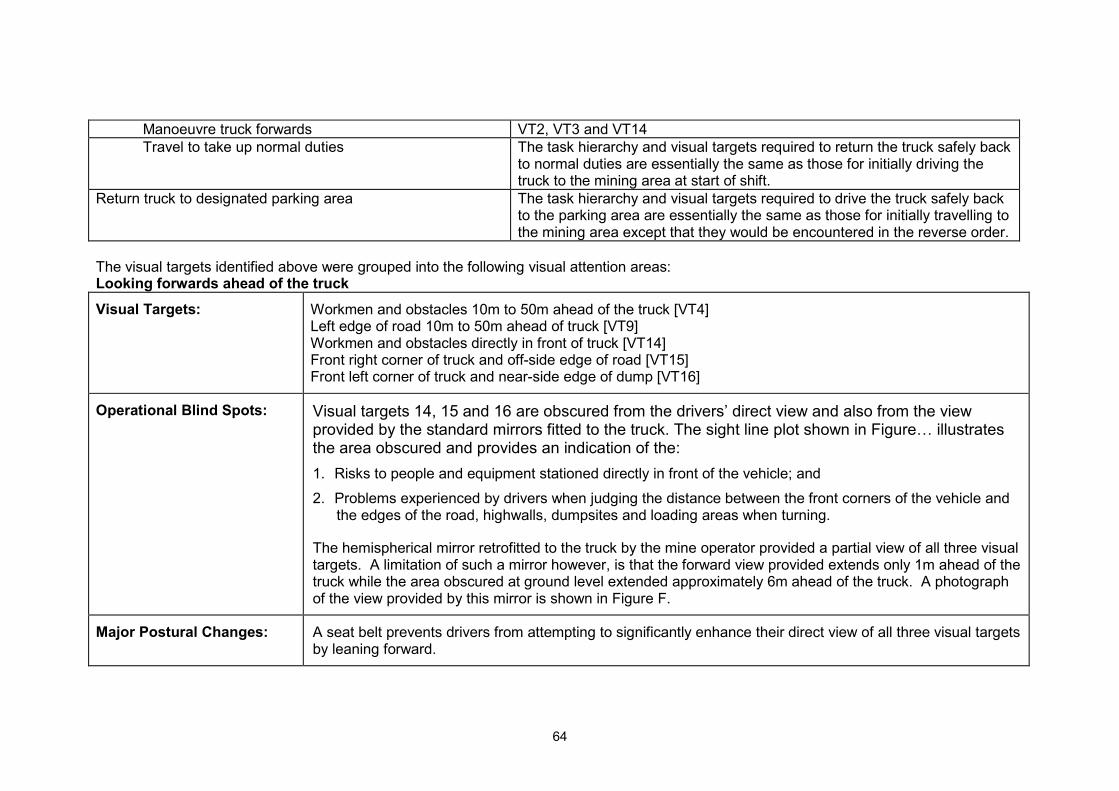
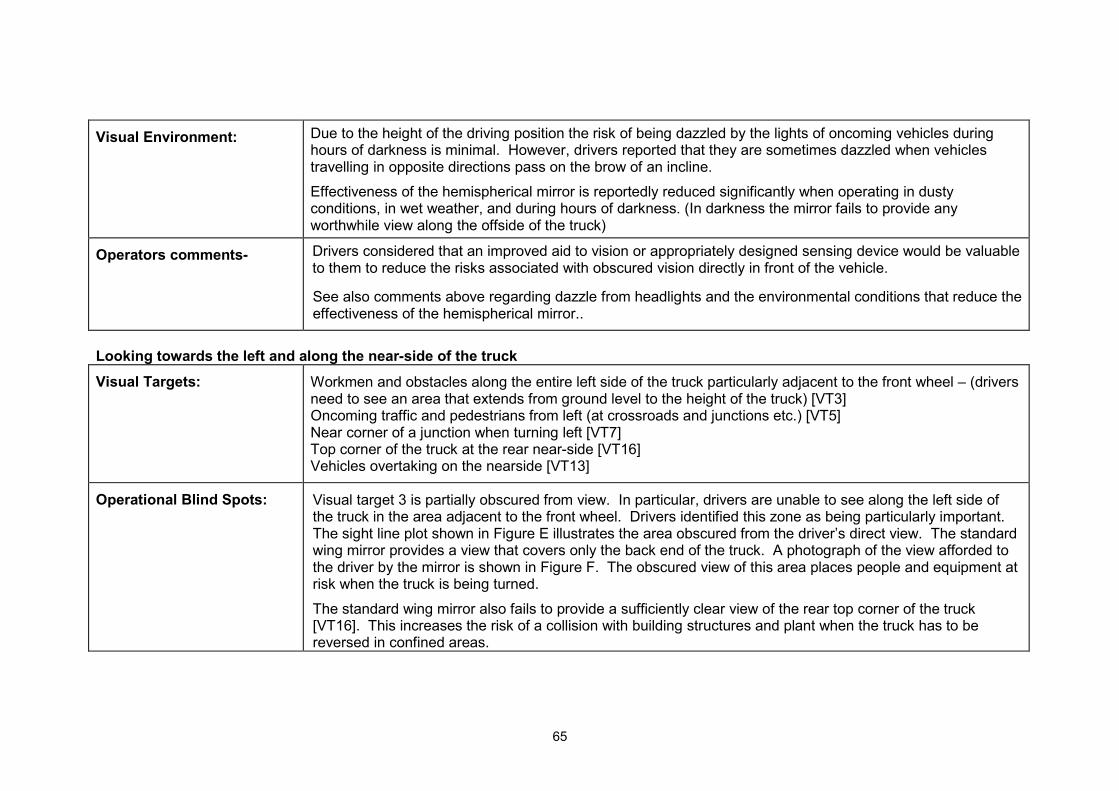
Visual Environment Assessment Methodology A sample of typical vehicle/operator tasks are selected and a Hierarchical Task Description produced. During this process each of the operator’s critical visual targets (what the operator needs to see) are noted. The critical visual targets are then grouped, based primarily on their spatial location, to derive more generalised visual attention areas. For each visual attention area the following factors are then considered and noted: • Operational Blind Spots. Areas where there is no direct line of sight to a particular
visual target are noted. The extent of operational blind spots is shown graphically on a sightline plot/diagram.
• Major Postural Changes. In some situations operators compensate for the difficulties
that arise from sightline restrictions by changing their normal driving posture/position. • Visual Environment. Characteristics of the visual environment are measured, where
practical circumstances permit; otherwise a subjective estimate/description is used. The key characteristics considered are:
��Visual angle: approximate size and distance of the visual targets from the operator. �� Illuminance: This is measured where possible, otherwise a subjective
estimate/description is used.
SECTION 2: IMPROVEMENTS THROUGH ERGONOMICS, REVERSING AND SIGHT LINE AIDS
8
��Reflectance: Reflectance characteristics such as material, colour, conditions (wet/dry, dusty, muddy, clean, etc.)
��Contrast: The background against which the target is viewed. Subjective descriptions are used: ‘high’, ‘medium’ and ‘low’.
��Visual conditions: Notes of glare sources, deep shadows, dust, rain/water sprays, high air velocity, etc.
• Classification of Visual Task. The level of visual information required to reliably conduct a particular task step can vary considerably. To accommodate this variability and provide an indication of the visual information required, visual tasks are classified using the following key words:
��Detection: It is only necessary to see the presence of an object or obstruction. (For
example, to avoid tripping or stumbling hazards, all that may be required is for a pedestrian to detect the presence of an obstacle in the roadway in sufficient time to avoid it).
�� Identification: It is necessary to detect the presence of an object and reliably determine what it is. (For example, a driver may need to detect an obstacle in the path of his machine and then determine what it is, to decide if he should stop, steer round it or ignore it and carry on past it).
��Coarse tracking: Where it is necessary to check the position of an object in relation to some reference point or other object, and determine what corrective control action is required to keep within relatively coarse boundaries. (For example, control of machine cutting heads, driving in confined spaces or around tight corners, etc.)
��Fine tracking: Used where small targets need to be tracked continually, and also for fine manipulative tasks and reading.
• Operators’ comments. During the study periods, the potential for hazards arising from
poor visual environments are noted. These are discussed with the operators who are asked to comment on any additional practical difficulties that may particularly concern them.
Summary of Results The detailed results derived from the Visual Environment Assessment are presented in Appendix 1. In the case of FSVs, an extensive amount of visibility assessment data from other research conducted in the underground coal mining sector was available to the researchers. Hence, this data was used in the derivation of the results. For Haul Trucks and Forklift Trucks, little or no directly usable data was available and hence the results are based on field observation exercises undertaken specifically for the project.
Free Steered Vehicles (FSVs) The problems that arise as a result of the limited visibility available to the drivers of FSVs are widely acknowledged to be an area of particular concern. The driver cabs are typically located centrally to one side of the machine and the driver is seated in a sideways position. Restricted driver visibility makes a significant contribution to the risk of: 1. Collision with people, sides of roadways and other objects or plant in the path of a
vehicle. 2. Collision with pedestrians and maintenance staff attending to the vehicle when moving
off. 3. Collision with workmen, loads and plant when manoeuvring at shaft stations, tips, transfer
points and maintenance workshops.
9
4. Workmen being caught and trapped in the pivot space. 5. Collision with workmen, loads and plant when entering turns. Line of sight provision on FSVs is particularly poor and is associated with a high incidence of accidents. In the acquisition of new machines consideration should be given to the critical visual requirements identified. However, the recommendations below provide suggestions on how sight lines on existing FSVs can potentially be improved: • Provision of adjustable height seats that can also be rotated through an angle of +-15
degrees, to face towards in either direction of travel.
• Modification to the profile of the vehicles by, for example, chamfering the corners of engine covers, lowering mudguards, removing and relocating items from the top of the vehicles that obstruct the driver’s view.
• Modification to canopies to improve the driver’s view of potential overhead obstructions.
• Provision of a closed circuit television system for use when carrying abnormal loads. (A camera connected to a flexible lead that can be hooked on the front of abnormal loads has been found to be particularly beneficial in identifying people and obstacles located on the off (blind) side.)
Where practical design constraints prevent further improvements to visibility, alternative means of controlling the visual related hazards need to be considered, for example, changing working practices, enhancing pedestrian awareness of the presence of vehicles and machines and providing additional safety features on the FSVs, such as emergency stops. Although the recommendations listed above will serve to reduce the risk of collisions with mine personnel, a significant residual risk is likely to remain with this type of vehicle in a typical coal mining environment.
Surface Mine Truck These results demonstrate that there is cause for concern with regard to the restricted field of view afforded to the drivers of large, rear-dump haulage trucks used in surface mining operations. Drivers are unable to see large areas near their vehicles, primarily because the driver's cab is set back under the canopies of the truck bodies for protection from falling rocks and also because of auxiliary equipment mounted on the radiator decks. These blind areas can conceal mine utility vehicles, pickup trucks, cars, people, road hazards, buildings and plant. Reportedly, the visibility problem is growing with the increase in size of haulage trucks. Although the use of additional visual aids such as mirrors and CCTV cameras make a significant contribution towards reducing the risk of personnel being struck by these machines, they are unlikely to provide a fully satisfactory solution. As the number of mirrors and CCTV cameras increases, the potential for drivers to overlook or fail to use all of the visual information sources available to them increases. With such a diverse and disjointed range of views, the tendency is for drivers to check thoroughly only those areas where experience indicates that there is likely to be an obstruction or some working in the area.
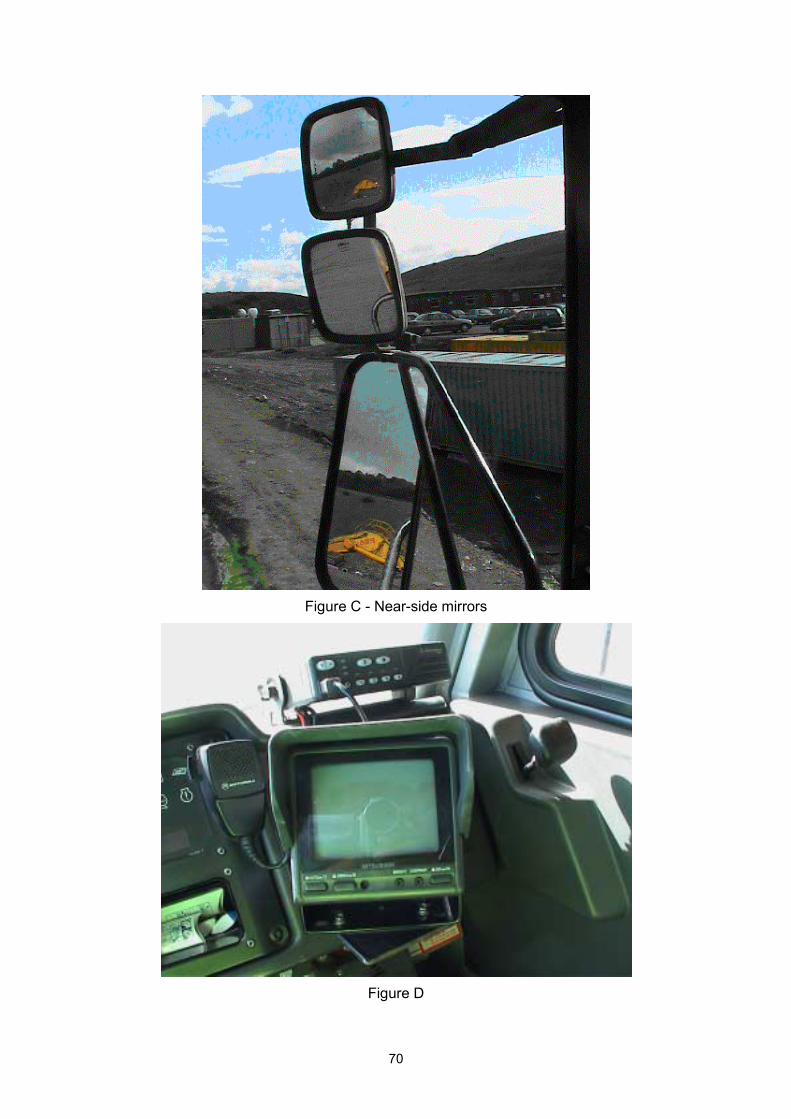
Forklift Trucks Although some restrictions to the vision for forklift truck drivers arise from the masts and protective canopy supports, these alone are less problematic than the visual restrictions identified on FSVs or Surface Mine Trucks. It is likely that relatively minor postural changes can be used to overcome the majority of sight line restrictions posed by forklift vehicles themselves. The most problematic visual restrictions arise from the load being handled.
10
The driver’s direct forward vision is likely to be significantly obscured during the load handling elements of the operational cycle. There are no apparent practical solutions to overcome reliably the visual restrictions imposed by the load being carried. Hence the primary means of control is via the introduction of safe working practices, enhancing pedestrian awareness of the presence of forklifts and, where possible, excluding pedestrians from the working area.
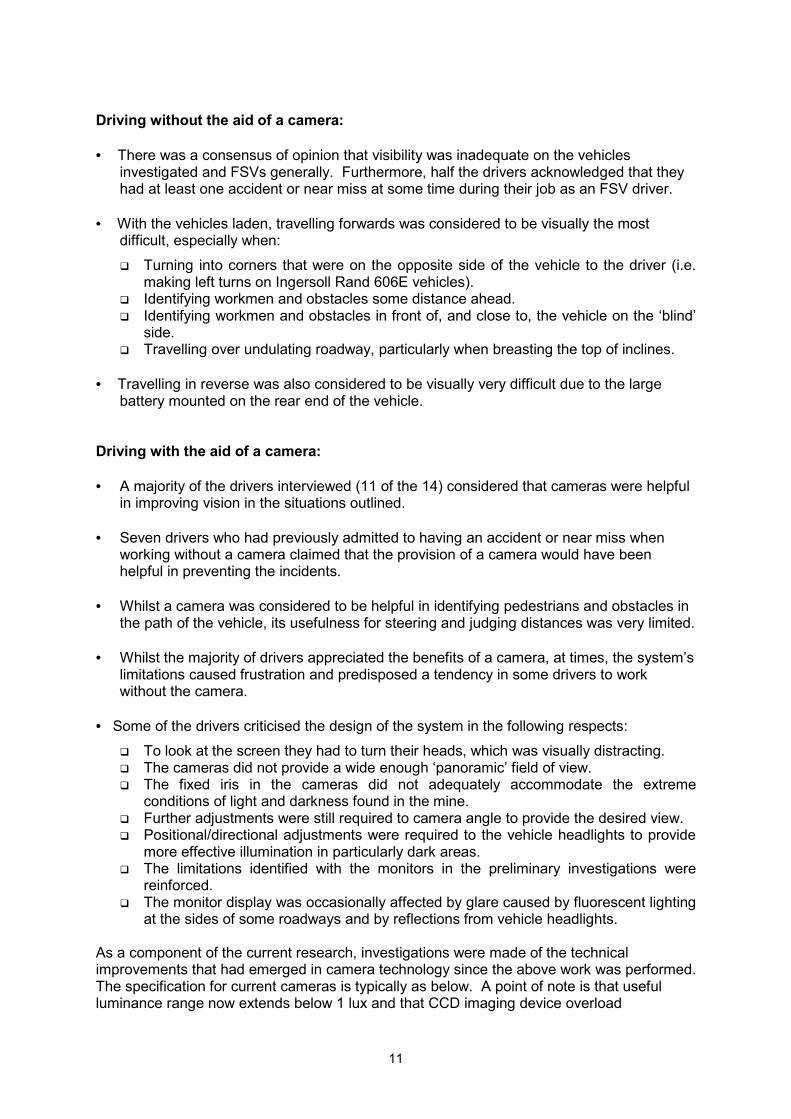
Discussion Visual restrictions were found to be present on the three vehicle types considered and these restrictions all contribute to the risk of the vehicle striking workers. Whilst vehicle modifications, or the addition of supplementary visual aids, can reduce the risk of such occurrences, significant residual risks are likely to remain. Even where visual restrictions are relatively minor, as is typically the case with an unloaded forklift truck, such accidents are still likely to occur. Beyond the problems posed by restricted vision, there are also problems in terms of ensuring and maintaining adequate levels of driver vigilance and awareness. For example, when reversing, having just collected a palletised load, although it is possible for forklift drivers to thoroughly check the area behind them, in practice drivers are often observed not undertaking this check. Having driven into an area a few seconds earlier, drivers are very likely to assume that if there was no one there at that, then there will be no one there now. In essence, improving visibility from a mobile machine is only of value if the driver looks in that direction and sees the pedestrian. The use of an automatic detection system that provides the driver with a distinctive, attention gaining warning that raises his awareness and indicates the need for additional care would materially contribute to mitigating the risk of accidents with pedestrians occurring. SECTION 2.2: REVERSING AND SIGHT LINE AIDS Camera Aids One important means of addressing vehicle visibility problems is to use camera systems, particularly for making checks for pedestrians or vehicles prior to making slow speed manoeuvres. Camera systems are now widely used in surface off-road vehicles and are increasingly being used underground. Lower power consumption is permitting intrinsically safe designs to be considered and wider application in coal mines is thus anticipated. The second component of the vehicle ergonomic assessment, Appendix 1, provides a detailed review of what can actually be seen from camera and convex mirror technologies fitted to a representative LHD used in surface mineral excavation activities. The reader is referred to this material, whilst the following provides a review of earlier studies by British Coal Corporation to assess the utility of cameras in an underground environment, together with a brief review of reversing aid developments. A previous ergonomic assessment of camera use with underground free-steered vehicles indicated that performance limitations in the camera and monitor combination would need to be addressed, and that inconsistent illumination imposed further limits on application [British Coal Corporation, 1994]. The comments on driving with and without cameras raised within that report are summarised below:
11
Driving without the aid of a camera: • There was a consensus of opinion that visibility was inadequate on the vehicles
investigated and FSVs generally. Furthermore, half the drivers acknowledged that they had at least one accident or near miss at some time during their job as an FSV driver.
• With the vehicles laden, travelling forwards was considered to be visually the most
difficult, especially when: �� Turning into corners that were on the opposite side of the vehicle to the driver (i.e.
making left turns on Ingersoll Rand 606E vehicles). �� Identifying workmen and obstacles some distance ahead. �� Identifying workmen and obstacles in front of, and close to, the vehicle on the ‘blind’
side. �� Travelling over undulating roadway, particularly when breasting the top of inclines.
• Travelling in reverse was also considered to be visually very difficult due to the large
battery mounted on the rear end of the vehicle. Driving with the aid of a camera: • A majority of the drivers interviewed (11 of the 14) considered that cameras were helpful
in improving vision in the situations outlined. • Seven drivers who had previously admitted to having an accident or near miss when
working without a camera claimed that the provision of a camera would have been helpful in preventing the incidents.
• Whilst a camera was considered to be helpful in identifying pedestrians and obstacles in
the path of the vehicle, its usefulness for steering and judging distances was very limited. • Whilst the majority of drivers appreciated the benefits of a camera, at times, the system’s
limitations caused frustration and predisposed a tendency in some drivers to work without the camera.
• Some of the drivers criticised the design of the system in the following respects:
�� To look at the screen they had to turn their heads, which was visually distracting. �� The cameras did not provide a wide enough ‘panoramic’ field of view. �� The fixed iris in the cameras did not adequately accommodate the extreme
conditions of light and darkness found in the mine. �� Further adjustments were still required to camera angle to provide the desired view. �� Positional/directional adjustments were required to the vehicle headlights to provide
more effective illumination in particularly dark areas. �� The limitations identified with the monitors in the preliminary investigations were
reinforced. �� The monitor display was occasionally affected by glare caused by fluorescent lighting
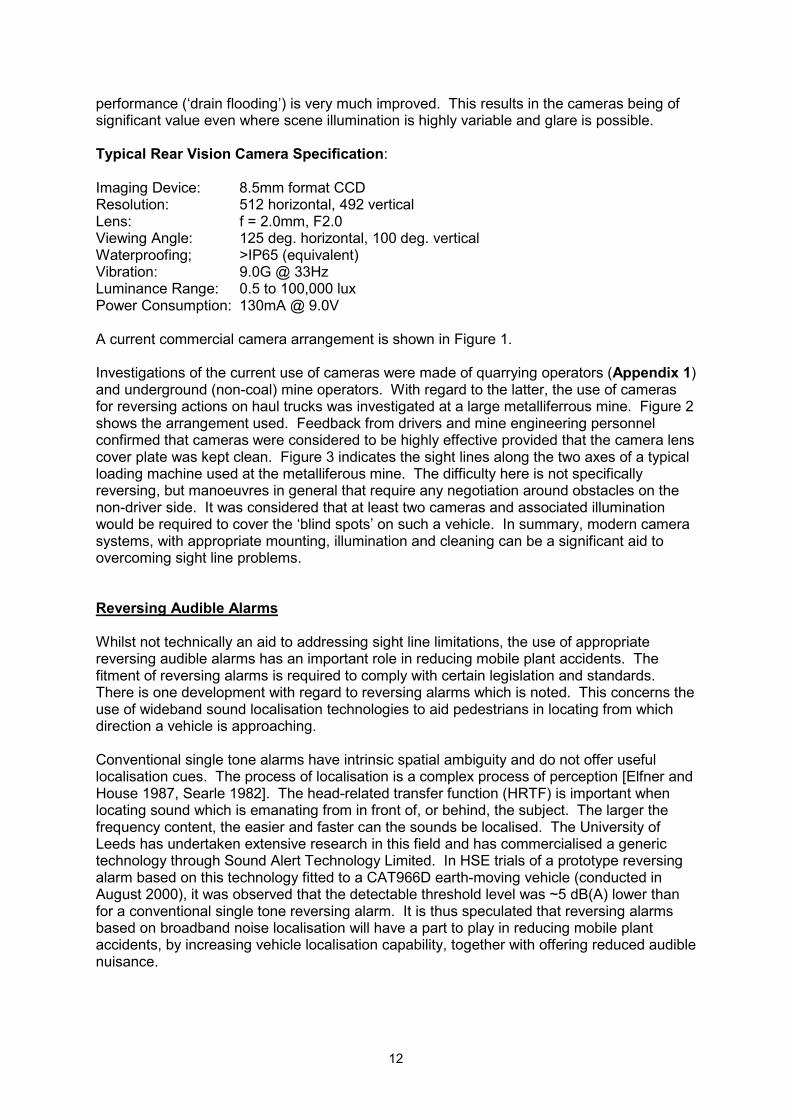
at the sides of some roadways and by reflections from vehicle headlights. As a component of the current research, investigations were made of the technical improvements that had emerged in camera technology since the above work was performed. The specification for current cameras is typically as below. A point of note is that useful luminance range now extends below 1 lux and that CCD imaging device overload
12
performance (‘drain flooding’) is very much improved. This results in the cameras being of significant value even where scene illumination is highly variable and glare is possible. Typical Rear Vision Camera Specification: Imaging Device: 8.5mm format CCD Resolution: 512 horizontal, 492 vertical Lens: f = 2.0mm, F2.0 Viewing Angle: 125 deg. horizontal, 100 deg. vertical Waterproofing; >IP65 (equivalent) Vibration: 9.0G @ 33Hz Luminance Range: 0.5 to 100,000 lux Power Consumption: 130mA @ 9.0V A current commercial camera arrangement is shown in Figure 1. Investigations of the current use of cameras were made of quarrying operators (Appendix 1) and underground (non-coal) mine operators. With regard to the latter, the use of cameras for reversing actions on haul trucks was investigated at a large metalliferrous mine. Figure 2 shows the arrangement used. Feedback from drivers and mine engineering personnel confirmed that cameras were considered to be highly effective provided that the camera lens cover plate was kept clean. Figure 3 indicates the sight lines along the two axes of a typical loading machine used at the metalliferous mine. The difficulty here is not specifically reversing, but manoeuvres in general that require any negotiation around obstacles on the non-driver side. It was considered that at least two cameras and associated illumination would be required to cover the ‘blind spots’ on such a vehicle. In summary, modern camera systems, with appropriate mounting, illumination and cleaning can be a significant aid to overcoming sight line problems. Reversing Audible Alarms Whilst not technically an aid to addressing sight line limitations, the use of appropriate reversing audible alarms has an important role in reducing mobile plant accidents. The fitment of reversing alarms is required to comply with certain legislation and standards. There is one development with regard to reversing alarms which is noted. This concerns the use of wideband sound localisation technologies to aid pedestrians in locating from which direction a vehicle is approaching. Conventional single tone alarms have intrinsic spatial ambiguity and do not offer useful localisation cues. The process of localisation is a complex process of perception [Elfner and House 1987, Searle 1982]. The head-related transfer function (HRTF) is important when locating sound which is emanating from in front of, or behind, the subject. The larger the frequency content, the easier and faster can the sounds be localised. The University of Leeds has undertaken extensive research in this field and has commercialised a generic technology through Sound Alert Technology Limited. In HSE trials of a prototype reversing alarm based on this technology fitted to a CAT966D earth-moving vehicle (conducted in August 2000), it was observed that the detectable threshold level was ~5 dB(A) lower than for a conventional single tone reversing alarm. It is thus speculated that reversing alarms based on broadband noise localisation will have a part to play in reducing mobile plant accidents, by increasing vehicle localisation capability, together with offering reduced audible nuisance.
13
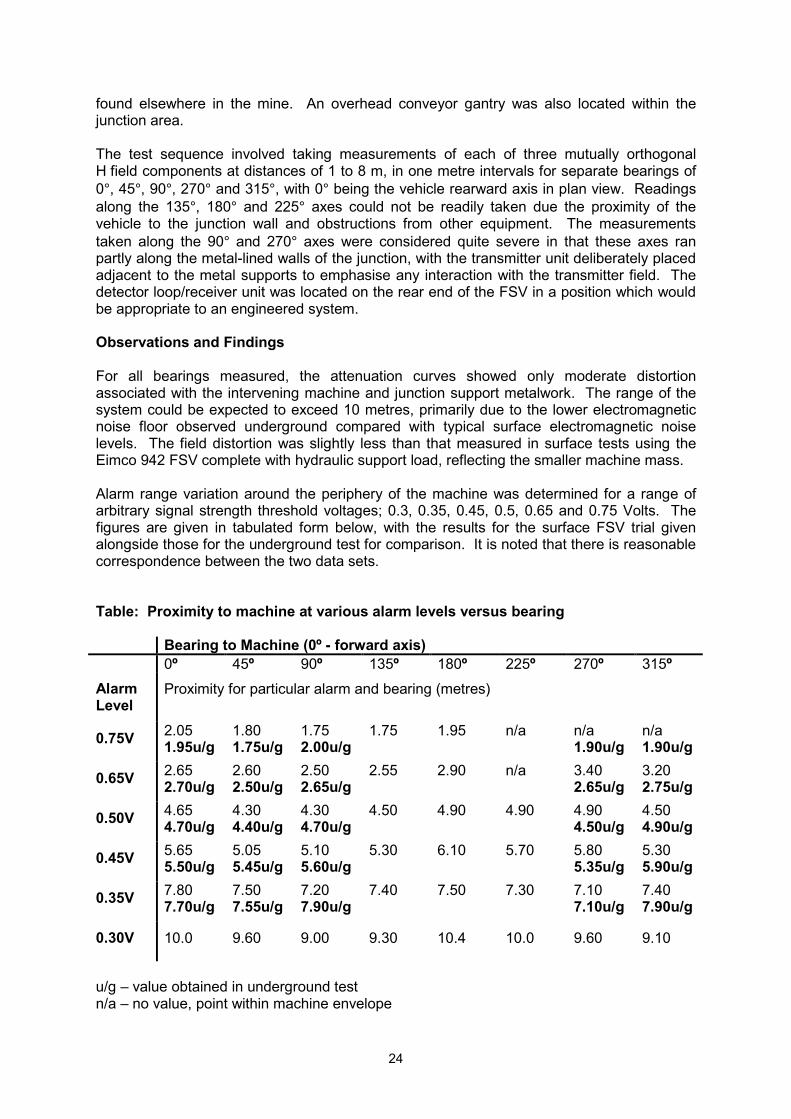
SECTION 3.1: OBJECT DETECTION AND COLLISION AVOIDANCE RESEARCH There has been a significant body of commercial research undertaken to develop systems to reduce the likelihood of automotive vehicle collisions and to detect and respond to pedestrians in the vicinity of vehicles. An understandably smaller volume of research has been undertaken to examine these problems in an industrial setting. This section reviews relevant research findings, both applicable to the highway and off-road sectors. It is noted that the application of collision avoidance research in the automotive sector has been limited more by legal liability reasons rather than on the grounds of technical performance. Jurgen [1998] cites the issue of tort liability in the United States as being as important an issue as cost effectiveness and public acceptance. The potential for US tort litigation is acting as a disincentive for automotive manufacturers to introduce these safety features, with a severe crash resulting in a potential liability of $100 million if crash avoidance features fail [Jurgen 1998]. The application of collision prevention and pedestrian protection systems is arguably less restrictive in the workplace, where most legal duties are based on what is “reasonably practicable”. The following summarises important aspects of this work and associated findings. Automotive Sector Studies Garrott et al [1998] evaluated a number of rear and side object detection systems based on ultrasonic and position/relative velocity radar systems. The researchers also tabulated statistics for the form of encroachment across a large database of incidents and offered comments on the required ergonomics of these detection and warning systems. The technologies tested offered inadequate detection of pedestrians, who were instructed to walk slowly through the detection zone. The percentage of time pedestrians were detected varied between 39% and 92%. A relatively high false alarm rate was also recorded for some systems, together with relatively limited coverage along the side axis of the vehicle. The technologies were judged to offer promise but had unacceptable shortcomings. Figure 4 shows typical side coverage for the systems tested. Hyland [1998] examined design issues pertaining to detection systems for blind spots. The reliability of such systems was not considered acceptable at say 99%, since it was observed that drivers would quickly begin to use the systems as their primary source of blind spot information. This raises similar questions in the case of the technology under development, namely that system dependence and motivation for rule violations may increase unacceptably. In an industrial setting, the introduction of any safety-critical driver aids must be undertaken within a framework of training and communication of the system’s limitations. Mazzae et al [1998] examined the ergonomic requirements pertaining to side impact detection and warning systems. Given that front-rear collisions can be reduced by 60% and 90%, if driver reaction can be advanced by about half a second and one second respectively, [Ulke1998], there is a critical need to ensure that the driver awareness time gained by any collision warning system is not wasted by poor warning and control system ergonomic design. The categories of ergonomic design considered important include:
SECTION 3: OBJECT DETECTION AND COLLISION AVOIDANCE RESEARCH, DIRECT DETECTION OF HUMAN BODY ATTRIBUTES
14
3. Visual warning display comprehensibility 4. Audio warning discrimination and comprehensibility 5. System status display conspicuity and comprehensibility 6. Control ergonomics
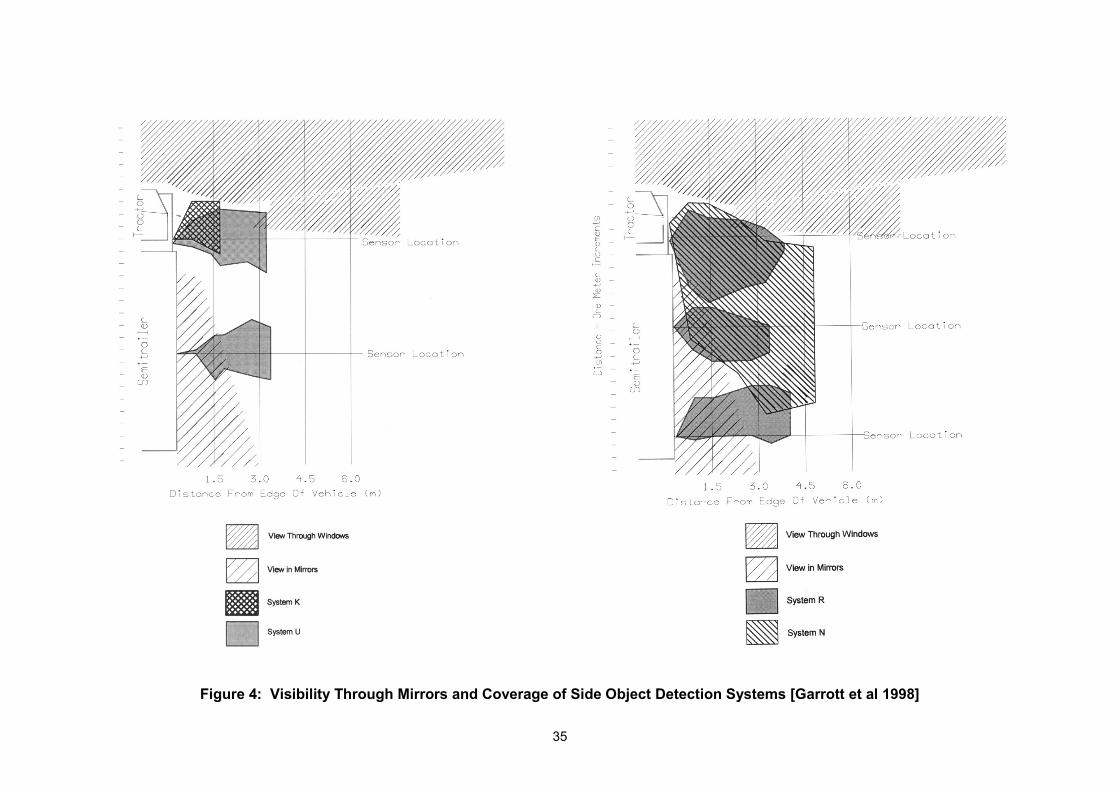
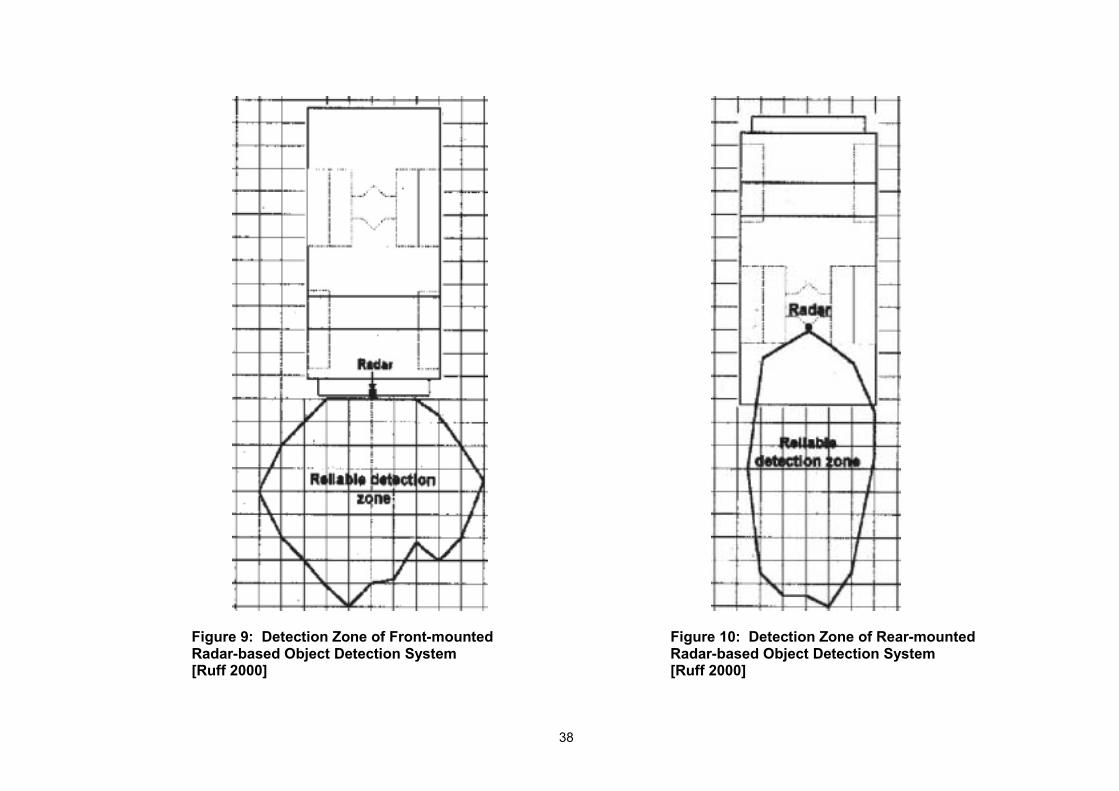
Human factor considerations of cab warning systems have also been examined by Harpster et al [1996] and Huey et al [1997]. Young [1995] reports that in 86% of incidents, no driver crash avoidance manoeuvres were indicated, suggesting driver inattentiveness and potential application for warning systems. In 58% of incidents, closing speeds were less than 5 mph, where "blind-spot" monitors would probably have been useful. Eleven crash avoidance systems were tested, including acoustic, radar and electro-optical based systems. Most systems were observed to be simple proximity detectors (<5 m) with activation latencies of between 40-1900 msec. Accuracy was typically ~ 0.6 m and probability of detection could be as high as 0.99 under nominal detection conditions. Mecheng [1992] reports on the scope to optimise existing mirror and viewing systems by the use of coherent fibre bundles to transmit images from two lens assemblies to a single viewer, the two images then being merged to provide a single, panoramic scene. Recent improvements in camera technology probably render this approach obsolete. Off-Road and Mine Applications Mark and Verhoef [1999] have examined the use of highway Doppler radar collision detection systems but considered their adaptation to mine use to be both costly and subject to technical uncertainty, due to positive identification difficulties associated with the mining environment. They cited RF tags and colour camera systems to be the most appropriate technologies for arduous environments. Hurteau et al [1994] examined a variety of obstacle detection and avoidance approaches for use in mine mineral haulage applications, primarily seeking to increase protection of pedestrians. All direct detection approaches examined had limitations. High frequency RF tags were considered the most reliable means of detection. Arguably the most comprehensive comparative testing of vehicle and personnel detection systems has been undertaken by the US National Institute for Occupational Safety and Health (NIOSH). This work comprises two avenues of research. The testing of various object detection systems is reported by Ruff [2000]. This work involved mounting detector units on the rear or front of a test vehicle, a 50 ton capacity dump truck, in a surface mine environment and plotting the detection zone around the vehicle for both pedestrian and small vehicle targets. The second area of NIOSH research is that undertaken by Schiffbauer [1999], which concerns the development and testing of a safety device specifically designed for remote control operators and other personnel in the vicinity of continuous miners. Given the relevance of these areas of work, further discussion is provided here. The test programme undertaken by Ruff involved testing four systems which employed radar based detection, three which used active RF tag technologies, and one system which used passive UHF tag technology. The test vehicle and test environment can be gauged from Figures 5 to 8. Whilst the test conditions were reasonably representative of surface mine environments, an underground mine test environment would be more severe. In particular, it would be expected that radar and UHF based tag technologies would produce more variable test results. The low frequency RF tag technologies tested would however be expected to have less susceptibility to the influence from local metallic infrastructure and strata
15
underground. Ruff’s test results indicated that the radar systems provided a relatively narrow angular coverage, either at the front of the vehicle or at the rear of the vehicle, Figures 9 and 10. The azimuth setting of the radar detector also influenced the detection zone, towards or away from the vehicle, Figure 11. It is concluded that a number of radar units would be required to cover all blind spots on a vehicle and that operation underground could be unreliable due to target clutter problems. The two systems tested by Ruff employing low frequency RF tag technologies each offered good circumferential coverage of the machine and satisfactory range. Each was primarily intended to increase the safety of mining machine remote-control operators and pedestrian personnel. Development continues on both systems and there are significant parallels with the IMC approach to detection. The two systems are as follows:
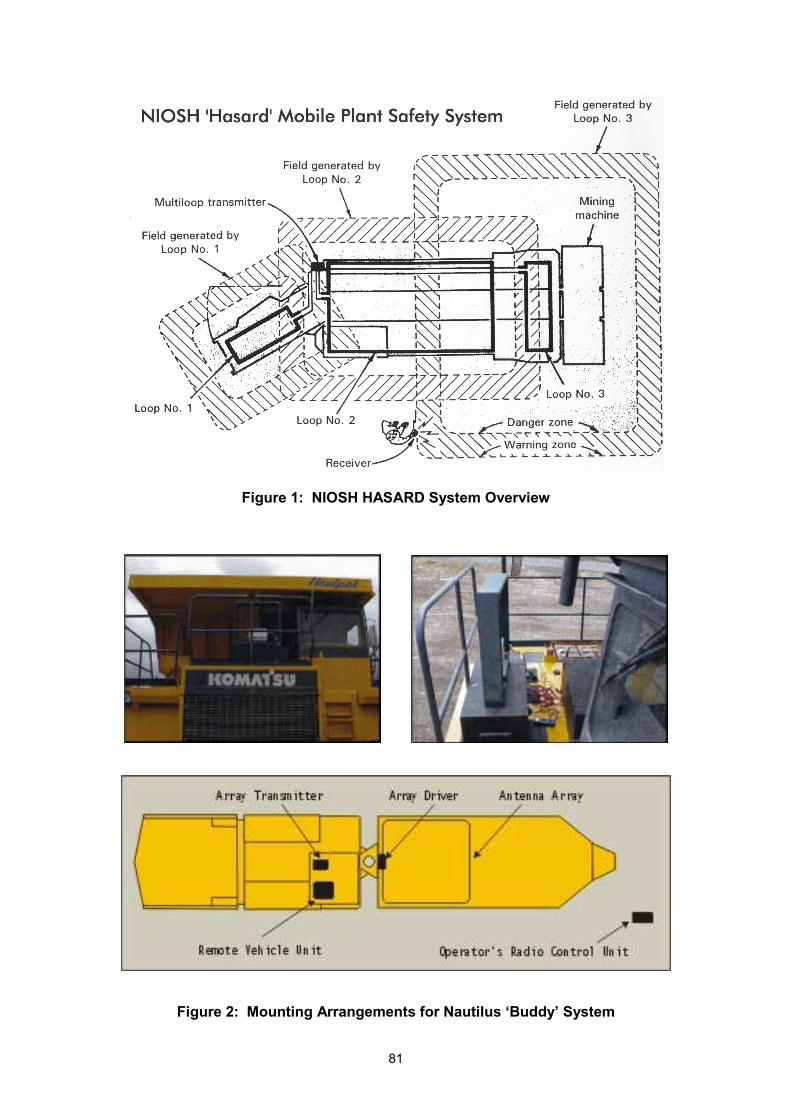
1. Nautilus ‘Buddy’ system (Nautilus International Control and Engineering Ltd., Burnaby, BC, Canada)
2. NIOSH ‘Hasard’ system (National Institute for Occupational Safety and Health, Pittsburgh)
The detection methods used in both systems are discussed further and contrasted with IMC’s approach in a subsequent section. The Nautilus system offered almost uniform coverage around the mining machine as noted in Figure 12. At the time of Ruff’s test programme the Hasard system personal detector unit was not available and the tests were confined to a vehicle detection test. This test indicated that good coverage could be obtained from the NIOSH system, Figure 13. A further description of these two systems is given in Appendix 2.
SECTION 3.2: DIRECT DETECTION OF HUMAN BODY ATTRIBUTES The human form, if not excessively clothed or buried, has a variety of features which may be discriminated from the background. A number of these are exploited in security applications for presence sensing and area surveillance. The large associated security product market is driving technological development. Whilst no directly suitable products could be identified it is anticipated that the performance of low cost presence-sensing devices will continue to improve. The suitability of the various sensor principles to the pedestrian detection problem is briefly reviewed here. Infrared Thermometry/Imaging
Human body temperature is nominally 36.5°C. The black body emission curve from an object at this temperature broadly peaks at 10µm. Where atmospheric absorption is significant (ie for long path lengths), working in windows at either 3 - 5µm or 8 - 14µm is normally required. A variety of surveillance sensors are available to differentiate the body object emission against background thermal radiation. The simplest employ pyroelectric devices which can resolve to circa 100mK. However, these devices generally have relatively slow response time, are noise limited and susceptible to spurious thermal signatures. Infrared band pass transmission filters help in this respect. Thermal imaging systems generally employ an uncooled ferroelectric detector of low resolution (320x240 pixels). The uncooled infrared response is broadly between 7 and 14 µm. Whilst thermal imaging can unambiguously detect a body heat signature against a cooler background, such a system would not be appropriate because of interference from other heat sources present, e.g. engine compartments.
16
Pyroelectric Sensors
Pyroelectric detection involves the conversion of photons to heat. Usually the sensitivity of the static polarization of a piezoelectric element is exploited in practical devices. Response of detectors is quite flat over a broad spectral band and the thermal time constant can be of the order of milliseconds. However, use as a thermal detector generally dictates low signal processing bandwidths (0.3 -3Hz) and sensitivity is inherently several orders of magnitude below quantum detectors. The sensor elements are sensitive to radiation over a wide range, so a filter window is added to limit incoming radiation to the 8 to 10 micron range which is most sensitive to human body radiation. Typical sensors contains two active elements configured as balanced differential series opposed type. This compensates for environmental temperature variation whilst offering reasonable sensitivity for small changes of a spatial temperature pattern. There are a number of means to improve detector sensitivity limitations. One method is to employ a multifacet mirror or Fresnel (flat plano convex) lens array to provide optical gain and define the field of view. However, where the target is largely obscured, or is some distance away, then an adequate detection sensitivity/false alarm rate compromise would not be achievable. Colour Specificity Employee workwear often has a specific colour, e.g. a fluorescent colour and high reflectivity which could lend itself as a method of detection. Illumination with a narrow-band light source matched to the colour would produce high reflected flux, readily discernable against the background. The above concept would be limited by target visibility and is predicated on the assumption that regular workwear was being worn. Proximity Transducers This is a generic term given to a variety of sensing techniques. Transducers used by current proximity sensors vary in sophistication and the various transduction media used for proximity-sensing include sound waves, magnetic fields, electric fields, and light (employing electro-optics) [Volpe and Ivlev 1994]. Conventionally, electro-optical proximity sensors have utilized one of two methods of operation, involving: the triangulation principle, or light intensity modulation principles (amplitude-modulation or phase-modulation). Triangulation schemes are usually more robust [Lee and Hahn 1991]. Sensor Data Fusion Passive infrared sensors used for intrusion detection, especially those used on mobile robots, are vulnerable to false alarms caused by clutter objects. To overcome these sources of false alarms, researchers have combined thermal and ultrasonic signals, the results being a more robust system for detecting personnel. Fusion strategies used for combining sensor information include statistical classifiers, using features such as received thermal energy, and ultrasonic range and neural classifiers trained by backpropagation [Carroll et al 1992]. These techniques are primarily used in military personnel detection applications. Advanced Pattern Recognition Techniques Pattern recognition is the extraction of consistent information from noisy spatiotemporal data. It can be, and is currently being, used in systems for automatic detection of land mines and unexploded ordnance, and anti-counterfeiting [NATO 1998]. The methods employed can be subdivided into: (1) statistical methods, (2) neuro-methods, (3) fuzzy-methods, and (4) neuro-fuzzy methods. Each of these methods has its special advantages and drawbacks, but all of them require the computation of feature variables from measurement or simulation data, e.g., from microwave backscattering. Research systems have been demonstrated
17
using fusion of images from multiple sensors to reduce the effects of clutter and improve the ability to detect surface and buried land mines [Lawrence Livermore 1995]. The complexity and cost of these systems makes them largely of academic interest. The question of direct discrimination of the body’s heat when clothed has also been addressed. Discrimination of infrared images in the 3 to 5 and 8 to 12 micron band has been accomplished using Fuzzy Logic detection algorithms [Meitzler 1998]. Kalman filtering is also used to enhance the ability to perform proximity-sensing. Some video-based commercial object position and attitude determination systems simultaneously track an object's linear and angular movement in all six degrees of freedom. Essentially, the Kalman filter is used for application that measures resolvable angle data from known targets to estimate relative position and attitude. Again, these approaches are of academic interest. Covert surveillance and personnel detection are of interest to civilian law enforcement applications. Microwave sensors are under development that can detect the presence of persons behind walls or other barriers and track moving persons. These detection techniques depend on recent advances in microwave and millimetre-wave (MMW) technologies. Sensors are under development which can provide pseudo-images of persons behind walls using active 95 GHz real aperture radars [Ferris 1998]. These systems are again of academic interest in the current application context. Simpler versions operating at 1.95 or 6.5GHz have however been developed by Roke Manor Research Centre in the UK for surveillance purposes, which are claimed to have a wall-penetrating capability. The operating principle of the sensor is based on ultrawideband impulse radar. A very short electromagnetic impulse is propagated from the sensor, and only echoes that reflect from a defined range are detected. By using phase-coding and a statistical detector, this type of system is claimed to be relatively insensitive in the presence of interference. The Doppler shift principle can be used to realize low cost movement sensing arrangements. Using this principle, omni-directional movement detection with a radius of around 6-10m can in principal be achieved. For a system operating at 1.2GHz the range of beat frequency for human movement would typically be in the range 5 - 50 Hz. There has been significant work to extract features from the time-varying Doppler signal, including the inputting of data to pattern recognition neural networks [Noel 1998]. The use of ultrasonics for gauging and proximity sensing is recognised for modest ranges (typically few metres). Since strong attenuation due to absorption in air limits usable frequencies to less than about 1 MHz, ultrasonic methods are inherently less accurate than optical methods. In this particular application this is not an issue. Ultrasonic systems are generally cheaper and more durable than equivalent optical systems but again suffer from having a relatively directional field of coverage. Hickling and Marin [1998] have examined the effect of air currents, surface temperature, and background noise on performance. The claims and dependence placed on proximity detecting technologies, particularly in safety critical applications has to be carefully assessed. By example, the US Occupational Safety and Health Administration had to issue a hazard warning after a number of industrial accidents were observed due to proximity device maloperation. A recommendation was made that radiofrequency presence sensing devices should not be used as the primary safeguard, or only safeguard, for workers exposed to serious hazards (e.g. to provide a machine guarding function). Short range capacitance proximity sensing devices were noted to be of specific concern.
18
SECTION 4.1: RFID ‘TAG’ SYSTEMS AND DEVELOPMENT PROCESS
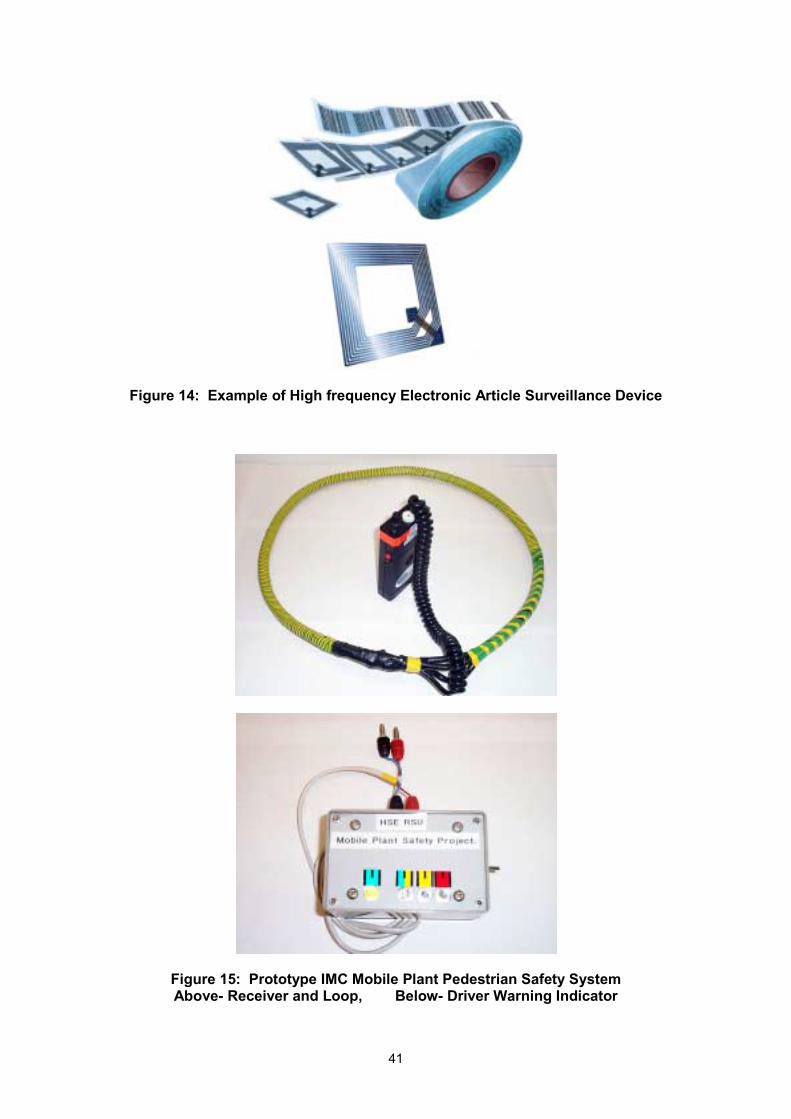
An extensive review of the theory and practice concerned with RFID (Radio Frequency Identification Devices, otherwise known as ‘Tags’ or Transponders) was undertaken. This is summarised in Appendix 5. One particular research objective was to try and determine whether recent advances in low cost passive EAS (Electronic Article Surveillance) technologies would permit a low-cost personnel detection system to be developed using generic security or retail theft prevention technologies. This sector represents a significant sector in the overall RFID market and large resources are being directed at developing sophisticated long range, low power interrogation systems to detect relatively simple passive transponders, such as those of Figure 14. It was conjectured that there was a possibility of using a multiplicity of low cost passive transponder devices carried on the person, possibly sewn into the workwear itself. However, after appraisal of a number of commercial systems and interrogation techniques, it was concluded that such a system would not provide the required range without using excessively high powers in the interrogation fields. There would also be a likely requirement for at least 3-4 sensing modules on a machine to provide appropriate coverage. In addition to this, single targets could probably be discriminated with a high probability but detection of multiple targets (tags) could result in a complex signal processing/detection problem. In conclusion, no directly suitable passive RFID technologies could be found. This position generally confirms that an active transmitter-transponder approach is the most technically feasible. There are a number of technical and operational issues to consider here, including:
• Machine based equipment; envelope size, aerial(s) and siting • Size, number of tags, operational life • Range and intervening material penetration properties • Performance near metallic structures/radio reflective environments • Susceptibility to interference, conducted and radiated • Orientational sensitivity, null zones • Geometry, predictability and confinement of reading zone • Response time • False alarm rate - detection probability trade off • Multiple tag interaction and multiple read capability • Fail-safe or self-test check provisions, data validation capability • EMC generated, radio frequency approvals compliance • Wearer electromagnetic radiation exposure levels • Compliance with electro-explosive device induction current limits • Intrinsic safety requirements (coal mines) The regulations covering a practical RFID system concern inter alia; radio frequency approvals, EMC compliance and electromagnetic field exposure limits, together with various Type Approval requirements. In addition, there is a need to define engineering detail for the application and importantly, the logistics and warning-control actions initiated from the personnel detection information, for example decisions concerning the issuing of warnings to the pedestrian or driver, or the immobilisation of the machine in high risk situations. It is noted that factors concerned with the use of the personnel detection information have provided arguably the greatest difficulty for researchers working in this field. Consideration was given to the working of a safety device and the need to jointly alert the driver and
SECTION 4: RFID ‘TAG’ SYSTEMS, DEVELOPMENT PROCESS, IMC PERSONAL SAFETY SYSTEM AND TRIALS
19
pedestrians, or whether the driver alone should be provided with the primary warning. After examination of various hazards and the interaction of drivers with pedestrians it was concluded that the system should primarily provide an alert to the driver. The provision of an alert to pedestrians within the worker safety device is technically feasible but would involve additional engineering and cost. SECTION 4.2: IMC PERSONAL SAFETY SYSTEM AND TRIALS The IMC programme of research work specifically involved investigation of very low frequency magnetic dipole location and field gradient detection techniques as the basis of an active personal safety system. However, the implementation within a practical system could take several forms, from having a person worn-active transmitter, to detecting the field emanating from a source on the machine. The research considered the principal permutations, undertaking a variety of proof-of-concept tests to determine the limitations of the candidate approaches. In parallel with these activities, an ongoing review was undertaken of research being conducted elsewhere to develop worker safety systems, principally involving research within the United States. Comparable research was identified within the research programme of the US National Institute for Occupational Safety and Health (NIOSH). A system has also been recently developed in Canada. Both systems are intended to reduce the risks posed to inappropriately positioned continuous miner or LHD remote-control operators. Due to commercial confidentiality constraints, and the fact that NIOSH was seeking to protect their work by patents, it was possible only to gain outline technical details during the research period. This has been added to subsequently. The following provides a brief review of the NIOSH approach and then the approach progressed by IMC. As background material, an overview of electromagnetic propagation at very low frequencies is given in Appendix 3. The NIOSH personnel detection process involves equipping each worker with a small transmitter (transponder) unit. The mobile plant has a loop aerial or loop aerials wound around the periphery of the plant itself, thus accommodating articulated mobile plant designs. The loop aerials on the plant are continuously energised with an interrogation field of 30-60 kilohertz, providing a magnetic field geometry which is only moderately influenced by the metallic construction of the plant or the surrounding infrastructure. The receiver unit of the wearer’s personal protection unit responds to the interrogation signal and provides a high frequency return confirmation signal when the interrogation signal exceeds a pre-defined level or amplitude. The immediate difficulty of this approach is that the response to field amplitude in a simple single axis transponder is highly influenced by the orientation of the wearer/transponder. In unfavourable orientations (for example where the wearer is prone), a single axis solenoidal receiver exhibits nulls in its response. In practical terms, this renders a single axis system unusable since the detection sensitivity varies excessively with device orientation and machine position. NIOSH’s response involved adopting a multi-axis transponder receiver section, with three orthogonal axes being sensed. This approach substantially reduced device orientational sensitivity but required a significant increase in pedestrian unit complexity to incorporate six miniature sensing coils and associated field measurement electronics. Nevertheless, the resulting prototype NIOSH system is largely orientation independent and can be set up to provide a range of around 30 metres maximum. The IMC research and design philosophy represents an inversion of this topology, where the sophistication of the system is moved to the machine, keeping the pedestrian unit as simple as possible. Initial consideration was given to the feasibility of using a simple single magnetic dipole (solenoidal coil) transmitter in the wearer’s unit and providing a complex three dimensional field interrogation capability on the machine. The machine detector in this
20
case needed to be equipped with a triaxial sensing capability, although this would not necessarily entail having to use large peripheral field sensing loops. This approach was considered to offer a relatively low-cost pedestrian unit, improving prospects for the take-up of the system. The safety device development work concentrated on designing a low-frequency, inductively coupled transmitter device which has relative insensitivity to the orientation of the wearer. The initial research avenue of using a single magnetic dipole transmitter was discounted due to field interpretation difficulties. For an unambiguous localisation of the dipole it would be necessary to analyse the primary field vectors at several separate points [Nessler and Böhler 1996]. In real time this would be technically challenging and, further, it was not clear as to whether nulls in the dipole response could be catered for adequately. The next phase of experimentation involved evaluating 2-axis and 3-axis device behaviour, using mutually orthogonal magnetic dipoles sequentially driven in a time division multiplexed manner. The 2-axis device was initially favoured since it was possible to design a very compact, flat profile device where two high permeability ferrite cores could be driven to produce an acceptable magnetic moment. Laboratory measurements indicated that a practical 2-axis device offered significant improvements in orientational sensitivity compared with a single magnetic dipole. Variants using coils woven into the fabric of a high-visibility vest and the inside of a conventional hard hat were also considered. The final variant involved a 3-axis device, where a flat planar coil was used to provide the third axis response (a flat profile coil was used to minimise the physical depth of the prototype). Experimentation confirmed that this configuration exhibited consistently the lowest variation in the received signal strength with orientation, based on peak measurement of the strongest of the three signal components. The experimental results showed some imbalance between the flat profile and ferrite solenoidal derived fields of the transmitter However this was not considered significant since the field imbalance could be reduced or eliminated by tighter design limits. The prototype worker safety device comprised three miniature, mutually orthogonal drive coils, with each separately driven from a microprocessor-based signal synthesis unit. The microprocessor permitted a wide variety of frequencies to be generated together with various drive waveforms. This also permitted the transmitted frequencies to be swept or dynamically switched, which could be used as a means to increase electromagnetic compatibility and reduce the impact of dominant frequency external noise sources. In principle, frequency agile spread spectrum techniques could also be employed but were not investigated due to issues of complexity and cost. The prototype personal transmitter unit electronics would also need to be repackaged into a smaller envelope for practical application. The prototype safety device had a relatively high power consumption, primarily because it was configured to transmit continuously in order to simply measurement procedures. In practice the power consumption could be greatly reduced by diversity techniques (i.e. pulsing the transmitter) whilst still retaining an acceptable response time. In normal industrial use it would be expected that a fully engineered unit would be recharged on a daily basis along with other essential safety equipment. The field interrogation device, mounted on the mobile plant, employs a highly sensitive receiver which uses a single sensing axis coil. The position of the sensing coil did not appear to be critical or unduly influenced by adjacent metal work. The prototype detection system did not include interface relay contacts, which could be added if required. A simple ‘green’, ‘yellow’, ‘amber’ and ‘red’ light driver’s warning annunciator unit was constructed to give alerts corresponding with increasing proximity to the vehicle. The prototype is shown in Figures 15 and 16. The outputs from the receiver unit comprised a demodulated audio output and an averaged logarithmic law received signal strength meter output for measurement purposes. The demodulated audio output with its rising pitch in response to
21
increasing proximity provided a useful audible indication of pedestrian proximity. As noted, the portable transmitter unit employs three mutually orthogonal coils to transmit a field in a time division multiplexed fashion. In any practical commercial system this device would be miniaturised and worn by persons working in high risk areas. The prototype transmitter unit is, in theory, capable of inducing electrical currents into an electro-explosive device (EED) if it were to be brought into close proximity to the transmitter. For the purposes of a trial it was a condition that no EED devices were allowed in the vicinity of the test apparatus. This aspect of the design would need to be examined further for any system intended for mining application. The possibility of a failure mode under a two fault analysis, involving two or more of the orthogonal personal transmitter coils transmitting together, would have to be assessed. Under worst case test conditions HSE Guidelines require no more than 60mA to be available in the EED circuit, representing a safety factor of five. A further issue researched was the safety of an active electromagnetic device in terms of electromagnetic field exposure, particularly since the wearer may carry an active transmitter device for 8-12 hours per day. A rigorous assessment of occupational health issues was considered beyond the scope of the research programme. However, a discussion on the subject is given in Appendix 4. Trials of the IMC Personal Safety System Trials of the prototype (proof-of-concept) system were undertaken in a warehouse, colliery surface and underground situations. The objective of the tests was specifically to gauge the range, coverage and variation in observed arbitrary alarm detection points around representative plant items. More extensive wearer trials would have been useful but would have required a mechanical redesign and repackaging of the prototype equipment to commercial equipment standards. This would be a substantial undertaking. Summary of Daw Mill Colliery Surface Tests Test Methodology RJB Mining (UK) Ltd. kindly made available an Eimco 942 free-steered vehicle complete with a heavy duty face support load. The vehicle was positioned in the colliery's stockyard, with various supplies and machine components located along one side of the vehicle. The other side of the vehicle was free to a distance of 15 metres of more. Figure 17 shows the vehicle in the test setting. This arrangement permitted the influence of any non-machine metallic infrastructure to be taken into account (observable as asymmetry in the detected field about the machine's longitudinal axis). To further make the test as representative as possible, the machine's engine was left running with normal services active throughout the tests. It is specifically noted that the Eimco 942 was not selected on the basis of its ergonomics, but rather on account of the physical size and mass of the machine. The Eimco 942 free-steered vehicle, complete with 32 tonne Joy face support, had an overall length of ~12.5 m and width of ~3.5 m, shown in plan view in Figure 18. The vehicle-load combination represented the largest mobile plant gross weight likely to be encountered in underground UK coal mines. As such, the metallic infrastructure effects associated with the machine were anticipated to be more significant than for smaller plant.
22
An initial reconnaissance of the machine was undertaken to identify suitable location(s) for the apparatus receiver unit. The loop was located close to the mass centroid of the combined vehicle, but to one side of the longitudinal axis in order to maximise any observations of field asymmetry and distortion introduced by the machine’s ferromagnetic mass. The test location of the apparatus on the machine was considered to be worst-case. The test sequence involved taking measurements of each of the three mutually orthogonal H field components at distances of 1 to 10 m, in one metre intervals for separate bearings of 0°, 45°, 90°, 135°, 180°, 225°, 270°, 315°, with 0° being the vehicle forward axis in plan view. Peak-weighted readings of the three components were also taken. Where the measurement points lay inside the machine envelope, no measurements were made. Observations and Findings For those bearings where there was least intervening metalwork then almost idealised attenuation curves (of field versus distance) were observed. Figures 19 and 20 are noted, where the y axis is received signal strength voltage (normalised logarithmic scale, 0.1=10 dBm) and the x axis is distance in metres. The attenuation curves for 0 degrees (forward axis) show moderate distortion associated with the intervening machine metalwork. Those for 90 degrees are close to theoretical predictions. The attenuation curves suggest that the useful range, for the prototype electronics, is of the order of 10 metres. This range could be improved upon, to the order of 15 metres, principally by the use of more sophisticated signal processing (i.e. ultra narrow band signal processing). A key objective in undertaking the tests was to ascertain how particular alarm threshold levels would vary around the periphery of the machine. To establish this, attenuation curves were determined from the discreet data points with 5th/6th order polynomial smoothing used to aid interpolation. For a range of arbitrary signal strength threshold voltages; 0.3, 0.35, 0.45, 0.5, 0.65 and 0.75 Volts within a receiver signal strength output range of 0.2 – 1.0V, the corresponding distances from the receiver loop were determined. The results are given in the table below. It is noted that there is ~15 per cent variation in range depending on bearing. This variation would probably be acceptable in a practical system. Orientational Sensitivity of the Personal Transmitter In performing the H field measurements, the x, y, z transmitter axes were nominally aligned in turn towards the receiver loop. In this situation, maximum field coupling is observed between the aligned transmitter magnetic dipole and the receiving loop. In order to determine the sensitivity to orientation of the personal transmitter for non-aligned conditions, a series of measurements were taken where the unit was turned through 180° (+90° from nominal alignment) in 15° steps for discreet distances between 1 to 8 metres. The results are given in Figure 21. It can be seen that the variation due to orientation between the two matched output transmitter axes is low. The slight periodicity at certain distances cannot be explained simply. Conclusions from Surface Mine Trials 1. Field distortion due to the influence of machine and extraneous metallic infrastructure
was observed. This distortion would not materially impair the operation of a practical device.
23
2. Variations in proximity (receiver loop to transmitter distance) observed around the machine for any given alarm threshold varied by ~15%. This again would probably not have great practical significance.
3. The effect of orientation of the personal transmitter on the peak-weighted received signal
is small, providing the output of the transmitter stages in the three axes are closely matched. This is a matter of design control.
4. The effective range of the system was up to 10 metres. This can be improved upon by
three mechanisms; either (a) using more sophisticated receiver signal processing to permit operation at a lower signal to noise ratio (b), by increasing the magnetic moment from the transmitter, which could be achieved by using a reflective vest in which a flexible transmitter loop is wound, and (c), by increasing the frequency of operation from ~35kHz to ~60kHz to reduce background electromagnetic noise.
5. The effective range recommends that a separate detection unit be mounted front and aft
on a free-steered vehicle. Table: Proximity to machine* at various alarm levels versus bearing * (loop – transmitter distance) Bearing to Machine (0º - forward axis) 0º 45º 90º 135º 180º 225º 270º 315º
Alarm Level Proximity for particular alarm and bearing (metres)
0.75V 2.05 1.80 1.75 1.75 1.95 n/a n/a n/a
0.65V 2.65 2.60 2.50 2.55 2.90 n/a 3.40 3.20
0.50V 4.65 4.30 4.30 4.50 4.90 4.90 4.90 4.50
0.45V 5.65 5.05 5.10 5.30 6.10 5.70 5.80 5.30
0.35V 7.80 7.50 7.20 7.40 7.50 7.30 7.10 7.40
0.30V 10.0 9.60 9.00 9.30 10.4 10.0 9.60 9.10 n/a – no value, point within machine envelope Summary of Daw Mill Colliery Underground Tests Test Methodology Again, RJB Mining (UK) Ltd. kindly made available an underground test site at Daw Mill colliery. Of the underground vehicles offered by the colliery, a garaged FSV located at a junction was selected in that measurement distances up to 8 metres were permitted about a wide arc around the machine. Further to this, the junction area was supported by close fitting I-beam steel girders, which presented a greater metallic infrastructure than would be
24
found elsewhere in the mine. An overhead conveyor gantry was also located within the junction area. The test sequence involved taking measurements of each of three mutually orthogonal H field components at distances of 1 to 8 m, in one metre intervals for separate bearings of 0°, 45°, 90°, 270° and 315°, with 0° being the vehicle rearward axis in plan view. Readings along the 135°, 180° and 225° axes could not be readily taken due the proximity of the vehicle to the junction wall and obstructions from other equipment. The measurements taken along the 90° and 270° axes were considered quite severe in that these axes ran partly along the metal-lined walls of the junction, with the transmitter unit deliberately placed adjacent to the metal supports to emphasise any interaction with the transmitter field. The detector loop/receiver unit was located on the rear end of the FSV in a position which would be appropriate to an engineered system. Observations and Findings For all bearings measured, the attenuation curves showed only moderate distortion associated with the intervening machine and junction support metalwork. The range of the system could be expected to exceed 10 metres, primarily due to the lower electromagnetic noise floor observed underground compared with typical surface electromagnetic noise levels. The field distortion was slightly less than that measured in surface tests using the Eimco 942 FSV complete with hydraulic support load, reflecting the smaller machine mass. Alarm range variation around the periphery of the machine was determined for a range of arbitrary signal strength threshold voltages; 0.3, 0.35, 0.45, 0.5, 0.65 and 0.75 Volts. The figures are given in tabulated form below, with the results for the surface FSV trial given alongside those for the underground test for comparison. It is noted that there is reasonable correspondence between the two data sets. Table: Proximity to machine at various alarm levels versus bearing Bearing to Machine (0º - forward axis) 0º 45º 90º 135º 180º 225º 270º 315º Alarm Level
Proximity for particular alarm and bearing (metres)
0.75V 2.05 1.95u/g
1.80 1.75u/g
1.75 2.00u/g
1.75 1.95 n/a n/a 1.90u/g
n/a 1.90u/g
0.65V 2.65 2.70u/g
2.60 2.50u/g
2.50 2.65u/g
2.55 2.90 n/a 3.40 2.65u/g
3.20 2.75u/g
0.50V 4.65 4.70u/g
4.30 4.40u/g
4.30 4.70u/g
4.50 4.90 4.90 4.90 4.50u/g
4.50 4.90u/g
0.45V 5.65 5.50u/g
5.05 5.45u/g
5.10 5.60u/g
5.30 6.10 5.70 5.80 5.35u/g
5.30 5.90u/g
0.35V 7.80 7.70u/g
7.50 7.55u/g
7.20 7.90u/g
7.40 7.50 7.30 7.10 7.10u/g
7.40 7.90u/g
0.30V 10.0 9.60 9.00 9.30 10.4 10.0 9.60 9.10
u/g – value obtained in underground test n/a – no value, point within machine envelope
25
Conclusions from Underground Tests 1. Field distortion due to the influence of machine and extraneous metallic infrastructure
was observed but did not materially affect the operation of the system. Slightly higher levels of field distortion were observed in surface trials using a physically more massive machine. This behaviour is consistent with field theory.
2. Variations in proximity (receiver loop to transmitter distance) observed around the
machine for any given alarm threshold varied by ~15%. The surface and underground data are comparable. This indicates that a practical system should have reasonably consistent behaviour.
3. The effect of relative orientation of the personal transmitter to the receiving loop aerial on
the peak-weighted received signal was observed to be small. 4. The effective range of the system was of the order of 10 metres, recommending that a
separate detection unit be mounted front and aft on a free-steered vehicle. Improvements in range would be obtained by using more sophisticated signal processing.
Summary of Surface Forklift Truck Tests In addition to the surface and underground mine trials to determine the field distribution around large items of mobile plant, a series of confirmatory tests were also conducted using a forklift truck within a warehousing and distribution operation involving the loading and unloading of palletised loads to and from heavy goods vehicles. The forklift vehicle was kindly made available by Bass plc (National Distribution Centre). Figure 22 shows the experimental arrangement, where for convenience, the detector coil was mounted on top of the forklift truck battery compartment/counterbalance. Commensurately, the test arrangement ensured that the detection coil and electronics were in close proximity to the principal mass component of the vehicle. The vehicle was also deliberately positioned close to the pallets stored within the warehouse and the support structures of the building. As anticipated, the metallic mass of the machine provided the most significant contribution to any field distortion. The only significant distortion was associated with the forward axis of the machine, where measurements were taken close to and between the tines.
26
SUMMARY CONCLUSIONS AND OBSERVATIONS 1. There is benefit from examining accident statistics and research response in other
countries. US data suggests that 20-36% of fatalities involving forklift trucks are due to a worker being struck or crushed by forklifts.
2. An average of 13 workers per year are killed in the US non-coal mining sector due to
collision or crushing by mobile plant. In MSHA’s judgement, half of these accidents could be avoided if the equipment operator is adequately warned of impending collision.
3. A visual environment assessment methodology, based largely on visual task analysis,
is considered to be of significant value in investigating vehicle sight line limitation problems.
4. Where practical constraints prevent further improvements to visibility, alternative means
of controlling vision-related hazards need to be considered, for example, changing working practices, enhancing pedestrian awareness of vehicles. A significant residual risk is likely to remain with vehicles in a coal mining environment.
5. There are no apparent practical solutions to overcome reliably the visual restrictions
imposed by large loads being carried on forklift trucks. The primary means of control should be via the introduction of safe working practices, improving pedestrian awareness of forklifts and, where possible, excluding pedestrians from the working area.
6. Even where visual restrictions are relatively minor, as is typically the case with an
unloaded forklift truck, accidents are still likely to occur. Beyond the problems posed by restricted vision, there are also significant problems in terms ensuring and maintaining adequate levels of driver vigilance and awareness.
7. Reliability of vision assistance systems needs to be very high, since drivers may use
the systems as their primary source of blind spot information. This raises questions over system dependence and a possible increase in motivation for rule violations.
8. Modern camera systems, with appropriate mounting, illumination and cleaning can be a
significant aid to overcoming sight line problems, particularly vehicle reversing activities. It is considered that at least two cameras and associated illumination are required to cover the ‘blind spots’ on a vehicle.
9. It is anticipated that reversing alarms based on broadband noise localisation will have a
part to play in both reducing mobile plant accidents, by increasing vehicle localisation capability, together with offering reduced audible nuisance.
10. Beyond the modification of vehicles to improve ergonomics and the fitment of cameras,
there is a need to provide a warning where the driver has failed to notice a worker in the vehicle’s proximity.
11. A safety system must respond both to situations where the machine is approaching the
worker at speed, and where the machine is about to start and the worker is already in close proximity to the machine.
27
12. It is considered that the problem can be addressed by a proximity or location system with a detection range of say from 1 to 15 metres from the machine, providing there is uniform coverage around the machine envelope.
13. There is a need to further define the logistics and warning-control actions initiated from
personnel detection information, for example decisions concerning the issuance of warnings to the pedestrian or driver, or the immobilisation of the machine in high risk situations.
14. Systems should primarily provide an alert to the driver. The provision of an alert to
pedestrians within a worker safety device has benefit but may involve additional engineering and complexity.
15. The safety system must offer high reliability, low false alarm rate and effective self-test
provision. An engineered system needs to be retrofittable, low cost and intrinsically safe for use in coal mines.
16. Negligible hazards must be presented in terms of affecting pacemakers or from
exposure to any associated electromagnetic radiation. A safety device may need to transmit continuously and be worn throughout a working shift of up to 12 hours per day.
17. Devices and their interrogation electronics should have a very low risk of initiation of
electro-explosive devices (detonators) and should not cause electromagnetic interference with other electronic systems.
18. Direct detection of intrinsic body or workwear attributes is unlikely to lead to a proximity
detection system of adequate detection sensitivity or integrity. Given the rapid advancement of personnel detection security technologies, this field may benefit from periodic review.
19. Surveillance sensors are available to differentiate the body against background. The
simplest, employing pyroelectric devices, are not suitable where the target is largely obscured, or is some distance away.
20. Thermal imaging can unambiguously detect a body heat signature against a cooler
background but would not be appropriate because of interference from other heat sources.
21. Front-rear and side-swipe automotive anti-collision technologies are not considered
suitable in their current form. Detection techniques include radars, ultrasonic and laser range finders, 2-D and 3-D vision systems, with radar-based systems used in most commercial systems.
22. Radar systems provide a relatively narrow angular coverage. The azimuth setting of
the radar detector also influences detection zone. A number of radar units would be required to cover all blind spots on a vehicle. Target clutter problems are anticipated underground.
23. No directly suitable passive RFID technologies could be found. Appraisal of current
commercial systems and interrogation techniques confirmed that the required range and coverage would require excessively high powers and multiple sensing units.
24. Advances in low cost passive EAS (Electronic Article Surveillance) technologies are
unlikely to lead to a low-cost personnel detection system based on retail theft-prevention technologies.
28
25. A number of researchers consider an active transmitter-transponder approach to be the
most practical and feasible response to mobile plant vision restriction safety problems. 26. The investigation of very low frequency magnetic field detection techniques as the
basis of an active personal safety system has shown that a practical system can take several forms, from having a person worn active transmitter, to detecting the field emanating from a source on the machine.
27. In unfavourable orientations (for example where the wearer is prone), a single axis
transmitter exhibits nulls in its response. In practical terms, this renders a single axis system unusable, since detection sensitivity varies excessively with device orientation and machine position.
28. Sensing fields in three orthogonal axes eliminates device orientational sensitivity but
requires a significant increase in the complexity of a pedestrian unit to incorporate the miniature sensing coils and associated field measurement electronics.
29. The IMC research philosophy of moving system complexity to the machine and keeping
the pedestrian unit as simple as possible is considered feasible, but requires a continuously operated, person worn transmitter.
30. It is feasible to design a portable transmitter employing three mutually orthogonal coils
to transmit a field in a time division multiplexed fashion. In any practical commercial system this device would be miniaturised and worn by persons working in high risk areas.
31. Experimentation confirmed that this configuration exhibits a low variation in received
signal strength with orientation, based on peak measurement of the strongest of the three signal components.
32. The use of a microprocessor permits a variety of frequencies and drive waveforms to
be generated. Transmitted frequencies may be swept or dynamically switched to increase electromagnetic compatibility.
33. The prototype device had a relatively high power consumption, which could be greatly
reduced by diversity techniques (i.e. pulsing the transmitter) whilst retaining acceptable response time.
34. The prototype transmitter unit is capable of inducing electrical currents into an electro-
explosive device (EED). This aspect of the design will need to be examined further for mining applications.
35. The safety of an active electromagnetic device in terms of electromagnetic field
exposure is complex and needs to be examined further. 36. Tests of the prototype system confirm an effective range of 10 metres. This can be
improved upon primarily by using more sophisticated receiver signal processing. 37. Field distortion due to the influence of machine and extraneous metallic infrastructure
was observed. This distortion would not materially impair the operation of a practical device.
29
38. Variations in proximity (receiver loop to transmitter distance) observed around the machine for any given alarm threshold varied by ~15%. This would not have practical significance.
39. Worker safety systems similar to the researched low frequency field detection approach
have been identified; the Nautilus system and US NIOSH system. Each system is nearing completion of development. Third party tests indicate that both offer satisfactory coverage and range.
40. The NIOSH system is protected by a US patent. This does not restrict further
development or application in the United Kingdom, but may discourage manufacturer involvement.
30
References BLS [1997], Fatal Workplace Injuries in 1995: A Collection of Data and Analysis, Department of Labor, Bureau of Labor Statistics, Washington DC, U.S., Report 913, 1997 BLS [1998], Occupational Injuries and Illnesses: Counts, Rates, and Characteristics, 1995, Department of Labor, Bureau of Labor Statistics, Washington DC, U.S., Bulletin 2493, 1998 British Coal Corporation [1993], Man Detection, British Coal Corporation, Technical Services and Research Executive, Final Report on ECSC Research Project No. 7262-08/34/254, 1993 British Coal Corporation [1994], Ergonomic Assessment of Closed Circuit Television Systems for Mine Vehicles, Report IMCL/2045, conducted by International Mining Consultants Limited on behalf of British Coal Corporation Midlands Group, August 1994, 23p Carroll MS [1992], Fusion of Ultrasonic and Infrared Signatures for Personnel Detection by a Mobile Robot, Proc. SPIE Vol. 1611, pp 619-629, Sensor Fusion IV: Control Paradigms and Data Structures, Paul S. Schenker; Ed., April 1992 Elfner LF, House WR [1987], Free Field Localisation with a Single Sound Transducer, Applied Ergonomics, 18.2, pp 125-131, 1987 Ferris DD [1998], Microwave and Millimetre-wave Systems for Wall Penetration, In: Targets and Backgrounds: Characterization and Representation IV. Editor(s): Wendell R. Watkins, U.S. Army Research Lab., White Sands Mis Rge, NM, USA; Dieter Clement, FGAN Forschungsinstitut für Optik, Tübingen, Germany. SPIE Proceedings Vol. 3375, pp 269-279, 1998 Frost & Sullivan [2000], The European Radio Frequency Identification Equipment Market - A New Study, Report Code: 3583, April 2000 Garrott WR et al, [1998], Hardware Evaluation of Heavy Truck Side and Rear Object Detection Systems. In: Object Detection, Collision Warning and Avoidance Systems, US Society of Automotive Engineers, Automotive Electronics Series, PT-70, Paper 951010, pp 3-27, 1998 Hansard [1990], Cm199091, 16th November 1990, Column 838 Hanson-Abbott C, [1997], Going Backwards on Safety, Global Transport, Summer 1997, pp 64-65 Harpster JL et al [1996], Backup Warning Signals: Driver Perception and Response. US Dept. of Transportation, Technical Report, DOT HS 808 536, 1996, 62p Harris Corporation [1994], Proximity Monitoring Apparatus Employing Encoded, Sequentially Generated, Mutually Orthogonally Polarized Magnetic Fields, United States Patent No. 5477210, December 19 1995 Hickling R, Marin SP [1986], The Use of Ultrasonics for Gauging and Proximity Sensing in Air, J. Acoust. Soc. Am., Vol. 79, No. 4, April 1986, pp 1151–1160 Hind DJ [1995], Application of Radio Frequency Identification Systems in the Mining Industry, Mining Technology, Vol. 77, No. 887, July 1995, pp 219-225 HSE [2000], HSE Issues Guidance on Safety in Working with Lift Trucks, HSE Press Release E200, 24 October 2000 Huey RW et al [1997], In-Vehicle Crash Avoidance Warning Systems: Human Factors Considerations. US Dept. of Transportation, Summary Report, DOT HS 808 531, 1997, 35p
31
Hurteau R et al [1994], Analysis of Detection and Obstacle-Avoidance Systems for Vehicles Operating in Underground Mines’, IEA’94, Vol.4, Ergonimie et Design, pp271-273, HSE Translation No. 15180A, 1994 Hyland W [1998], Blind Spot Systems – Design Issues. In: Object Detection, Collision Warning and Avoidance Systems, US Society of Automotive Engineers, Automotive Electronics Series, PT-70, Paper 952618, pp 121-124, 1998 Jurgen RK [1998], Cost Effectiveness, Tort Liability, and Public Acceptance are Key. In: Object Detection, Collision Warning and Avoidance Systems, US Society of Automotive Engineers, Automotive Electronics Series, PT-70 (end page), 1998
Lawrence Livermore National Laboratory [1995], Land Mine Detection Using Multispectral Image Fusion, Symposium on Autonomous Vehicles in Mine Countermeasures, Monterey, CA, 3-7 April 1995, 12p
Lee S, Hahn H [1991], Recognition and Localization of 3-D Natural Quadric Objects Based on Active Sensing, IEEE Int. Conf. on Robotics and Automation, Vol. 1, pp 156-161, Sacramento, CA, April, 1991 Lozak J [1975], Analysis of Possibilities of Location of Low Power Electromagnetic Field Sources in a Rock Medium, Doctoral Thesis, Part I, University of Warszawa, Poland, WAT 1975, 96p Mark R, Verhoef H [1999], Collision Avoidance System for Large Mining Trucks, Proceedings of Queensland Mining Industry Health and Safety Conference, Queensland Australia, 1999, pp 177-181 Mazzae EN [1998], Human Factors Evaluation of Existing Side Collision Avoidance System Driver Interfaces. In: Object Detection, Collision Warning and Avoidance Systems, US Society of Automotive Engineers, Automotive Electronics Series, PT-70, Paper 952659, pp 205-229, 1998 Mecheng T [1992], Fiber Optics Eliminate Driver's Blind Spot, Mechanical Engineering, November, 1992, p20 Meitzler TJ [1998], Perception Test of Infrared Images of Soldiers in Camouflaged Uniforms. In: Targets and Backgrounds: Characterization and Representation IV Editor(s): Wendell R. Watkins, U.S. Army Research Lab., White Sands Mis Rge, NM, USA; Dieter Clement, FGAN Forschungsinstitut für Optik, Tuebingen, Germany. SPIE Proceedings Vol. 3375, pp 2-16, 1998 Murray W et al [1998], Reversing Accidents in UK Transport Fleets 1996-97, Study Report, Transport and Logistics Research Unit, University of Huddersfield, 1998, 20p
NATO [1998], Advanced Pattern Recognition Techniques (Techniques Avancees de Reconnaissance de Forme). North Atlantic Treaty Organization, Brussels (Belgium), September 1998. 163p
Nessler N, Böhler N [1996], ‘Location System with ELF-Signals for Underground Applications with Coded Responsive Transmitters’, Proc. of 1996 Int. Symp. On Antennas and Propagation, Vol. 4, pp 1069-72, Tokyo, Japan NIOSH [1999], Preventing Injuries and Deaths of Workers Who Operate or Work Near Forklifts, US National Institute for Occupational Safety and Health, DHHS (NIOSH) Publication No. 2000-112a, December 1999, 12p Noel SE [1998], Proximity Sensing with Wavelet Generated Video, Journal of Electronic Imaging, Vol. 07(04), October 1998, pp 770-780 Pearce RP [1998], Opencast Vehicle Safety - Improving Visibility from the Driver’s Position, Coal International, September 1998, pp 176-177
32
Ruff TM [2000], Test Results of Collision Warning Systems for Surface Mining Dump Trucks, Report of Investigations, RI 9652, US National Institute for Occupational Safety and Health, May 2000, 45p
Schiffbauer WH [1999], A Workplace Safety Device for Operators of Remote-Controlled Continuous Mining Machines, American Jrnl. of Indust. Medicine, Suppl. 1, Sept. 1999, pp 69-71
Searle CL [1982], A Model of Auditory Localisation: Peripheral Constraints. In: Gatehouse, R.W. (Ed), Localisation of Sound: Theory and Applications, Groton, CT: Amphora Press, 1982 SIMRAC [1996], Investigation of the Causes of Transport and Tramming Accidents in Mines other than Coal, Gold and Platinum, Republic of South Africa, Safety in Mines Research Advisory Committee, Final Report on Contract No. OTH 202, 1996 SIMRAC [1999], Investigation of the Causes of Transport and Tramming Accidents in Coalmines, Republic of South Africa, Safety in Mines Research Advisory Committee, Final Report on Contract No. COL 506, 1999 SIMRAC [2000], Assessment of World-wide Illumination and Visibility Standards, Republic of South Africa, Safety in Mines Research Advisory Committee, Final Report on Contract No. COL 451, 2000 Thompson RJ [1998], The Role of Haul Road Safety Audits in Reducing Transportation Accidents, Proceedings of Minesafe 1998 International Conference, pp 426-429 Ulke W [1998], Radar Based Automotive Obstacle Detection System. In: Object Detection, Collision Warning and Avoidance Systems, US Society of Automotive Engineers, Automotive Electronics Series, PT-70, Paper 940904, pp 39-52, 1998 Volpe R, Ivlev R [1994], A survey and experimental evaluation of proximity sensors for space robotics, IEEE Int. Conf. on Robotics and Automation, Vol. 4, pp 3466-3473, San-Diego, CA, March 1994 Young SK [1995], Collision Avoidance System Performance for Lane Change, Merging and Backing: Phase I Results and Future Plans, Report prepared for U.S. Dept. of Trans., National Highway Traffic Safety Administration, October 27, 1995
33
Figure 1: Typical Commercial Camera Reversing Aid System (Acknowledgement: Vision Techniques Limited)
Figure 2: Underground Mineral Haul Truck Reversing Camera Arrangement
34
Figure 3:
Views along driver’s side and opposing side of LHD vehicle
35
Figure 4: Visibility Through Mirrors and Coverage of Side Object Detection Systems [Garrott et al 1998]
36
Figure 5: Obstacle Detection System Test Vehicle, Side View [Ruff 2000]
Figure 6: Obstacle Detection System Test Vehicle, Rear View [Ruff 2000]
37
Figure 7: Test Environment for Detecting Proximity of Smaller Vehicle [Ruff 2000]
Figure 8: Test Environment for Detecting Proximity of Pedestrian [Ruff 2000]
38
Figure 9: Detection Zone of Front-mounted Figure 10: Detection Zone of Rear-mounted Radar-based Object Detection System Radar-based Object Detection System [Ruff 2000] [Ruff 2000]
39
Figure 11: Effect of Mounting Azimuth on Detection Range of Radar-based Object Detection System [Ruff 2000]
40
Figure 12: Detection Zone of Nautilus ‘Buddy’ System [Ruff 2000]
Figure 13: Detection Zone of US NIOSH ‘Hasard’ System [Ruff 2000]
41
Figure 14: Example of High frequency Electronic Article Surveillance Device
Figure 15: Prototype IMC Mobile Plant Pedestrian Safety System Above- Receiver and Loop, Below- Driver Warning Indicator
42
Figure 16: Internal Views of Prototype Personal Transmitter Unit
43
Figure 17: EIMCO 942 used in Surface-based Colliery Trials
44
Figure 18: Plan View Showing Location of Detection Loop on FSV
45
Figure 19: Worst-Case Field Distortion in Surface FSV Test
Figure 20: Near-Idealised Attenuation Curve, Surface FSV Test
46
Figure 21: Effect of Orientation of Personal Transmitter Unit on Peak Field Strength (Three Components)
47
Figure 22: Experimental Arrangement for Warehouse Forklift Truck Tests
48
APPENDIX 1 : ERGONOMIC STUDY OF VEHICLES
A1.1 Free Steered Vehicles (FSVs) FSVs used in the underground coal mining sector are typically fitted with two to three cubic metre capacity buckets or load platforms and are used to transport supplies to wide-spread locations throughout the mines. A common characteristic of these vehicles is that the driver cabs are located centrally on one side, with the driver seated in a sideways position. In most cases the driving position is provided on the left side of the vehicle when looking towards the bucket but a minority of vehicles have right-sided cabs. Smaller battery powered scoops, used primarily for clearing up spillage and levelling ground, can also be considered within this family of machines. They too have side seating arrangements and are fitted with buckets on the front end. The following five units were considered.
1. A large vehicle approximately 7,5m long x 1,8m wide x 1,8m high with the driving position on the left. The vehicle was observed transporting supplies between a shaft station and an underground workshop complex over a distance of 0,5 km in 6,0m x 2,5m section roadways. Sources of illumination comprised:- Two 12v 50W Hytronic headlights mounted at each end of the machine. At the front (bucket) end, a light unit was mounted on the top of each mud-guard. At the rear, the lights were mounted in front of the radiator, approximately 1,0m off the ground, one close to each corner of the machine. The roadway was illuminated by twin 75W, 1,8m fluorescent light units mounted laterally across the roof every 25m. No light units were however provided within 10m of any junction
2. A large vehicle, similar to Vehicle 1, transporting supplies in an underground workshop complex in which roadway sections varied. Sources of illumination comprised:- This vehicle was fitted with an identical arrangement of lights as Vehicle 1. The roadways were extremely well illuminated by various arrangements of fluorescent lights.
3. A medium height vehicle approximately 6,0m long x 1,8m wide x 1,3m high with the driving position on the right. The vehicle was observed transporting supplies inbye to a production section along a 7,0m x 1,8m section roadway. Sources of illumination comprised:- Two 12v 50W Hytronic headlights mounted at the front (bucket) end of the vehicle on top of each mud-guard. At the rear, a single headlight of the same type was mounted in front of the radiator, approximately 0,75m off the ground, close to the right corner of the vehicle The roadway was illuminated by twin 75W, 2,4m fluorescent light units mounted laterally across the roof every 25 m.
4. A medium height vehicle approximately 6,0m long x 1,8m wide x 1,5m high with the driver on the left. The vehicle was observed travelling outbye from a production section along a 7,0m x 2,0m section roadway. Sources of illumination comprised:- Two 50mm diameter 50W headlights mounted at each end of the vehicle. At the front (bucket) end a light unit was mounted on the top of each mud-guard. At the rear, the lights were mounted one on either side, and at the end, of the engine compartment, approximately 1,0m off the ground. A red reflector was mounted on the radiator grille.
49
The roadway was illuminated by twin 75W, 2,4m fluorescent light units mounted laterally across the roof every 25 m.
5. A small pivot steered purpose designed battery powered scoop with the driver on the right. The vehicle was observed clearing up spillage and levelling the ground in a 7,3m x 3,3m section roadway in a production section. Sources of illumination comprised:- Two 50mm diameter 50W headlights mounted at each end of the vehicle. The lights were mounted at each corner on top of the vehicle approximately 0,6m off the ground and were directed downwards to illuminate a line across the roadway approximately 5m ahead of the scoop. All the lights illuminated when the machine was switched on, regardless of travel direction selected.
Assessment details for Vehicles 1 and 5 are given below.
50
Assessment of Vehicle 1 Hierarchical Task Description Task Elements Visual Targets Hazard No. Travel to shaft station (bucket loaded with empty oil drums)
Raise and tilt bucket to travelling position VT1 Workmen and obstacles directly in front of and at the sides of the bucket VT2 Top of bucket and roof above the bucket
1, 8
Set off bucket leading VT1, VT2 VT3 Workmen and obstacles alongside the pivot point on the off side of the vehicle VT4 Workmen and obstacles alongside the pivot point on the near side of the vehicle
1, 2, 3, 4, 5
Negotiate left turns VT1, VT2 VT5 Near corner of roadway being turned into VT6 Far corner of roadway being turned into VT7 Near side of vehicle VT8 Leading off side corner of bucket VT9 Workmen and equipment in entrance to turning (left)
1, 2, 3, 4, 5, 7
Negotiate right turns VT1, VT2 VT10 Near corner of roadway being turned into VT11 Far corner of roadway being turned into VT12 Top edge of vehicle running down off side VT13 Leading near side corner of bucket VT14 Workmen and equipment in entrance to turning (right)
1, 2, 3, 4, 5, 7
Travel along straight stretch of roadway VT1-4 VT15 Workmen and obstacles (ground/sides/roof) far enough in front of the vehicle for them to be detected and identified to enable the vehicle to be stopped before collision.
1, 2, 3, 4, 5
Cross over junction VT9 & 14 1, 2, 5, 7 Approach shaft station and stop VT1, 2, 3, 4, 15 1, 2, 3, 5, 6
Unloading Tilt and lower bucket to ground VT1 1, 6 Supplies crew lift empty drums from bucket and store at side of shaft station
1, 4, 6
51
Travel back to workshop When travelling back to the workshops the vehicle was driven
in reverse. The task hierarchy and visual targets that were required were essentially the same, except that they were encountered in the reverse order. When travelling in reverse, visibility was slightly better because there was no bucket to obstruct the driver’s sight lines and output from the vehicle headlights.
1, 2, 3, 4, 5, 8
The visual targets identified above were grouped into the following visual attention areas:
52
Facing forwards (towards the bucket) Visual Targets: Workmen and obstacles directly in front of and at the sides of the bucket [VT1]
Top of bucket and roof above the bucket [VT2] Workmen and obstacles (ground/sides/roof) far enough in front of the vehicle for them to be detected and identified, to enable the vehicle to be stopped before collision [VT15]
Operational Blind Spots: A substantial area in front of the vehicle, particularly towards the off side, was obscured by the bucket and items on top of the vehicle. It was not possible to see the ground in front of the bucket up to a distance of 60m. The driver conceded that at 60m it was not possible to reliably detect and identify people and the nature of obstacles and hazards in the path of the vehicle. Furthermore, it was not possible to see even the hard hat of a 1,8 m tall workman standing erect directly in front of the bucket between the centre line of the vehicle and the right front corner.
When travelling in reverse i.e. bucket trailing, the driver, when looking towards the rear of the vehicle, could see only the top of the hard hat of a 1,8 m tall workman extending above the engine compartment.
Major Postural Changes: Driver has to rotate upper part of his body through 180 degrees to see ahead of the vehicle. Canopy and side of vehicle did not prevent him from leaning out of cab.
Visual Environment: Illuminance- With the bucket raised in the travelling position, output from the headlights was not measurable at 20m.
With the bucket lowered, average illumination across the roadway at 20m with engine running at above idle speed was 20 lux (similar output levels were recorded for the headlights mounted on the rear of the vehicle). With engine running at idle speed, light output was not measurable at 20m.
Roadway lights – measurements taken 1m off the ground Directly beneath lights: 240 lux in centre of road Between lights: 50 lux in centre of road
Reflectance- All workmen wore white hard hats, dark blue overalls and reflective yellow waistcoats. Most other vehicles were painted white but some tractors were blue.
Contrast- Viewed against: Main roadway ribsides were coated with stone dust with poor reflective properties, walls were dry compacted coal dust.
Visual conditions- Poor, Machine lights extinguish at low engine revs Roadway lights are covered in dust and only emit a fraction of their potential output. Some critical areas, such as junctions, not illuminated
Hitting people who may be crouched at the side of the vehicle Collisions with other vehicles parked at the side of the road and at junctions, especially on the off side Masking of headlights by the bucket when driving through areas where mine illumination levels were low Running over debris in the roadway.
53
To the near side Visual Targets: Workmen and obstacles alongside the pivot point on the near side of the vehicle [VT4]
Near corner of a nearside turning [VT5] Far corner of a nearside turning [VT6] Near side of vehicle [VT7] Workmen and equipment in entrance to near side turning [VT9] Leading near side corner of bucket [VT13]
Operational Blind Spots: Workmen and equipment in entrance to turnings.
Major Postural Changes: Driver has to rotate upper part of his body in excess of 180 degrees to see along the near side of the vehicle, especially the area encompassing the central pivot. Canopy and side of vehicle did not prevent him from leaning out of cab.
Visual Environment: See previous table for details. To the off side Visual Targets: Workmen and obstacles alongside the pivot point on the off side of the vehicle [VT3]
Leading off side corner of bucket [VT8] Near corner of an off side turning [VT10] Far corner of an off side turning [VT11] Top edge of vehicle running down off side [VT12] Workmen and equipment in entrance to off side turning [VT14]
Operational Blind Spots: A substantial area on the off side of the vehicle was obscured from the driver. Between the central pivot point to the leading off side corner of the bucket, it was possible for the driver to see only the hard hat of a 1,8 m tall workman standing erect at the side of the vehicle. The same workman standing in the area of the pivot point was totally obscured [VT3]. Below a height of 1,8 m, the near and far corners of an off side turning were obscured [VT10] and [VT11]. Furthermore, any workmen or equipment in the entrance to an off side turning would have been almost totally obscured.
Major Postural Changes: None
Visual Environment: See previous table for details.
54
Potential Hazards The visual limitations identified above were judged to make a significant contribution to the risks arising from the following potential hazards:
Potential Hazards Control Limitations
1 Collision with pedestrians/maintenance staff Lines of sight to front, off side and rear were obstructed. Lack of visual/audible tramming alarm systems.
2 Struck by objects thrown up by vehicle Drivers lines of sight to front and rear obstructed Output from front headlights masked by bucket Occasional items in roadway not picked up by routine housekeeping
3 Injured whilst leaning out of cab Cab design has minimal restraining effects Sight line and headlight restrictions create a temptation among drivers to lean out of cab.
4 Postural injuries Fixed side seating arrangement combined with sight line and headlight restrictions create the need for drivers to undertake gross postural changes.
5 Collision with other vehicles particularly at junctions and turns Machine lighting fails to provide adequate warning to drivers of other vehicles. Lines of sight to front, off side and rear were obstructed. Restricted roadway lighting at some junctions
6 Collision with workmen, loads and other plant at shaft station Lines of sight to front, off side and rear were obstructed. Lack of visual/audible tramming alarm systems.
7 Collision with corners of turns on off side Lines of sight to front, off side and rear were obstructed.
55
Assessment of Vehicle 5 - Battery powered scoop Hierarchical Task Description Task Elements Visual Targets Hazard No. The method of work varied considerably and it was not possible to define a clear task hierarchy. Basically the driver was required to:
• Systematically drive through the different routes used by the three shuttlecars
• Scoop up any spillage or accumulations of coal • Fill in any ruts by depositing material from the scoop • Grade uneven ground by inverting the scoop and using it
to scrape and compress the ground. Approximately 60% of the driver’s time was spent travelling in the forward direction i.e. scoop leading and 40% in reverse.
VT1 Workmen, obstacles and the roadway in the path of the vehicle VT2 Power cables for the shuttlecars VT3 Ground in front of the scoop VT4 Right hand edge of the scoop VT5 Near corner of roadways being turned into VT6 Far corner of roadways being turned into VT7 Shuttlecars and any other vehicles in the same road VT8 Ribside behind the driver
1 2
1 1 3
The visual targets identified could be grouped into two visual attention areas, namely, facing in a forwards (towards the scoop) and in a backwards direction (to reverse). The visual targets are, however, essentially the same in both directions and have, therefore, been considered collectively below. Operational Blind Spots: When entering off-side turnings, the driver’s view of workmen, obstacles and other vehicles in the roadway
was partially obscured. Major Postural Changes: Driver has to twist through 180 degrees to see to the rear. Visual Environment:
Visual angle People, obstructions and objects in roadway at a range of 1,0m (end of m/c) to approx. 5m. Corners of turnings 5-10m from the driver Side of scoop 2m from driver Power cables lying in roadway 2-6m from driver
Illuminance- Illumination directly in front and behind vehicle at 20m = 25 lux Illumination at ribsides 20m in front and behind vehicle = 4 lux
Reflectance- Variable. Supervisors in white overalls, workmen in dark blue overalls. All hard hats white. Other machines painted white. Supply cables black.
Contrast- Viewed against: Sidewall dry dull coal near working headings, stone dusted elsewhere. Floor damp but not muddy.
Visual conditions- Poor, resulting from limited spread of light to ribsides and awkward postures that have to be adopted by the driver. Damage to off-side of vehicles indicates that collisions are not uncommon.
56
Classification- Detection and course tracking Operators comments- Driver expressed concern about the lack of protection to his back. Bolts extending from the ribsides are
difficult to detect and the protective guarding behind the driver was insubstantial. Potential Hazards The visual limitations identified above were judged to make a significant contribution to the risks arising from the following potential hazards:
Potential Hazards Control Limitations 1 Striking workmen, shuttlecars and the corners of turns on the off-
side of the vehicle when travelling in either direction. No restrictions on workmen walking along vehicle routes. Lines of sight to off-side of machine obstructed. Low reflectance and hence poor contrast/visibility of workforce due to use of dark blue overalls. Stone dusting does not keep pace with advancement of headings. Lack of effective traffic controls to prevent machine from working in roadways at same time as shuttlecars.
2 Fire, explosion, burns, etc. from damage to supply cables to shuttlecars, etc.
Visibility of power cables is poor.
3 Contact with bolts protruding from ribsides Failure to crop protruding bolts and provide adequate driver protection
57
Significant Factors from Other FSVs The assessment details given above were also substantially applicable to Vehicles 2, 3 and 4. The following additional factors were also identified: Vehicle 2. In the context of visibility and illumination this vehicle was very similar to the Vehicle 1. and was used for similar operations. The resulting hazards were therefore essentially the same. Driver sight lines were marginally better in that it was possible to see:
• the whole head of a 1,8m tall person standing erect in front of the bucket or behind the engine compartment rather than just the top of their hard hat.
• the whole head of a 1,8m tall person standing erect at any point on the off side of the vehicle rather than just their hard hat or not at all • the obstacles at ground level 30m in front and behind the vehicle, rather than at 60m.
Illumination problems were similar in that: • output levels dropped to an almost negligible value when the engine ran at idle speed • while maximum output levels from the front headlights measured 20 lux at 20m the bucket obstructed output when raised to the normal
travelling position. An additional problem on this vehicle was that one of the rear headlights was hanging loose (pointing vertically downwards) and had, apparently, been in this condition for some period of time. Vehicle 3. Although Vehicle 3 was some 50cm lower than Vehicles 1 and 2, the driver was provided with a relatively higher seat. Sight lines were, therefore, marginally better in that the drivers were able to see the head and shoulders of a 1,8m tall person standing erect at any point round the periphery of the vehicle. Maximum roadway height was 2,0m and, in the absence of a canopy, there was a significant risk of tall drivers striking objects at roof height. Drivers reported that they regularly bumped their heads against the roof. The problem was greatest when travelling forwards because the bucket prevented the headlights from illuminating the obstructions. Some drivers adopted a crouched/leaning posture to avoid contact with the roof, which reduced their ability to identify workmen or obstacles in the path of the vehicle, and created risk of postural injuries. The drivers raised the following issues associated with the vehicle lights, which created a significant collision risk:
• Limited provision of effective visual warnings on other moving or parked vehicles.
• When moving, the rear facing headlights operate as well as the forward facing units thereby ‘blinding’ the drivers of following vehicles.
• Several of the FSVs observed at the mine had defective headlights.
58
Machine 4. The limitations outlined above for Machine 3 also apply to Machine 4. However, on this vehicle the drivers were provided with a relatively lower seated position. While this marginally reduced the risk of the operators striking their heads against the roof, sight line limitations around the vehicle were more pronounced. To overcome this limitation, the drivers developed the tendency of leaning out of the cab to enhance their view ahead when travelling.
59
60
A1.2 Surface Mine Truck Assessment A number of different types and capacities of rear-dump haulage truck are used on the mines and the specific duties for which they are employed also differ. A review of previous research material, published articles and discussions with mine operators confirmed that a rear dump haulage truck with a load carrying capacity in the order of 100 tonne would be the most appropriate version of this type of vehicle on which to base this aspect of the study. Typical dimensions for such a vehicle are given in Figure A. It is convention on this type of vehicle to provide the driving compartment on the left side. The standard visual aids provided by the manufacturer of the sample truck selected to form the basis of the assessment included:
1. A large convex wing mirror on the right front corner of the vehicle. The mirror was rectangular in shape and mounted in vertical orientation to the handrails surrounding the radiator deck – see Figure B.
2. A large flat wing mirror on the left front corner of the vehicle. The mirror was rectangular in shape and mounted in vertical orientation to the handrails adjacent to the door used by the driver – see Figure C.
3. A closed–circuit television (CCTV) system consisting of a cab mounted monitor (see Figure D) and a camera mounted close to the rear axle midway between the two sets of wheels. The system provided the driver with a rear view that included the inner facing walls of the left and right rear tyres.
The following supplementary visual aids had also been fitted to the vehicle 1. A hemispherical mirror provided by the mine for trial purposes. The mirror was
suspended beneath the right front corner of the canopy of the vehicle and is shown in Figure D. The purpose of the mirror was to provide the driver with simultaneous views of the area directly across the front of the vehicle and along the offside of the vehicle towards the rear.
2. The driver on his own initiative had acquired and fitted a pair of additional wing mirrors to the left side of the vehicle (Figure C) and a single wing mirror to the right (Figure B). The mirrors were mounted adjacent to the two standard mirrors but were inclined at different angles to further increase the drivers’ field of vision.
In UK surface mines rear-dump haulage trucks are commonly used to transport rock and over-burden from the point where mining operations are taking place to a suitable dumpsite. This was considered to be a suitably representative activity to form a basis on which to assess the above vehicle. A typical duty cycle for a truck being used in such an operation is outlined below.
1. At the start of the shift, following a pre-use inspection by the driver, an empty truck will be started and driven off from a designated open parking area. When manoeuvring out of the park, some reversing may be necessary.
2. The truck will be driven to the point where mining operations are taking place. This is likely to involve travelling some distance along a main haul road followed by a descent down a ramp. Left and right turns may have to be made. The convention of travelling on the left side of the road has been adopted in the UK.
3. At the area being mined the truck may have to queue for a short period while other trucks are loaded.
61
4. Positioning the truck for loading would usually involve ‘swinging’ the vehicle to the right across the road and then reversing to a point adjacent to the excavator or loader.
5. The loaded truck will then be driven to the designated dumpsite. This is likely to involve an ascent back up the ramp, some travelling along main haul roads, left or right turns and some further travelling along a temporary road or ramp.
6. Manoeuvres at the dump are likely to be similar to those undertaken at the loading area in that the truck will probably have to be turned and reversed to the point where the load can be discharged. Positioning may be accomplished by hand signals from a person working at the dumpsite.
7. The above process of loading and dumping usually continues throughout the shift, with loading areas and dumpsites at different locations possibly being used.
8. At the end of the shift it would be usual for the empty truck to be driven back to the designated parking area and locked out.
9. Periodic interruptions to the routine cycle of work may occur when, for instance, the truck has to be taken to a service area for routine maintenance or repair. When manoeuvring in and out of the workshop some reversing may be necessary.
In following the above cycle of operations a rear-dump haulage truck is likely to be driven in the presence of other haul trucks, mine utility vehicles, pickup trucks, cars, people, road hazards, buildings, plant, etc. No convention appears to have been established in the UK on the question of which side a stationary or slow moving haulage truck should be overtaken by lighter, smaller types of vehicle. At the mine selected for the study the transport rules stipulated that trucks should be overtaken on the inside, however, it is understood that the opposite convention exists at other mines. Therefore, for the purposes of assessment, it has been assumed that a haulage truck can be overtaken on either side. Assessment details for a large, rear-dump haulage truck engaged in the work cycle outlined above are given below. The assessment assumed that the truck was fitted with only the standard wing mirrors and a CCTV system provided by the vehicle suppliers. Comments on the value of the additional mirrors provided by the mine and the truck driver have also been included however. Sight line plots produced for the truck and mirror photographs, shown in Figures B to K, should be used in conjunction with the following assessment. The plots show the areas round the truck where people are likely to be concealed from the driver and to be at most risk. The photographs provide a good indication of what drivers are able see when using the mirrors.
62
Hierarchical Task Description Task Elements Visual Targets Travel from designated parking area to main haul road
Start and turn truck while reversing VT1 Workmen and obstacles directly behind the truck VT2 Workmen and obstacles along the entire right side of the truck particularly adjacent to the front wheel – drivers need to see an area that extends from ground level to the height of the truck. VT3 Workmen and obstacles along the entire left side of the truck particularly adjacent to the front wheel – drivers need to see an area that extends from ground level to the height of the truck.
Travel forwards to exit from truck park VT4 Workmen and obstacles 10m to 50m ahead of the truck
Turn left into main haul road VT5 Oncoming traffic and pedestrians from left VT6 Oncoming traffic and pedestrians from right VT7 Near corner of junction when turning left.
Turn right into main haul road VT5 and VT6 VT8 Near corner of junction when turning right
Travel from exit of truck park to mining area Travel along main haul road VT4
VT9 Left edge of road 10m to 50m ahead of truck Turn right onto ramp VT4 (Vehicles approaching from ahead)
VT6 (Traffic emerging from ramp on right) VT10 Vehicles overtaking on the offside VT11 Far corner of junction when turning right VT12 Vehicles approaching from behind
Turn left onto ramp VT5 Traffic emerging from ramp on left VT7 VT12 VT13 Vehicles overtaking on the nearside
Descend ramp and stop VT4 and VT9
63
Load truck
Travel across road turning to the right VT2 and VT10 VT14 Workmen and obstacles directly in front of truck VT15 Front right corner of truck and off-side edge of road
Turn truck while reversing to point adjacent to loader VT1, VT2 and VT3 Travel from loader to dumpsite
Ascend ramp VT4 and VT9 Turn right onto main haul road VT5, VT6 VT8 and VT12 Turn left onto main haul road VT5, VT6 VT7 and VT12 Travel along main road VT4 and VT9 Turn right onto temporary road or ramp VT4, VT6, VT10 VT11 and VT12 Turn left onto temporary road or ramp VT5, VT7 VT12 and VT13 Travel along temporary road or ramp and stop VT4 and VT9
Discharge load at dumpsite Travel across road turning to right VT2, VT10, VT14 and VT15 Travel across road turning to left VT2 and VT13
VT16 Front left corner of truck and near-side edge of dump Turn truck while reversing to point of discharge VT1, VT2 and VT3 Dump load None
Travel from dumpsite to loader The task hierarchy and visual targets required to drive the truck safely back to the loader are essentially the same as those for travelling to the dumpsite except that they would be encountered in the reverse order.
Travelling associated with taking truck for service and repair Travel to service compound The task hierarchy and visual targets required to drive the truck safely back
to the service compound are essentially the same as those for initially travelling to the mining area except that they would be encountered in the reverse order.
Manoeuvre truck in reverse VT1, VT2 and VT3 VT16 Top corner of the truck at the rear near-side VT17 Top corner of the truck at the rear off-side
64
Manoeuvre truck forwards VT2, VT3 and VT14 Travel to take up normal duties The task hierarchy and visual targets required to return the truck safely back
to normal duties are essentially the same as those for initially driving the truck to the mining area at start of shift.
Return truck to designated parking area The task hierarchy and visual targets required to drive the truck safely back to the parking area are essentially the same as those for initially travelling to the mining area except that they would be encountered in the reverse order.
The visual targets identified above were grouped into the following visual attention areas: Looking forwards ahead of the truck Visual Targets: Workmen and obstacles 10m to 50m ahead of the truck [VT4]
Left edge of road 10m to 50m ahead of truck [VT9] Workmen and obstacles directly in front of truck [VT14] Front right corner of truck and off-side edge of road [VT15] Front left corner of truck and near-side edge of dump [VT16]
Operational Blind Spots: Visual targets 14, 15 and 16 are obscured from the drivers’ direct view and also from the view provided by the standard mirrors fitted to the truck. The sight line plot shown in Figure… illustrates the area obscured and provides an indication of the: 1. Risks to people and equipment stationed directly in front of the vehicle; and 2. Problems experienced by drivers when judging the distance between the front corners of the vehicle and
the edges of the road, highwalls, dumpsites and loading areas when turning.
The hemispherical mirror retrofitted to the truck by the mine operator provided a partial view of all three visual targets. A limitation of such a mirror however, is that the forward view provided extends only 1m ahead of the truck while the area obscured at ground level extended approximately 6m ahead of the truck. A photograph of the view provided by this mirror is shown in Figure F.
Major Postural Changes: A seat belt prevents drivers from attempting to significantly enhance their direct view of all three visual targets by leaning forward.
65
Visual Environment: Due to the height of the driving position the risk of being dazzled by the lights of oncoming vehicles during hours of darkness is minimal. However, drivers reported that they are sometimes dazzled when vehicles travelling in opposite directions pass on the brow of an incline. Effectiveness of the hemispherical mirror is reportedly reduced significantly when operating in dusty conditions, in wet weather, and during hours of darkness. (In darkness the mirror fails to provide any worthwhile view along the offside of the truck)
Operators comments- Drivers considered that an improved aid to vision or appropriately designed sensing device would be valuable to them to reduce the risks associated with obscured vision directly in front of the vehicle.
See also comments above regarding dazzle from headlights and the environmental conditions that reduce the effectiveness of the hemispherical mirror..
Looking towards the left and along the near-side of the truck Visual Targets: Workmen and obstacles along the entire left side of the truck particularly adjacent to the front wheel – (drivers
need to see an area that extends from ground level to the height of the truck) [VT3] Oncoming traffic and pedestrians from left (at crossroads and junctions etc.) [VT5] Near corner of a junction when turning left [VT7] Top corner of the truck at the rear near-side [VT16] Vehicles overtaking on the nearside [VT13]
Operational Blind Spots: Visual target 3 is partially obscured from view. In particular, drivers are unable to see along the left side of the truck in the area adjacent to the front wheel. Drivers identified this zone as being particularly important. The sight line plot shown in Figure E illustrates the area obscured from the driver’s direct view. The standard wing mirror provides a view that covers only the back end of the truck. A photograph of the view afforded to the driver by the mirror is shown in Figure F. The obscured view of this area places people and equipment at risk when the truck is being turned. The standard wing mirror also fails to provide a sufficiently clear view of the rear top corner of the truck [VT16]. This increases the risk of a collision with building structures and plant when the truck has to be reversed in confined areas.
66
Of the mirrors fitted by the driver: 1. One provides a view of the side of the truck just behind the front wheel but fails to capture the important
area adjacent to the wheel – see Figure H; and 2. The second provides a view of the rear top corner of the truck – see Figure I, The sight line plot and views through the mirrors also show that it is likely that drivers would be unable to see vehicles attempting to overtake on the nearside (VT13)
Major Postural Changes: Drivers have been seen leaning out of the open window/door to gain a better downward view of the front nearside wheel.
Visual Environment: None of the mirrors provided are of real value in providing the driver with a reliable view of the prescribed visual targets during hours of darkness unless the vehicle is being used in an extremely well lit area.
Operators Comments Drivers considered that an improved aid to vision or appropriately designed sensing device would be valuable to them to reduce the risks associated with obscured vision in the region of the front wheel.
Looking towards the right and along the off-side of the truck Visual Targets: Workmen and obstacles along the entire right side of the truck particularly adjacent to the front wheel –
(drivers need to see an area that extends from ground level to the height of the truck) [VT2] Oncoming traffic and pedestrians from right [VT6] Near corner of a junction when turning right [VT8] Far corner of a junction when turning right [VT11] Top corner of the truck at the rear off-side [VT17] Vehicles overtaking on the offside [VT10]
Operational Blind Spots: Visual target 2 is partially obscured from view. In particular, drivers are unable to see along the right side of the truck in the area adjacent to the front wheel. Drivers identified this zone as being particularly important. The problem is more pronounced than on the nearside of the vehicle. The sight line plot (Figure E) shows that an area of ground extending as far as 13m from the truck is obscured from the driver’s direct view. The standard wing mirror provides a view that covers only the back end of the truck. A photograph of the view afforded to the driver by the mirror is shown in Figure J. The obscured view of this area places people and equipment at risk when the truck is being turned. The obscured area is sufficient to conceal a small vehicle.
67
The standard wing mirror also fails to provide a sufficiently clear view of the rear top corner of the truck [VT17]. This increases the risk of a collision with building structures and plant when the truck has to be reversed in confined areas. The mirror fitted by the driver provides a view of the side of the truck just behind the front wheel but fails to capture the important area adjacent to the wheel – see Figure… .
The sight line plot and views through the mirrors also show that it is likely that drivers would be unable to see vehicles attempting to overtake on the offside (VT10)
Major Postural Changes: None
Visual Environment: Visual target 2 can be seen in its entirety by drivers using the hemispherical mirror retrofitted to the vehicle, however, in dusty or wet conditions the images displayed are unclear. In darkness no worthwhile view along the offside of the truck.
None of the mirrors provided are of real value in providing the driver with a reliable view of the prescribed visual targets during hours of darkness unless the vehicle is being used in an extremely well lit area.
Operators Comments Drivers considered that an improved aid to vision or appropriately designed sensing device would be valuable to them to reduce the risks associated with obscured vision in the region of the front wheel.
Looking backwards behind the truck Visual Targets: Workmen and obstacles directly behind the truck [VT1]
Vehicles approaching from behind VT12
Operational Blind Spots: Drivers are unable to see any point behind the truck directly and are dependent on the CCTV system to provide them with a view of both the above visual targets. While approaching vehicles can normally be seen reliably, the system provides only a partial view of the area directly behind the vehicle. In particular, the camera fails to cover the two zones immediately behind the two rear wheels as indicated on the sight line plot (Figure E).
Major Postural Changes: None
68
Visual Environment: Sunlight encroaching into the cab of the vehicle can obliterate the image on the TV screen.
Operators Comments Drivers considered that an appropriately designed sensing device to enable them to detect the presence of people stationed directly behind the rear wheels when reversing.
Potential Hazards The primary hazard insofar as this investigation is concerned involves the potential for people being struck and/or run over by the vehicle. Of particular concern are those people who have escaped detection because they are obscured from drivers when stationed in the following areas. 1. An area directly in front of the truck extending from the bumper bar to a line approximately 4.5m ahead of the truck. 2. An area to left extending from the side of the truck to a line approximately 2.5m away. The area extends from the above 4.5m line to the
centre-line of the axis of the rear wheels. 3. An area to right extending from the side of the truck to a line approximately 10m away. The area extends from the above 4.5m line to the
centre-line of the axis of the rear wheels. 4. Areas directly behind the two sets of rear wheels extending for a distance of approximately 3m to the rear of the truck.
69
Figure A. Vehicle Dimensions
Figure B. Off-side mirrors
70
Figure C - Near-side mirrors
Figure D
71
Figure E
1.5m
2.2m 3.0m
6.0m
9.5m13.0
4.5m
6.0m
3.0m
People totally obscured in this area.
Camera View
Left
Mirr
or V
iew
Rig
ht M
irror
Vie
w
5th percentile man obscured
crouching man obscured
Clear view of ground
72
Figure F
Figure G
73
Figure H
Figure I
74
Figure J
Figure K
75
A1.3 Forklift Truck Assessment There is a vast range of industrial applications and environments in which forklift trucks are used routinely. Given that it was impractical to obtain a representative sample of such a diverse range of applications, the approach adopted was to conduct an assessment of a typical, relatively simple and straightforward warehousing operation. This was done on the basis that any visual limitations, and the potential hazards that arise, in such a situation are likely to be common to almost all industrial applications involving the use of forklift trucks. The operation observed involved loading and unloading palletised loads to and from heavy goods vehicles within a warehousing and distribution operation. Standard 1,000 by 1,200mm (40" by 48") wooden pallets were used. These carried stacks of tinned goods that were shrunk wrapped to form loads that ranged in height from 1220 to 1530mm. Typically, two pallets were moved in a side by side configuration during each operational cycle. The basic dimensions of the counterbalance forklift truck observed are shown below
1400
2110
1700
Load Height range 1220 to 1530 Max lift 5000
1200
5th percentile eye height
76
Hierarchical Task Description
Task Elements Visual Targets Travel unloaded to collect pallets from stock area VT1 Pedestrians and obstructions to front of truck
Travel across junctions, aisle to right VT2 Pedestrians emerging from right Travel across junctions, aisle to left VT3 Pedestrians emerging from left Turn right into aisle VT1 and VT2
VT4 Clearance from right side of truck to near corner of junction VT5 Clearance of left forks from far side of aisle
Turn left into aisle VT1 and VT3 VT6 Clearance from left side of truck to near corner of junction VT7 Clearance of right forks from far side of aisle
Collect palletised loads Turn towards required stack VT4 and 5 or VT6 and 7 depending on direction of turn Insert forks under load VT8 Clearance/entry position of forks in pallet entry space. Lift load, VT9 Clearance from adjacent stacks Reverse, lower and tilt load VT9
VT10 Pedestrians, obstructions and clearance to rear of truck. Turn in aisle space (to either left or right) VT11 Clearance between far corner of the load and aisle stacks.
Travel with load to vehicle park The same visual targets as those described for unloaded travelling apply with the exception that load clearance rather than fork clearance needs to be observed.
Load vehicle Lift load VT12 Height of pallet base in relation to vehicle height Position load on vehicle VT13 Side of load in relation to vehicle or previously loaded pallets
VT14 Clearance between front face of mast and vehicle side. Return mast to vertical position and lower forks VT8
VT15 Clearance between top of mast and vehicle structure Reverse to clear forks from load and vehicle. VT10
77
The visual targets identified above were grouped into the following visual attention areas: Looking directly forwards Visual Targets: VT1 Pedestrians and obstructions in front of truck
VT8 Clearance/entry position of forks into pallet entry space. VT14 Clearance between front face of mast and vehicle side. VT15 Clearance between top of mast and vehicle structure
Operational Blind Spots:
The driver’s direct forward vision is obscured during the load handling elements of the operational cycle.
Major Postural Changes:
Non observed
Looking towards the left and right front corners of load/forks Visual Targets: VT2 & 3 Pedestrians emerging from right or left aisles
VT5 & 7 Clearance of forks or load from far side of aisle VT9 Clearance between load and adjacent stacks VT11 Clearance between far corner of the load and stacks. VT12 Height of pallet base in relation to vehicle height VT13 Side of load in relation to vehicle or loaded pallets
Operational Blind Spots:
As with direct forward vision, the driver’s view of pedestrians is obscured during the load handling elements of the operational cycle
Major Postural Changes:
Drivers were observer to lean to one side to gain a better view of the load clearance position.
Looking towards the sides and rear of the truck Visual Targets: VT4 & 6 Clearance from side of truck to near corner of junction
VT10 Pedestrians, obstructions and clearance to rear.
Operational Blind Spots:
No significant operational blind spots were observed or reported.
Major Postural Changes:
Drivers need to partially turn on their seats and twist both trunk and neck to obtain a clear view to the rear of the truck.
78
Potential Hazards The primary hazard insofar as this investigation is concerned involves the potential for pedestrians being struck by the vehicle. In terms of restrictions to the driver’s line of sight, it is the restricted forward visibility created by the load being carried that presents the most significant risk.
The driver’s forward visibility is determined largely by the overall size of the load being carried. Tilting the load backwards by 15° effectively raises the leading edge of the load by 570 mm. Assuming a pallet height of 150mm and a nominal travelling ground clearance of 100mm results in an effective overall travelling load height that ranges from 2040 to 2350mm.
The range of standing heights for pedestrians wearing boots and a helmet is shown in the table below.
Percentiles
5th 50th 95th
Height (mm) 1680 1790 1900
In cases where the top of the load being carried is at, or above, the level of
the driver's eye, all pedestrians directly in front of the vehicle will be totally obscured. With the lowest height load observed and a "short", 5th percentile eye-height driver, the top of a "short", 5th percentile height, pedestrian's helmet would be just visible at 17.8m. Alternatively, a "tall", 95th percentile, pedestrian would be just visible at 8.7m
79
APPENDIX 2: US NIOSH AND NAUTILUS LTD. PERSONNEL DETECTION SYSTEMS US NIOSH ‘Hasard’ System Basically, the Hasard system is a two-part system composed of a transmitter and one or more receivers, depending on need. The Hasard transmitter is designed to be installed on-board a continuous miner. The Hasard receiver is designed to be worn by the continuous miner operator, the continuous miner operator helper, or installed in the continuous miner remote control pendant. The Hasard transmitter consists of a low frequency current source whose outputs are split into several channels with independently adjustable amplitudes. Each channel is connected to a wire loop antenna. Adjustments to the placement, shape, and current amplitude of each loop (Figure 1) allow tailoring of the magnetic field to conform to the shape and size of the danger zone for that part of the continuous miner. When all current loops are located and adjusted properly, the danger zones for the machine are established and are approximated by a surface of constant magnetic field. The Hasard receiver is an omni-directional (direction independent) magnetic field strength meter. Multiple antennae within the pedestrian receiver unit detect the field in each of three orthogonal axes; electronics amplifies and filters the signal and then converts it to a DC voltage level. This signal level is compared to thresholds which define the field strengths which represent areas of safety, caution, and danger. Each threshold can be adjusted, which affects the size (or the distance from the continuous miner) of the ‘danger’ and ‘caution’ zones for the entire machine. The size of the protection zone for a specific location is adjusted by adjusting the transmitter current to the appropriate current loop. When a ‘warning’ or ‘danger’ lever is triggered, the receiver alerts the operator. It can also automatically disable continuous miner functions, such as tramming, or conveyor swing. The prototype receiver has a variety of output indicators (e.g., visual, audible, and/or vibration). The indicators could be mounted inside the operator’s hard hat or on the continuous miner itself. Status of Hasard System A prototype Hasard system has been constructed and is being used to define critical design parameters. The Hasard system must function in the presence of electromagnetic noise produced by the continuous miner electrical motors. An analysis of the electrical noise spectrum generated by a collection of continuous miners, performing a variety of tasks, showed that there was a heavy concentration of electrical noise below 15 Khz. Above 15 Khz, the noise gradually decreased. The prototype was originally set to operate at a frequency of 30 Khz but to minimise interference problems, frequency of operation was changed to 60 Khz. This increases field distortion effects slightly. Underground trials are planned for the system. The current equipment is considered to require re-engineering if it is to be manufactured and enter service in the US coal mining industry. Ruff [2000] comments on the need to complete development of the worker safety unit. NIOSH filed for a US patent for the technique and was granted a patent in August 1999 (US Patent No. 5,939, 986 assigned to the US Department of Energy). The patent is unusual in that it makes no reference to the detection of the electromagnetic field in three components, considered to be a key aspect of the equipment’s function.
80
Further US patent searching revealed that the principle of proximity detection using mutually orthogonally polarised magnetic fields has already been assigned to the Harris Corporation [1994]. Nautilus ‘Buddy’ System The Nautilus ‘Buddy’ system functions in an analogous fashion to the NIOSH Hasard system. There are differences however, for example, the antenna array is generally constrained to be a smaller, single machine-mounted loop. There is no design intention, as far as can be ascertained, for the field to be ‘shaped’ around the machine sections. A single antenna is mounted at the front of the haul truck, close to the front or on the body of the load-haul-dump truck (Figure 2). The field is claimed to offer reasonable spherical coverage and has been tested on 3 different sizes of truck from 50 to 320 ton capacity. The system’s pedestrian unit monitors the RF field and calculates the distance between the antenna array and the pedestrian unit. This unit is carried on the user’s belt. The pedestrian unit employs 3 field strength detectors. Each one detects the generated field in an orthogonal plane (x, y, and z). This ensures that the attitude of the operator with respect to the truck will not affect the detection of the RF field. The calculated distance is shown on the pedestrian unit display and if the truck is too close, an audible alarm on the pedestrian unit alerts the user. The audible alarm increases in frequency as the truck approaches the pedestrian. This information is also sent to the truck’s cab by radio, to be displayed as a warning message to the driver on a monitor unit (Figure 3). These messages include the name of the pedestrian (target) and how far away the pedestrian is away from the truck. The Buddy system, because it uses low frequency field detection, will detect a person who is within a small vehicle and therefore both the person and the vehicle should be protected. If the target is a small vehicle instead of a person, the truck driver’s display will show the vehicle description and how far away it is. To ensure truck drivers are only warned when a pedestrian is exposed, there is a ‘bypass’ button on the pedestrian unit. If the pedestrian is not in any danger, for example standing in a recessed shelter, holding down the ‘bypass’ button until the truck is out of range (>20m away) allows the vehicle’s progress not to be interrupted. As a comment, the fitment of a bypass function on a safety critical system should not be implemented without extensive risk evaluation and consultation with mine safety authorities to strictly control its conditions for use. Status of Buddy System The development of the Buddy system has recently been completed and the system is being targeted at mine operators in Canada. At this point it is unclear whether an intrinsically safe version is planned or technically feasible. The engineering of the product appears to be commensurate with commercial mining electronic systems and as such should offer acceptable reliability. Applications in surface industrial environments will be sensitive to cost of implementation across the vehicle fleet and workforce. It is not known whether Nautilus Ltd. has applied for proprietary protection concerning the system design.
81
Figure 1: NIOSH HASARD System Overview
Figure 2: Mounting Arrangements for Nautilus ‘Buddy’ System
Figure 3: Components of the Nautilus ‘Buddy’ System
83
APPENDIX 3: EXPLANATION OF THE PROPAGATION THAT OCCURS AT VERY LOW FREQUENCIES
Inductive propagation requires an understanding of slightly different concepts to radio propagation. A note on inductive propagation is provided as a background to understanding the technical and engineering requirements of the worker safety system.
By passing a current through a loop of wire, a magnetic field is generated. If the current is varied, then the field varies in sympathy. If the magnetic field lines are arranged to interact with a second coil, then the varying field will, in accordance with Faraday's law of induction, produce a voltage at the terminals of the coil. The generated magnetic field depends on the number of turns of wire, the current and the area of the primary loop, i.e., NIA. The signal induced in the secondary coil (receiving loop) depends on how much of the flux is captured, suggesting that the physical construction and dimensions of the loop will be the predominant factor in determining range and power consumption of the system.
If the current varies only slowly then one can imagine the field lines collapsing to zero and building up again in step with the current. Now suppose that the field is oscillated very quickly. Since the field lines can only travel at the speed of light, the lines that are far away do not have time to return to the transmitter coil. Instead they detach themselves and are radiated away. The transition between inductive and radiated fields is illustrated in Figure 1.
Close to the transmitter the field lines have the familiar 'bar magnet' shape, with the strength of the field reducing proportionally to the inverse cube (1/r3) of the distance (r) from the transmitter. Beyond this region the field lines take on a circular shape as they are radiated from the transmitter. To a first approximation the critical 'detachment' is ~λ/4 (or λ/2π), since at this distance it would take a time equal to half a cycle of oscillation for the field lines to collapse and reform in anti-phase.
It is the property of an electromagnetic field that a time-varying magnetic field coexists with a time-varying electric field. The electric field lines are not shown in the plot, but are concentric circles in the same plane as the inductive loop. In free space in the near region of a pulsating current loop, the electric field strength reduces at a rate of 1/r2 and in the far 'detaching' region it and the magnetic field, behave like an electromagnetic field, reducing at 1/r with distance from the source. The fields in the pulsating region, near to the source, are called the electrostatic (electric) field and the induction (magnetic) field respectively. Together they are called the near-field. Conversely the radiating/detaching region is termed the far-field. Electric and magnetic near-fields pulsate 90° out of phase, whereas the far field components are in phase. This means that in the near-field the energy simply pulsates back and forth, but in the far-field there is a power flow. For this reason the far field is known as the radiation field, and it is this field which is normally considered as radio. For energy (information) to flow in the near-field region it must be coupled into a second coil arrangement. Efficient induction of the signal depends on the rate at which the magnetic field fluctuates, favouring higher frequencies. However, the coupling advantage of using higher frequencies is negated by increasing path losses (attenuation) and field distortion from the influence of local metallic infrastructure. Fundamentally, the range of an inductive transmitter is determined by its operational
84
signal-to-noise ratio (S/N). The background electromagnetic noise, in a given situation, cannot normally be greatly influenced. Therefore, maintaining a received signal strength above the background noise is normally essential. Given that the power budget of the transmitter is also a critical factor in a practical system, then all aspects of signal generation, attenuation and reception become important. The efficiency of signal generation and reception is mainly influenced by technology and design ingenuity. The basic physics of inductive and radio propagation through different strata/materials has been studied, albeit by few key researchers worldwide. Models exist for predicting the signal attenuation in different conductive grounds with both homogeneous and heterogeneous structures. The magnetic field strength, H from a magnetic dipole antenna has a complex relationship with distance from the source. The primary magnetic field begins at the antenna and induces electric field lines in space. The inductive or electrostatic coupling mechanisms are active up to radial distance of λ/2π, representing a range limit for inductively coupled tag systems. This distance corresponds to 353m and 3.5m for systems with operating frequencies of 135kHz and 13.56MHz respectively (common tag operating frequencies). Away from the extreme near-field, the field strength path of a magnetic antenna along the coil x axis follows the relationship 1/d3 until it approaches distance λ/2π. In the transitional region the field attenuation characteristic flattens out and decreases thereafter according to the relationship 1/d as distance increases, essentially in response to the geometric dispersion of the field. The theoretical attenuation rates in the near field and far field zone are 60dB per decade and 20dB per decade respectively. Figure 2 indicates the magnetic field strength H in the transition from near to far field at a frequency of 13.56 MHz. It is evident that the operation of an inductive system at extended range (say >10m) cannot be accomplished with transponders from the popular 13.56 MHz frequency band. Equally, the lower the frequency, the greater the amplitude and disturbance from electromagnetic noise.
85
Figure 1: Graphical Representation of Electromagnetic Propagation
Figure 2: H-Field Attenuation Characteristic
86
APPENDIX 4: HUMAN EXPOSURE TO LOW POWER NON-IONISING ELECTROMAGNETIC FIELDS In any further development of an electromagnetic transmitter based safety system, compliance with permissible exposure levels will need to be considered as a design objective. Details of exposure criteria and standards are provided as follows. Classes of Guidance In regard to the need to specify exposure limits for time-varying electromagnetic fields, the UK NRPB has issued guidelines [NRBP 1993]. Further to this, the ICNIRP, an independent international commission has published revised guidelines and two sets of limits, one for occupational personnel (workers) and one for the general public. The public exposure limits are approximately five times lower than the occupational limits. In general, risk evaluation in this area is very difficult due to the lack of evidence at low exposure levels. Most standards organisations promote acceptance of the Precautionary principle together with the ALARA (As Low As Reasonably Achievable) principle. The specifications relating to exposure provided in the ICNIRP Guidelines (1998) distinguish two classes of guidance: • Basic restrictions - specifying restrictions on exposure to electric, magnetic and
electromagnetic fields based upon known and established adverse effects and specified according to frequency of the time-varying field. The physical parameters used to specify basic restrictions are current density (J), specific absorption rate (SAR) and power density (S).
• Reference levels - levels specified to provide a practical basis for assessing
exposure and the likelihood of the basic restrictions being exceeded. The quantitative bases for reference levels are field parameters electric (E) and magnetic field (H) strengths, magnetic flux density (B), power density (s) and current levels in the case of contact effects.
Where measured or calculated values for exposures are derived for a given situation they can be compared with specified reference levels and conclusions drawn in respect of basic restrictions. Compliance with reference levels also ensures compliance with the basic restrictions. Where measured or calculated values are seen to exceed the reference level it is necessary to determine if the basic restrictions have been exceeded. It does not necessarily follow that if the reference levels are exceeded the basic restrictions are also exceeded. Dosimetric Parameters Dosimetric parameters are used to quantify exposure conditions, the principal dosimetric parameters being: • Current density (J), generally used in quantifying exposure conditions up to
frequencies of 10 MHz, and measured in Amperes per square metre (Am-2).
87
• Specific energy absorption rate (SAR), for measurements between 100kHz and 10 GHz, and measured in Watts per kilogram (Wkg-1).
• Specific energy absorption (SA) for measurements of pulsed fields in the
frequency range 300 MHz to 10GHz, and measured in Joules per kilogram (Jkg-1).
• Power density (S) for measurements in the frequency range 10 to 300 GHz and
measured in Watts per square metre (Wm-2). Exposure time is a further consideration in respect of the effects that time-varying fields may have. Field parameters used in specifying exposure limits are: • Electric field strength (E), measured in Volts per metre (Vm-1) • Magnetic field strength (H), measured in Amperes per metre (Am-1) • Magnetic flux density (B), measured in Tesla (T) and related to H by the
expression B = µH, where µ is the permeability, measured in Henries per metre (Hm-1).
The ICNIRP Guidelines (1998), abstracted as reference levels (root mean squared values) for general public exposure within the frequency range 3kHz to 300GHz are reproduced below to illustrate the field magnitudes involved.
The uncertainties associated with low level exposure non-thermal effects is leading to adoption of more stringent standards. The European Commission is proposing adoption of the following maximum permissible exposure levels over the next 10 years: • 1Hz – 2kHz frequency range, magnetic flux density 0.25 µT and electric field
strength of 25 Vm-1. • 2kHz – 400kHz frequency range, magnetic flux density 0.03 µT and electric field
strength of 2.5 Vm-1. • 400kHz – 300GHz frequency range, magnetic flux density 0.01 µT and electric
field strength of 1 Vm-1. In the United States the IEEE Standards Coordinating Committee 28 on Non-Ionising Radiation Hazards sponsored the following standard which has been approved by the US National Standards Institute. The standard set guidelines for human exposure to RF radiation in a variety of conditions.
Frequency Range
E-field (Vm-1) H-Field (Am-1) B-field (µµµµT) Equivalent plane wave power density S (Wm-2)
References on EM exposure standards Bailey WH et al, [1997], Summary and evaluation of guidelines for occupational exposure to power frequency electric and magnetic fields. Health Physics 73:433-453 (1997). Bowman JD, Gailey PD, Gillette L, Lotz WG (eds.), [1997], Proceedings of a Joint NIOSH/DOE Workshop on EMF Exposure Assessment and Epidemiology: Hypotheses, Metrics, and Measurements. Oak Ridge National Laboratories, Oak Ridge, TN (1997). BSI document (1999), Considerations for the evaluation of human exposure to electromagnetic fields (EMFs) from mobile telecommunication equipment (MTh) in the frequency range 30MHz - 6GHz. ICNIRP (1998) Guidelines for limiting exposure to time-varying electric, magnetic and electromagnetic fields (up to 300 GHz), Health Physics, April 1998, volume 74, number 4. IEEE C95.1-1991 - IEEE Standard for Safety Levels with Respect to Human Exposure to Radio Frequency Electromagnetic Fields, 3kHz to 300 GHz Morgan MG, Nair I, [1992], Alternative functional relationships between ELF field exposure and possible health effects: Report on an expert workshop. Bioelectromagnetics, 13:335-350 (1992). NRPB (1993) Board statement on restrictions on human exposure to static and time varying electromagnetic fields and radiation, Doc. NRPB, volume 4, number 5. NRPB Response Statement (1998) National and International Exposure Standards for Electric and Magnetic Fields.
89
APPENDIX 5: RFID SYSTEMS RFID stands for radio frequency identification. It is a widely varied collection of technologies for various applications, ranging from the high speed reading of railway containers to applications in retail that can be regarded as a potential successor to the bar-coding technologies in use today. RFID is based around radio or electromagnetic propagation. This has the ability to allow energy to penetrate certain goods and read a tag that is not visible, thereby to identify those goods remotely, either in the form of an identity code or more simply to detect that something is present (Electronic Article Surveillance, EAS). Different operating frequencies result in different reading ranges and properties of the detection system. Commonly available tags have an operating frequency in the range from 60kHz to 5.8GHz depending on application. Reductions in equipment prices, along with the introduction of ISO standards and new technologies is projected to increase revenues in the European RFID market from $664 million in 1999 to $2.0 billion in 2006 [Frost & Sullivan 2000]. RFID Carrier Frequencies In selecting from commercial tag systems, three frequency ranges distinguish RFID systems; low, intermediate and high. The following table summarises these three frequency ranges, along with the typical system characteristics and examples of major areas of application.
RFID Frequency Ranges and Applications
Frequency Band Characteristics Typical Applications Low 100-500 kHz
Short to medium read range Inexpensive Low reading speed
Access control Animal identification Inventory control
Intermediate 10-15 MHz
Short to medium read range Potentially inexpensive Medium reading speed
Access control Smart cards
High 850-950 MHz 2.4-5.8 GHz
Long read range High reading speed Line of sight required Expensive
Railroad car monitoring Toll collection systems
The related system performance classification of RFID systems is shown graphically in Figure 1. There are eight frequency band assignments in use for RFID applications. The applications using these frequency bands are listed below. Not all countries have access to the frequency assignments listed.
90
Frequency assignment Applications and comments Less than 135kHz Wide range of products, wide range of applications,
including animal tagging, access control and track and traceability. Transponder systems in this band do not need to be licensed in most countries.
1.95 MHz, 3.25MHz, 4.75MHz, and 8.2MHz
Electronic article surveillance (EAS) systems used in retail stores
Approx. 13 MHz, 13.56MHz EAS systems and ISM (Industrial, Scientific and Medical)
Approx. 27 MHz ISM applications 430-460 MHz ISM applications 902-916 MHz ISM applications. USA uses include railcar and toll
road applications. 918-926 MHz RFID (Australia) ERP less than 1 Watt 2350 - 2450 MHz ISM band. IEEE 802.11 recognises band as
acceptable for RF communications; spread spectrum and narrow band systems. Future use by ‘Bluetooth’ RF technologies.
5400 - 6800 MHz Band allocated for future use. Key Aspects of RFID Systems Passive and Active. RF tags communicate with the interrogation units via radio frequency radiation. The electrical power to drive the tag’s communication capability can either be derived from the incident radiation arriving from the interrogation unit or by an electrical supply source (e.g., a battery) located on the tag. Tags which derive their transmitting power from the radiation impinging on the tag are known as passive devices. They either use the magnetic field from the interrogator’s signal or the electric field. If they use the former, then they are known as passive inductive tags, which use low frequency excitation fields and have very short communication distances. When the electric field is used to power up the tag, these devices are referred to as backscatter or reflective tags and usually utilize higher frequencies and achieve longer communication distances. When the tag has its own power source for transmission, the tags are referred to as active tags and can usually achieve significantly greater communication distances. Figures 2, 3 and 4 show some of the essential features and differentiation of RFID types. There are a number of other parameters which must be taken into account. Range. This is specified as the effective maximum distance over which the tag and interrogator can successfully communicate. Line-of-Sight. In order for any communication to occur, a signal transmitted from the interrogator or the tag must reach the other device. The amount of radiation (and its phase) which reaches the device is very important. If a passive device is being used, sufficient radiation must reach a tag so that the tag can not only interpret the information content of the signal, but also receive sufficient power for signal transmission of the tag back to the interrogator. Therefore, passive devices usually have a significant degradation in their range when they are not in the direct line of sight of the interrogator, since they may not receive enough RF radiation to allow for
91
a successful re-transmission of RF radiation. Active tags are more non-line-of-sight tolerant since they only need receive enough radiation to allow for the incoming signal to be successfully interpreted. They then re-transmit using their on-board power supply. Multiple Tag Read Capability. It is often necessary to identify all tags in a given area. This can always be accomplished if one tag at a time is placed in the RF field of the interrogator. However, if the tags are randomly spread out over an area, it is desirable for the interrogator to transmit a command over the entire area (omni-directional signal transmission) requesting the identity of all tags. If all tags were to simultaneously respond to that command then the various RF signals could interfere with each other. This ‘collision’ situation is shown graphically in Figure 5. Multiple tag reading capability is usually achieved by randomising the response of each tag into different time slots or having each tag respond at a slightly different non-interfering frequency. Probability of Reading Reader field pattern, tag orientation and presentation and the number of tags present all have an influence on the overall probability of successful detection.
Reader Field Pattern The electromagnetic field in the reading volume will generally not be consistent in intensity or orientation, due to electromagnetic field characteristics and the geometric constraints of the reading volume. Therefore a probability function of tag activation is associated with the variation of magnetic field strength and orientation in the reading volume.
Tag Orientation, Speed and Trajectory A tag will have the greatest reading distance at optimum orientation, and lesser reading distance as a function of sub-optimal orientation. The average reading distance of the tag can be calculated by integrating the reading distance for all orientations by the probability of orientation in the given direction. The reading distance for a stationary tag in the reader field is a function of the field strength and the tag orientation in the field. The probability of reading therefore varies proportional to the field strength and inversely proportional to the distance from the reader. The time the tag is in the reader field also affects probability of reading.
Multiple Tags Depending on the modulation method used in the tag system, the mutual interference between tag signals has a variable effect on whether a valid reading of any tag in the field will take place. Therefore another probability function is whether multiple tags will be in the reading volume simultaneously. Operating power vs frequency The amount of power that can be used in an application is governed by health and safety requirements and also by local radio frequency licensing regulation. For example, the European restriction on effective radiated power (ERP) for RFID systems is 500mW. The licensing regulation is primarily to introduce order between users and communities, whilst the health issues relate to safety of systems in electromagnetic radiation exposure terms. The subject of low power non-ionising electromagnetic field exposure standards is reviewed in Appendix 4.
92
RFID Transmission Mechanisms This section considers the transmission mechanisms within tag systems further. Specific attention is paid to deriving the fundamental limitations pertaining to passive high frequency tag systems since it was conjectured that this could provide a low cost solution if commercial electronic article surveillance systems could be adapted. For an RFID reader/writer to successfully interact with a passive tag, the field from the reader must be sufficient to power the tag, and the signal from the tag must be sufficient to be interpreted by the reader. Several factors influence these two conditions, with distance being the most important. The near-field signal used by most tags drops off as the cube of the distance from the reader (1/r3). This results in the abstraction of power being increasingly difficult with modest increases in range. In practical devices, the field must be strong enough to generate peak voltages of about four volts in the tag antenna to offer sufficient power to drive the tag circuitry. A basic arrangement is shown in Figure 6, although practical realisations are somewhat more complex, an example being given in Figures 7 and 8. The next design challenge is the detection of the damping and undamping of the field when a simple tag responds. The tag does not radiate significant energy back; but rather affects the complex load presented to the reader. Alternately, the tag may act as a non-linear device, returning a sub-harmonic signal. Figures 9 and 10 show the essential details for low frequency and high frequency tags. Versions using piezoelectric surface acoustic wave (rayleigh wave) devices provide a delayed echo response typically 1.5ms after the interrogation request signal has ended. Figures 11 and 12 show a typical generic arrangement. Signals available at the tag can be greatly affected by intervening conducting media. The signal coming from the reader can be absorbed or reflected with the human body absorbing high-frequency far fields more than lower-frequency near fields. Tags operating at 2.4 GHz are particularly susceptible to absorption by water, and therefore these tags are easily blocked by human tissue. Tags operating at 125 KHz and 13.56 MHz are less affected. High-frequency far fields are more easily reflected from metallic and other surfaces, which sometimes acts to mitigate the absorption effect. Metallic infrastructure affects RFID tag performance in ways other than reflection of signals. An antenna in a near-field tag forms an inductor as part of a circuit tuned to the reader's frequency. Conducting metals (including other RFID tags) close to the tag effectively add inductance, lowering the frequency of the tuned circuit. The effect of this frequency shift on system performance depends on tag design. Tags optimised for maximum read range use a highly tuned circuit with greater sensitivity to metallic disturbance. Other tag designs spread their transmission frequencies over a wider frequency range, compensating for the interfering inductance at the expense of maximum read range at the design frequency. The signal and power available from a reader in a given location is an important parameter. Effectively translating the local field into currents and voltages within the RFID tag is the other important issue, where tag size dominates this consideration. The field also has pronounced orientational sensitivity. As a tag rotates in such a field, it reaches maximum power coupling broadly commensurate with maximum coupling with the reader antenna. Power decreases as the tag rotates, reaching a null in an orthogonal axis. Low frequency inductive tags can have pronounced nulls in their response, indicated by Figure 13 . High frequency tags can also display orientational sensitivity and a variation in range.
93
Limitations of passive high frequency tags In examining the possible application of passive tags, there was a need to understand the theoretical limitations of high frequency (microwave) tag technologies. This is briefly reviewed as follows. There are two fundamentally different means of accomplishing far-field RFID in the microwave spectrum. One method, passive backscattering, uses a modified radar to detect changes in the radar cross section of a distant tag. The tag consists of a passive resonant structure and some active means of changing the resonance to encode data. The other method uses an active transponder; the tag reader sends out an interrogation pulse to determine whether any tags are within range. The tag then responds with its ID, transmitted with a low-power microwave transmitter on the tag itself. There are several tradeoffs implicit in the choice of one method or the other. Integration of the Poynting vector across a tag's antenna surface permits the RF power impinging upon the tag to be determined. If we assume an isotropic transmitter, the power density varies inversely with radial distance from the transmitter. In considering a transmitting source that does not radiate equally in all directions, we achieve an effective transmit gain by reducing the antenna's beamwidth. The total radiated power remains the same, but more of it is constrained in the desired direction. When a transmitted signal originating from a non-isotropic source impinges upon a reflecting surface and is detected at the same non-isotropic antenna, it can be shown that the returned signal decreases as the fourth power of the distance to the tag. This represents a fundamental limit for a passive high frequency type tags.
94
Figure 1: System Performance Classification for RFID Systems
Figure 2: Essential Elements of an RFID System
Figure 3: Low Frequency Inductive (Left) and High Frequency Microwave Tag (Right)
95
Figure 4: Differentiation Between RFID Technologies
Figure 5: Illustration of Data Collision Problem of Multiple Transponder Responses
96
Figure 6: Generic Arrangement for Inductively Coupling Power to Transponder
Figure 7: Practical Internal Electronics Arrangement to Abstract Power
Figure 8: Sequence for Charging and Returning Transponder Signal
97
Figure 9: Frequency Dividing Non-Linear Microwave Device
Figure 10: Low Frequency Return Transmission of Inductive Device
Figure 12: Time Delayed RF Response from SAW Device
99
Figure 13: Nulls in Detection Zones for Low Frequency Inductive Transponder Acknowledgement: Full acknowledgement is extended to John Wiley & Sons Limited for the selective reprinting of diagrams from “RFID Handbook”, Finkenzeller, K., 1999, ISBN 0 471 98851 0
Printed and published by the Health and Safety ExecutiveC30 1/98
Printed and published by the Health and Safety ExecutiveC1 07/01