17
Contracts C - 1(17) Entertainment and Media: Markets and Economics Contracts Between Talent and Entertainment Producers Appendix: A-Rod Deal
| Date post: | 23-Dec-2015 |
| Category: |
Documents |
| Upload: | brandon-stanley |
| View: | 218 times |
| Download: | 0 times |

Contracts3:C - 1(17)
Entertainment and Media: Markets and Economics
Contracts Between Talent and Entertainment Producers
Appendix: A-Rod Deal
Contracts3:C - 2(17)
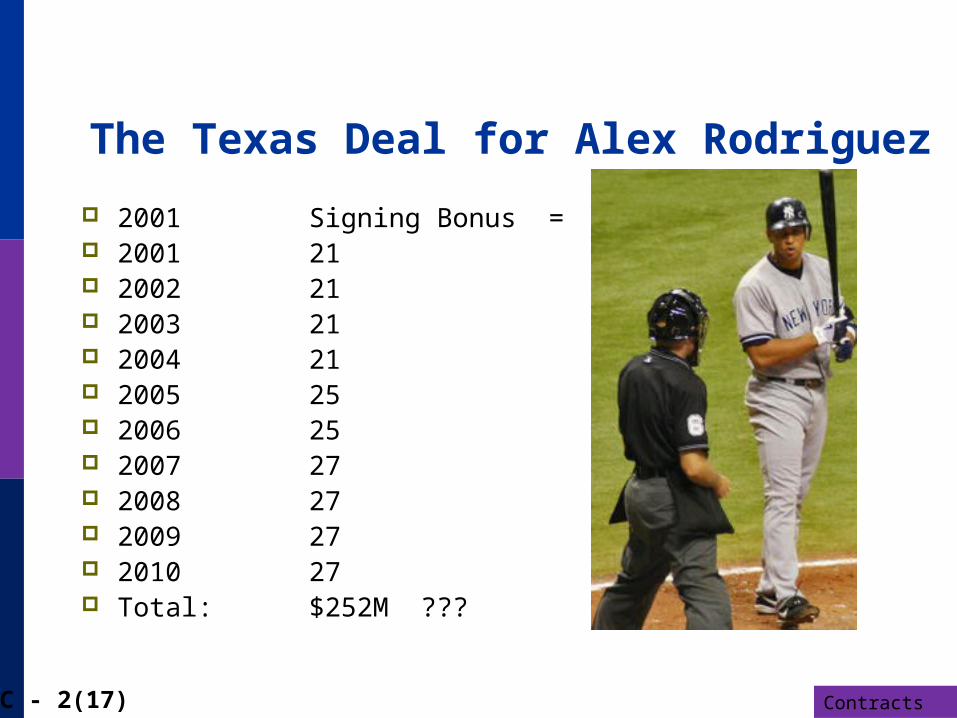
The Texas Deal for Alex Rodriguez
2001 Signing Bonus = 10M 2001 21 2002 21 2003 21 2004 21 2005 25 2006 25 2007 27 2008 27 2009 27 2010 27 Total: $252M ???

Contracts3:C - 3(17)
The Real Deal Year Salary Bonus Deferred Salary 2001 21 2 5 to 2011 2002 21 2 4 to 2012 2003 21 2 3 to 2013 2004 21 2 4 to 2014 2005 25 2 4 to 2015 2006 25 4 to 2016 2007 27 3 to 2017 2008 27 3 to 2018 2009 27 3 to 2019 2010 27 5 to 2020 Deferrals accrue interest of 3% per year.

Contracts3:C - 4(17)
Costs
Insurance: About 10% of the contract per year (Taxes: About 40% of the contract) Some additional costs in revenue sharing revenues from
the league (anticipated, about 17.5% of marginal benefits – uncertain)
Interest on deferred salary - $150,000 in first year, well over $1,000,000 in 2010.
(Reduction) $3M it would cost to have a different shortstop. (Nomar Garciaparra)

Contracts3:C - 5(17)
PDV
Using 8% discount factor Accounting for all costs Roughly $21M to $28M in each year from 2001 to 2010, then the deferred payments from 2010 to 2020
Total costs: About $165 Million in 2001
t 2020
tt 2000
All costs in year tPDV of Costs =
(1 .08)
Discount factor for 10 years out is .46
Discount factor for 20 years out is .21

Contracts3:C - 6(17)
Benefits
More fans in the seats Gate – the major component Parking Merchandise Miscellaneous
Increased chance at playoffs and world series Sponsorships (Loss to revenue sharing) Franchise value

Contracts3:C - 7(17)
How Many New Fans?
Projected 8 more wins per year. What is the relationship between wins and
attendance? Not known precisely Many empirical studies (The Journal of Sports
Economics) My own study…

Contracts3:C - 8(17)
A Dynamic Model for AttendanceAttendance in year t depends on
(1) What happens in year t, X(t) = wins, all stars, rookies, manager changes, etc.
(2) Fan loyalty to the team, Y(t-1) = attendance last year
(3) Random events, ε(t) = breakout stars, bad luck, player injuries, etc.
Y(t)=a+bX(t)+dY(t-1)+ε(t)
Suppose Y(0) = Y0 (Year 0 is 1984; Y(0) = 1984 attendance)
Suppose we fix X(t) at some X* and at 0.
W
hat values does Y(t) take
Y(1985) = a + bX* + cY1984
Y(1986) = a + bX* + c(a + bX* + cY1984)
Y(1987) = a + bX* + c(a + bX* + c(a + bX* + cY1984))
Y(1988) = a + bX* + c(a + bX* + c(a + bX* + c(a + bX* + cY1984)))
Reinterpretation:
Y(t) depends on everything in the history, but the most recent influences
are the most important.

Contracts3:C - 9(17)
A Dynamic Model for AttendanceHow does the path of the team's attendance change when something
in X* changes. For example, if we assumed the team had 3 all stars
on it, how would everything be different if we had 4 all stars every
2 t-1 2 t-1 t
year
instead?
How would Texas' attendance change if they won 8 more games every year?
Y(t) = a(1+c+c ... c ) bX*(1+c+c ... c )+c Y1984
a bSuppose 0 < c < 1. Y(later year) = + X*.
1-c 1-cdY(later y
ear) b= (This is per game)
dX * 1-c

Contracts3:C - 10(17)
Baseball Data 31 teams, 17 years (1985-2001; fewer years for 6 teams) Winning percentage: Wins = 162 * percentage Rank Average attendance. Attendance = 81*Average Average team salary Number of all stars Manager years of experience Percent of team that is rookies Lineup changes Mean player experience Dummy variable for change in manager

Contracts3:C - 11(17)
Baseball Data

Contracts3:C - 12(17)
The Regression Model to Translate Wins into Attendance
team
1 2
3
Attendance(i,t) = α + γAttendance(i,t-1)
+ β Wins(i,t) + β Wins(i,t-1)
+ All_Stars(i,t)
4
5
6
+ Manager Experience(i,t)
+ Pct_Rookies(i,t)
+ Lineup_Changes(i,t)
7 + Change_Manager(i,t)
+ (i,t)
Loyalty effect
i = team, t = year

Contracts3:C - 13(17)

Contracts3:C - 14(17)
Translate Attendance into RevenueMarginal Value of One Win
Using the formula for a dynamic equilibrium
dAttendance b[Wins(t)] + b[Wins(t-1)] + b[Allstars(t)] =
d(Games Won + Allstar Added) 1 - c[Attendance(t-1)]
9563 + 2299.92 + 17090.5
= (1 - .54572)
= 63,734 (Fans per Win + All star effect)

Contracts3:C - 15(17)
Marginal Value of an A Rod 8 games * 63,734 fans = 509,878 fans 509,878 fans *
$18 per ticket $2.50 parking etc. $1.80 stuff (hats, bobble head dolls,…)
$11.3 Million per year !!!!! It’s not close. (Marginal cost is at least $16.5M / year)
Increased probability of reaching playoffs times payoff of reaching 7.5% for League Championship * 10M 3.75% for World Series * 10M Total, about $1,000,000 (if they do it every year!!)

Contracts3:C - 16(17)

Contracts3:C - 17(17)
The IPN Player
A-Rod and Yankees – The Iconic Performance Network Player Attendance rose to 4M in 2005,
4.3M in 2007 MVP in 2005 and 2007 Huge growth in the YES network Seemed certain to break Bonds’
HR record (Asterisk?) New deal: $275M over 10 years
Chicago Cubs offer included team ownership.
Drug Problems probably derailed this career path.


![Cyber Security for Smart Grid Devices - TCIPG · Applications Symposium2008 ] Optimal Contracts for Wind Power Producers in Electricity Markets (Poolla) [CDC 2010] Renewable integration](https://static.documents.pub/doc/80x56/5f05517a7e708231d4125ec8/cyber-security-for-smart-grid-devices-tcipg-applications-symposium2008-optimal.jpg)


