31
Contractual Savings and Financial Markets Alberto R. Musalem, Gregorio Impavido and Thierry Tressel Financial Sector Development Department Financial Sector Vice Presidency The World Bank
| Date post: | 23-Dec-2015 |
| Category: |
Documents |
| Upload: | jeffry-anthony |
| View: | 219 times |
| Download: | 3 times |

Contractual Savings and
Financial MarketsAlberto R. Musalem, Gregorio Impavido and Thierry TresselFinancial Sector Development DepartmentFinancial Sector Vice PresidencyThe World Bank
2
Definition and Importance of Contractual Savings
Funded pensions plans: accumulation period Annuities: pensions pay out Life insurance Funded unemployment benefits, gratuity, end of
service indemnity Other contingencies - down payment for a house,
education, weddings, funerals Supply long term savings

3
Financial assets of contractual savings, selected countriesCountries 1970 1980 1990 1993 1998Switzerland 51.00 70.00 88.51 106.82 131.01 /1
life 32.29 39.81 49.44
pension 56.22 67.01 81.57
United Kingdom 43.00 38.81 86.91 137.36 167.85life 17.77 36.87 65.22 87.79
pension 21.04 50.04 72.14 80.06
The Netherlands 45.00 66.90 108.11 130.46 166.45life 21.13 36.06 47.25 60.34
pension 45.77 72.05 83.21 106.11
United States 40.00 43.01 69.20 82.07 113.59life 17.72 25.85 31.10 31.85
pension 25.29 43.35 50.97 81.74
Chile 1.00 29.28 45.61 54.12 /2life 5.59 8.60 12.13
pension 23.69 37.01 41.99
South Africa 40.00 39.27 78.13 111.87 109.31life 17.20 43.94 72.25 63.49
pension 22.07 34.19 39.62 45.82
Malaysia* 18.00 20.08 47.18 50.25 59.82life 3.26 7.02 9.04 9.17
pension 16.82 40.16 41.21 50.65
Singapore* 17.00 41.00 115.13 102.39 116.58life 8.44 12.00 14.36
pension 106.69 90.39 102.22
Notes: * Prior to 1990, the data do not include the funds invested directly by individual workers in housing and other approved assets.
/ 1 1996; 2/ 1997.
Source: 1970 data from Davis (1995) and national central banks, as quoted by Vittas (1998); all other data from World Bank database
and OECD 2000 Institutional Investors Statistical Yearbook
4
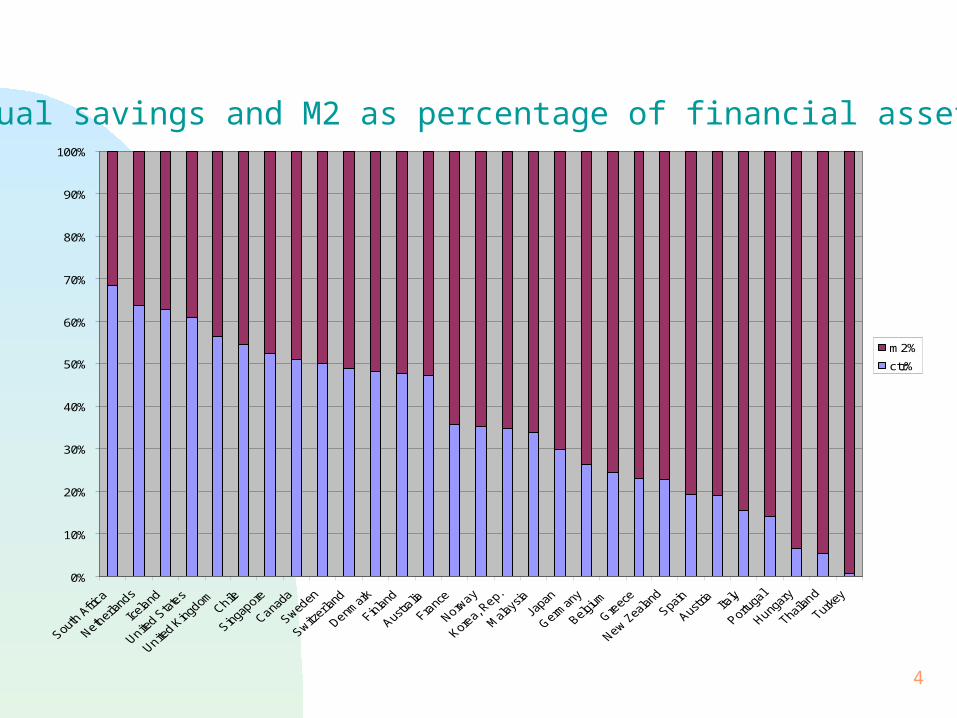
Contractual savings and M2 as percentage of financial assets (1996)
0%
10%
20%
30%
40%
50%
60%
70%
80%
90%
100%
m2%
ctr%

5
CONTRACTUAL SAVINGS % OF CAPITAL MARKETS (STOCKS AND BONDS) Comparing Two Years During the 1990s
0.00%
20.00%
40.00%
60.00%
80.00%
100.00%
120.00%
6
Financial Market Effects
Increase demand for shares and bonds, market capitalization and volume traded: increase depth and liquidity
Increase demand for long term bonds Increase supply of long term loans Improve regulations and transparency Foster financial innovation, competition and
efficiency Improve corporate governance
7
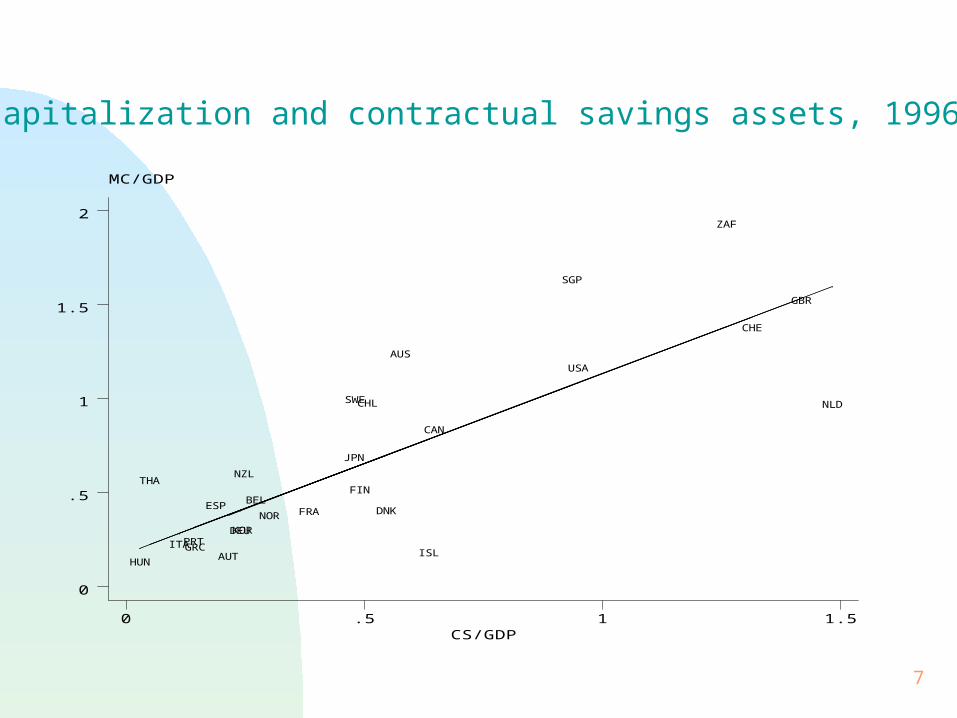
Market capitalization and contractual savings assets, 1996 (% GDP)
MC/GDP
CS/GDP0 .5 1 1.5
0
.5
1
1.5
2
AUS
AUT
BEL
CAN
CHE
CHL
DEU
DNKESPFIN
FRA
GBR
GRCHUN
ISLITA
JPN
KOR
NLD
NOR
NZL
PRT
SGP
SWE
THA
USA
ZAF
8
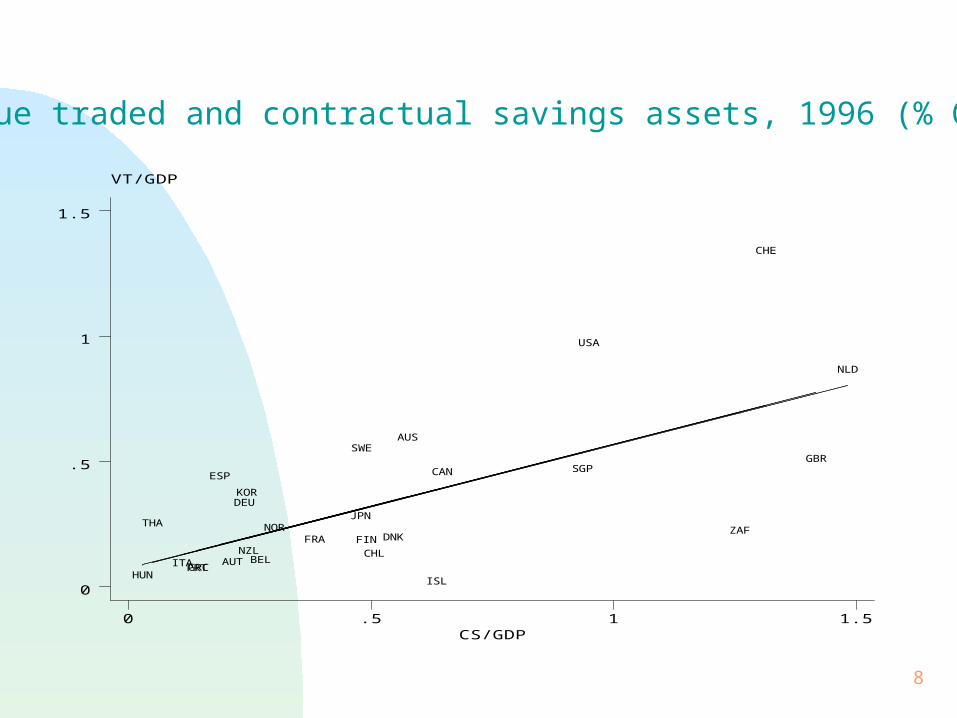
Value traded and contractual savings assets, 1996 (% GDP)
VT/GDP
CS/GDP0 .5 1 1.5
0
.5
1
1.5
AUS
AUTBEL
CAN
CHE
CHL
DEU
DNK
ESP
FINFRA
GBR
GRCHUN ISL
ITA
JPN
KOR
NLD
NOR
NZL
PRT
SGP
SWE
THA
USA
ZAF
9
Causality
In countries with developed capital markets, direction of causality between contractual savings and either market capitalization or value traded is not clear.
In countries with underdeveloped capital markets, either contractual savings causes market capitalization and value traded, or causality runs both ways.
In developing countries, pension funds cause market capitalization while life and non-life insurance cause value traded.
In Malaysia and Singapore there is no causality in either way between institutions and mkt capitalization or value traded.
10
Market Capitalization Estimator: Error Components 2 Stage Least Square
(EC2SLS), N=281, 26 unbalanced panels (21 OECD and 5 non-OECD countries, 1975-97)
Positive impact: contractual savings, non-life ins., value traded, real return on stocks
Negative Impact: real return on money, real interest rate, book reserves, stock price index volatility
Step dummy: developing countries with positive coefficient Endogenous variables: asset returns Exogenous variables: all other Diagnostics: various specification tests passed
11
Value Traded Estimator: EC2SLS, N=233, 26 unbalanced panels (21
OECD and 5 non-OECD countries, 1975-97) Positive impact: contractual savings share portfolio, non-
life insurance share portfolio, real return on money Negative impact: real interest rate Step dummy: developing countries with positive coefficient Diagnostics: various specification tests passed

12
National Saving Effects
Mandatory plan and credit constraints increase household saving but watch welfare effects
Non-captive funding for public sector promotes its saving
Significant shift to funding promotes saving Transition cost financed by cutting the non-pension
public sector deficit increases Government saving System coverage and retirement ages are increased Uncertain effect from voluntary plan (tax incentive)
13
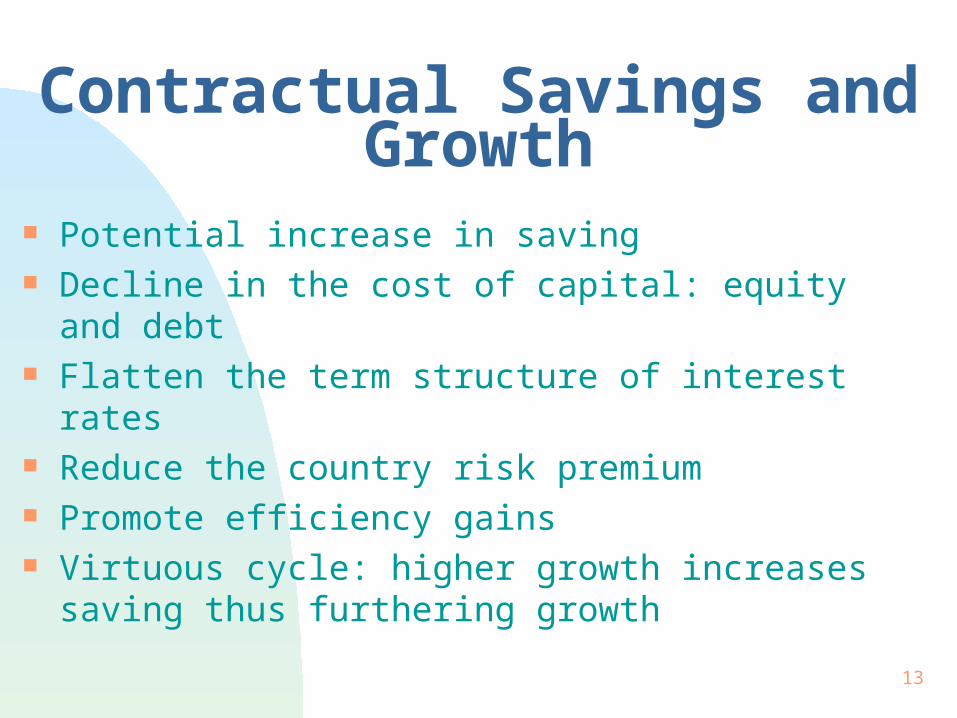
Contractual Savings and Growth
Potential increase in saving Decline in the cost of capital: equity and debt Flatten the term structure of interest rates Reduce the country risk premium Promote efficiency gains Virtuous cycle: higher growth increases saving thus
furthering growth

14
Social and Financial Risk Mitigation Effects
Beneficiaries improve management of longevity, death and other risks
Reduce debtors refinancing risks, including governments, by lengthening the maturity of debts
Reduce pressure on banks to engage in excessive term transformation risks
Reduce enterprise vulnerability to interest rate and demand shocks due to improved financial structure (higher equity/debt ratio)
Reduce capital markets volatility

15
Debt-equity ratios of listed companies and contractual savings assets, 1997 (% GDP)
Tota
l D
eb
t o
ve
r E
qu
ity
CS Financial Assets, % GDP.013976 1.9
.230171
4.14341
ARGENTIN
AUSTRALI
BRAZIL
CANADA
CHILE
FRANCE
GERMANY
INDIA
ITALY
KOREA (S
MEXICO
NETHERLA
NEW ZEALPORTUGAL
SOUTH AF
SPAIN
SRI LANK
THAILAND
UNITED K
UNITED S
16
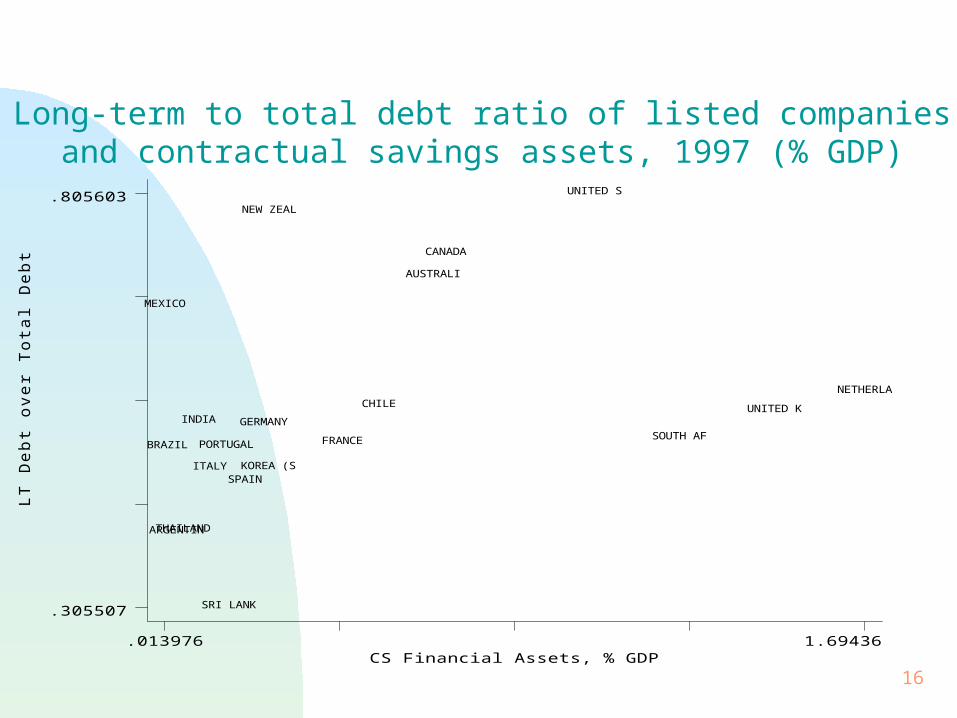
Long-term to total debt ratio of listed companiesand contractual savings assets, 1997 (% GDP)
LT
De
bt o
ve
r To
tal D
eb
t
CS Financial Assets, % GDP.013976 1.69436
.305507
.805603
ARGENTIN
AUSTRALI
BRAZIL
CANADA
CHILE
FRANCE
GERMANYINDIA
ITALY KOREA (S
MEXICO
NETHERLA
NEW ZEAL
PORTUGALSOUTH AF
SPAIN
SRI LANK
THAILAND
UNITED K
UNITED S
17
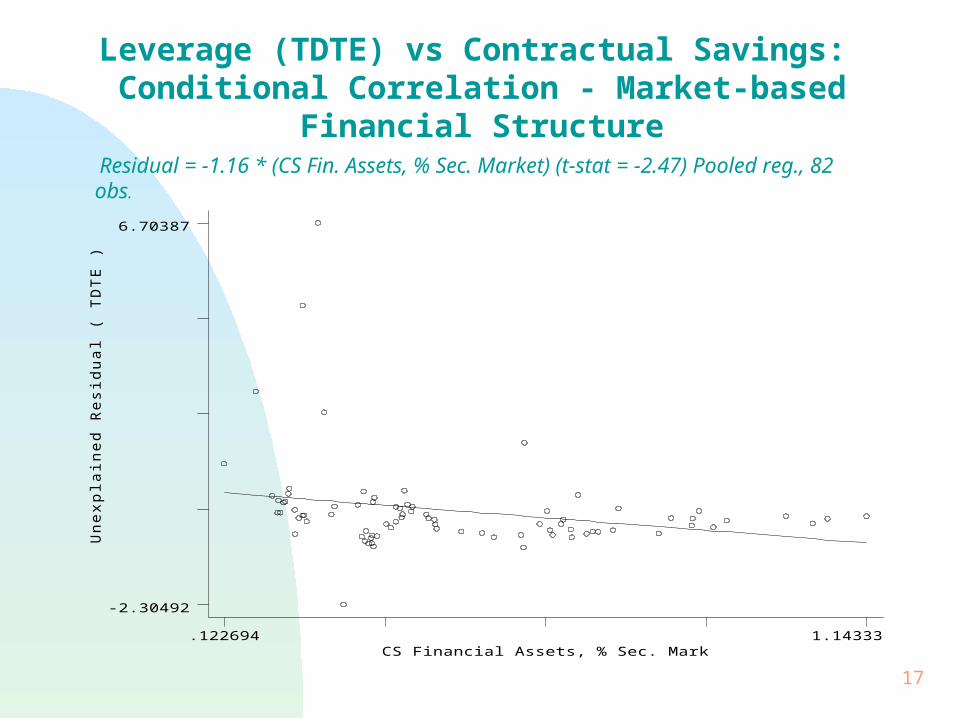
Leverage (TDTE) vs Contractual Savings: Conditional Correlation - Market-based Financial Structure
Residual = -1.16 * (CS Fin. Assets, % Sec. Market) (t-stat = -2.47) Pooled reg., 82 obs .
Un
exp
lain
ed
Re
sid
ua
l ( T
DT
E )
CS Financial Assets, % Sec. Mark.122694 1.14333
-2.30492
6.70387

18
Leverage (TDTE) vs Contractual Savings: Conditional Correlation - Bank-based Financial Structure
Residual = 4.0 * (CS Fin. Assets, % Sec. Market) (t-stat = 2.37) Pooled regression, 74 obs.
Unexpla
ined R
esid
ual (
TD
TE
)
CS Financial Assets, % Sec. Mark.029634 .608034
-1.6972
5.48049
19
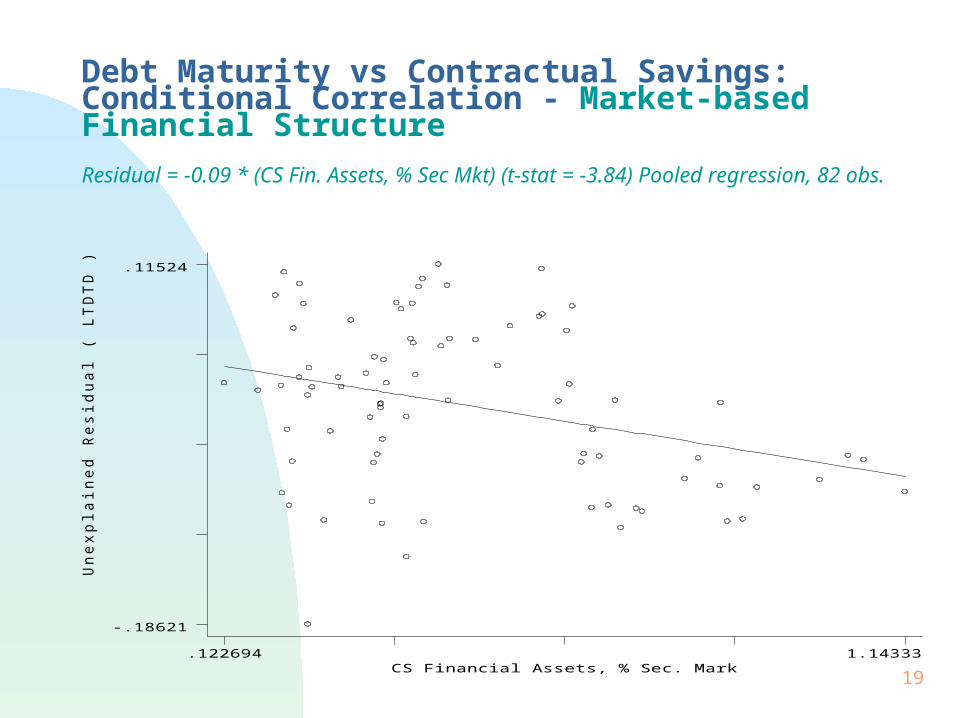
Debt Maturity vs Contractual Savings: Conditional Correlation - Market-based Financial Structure
Residual = -0.09 * (CS Fin. Assets, % Sec Mkt) (t-stat = -3.84) Pooled regression, 82 obs.
Unexpla
ined R
esid
ual (
LT
DT
D )
CS Financial Assets, % Sec. Mark.122694 1.14333
-.18621
.11524
20
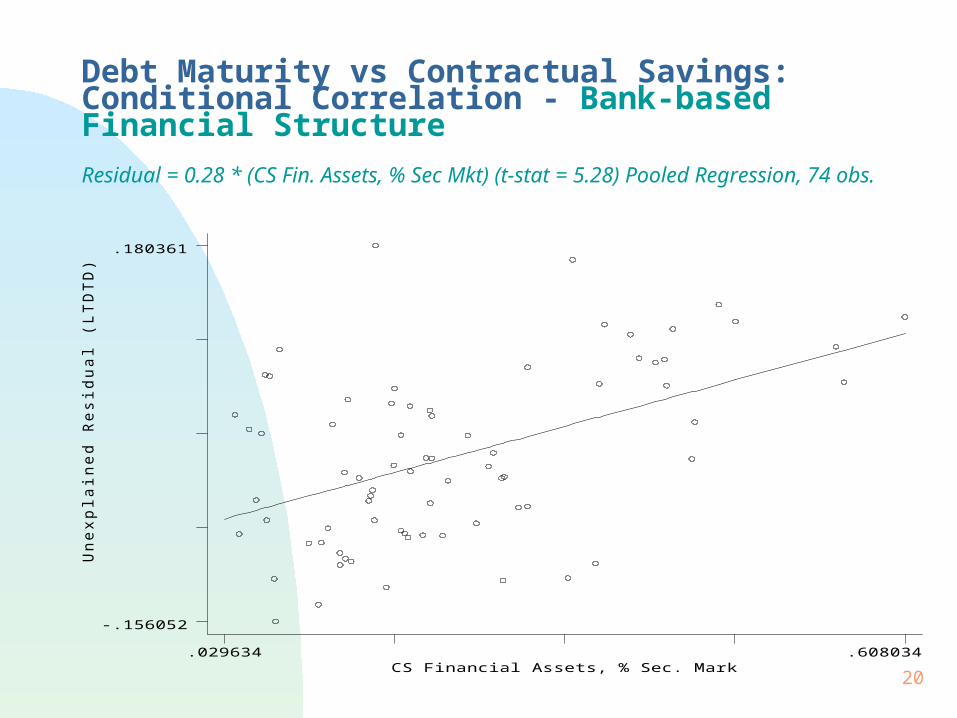
Debt Maturity vs Contractual Savings: Conditional Correlation - Bank-based Financial Structure
Residual = 0.28 * (CS Fin. Assets, % Sec Mkt) (t-stat = 5.28) Pooled Regression, 74 obs.
Un
exp
lain
ed
Re
sid
ua
l (L
TD
TD
)
CS Financial Assets, % Sec. Mark.029634 .608034
-.156052
.180361
21
Development of Contractual Savings Institution
Reform pension systems to increase funding Mandatory: privately or publicly managed Voluntary Regulation and supervision of pension funds: allow banks and
life insurance companies to market pension plans Tax treatment
Developing life insurance Regulation and supervision: allow banks to market insurance Tax treatment

22
Government long-term to total debt ratio and contractual savings assets, 1996 (% GDP)
Financial Assets of CS over GDP.003 1.482
.32
.97
TUR
HUN
GRC
AUT
DEU
KOR
NZL
NOR
FRA
JPN
SWE
FIN
DNK
AUSISL
CAN
SGP
USA
ZAF
CHE
GBRNLD

Portfolios Composition
24
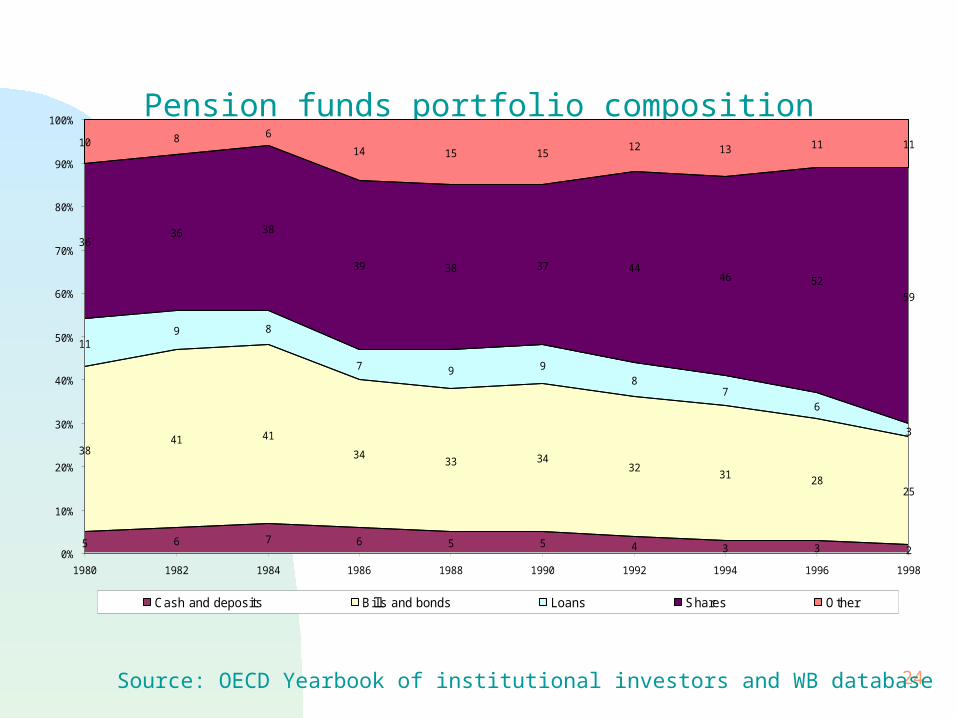
Pension funds portfolio composition
Source: OECD Yearbook of institutional investors and WB database
5 6 7 6 5 5 4 3 3 2
3841 41
3433 34
3231 28
25
119 8
7 9 98
76
3
3636 38
39 38 37 4446 52
59
10 8 6
14 15 1512 13 11 11
0%
10%
20%
30%
40%
50%
60%
70%
80%
90%
100%
1980 1982 1984 1986 1988 1990 1992 1994 1996 1998
Cash and deposits Bills and bonds Loans Shares Other

25
Pension funds portfolio composition (Common Law)
Source: OECD Yearbook of institutional investors and WB database
6 6 7 6 6 6 4 3 3 2
41 43 42
35 34 35
31 3126
23
4 3 3
3 3 3
3 2
2
2
39 39 40
41 41 4049 51
5762
10 9 815 16 16 13 13 12 11
0%
10%
20%
30%
40%
50%
60%
70%
80%
90%
100%
1980 1982 1984 1986 1988 1990 1992 1994 1996 1998
Cash and deposits Bills and bonds Loans Shares Other
26
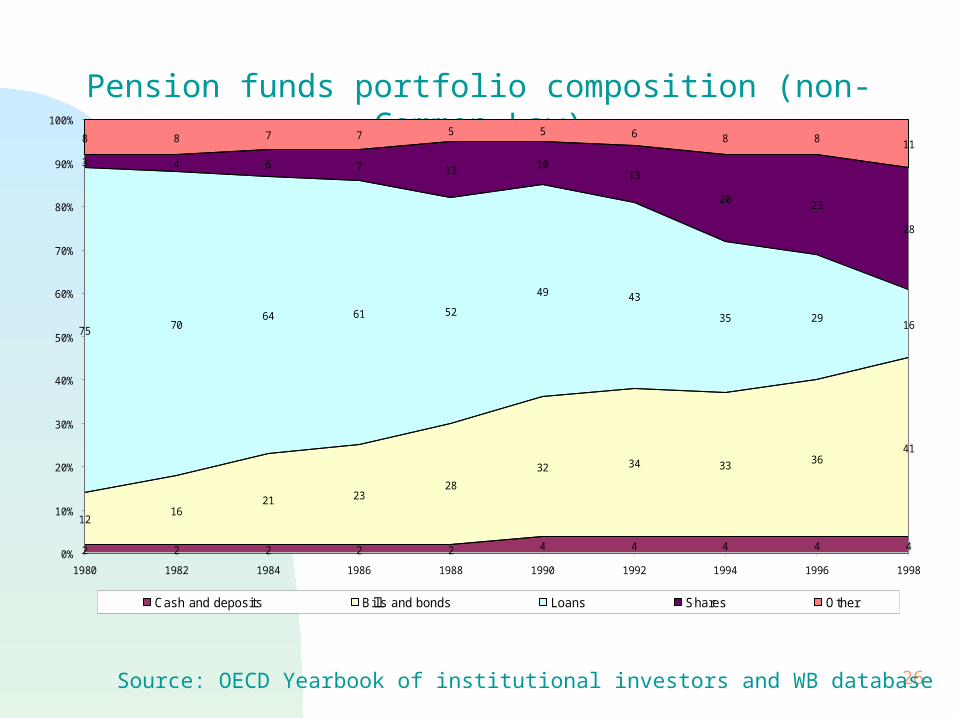
Pension funds portfolio composition (non-Common Law)
Source: OECD Yearbook of institutional investors and WB database
2 2 2 2 2 4 4 4 4 4
1216
21 2328
32 34 33 3641
75 7064 61 52
49 43
35 2916
3 4 6 7 13 1013
20 23
28
8 8 7 7 5 5 6 8 8 11
0%
10%
20%
30%
40%
50%
60%
70%
80%
90%
100%
1980 1982 1984 1986 1988 1990 1992 1994 1996 1998
Cash and deposits Bills and bonds Loans Shares Other

27
Pension funds portfolio composition (MYS and SGP)
Notes: 1/ 100% of assets are invested in non-tradable govt. securities. Money is channeled through the Consolidated Fund to investment holding companies of the Singapore Government. No public disclosure of their operations is required or made. Source: WB database
Malaysia: EPF Singapore: CPF /1
28
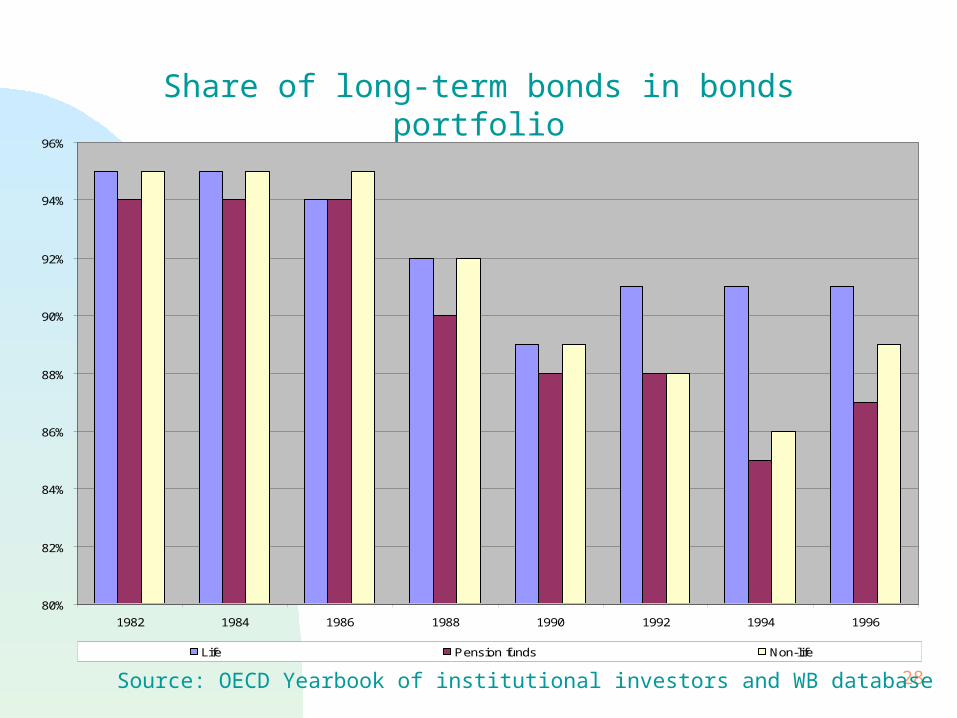
Share of long-term bonds in bonds portfolio
80%
82%
84%
86%
88%
90%
92%
94%
96%
1982 1984 1986 1988 1990 1992 1994 1996
Life Pension funds Non-life
Source: OECD Yearbook of institutional investors and WB database
29
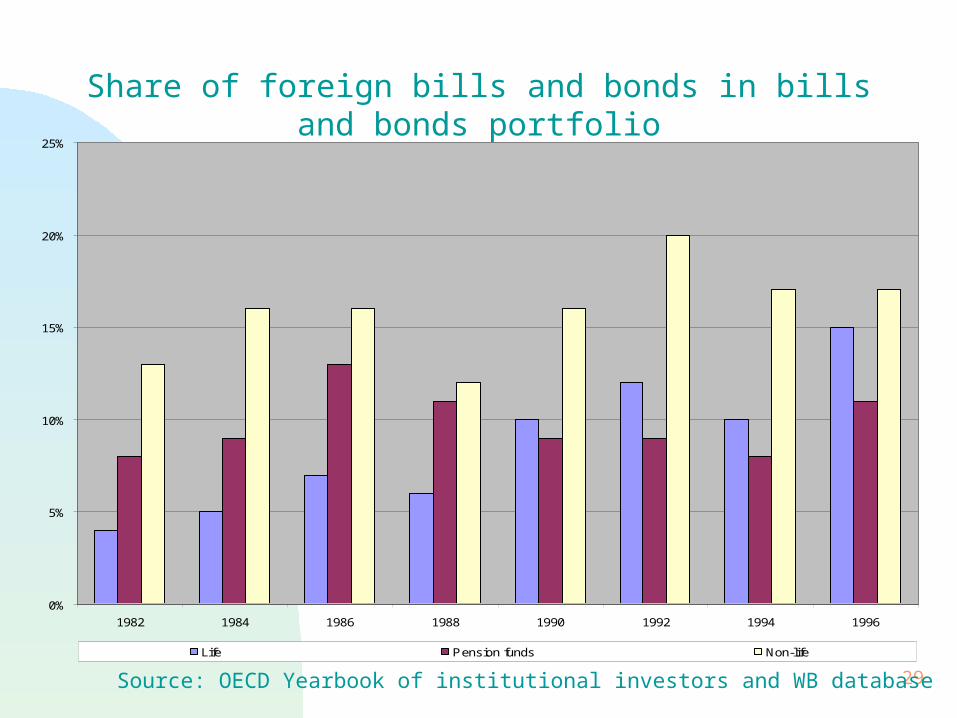
Share of foreign bills and bonds in bills and bonds portfolio
0%
5%
10%
15%
20%
25%
1982 1984 1986 1988 1990 1992 1994 1996
Life Pension funds Non-life
Source: OECD Yearbook of institutional investors and WB database
30
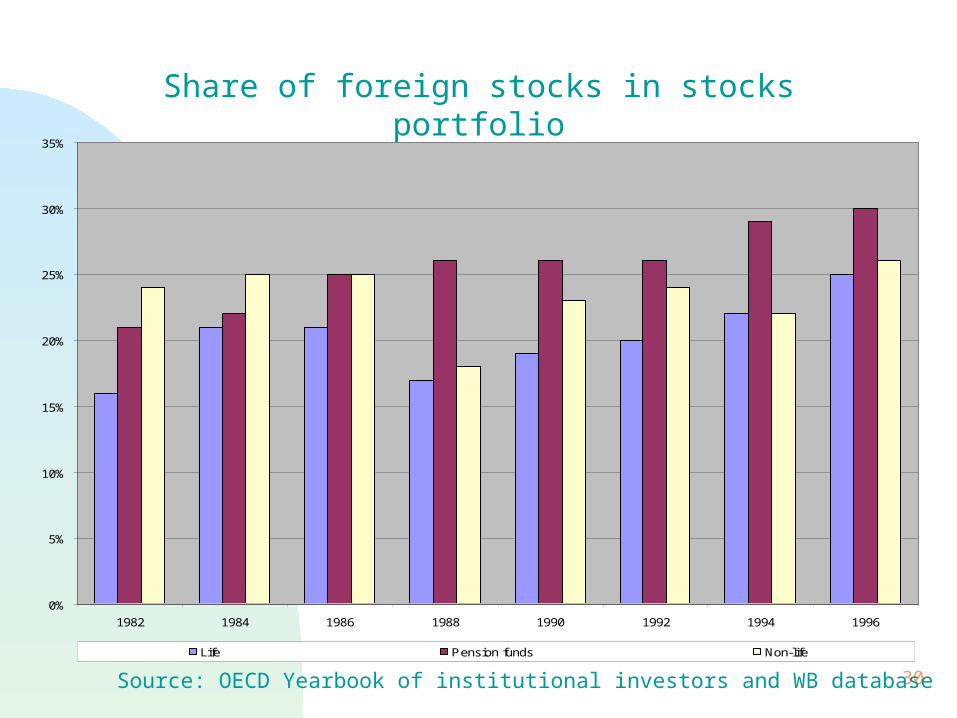
Share of foreign stocks in stocks portfolio
0%
5%
10%
15%
20%
25%
30%
35%
1982 1984 1986 1988 1990 1992 1994 1996
Life Pension funds Non-life
Source: OECD Yearbook of institutional investors and WB database
31
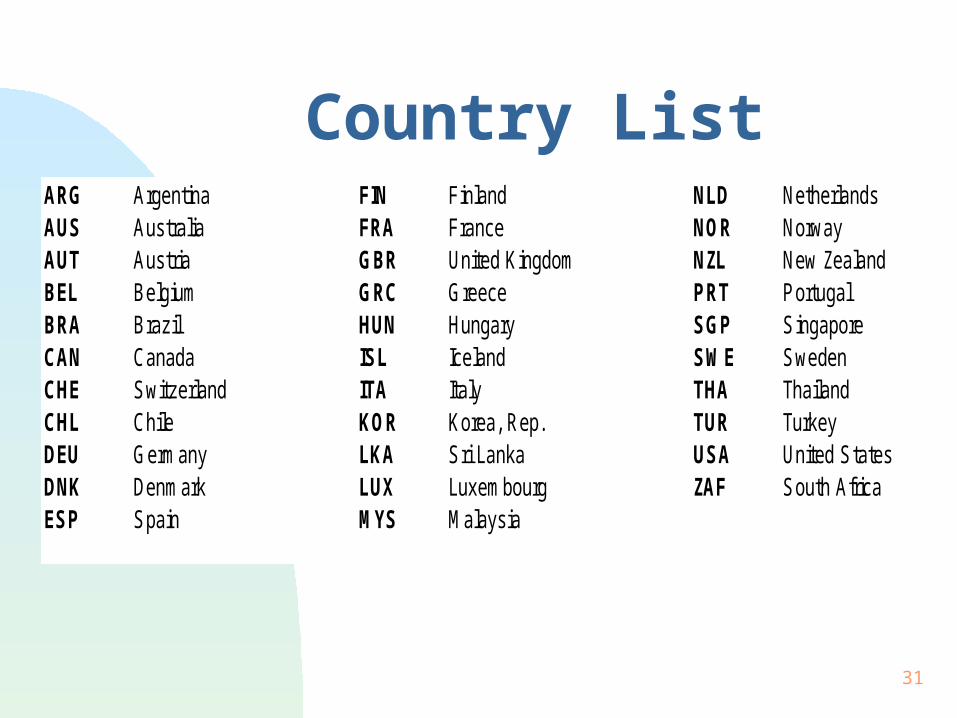
Country ListARG Argentina FIN Finland NLD NetherlandsAUS Australia FRA France NOR NorwayAUT Austria GBR United Kingdom NZL New ZealandBEL Belgium GRC Greece PRT PortugalBRA Brazil HUN Hungary SGP SingaporeCAN Canada ISL Iceland SWE SwedenCHE Switzerland ITA Italy THA ThailandCHL Chile KOR Korea, Rep. TUR TurkeyDEU Germany LKA Sri Lanka USA United StatesDNK Denmark LUX Luxembourg ZAF South AfricaESP Spain MYS Malaysia


