DNMT3a H3 DNMT3b H3 0 h 2 h 1 d 3 d 7 d DNMT3a DNMT3b 0 0.5 1 1.5 Relative level 0 h 2 h 1 d 3 d 7 d Time points after CFA d TET1 H3 TET2 H3 TET3 H3 0 0.5 1 1.5 0 3 7 Days TET1 TET2 TET3 Relative level 0 3 7 Days after SNL e OCT1 H3 OCT1 H3 Days 0 3 7 f Relative level 0 0.5 1 1.5 Contralateral L5 DRG 0 3 7 Ipsilateral L4 DRG Days after SNL Con L5 Ipsi L4 DNMT3a DNMT3b 0 0.5 1 1.5 Relative level DNMT3a DNMT3b H3 Days 0 3 7 14 Contralateral L5 DRG a DNMT3a DNMT3b 0 0.5 1 1.5 DNMT3a DNMT3b Relative level 3 d 7 d 14 d 0 d H3 Days 0 3 7 14 Ipsilateral L4 DRG b 0 0.5 1 1.5 DNMT3a DNMT3b Relative level DNMT3a DNMT3b H3 Days 0 3 7 14 Ipsilateral L5 dorsal horn c
Transcript
DNMT3a
H3DNMT3b
H3
0 h 2 h 1 d 3 d 7 d
DNMT3a DNMT3b
0
0.5
1
1.5
Rel
ativ
e le
vel
0 h 2 h 1 d 3 d 7 d
Time points after CFA
d
TET1
H3
TET2
H3
TET3
H3
0
0.5
1
1.50 3 7Days TET1 TET2 TET3
Rel
ativ
e le
vel
0 3 7Days after SNL
e
OCT1
H3
OCT1
H3
Days 0 3 7f
Rel
ativ
e le
vel
0
0.5
1
1.5 Contralateral L5 DRG
0 3 7
Ipsilateral L4 DRG
Days after SNL
Co
n L
5Ip
si L
4
DNMT3a DNMT3b0
0.5
1
1.5
Rel
ativ
e le
vel
DNMT3a
DNMT3b
H3
Days 0 3 7 14
Contralateral L5 DRGa
DNMT3a
DNMT3b
0
0.5
1
1.5
DNMT3a DNMT3b
Rel
ativ
e le
vel
3 d 7 d 14 d0 d
H3
Days 0 3 7 14
Ipsilateral L4 DRGb
0
0.5
1
1.5
DNMT3a DNMT3b
Rel
ativ
e le
vel
DNMT3a
DNMT3b
H3
Days 0 3 7 14
Ipsilateral L5 dorsal hornc
Supplementary Figure 1. (a) Levels of DNMT3a and DNMT3b in the contralateral L5 DRG on days 0, 3, 7, and 14 post-SNL in
rats. n = 6 rats/time point. One-way ANOVA (relative level vs. time points) followed by post hoc Tukey test, Ftime (3, 11) = 0.10 for
DNMT3a and Ftime (3, 11) = 0.27 for DNMT3b. (b) Levels of DNMT3a and DNMT3b in the ipsilateral L4 DRG on days 0, 3, 7 and
14 post-SNL in rats. n = 6 rats/time point. One-way ANOVA (relative level vs. time points) followed by post hoc Tukey test, Ftime
(3, 11) = 0.18 for DNMT3a and Ftime (3, 11) = 0.17 for DNMT3b. (c) Levels of DNMT3a and DNMT3b in the ipsilateral L5 dorsal
horn on days 0, 3, 7 and 14 post-SNL in rats. n = 6 rats/time point. One-way ANOVA (relative level vs. time points) followed by
post hoc Tukey test, Ftime (3, 15) = 0.87 for DNMT3a and Ftime (3, 11) = 0.001 for DNMT3b. (d) Levels of DNMT3a and DNMT3b
in the ipsilateral L4 and L5 DRG at 0 h, 2 h, 1 d, 3 d, and 7 d post-CFA in rats. n = 6 rats/time point. One-way ANOVA (relative
level vs. time points) followed by post hoc Tukey test, Ftime (4, 29) = 0.76 for DNMT3a and Ftime (4, 14) = 1.49 for DNMT3b. (e)
Levels of TET1, TET2, and TET3 in the ipsilateral L5 DRG on days 0, 3, and 7 post-SNL in rats. n = 12 rats/time point. One-way
ANOVA (relative level vs. time points) followed by post hoc Tukey test, Ftime (2, 8) = 0.70 for TET1, Ftime (2, 8) = 0.76 for TET2,
and Ftime (2, 8) = 1.10 for TET3. (f) Level of OCT1 in the contralateral (Con) L5 DRG and ipsilateral (Ipsi) L4 DRG on days 0, 3,
and 7 post-SNL in rats. n = 6 rats/time point. One-way ANOVA (relative level vs. time points) followed by post hoc Tukey test,
Ftime (2, 8) = 1.34 for Con L5 DRG and Ftime (2, 8) = 0.66 for Ipsi L4 DRG. Full-length blots are presented in Supplementary Figure
6.
Days after SNL or sham surgery-30-30
0
5
10
15
20
25
30
shRNA + SNL
PBS + SNL
shRNA + Sham
scram + SNL
0
2
4
6
8
10
12
-1 3 5 7-1 3 5 7
Paw
wit
hd
raw
al
thre
sho
ld (
g)
c
Paw
wit
hd
raw
al
late
ncy
(s)
b
g
0
5
10
15
20
25
30
-30 -1 3 5 7
Paw
wit
hd
raw
al
thre
sho
ld
(g)
PBS + CCI shRNA + CCI
7
8
9
10
11
12
-30 -1 3 5 7
Paw
wit
hd
raw
al
late
ncy
(s)
hshRNA + Sham scram + CCI
0
0.5
1
1.5
DNMT1 DNMT3a DNMT3b
**
GFP scram
shRNA
GFP scram shRNA
DNMT1
DNMT3a
DNMT3b
H3
Rel
ativ
e le
vel
a
0
5
10
15
20
25
30
-30 -1 3 5 7
Paw
wit
hd
raw
al
thre
sho
ld (
g)
***
**
Days after CCI or sham surgery
7
8
9
10
11
12
-30 -1 3 5 7
Paw
wit
hd
raw
al
late
ncy
(s)
*
****
0
10
20
30
40
50
60
-30 -1 3 5 7
Paw
wit
hd
raw
al
late
ncy
(s) ****
d e f
i
0
200
400
600
800 Saline paired
Lidocaine paired
Pre Post Pre Post Pre Post Pre Post
scram + Sham shRNA + Sham scram + SNL shRNA + SNL
Tim
e in
the
cham
ber
s (s
)
**
**
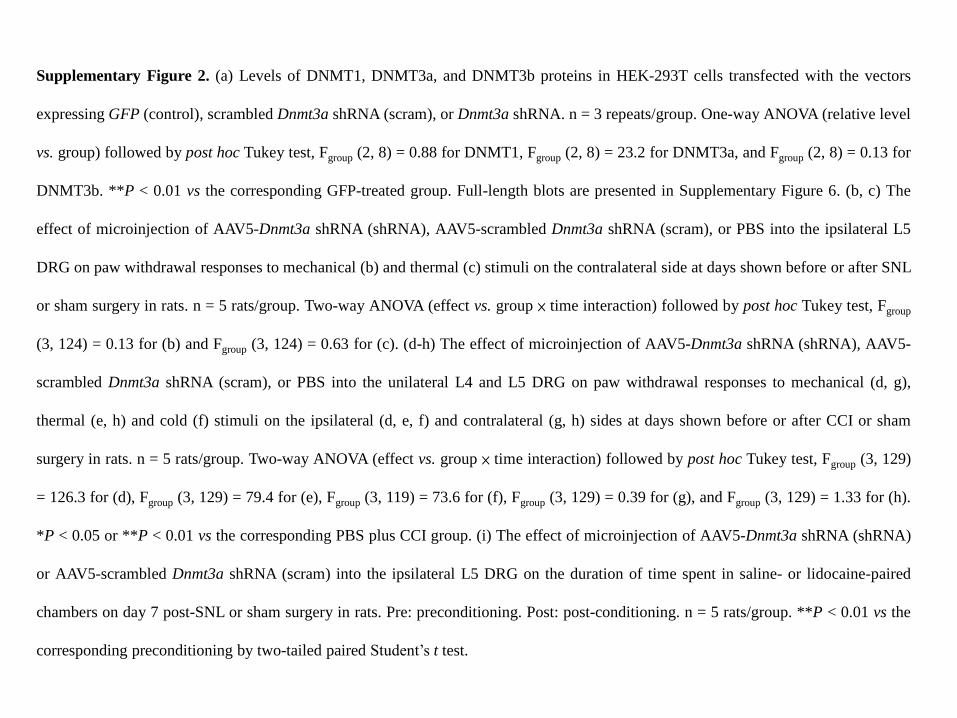
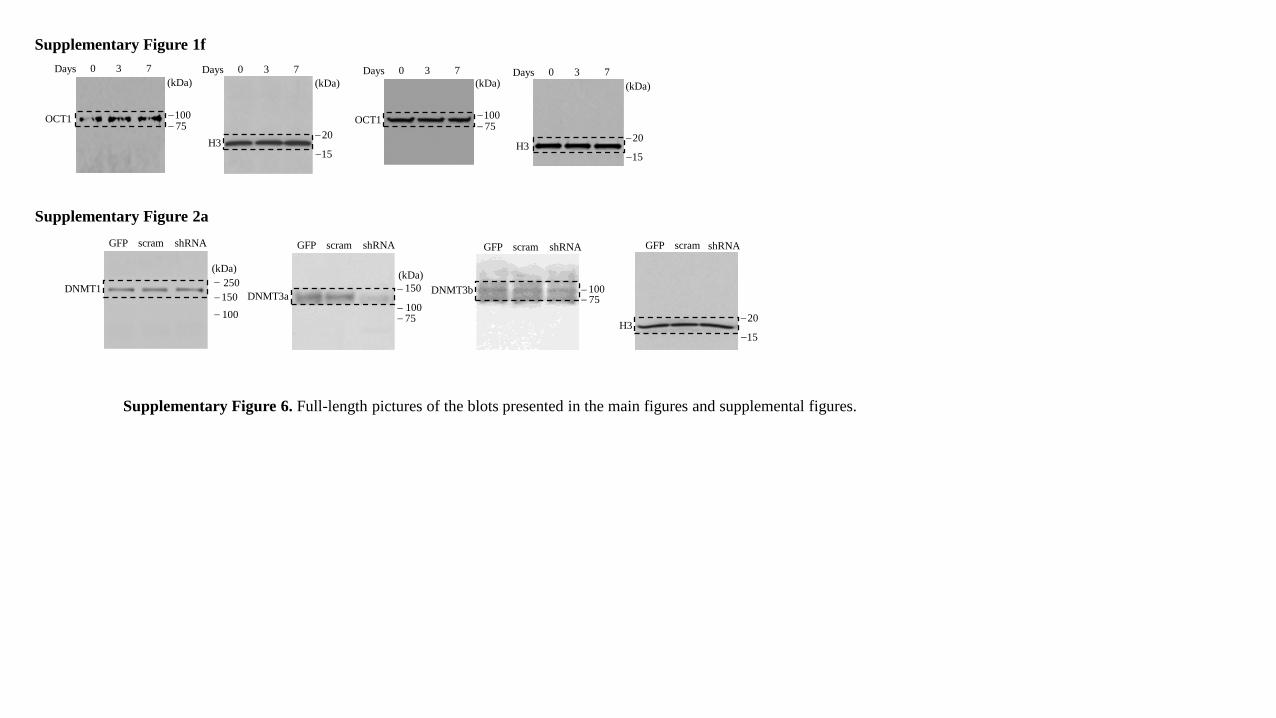
Supplementary Figure 2. (a) Levels of DNMT1, DNMT3a, and DNMT3b proteins in HEK-293T cells transfected with the vectors
expressing GFP (control), scrambled Dnmt3a shRNA (scram), or Dnmt3a shRNA. n = 3 repeats/group. One-way ANOVA (relative level
vs. group) followed by post hoc Tukey test, Fgroup (2, 8) = 0.88 for DNMT1, Fgroup (2, 8) = 23.2 for DNMT3a, and Fgroup (2, 8) = 0.13 for
DNMT3b. **P < 0.01 vs the corresponding GFP-treated group. Full-length blots are presented in Supplementary Figure 6. (b, c) The
effect of microinjection of AAV5-Dnmt3a shRNA (shRNA), AAV5-scrambled Dnmt3a shRNA (scram), or PBS into the ipsilateral L5
DRG on paw withdrawal responses to mechanical (b) and thermal (c) stimuli on the contralateral side at days shown before or after SNL
or sham surgery in rats. n = 5 rats/group. Two-way ANOVA (effect vs. group × time interaction) followed by post hoc Tukey test, Fgroup
(3, 124) = 0.13 for (b) and Fgroup (3, 124) = 0.63 for (c). (d-h) The effect of microinjection of AAV5-Dnmt3a shRNA (shRNA), AAV5-
scrambled Dnmt3a shRNA (scram), or PBS into the unilateral L4 and L5 DRG on paw withdrawal responses to mechanical (d, g),
thermal (e, h) and cold (f) stimuli on the ipsilateral (d, e, f) and contralateral (g, h) sides at days shown before or after CCI or sham
surgery in rats. n = 5 rats/group. Two-way ANOVA (effect vs. group × time interaction) followed by post hoc Tukey test, Fgroup (3, 129)
= 126.3 for (d), Fgroup (3, 129) = 79.4 for (e), Fgroup (3, 119) = 73.6 for (f), Fgroup (3, 129) = 0.39 for (g), and Fgroup (3, 129) = 1.33 for (h).
*P < 0.05 or **P < 0.01 vs the corresponding PBS plus CCI group. (i) The effect of microinjection of AAV5-Dnmt3a shRNA (shRNA)
or AAV5-scrambled Dnmt3a shRNA (scram) into the ipsilateral L5 DRG on the duration of time spent in saline- or lidocaine-paired
chambers on day 7 post-SNL or sham surgery in rats. Pre: preconditioning. Post: post-conditioning. n = 5 rats/group. **P < 0.01 vs the
corresponding preconditioning by two-tailed paired Student’s t test.
Days after viral injection
GFPDNMT3a
0
10
20
30
40
50
0
20
40
60
80
100
0
3
6
9
12
15
0 4 6 0 4 6 0 4 6
Paw
wit
hd
raw
al
late
ncy
(s)
Paw
wit
hd
raw
al
freq
uen
cy (
%)
Paw
wit
hd
raw
al
freq
uen
cy (
%)
a c
0.07 g 0.4 g
b
Supplementary Figure 3. Paw withdrawal responses to mechanical (a, b) and thermal (c) stimuli on the contralateral side
at days as shown from control HSV-GFP (GFP)- or HSV-Dnmt3a (DNMT3a)-injected mice. n = 10/group. Two-way
ANOVA (effect vs. group × time point interaction) followed by post hoc Tukey test, Fgroup (1, 23) = 0.00 for (a), Fgroup (1,
23) = 1.2 for (b), and Fgroup (1, 23) = 3 for (c).
a**
**
0
10
20
30
40
50
60
70
WT -482 CpG
mutant
-457 CpG
mutant
-444 CpG
mutant
-440 CpG
mutant
Rel
ativ
e ac
tivit
y
b
*
0
10
20
30
40
50
60
70
80
Rel
ativ
e ac
tivit
y
**#
WT +
GFP
WT +
DNMT3a
Double mutant
+ GFP
Double mutant
+ DNMT3a
Supplementary Figure 4. (a) Kcna2 gene promoter activity in HEK-293 cells transfected with wild type (WT) vector
expressing the fragment (-622 to +74) of Kcna2 gene or with the vectors expressing this fragment with a mutated base at the
-482, -457, -444, or -440 CpG site. n = 3 repeats/treatment. One-way ANOVA (relative activity vs. group) followed by post
hoc Tukey test, Fgroup (4, 14) = 137.9. **P < 0.01 vs the WT group. (b) Kcna2 gene promoter activity in HEK-293 cells co-
transfected with WT vector plus vector expressed GFP (GFP), WT vector plus vector expressing full-length Dnmt3a
(DNMT3a), the vector expressing two mutated bases at the -457 and -444 CpG sites (double mutant) plus GFP, or the
double mutant plus DNMT3a. n = 3 repeats/treatment. One-way ANOVA (relative activity vs. group) followed by post hoc
Tukey test, Fgroup (3, 11) = 391.8. *P < 0.05 vs the WT plus GFP group. #P < 0.05 vs the WT plus DNMT3a group.
Co
ntr
ol
DN
MT
3a
Before MTX After MTX
Medium a c
0
0.2
0.4
0.6
0.8
1
Control DNMT3a
Per
centa
ge
curr
ent
afte
r
MT
X
5nA
40ms
Co
ntr
ol
DN
MT
3a
2nA
40ms
Before MTX After MTX
Smalld
*
0
0.2
0.4
0.6
0.8
1
Control DNMT3a
f
Per
centa
ge
curr
ent
afte
r
MT
X
Control
Control + MTX
DNMT3a
DNMT3a+MTX
Curr
ent
den
sity
(p
A/p
F)
Voltage (mV)
b **
0
50
100
150
200
250
300
-80 -60 -40 -20 0 20 40
**
**
**
*
0
20
40
60
80
100
120
140
160
180
200
-80 -60 -40 -20 0 20 40
Curr
ent
den
sity
(p
A/p
F)
Voltage (mV)
e
**
**
**
**
*
Supplementary Figure 5. Dnmt3a overexpression reduces total Kv current density in medium and small neurons from the
injected DRG 6–8 weeks after viral microinjection into the unilateral L4 and L5 DRG in rats. (a) Representative traces of total Kv
current in medium DRG neurons from AAV5-GFP (Control)-treated and AAV5-Dnmt3a (DNMT3a)-treated groups before or after
bath perfusion of 100 nM maurotoxin (MTX). (b) I-V curve for control (n = 22 neurons, 6 rats) and DNMT3a-treated (n = 27
neurons, 8 rats) medium DRG neurons before or after 100 nM MTX treatment. The current density was plotted against each
voltage. One-way ANOVA (current density vs. group) followed by post hoc Tukey test, Fgroup (1, 13) = 50.8. *P < 0.05, **P < 0.01
vs the corresponding DNMT3a-treated group at the same voltage. (c) At +50 mV, the reduction in total Kv current after MTX
treatment in medium DRG neurons was greater in the control group than in the DNMT3a-treated group. **P < 0.01 vs control
group by two-tailed unpaired Student’s t-test. (d) Representative traces of total Kv current in small DRG neurons from control and
DNMT3a-treated groups before or after bath perfusion of 100 nM MTX. (e) I-V curve for control (n = 23 neurons, 8 rats) and
DNMT3a-treated (n = 24 neurons, 9 rats) small DRG neurons before or after 100 nM MTX treatment. The current density was
plotted against each voltage. One-way ANOVA (current density vs. group) followed by post hoc Tukey test, Fgroup (1, 13) = 68.7.
*P < 0.05, **P < 0.01 vs the corresponding DNMT3a-treated group at the same voltage. (f) At +50 mV, the reduction in total Kv
current after MTX treatment in small DRG neurons was similar between the control group and the DNMT3a-treated group.
0 3 7 14
150
75 100
(kDa)
Figure 2a
Days
DNMT3a
0 3 7 14Days
75 100
(kDa)
DNMT3b
H3
20
15
0 3 7 14Days(kDa)
SNL
0 3 7 14
150
75 100
(kDa)Days
DNMT3a
0 3 7 14Days
75 100
(kDa)
DNMT3b
Sham
0 3 7 14Days
(kDa)
150
75 100
(kDa)
DNMT3a
Sham CCI
Figure 2e
75 100DNMT3b
(kDa)Sham CCI
H3
20
15
(kDa)
Sham CCI
Figure 3d
75100OCT1
Ctl Oct1 siRNA
siRNA
+ Oct1
NC
+ Oct1NC 150
75
DNMT3a
Ctl Oct1 siRNA
siRNA
+ Oct1
NC
+ Oct1NC
100
H3
20
15
Ctl Oct1 siRNA
siRNA
+ Oct1 NC
NC
+ Oct1
(kDa)
(kDa) (kDa)
75 100DNMT3b
(kDa)
150
SNLSham SNLSham
scram shRNA
H3
20
15
SNLSham SNLSham
scram shRNA
(kDa)
Figure 4b
SNLSham SNLSham
scram shRNA
H3
20
15
SNLSham SNLSham
scram shRNA
(kDa)
150
75 100
DNMT3a
(kDa)
Figure 3b
Figure 5bSham+
GFP CreGFP
SNL
(kDa)
75DNMT3b
(kDa)
150
100
Sham+
GFP GFP
SNL
CreSham+
GFP GFP
SNL
(kDa)
Cre
Days 0 3 7
SNL
(kDa) Days 0 3 7
SNL
(kDa) Days 0 3 7
Sham
(kDa)Days 0 3 7
Sham
(kDa)
Figure 4b
Figure 6bNaïve GFP DNMT3a
150
75 100
(kDa)
DNMT3a
Naïve GFP DNMT3a
H3
20
15
(kDa)
150
250
100
Naïve GFP DNMT3a
(kDa)
DNMT1
Naïve GFP DNMT3a
H3
20
15
(kDa)
Figure 6j
GFP DNMT3a
150
75
(kDa)
DNMT3a
GFP DNMT3a
H3
20
15
(kDa)
5037
GFP DNMT3a
p-ERK1/2
(kDa)
OCT175
100
H3
20
15
OCT175
100
DNMT3a
150
75 100
H3
20
15
H3
20
15
H3
20
15
100
Figure 6j
50
37
GFP DNMT3a
ERK1/2
(kDa)
50
37
GFP DNMT3a
Tubulin
(kDa)
50
37
GFP DNMT3a
GFAP
(kDa)
50
37
GFP DNMT3a
GAPDH
(kDa)
25
Sham
+ scram scram shRNA
SNL
(kDa)
Figure 7bSham
+ scram scram shRNA
SNL
(kDa)
50
37GAPDH
(kDa)
25
Sham
+ scram scram shRNA
SNL
100
75Kcna1
Figure 7d
100
75Kcna2
(kDa)
Sham
+ GFP GFP Cre
SNL
100
75
5037
Kcna4
(kDa)
Sham
+ GFP GFP Cre
SNL
(kDa)
Sham
+ GFP GFP Cre
SNL Figure 8bGFP DNMT3a
100
75Kcna2
(kDa)
-actin
5037
GFP DNMT3a(kDa)
100
75
5037
Kcna4
GFP DNMT3a
(kDa)
50
37GAPDH
(kDa)
GFP DNMT3a
50
37
Tubulin
Kcna2
100
75
Supplementary Figure 1a0 3 7 14
150
75 100
(kDa)
Days
DNMT3a
0 3 7 14Days
75100
(kDa)
DNMT3b
H3
20
15
0 3 7 14Days(kDa)
Supplementary Figure 1b
0 3 7 14
150
75 100
(kDa)Days
DNMT3a
0 3 7 14Days
75100
(kDa)
DNMT3b
H3
20
15
0 3 7 14Days(kDa)
Supplementary Figure 1c
0 3 7 14
150
75 100
(kDa)Days
DNMT3a
0 3 7 14Days
75DNMT3b 100
(kDa)Days
H3
20
15
0 3 7 14(kDa)
Supplementary Figure 1d
DNMT3a
0 h 2 h 1 d 3 d 7 d
150
75 100
(kDa)
H3
20
15
(kDa)
0 h 2 h 1 d 3 d 7 d
DNMT3a
0 h 2 h 1 d 3 d 7 d150
75 100
(kDa)
20
15
(kDa)0 h 2 h 1 d 3 d 7 d
H3
Supplementary Figure 1e
TET1150
250
100
(kDa)0 3 7Days
H3
20
15
(kDa)0 3 7Days 0 3 7
150
75 100
(kDa)
Days
TET2
H3
20
15
(kDa)
0 3 7Days
TET1 150
250
100
(kDa)0 3 7Days
H3
20
15
(kDa)
0 3 7Days
Supplementary Figure 1f
75100OCT1
(kDa)
0 3 7Days
H3
20
15
(kDa)
0 3 7Days
75100OCT1
(kDa)
0 3 7Days
H3
20
15
(kDa)
0 3 7Days
Supplementary Figure 2a
GFP scram shRNA
DNMT1150
250
100
(kDa)
150
75 100
(kDa)
DNMT3a
GFP scram shRNA
75DNMT3b 100
GFP scram shRNA
H3
20
15
GFP scram shRNA
Supplementary Figure 6. Full-length pictures of the blots presented in the main figures and supplemental figures.
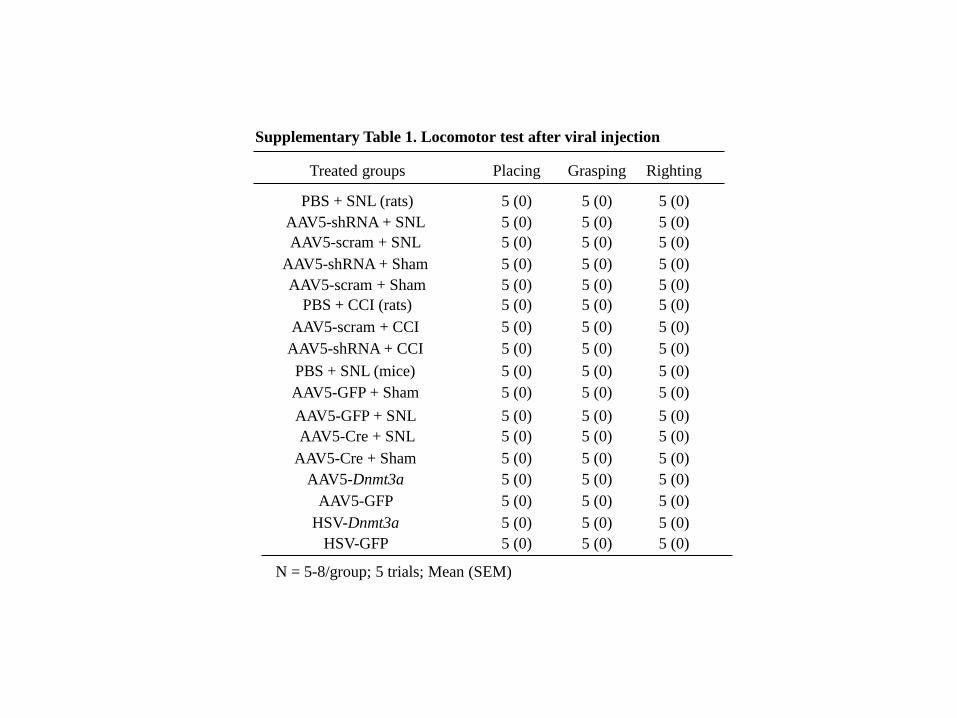
Supplementary Table 1. Locomotor test after viral injection
Treated groups Placing Grasping Righting
PBS + SNL (rats) 5 (0) 5 (0) 5 (0)
AAV5-shRNA + SNL 5 (0) 5 (0) 5 (0)
AAV5-scram + SNL 5 (0) 5 (0) 5 (0)
N = 5-8/group; 5 trials; Mean (SEM)
AAV5-shRNA + Sham 5 (0) 5 (0) 5 (0)
AAV5-scram + Sham 5 (0) 5 (0) 5 (0)
PBS + SNL (mice) 5 (0) 5 (0) 5 (0)
AAV5-GFP + Sham 5 (0) 5 (0) 5 (0)
AAV5-GFP + SNL 5 (0) 5 (0) 5 (0)
AAV5-Cre + SNL 5 (0) 5 (0) 5 (0)
AAV5-Cre + Sham 5 (0) 5 (0) 5 (0)
AAV5-Dnmt3a 5 (0) 5 (0) 5 (0)
AAV5-GFP 5 (0) 5 (0) 5 (0)
HSV-Dnmt3a 5 (0) 5 (0) 5 (0)
HSV-GFP 5 (0) 5 (0) 5 (0)
PBS + CCI (rats) 5 (0) 5 (0) 5 (0)
AAV5-scram + CCI 5 (0) 5 (0) 5 (0)
AAV5-shRNA + CCI 5 (0) 5 (0) 5 (0)
Supplementary Table 2: Membrane input resistance and other action potential parameters in DRG neurons.
Large Cell Medium Cell Small Cell
GFP DNMT3a t/p value GFP DNMT3a t/p value GFP DNMT3a t/p value