Contrasting Mesozoic evolution across the boundarybetween on and off craton regions of the South Africanplateau inferred from apatite fission trackand (U-Th-Sm)/He thermochronologyMark Wildman1,2 , Roderick Brown1 , Cristina Persano1, Romain Beucher1,3, Finlay M. Stuart4,Vhairi Mackintosh5 , Kerry Gallagher6 , James Schwanethal7 , and Andrew Carter8
1School of Geographical and Earth Sciences, College of Science and Engineering, University of Glasgow, Glasgow, Scotland,2Now at Géosciences Rennes, Université de Rennes, Rennes, France, 3Now at School of Earth Sciences, University ofMelbourne, Melbourne, Victoria, Australia, 4Scottish Universities Environmental Research Centre, East Kilbride, Scotland,5School of Earth Sciences, University of Melbourne, Melbourne, Victoria, Australia, 6Géosciences Rennes, Université deRennes, Rennes, France, 7Department of Earth Sciences, University College London, London, UK, 8Department of Earth andPlanetary Sciences, Birkbeck, University of London, UK
Abstract The timing and mechanisms involved in creating the elevated, low-relief topography of theSouth African plateau remain unresolved. Here we constrain the thermal history of the Southwest Africanplateau since 300Ma by using apatite fission track (AFT) and (U-Th-Sm)/He (AHe) thermochronology. Archeanrocks from the center of the Kaapvaal Craton yield AFT ages of 331.0 ± 11.0 and 379.0 ± 23.0Ma and meantrack lengths (MTLs) of 11.9 ± 0.2 and 12.5 ± 0.3μm. Toward the southwest margin of the craton and in theadjacent Paleozoic mobile belt, AFT ages are significantly younger and range from 58.9 ± 5.9 to 128.7 ± 6.3Maand have longer MTLs (>13μm). The range of sample AHe ages complements the AFT ages, and single-grainAHe ages for most samples are highly dispersed. Results from joint inverse modeling of these data reveal thatthe center of the craton has resided at near-surface temperatures (<60°C) since 300Ma, whereas the marginsof the craton and the off-craton mobile belt experienced two discrete episodes of cooling during theCretaceous. An Early Cretaceous cooling episode is ascribed to regional denudation following continentalbreakup. Late Cretaceous cooling occurs regionally but is locally variable and may be a result of a complexinteraction between mantle-driven uplift and the tectonic setting of the craton margin. Across the entireplateau, samples are predicted to have remained at near-surface temperatures throughout the Cenozoic,suggesting minimal denudation (<1 km) and relative tectonic stability of the plateau.
1. Introduction
Elevated, low-relief interior plateaus are a defining morphological feature of high-elevation continental mar-gins [Bishop, 2007; Blenkinsop and Moore, 2013]. They are typically considered to be tectonically inactive hav-ing experienced only limited deformation that is largely restricted to gentle, long-wavelength warping [e.g.,Moore et al., 2009; Cloetingh et al., 2013]. The South African plateau is surrounded by classic high-relief escarp-ment zones. It is arguably the type-example of a high-elevation continental margin, yet both its mode of for-mation and its subsequent evolution remain controversial.
The mechanism that generated the high elevation of the plateau, and the timing of plateau formation, is atthe center of the controversy [e.g., Partridge and Maud, 1987; Brown et al., 2002; Braun et al., 2014; Rudge et al.,2015; Green et al., 2016]. Insights from geodynamic models support the hypothesis that vertical stressesimposed at the base of the lithosphere by the vertical component of mantle flow will induce significant uplift(or subsidence for downwelling mantle) of the interior plateau [e.g., Gurnis et al., 2000; Moucha et al., 2008;Braun, 2010; Forte et al., 2010; Flament et al., 2014]. It is also significant that recent thermomechanical modelsthat simulate the interaction between mantle convection and the overlying lithosphere suggest that brittledeformation of the upper crust at short-wavelength scales may also occur in tandem with longer wavelength(plume-induced) uplift of the lithosphere [e.g., Burov and Cloetingh, 2009; Guillou-Frottier et al., 2012; Cloetinghet al., 2013; Koptev et al., 2015]. In addition to deformation arising from these vertical stresses applied at thebase of the lithosphere, horizontal stresses arising from plate boundary and plate kinematic changes maypropagate significant distances and drive local, brittle deformation and reactivation of pre-existing
WILDMAN ET AL. MESOZOIC EVOLUTION OF SOUTHERN AFRICA 1
PUBLICATIONSJournal of Geophysical Research: Solid Earth
RESEARCH ARTICLE10.1002/2016JB013478
Key Points:• New AFT and AHe data revealcontrasts in the thermal history ofon- and off-craton regions during theMesozoic
• Interior craton has stayed at less than60 degrees Celsius since 300 Ma;off-craton experienced two discreteepisodes of cooling during theCretaceous
• Late Cretaceous denudation focusedalong basement structures at thecraton margin and is linked to theerosion of uplifted fault blocks
Supporting Information:• Supporting Information S1
Citation:Wildman, M., R. Brown, C. Persano,R. Beucher, F. M. Stuart, V. Mackintosh,K. Gallagher, J. Schwanethal, andA. Carter (2017), Contrasting Mesozoicevolution across the boundary betweenon and off craton regions of the SouthAfrican plateau inferred from apatitefission track and (U-Th-Sm)/Hethermochronology, J. Geophys. Res. SolidEarth, 122, doi:10.1002/2016JB013478.
Received 22 AUG 2016Accepted 2 FEB 2017Accepted article online 3 FEB 2017
structures within continental interiors [Daly et al., 1989; Janssen et al., 1995; Guiraud and Bosworth, 1997;Fairhead et al., 2013; Viola et al., 2012; Pérez-Díaz and Eagles, 2014; Salomon et al., 2014, 2015].
Continental interiors are often centered around Archean-Paleoproterozoic cratons that are surrounded byMesoproterozoic-to-Neoproterozoic orogenic belts. In the case of Southern Africa, the Mesoproterozoic-to-Neoproterozoic regions are characterized by a distinct tectonic fabric that developed during early accretionof older cratons [Jacobs et al., 1993; Karlstrom and Humphreys, 1998]. The southwest corner of the KaapvaalCraton and its boundary with the Namaqua mobile belt represent such a tectonic setting with prominentNW-SE trending thrust faults and shear zones defining the craton boundary (Figures 1 and 2). Recent workhas shown that due to thermal, compositional, and structural contrasts across the craton margin, regionalstresses and/or mantle instabilities may become focused at the craton margin and induce intraplate deforma-tion along lithospheric-scale craton boundary faults [Lenardic et al., 2000, 2003; Guillou-Frottier et al., 2012].
In this paperwepresent 17newapatitefission track (AFT) and103 single-grain apatite (U-Th-Sm)/He (AHe) ana-lyses from the BushmanlandPlateau. Using a Bayesian transdimensional approach to thermal history inversion[Gallagher, 2012], temperature-time coolingpaths are obtained for each sample. The thermal histories are usedto derive magnitudes of denudation and evaluate the timing and pattern of uplift and intracontinental defor-mation across this region of the South African plateau. The new data indicate that at the structurally complexzone at the craton margin an equally complex spatial pattern of deep erosion characterized the LateCretaceous, which could be explained by post-breakup deformation driving uplift and focusing denudation.
2. Geomorphology and Geology2.1. Geomorphic Setting
The study area is located within the South African plateau and is characterized by an extensive low-reliefplain where elevations range between 800 and 1000m in the west and 1200 and 1400m in the east
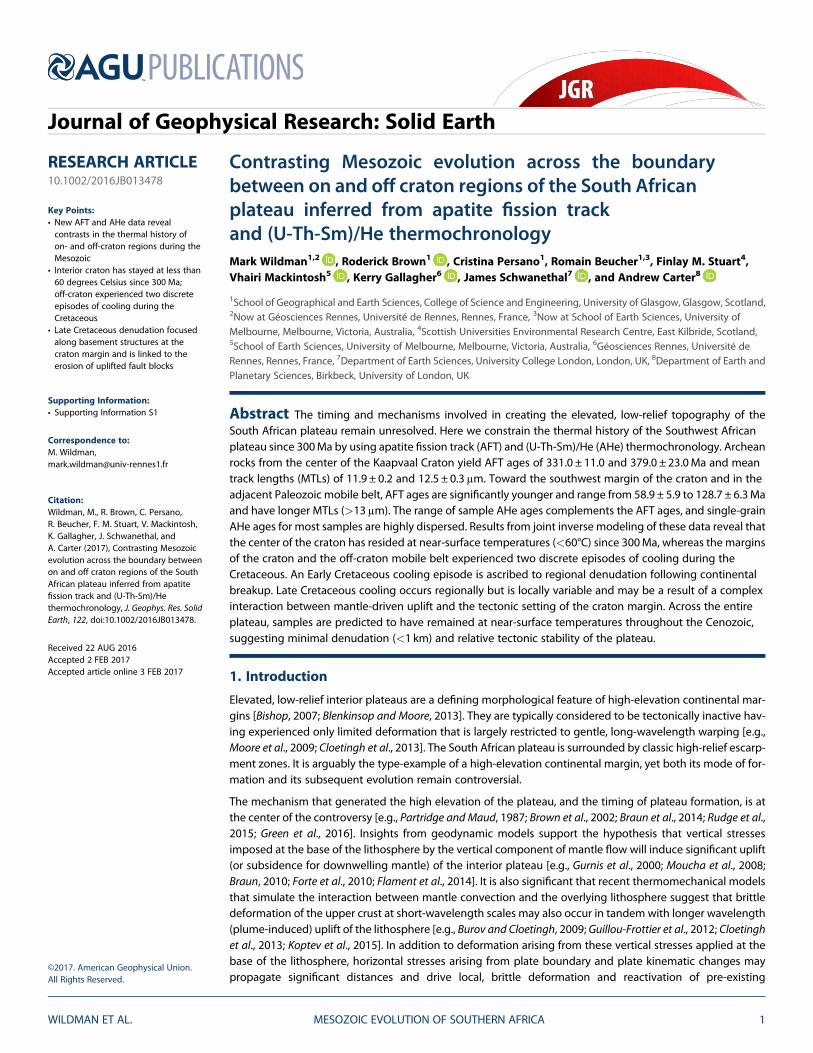
Figure 1. (top right) Location of the Bushmanland Plateau study area relative to Southern Africa. The grey shading indicates extent of the “on-craton” region, and thebrown shading indicates the “off-craton” region. KC = Kaapvaal Craton, NNMB=Namaqua-Natal Mobile Belt, CFB = Cape Fold Belt, KB = Kheis Belt, R = Rehoboth,DMB =Damara Mobile Belt, OB = Okwa Block, MB =Magondi Belt, LB = Limpopo Belt, MMB=Mozambique Mobile Belt. (top left) DEM of Bushmanland Plateau studyarea created by using SRTM90m data. The red line indicates craton boundary. (bottom) Elevation profile (dog-legged) showing the location of samples from thisstudy and from Wildman et al. [2015, 2016]. The light grey samples are those beyond a 50 km range either side of the section line.
Journal of Geophysical Research: Solid Earth 10.1002/2016JB013478
WILDMAN ET AL. MESOZOIC EVOLUTION OF SOUTHERN AFRICA 2
(Figure 1). In the northeast of the study area, the Asbestos Hills, which achieve elevations of up to1600m, mark the transition from the rocks of the Proterozoic Namaqua mobile belt to those of theArchean Kaapvaal Craton. The plateau forms the hinterland to the divergent continental margins ofSouthern Africa and is separated from low elevation, moderate relief coastal plains by a prominentescarpment zone of significantly higher relief [Gilchrist et al., 1994; Brown et al., 2002; Blenkinsop andMoore, 2013].
The Orange River, the largest catchment in South Africa and responsible for draining ~80% of the subconti-nent, enters the study area in the southeast and exits in the west before continuing westward toward theAtlantic Ocean (Figure 1). At the town of Douglas, the northwest trending Orange River (Figure 1) convergeswith the southwest flowing Vaal River, which drains northeast South Africa. North of Prieska, the Orange Riverfollows the major NW-SE structural trend of the Kheis Front and, specifically, the Doringberg Lineament,which marks the tectonic boundary between the Kaapvaal Craton and the Namaqua Belt. After continuingon this trend for ~170 km, the Orange River meanders as it flows west through the towns of Upington andKakamas. The main Orange River channel includes several significant knickpoints along its course,
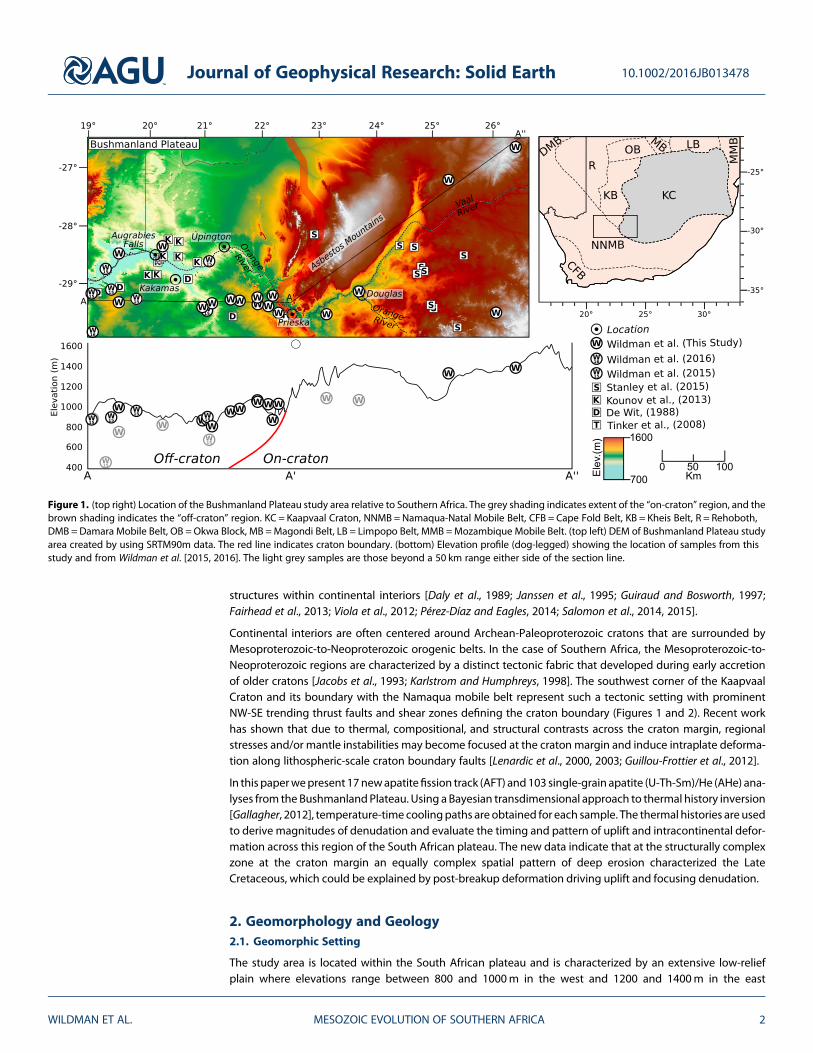
Figure 2. (a) Geological map of the Bushmanland Plateau. The geological map was redrawn to highlight the major geological units, structures, and features relevantto this study, using 1:1 × 1,000,000 map produced by the Council for Geoscience, South Africa [Fourie and Cole, 1997]; (b) schematic geological cross section of theNamaqualand Metamoprhic Province after Thomas et al. [1994]. Fault names: PS = Poffader Shear Zone; HT = Hartbees Thrust; BoS = Bouzen River Shear Zone;BS = Brakbos Shear Zone; DT = Dabep Thrust are given in the figure (after Tankard et al. [2009] and Thomas et al. [1994]).
Journal of Geophysical Research: Solid Earth 10.1002/2016JB013478
WILDMAN ET AL. MESOZOIC EVOLUTION OF SOUTHERN AFRICA 3
particularly the 90mAugrabies Falls [Tooth andMcCarthy, 2004; Dauteuil et al., 2013; Paul et al., 2014], which isdownstream to the west of the study area. The Vaal River flows within a prominent (up to 300m deep) NW-SEtrending valley into the Kaapvaal Craton.
The main drainage network of the Orange River has been in place from the middle-to-Late Cretaceous[Partridge and Maud, 1987; Dollar, 1998; de Wit, 1999, 2009]. Below the Augrabies Falls, the preservationof Pliocene, middle Miocene, and possibly Eocene river terraces indicates that there has been moderatechannel incision of the lower Orange River through the Tertiary [de Wit, 1999; Jacob et al., 1999].Preserved middle-to-Late Cretaceous diamond bearing and fossiliferous alluvial gravels in the upper Vaalsupport the antiquity of the present drainage network (Mahura Muthla channel [de Wit et al., 2009]; theMahura Muthla channel is proposed to have fed the Kalahari paleoriver, which exited into the Atlantic atthe present-day position of the lower Orange River and had captured the Upper Karoo River (composedof the present-day middle and upper Orange River and Vaal River) by the end of the Cretaceous [de Wit,1999; de Wit et al., 2009]). The preservation of these geomorphic features, as well as similar deposits inSundays River (southeast coast), and lacustrine deposits on Late Cretaceous intrusions in Namaqualandand Bushmanland [Cornelissen and Verwoerd, 1975; Moore and Verwoerd, 1985; Smith, 1986; Hanson et al.,2009; Stanley et al., 2013] suggests that regional erosion has been minimal through the Cenozoic.Cosmogenic nuclide dating has constrained the regional erosion rates to <20m/Myr over at least the last1Myr [e.g., Codilean et al., 2008, 2014; Bierman et al., 2014; Decker et al., 2011; Erlanger et al., 2012; Kounovet al., 2015; Scharf et al., 2013].
2.2. Geological and Tectonic Setting
The Archean-Paleoproterozoic Transvaal Supergroup rocks form the basement of the Kaapvaal Craton withinthe study area [Altermann and Nelson, 1998; Eriksson et al., 2006]. They were deposited in a shallow marineenvironment prior to experiencing multiple deformation phases between 2500 and 1000Ma and greenschistfacies metamorphism [Kendall et al., 2013]. An array of NW-SE to N-S trending, steeply dipping, en echelonfaults forming the Kheis Front define the structurally complex transition from the Kaapvaal Craton to theyounger Namaqua Metamorphic Province [Altermann and Hälbich, 1991; Eriksson et al., 2006] (Figure 2).These faults initially formed during the Mesoproterozoic [Eglington, 2006] and accommodated many defor-mation events from 2 to 1Ga [Altermann and Hälbich, 1991]. The NW structural trend that characterizes thesouthwest Kaapvaal Craton margin extends southwestward from southern Namibia and into South Africa,where post-Triassic displacement on brittle faults is indicated by the presence of fault-bounded basementinliers in contact with Karoo sediments [Rosendahl, 1987; Daly et al., 1989; Jelsma et al., 2009; Tankard et al.,2009] (Figure 2).
The entire Namaqua Metamorphic Province experienced significant metamorphism over ~2000 and1000Ma. The main phase of metamorphism of the Namaqua Metamorphic Province was largely granulite-facies metamorphism (T: 800–860°C and P: 5–6 kbar) and was completed by 1000–800Ma [Waters, 1989;Eglington, 2006]. Lithostratigraphic variations in the Namaqua Metamorphic Province define terrane subpro-vinces and are discussed in more detail by Eglington [2006] and Cornell et al. [2006]. These terrane subpro-vinces are bounded by major shear zones and thrust belts that are evident along the Orange River thatextend into southern Namibia (Figure 2).
The Hartbees River Thrust is the western most thrust fault in the study area and trends NW-SE before deviat-ing E-W and running parallel to the Orange River [Colliston et al., 2015]. The generally E-W structural trend ofthe western section of the study area is best represented by the Tantalite Valley shear zone, GroothoekThrust, and, further south, Buffels River shear zone. Within the Tantalite Valley shear zone, NNE-to-NE trend-ing normal structures associated with transtensional stresses juxtapose basement gneisses against lateProterozoic sediments of the overlying Nama Group [Gresse and Germs, 1993; Gresse et al., 2006]. These faultswere formed and accommodated multiple deformation phases over 1.3–1.0 Ga [Eglington, 2006; Dewey et al.,2006; Colliston and Schoch, 2013].
Sedimentary units of the Permo-Triassic Karoo Supergroup were deposited over much of Southern Africain a foreland basin north of the developing Cape Fold Belt [Catuneanu et al., 2005]. In the study area,the Karoo Supergroup unconformably overlies the basement and is represented by the LowerPermian glacially derived Dwyka Group, the Upper Permian shallow marine sandstones and siltstones
Journal of Geophysical Research: Solid Earth 10.1002/2016JB013478
WILDMAN ET AL. MESOZOIC EVOLUTION OF SOUTHERN AFRICA 4
of the Ecca Group, and the Permo-Triassic fluvial sediments of the Beaufort Group (Figure 2) [Visser,1989; Catuneanu et al., 2005; Johnson et al., 2006; Herbert and Compton, 2007; Wilson et al., 2014]. Thewidespread marine sediments of the Late Permian Ecca Group provide an important stratigraphic markeras they represent the last time that the continental interior of Southern Africa was unequivocally atsea level.
Intrusive dolerite dykes, sills, and sheets are ubiquitous within the Karoo Basin and commonly crop out acrossthe study area. The intrusion of the Karoo Dolerite Suite is thought to have occurred at ~180–185Ma [Duncanet al., 1997; Jourdan et al., 2005, 2007; Moulin et al., 2011; Svensen et al., 2012]. Mafic intrusive and extrusiverocks of similar age are found across Southern Africa and are associated with continental flood basalt empla-cement during continental rifting and breakup continental rifting and breakup of Eastern Gondwana [Cox,1992; Duncan et al., 1997].
Widespread, post-Karoo, emplacement of kimberlites and alkaline intrusions occurred in two main phases at140–120 and 100–80Ma [e.g., Smith et al., 1994; Moore et al., 2008; Jelsma et al., 2009]. The intrusions arethought to have been preferentially emplaced along tectonic boundaries, and their occurrence is linked toin-plane plate motions [Moore et al., 2008; Jelsma et al., 2009; Torsvik et al., 2010] and a changing thermoche-mical structure in the underlying mantle [Bell et al., 2003; Griffin et al., 2003; Kobussen et al., 2008]. Their pre-servation at the surface can provide important insights into the amount of erosion since emplacement [e.g.,Hanson et al., 2009; Stanley et al., 2013, 2015].
The Cenozoic Kalahari Group, a sequence of poorly sorted consolidated gravel and sand fill paleovalleys, sitson the Karoo Supergroup and older basement rocks and can reach a thickness up to 210m [Thomas andShaw, 1990] (Figure 2). However, the timing of the development of the Kalahari Basin and subsequent sedi-ment infill remains uncertain due to the absence of direct dating of the sediments [Haddon andMcCarthy, 2005].
2.3. Evidence for Discrete Post-breakup Tectonic Activity
Due to the lack of suitable stratigraphic information across the study area, constraining fault reactivation ofmajor faults during the Late Mesozoic and Cenozoic is challenging. The majority of structures mapped at the1:1,000,000 scale are confined to the Namaqua Metamorphic Province where they define terrane boundariesand lithological discontinuities (Figure 2). Exceptions to this are the southern extents of the Brakbos andDoringberg faults, which displace Proterozoic basement against Carboniferous-Permian Dwyka Group rocks.SW of Douglas, a fault is also mapped which displaces Archean Transvaal Supergroup rocks against DwykaGroup rocks. Post-Permian fault reactivation is therefore unrelated to terrane accretion or Pan-AfricanOrogenic activity.
Geological evidence for Mesozoic tectonic activity in southern Namibia is found in sporadic examples ofKaroo Dolerite Suite rocks with a faulted contact with Dwyka Group, Nama Group, and/or NamaquaMetamorphic Province rocks [Stollhofen et al., 1998]. Fault-dissected Karoo dolerites suggest tectonicactivity less than 180Ma old. Two phases of extension during the Cenozoic are advocated by Mvondoet al. [2011]. N-S grabens that shape the lower Fish River Canyon are ascribed to E-W extension in thelate Eocene and NE-SW grabens shaping the upper Fish River Canyon due to younger NW-SE extensionin the Plio-Pleistocene [Mvondo et al., 2011]. However, there are no quantitative constraints on the age ofthe African surface, which is used to constrain the timing of faulting. In NW Namibia, Late Mesozoic tec-tonics is constrained by the preservation of Early Cretaceous Etendeka volcanic rocks in coast-parallel halfgrabens [Raab et al., 2002; Brown et al., 2014; Salomon et al., 2015]. These grabens are bound by NNW-SSE trending normal faults, which displace Etendeka lavas against Namaqua Metamorphic Province base-ment [Brown et al., 2014; Salomon et al., 2015]. Further evidence is provided by syntectonic conglomerateunits composed of Etendeka volcanic material that dip to the east into a westerly dipping normal fault[Ward and Martin, 1987].
These NW Namibian examples indicate that localized faulting has occurred onshore after 130Ma.However, as with the previously described examples, no well-dated younger stratigraphic constraintsare available. We have shown previously, using combined AFT and AHe analysis, that post-breakup tec-tonic reactivation of brittle faults occurred during the middle-to-Late Cretaceous well inland along theNamaqualand sector of Atlantic margin in South Africa [Wildman et al., 2015, 2016]. These studies lend
Journal of Geophysical Research: Solid Earth 10.1002/2016JB013478
WILDMAN ET AL. MESOZOIC EVOLUTION OF SOUTHERN AFRICA 5
further support to earlier thermochronology [Gallagher and Brown, 1997; Kounov et al., 2009] and struc-tural investigations [Viola et al., 2012] that advocate significant post-rift tectonic activity in theNamaqualand region. Seismic activity indicates that the tectonic boundary between the KaapvaalCraton and Namaqua Metamorphic Province mobile belt remains active [Tankard et al., 2009]. Post-rifttectonic activity is well documented for the offshore margin. Seismic reflection data from the Orange,Luderitz, and Walvis Basins, adjacent to the South African and Namibian continental margins, clearlyindicate regional deformation in the Upper Cretaceous sequences and segmentation of the margin byfaults, which can be traced onshore [Dingle et al., 1983; Clemson et al., 1997; Viola et al., 2005; de Veraet al., 2010].
3. Apatite Fission Track and (U-Th-Sm)/He Analysis
In apatite, annealing of damage trails from the spontaneous fission of U and retention of He from the alphadecay of U, Th, and Sm as the crystal cools through temperatures of 120 to 40°C in the upper crust enableapatite fission track and apatite (U-Th-Sm)/He analysis to constrain denudation-driven exhumation over mil-lion year timescales [Lisker et al., 2009].
Spontaneous fission tracks form in apatite with an initial etchable length of ~16 ± 1μm [Green et al., 1986].Fission tracks anneal primarily as a function of temperature such that, at temperatures hotter than 110± 10°C, tracks are entirely annealed and temperatures cooler than 60°C track annealing is minimal [Greenet al., 1985]. The intervening temperature range is termed as the partial annealing zone where annealing rateis inversely proportional to temperature [Gleadow and Fitzgerald, 1987]. Apatite composition (particularly F,Cl, and OH substitution) can also influence the annealing rate of tracks [Carlson et al., 1999]. By measuringthe spontaneous track density of 238U in a sample relative to the induced track density of 235U in a mica exter-nal detector, a fission track age can be obtained. Age data can be combined with length measurements of
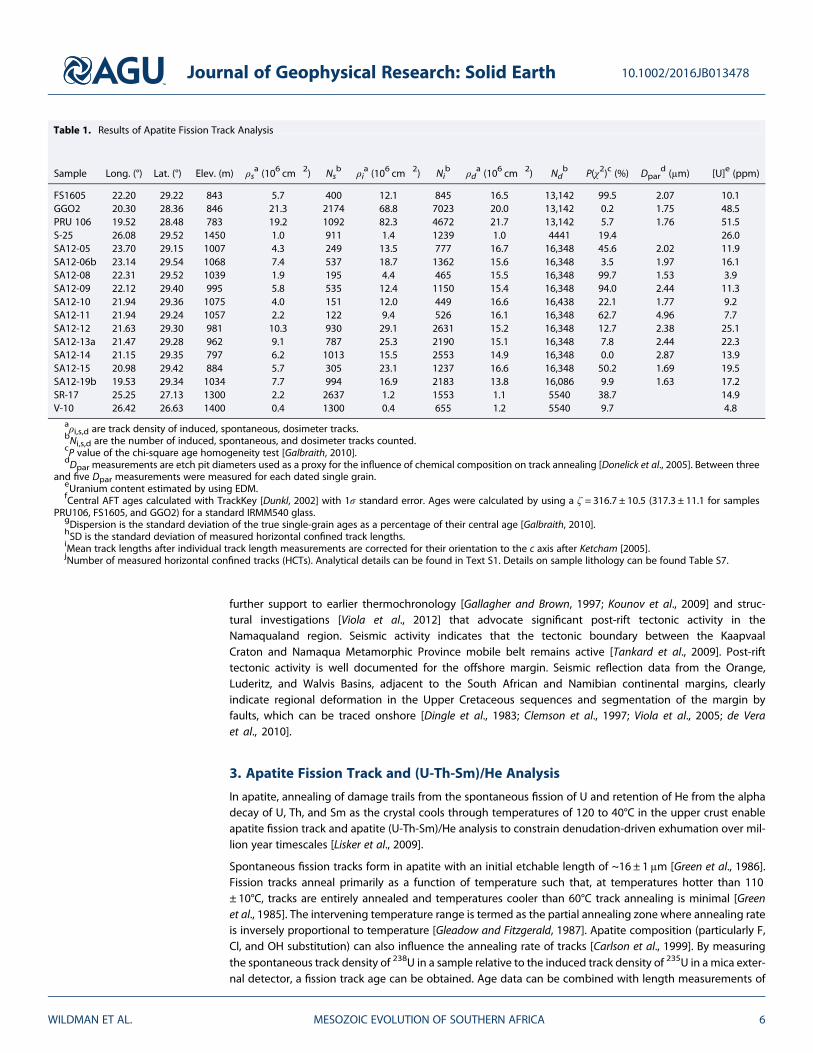
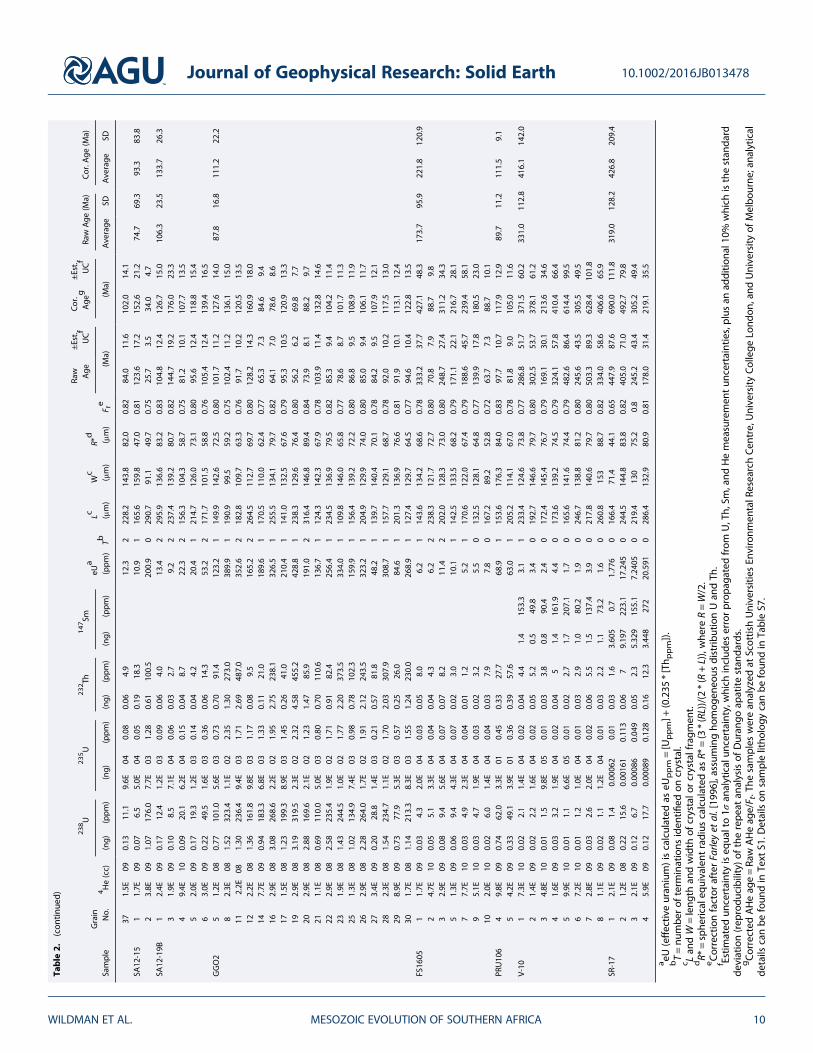
Table 1. Results of Apatite Fission Track Analysis
aρi,s,d are track density of induced, spontaneous, dosimeter tracks.bNi,s,d are the number of induced, spontaneous, and dosimeter tracks counted.cP value of the chi-square age homogeneity test [Galbraith, 2010].dDpar measurements are etch pit diameters used as a proxy for the influence of chemical composition on track annealing [Donelick et al., 2005]. Between three
and five Dpar measurements were measured for each dated single grain.eUranium content estimated by using EDM.fCentral AFT ages calculated with TrackKey [Dunkl, 2002] with 1σ standard error. Ages were calculated by using a ζ = 316.7 ± 10.5 (317.3 ± 11.1 for samples
PRU106, FS1605, and GGO2) for a standard IRMM540 glass.gDispersion is the standard deviation of the true single-grain ages as a percentage of their central age [Galbraith, 2010].hSD is the standard deviation of measured horizontal confined track lengths.iMean track lengths after individual track length measurements are corrected for their orientation to the c axis after Ketcham [2005].jNumber of measured horizontal confined tracks (HCTs). Analytical details can be found in Text S1. Details on sample lithology can be found Table S7.
Journal of Geophysical Research: Solid Earth 10.1002/2016JB013478
WILDMAN ET AL. MESOZOIC EVOLUTION OF SOUTHERN AFRICA 6
horizontal tracks beneath the polished surface to reveal information on both the timing and rate of samplecooling [Gallagher et al., 1998].
Defining a nominal closure temperature for the apatite (U-Th-Sm)/He dating system has proven to be chal-lenging [Fitzgerald et al., 2006]. Depending on the size of the apatite crystal (i.e., the diffusion domain) andthe amount of accumulated radiation damage, the temperature range between total retention of heliumand complete diffusive loss of helium can vary from 40 to 120°C [Gautheron et al., 2013]. Depending onthe cooling history through this partial retention zone, variations in closure temperature can result in intra-sample single-grain AHe ages being significantly dispersed [Brown et al., 2013]. To understand the controlson AHe age dispersion and the information this can yield on the thermal history of the sample, multiplesingle-grain aliquots are typically measured.
3.1. Apatite Fission Track Analysis
The external detector method [e.g., Hurford and Green, 1982; Green et al., 1989; Donelick et al., 2005] (Text S1in the supporting information) was used to obtain AFT data from 17 samples collected across theSouthwest Africa plateau (Table 1). The main transect extends west from Douglas to Pofadder cuttingacross and beyond the major NW-SE trending structures (e.g., Doringberg and Hartbees thrust faults).Central AFT ages range from 58.9 ± 5.9 to 379.0 ± 23.0Ma with more than half of the sample ages beingLate Cretaceous (i.e., 110–70Ma). Mean track lengths (MTLs) within samples range from 10.33 ± 0.24 to14.29 ± 0.12μm with the standard deviation of track length measurements ranging from 1.17 to 2.19 (seeFigure S2 for TLDs).
The 17 samples analyzed across the study area provided a good number of grains suitable for AFTdating (n> 17 for 15 samples), each with moderate-to-high track density. Radial plots for all 17 samplescan be found in Figure S3 and highlight the dispersion on single-grain ages. Three samples (GGO2,SA12-06, and SA12-14) fail the chi-square homogeneity test (i.e., P(χ2)< 0.05); however, single-grainage dispersion for these samples is ≤20% and is therefore not considered to be significantly overdis-persed. To robustly interpret the significance of the AFT age in terms of the samples’ thermal history,the track length distribution, compositional kinetic parameters for the sample must also be takeninto account.
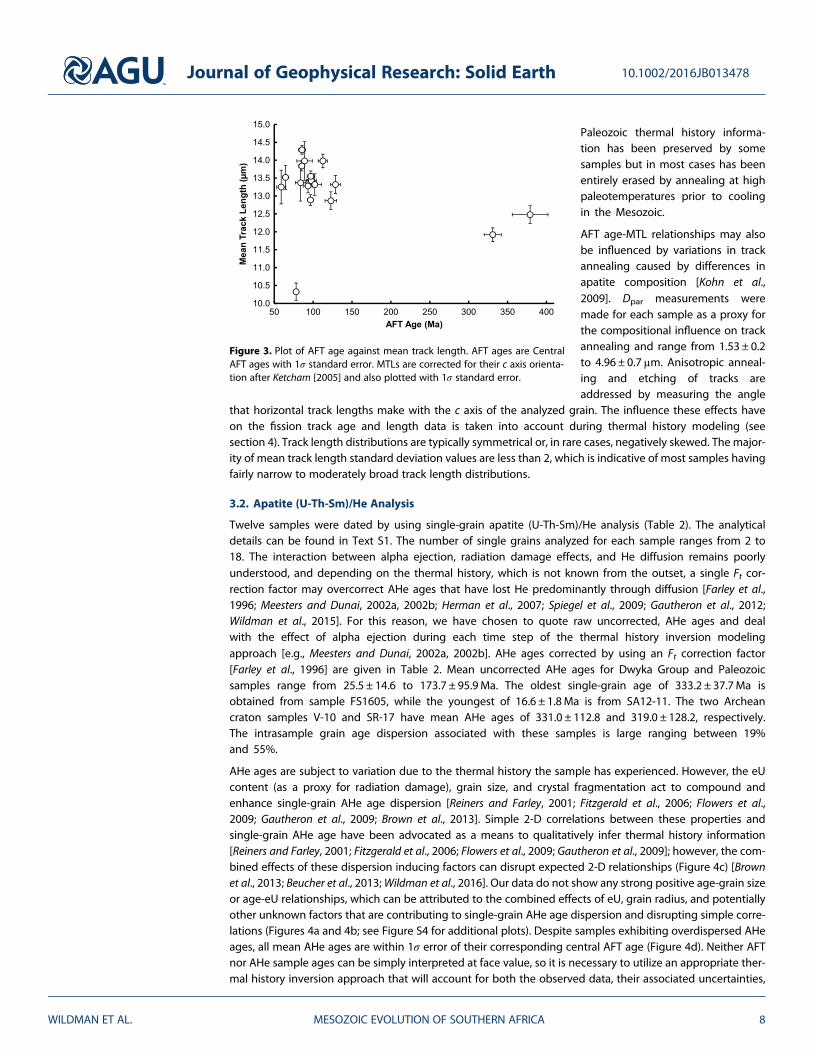
The relationship between AFT ages and MTLs plotted in Figure 3 clearly shows that Cretaceous ages areassociated with relatively long mean track lengths (i.e., > 13μm) and older ages (>300Ma) associatedwith shorter MTLs. Although relatively few data points record old AFT ages, the data set implies that
Journal of Geophysical Research: Solid Earth 10.1002/2016JB013478
WILDMAN ET AL. MESOZOIC EVOLUTION OF SOUTHERN AFRICA 7
Paleozoic thermal history informa-tion has been preserved by somesamples but in most cases has beenentirely erased by annealing at highpaleotemperatures prior to coolingin the Mesozoic.
AFT age-MTL relationships may alsobe influenced by variations in trackannealing caused by differences inapatite composition [Kohn et al.,2009]. Dpar measurements weremade for each sample as a proxy forthe compositional influence on trackannealing and range from 1.53 ± 0.2to 4.96 ± 0.7μm. Anisotropic anneal-ing and etching of tracks areaddressed by measuring the angle
that horizontal track lengths make with the c axis of the analyzed grain. The influence these effects haveon the fission track age and length data is taken into account during thermal history modeling (seesection 4). Track length distributions are typically symmetrical or, in rare cases, negatively skewed. The major-ity of mean track length standard deviation values are less than 2, which is indicative of most samples havingfairly narrow to moderately broad track length distributions.
3.2. Apatite (U-Th-Sm)/He Analysis
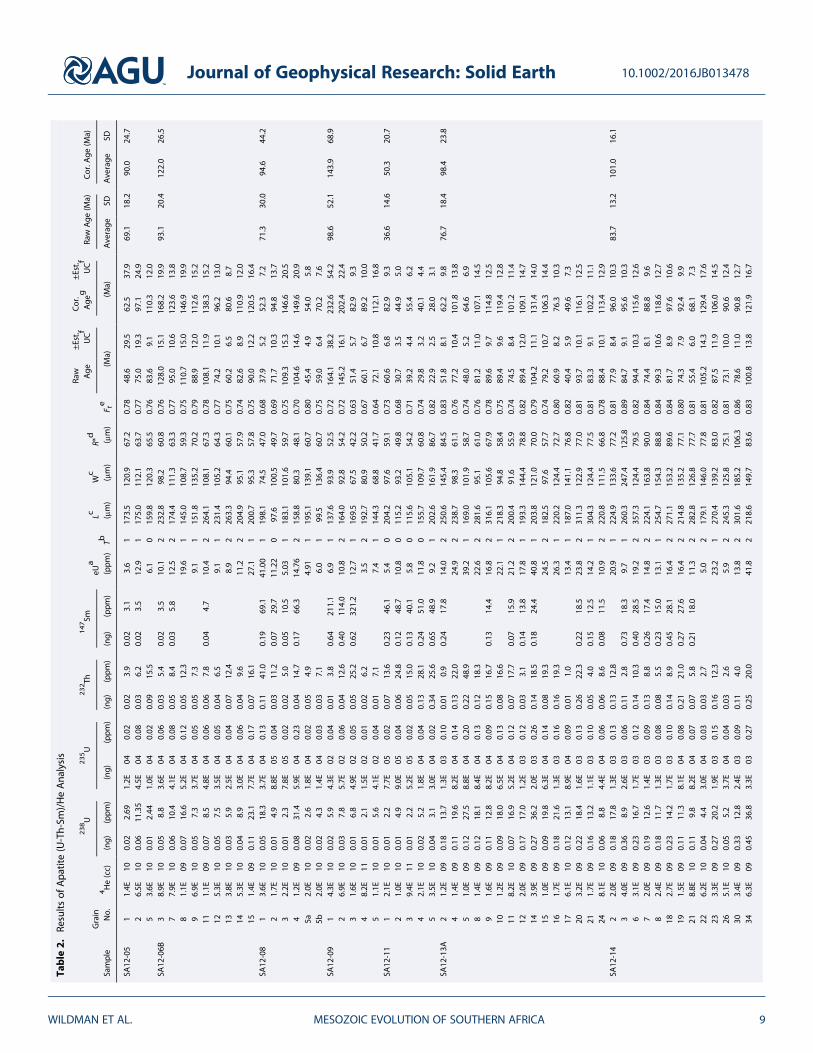
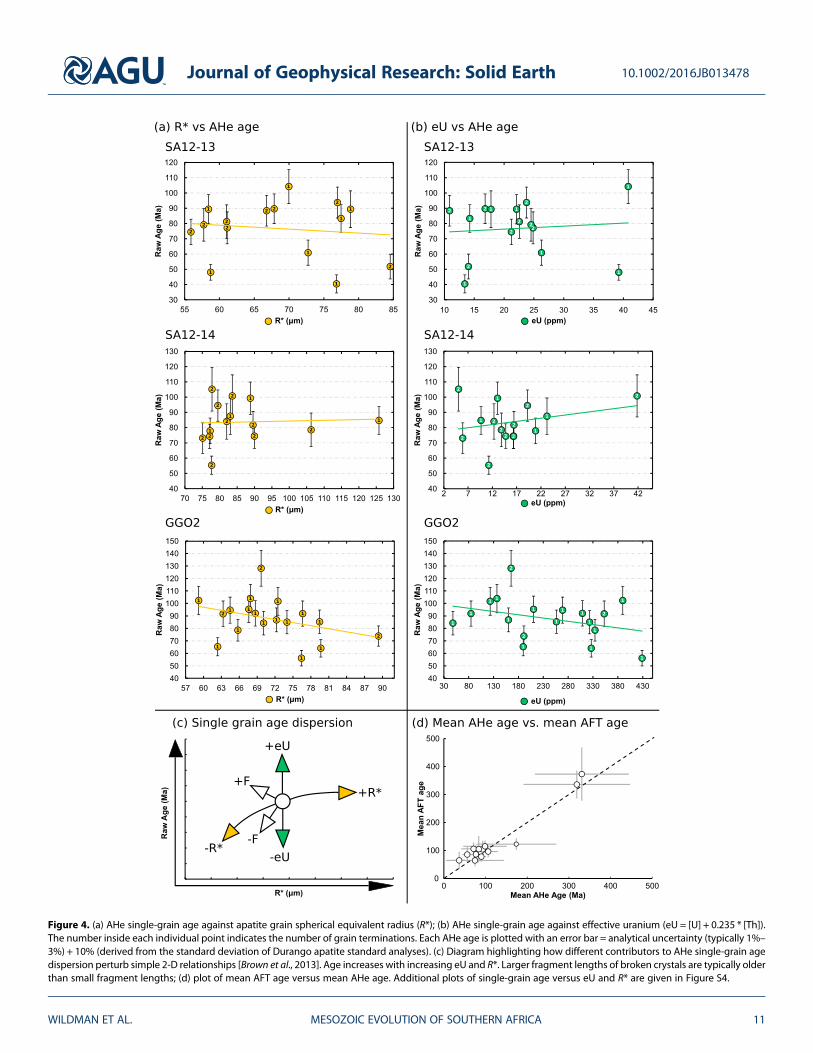
Twelve samples were dated by using single-grain apatite (U-Th-Sm)/He analysis (Table 2). The analyticaldetails can be found in Text S1. The number of single grains analyzed for each sample ranges from 2 to18. The interaction between alpha ejection, radiation damage effects, and He diffusion remains poorlyunderstood, and depending on the thermal history, which is not known from the outset, a single Ft cor-rection factor may overcorrect AHe ages that have lost He predominantly through diffusion [Farley et al.,1996; Meesters and Dunai, 2002a, 2002b; Herman et al., 2007; Spiegel et al., 2009; Gautheron et al., 2012;Wildman et al., 2015]. For this reason, we have chosen to quote raw uncorrected, AHe ages and dealwith the effect of alpha ejection during each time step of the thermal history inversion modelingapproach [e.g., Meesters and Dunai, 2002a, 2002b]. AHe ages corrected by using an Ft correction factor[Farley et al., 1996] are given in Table 2. Mean uncorrected AHe ages for Dwyka Group and Paleozoicsamples range from 25.5 ± 14.6 to 173.7 ± 95.9Ma. The oldest single-grain age of 333.2 ± 37.7Ma isobtained from sample FS1605, while the youngest of 16.6 ± 1.8Ma is from SA12-11. The two Archeancraton samples V-10 and SR-17 have mean AHe ages of 331.0 ± 112.8 and 319.0 ± 128.2, respectively.The intrasample grain age dispersion associated with these samples is large ranging between 19%and 55%.
AHe ages are subject to variation due to the thermal history the sample has experienced. However, the eUcontent (as a proxy for radiation damage), grain size, and crystal fragmentation act to compound andenhance single-grain AHe age dispersion [Reiners and Farley, 2001; Fitzgerald et al., 2006; Flowers et al.,2009; Gautheron et al., 2009; Brown et al., 2013]. Simple 2-D correlations between these properties andsingle-grain AHe age have been advocated as a means to qualitatively infer thermal history information[Reiners and Farley, 2001; Fitzgerald et al., 2006; Flowers et al., 2009; Gautheron et al., 2009]; however, the com-bined effects of these dispersion inducing factors can disrupt expected 2-D relationships (Figure 4c) [Brownet al., 2013; Beucher et al., 2013;Wildman et al., 2016]. Our data do not show any strong positive age-grain sizeor age-eU relationships, which can be attributed to the combined effects of eU, grain radius, and potentiallyother unknown factors that are contributing to single-grain AHe age dispersion and disrupting simple corre-lations (Figures 4a and 4b; see Figure S4 for additional plots). Despite samples exhibiting overdispersed AHeages, all mean AHe ages are within 1σ error of their corresponding central AFT age (Figure 4d). Neither AFTnor AHe sample ages can be simply interpreted at face value, so it is necessary to utilize an appropriate ther-mal history inversion approach that will account for both the observed data, their associated uncertainties,
Figure 3. Plot of AFT age against mean track length. AFT ages are CentralAFT ages with 1σ standard error. MTLs are corrected for their c axis orienta-tion after Ketcham [2005] and also plotted with 1σ standard error.
Journal of Geophysical Research: Solid Earth 10.1002/2016JB013478
WILDMAN ET AL. MESOZOIC EVOLUTION OF SOUTHERN AFRICA 8
Table
2.Re
sults
ofApa
tite(U-Th-Sm
)/HeAna
lysis
Sample
Grain No.
4He(cc)
238U
235U
232Th
147Sm
eUa
(ppm
)Tb
Lc (μm)
Wc
(μm)
R*d
(μm)
F te
Raw Age
±Est.
UCf
Cor.
Ageg
±Est.
UCf
RawAge
(Ma)
Cor.A
ge(M
a)
(ng)
(ppm
)(ng)
(ppm
)(ng)
(ppm
)(ng)
(ppm
)(M
a)(M
a)Average
SDAverage
SD
SA12
-05
11.4E
�10
0.02
2.69
1.2E
�04
0.02
0.02
3.9
0.02
3.1
3.6
117
3.5
120.9
67.2
0.78
48.6
29.5
62.5
37.9
69.1
18.2
90.0
24.7
26.5E
�10
0.06
11.35
4.5E
�04
0.08
0.03
6.2
0.02
3.5
12.9
117
5.0
112.1
63.7
0.77
75.0
19.3
97.1
24.9
53.6E
�10
0.01
2.44
1.0E
�04
0.02
0.09
15.5
6.1
015
9.8
120.3
65.5
0.76
83.6
9.1
110.3
12.0
SA12
-06B
38.9E
�10
0.05
8.8
3.6E
�04
0.06
0.03
5.4
0.02
3.5
10.1
223
2.8
98.2
60.8
0.76
128.0
15.1
168.2
19.9
93.1
20.4
122.0
26.5
77.9E
�10
0.06
10.4
4.1E
�04
0.08
0.05
8.4
0.03
5.8
12.5
217
4.4
111.3
63.3
0.77
95.0
10.6
123.6
13.8
81.1E
�09
0.07
16.6
5.2E
�04
0.12
0.05
12.3
19.6
114
5.0
108.7
59.3
0.75
110.7
15.0
146.9
19.9
96.9E
�10
0.05
7.3
3.7E
�04
0.05
0.05
7.3
9.1
115
1.8
135.2
70.2
0.79
88.9
12.0
112.6
15.2
111.1E
�09
0.07
8.5
4.8E
�04
0.06
0.06
7.8
0.04
4.7
10.4
226
4.1
108.1
67.3
0.78
108.1
11.9
138.3
15.2
125.3E
�10
0.05
7.5
3.5E
�04
0.05
0.04
6.5
9.1
123
1.4
105.2
64.3
0.77
74.2
10.1
96.2
13.0
133.8E
�10
0.03
5.9
2.5E
�04
0.04
0.07
12.4
8.9
226
3.3
94.4
60.1
0.75
60.2
6.5
80.6
8.7
145.3E
�10
0.04
8.9
3.0E
�04
0.06
0.04
9.6
11.2
220
4.9
95.1
57.9
0.74
82.6
8.9
110.9
12.0
151.4E
�09
0.11
23.1
7.7E
�04
0.17
0.07
16.1
27.1
120
0.7
95.3
57.8
0.75
90.0
12.2
120.5
16.4
SA12
-08
13.6E
�10
0.05
18.3
3.7E
�04
0.13
0.11
41.0
0.19
69.1
41.00
119
8.1
74.5
47.0
0.68
37.9
5.2
52.3
7.2
71.3
30.0
94.6
44.2
21.7E
�10
0.01
4.9
8.8E
�05
0.04
0.03
11.2
0.07
29.7
11.22
097
.610
0.5
49.7
0.69
71.7
10.3
94.8
13.7
32.2E
�10
0.01
2.3
7.8E
�05
0.02
0.02
5.0
0.05
10.5
5.03
118
3.1
101.6
59.7
0.75
109.3
15.3
146.6
20.5
41.2E
�09
0.08
31.4
5.9E
�04
0.23
0.04
14.7
0.17
66.3
14.76
215
8.8
80.3
48.1
0.70
104.6
14.6
149.6
20.9
5a2.0E
�10
0.02
2.6
1.8E
�04
0.02
0.05
4.9
4.91
119
5.1
139.1
60.7
0.80
45.4
4.9
54.0
5.8
5b2.0E
�10
0.02
4.3
1.4E
�04
0.03
0.03
7.1
6.0
199
.513
6.4
60.7
0.75
59.0
6.4
70.2
7.6
SA12
-09
14.3E
�10
0.02
5.9
4.3E
�02
0.04
0.01
3.8
0.64
211.1
6.9
113
7.6
93.9
52.5
0.72
164.1
38.2
232.6
54.2
98.6
52.1
143.9
68.9
26.9E
�10
0.03
7.8
5.7E
�02
0.06
0.04
12.6
0.40
114.0
10.8
216
4.0
92.8
54.2
0.72
145.2
16.1
202.4
22.4
31.6E
�10
0.01
6.8
4.9E
�02
0.05
0.05
25.2
0.62
321.2
12.7
116
9.5
67.5
42.2
0.63
51.4
5.7
82.9
9.3
48.2E
�11
0.01
2.1
1.5E
�02
0.01
0.02
6.2
3.5
219
2.7
80.9
50.2
0.67
60.1
6.7
89.2
10.0
51.1E
�10
0.01
5.6
4.1E
�02
0.04
0.01
7.1
7.4
114
4.3
68.8
41.7
0.64
72.1
10.8
112.1
16.8
SA12
-11
12.1E
�10
0.01
2.2
7.7E
�05
0.02
0.07
13.6
0.23
46.1
5.4
020
4.2
97.6
59.1
0.73
60.6
6.8
82.9
9.3
36.6
14.6
50.3
20.7
21.0E
�10
0.01
4.9
9.0E
�05
0.04
0.06
24.8
0.12
48.7
10.8
011
5.2
93.2
49.8
0.68
30.7
3.5
44.9
5.0
39.4E
�11
0.01
2.2
5.2E
�05
0.02
0.05
15.0
0.13
40.1
5.8
011
5.6
105.1
54.2
0.71
39.2
4.4
55.4
6.2
42.1E
�10
0.02
5.2
1.8E
�04
0.04
0.13
28.1
0.24
51.0
11.8
015
5.7
109.7
60.8
0.74
29.8
3.2
40.1
4.4
53.5E
�10
0.04
3.1
3.0E
�04
0.02
0.34
25.6
0.65
48.9
9.2
120
2.6
161.9
86.7
0.82
22.9
2.5
28.0
3.1
SA12
-13A
21.2E
�09
0.18
13.7
1.3E
�03
0.10
0.01
0.9
0.24
17.8
14.0
225
0.6
145.4
84.5
0.83
51.8
8.1
62.2
9.8
76.7
18.4
98.4
23.8
41.4E
�09
0.11
19.6
8.2E
�04
0.14
0.13
22.0
24.9
223
8.7
98.3
61.1
0.76
77.2
10.4
101.8
13.8
51.0E
�09
0.12
27.5
8.8E
�04
0.20
0.22
48.9
39.2
116
9.0
101.9
58.7
0.74
48.0
5.2
64.6
6.9
81.4E
�09
0.12
18.1
8.4E
�04
0.13
0.12
18.3
22.6
228
1.6
95.1
61.0
0.76
81.2
11.0
107.1
14.5
91.6E
�09
0.11
12.8
8.2E
�04
0.09
0.15
16.7
0.13
14.4
16.8
231
6.1
105.6
67.9
0.78
89.6
9.7
114.8
12.5
101.2E
�09
0.09
18.0
6.5E
�04
0.13
0.08
16.6
22.1
121
8.3
94.8
58.4
0.75
89.4
9.6
119.4
12.8
118.2E
�10
0.07
16.9
5.2E
�04
0.12
0.07
17.7
0.07
15.9
21.2
220
0.4
91.6
55.9
0.74
74.5
8.4
101.2
11.4
122.0E
�09
0.17
17.0
1.2E
�03
0.12
0.03
3.1
0.14
13.8
17.8
119
3.3
144.4
78.8
0.82
89.4
12.0
109.1
14.7
143.9E
�09
0.27
36.2
2.0E
�03
0.26
0.14
18.5
0.18
24.4
40.8
120
3.8
121.0
70.0
0.79
104.2
11.1
131.4
14.0
151.0E
�09
0.09
19.8
6.3E
�04
0.14
0.08
19.3
24.5
218
2.5
97.6
57.7
0.74
79.2
10.7
106.3
14.4
161.7E
�09
0.18
21.6
1.3E
�03
0.16
0.16
19.3
26.3
122
0.2
124.4
72.7
0.80
60.9
8.2
76.3
10.3
176.1E
�10
0.12
13.1
8.9E
�04
0.09
0.01
1.0
13.4
118
7.0
141.1
76.8
0.82
40.4
5.9
49.6
7.3
203.2E
�09
0.22
18.4
1.6E
�03
0.13
0.26
22.3
0.22
18.5
23.8
231
1.3
122.9
77.0
0.81
93.7
10.1
116.1
12.5
211.7E
�09
0.16
13.2
1.1E
�03
0.10
0.05
4.0
0.15
12.5
14.2
130
4.3
124.4
77.5
0.81
83.3
9.1
102.2
11.1
248.1E
�10
0.06
8.8
4.4E
�04
0.06
0.06
8.6
0.08
11.5
10.9
222
0.8
111.5
66.8
0.78
88.4
10.1
113.4
12.9
SA12
-14
22.0E
�09
0.18
17.8
1.3E
�03
0.13
0.13
12.8
20.9
122
4.9
133.6
77.2
0.81
77.9
8.4
96.0
10.3
83.7
13.2
101.0
16.1
34.0E
�09
0.36
8.9
2.6E
�03
0.06
0.11
2.8
0.73
18.3
9.7
126
0.3
247.4
125.8
0.89
84.7
9.1
95.6
10.3
63.1E
�09
0.23
16.7
1.7E
�03
0.12
0.14
10.3
0.40
28.5
19.2
235
7.3
124.4
79.5
0.82
94.4
10.3
115.6
12.6
72.0E
�09
0.19
12.6
1.4E
�03
0.09
0.13
8.8
0.26
17.4
14.8
222
4.1
163.8
90.0
0.84
74.4
8.1
88.8
9.6
82.4E
�09
0.18
11.7
1.3E
�03
0.08
0.08
5.5
0.23
15.0
13.1
125
4.7
154.3
88.8
0.84
99.3
10.6
118.6
12.7
182.7E
�09
0.23
14.2
1.7E
�03
0.10
0.14
8.9
0.45
28.1
16.4
227
1.1
153.2
89.6
0.84
81.7
8.9
97.6
10.6
191.5E
�09
0.11
11.3
8.1E
�04
0.08
0.21
21.0
0.27
27.6
16.4
221
4.8
135.2
77.1
0.80
74.3
7.9
92.4
9.9
218.8E
�10
0.11
9.8
8.2E
�04
0.07
0.07
5.8
0.21
18.0
11.3
228
2.8
126.8
77.7
0.81
55.4
6.0
68.1
7.3
226.2E
�10
0.04
4.4
3.0E
�04
0.03
0.03
2.7
5.0
217
9.1
146.0
77.8
0.81
105.2
14.3
129.4
17.6
233.3E
�09
0.27
20.2
1.9E
�03
0.15
0.16
12.3
23.2
127
0.4
139.2
83.0
0.82
87.5
11.9
106.0
14.5
265.1E
�10
0.05
5.2
3.7E
�04
0.04
0.03
2.6
5.9
224
5.3
125.8
75.1
0.81
73.1
10.0
90.6
12.4
303.4E
�09
0.33
12.8
2.4E
�03
0.09
0.11
4.0
13.8
230
1.6
185.2
106.3
0.86
78.6
11.0
90.8
12.7
346.3E
�09
0.45
36.8
3.3E
�03
0.27
0.25
20.0
41.8
221
8.6
149.7
83.6
0.83
100.8
13.8
121.9
16.7
Journal of Geophysical Research: Solid Earth 10.1002/2016JB013478
WILDMAN ET AL. MESOZOIC EVOLUTION OF SOUTHERN AFRICA 9
Table
2.(con
tinue
d)
Sample
Grain No.
4He(cc)
238U
235U
232Th
147Sm
eUa
(ppm
)Tb
Lc (μm)
Wc
(μm)
R*d
(μm)
F te
Raw Age
±Est.
UCf
Cor.
Ageg
±Est.
UCf
RawAge
(Ma)
Cor.A
ge(M
a)
(ng)
(ppm
)(ng)
(ppm
)(ng)
(ppm
)(ng)
(ppm
)(M
a)(M
a)Average
SDAverage
SD
371.5E
�09
0.13
11.1
9.6E
�04
0.08
0.06
4.9
12.3
222
8.2
143.8
82.0
0.82
84.0
11.6
102.0
14.1
SA12
-15
11.7E
�09
0.07
6.5
5.0E
�04
0.05
0.19
18.3
10.9
116
5.6
159.8
47.0
0.81
123.6
17.2
152.6
21.2
74.7
69.3
93.3
83.8
23.8E
�09
1.07
176.0
7.7E
�03
1.28
0.61
100.5
200.9
029
0.7
91.1
49.7
0.75
25.7
3.5
34.0
4.7
SA12
-19B
12.4E
�09
0.17
12.4
1.2E
�03
0.09
0.06
4.0
13.4
229
5.9
136.6
83.2
0.83
104.8
12.4
126.7
15.0
106.3
23.5
133.7
26.3
31.9E
�09
0.10
8.5
7.1E
�04
0.06
0.03
2.7
9.2
223
7.4
139.2
80.7
0.82
144.7
19.2
176.0
23.3
49.4E
�10
0.09
20.1
6.2E
�04
0.15
0.04
8.7
22.3
215
6.3
104.3
58.7
0.75
81.2
10.1
107.7
13.5
52.0E
�09
0.17
19.3
1.2E
�03
0.14
0.04
4.2
20.4
121
4.7
126.0
73.1
0.80
95.6
12.4
118.8
15.4
63.0E
�09
0.22
49.5
1.6E
�03
0.36
0.06
14.3
53.2
217
1.7
101.5
58.8
0.76
105.4
12.4
139.4
16.5
GGO2
51.2E
�08
0.77
101.0
5.6E
�03
0.73
0.70
91.4
123.2
114
9.9
142.6
72.5
0.80
101.7
11.2
127.6
14.0
87.8
16.8
111.2
22.2
82.3E
�08
1.52
323.4
1.1E
�02
2.35
1.30
273.0
389.9
119
0.9
99.5
59.2
0.75
102.4
11.2
136.1
15.0
112.2E�0
81.30
236.4
9.4E
�03
1.71
2.69
487.0
352.6
218
2.8
109.7
63.3
0.76
91.7
10.2
120.5
13.5
122.2E
�08
1.36
161.8
9.8E
�03
1.17
0.08
9.5
165.2
226
4.5
112.7
69.7
0.80
128.2
14.3
160.9
18.0
147.7E
�09
0.94
183.3
6.8E
�03
1.33
0.11
21.0
189.6
117
0.5
110.0
62.4
0.77
65.3
7.3
84.6
9.4
162.9E
�08
3.08
268.6
2.2E
�02
1.95
2.75
238.1
326.5
125
5.5
134.1
79.7
0.82
64.1
7.0
78.6
8.6
171.5E
�08
1.23
199.3
8.9E
�03
1.45
0.26
41.0
210.4
114
1.0
132.5
67.6
0.79
95.3
10.5
120.9
13.3
192.9E
�08
3.19
319.5
2.3E
�02
2.32
4.58
455.2
428.8
123
8.3
129.6
76.4
0.80
56.2
6.2
69.8
7.7
202.9E
�08
2.88
169.6
2.1E
�02
1.23
1.47
85.9
191.0
231
6.4
146.8
89.4
0.84
73.9
8.1
88.2
9.7
211.1E
�08
0.69
110.0
5.0E
�03
0.80
0.70
110.6
136.7
112
4.3
142.3
67.9
0.78
103.9
11.4
132.8
14.6
222.9E
�08
2.58
235.4
1.9E
�02
1.71
0.91
82.4
256.4
123
4.5
136.9
79.5
0.82
85.3
9.4
104.2
11.4
231.9E
�08
1.43
244.5
1.0E
�02
1.77
2.20
373.5
334.0
110
9.8
146.0
65.8
0.77
78.6
8.7
101.7
11.3
251.3E
�08
1.02
134.9
7.4E
�03
0.98
0.78
102.3
159.9
115
6.4
139.2
72.2
0.80
86.8
9.5
108.9
11.9
262.9E
�08
2.28
264.0
1.7E
�02
1.91
2.12
243.5
323.2
120
4.9
129.9
74.0
0.80
85.0
9.4
106.1
11.7
273.4E
�09
0.20
28.8
1.4E
�03
0.21
0.57
81.8
48.2
113
9.7
140.4
70.1
0.78
84.2
9.5
107.9
12.1
282.3E
�08
1.54
234.7
1.1E
�02
1.70
2.03
307.9
308.7
115
7.7
129.1
68.7
0.78
92.0
10.2
117.5
13.0
298.9E
�09
0.73
77.9
5.3E
�03
0.57
0.25
26.0
84.6
120
1.3
136.9
76.6
0.81
91.9
10.1
113.1
12.4
301.7E
�08
1.14
213.3
8.3E
�03
1.55
1.24
230.0
268.9
112
7.4
129.7
64.5
0.77
94.6
10.4
122.8
13.5
FS16
051
1.7E
�09
0.03
4.3
2.0E
�04
0.03
0.05
8.0
6.2
114
3.6
134.2
68.6
0.78
333.2
37.7
427.1
48.3
173.7
95.9
221.8
120.9
24.7E
�10
0.05
5.1
3.3E
�04
0.04
0.04
4.3
6.2
223
8.3
121.7
72.7
0.80
70.8
7.9
88.7
9.8
32.9E
�09
0.08
9.4
5.6E
�04
0.07
0.07
8.2
11.4
220
2.0
128.3
73.0
0.80
248.7
27.4
311.2
34.3
51.3E
�09
0.06
9.4
4.3E
�04
0.07
0.02
3.0
10.1
114
2.5
133.5
68.2
0.79
171.1
22.1
216.7
28.1
77.7E
�10
0.03
4.9
2.3E
�04
0.04
0.01
1.2
5.2
117
0.6
122.0
67.4
0.79
188.6
45.7
239.4
58.1
95.1E
�10
0.03
4.7
1.9E
�04
0.03
0.02
3.2
5.5
013
2.5
128.1
64.8
0.77
139.9
17.8
180.5
23.0
102.0E
�10
0.02
6.0
1.4E
�04
0.04
0.03
7.9
7.8
016
7.2
89.2
52.8
0.72
63.7
7.3
88.7
10.1
PRU10
64
9.8E
�09
0.74
62.0
3.3E
�01
0.45
0.33
27.7
68.9
115
3.6
176.3
84.0
0.83
97.7
10.7
117.9
12.9
89.7
11.2
111.5
9.1
54.2E
�09
0.33
49.1
3.9E
�01
0.36
0.39
57.6
63.0
120
5.2
114.1
67.0
0.78
81.8
9.0
105.0
11.6
V-10
17.3E
�10
0.02
2.1
1.4E
�04
0.02
0.04
4.4
1.4
153.3
3.1
123
3.4
124.6
73.8
0.77
286.8
51.7
371.5
60.2
331.0
112.8
416.1
142.0
21.4E
�09
0.02
2.2
1.6E
�04
0.02
0.05
5.2
0.5
49.8
3.4
019
2.7
146.6
79.7
0.80
302.5
53.7
378.1
61.2
34.8E
�10
0.01
1.5
9.8E
�05
0.01
0.03
3.8
0.8
90.4
2.4
017
2.4
145.4
76.7
0.79
169.1
30.1
213.6
34.6
41.6E
�09
0.03
3.2
1.9E
�04
0.02
0.04
51.4
161.9
4.4
017
3.6
139.2
74.5
0.79
324.1
57.8
410.4
66.4
59.9E
�10
0.01
1.1
6.6E
�05
0.01
0.02
2.7
1.7
207.1
1.7
016
5.6
141.6
74.4
0.79
482.6
86.4
614.4
99.5
67.2E
�10
0.01
1.2
1.0E
�04
0.01
0.03
2.9
1.0
80.2
1.9
024
6.7
138.8
81.2
0.80
245.6
43.5
305.5
49.5
72.8E
�09
0.03
2.6
2.0E
�04
0.02
0.06
5.5
1.5
137.4
3.9
021
7.8
140.6
79.7
0.80
503.3
89.3
628.4
101.8
81.1E
�09
0.02
1.1
1.2E
�04
0.01
0.03
2.2
1.1
73.2
1.6
026
0.8
153
88.7
0.82
334.0
58.6
406.6
65.9
SR-17
12.1E
�09
0.08
1.4
0.00
062
0.01
0.03
1.6
3.60
50.7
1.77
60
166.4
71.4
44.1
0.65
447.9
87.6
690.0
111.8
319.0
128.2
426.8
209.4
21.2E
�08
0.22
15.6
0.00
161
0.11
30.06
79.19
722
3.1
17.245
024
4.5
144.8
83.8
0.82
405.0
71.0
492.7
79.8
32.1E
�09
0.12
6.7
0.00
086
0.04
90.05
2.3
5.32
915
5.1
7.24
050
219.4
130
75.2
0.8
245.2
43.4
305.2
49.4
45.9E
�09
0.12
17.7
0.00
089
0.12
80.16
12.3
3.44
827
220
.591
028
6.4
132.9
80.9
0.81
178.0
31.4
219.1
35.5
a eU(effectiv
euran
ium)iscalculated
aseU
ppm=[U
ppm]+
(0.235
*[Th p
pm]).
bT=nu
mbe
rof
term
inations
iden
tified
oncrystal.
c Lan
dW
=leng
than
dwidth
ofcrystalo
rcrystalfragm
ent.
dR*
=sphe
ricaleq
uivalent
radius
calculated
asR*
=(3*(RL))/(2*(R+L)),whe
reR=W/2.
eCorrectionfactor
afterFarleyet
al.[19
96],assumingho
mog
eneo
usdistrib
utionUan
dTh
.f Estim
ated
uncertaintyiseq
ualto1σ
analyticalun
certainty,which
includ
eserrorprop
agated
from
U,Th,Sm
,and
Hemeasuremen
tun
certainties,plus
anad
ditio
nal10%
which
isthestan
dard
deviation(rep
rodu
cibility)
oftherepe
atan
alysisof
Duran
goap
atite
stan
dards.
gCorrected
AHeag
e=Ra
wAHeag
e/F t.The
samples
werean
alyzed
atScottishUniversities
Environm
entalR
esearchCen
tre,University
College
Lond
on,and
University
ofMelbo
urne
;ana
lytical
details
canbe
foun
din
Text
S1.D
etailson
samplelitho
logy
canbe
foun
din
TableS7.
Journal of Geophysical Research: Solid Earth 10.1002/2016JB013478
WILDMAN ET AL. MESOZOIC EVOLUTION OF SOUTHERN AFRICA 10
Figure 4. (a) AHe single-grain age against apatite grain spherical equivalent radius (R*); (b) AHe single-grain age against effective uranium (eU = [U] + 0.235 * [Th]).The number inside each individual point indicates the number of grain terminations. Each AHe age is plotted with an error bar = analytical uncertainty (typically 1%–3%) + 10% (derived from the standard deviation of Durango apatite standard analyses). (c) Diagram highlighting how different contributors to AHe single-grain agedispersion perturb simple 2-D relationships [Brown et al., 2013]. Age increases with increasing eU and R*. Larger fragment lengths of broken crystals are typically olderthan small fragment lengths; (d) plot of mean AFT age versus mean AHe age. Additional plots of single-grain age versus eU and R* are given in Figure S4.
Journal of Geophysical Research: Solid Earth 10.1002/2016JB013478
WILDMAN ET AL. MESOZOIC EVOLUTION OF SOUTHERN AFRICA 11
and the uncertainties on the model parameterization itself. This is particularly important when integratingcomplex AFT and AHe data [Wildman et al., 2016].
4. Thermal History Inversion
The ultimate goal of thermochronology is to extract thermal history information and interpret this within ageological framework. Due to the complex nature of the combined AFT and AHe data sets, an appropriateinversion approach is required to extract the most probable thermal history for the observed data and theuncertainty on that data. A Bayesian approach to inverse thermal history modeling was performed by usingthe reversible jump Markov chain Monte Carlo (MCMC) method described by Gallagher [2012] and the soft-ware QTQt. The theoretical basis and application of this modeling technique has been well documented anddiscussed in previous studies [Gallagher et al., 2009; Gallagher, 2012; Cogné et al., 2011, 2012; Vermeesch andTian, 2014; Guillaume et al., 2013; Wildman et al., 2015, 2016; Leprêtre et al., 2015]. The MCMC algorithm wasrun for a minimum of ~200,000 iterations after discarding an initial ~50,000 “burn in” runs [Gallagher et al.,2009; Gallagher, 2012]. However, in most cases, the number of runs far exceeds this as several short;~10,000 iteration runs are performed in order to optimize the MCMC search parameters before performinglonger runs.
For this study, the multikinetic fission track annealing model of Ketcham et al. [2007] was used and the com-positional influence on fission track annealing, predominantly due to the relative proportions of Cl and F[Carlson et al., 1999; Sobel and Seward, 2010], was constrained by using a sample average Dpar value. Threesamples do not have Dpar information as AFT analysis on these samples was completed prior to the commonpractice of measuring specific grain compositions. As such, a range in Dpar values defined as 2.04 ± 1.50μmwas used, following the same approach to similar samples reported by Wildman et al. [2015].
All AHe single-grain ages were jointly inverted alongside their corresponding AFT data by using the radiationdamage accumulation and annealing model of Gautheron et al. [2009], which accounts for the effect of radia-tion damage accumulation and annealing on He diffusion. Ejection of alpha particles from the crystal rim[Farley et al., 1996] was accounted for during each time step of the thermal history [e.g., ,Meesters andDunai, 2002a, 2002b]. Flowers et al. [2009] present an alternativemethod of modeling radiation damage accu-mulation and annealing on He diffusion, which has been used to derive thermal histories from many AHedata sets [Clark et al., 2010; Duvall et al., 2011; Ault et al., 2013; Stanley et al., 2013, 2015]. The major differencebetween the two radiation damage models comes from the treatment of the reduction of defects over timeand temperature, which is inversely proportional to the diffusion coefficient [Flowers et al., 2009; Gautheronet al., 2009]. While the Gautheron et al. [2009] model calculates the reduction of fission track density in a linearmanner, the Flowers et al. [2009] model treats it with an empirically determined cubic function and thereforepredicts an enhanced reduction in diffusivity with increasing radiation damage. In practical terms, however,this will only cause significant discrepancies in predicted AHe ages for slowly cooled samples with very high(>100 ppm) or very low eU (<5 ppm) values. The choice of radiation damage model is therefore only a con-cern for two samples from our data set: GGO2 (average eU= 239 ppm) and V-10 (average eU= 3ppm).
Neither model is parameterized for the effect of compositional heterogeneity on the annealing rate ofdamage defects [Gautheron et al., 2013; Mbongo-Djimbi et al., 2015]. As our understanding of how radiationdamage accumulates and anneals and impacts helium trapping and diffusion is still developing, and as theamount of zonation [e.g., Farley et al., 2011] and implantation [e.g., Spiegel et al., 2009] in individual analyzedgrains is unknown, less weight was placed on AHe ages by assigning an uncertainty to AHe single-grain agesgreater than the analytical uncertainty. All AHe single-grain ages were modeled as if they were whole grain,as opposed to fragments [e.g., Brown et al., 2013; Beucher et al., 2013] and were allowed to be resampled fromtheir uncertainty range.
4.1. Geological Constraints
Two samples were clasts from within the Dwyka Group glacial tillite. Sample SA12-05 was a granite drop-stone, and SA12-06B was a gneissic boulder within a fine-grained, weathered matrix. An initial stratigraphicconstraint of 300 ± 10Ma, 10 ± 10°C was specified for modeling these samples [Visser, 1989]. Paleozoic base-ment rocks were assigned an initial constraint of 550 ± 50Ma and 100± 100°C to allow freedom for the initialmodel conditions to extend back to the beginning of the Pan-African Orogeny. As AFT single-grain ages for
Journal of Geophysical Research: Solid Earth 10.1002/2016JB013478
WILDMAN ET AL. MESOZOIC EVOLUTION OF SOUTHERN AFRICA 12
Archean rocks are as old as 503Ma, an initial constraint of 1000 ± 100Ma and 100 ± 100°C was used to allowfreedom for the initial model conditions during the Proterozoic, allowing the data to determine the thermalhistory through the Pan-African. For many samples, maximum paleotemperatures are sufficiently elevated sothat the AFT and AHe thermochronometers were completely reset after deposition of the Karoo (i.e., Permo-Triassic). However, there are samples that possess a tail of partially annealed tracks arising from thermalhistories that have had slower or more complex thermal histories <110± 10°C. The lack of furtherindependent geological stratigraphic evidence prevents the use of additional constraints being placed onthe thermal histories.
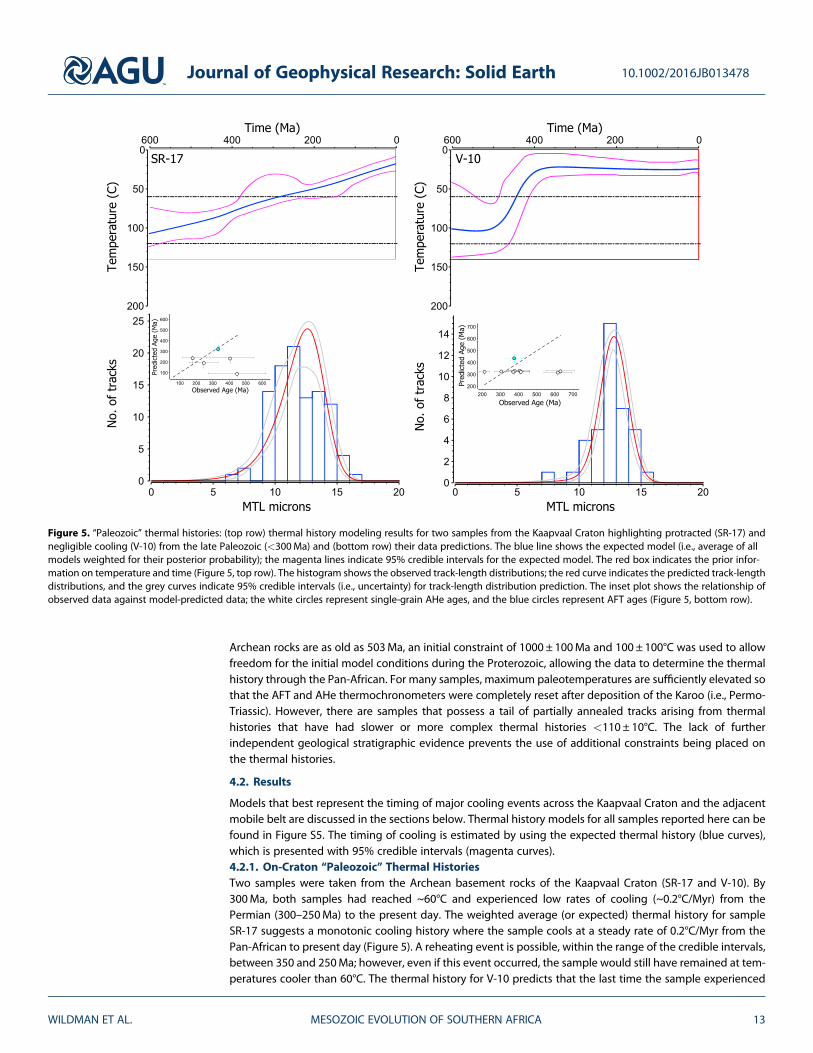
4.2. Results
Models that best represent the timing of major cooling events across the Kaapvaal Craton and the adjacentmobile belt are discussed in the sections below. Thermal history models for all samples reported here can befound in Figure S5. The timing of cooling is estimated by using the expected thermal history (blue curves),which is presented with 95% credible intervals (magenta curves).4.2.1. On-Craton “Paleozoic” Thermal HistoriesTwo samples were taken from the Archean basement rocks of the Kaapvaal Craton (SR-17 and V-10). By300Ma, both samples had reached ~60°C and experienced low rates of cooling (~0.2°C/Myr) from thePermian (300–250Ma) to the present day. The weighted average (or expected) thermal history for sampleSR-17 suggests a monotonic cooling history where the sample cools at a steady rate of 0.2°C/Myr from thePan-African to present day (Figure 5). A reheating event is possible, within the range of the credible intervals,between 350 and 250Ma; however, even if this event occurred, the sample would still have remained at tem-peratures cooler than 60°C. The thermal history for V-10 predicts that the last time the sample experienced
Figure 5. “Paleozoic” thermal histories: (top row) thermal history modeling results for two samples from the Kaapvaal Craton highlighting protracted (SR-17) andnegligible cooling (V-10) from the late Paleozoic (<300Ma) and (bottom row) their data predictions. The blue line shows the expected model (i.e., average of allmodels weighted for their posterior probability); the magenta lines indicate 95% credible intervals for the expected model. The red box indicates the prior infor-mation on temperature and time (Figure 5, top row). The histogram shows the observed track-length distributions; the red curve indicates the predicted track-lengthdistributions, and the grey curves indicate 95% credible intervals (i.e., uncertainty) for track-length distribution prediction. The inset plot shows the relationship ofobserved data against model-predicted data; the white circles represent single-grain AHe ages, and the blue circles represent AFT ages (Figure 5, bottom row).
Journal of Geophysical Research: Solid Earth 10.1002/2016JB013478
WILDMAN ET AL. MESOZOIC EVOLUTION OF SOUTHERN AFRICA 13
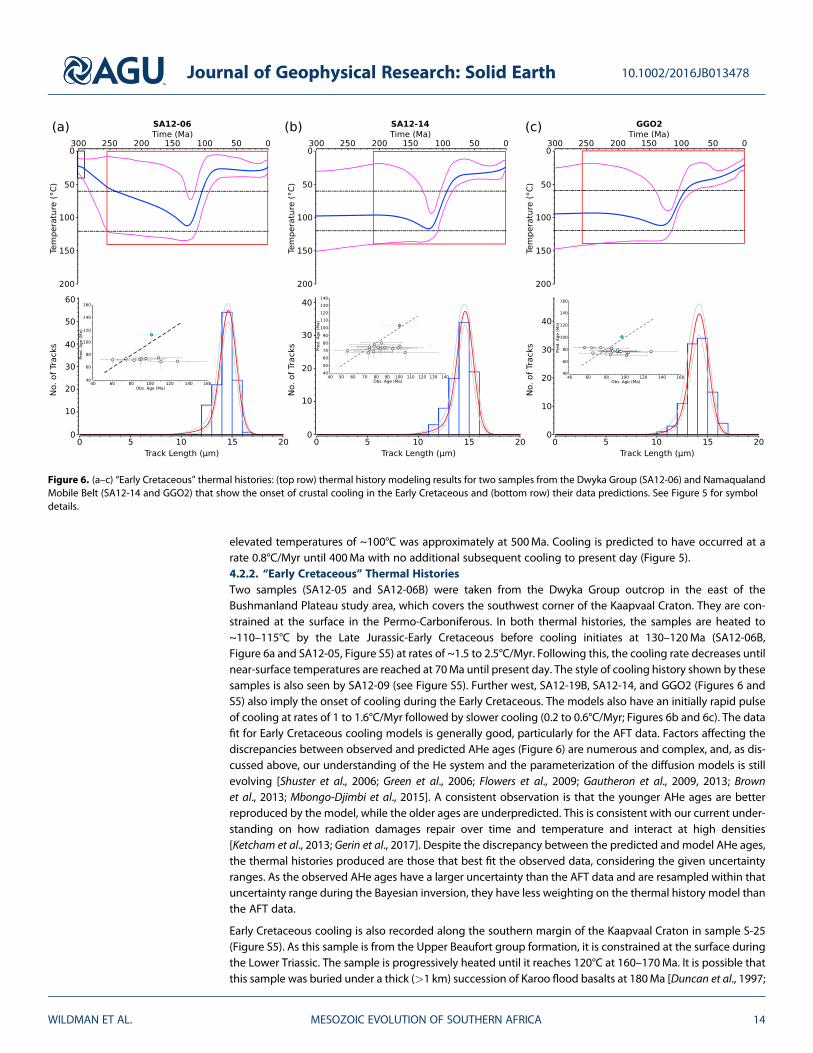
elevated temperatures of ~100°C was approximately at 500Ma. Cooling is predicted to have occurred at arate 0.8°C/Myr until 400Ma with no additional subsequent cooling to present day (Figure 5).4.2.2. “Early Cretaceous” Thermal HistoriesTwo samples (SA12-05 and SA12-06B) were taken from the Dwyka Group outcrop in the east of theBushmanland Plateau study area, which covers the southwest corner of the Kaapvaal Craton. They are con-strained at the surface in the Permo-Carboniferous. In both thermal histories, the samples are heated to~110–115°C by the Late Jurassic-Early Cretaceous before cooling initiates at 130–120Ma (SA12-06B,Figure 6a and SA12-05, Figure S5) at rates of ~1.5 to 2.5°C/Myr. Following this, the cooling rate decreases untilnear-surface temperatures are reached at 70Ma until present day. The style of cooling history shown by thesesamples is also seen by SA12-09 (see Figure S5). Further west, SA12-19B, SA12-14, and GGO2 (Figures 6 andS5) also imply the onset of cooling during the Early Cretaceous. The models also have an initially rapid pulseof cooling at rates of 1 to 1.6°C/Myr followed by slower cooling (0.2 to 0.6°C/Myr; Figures 6b and 6c). The datafit for Early Cretaceous cooling models is generally good, particularly for the AFT data. Factors affecting thediscrepancies between observed and predicted AHe ages (Figure 6) are numerous and complex, and, as dis-cussed above, our understanding of the He system and the parameterization of the diffusion models is stillevolving [Shuster et al., 2006; Green et al., 2006; Flowers et al., 2009; Gautheron et al., 2009, 2013; Brownet al., 2013; Mbongo-Djimbi et al., 2015]. A consistent observation is that the younger AHe ages are betterreproduced by the model, while the older ages are underpredicted. This is consistent with our current under-standing on how radiation damages repair over time and temperature and interact at high densities[Ketcham et al., 2013; Gerin et al., 2017]. Despite the discrepancy between the predicted and model AHe ages,the thermal histories produced are those that best fit the observed data, considering the given uncertaintyranges. As the observed AHe ages have a larger uncertainty than the AFT data and are resampled within thatuncertainty range during the Bayesian inversion, they have less weighting on the thermal history model thanthe AFT data.
Early Cretaceous cooling is also recorded along the southern margin of the Kaapvaal Craton in sample S-25(Figure S5). As this sample is from the Upper Beaufort group formation, it is constrained at the surface duringthe Lower Triassic. The sample is progressively heated until it reaches 120°C at 160–170Ma. It is possible thatthis sample was buried under a thick (>1 km) succession of Karoo flood basalts at 180Ma [Duncan et al., 1997;
Figure 6. (a–c) “Early Cretaceous” thermal histories: (top row) thermal history modeling results for two samples from the Dwyka Group (SA12-06) and NamaqualandMobile Belt (SA12-14 and GGO2) that show the onset of crustal cooling in the Early Cretaceous and (bottom row) their data predictions. See Figure 5 for symboldetails.
Journal of Geophysical Research: Solid Earth 10.1002/2016JB013478
WILDMAN ET AL. MESOZOIC EVOLUTION OF SOUTHERN AFRICA 14
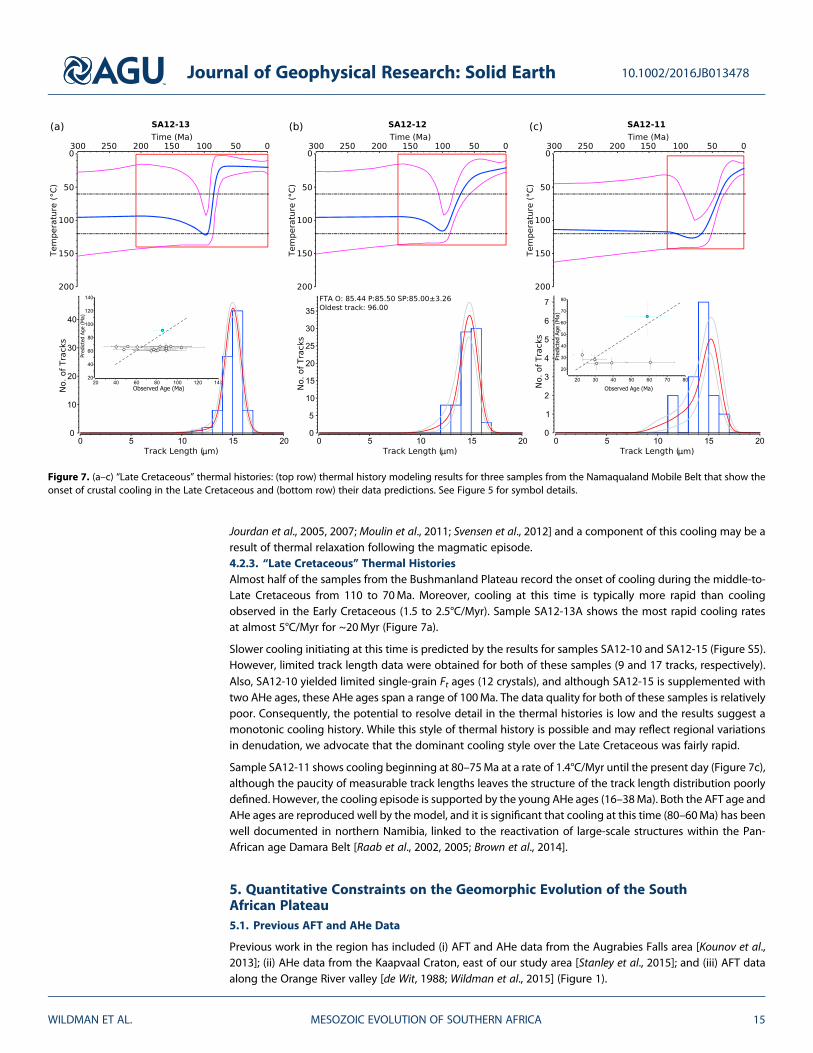
Jourdan et al., 2005, 2007; Moulin et al., 2011; Svensen et al., 2012] and a component of this cooling may be aresult of thermal relaxation following the magmatic episode.4.2.3. “Late Cretaceous” Thermal HistoriesAlmost half of the samples from the Bushmanland Plateau record the onset of cooling during the middle-to-Late Cretaceous from 110 to 70Ma. Moreover, cooling at this time is typically more rapid than coolingobserved in the Early Cretaceous (1.5 to 2.5°C/Myr). Sample SA12-13A shows the most rapid cooling ratesat almost 5°C/Myr for ~20Myr (Figure 7a).
Slower cooling initiating at this time is predicted by the results for samples SA12-10 and SA12-15 (Figure S5).However, limited track length data were obtained for both of these samples (9 and 17 tracks, respectively).Also, SA12-10 yielded limited single-grain Ft ages (12 crystals), and although SA12-15 is supplemented withtwo AHe ages, these AHe ages span a range of 100Ma. The data quality for both of these samples is relativelypoor. Consequently, the potential to resolve detail in the thermal histories is low and the results suggest amonotonic cooling history. While this style of thermal history is possible and may reflect regional variationsin denudation, we advocate that the dominant cooling style over the Late Cretaceous was fairly rapid.
Sample SA12-11 shows cooling beginning at 80–75Ma at a rate of 1.4°C/Myr until the present day (Figure 7c),although the paucity of measurable track lengths leaves the structure of the track length distribution poorlydefined. However, the cooling episode is supported by the young AHe ages (16–38Ma). Both the AFT age andAHe ages are reproduced well by the model, and it is significant that cooling at this time (80–60Ma) has beenwell documented in northern Namibia, linked to the reactivation of large-scale structures within the Pan-African age Damara Belt [Raab et al., 2002, 2005; Brown et al., 2014].
5. Quantitative Constraints on the Geomorphic Evolution of the SouthAfrican Plateau5.1. Previous AFT and AHe Data
Previous work in the region has included (i) AFT and AHe data from the Augrabies Falls area [Kounov et al.,2013]; (ii) AHe data from the Kaapvaal Craton, east of our study area [Stanley et al., 2015]; and (iii) AFT dataalong the Orange River valley [de Wit, 1988; Wildman et al., 2015] (Figure 1).
Figure 7. (a–c) “Late Cretaceous” thermal histories: (top row) thermal history modeling results for three samples from the Namaqualand Mobile Belt that show theonset of crustal cooling in the Late Cretaceous and (bottom row) their data predictions. See Figure 5 for symbol details.
Journal of Geophysical Research: Solid Earth 10.1002/2016JB013478
WILDMAN ET AL. MESOZOIC EVOLUTION OF SOUTHERN AFRICA 15
AFT and AHe data from Augrabies Falls and from the Fish River Canyon in southern Namibia recordsenhanced cooling from 100 to 65Ma [Kounov et al., 2013]. This is in agreement with the predominant ageof cooling inferred from our data and is interpreted by Kounov et al. [2013] as representing the geomorphicresponse to regional uplift increasing river gradients and hence erosion rates. AFT and AHe ages are reportedby Kounov et al. [2013] for samples from the Augrabies Falls, and the observed ages agree with LateCretaceous cooling inferred here. However, as acknowledged by the authors, radiation damage effectsmay have influenced the closure temperature of individual AHe ages and so denudation estimates are madeby using AFT data from a vertical profile taken from the Orange River valley wall. Kounov et al. [2013] do notsupport tectonic reworking as the dominant, regional mechanism that enhanced denudation at this time butdo suggest that a record of localized fault reactivation is preserved in their study areas. In the Fish RiverCanyon, an AFT age of 67 ± 26Ma in the hanging wall is adjacent to AFT ages of 81 ± 12 to 84± 17Ma inthe footwall of a major thrust fault and is used to invoke almost 1 km of offset around 70Ma. Due to the rela-tive uncertainties of these fission track ages and lack of track length information to constrain their thermalhistory, the timing of faulting is still not well constrained. No local tectonic mechanism is suggested to haveoccurred in the Augrabies Falls region, which is interpreted as reflecting the regional signal of plateau upliftand denudation in the middle Late Cretaceous. While there is consistency in the timing of cooling invoked byour data and that of Kounov et al. [2013], our data suggest greater spatial variability in cooling across theBushmanland plateau.
Although the data from Kounov et al. [2013] alone do not provide strong evidence for major structuralreactivation at ~70Ma, they are supported by cooling ages from Raab et al. [2002, 2005] and Brownet al. [2014] from northwestern Namibia that also indicate a regionally significant tectonic event at thistime. These authors infer that ~2 km of vertical displacement has occurred across the Omaruru-Waterberg Lineament since the Early Cretaceous, with a major period of enhanced denudation occurringat ~70Ma.
A transect of samples from the coast to the middle of our study area was collected by de Wit [1988] (Figure 1).The majority of the samples from this transect yield AFT ages between 108 and 129Ma, with MTLs rangingfrom 13.3 to 14.0μm. This is comparable to our AFT data from west of the craton boundary faults. Two sam-ples from Kakamas and Kenhardt yielded AFT ages of 70 ± 5Ma and 73± 4Ma andMTLs of 13.98 ± 0.1μmand14.23 ± 0.1μm, respectively [de Wit, 1988]. No track length histograms are presented, but the mean tracklength standard deviation for these samples is low (0.88 and 1.12 and n= 74 and 96, respectively), and itcan be assumed that the track length distribution is relatively narrow. De Wit [1988] interpret these AFT dataas evidence for thermal overprinting due to Late Cretaceous magmatism. The Stompoor intrusion is LateCretaceous in age [Smith, 1986], but emplacement of other intrusive bodies in the study area occurs in themiddle Cretaceous (e.g., Markt, Jonkerwater, and Middlewater) [Moore et al., 2008). The Stompoor intrusionis ~30–40 km SW of the young AFT ages of de Wit [1988] and is unlikely to have had a thermal effect. It is pos-sible that unknown and undated minor intrusions close to the sample locations caused thermal overprinting,but these samples are located adjacent within the structural zone that we suggest may have accommodateddeformation and focused denudation during the Late Cretaceous, and this could provide an alternativeexplanation for these AFT data.
East of our study area, a novel approach to constraining the erosional history of the plateau was presented byStanley et al. [2015]. In this study, 15 early and mid-Cretaceous kimberlite pipes occurring both on and off theKaapvaal Craton were sampled. (U-Th)/He ages were obtained on apatites primarily from the kimberlitematrix itself, with additional grains from crustal xenoliths within the pipe. Uncorrected mean AHe ages rangefrom 36 to 72Ma (corrected mean ages: 54–113Ma). They concluded that an initial phase of regional erosionbeginning in the Early Cretaceous was later perturbed by a spatially variable mid-Cretaceous erosion eventcontrolled by lithospheric-mantle interactions in and around the Kaapvaal Craton. This conclusion is largelysupported by our study.
AHe age-eU correlations were used by Stanley et al. [2015] to constrain the thermal history information fromthese samples; however, this relationship has significant uncertainty [e.g., Gautheron et al., 2013; Mbongo-Djimbi et al., 2015; Brown et al., 2013] and thus demonstrates the importance of modeling AHe data alongsideindependent information such as AFT data or well-dated geological constraints (e.g., kimberlite intrusion age)to constrain thermal histories.
Journal of Geophysical Research: Solid Earth 10.1002/2016JB013478
WILDMAN ET AL. MESOZOIC EVOLUTION OF SOUTHERN AFRICA 16
The current South African thermochronology data set for the interior plateau is dominated by a signal ofmiddle-to-Late Cretaceous cooling. Our new AFT and AHe contribute to this data set by identifying a pre-served Paleozoic history on the craton and by showing that, over the NW-SE trending structural zone atthe western craton margin, the timing and style of Cretaceous cooling are spatially variable.
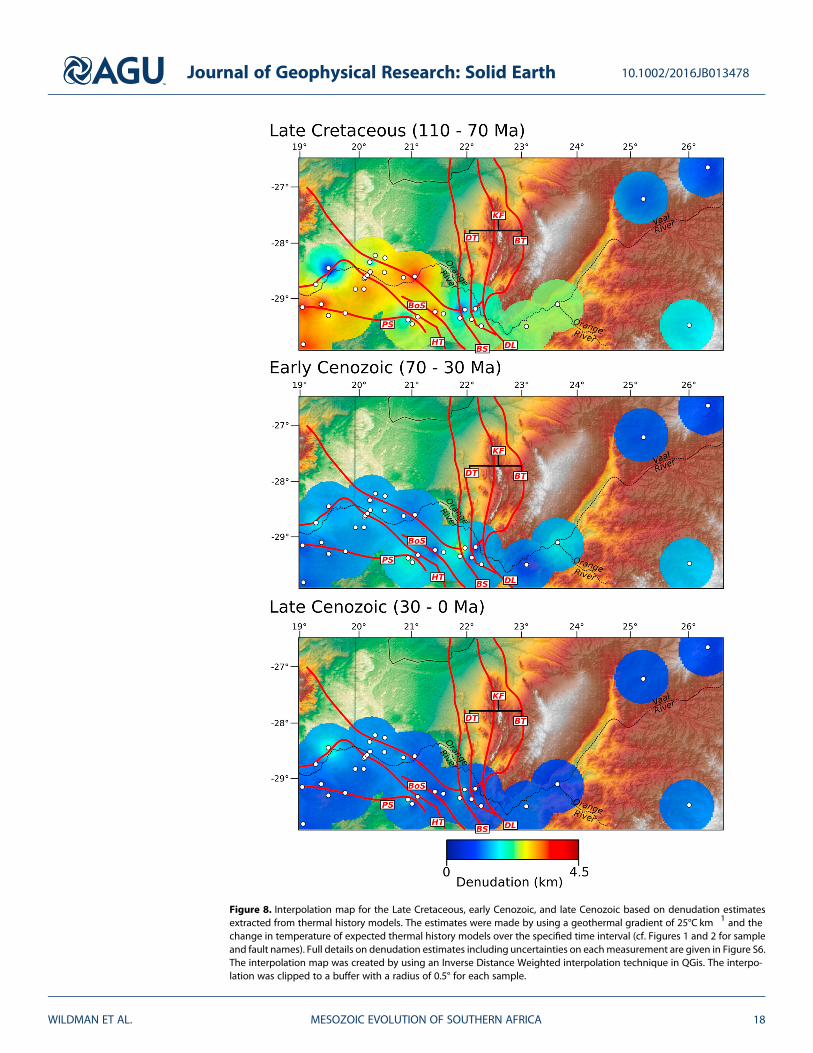
5.2. Timing and Spatial Patterns of Cretaceous Denudation
Themagnitude of denudation has been calculated by using the thermal historymodels of Kounov et al. [2013]andWildman et al. [2015, 2016] and newmodels presented here, assuming a geothermal gradient of 25°C/km[e.g., Jones, 1987] (Figure 8). Denudation estimates were made for each individual sample simply by dividingthe temperature change of the sample over the specified time interval, as predicted by the expected thermalhistory model by the assumed geothermal gradient (see Figure S6 for more details). Inferring the magnitudeof denudation across the study area during the Early Cretaceous is difficult because many samples have notyet cooled below 110 ± 10°C and therefore do not record cooling over this time. A greater number of modelsrecord cooling that initiates closer to ~130Ma, leaving uncertainty on paleotemperatures before this time.Thermal histories that best constrain cooling over this time (see Figure S5) suggest that denudation couldhave been as high as 2 km (FS1605) and was probably at least 1 km across most of the region (e.g., S-25)except for the most interior Archean samples, which suggest that denudation was minimal <0.2 km overthis time.
The thermal history information is better constrained through the middle Late Cretaceous (110–70Ma) butimplies significant heterogeneity of denudation across the plateau (Figure 8). Archean samples in the centerof the craton continue to show minimal denudation (<0.3 km). Across the rest of the study area, denudationestimates range from 0 (e.g., PRU106) to 4.2 km (8732-93). Samples in the southwest corner of the study areaare characterized by these larger magnitudes (~3.5–4 km) (e.g., of denudation, suggesting that this section ofthe plateau experienced the same intense period of erosion). In the east of the study area, samples thatbegan cooling in the Early Cretaceous continue to be exhumed but with the removal of less rock than inthe west (1–2.2 km as predicted by S-25 and SA12-06B, respectively). Within the heavily faulted zone at theboundary between the Paleozoic mobile belt and Archean craton, denudation is more variable over shorterscales. The regional average denudation (excluding the Archean samples) is 2.5 km however, samples suchas SA12-13A and 8732-93 predict that denudation may have been as much as 4 km. At the other extreme,the thermal history model of PRU106 suggests that the sample was not exhumed and may have experiencedlimited burial during this period. Samples such as GGO2, SA12-09, and SA12-08 suggest similar magnitudes ofdenudation compared to that predicted by samples east of the structural zone (1.7–2.3 km).
Predicting where the eroded continental interior material has ended up is difficult due to uncertainties overthe Cretaceous drainage network during the prerift, synrift, and postrift phases [De Wit, 2007]. It is suggestedby many workers though that the westward drainage of Southern Africa has persisted since continentalbreakup, but internal drainage reorganizations may have altered the position of the major drainage outletover this time and interior drainage patterns [de Wit, 1999; Moore and Larkin, 2001; Stevenson andMcMillan, 2004; Goudie, 2005]. Episodic drainage reorganizations may have occurred during the Cretaceousand early Cenozoic, related to periods of tectonic uplift of the continent at these times [Partridge andMaud, 1987; Dollar, 1998; Goudie, 2005; Moore et al., 2009]. It is likely that most of the eroded material wastransported to the nascent Orange Basin, although drainage to interior basins (e.g., Kalahari basin) cannotbe ruled out entirely.
Two prominent peaks in accumulated sediment volume and sedimentation rates occur during the EarlyCretaceous synrift phase and in the Late Cretaceous in the Orange Basin [Rouby et al., 2009; Guillocheauet al., 2012]. The timing of sedimentation is broadly coeval with the timing of onshore denudation alongthe continental margin [Wildman et al., 2016] and interior plateau, as described here. Middle-to-LateCretaceous denudation has been predicted along the southern margin and interior plateau [Tinker et al.,2008; Wildman et al., 2015; Stanley et al., 2013; Green et al., 2016] and correlates with a peak in sedimentvolumes in the Bredasdorp and Outeniqua Basins [Tinker et al., 2008].
5.3. Timing and Spatial Patterns of Cenozoic Denudation
Throughout the Cenozoic (70–0Ma) the interior Archean samples continue to record minimal levels of denu-dation. SR-17 suggests that 1 km of material has been removed with ~800m of this being eroded in the last
Journal of Geophysical Research: Solid Earth 10.1002/2016JB013478
WILDMAN ET AL. MESOZOIC EVOLUTION OF SOUTHERN AFRICA 17
Figure 8. Interpolation map for the Late Cretaceous, early Cenozoic, and late Cenozoic based on denudation estimatesextracted from thermal history models. The estimates were made by using a geothermal gradient of 25°C km�1 and thechange in temperature of expected thermal history models over the specified time interval (cf. Figures 1 and 2 for sampleand fault names). Full details on denudation estimates including uncertainties on eachmeasurement are given in Figure S6.The interpolation map was created by using an Inverse Distance Weighted interpolation technique in QGis. The interpo-lation was clipped to a buffer with a radius of 0.5° for each sample.
Journal of Geophysical Research: Solid Earth 10.1002/2016JB013478
WILDMAN ET AL. MESOZOIC EVOLUTION OF SOUTHERN AFRICA 18
30Ma. However, as the sample resided at temperatures less than 40°C through this time, it is beyond the sen-sitivity of the AFT and AHe techniques, and so these should be regarded as maximum estimates of erosion.Unlike during the Cretaceous, themagnitudes of denudation during the Cenozoic predicted across the wholeof the study area are quite similar. The regional averages for the early and late Cenozoic are 0.7 and 0.3 km,respectively. During the Cenozoic there are localized occurrences of higher denudation recorded primarily inthe samples that started to cool during the Late Cretaceous at slow rates and were finally brought to near-surface temperatures in the Cenozoic. An exception to this is SA12-11, located among the Kheis Front faults,which was still at temperatures >100°C by the end of the Cretaceous. This is anomalous, considering theregional denudation estimates; however, this thermal history is consistent with the Cenozoic AFT and AHeages obtained for the sample. Another exception is PRU106, which is characterized by long residence at~70°C before rapidly cooling over the last 30Ma.
The constraints provided here on the timing and magnitudes of continental denudation have major implica-tions for the long-term geomorphic development of the South African interior plateau. The extensive AFT andAHe data set can be combined with a wealth of cosmogenic nuclide data from South Africa constrainingmore recent erosion rates [e.g., Fleming et al., 1999; Cockburn et al., 2000; Bierman and Caffee, 2001; van derWateren and Dunai, 2001; Codilean et al., 2008, 2014; Decker et al., 2011; Kounov et al., 2007, 2015; Scharfet al., 2013; Erlanger et al., 2012; Bierman et al., 2014]. Together, these data sets indicate that regional erosionrates over the Cenozoic, and particularly the late Cenozoic, were low (<20m/Myr) relative to the Cretaceous;however, faster erosion rates (27–160m/Myr) have been be observed locally, associated with local channelincision in the Drakensberg Escarpment [Fleming et al., 1999] and the Kuiseb River Valley in northeasternNamibia [van der Wateren and Dunai, 2001]. These rates are also similar to those suggested by our samplePRU106. The preservation of Late Cretaceous crater facies within kimberlite pipes and their infill lacustrinesediments provide additional evidence for minimal erosion of the plateau through the Cenozoic [Stanleyet al., 2013, 2015; Hanson et al., 2009; Smith, 1986]. These low erosion rates and amounts of Cenozoic erosiononshore are reflected in the low rates of sediment accumulation in offshore basins on the western margin ofSouth Africa throughout the Cenozoic [Guillocheau et al., 2012; Tinker et al., 2008; Rouby et al., 2009].
6. Post 300Ma Evolution of the South African Plateau6.1. Paleozoic Evolution
The data presented here, combined with previously published low-temperature thermochronology data sets,provide evidence that, while the center of the Kaapvaal Craton has remained at relatively low temperatures(<60°C) since the end of the Carboniferous, the craton margins and off-craton regions have experiencedyounger Mesozoic cooling. The thermal history models suggest that interior craton samples underwent theirmain cooling phase between 600 and 400Ma, which is coeval with the Pan-African Orogeny. Although onlytwo samples define this preserved Paleozoic history, they are immensely important, as until now, AFT andAHe data have shown that parts of the elevated cratonic interior and its margins were significantly erodedduring the Mesozoic [Stanley et al., 2013, 2015; Flowers and Schoene, 2010; Tinker et al., 2008]. Diamond-bearing gravels unconformably overlying the Transvaal Supergroup rocks ~30 kmN and NW of sample V-10 have previously been interpreted as post-Gondwana drainage deposits [e.g., Partridge and Maud, 1987].However, a reinterpretation of these gravels based on their lithofacies and age dating from inclusions in dia-mond and zircon suggest that the gravels are most likely semilithified paleoeskers associated with the degla-ciation of the Dwyka ice sheet during the Permian to Carboniferous [de Wit, 2016]. The preservation of thesefeatures and presence of only limited remnants of Ecca Group sediments [Beukes et al., 1999] support the pro-posal that this part of the craton was only covered by a thin layer of Karoo sediments and did not experiencesignificant erosion over the last 300Ma (Figure 9).
6.2. Mesozoic Evolution: Late Jurassic-Early Cretaceous
The onset of Gondwana breakup is marked by the widespread emplacement of Karoo flood basalts at~183Ma [Svensen et al., 2012]. These basalts are best preserved in the Drakensberg Mountains in southeast-ern South Africa and likely extended across all of Southern Africa. The thermal effect, either due to directheating or burial, of these basalts on apatite thermochronometery is still unclear. Due to the preservationof older (195–220Ma) ages with only partially annealed tracks in samples from the Karoo Basin underlyingthe Drakensberg Basalts, direct thermal heating is not thought to have affected the AFT data of some
Journal of Geophysical Research: Solid Earth 10.1002/2016JB013478
WILDMAN ET AL. MESOZOIC EVOLUTION OF SOUTHERN AFRICA 19
Karoo samples [e.g., Brown et al., 2002]; however, Kounov et al. [2009] advocate that AFT data from theKaroo Basin in southwestern Africa provide evidence for resetting due to Karoo magmatism. These obser-vations are not incompatible and simply indicate that the thermal effect of the Karoo magmatic event wasspatially heterogeneous, and this is consistent with an earlier quantitative analysis of the thermal effects ofthe Karoo igneous event involving both extrusive and intrusive bodies [Brown et al., 1994]. Our data pre-sented in this paper do not record any heating or cooling that can be directly attributed to the thermaleffects of Karoo magmatism; however, the presence of basaltic xenoliths in kimberlites emplaced between120 and 140Ma suggests that flood basalts at least covered the southern Kaapvaal Craton. No directevidence is available to suggest that the basalts covered samples SR-17 and V-10 in the center of thecraton [de Wit, 2016].
Early Cretaceous cooling is broadly coeval with the opening of the southern Atlantic and has been recordedin samples across the SW Cape [Kounov et al., 2009;Wildman et al., 2015, 2016]. Kilometer scale denudation inresponse to continental rifting has been well documented [Gallagher and Brown, 1999; Brown et al., 2002; Vander beek et al., 2002; Gunnell et al., 2003; Persano et al., 2005]. The Early Cretaceous cooling episode is thereforeinterpreted to have been caused by enhanced erosion in response to the breakup of western Gondwana and
Figure 9. Regional cross section showing total denudation across the Cape Fold Belt (CFB), Namaqua-Natal Mobile Belt(NNMB), and Kaapvaal Craton (KC) calculated by using data from Wildman et al. [2015, 2016] and this study. Lower plotsshow P and S vertical sections for P and S wave velocity maps [Youssof et al., 2015], which defines the inland slopingboundary (i.e., craton edge) between thick and depleted mantle lithospheres below the KC and thinner, fertile lithospherebeneath the NNMB and CFB. The inset map shows total magnitudes of denudation predicted across southwestern Africabased on published thermochronology data. Interpolation performed as in Figure 8. We highlight that denudation is pre-dicted to be higher southwest of the craton edge than on the craton itself.
Journal of Geophysical Research: Solid Earth 10.1002/2016JB013478
WILDMAN ET AL. MESOZOIC EVOLUTION OF SOUTHERN AFRICA 20
lowering of regional base levels. It has now been clearly shown by data presented here and previously byWildman et al. [2015, 2016], Kounov et al. [2009], and Tinker et al. [2008] that Early Cretaceous erosionoccurred across what is now the southwest African plateau. Major drainage conduits such as the paleo-Orange River transmitted the base-level drop associated with the opening of the Atlantic several hundredsof kilometers inland. It is possible that much of the Karoo basalts were stripped from southwest Africa duringthis phase of enhanced erosion prior to the second phase of kimberlite intrusive activity (~100–85Ma)[Hanson et al., 2009; Stanley et al., 2013, 2015].
6.3. Mesozoic Evolution: Late Cretaceous
The Late Cretaceous period of South Africa’s evolution is a time of significant change, with plate tectonicsand mantle dynamics coupling to produce a complex tectonic and geomorphic development of the sub-continent. In a regional context, thermochronology consistently supports major cooling of the SouthAfrican crust in the Late Cretaceous (Figure 10). However, in detail, particularly at continental marginsand structurally complex zones, variation in the timing and rate of Late Cretaceous cooling is evident(e.g., western South African margin [Kounov et al., 2009; Wildman et al., 2016], southwest Cape[Wildman et al., 2015], Cape Fold Belt [Green et al., 2016; Tinker et al., 2008, northwestern Namibia[Raab et al., 2002, 2005; Brown et al., 2014], and southern Zimbabwe [Belton and Raab, 2010])(Figure 10). We suggest that the complex spatial patterns of Late Cretaceous denudation implied bythe AFT and AHe data across the craton boundary faults provide further evidence that the drivingmechanism behind Late Cretaceous evolution involved both a regional component as well as morefocused deformation at tectonically weak zones.
Erosional unconformities, regression wedges, and slumping/gravitational tectonics during the LateCretaceous have been identified in seismic stratigraphic analyses of the South African offshore basins[Brown et al., 1995; McMillan, 2003; de Vera et al., 2010]. These features provide corroborating evidence for
Figure 10. Maps of sample paleotemperature at different time steps over the Late Cretaceous period (110–70Ma). Paleotemperatures were obtained from theexpected thermal history models presented in this study as well as those presented by Wildman et al. [2015, 2016]. The interpolation and masked data used arethe same as those described in Figure 6. The maps highlight the major regional cooling of southwestern Africa during the Late Cretaceous and also highlight thespatial variability of sample cooling.
Journal of Geophysical Research: Solid Earth 10.1002/2016JB013478
WILDMAN ET AL. MESOZOIC EVOLUTION OF SOUTHERN AFRICA 21
downward migration of the shoreline and long-wavelength regional uplift of the continent. Westward tiltinginvolved during this uplift may explain the relative timing of offshore accumulation in the western and east-ern basins [Braun et al., 2014].
The presence of a large mantle plume, or plumes, beneath the African continent [e.g., Nyblade and Robinson,1994; Lithgow-Bertelloni and Silver, 1998; Brandt et al., 2012; Fishwick and Bastow, 2011] has often been cited asa mechanism to drive regional uplift and support the elevated African topography over long timescales[Gurnis et al., 2000; Roberts and White, 2010; Braun et al., 2014; Moucha and Forte, 2011]. However, the pre-dicted spatial pattern, timing, and amount of “dynamic” uplift and subsidence for Africa are still unresolved[Moucha and Forte, 2011; Braun et al., 2014; Flament et al., 2014], and isolating the mantle “dynamic” upliftcontribution from that of isostatically compensated topography remains challenging [e.g., Molnar et al.,2015; Colli et al., 2016; Artemieva and Vinnik, 2016].
Recent thermomechanical models have shown that the interaction of horizontal plate movement andconvection in the mantle drives vertical motions of the crust over different wavelengths [Colli et al.,2014; Cloetingh et al., 2013; García-Castellanos and Cloetingh, 2011; Cloetingh and Burov, 2011; Burovand Cloetingh, 2009]. In particular, it has been shown that, during mantle upwelling, bending of the brittlecrust induces lateral stresses and instabilities which may promote short wavelength, asymmetric, and topo-graphic features (i.e., fault block movement and flexural upwarps) [Burov and Guillou-Frottier, 2005; Burov andGerya, 2014].
Craton edges are characterized by abrupt variations in lithospheric thickness. For the Kaapvaal Craton themantle lithosphere is ~260–350 km thick compared to the ~200 km thick mobile belts, with an abrupt transi-tion zone at the edge [Delph and Porter, 2015; Youssof et al., 2013, 2015; Sodoudi et al., 2013] (Figure 9).Thermochemical modification has been suggested to have caused the off-craton lithosphere to thin by~30–40 km during the Late Cretaceous [Kobussen et al., 2008; Griffin et al., 2009; Janney et al., 2010].Changes in the deep Earth structure and/or composition may induce edge-driven convection or focus upwel-lings in the mantle around the craton [Guillou-Frottier et al., 2012] or may well result in the off-craton and on-craton regions responding differently to unloading and stress [Gilchrist and Summerfield, 1990; Pérez-Gussinyéand Watts, 2005]. Moreover, additional contrasting geophysical characteristics at craton margins such as lat-eral variations in lithospheric strength, rheology, heat flow, and the presence of pre-existing weak zones havebeen shown to cause intraplate stresses to build up at the craton margins [Redfield and Osmundsen, 2014;Gueydan et al., 2014; Lenardic et al., 2003; Baptiste et al., 2012; Wang et al., 2014; Calignano et al., 2015;Janney et al., 2010].
These lithospheric properties have the potential to create surface topography over different length scales inresponse to vertical and horizontal forcings, which, when eroded, can leave a complex thermochronologyrecord. We suggest that our data indicate that denudation was greatest at the southwest margin of theKaapvaal Craton in the Late Cretaceous, while the craton itself remained relatively stable and preservedthe older Early Cretaceous and Paleozoic thermal history of the plateau. Our data set suggests that the spatialpattern of Late Cretaceous denudation is extremely variable; however, additional sampling and multisamplemodeling approaches in future studies will increase the spatial resolution and robustness of denudation esti-mates across the plateau.
Our data do not have the precision or local coverage to constrain magnitudes of fault reactivation on specificfaults. However, the buildup of stresses at the structurally weak craton margin in response to changes inAfrican plate velocity and rotation orientation during the middle Late Cretaceous [Colli et al., 2014; Mülleret al., 2008; Labails et al., 2009; Eagles, 2007; Heine et al., 2013; Moulin et al., 2010; Torsvik et al., 2009; Granotand Dyment, 2015] may have triggered transpressional faulting of shear zones that involved relative verticalmovement of individual fault blocks. This structural style has been described theoretically [e.g., Christie-Blickand Biddle, 1985; Fossen and Tikoff, 1998] and is suggested to have occurred during reactivation of basementstructures at 90Ma along the Limpopo belt, which defines the southern margin of the Zimbabwe Craton[Belton and Raab, 2010].
Recent South American-African plate reconstruction models have predicted that deformation along conti-nental margins and within interior shear zones and rift basins during the Cretaceous normal polarity super-chron (chron CM0-C34) is required in South America [Torsvik et al., 2009; Heine et al., 2013; Pérez-Díaz andEagles, 2014]. The data presented here indicate that this has occurred within Southern Africa too. However,
Journal of Geophysical Research: Solid Earth 10.1002/2016JB013478
WILDMAN ET AL. MESOZOIC EVOLUTION OF SOUTHERN AFRICA 22
additional evidence will be required to document the reactivation of specific faults at the southwestern mar-gin of the Kaapvaal Craton.
6.4. Cenozoic Evolution
Several geomorphological studies have advocated that the first-order topography of South Africa wasformed by a major Cenozoic phase (or phases) of uplift and erosion [e.g., King, 1955; Partridge and Maud,1987; Burke, 1996; Burke and Gunnell, 2008; Roberts and White, 2010; Rudge et al., 2015]. Many of the earlygeomorphological studies are based on the concept of the formation of continent-wide planation surfacesformed by prolonged erosion that are subsequently dissected by later erosion events following regionaluplift of lowering of base level, and therefore, their remnants can be extrapolated regionally. Theoccurrence and significance of continental erosion surfaces as geomorphic markers have been thoroughlydiscussed with frequent reference to the African case [e.g., Dixey, 1955; King, 1955; Ollier and Marker, 1985;Summerfield, 1985; Partridge and Maud, 1987; Van der Beek et al., 2002; Burke and Gunnell, 2008; Greenet al., 2013].
Recent numerical modeling approaches have attempted to unravel the uplift history of Africa by inverting thephysiography of drainage networks over time [e.g., Roberts and White, 2010; Paul et al., 2014; Rudge et al.,2015], starting with the initial condition that Africa was characterized by low-lying and low-relief surface withno notable topography prior to ~30Ma. This assumption is largely based on the work by Partridge and Maud[1987] and summarizedmore recently by Burke and Gunnell [2008]. The hypothesis that the present-day topo-graphy of Southern Africa formed following the uplift and erosion of an initially flat, low-elevation landscapeover the last 30Ma is difficult to reconcile with our data or the existing cosmogenic data that indicate lowregional erosion rates during the Cenozoic. The creation of ~1 km of relief across the continental margins,such as at the present escarpment zone, would require the removal of several kilometers of rock to overcomeisostatic compensation and would therefore be recorded by the thermochronological data along the coastalplain [Van der Beek et al., 2002; Brown et al., 2002].
In contrast, the preservation of Cretaceous topography through the Cenozoic can be explained by theonset of relative tectonic stability at this time [Torsvik et al., 2009; Nürnberg and Müller, 1991; Ganerødet al., 2011; Gaina et al., 2013; Heine et al., 2013; Pérez-Díaz and Eagles, 2014; Gorczyk and Vogt, 2015] withadditional moderation of erosion due to the exposure of more resistant basement rock [e.g., Cockburnet al., 2000; Scharf et al., 2013] and the onset of a more arid climate [e.g., de Wit, 1999; Gutzmer andBeukes, 2000; Bamford, 2000] following the warm, very humid climate that prevailed during thePaleocene-Eocene thermal maximum [Zachos et al., 2001]. During this time, laterite weathering profilesformed on the relic Cretaceous landscape [e.g., Dauteuil et al., 2013, Chardon et al., 2016] and are stillintact in many places.
AnyCenozoic surfaceuplift of SouthernAfrica cannot thereforebe accompaniedbymajor (i.e., kmscale), regio-nal erosion, and any geomorphic response was restricted tomoderate erosion (<1 km) and local channel inci-sion [e.g., Dauteuil et al., 2013; Fleming et al., 1999; van der Wateren and Dunai, 2001]. Significantly, dated riverterrace sequences onboth the lowerOrangeRiver (west coast) and the Sundays river (south east coast) provideconstraints on Cenozoic incision and rock uplift for these locations during the Neogene and indicate low-to-moderate rates of incision of 4.4–16m/Ma [Erlanger et al., 2012; Bierman et al., 2014; Dauteuil et al., 2013].Prior to the onset of the present-day semiarid climate [Pickford and Senut, 1997], a slightlymore humid climateprevailed during the early–middle Miocene. This wetter climate may have intensified river incision andenhance relief on the scale of tens to hundreds of meters [Mvondo et al., 2011; Dauteuil et al., 2013].
It is unlikely, though, that late Cenozoic erosion is only linked to climate changes because there is good evi-dence of sea level fluctuations [Roberts et al., 2011], neotectonic fault activity [de Beer, 2012], and the effects ofsmall-scale mantle convection [e.g.,Moucha et al., 2008] causing vertical surface motions and throughout theCenozoic. The key conclusion is that the thermochronometry data and modeling, coupled with cosmogenicisotope constraints and the geological constraints onshore and offshore, are inconsistent with the hypothesisthat the current topography of South Africa evolved from a low-relief, low-elevation landscape over the last30Myr. It is important to emphasize that we do not suggest that no variation in elevation or topography hasoccurred during the Cenozoic, but only that any change was not accompanied by major (km scale)regional erosion.
Journal of Geophysical Research: Solid Earth 10.1002/2016JB013478
WILDMAN ET AL. MESOZOIC EVOLUTION OF SOUTHERN AFRICA 23
7. Summary and Conclusions
The study of the origin and longevity of South Africa’s interior plateau has recently focused on the influenceof regional dynamic uplift arising from a buoyant source in the mantle. However, vertical motions stemmingfrom the mantle will couple with the regional in-plane stress field and, depending on the preexisting struc-ture, may induce different styles of deformation over different length scales. This regional uplift and localizeddeformation will result in complex patterns of denudation as new topography is eroded.
In the South African case, a change in lithospheric thickness between the Kaapvaal Craton and Namaquamobile belt focuses stress at the craton margin that will be augmented by changes in relative plate motionsin the middle Late Cretaceous. Thermal modification of the lithosphere as recorded by ubiquitous temporallyand chemically distinct kimberlite intrusions indicates the possible initiation or impact of a thermal anomalyat the base of the lithosphere during the middle Late Cretaceous. The vertical stresses imposed by a buoyantthermal upwelling may have driven long wavelength uplift of the strong, undeformed, cratonic lithosphere,whereas the off-craton Proterozoic mobile belt, weakened due to a thinner lithosphere, and the presence ofmajor pre-existing structures and thermal modification experienced short-wavelength deformation.
Due to the lack of significant preservation of post-Karoo stratigraphic units, and the overall lack of rock expo-sure across the plateau, direct observation of such a complex history of deformation in the geological recordis difficult. The constraints provided by AFT and AHe data, presented here, on the timing, rate, and spatial dis-tribution of denudation reveal a complex spatial and temporal Cretaceous evolution of the South African pla-teau (Figures 8 and 9).
We suggest that the removal of several kilometers of overburden during the Early Cretaceous from theSouthwest African continental margins and off-craton region of the interior plateau was in response to theinitial opening of the South Atlantic at ~150–130Ma and the lowering of regional base levels. This responsewas transmitted far inland along the paleo-Orange and Vaal River systems. Long- and short-wavelength uplifttriggered a younger km-scale regional phase of erosion that was particularly focused at the heavily faultedmargin of the SW Kaapvaal Craton at ~110–70Ma with deformation-related uplift continuing until the earlyCenozoic. However, the center of the Kaapvaal Craton studied has itself experienced extremely low amountsof cooling since the Paleozoic, suggesting that the region was not significantly buried or eroded since thePan-African orogenic cycle. The Cenozoic erosion history of the plateau is now well-constrained by AFT,AHe, and cosmogenic nuclide data and the preservation of crater facies rocks of Late Cretaceous kimberlitesand is characterized by low erosion rates (5–15m/Myr) with the total thickness of material removed duringthe Cenozoic being less than approximately 1 km.
ReferencesAltermann, W., and D. R. Nelson (1998), Sedimentation rates, basin analysis and regional correlations of three Neoarchaean and
Palaeoproterozoic sub-basins of the Kaapvaal craton as inferred from precise U-Pb zircon ages from volcaniclastic sediments, Sediment.Geol., 120(1), 225–256, doi:10.1016/S0037-0738(98)00034-7.
Altermann, W., and I. W. Hälbich (1991), Structural history of the southwestern corner of the Kaapvaal Craton and the adjacent Namaquarealm: New observations and a reappraisal, Precambrian Res., 52(1), 133–166, doi:10.1016/0301-9268(91)90017-5.
Artemieva, I. M., and L. P. Vinnik (2016), Density structure of the cratonic mantle in southern Africa: 1. Implications for dynamic topography,Gondwana Res., doi:10.1016/j.gr.2016.03.002.
Ault, A. K., R. M. Flowers, and S. A. Bowring (2013), Phanerozoic surface history of the Slave craton, Tectonics, 32, 1066–1083, doi:10.1002/tect.20069.
Bamford, M. K. (2000), Fossil woods of Karoo age deposits in South Africa and Namibia as an aid to biostratigraphical correlation, J. Afr. EarthSci., 31(1), 119–132, doi:10.1016/S0899-5362(00)00077-4.
Baptiste, V., A. Tommasi, and S. Demouchy (2012), Deformation and hydration of the lithospheric mantle beneath the Kaapvaal craton, SouthAfrica, Lithos, 149, 31–50, doi:10.1016/j.lithos.2012.05.001.
Bell, D. R., M. D. Schmitz, and P. E. Janney (2003), Mesozoic thermal evolution of the southern African mantle lithosphere, Lithos, 71(2),273–287, doi:10.1016/S0024-4937(03)00117-8.
Belton, D. X., and M. J. Raab (2010), Cretaceous reactivation and intensified erosion in the Archean-Proterozoic Limpopo Belt, demonstratedby apatite fission track thermochronology, Tectonophysics, 480(1), 99–108, doi:10.1016/j.tecto.2009.09.018.
Beucher, R., R. W. Brown, S. Roper, F. Stuart, and C. Persano (2013), Natural age dispersion arising from the analysis of broken crystals: Part II.Practical application to apatite (U-Th)/He thermochronometry, Geochim. Cosmochim. Acta, 120, 395–416, doi:10.1016/j.gca.2013.05.042.
Beukes, N. J., H. S. van Niekerk, and J. Gutzmer (1999), Post Gondwana land surface and pedogenetic ferromanganese deposits on theWitwatersrand at the West Wits Gold Mine, South Africa, S. Afr. J. Geol., 102(1), 65–82.
Bierman, P. R., and M. Caffee (2001), Slow rates of rock surface erosion and sediment production across the Namib Desert and escarpment,southern Africa, Am. J. Sci., 301(4–5), 326–358, doi:10.2475/ajs.301.4-5.326.
Bierman, P. R., R. Coppersmith, K. Hanson, J. Neveling, E. W. Portenga, and D. H. Rood (2014), A cosmogenic view of erosion, relief generation,and the age of faulting in southern Africa, GSA Today, 24(9), 4–11, doi:10.1130/GSATG206A.1.
Journal of Geophysical Research: Solid Earth 10.1002/2016JB013478
WILDMAN ET AL. MESOZOIC EVOLUTION OF SOUTHERN AFRICA 24
AcknowledgmentsFull analytical details, data tables, QTQtmodels, and QTQt data files can beaccessed through the online supportinginformation. We thank Olivier Datueil,Francois Guillocheau, Tim Redfield,Delphine Rouby, and Guilio Viola forinsightful contributions during thisproject. Marco Andreoli and staff atNECSA are thanked for logistic supportduring fieldwork in Namaqualand.Alexandre Kounov and Jessica Stanleyare sincerely thanked for their con-structive and detailed reviews. Thiswork was funded by the NaturalEnvironment Research Council, UK,grants NE/H008276/1, NE/H008454/1,and NE/JE500252/1. The University ofMelbourne thermochronologylaboratory receives infrastructuresupport under the AuScope Program ofNCRIS.
Bishop, P. (2007), Long-term landscape evolution: linking tectonics and surface processes, Earth Surf. Processes Landforms, 32(3), 329–365,doi:10.1002/esp.1493.
Blenkinsop, T. G., and A. Moore (2013), Tectonic geomorphology of passive margins and continental hinterlands, in Treatise onGeomorphology, vol. 5, edited by J. F. Shroder, pp. 71–92, Academic Press, London, doi:10.1016/B978-0-12-374739-6.00083-X.
Brandt, M. B., S. P. Grand, A. A. Nyblade, and P. H. Dirks (2012), Upper mantle seismic structure beneath Southern Africa: Constraints on thebuoyancy supporting the African superswell, Pure Appl. Geophys., 169(4), 595–614, doi:10.1007/s00024-011-0361-8.
Braun, J. (2010), The many surface expressions of mantle dynamics, Nat. Geosci., 3(12), 825–833, doi:10.1038/ngeo1020.Braun, J., F. Guillocheau, C. Robin, G. Baby, and H. Jelsma (2014), Rapid erosion of the Southern African Plateau as it climbs over a mantle
superswell, J. Geophys. Res. Solid Earth, 119, 6093–6112, doi:10.1002/2014JB010998..Brown, L. F., J. M. Benson, G. J. Brink, S. Doherty, A. Jollands, E. H. A. Jungslager, J. H. G. Keenan, A. Muntingh, and N. J. S. van Wyk (1995),
Sequence Stratigraphy in Offshore South African Divergent Basins: An Atlas on Exploration for Cretaceous Lowstand Traps by Soekor (Pty)Ltd, AAPG Stud. in Geol., 41, AAPG, doi:10.1306/St41600.
Brown, R. W., M. A. Summerfield, and A. J. Gleadow (2002), Denudational history along a transect across the Drakensberg Escarpment ofsouthern Africa derived from apatite fission track thermochronology, J. Geophys. Res., 107(B12), 2350, doi:10.1029/2001JB000745.
Brown, R. W., R. Beucher, S. Roper, C. Persano, F. Stuart, and P. Fitzgerald (2013), Natural age dispersion arising from the analysis of brokencrystals. Part I: Theoretical basis and implications for the apatite (U-Th)/He thermochronometer, Geochim. Cosmochim. Acta, 122, 478–497,doi:10.1016/j.gca.2013.05.041.
Brown, R., K. Gallagher, and M. Duane (1994), A quantitative assessment of the effects of magmatism on the thermal history of the Karoosedimentary sequence, J. Afr. Earth Sci., 18(3), 227–243.
Brown, R., M. Summerfield, A. Gleadow, K. Gallagher, A. Carter, R. Beucher, and M. Wildman (2014), Intracontinental deformation in southernAfrica during the Late Cretaceous, J. Afr. Earth Sci., 100, 20–41, doi:10.1016/j.jafrearsci.2014.05.014.
Burke, K. (1996), The African plate, S. Afr. J. Geol., 99(4), 341–409.Burke, K., and Y. Gunnell (2008), The African erosion surface: a continental-scale synthesis of geomorphology, tectonics, and environmental
change over the past 180 million years, Geol. Soc. Am. Mem., 201, 1–66, doi:10.1130/2008.1201.Burov, E., and S. Cloetingh (2009), Controls of mantle plumes and lithospheric folding on modes of intraplate continental tectonics:
Differences and similarities, Geophys. J. Int., 178(3), 1691–1722.Burov, E., and T. Gerya (2014), Asymmetric three-dimensional topography over mantle plumes, Nature, 513(7516), 85–89, doi:10.1038/
nature13703.Burov, E., and L. Guillou-Frottier (2005), The plume head-continental lithosphere interaction using a tectonically realistic formulation for the
lithosphere, Geophys. J. Int., 161(2), 469–490, doi:10.1016/j.tecto.2007.01.002.Calignano, E., D. Sokoutis, E. Willingshofer, F. Gueydan, and S. Cloetingh (2015), Strain localization at the margins of strong lithospheric
domains: Insights from analog models, Tectonics, 34, 396–412, doi:10.1002/2014TC003756.Carlson, W. D., R. A. Donelick, and R. A. Ketcham (1999), Variability of apatite fission-track annealing kinetics: I. Experimental results, Am.
Mineral., 84(9), 1213–1223, doi:10.2138/am-1999-0901.Catuneanu, O., H. Wopfner, P. G. Eriksson, B. Cairncross, B. S. Rubidge, R. M. H. Smith, and P. J. Hancox (2005), The Karoo basins of south-
central Africa, J. Afr. Earth Sci., 43(1), 211–253, doi:10.1016/j.jafrearsci.2005.07.007.Chardon, D., J. L. Grimaud, D. Rouby, A. Beauvais, and F. Christophoul (2016), Stabilization of large drainage basins over geological time
scales: Cenozoic West Africa, hot spot swell growth, and the Niger River, Geochem. Geophys. Geosyst., 17, 1164.Christie-Blick, N., and K. T. Biddle (1985), Deformation and sedimentation along strike-slip faults, in Strike-Slip Deformation, Basin Formation
and Sedimentation, edited by K. T. Biddle and N. Christie-Blick, pp. 1–37, SEPM Special Publications, Tulsa, Okla.Clark, M. K., K. A. Farley, D. Zheng, Z. Wang, and A. R. Duvall (2010), Early Cenozoic faulting of the northern Tibetan Plateau margin from
apatite (U-Th)/He ages, Earth Planet. Sci. Lett., 296(1), 78–88, doi:10.1016/j.epsl.2010.04.051.Clemson, J., J. Cartwright, and J. Booth (1997), Structural segmentation and the influence of basement structure on the Namibian passive
margin, J. Geol. Soc., 154(3), 477–482, doi:10.1144/gsjgs.154.3.0477.Cloetingh, S., and E. Burov (2011), Lithospheric folding and sedimentary basin evolution: A review and analysis of formation mechanisms,
Basin Res., 23(3), 257–290.Cloetingh, S., E. Burov, and T. Francois (2013), Thermo-mechanical controls on intra-plate deformation and the role of plume-folding inter-
actions in continental topography, Gondwana Res., 24(3), 815–837, doi:10.1111/j.1365-2117.2010.00490.x.Cockburn, H. A. P., R. W. Brown, M. A. Summerfield, and M. A. Seidl (2000), Quantifying passive margin denudation and landscape devel-
opment using a combined fission-track thermochronology and cosmogenic isotope analysis approach, Earth Planet. Sci. Lett., 179(3),429–435, doi:10.1016/s0012-821x(00)00144-8.
Codilean, A. T., P. Bishop, F. M. Stuart, T. B. Hoey, D. Fabel, and S. P. Freeman (2008), Single-grain cosmogenic 21Ne concentrations in fluvialsediments reveal spatially variable erosion rates, Geology, 36(2), 159–162, doi:10.1130/g24360a.1.
Codilean, A. T., C. R. Fenton, D. Fabel, P. Bishop, and S. Xu (2014), Discordance between cosmogenic nuclide concentrations in amalgamatedsands and individual fluvial pebbles in an arid zone catchment, Quat. Geochronol., 19, 173–180, doi:10.1016/j.quageo.2012.04.007.
Cogné, N., K. Gallagher, and P. R. Cobbold (2011), Post-rift reactivation of the onshore margin of southeast Brazil: Evidence from apatite(U-Th)/He and fission-track data, Earth Planet. Sci. Lett., 309(1), 118–130, doi:10.1016/j.epsl.2011.06.025.
Cogné, N., K. Gallagher, P. R. Cobbold, C. Riccomini, and C. Gautheron (2012), Post-breakup tectonics in southeast Brazil fromthermochronological data and combined inverse-forward thermal history modeling, J. Geophys. Res., 117, B11413, doi:10.1029/2012JB009340.
Colli, L., I. Stotz, H. P. Bunge, M. Smethurst, S. Clark, G. Iaffaldano, A. Tassara, F. Guillocheau, and M. C. Bianchi (2014), Rapid South Atlanticspreading changes and coeval vertical motion in surrounding continents: Evidence for temporal changes of pressure-driven uppermantle flow, Tectonics, 33, 1304–1321, doi:10.1002/2014TC003612.
Colli, L., S. Ghelichkhan, and H. P. Bunge (2016), On the ratio of dynamic topography and gravity anomalies in a dynamic Earth, Geophys. Res.Lett., 43, 2510–2516, doi:10.1002/2016GL067929.
Colliston, W. P., and A. E. Schoch (2013), Wrench-shearing during the Namaqua Orogenesis—Mesoproterozoic late stage deformation effectsduring Rodinia assembly, Precambrian Res., 233, 44–58, doi:10.1016/j.precamres.2013.03.007.
Colliston, W. P., D. H. Cornell, A. E. Schoch, and H. E. Praekelt (2015), Geochronological constraints on the Hartbees River Thrust and AugrabiesNappe: New insights into the assembly of the Mesoproterozoic Namaqua-Natal Province of Southern Africa, Precambrian Res., 265,150–165, doi:10.1016/j.precamres.2015.03.008.
Cornelissen, A. K., and W. J. Verwoerd (1975), The Bushmanland kimberlites and related rocks, Phys. Chem. Earth, 9, 71–80, doi:10.1016/b978-0-08-018017-5.50011-0.
Journal of Geophysical Research: Solid Earth 10.1002/2016JB013478
WILDMAN ET AL. MESOZOIC EVOLUTION OF SOUTHERN AFRICA 25
Cornell, D. H., R. J. Thomas, R. Gibson, H. F. G. Moen, D. L. Reid, J. M. Moore, and R. L. Gibson (2006), The Namaqua-Natal Province, Geol. Soc. S.Afr., 325–379, isbn:9781919908779.
Cox, K. G. (1992), Karoo igneous activity, and the early stages of the break-up of Gondwanaland, Geol. Soc. London, Spec. Publ., 68(1), 137–148,doi:10.1144/GSL.SP.1992.068.01.09.
Daly, M. C., J. Chorowicz, and J. D. Fairhead (1989), Rift basin evolution in Africa: The influence of reactivated steep basement shear zones,Geol. Soc. London, Spec. Publ., 44(1), 309–334, doi:10.1144/gsl.sp.1989.044.01.17.
Dauteuil, O., F. Deschamps, O. Bourgeois, A. Mocquet, and F. Guillocheau (2013), Post-breakup evolution and palaeotopography of theNorth Namibian Margin during the Meso-Cenozoic, Tectonophysics, 589, 103–115, doi:10.1016/j.tecto.2012.12.022.
de Beer, C. H. (2012), Evidence of Neogene to Quaternary faulting and seismogenic deformation along the Namaqualand coast, South Africa,S. Afr. J. Geol., 115(2), 117–136, doi:10.2113/gssajg.115.2.117.
de Vera, J., P. Granado, and K. McClay (2010), Structural evolution of the Orange Basin gravity-driven system, offshore Namibia, Mar. Pet.Geol., 27(1), 223–237, doi:10.1016/j.marpetgeo.2009.02.003.
De Wit, M. (2007), The Kalahari Epeirogeny and climate change: Differentiating cause and effect from core to space, S. Afr. J. Geol., 110(2-3),367–392, doi:10.2113/gssajg.110.2-3.367.
de Wit, M. C. (2016), Dwyka Eskers Along the Northern Margin of the Main Karoo Basin, in Origin and Evolution of the Cape Mountains andKaroo Basin, pp. 87–99, Springer Int.
deWit, M. C. J. (1988), Aspects of the geomorphology of the north-western Cape, South Africa, in Geomorphological Studies in Southern Africa,edited by G. F. Dardis and B. P. Moon, pp. 57–69, CRC Press, Rotterdam, Netherlands.
deWit, M. C. J. (1999), Post-Gondwana drainage and the development of diamond placers in western South Africa, Econ. Geol., 94(5), 721–740,doi:10.2113/gsecongeo.94.5.721.
de Wit, M. C. J., J. D. Ward, M. K. Bamford, and M. J. Roberts (2009), The significance of the Cretaceous diamondiferous gravel deposit atMahura Muthla, Northern Cape province, South Africa, S. Afr. J. Geol., 112(2), 89–108, doi:10.2113/gssajg.112.2.89.
Decker, J. E., S. Niedermann, and M. J. de Wit (2011), Soil erosion rates in South Africa compared with cosmogenic 3He-based rates of soilproduction, S. Afr. J. Geol., 114(3–4), 475–488, doi:10.2113/gssajg.114.3-4.475.
Delph, J. R., and R. C. Porter (2015), Crustal structure beneath Southern Africa: Insight into how tectonic events affect the Mohorovičić dis-continuity, Geophys. Journal Int., 200(1), 254–264, doi:10.1093/gji/ggu376.
Dewey, J. F., L. Robb, and L. Van Schalkwyk (2006), Did Bushmanland extensionally unroof Namaqualand?, Precambrian Res., 150(3), 173–182,doi:10.1016/j.precamres.2006.07.007.
Dingle, R. V., W. G. Siesser, and A. R. Newton (1983), Mesozoic and Tertiary Geology of Southern Africa, Balkema, Rotterdam.Dixey, F. (1955), Erosion surfaces in Africa: Some considerations of age and origin, Trans. Geol/. Society South Africa, 58, 265–280.Dollar, E. S. (1998), Palaeofluvial geomorphology in southern Africa: A review, Prog. Phys. Geogr., 22(3), 325–349, doi:10.1177/
030913339802200302.Donelick, R. A., P. B. O’Sullivan, and R. A. Ketcham (2005), Apatite fission-track analysis, Rev. Mineral. Geochem., 58(1), 49–94, doi:10.2138/
rmg.2005.58.3.Duncan, R. A., P. R. Hooper, J. Rehacek, J. S. Marsh, and A. R. Duncan (1997), The timing and duration of the Karoo igneous event, southern
Gondwana, J. Geophys. Res., 102, 18,127–18,138, doi:10.1029/97JB00972.Dunkl, I. (2002), TRACKKEY: A Windows program for calculation and graphical presentation of fission track data, Comput. Geosci., 28(1), 3–12,
doi:10.1016/s0098-3004(01)00024-3.Duvall, A. R., M. K. Clark, B. A. van der Pluijm, and C. Li (2011), Direct dating of Eocene reverse faulting in northeastern Tibet using Ar-dating of
fault clays and low-temperature thermochronometry, Earth Planet. Sci. Lett., 304(3), 520–526.Eagles, G. (2007), New angles on South Atlantic opening, Geophys. J. Int., 168(1), 353–361, doi:10.1111/j.1365-246x.2006.03206.x.Eglington, B. M. (2006), Evolution of the Namaqua-Natal Belt, southern Africa—A geochronological and isotope geochemical review, J. Afr.
Earth Sci., 46(1), 93–111, doi:10.1016/j.jafrearsci.2006.01.014.Eriksson, P. G., W. Altermann, and F. J. Hartzer (2006), The Transvaal Supergroup and its precursors, The Geology of South Africa. Geological
Society of South Africa, Johannesburg/Council for Geoscience, Pretoria, 237-260.Erlanger, E. D., D. E. Granger, and R. J. Gibbon (2012), Rock uplift rates in South Africa from isochron burial dating of fluvial and marine ter-
races, Geology, 40(11), 1019–1022, doi:10.1130/g33172.1.Fairhead, J. D., C. M. Green, S. M. Masterton, and R. Guiraud (2013), The role that plate tectonics, inferred stress changes and stratigraphic
unconformities have on the evolution of the West and Central African Rift System and the Atlantic continental margins, Tectonophysics,594, 118–127, doi:10.1016/j.tecto.2013.03.021.
Farley, K. A., R. A. Wolf, and L. T. Silver (1996), The effects of long alpha-stopping distances on (U-Th)/He ages, Geochim. Cosmochim. Acta,60(21), 4223–4229, doi:10.1016/s0016-7037(96)00193-7.
Farley, K. A., D. L. Shuster, and R. A. Ketcham (2011), U and Th zonation in apatite observed by laser ablation ICPMS, and implications for the(U-Th)/He system, Geochim. Cosmochim. Acta, 75(16), 4515–4530, doi:10.1016/j.gca.2011.05.020.
Fishwick, S., and I. D. Bastow (2011), Towards a better understanding of African topography: A review of passive-source seismic studies of theAfrican crust and upper mantle, Geol. Soc. London, Spec. Publ., 357(1), 343–371, doi:10.1144/SP357.19.
Fitzgerald, P. G., S. L. Baldwin, L. E. Webb, and P. B. O’sullivan (2006), Interpretation of (U-Th)/He single grain ages from slowly cooled crustalterranes: A case study from the Transantarctic Mountains of southern Victoria Land, Chem. Geol., 225(1), 91–120, doi:10.1016/j.chemgeo.2005.09.001.
Flament, N., M. Gurnis, S. Williams, M. Seton, J. Skogseid, C. Heine, and R. D. Müller (2014), Topographic asymmetry of the South Atlantic fromglobal models of mantle flow and lithospheric stretching, Earth Planet. Sci. Lett., 387, 107–119, doi:10.1016/j.epsl.2013.11.017.
Fleming, A., M. A. Summerfield, J. O. Stone, L. K. Fifield, and R. G. Cresswell (1999), Denudation rates for the southern DrakensbergEscarpment, SE Africa, derived from in-situ-produced cosmogenic 36Cl: Initial results, J. Geol. Soc., 156(2), 209–212, doi:10.1144/gsjgs.156.2.0209.
Flowers, R. M., and B. Schoene (2010), (U-Th)/He thermochronometry constraints on unroofing of the eastern Kaapvaal craton and signifi-cance for uplift of the southern African Plateau, Geology, 38(9), 827–830.
Flowers, R. M., R. A. Ketcham, D. L. Shuster, and K. A. Farley (2009), Apatite (U-Th)/He thermochronometry using a radiation damage accu-mulation and annealing model, Geochim. Cosmochim. Acta, 73(8), 2347–2365.
Foeken, J., F. M. Stuart, K. J. Dobson, C. Persano, and D. Vilbert (2006), A diode laser system for heating minerals for (U-Th)/He chronometry,Geochem. Geophys. Geosystems, 7, Q04015, doi:10.1029/2005GC001190.
Fossen, H., and B. Tikoff (1998), Extended models of transpression and transtension, and application to tectonic settings, Geol. Soc. London,Spec. Publ., 135(1), 15–33, doi:10.1144/GSL.SP.1998.135.01.02.
Journal of Geophysical Research: Solid Earth 10.1002/2016JB013478
WILDMAN ET AL. MESOZOIC EVOLUTION OF SOUTHERN AFRICA 26
Forte, A. M., R. Moucha, N. A. Simmons, S. P. Grand, and J. X. Mitrovica (2010), Deep-mantle contributions to the surface dynamics of theNorth American continent, Tectonophysics, 481(1), 3–15, doi:10.1016/j.gca.2009.01.015.
Fourie, C. J. S., and P. Cole (1997), Geological map of the Republic of South Africa and the Kingdoms of Lesotho and Swaziland, Council forGeoscience.
Gaina, C., T. H. Torsvik, D. J. van Hinsbergen, S. Medvedev, S. C. Werner, and C. Labails (2013), The African Plate: A history of oceanic crustaccretion and subduction since the Jurassic, Tectonophysics, 604, 4–25, doi:10.1016/j.tecto.2013.05.037.
Galbraith, R. F. (2010), Statistics for Fission Track Analysis, pp. 240, Chapman and Hall/CRC, Florida.Gallagher, K. (2012), Transdimensional inverse thermal history modeling for quantitative thermochronology, J. Geophys. Res., 117, B02408,
doi:10.1029/2011JB008825.Gallagher, K., and R. Brown (1997), The onshore record of passive margin evolution, J. Geol. Soc., 154(3), 451–457, doi:10.1144/
gsjgs.154.3.0451.Gallagher, K., and R. Brown (1999), Denudation and uplift at passive margins: The record on the Atlantic Margin of southern Africa, Phil. Trans.
R. Soc. Lond. Math. Phys. Eng. Sci., 357(1753), 835–859.Gallagher, K., R. Brown, and C. Johnson (1998), Fission track analysis and its applications to geological problems, Annu. Rev. Earth Planet. Sci.,
26(1), 519–572.Gallagher, K., K. Charvin, S. Nielsen, M. Sambridge, and J. Stephenson (2009), Markov chain Monte Carlo (MCMC) sampling methods to
determine optimal models, model resolution and model choice for Earth science problems, Mar. Pet. Geol., 26(4), 525–535, doi:10.1016/j.marpetgeo.2009.01.003.
Ganerød, M., T. H. Torsvik, D. J. J. Van Hinsbergen, C. Gaina, F. Corfu, S. Werner, T. M. Owen-Smith, L. D. Ashwal, S. J. Webb, andB. W. H. Hendriks (2011), Palaeoposition of the Seychelles microcontinent in relation to the Deccan Traps and the Plume Generation Zonein Late Cretaceous-Early Palaeogene time, Geol. Soc. London, Spec. Publ., 357(1), 229–252, doi:10.1144/SP357.12.
García-Castellanos, D., and S. I. E. R. D. Cloetingh (2011), Modeling the interaction between lithospheric and surface processes in forelandbasins, in Tectonics of Sedimentary Basins: Recent Advances, edited by C. Busby and A. Azor, pp. 152–181, John Wiley, Chichester, U. K.,doi:10.1002/9781444347166.ch8.
Gautheron, C., L. Tassan-Got, J. Barbarand, and M. Pagel (2009), Effect of alpha-damage annealing on apatite (U-Th)/He thermochronology,Chem. Geol., 266(3), 157–170, doi:10.1016/j.chemgeo.2009.06.001.
Gautheron, C., L. Tassan-Got, R. A. Ketcham, and K. J. Dobson (2012), Accounting for long alpha-particle stopping distances in (U-Th-Sm)/Hegeochronology: 3D modeling of diffusion, zoning, implantation, and abrasion, Geochim. Cosmochim. Acta, 96, 44–56.
Gautheron, C., J. Barbarand, R. A. Ketcham, L. Tassan-Got, P. van der Beek, M. Pagel, R. Pinna-Jamme, F. Couffignal, and M. Fialin (2013),Chemical influence on α-recoil damage annealing in apatite: Implications for (U-Th)/He dating, Chem. Geol., 351, 257–267, doi:10.1016/j.chemgeo.2013.05.027.
Gerin, C., C. Gautheron, E. Oliviero, C. Bachelet, D. M. Djimbi, A. M. Seydoux-Guillaume, L. Tassan-Got, P. Sarda, J. Roques, and F. Garrido(2017), Influence of vacancy damage on He diffusion in apatite, investigated at atomic to mineralogical scales, Geochim. Cosmochim. Acta,197, 87–103.
Gilchrist, A. R., and M. A. Summerfield (1990), Differential denudation and flexural isostasy in formation of rifted-margin upwarps, 346,739–742, doi:10.1038/346739a0.
Gilchrist, A. R., H. Kooi, and C. Beaumont (1994), Post-Gondwana geomorphic evolution of southwestern Africa: Implications for thecontrols on landscape development from observations and numerical experiments, J. Geophys. Res., 99, 12,211–12,228,doi:10.1029/94JB00046.
Gleadow, A., M. Harrison, B. Kohn, R. Lugo-Zazueta, and D. Phillips (2015), The Fish Canyon Tuff: A new look at an old low-temperaturethermochronology standard, Earth Planet. Sci. Lett., 424, 95–108.
Gleadow, A. J. W., and P. G. Fitzgerald (1987), Uplift history and structure of the Transantarctic Mountains: New evidence from fission trackdating of basement apatites in the Dry Valleys area, southern Victoria Land, Earth Planet. Sci. Lett., 82(1), 1–14.
Gorczyk, W., and K. Vogt (2015), Tectonics and melting in intra-continental settings, Gondwana Res., 27(1), 196–208, doi:10.1016/j.gr.2013.09.021.
Goudie, A. S. (2005), The drainage of Africa since the Cretaceous, Geomorphology, 67(3), 437–456, doi:10.1016/j.geomorph.2004.11.008.Granot, R., and J. Dyment (2015), The Cretaceous opening of the South Atlantic Ocean, Earth Planet. Sci. Lett., 414, 156–163, doi:10.1016/j.
epsl.2015.01.015.Green, P. F., I. R. Duddy, A. J. W. Gleadow, P. R. Tingate, and G. M. Laslett (1985), Fission-track annealing in apatite: Track length measurements
and the form of the Arrhenius plot, Nucl. Tracks Radiat. Meas., 10(3), 323–328.Green, P. F., I. R. Duddy, A. J. W. Gleadow, P. R. Tingate, and G. M. Laslett (1986), Thermal annealing of fission tracks in apatite: 1. A qualitative
description, Chem. Geol. Isot. Geosci. Sect., 59, 237–253.Green, P. F., I. R. Duddy, G. M. Laslett, K. A. Hegarty, A. W. Gleadow, and J. F. Lovering (1989), Thermal annealing of fission tracks in apatite 4.
Quantitative modelling techniques and extension to geological timescales, Chem. Geol. Isot. Geosci. Sect., 79(2), 155–182, doi:10.1016/0168-9622(89)90018-3.
Green, P. F., P. V. Crowhurst, I. R. Duddy, P. Japsen, and S. P. Holford (2006), Conflicting (U-Th)/He and fission track ages in apatite: EnhancedHe retention, not anomalous annealing behaviour, Earth Planet. Sci. Lett., 250(3), 407–427, doi:10.1016/j.epsl.2006.08.022.
Green, P. F., K. Lidmar-Bergström, P. Japsen, J. M. Bonow, and J. A. Chalmers (2013), Stratigraphic landscape analysis, thermochronology andthe episodic development of elevated, passive continental margins, Geological Survey of Denmark and Greenland. Danish Ministry ofclimate, energy and building, isbn:978-87-7871-372-8.
Green, P. F., I. R. Duddy, P. Japsen, J. M. Bonow, and J. A. Malan (2016), Post-breakup burial and exhumation of the southern margin of Africa,Basin Res., doi:10.1111/bre.12167.
Gresse, P. G., and G. J. B. Germs (1993), The Nama foreland basin: Sedimentation, major unconformity bounded sequences and multisidedactive margin advance, Precambrian Res., 63(3), 247–272, doi:10.1016/0301-9268(93)90036-2.
Gresse, P. G., M. W. Von Veh, and H. E. Frimmel (2006), Namibian (Neoproterozoic) to early Cambrian successions, in The Geology of SouthAfrica, edited by C. R. Johannesburg and R. J. Thomas, pp. 395–420 , Geological Society of South Africa, Pretoria, isbn:9781919908779.
Griffin, W. L., S. Y. O’Reilly, L. M. Natapov, and C. G. Ryan (2003), The evolution of lithospheric mantle beneath the Kalahari Craton and itsmargins, Lithos, 71(2), 215–241, doi:10.1016/j.lithos.2003.07.006.
Griffin, W. L., S. Y. O’reilly, J. C. Afonso, and G. C. Begg (2009), The composition and evolution of lithospheric mantle: A re-evaluation and itstectonic implications, J. Petrol., 50(7), 1185–1204.
Gueydan, F., J. Précigout, and L. G. Montesi (2014), Strain weakening enables continental plate tectonics, Tectonophysics, 631, 189–196,doi:10.1016/j.tecto.2014.02.005.
Journal of Geophysical Research: Solid Earth 10.1002/2016JB013478
WILDMAN ET AL. MESOZOIC EVOLUTION OF SOUTHERN AFRICA 27
Guillaume, B., C. Gautheron, T. Simon-Labric, J. Martinod, M. Roddaz, and E. Douville (2013), Dynamic topography control on Patagonianrelief evolution as inferred from low temperature thermochronology, Earth Planet. Sci. Lett., 364, 157–167, doi:10.1016/j.epsl.2012.12.036.
Guillocheau, F., D. Rouby, C. Robin, C. Helm, N. Rolland, C. Le Carlier de Veslud, and J. Braun (2012), Quantification and causes of the terri-genous sediment budget at the scale of a continental margin: A new method applied to the Namibia-South Africa margin, Basin Res.,24(1), 3–30, doi:10.1111/j.1365-2117.2011.00511.x.
Guillou-Frottier, L., E. Burov, S. Cloetingh, E. Le Goff, Y. Deschamps, B. Huet, and V. Bouchot (2012), Plume-induced dynamic instabilities nearcratonic blocks: Implications for P-T-t paths and metallogeny, Global Planet. Change, 90, 37–50, doi:10.1016/j.gloplacha.2011.10.007.
Gunnell, Y., K. Gallagher, A. Carter, M. Widdowson, and A. J. Hurford (2003), Denudation history of the continental margin of westernpeninsular India since the early Mesozoic—Reconciling apatite fission-track data with geomorphology, Earth Planet. Sci. Lett., 215(1),187–201, doi:10.1016/s0012-821x(03)00380-7.
Guiraud, R., and W. Bosworth (1997), Senonian basin inversion and rejuvenation of rifting in Africa and Arabia: Synthesis and implications toplate-scale tectonics, Tectonophysics, 282(1), 39–82, doi:10.1016/S0040-1951(97)00212-6.
Gurnis, M., J. X. Mitrovica, J. Ritsema, and H. J. van Heijst (2000), Constraining mantle density structure using geological evidence of surfaceuplift rates: The case of the African superplume, Geochem. Geophys. Geosyst., 1, 1020, doi:10.1029/1999GC000035.
Gutzmer, J., and N. J. Beukes (2000), Asbestiform manjiroite and todorokite from the Kalahari manganese field, South Africa, S. Afr. J. Geol.,103(3-4), 163–174, doi:10.2113/1030163.
Haddon, I. G., and T. S. McCarthy (2005), The Mesozoic-Cenozoic interior sag basins of Central Africa: The Late-Cretaceous-Cenozoic Kalahariand Okavango basins, J. Afr. Earth Sci., 43(1), 316–333, doi:10.1016/j.jafrearsci.2005.07.008.
Hanson, E. K., J. M. Moore, E. M. Bordy, J. S. Marsh, G. Howarth, and J. V. A. Robey (2009), Cretaceous erosion in central South Africa: Evidencefrom upper-crustal xenoliths in kimberlite diatremes, S. Afr. J. Geol., 112, 125–140, doi:10.2113/gssajg.112.2.125.
Heine, C., J. Zoethout, and R. D. Müller (2013), Kinematics of the South Atlantic rift, Solid Earth, 4, 215–253, doi:10.5194/se-4-215-2013.Herbert, C. T., and J. S. Compton (2007), Depositional environments of the Lower Permian Dwyka diamictite and Prince Albert shale inferred
from the geochemistry of early diagenetic concretions, southwest Karoo Basin, South Africa, Sediment. Geol., 194(3), 263–277, doi:10.1016/j.sedgeo.2006.06.008.
Herman, F., J. Braun, T. J. Senden, and W. J. Dunlap (2007), (U-Th)/He thermochronometry: Mapping 3D geometry using micro-X-ray tomo-graphy and solving the associated production-diffusion equation, Chem. Geol., 242(1), 126–136.
Hurford, A. J., and P. F. Green (1982), A users’ guide to fission track dating calibration, Earth Planet. Sci. Lett., 59(2), 343–354, doi:10.1016/0012-821x(82)90136-4.
Jacob, R. J., B. J. Bluck, and J. D. Ward (1999), Tertiary-age diamondiferous fluid deposits of the lower Orange River valley, Southwest Africa,Econ. Geol., 94(5), 749–758, doi:10.2113/gsecongeo.94.5.749.
Jacobs, J., R. J. Thomas, and K. Weber (1993), Accretion and indentation tectonics at the southern edge of the Kaapvaal Craton during theKibaran (Grenville) orogeny, Geology, 21(3), 203–206, doi:10.1130/0091-7613(1993)021<0203:aaitat>2.3.co;2.
Janney, P. E., S. B. Shirey, R. W. Carlson, D. G. Pearson, D. R. Bell, A. P. Le Roex, A. Ishikawa, P. H. Nixon, and F. R. Boyd (2010), Age, compositionand thermal characteristics of South African off-craton mantle lithosphere: Evidence for a multi-stage history, J. Petrol., doi:10.1093/pet-rology/egq041.
Janssen, M. E., R. A. Stephenson, and S. A. P. L. Cloetingh (1995), Temporal and spatial correlations between changes in plate motions and theevolution of rifted basins in Africa, Geol. Soc. Am. Bull., 107(11), 1317–1332, doi:10.1130/0016-7606(1995)107<1317:TASCBC>2.3.CO;2.
Jelsma, H., W. Barnett, S. Richards, and G. Lister (2009), Tectonic setting of kimberlites, Lithos, 112, 155–165, doi:10.1016/j.lithos.2009.06.030.Johnson, M. R., C. R. Anhauesser, and R. J. Thomas (2006), The Geology of South Africa, Geological Society of South Africa, Pretoria,
isbn:9781919908779.Jones, M. Q. W. (1987), Heat flow and heat production in the Namaqua mobile belt, South Africa, J. Geophys. Res., 92, 6273–6289, doi:10.1029/
JB092ib07p06273.Jourdan, F., G. Féraud, H. Bertrand, A. B. Kampunzu, G. Tshoso, M. K. Watkeys, and B. Le Gall (2005), Karoo large igneous province: Brevity,
origin, and relation to mass extinction questioned by new 40Ar/39Ar age data, Geology, 33(9), 745–748, doi:10.1130/g21632.1.Jourdan, F., G. Féraud, H. Bertrand, and M. K. Watkeys (2007), From flood basalts to the inception of oceanization: Example from the
40Ar/39Ar high-resolution picture of the Karoo large igneous province, Geochem. Geophys. Geosyst., 8, Q02002, doi:10.1029/2006GC001392.
Karlstrom, K. E., and E. D. Humphreys (1998), Persistent influence of Proterozoic accretionary boundaries in the tectonic evolution of south-western North America interaction of cratonic grain and mantle modification events, Rocky Mt. Geol., 33(2), 161–179, doi:10.2113/33.2.161.
Kendall, B., D. van Acken, and R. A. Creaser (2013), Depositional age of the early paleoproterozoic klipputs member, nelani formation (GhaapGroup, Transvaal Supergroup, South Africa) and implications for low-level Re-Os geochronology and paleoproterozoic global correlations,Precambrian Res., 237, 1–12, doi:10.1016/j.precamres.2013.08.002.
Ketcham, R. A. (2005), The role of crystallographic angle in characterizing and modeling apatite fission-track length data, Radiat. Meas., 39(6),595–601, doi:10.1016/j.radmeas.2004.07.008.
Ketcham, R. A., A. Carter, R. A. Donelick, J. Barbarand, and A. J. Hurford (2007), Improved modeling of fission-track annealing in apatite, Am.Mineral., 92(5–6), 799–810, doi:10.2138/am.2007.2281.
Ketcham, R. A., W. R. Guenthner, and P. W. Reiners (2013), Geometric analysis of radiation damage connectivity in zircon, and its implicationsfor helium diffusion, Am. Mineral., 98(2–3), 350–360.
King, L. C. (1955), Pediplanation and isostasy: An example from South Africa, Quart. J. Geol. Soc., 111(1–4), 353–359, doi:10.1144/GSL.JGS.1955.111.01-04.18.
Kobussen, A. F., W. L. Griffin, S. Y. O’Reilly, and S. R. Shee (2008), Ghosts of lithospheres past: Imaging an evolving lithospheric mantle inSouthern Africa, Geology, 36(7), 515–518, doi:10.1130/G24868A.1.
Kohn, B. P., M. Lorencak, A. J. Gleadow, F. Kohlmann, A. Raza, K. G. Osadetz, and P. Sorjonen-Ward (2009), A reappraisal of low-temperaturethermochronology of the eastern Fennoscandia Shield and radiation-enhanced apatite fission-track annealing, Geol. Soc. London, Spec.Publ., 324(1), 193–216.
Koptev, A., E. Calais, E. Burov, S. Leroy, and T. Gerya (2015), Dual continental rift systems generated by plume-lithosphere interaction, Nat.Geosci., 8(5), 388–392, doi:10.1038/ngeo2401.
Kounov, A., S. Niedermann, M. J. de Wit, G. Viola, M. Andreoli, and J. Erzinger (2007), Present denudation rates at selected sections of theSouth African escarpment and the elevated continental interior based on cosmogenic 3He and 21Ne, S. Afr. J. Geol., 110(2–3), 235–248,doi:10.2113/gssajg.110.2-3.235.
Kounov, A., G. Viola, M. DeWit, and M. A. G. Andreoli (2009), Denudation along the Atlantic passive margin: New insights from apatite fission-track analysis on the western coast of South Africa, Geol. Soc. London, Spec. Publ., 324(1), 287–306, doi:10.1144/sp324.19.
Journal of Geophysical Research: Solid Earth 10.1002/2016JB013478
WILDMAN ET AL. MESOZOIC EVOLUTION OF SOUTHERN AFRICA 28
Kounov, A., G. Viola, I. Dunkl, and H. E. Frimmel (2013), Southern African perspectives on the long-termmorpho-tectonic evolution of cratonicinteriors, Tectonophysics, 601, 177–191, doi:10.1016/j.tecto.2013.05.009.
Kounov, A., S. Niedermann, M. J. de Wit, A. T. Codilean, G. Viola, M. Andreoli, and M. Christl (2015), Cosmogenic 21Ne and 10Be reveal a morethan 2 Ma alluvial fan flanking the Cape Mountains, South Africa, S. Afr. J. Geol., 118(2), 129–144, doi:10.2113/gssajg.118.2.129.
Labails, C., T. H. Torsvik, C. Gaina, and R. M. Cocks (2009), Global plate polygons 2009. SPlates Model (version 2.0), Tech. Rep. 2009.047, NGU,Postboks 6315 Sluppen, 7491 Trondheim. [Available at http://www.ngu.no/en-gb/.]
Lenardic, A., L. Moresi, and H. Mühlhaus (2000), The role of mobile belts for the longevity of deep cratonic lithosphere: The crumple zonemodel, Geophys. Res. Lett., 27, 1235–1238, doi:10.1029/1999GL008410.
Lenardic, A., L. N. Moresi, and H. Mühlhaus (2003), Longevity and stability of cratonic lithosphere: Insights from numerical simulations ofcoupled mantle convection and continental tectonics, J. Geophys. Res., 108(B6), 2302, doi:10.1029/2001JB000169.
Leprêtre, R., Y. Missenard, J. Barbarand, C. Gautheron, O. Saddiqi, and R. Pinna-Jamme (2015), Postrift history of the eastern central Atlanticpassive margin: Insights from the Saharan region of SouthMorocco, J. Geophys. Res. Solid Earth, 120, 4645–4666, doi:10.1002/2014JB011549.
Lisker, F., B. Ventura, and U. A. Glasmacher (2009), Apatite thermochronology in modern geology, Geol. Soc. London, Spec. Publ., 324(1), 1–23.Lithgow-Bertelloni, C., and P. G. Silver (1998), Dynamic topography, plate driving forces and the African superswell, Nature, 395(6699),
269–272, doi:10.1038/26212.Mbongo-Djimbi, D., C. Gautheron, J. Roques, L. Tassan-Got, C. Gerin, and E. Simoni (2015), Impact of apatite chemical composition on (U-Th)/
He thermochronometry: An atomistic point of view, Geochim. Cosmochim. Acta, 167, 162–176, doi:10.1016/j.gca.2015.06.017.McMillan, I. K. (2003), Foraminiferally defined biostratigraphic episodes and sedimentation pattern of the Cretaceous drift succession (Early
Barremian to Late Maastrichtian) in seven basins on the South African and southern Namibian continental margin, S. Afr. J. Sci.,99(11 & 12), 537, issn:00382353.
Meesters, A. G. C. A., and T. J. Dunai (2002a), Solving the production-diffusion equation for finite diffusion domains of various shapes: Part I.Implications for low-temperature (U-Th)/He thermochronology, Chem. Geol., 186(3), 333–344, doi:10.1016/s0009-2541(01)00422-3.
Meesters, A. G. C. A., and T. J. Dunai (2002b), Solving the production-diffusion equation for finite diffusion domains of various shapes: Part II.Application to cases with α-ejection and nonhomogeneous distribution of the source, Chem. Geol., 186(3), 347–363, doi:10.1016/s0009-2541(02)00073-6.
Molnar, P., P. C. England, and C. H. Jones (2015), Mantle dynamics, isostasy, and the support of high terrain, J. Geophys. Res. Solid Earth, 120,1932–1957, doi:10.1002/2014JB011724.
Moore, A. E., and P. A. Larkin (2001), Drainage evolution in south-central Africa since the breakup of Gondwana, S. Afr. J. Geol., 104(1), 47–68,doi:10.2113/104.1.47.
Moore, A. E., and W. J. Verwoerd (1985), The olivine melilitite-“kimberlite”-carbonatite suite of Namaqualand and Bushmanland, South Africa,S. Afr. J. Geol., 88(2), 281–294.
Moore, A., T. Blenkinsop, and F. W. Cotterill (2008), Controls on post-Gondwana alkaline volcanism in Southern Africa, Earth Planet. Sci. Lett.,268(1), 151–164, doi:10.1016/j.epsl.2008.01.007.
Moore, A., T. Blenkinsop, and F. W. Cotterill (2009), Southern African topography and erosion history: Plumes or plate tectonics?, Terra Nova,21(4), 310–315, doi:10.1111/j.1365-3121.2009.00887.x.
Moucha, R., and A. M. Forte (2011), Changes in African topography driven by mantle convection, Nat. Geosci., 4(10), 707–712, doi:10.1038/ngeo1235.
Moucha, R., A. M. Forte, J. X. Mitrovica, D. B. Rowley, S. Quéré, N. A. Simmons, and S. P. Grand (2008), Dynamic topography and long-term sea-level variations: There is no such thing as a stable continental platform, Earth Planet. Sci. Lett., 271(1), 101–108, doi:10.1016/j.epsl.2008.03.056.
Moulin, M., D. Aslanian, and P. Unternehr (2010), A new starting point for the South and Equatorial Atlantic Ocean, Earth Sci. Rev., 98(1), 1–37,doi:10.1016/j.earscirev.2009.08.001.
Moulin,M., F. Fluteau, V. Courtillot, J. Marsh, G. Delpech, X. Quidelleur, M. Gerard, andA. E. Jay (2011), An attempt to constrain the age, duration,and eruptive history of the Karoo flood basalt: Naude’s Nek section (South Africa), J. Geophys. Res., 116, B07403, doi:10.1029/2011JB008210.
Müller, R. D., M. Sdrolias, C. Gaina, and W. R. Roest (2008), Age, spreading rates, and spreading asymmetry of the world’s ocean crust,Geochem. Geophys. Geosyst., 9, Q04006, doi:10.1029/2007GC001743.
Mvondo, F., O. Dauteuil, and F. Guillocheau (2011), The Fish River Canyon (Southern Namibia): A record of Cenozoic mantle dynamics?, C. R.Geosci., 343(7), 478–485, doi:10.1016/j.crte.2011.07.003.
Nürnberg, D., and R. D. Müller (1991), The tectonic evolution of the South Atlantic from Late Jurassic to present, Tectonophysics, 191(1), 27–53,doi:10.1016/0040-1951(91)90231-g.
Nyblade, A. A., and S. W. Robinson (1994), The African superswell, Geophy. Res. Lett., 21, 765–768, doi:10.1029/94GL00631.Ollier, C. D., and M. E. Marker (1985), The Great Escarpment of Southern Africa, Z. Geomorph. Suppl., 54, 37–56.Partridge, T. C., and R. R. Maud (1987), Geomorphic evolution of southern Africa since the Mesozoic, S. Afr. J. Geol., 90(2), 179–208.Paul, J. D., G. G. Roberts, and N. White (2014), The African landscape through space and time, Tectonics, 33, 898–935, doi:10.1002/
2013TC003479.Pérez-Díaz, L., and G. Eagles (2014), Constraining South Atlantic growth with seafloor spreading data, Tectonics, 33, 1848–1873, doi:10.1002/
2014TC003644.Pérez-Gussinyé, M., and A. B. Watts (2005), The long-term strength of Europe and its implications for plate-forming processes, Nature,
436(7049), 381–384, doi:10.1038/nature03854.Persano, C., F. M. Stuart, P. Bishop, and T. J. Dempster (2005), Deciphering continental breakup in eastern Australia using low-temperature
thermochronometers, J. Geophys. Res., 110, B12405, doi:10.1029/2004JB003325.Pickford, M., and B. Senut (1997), Cainozoic mammals from coastal Namaqualand, South Africa, Palaeontol. Afr., 34, 199–217.Raab, M. J., R. W. Brown, K. Gallagher, A. Carter, and K. Weber (2002), Late Cretaceous reactivation of major crustal shear zones in northern
Namibia: Constraints from apatite fission track analysis, Tectonophysics, 349(1), 75–92, doi:10.1016/s0040-1951(02)00047-1.Raab, M. J., R. W. Brown, K. Gallagher, K. Weber, and A. J. W. Gleadow (2005), Denudational and thermal history of the Early Cretaceous
Brandberg and Okenyenya igneous complexes on Namibia’s Atlantic passive margin, Tectonics, 24, TC3006, doi:10.1029/2004TC001688Redfield, T. F., and P. T. Osmundsen (2014), Some remarks on the earthquakes of Fennoscandia: A conceptual seismological model drawn
from the perspective of hyperextension, Norw. J. Geol./Norsk Geologisk Forening, 94(4), 233–262.Reiners, P. W., and K. A. Farley (2001), Influence of crystal size on apatite (U-Th)/He thermochronology: An example from the Bighorn
Mountains, Wyoming, Earth Planet. Sci. Lett., 188(3), 413–420, doi:10.1016/s0012-821x(01)00341-7.Roberts, D. L., et al. (2011), Regional and global context of the Late Cenozoic Langebaanweg (LBW) palaeontological site: West Coast of South
Roberts, G. G., and N. White (2010), Estimating uplift rate histories from river profiles using African examples, J. Geophys. Res., 115, B02406,doi:10.1029/2009JB006692.
Rosendahl, B. R. (1987), Architecture of continental rifts with special reference to East Africa, Ann. Rev. Earth Planet. Sci., 15, 445–503,doi:10.1146/annurev.ea.15.050187.002305.
Rouby, D., S. Bonnet, F. Guillocheau, K. Gallagher, C. Robin, F. Biancotto, O. Dauteuil, and J. Braun (2009), Sediment supply to the Orangesedimentary system over the last 150 My: An evaluation from sedimentation/denudation balance, Mar. Pet. Geol., 26(6), 782–794,doi:10.1016/j.marpetgeo.2008.08.004.
Rudge, J. F., G. G. Roberts, N. White, and C. N. Richardson (2015), Uplift histories of Africa and Australia from linear inverse modeling ofdrainage inventories, J. Geophys. Res. Earth Surf., 120, 894–914, doi:10.1002/2014JF003297.
Salomon, E., D. Koehn, C. Passchier, P. C. Hackspacher, and U. A. Glasmacher (2014), Contrasting stress fields on correlating margins of theSouth Atlantic, Gondwana Res., 28(3), 1152–1167, doi:10.1016/j.gr.2014.09.006.
Salomon, E., D. Koehn, and C. Passchier (2015), Brittle reactivation of ductile shear zones in NW Namibia in relation to South Atlantic rifting,Tectonics, 34, 70–85, doi:10.1002/2014TC003728.
Scharf, T. E., A. T. Codilean, M. de Wit, J. D. Jansen, and P. W. Kubik (2013), Strong rocks sustain ancient postorogenic topography in southernAfrica, Geology, 41(3), 331–334, doi:10.1130/g33806.1.
Shuster, D. L., R. M. Flowers, and K. A. Farley (2006), The influence of natural radiation damage on helium diffusion kinetics in apatite, EarthPlanet. Sci. Lett., 249(3), 148–161, doi:10.1016/j.epsl.2006.07.028.
Smith, C. B., T. C. Clark, E. S. Barton, and J. W. Bristow (1994), Emplacement ages of kimberlite occurrences in the Prieska region, southwestborder of the Kaapvaal Craton, South Africa, Chem. Geol., 113(1), 149–169.
Smith, R. M. H. (1986), Sedimentation and palaeoenvironments of Late Cretaceous crater-lake deposits in Bushmanland, South Africa,Sedimentology, 33(3), 369–386, doi:10.1111/j.1365-3091.1986.tb00542.x.
Sobel, E. R., and D. Seward (2010), Influence of etching conditions on apatite fission-track etch pit diameter, Chem. Geol., 271(1), 59–69,doi:10.1016/j.chemgeo.2009.12.012.
Sodoudi, F., X. Yuan, R. Kind, S. Lebedev, J. M. C. Adam, E. Kästle, and F. Tilmann (2013), Seismic evidence for stratification in composition andanisotropic fabric within the thick lithosphere of Kalahari Craton, Geochem. Geophys. Geosyst., 14, 5393–5412, doi:10.1002/2013GC004955.
Spiegel, C., B. Kohn, D. Belton, Z. Berner, and A. Gleadow (2009), Apatite (U-Th-Sm)/He thermochronology of rapidly cooled samples: Theeffect of He implantation, Earth Planet. Sci. Lett., 285(1), 105–114, doi:10.1016/j.epsl.2009.05.045.
Stanley, J. R., R. M. Flowers, and D. R. Bell (2013), Kimberlite (U-Th)/He dating links surface erosion with lithospheric heating, thinning, andmetasomatism in the southern African Plateau, Geology, 41(12), 1243–1246, doi:10.1130/g34797.1.
Stanley, J. R., R.M. Flowers, andD. R. Bell (2015), Erosionpatterns andmantle sources of topographic change across the southernAfricanPlateauderived from the shallow and deep records of kimberlites, Geochem. Geophys. Geosyst., 16, 3235–3256, doi:10.1002/2015GC005969.
Stevenson, I. R., and I. K. McMillan (2004), Incised valley fill stratigraphy of the Upper Cretaceous succession, proximal Orange Basin, Atlanticmargin of Southern Africa, J. Geol. Soc., 161(2), 185–208, doi:10.1144/0016-764902-003.
Stollhofen, H., S. Gerschütz, I. G. Stanistreet, and V. Lorenz (1998), Tectonic and volcanic controls on Early Jurassic rift-valley lake depositionduring emplacement of Karoo flood basalts, southern Namibia, Palaeogeogr. Palaeoclimatol. Palaeoecol., 140(1), 185–215, doi:10.1016/S0031-0182(98)00029-7.
Summerfield, M. A. (1985), Plate tectonics and landscape development on the African continent, in Tectonic Geomorphology, edited by M.Morisawa and J. T. Hack, pp. 27–51, Allan and Unwin, Boston, Mass.
Svensen, H., F. Corfu, S. Polteau, Ø. Hammer, and S. Planke (2012), Rapid magma emplacement in the Karoo large igneous province, EarthPlanet. Sci. Lett., 325, 1–9, doi:10.1016/j.epsl.2012.01.015.
Tankard, A., H. Welsink, P. Aukes, R. Newton, and E. Stettler (2009), Tectonic evolution of the Cape and Karoo basins of South Africa, Mar. Pet.Geol., 26(8), 1379–1412, doi:10.1016/j.marpetgeo.2009.01.022.
Thomas, D. S. G., and P. A. Shaw (1990), The deposition and development of the Kalahari Group sediments, Central Southern Africa, J. Afr.Earth Sci. (and the Middle East), 10(1–2), 187–197, doi:10.1016/0899-5362(90)90054-I.
Thomas, R. J., A. L. D. Agenbacht, D. H. Cornell, and J. M. Moore (1994), The Kibaran of southern Africa: Tectonic evolution and metallogeny,Ore Geol. Rev., 9(2), 131–160, doi:10.1016/0169-1368(94)90025-6.
Tinker, J., M. de Wit, and R. Brown (2008), Linking source and sink: Evaluating the balance between onshore erosion and offshore sedimentaccumulation since Gondwana break-up, South Africa, Tectonophysics, 455(1), 94–103, doi:10.1016/j.tecto.2007.11.040.
Tooth, S., and T. S. McCarthy (2004), Anabranching in mixed bedrock-alluvial rivers: The example of the Orange River above Augrabies Falls,Northern Cape Province, South Africa, Geomorphology, 57(3), 235–262, doi:10.1016/S0169-555X(03)00105-3.
Torsvik, T. H., S. Rousse, C. Labails, and M. A. Smethurst (2009), A new scheme for the opening of the South Atlantic Ocean and the dissectionof an Aptian salt basin, Geophys. J. Int., 177(3), 1315–1333, doi:10.1111/j.1365-246X.2009.04137.x.
Torsvik, T. H., K. Burke, B. Steinberger, S. J. Webb, and L. D. Ashwal (2010), Diamonds sampled by plumes from the core-mantle boundary,Nature, 466(7304), 352–35, doi:10.1038/nature09216.
van der Beek, P., M. A. Summerfield, J. Braun, R. W. Brown, and A. Fleming (2002), Modeling postbreakup landscape development and denu-dational history across the southeast African (DrakensbergEscarpment)margin, J. Geophys. Res.,107(B12), 2351,doi:10.1029/2001JB000744.
van der Wateren, F. M., and T. J. Dunai (2001), Late Neogene passive margin denudation history—Cosmogenic isotope measurements fromthe central Namib desert, Global Planet. Change, 30(3), 271–307, doi:10.1016/s0921-8181(01)00104-7.
Vermeesch, P. (2009), RadialPlotter: A Java application for fission track, luminescence and other radial plots, Radiat. Meas., 44(4), 409–410.Vermeesch, P., and Y. Tian (2014), Thermal history modelling: HeFTy vs. QTQt, Earth Sci. Rev., 139, 279–290, doi:10.1016/j.
earscirev.2014.09.010.Viola, G., M. Andreoli, Z. Ben-Avraham, I. Stengel, and M. Reshef (2005), Offshore mud volcanoes and onland faulting in southwestern Africa:
Neotectonic implications and constraints on the regional stress field, Earth Planet. Sci. Lett., 231(1), 147–160, doi:10.1016/j.epsl.2004.12.001.
Viola, G., A. Kounov, M. A. G. Andreoli, and J. Mattila (2012), Brittle tectonic evolution along the western margin of South Africa: More than500 Myr of continued reactivation, Tectonophysics, 514, 93–114, doi:10.1016/j.tecto.2011.10.009.
Visser, J. N. J. (1989), The Permo-Carboniferous Dwyka Formation of southern Africa: Deposition by a predominantly subpolar marine icesheet, Palaeogeogr. Palaeoclimatol. Palaeoecol., 70(4), 377–391, doi:10.1016/0031-0182(89)90115-6.
Wang, H., J. van Hunen, D. G. Pearson, and M. B. Allen (2014), Craton stability and longevity: The roles of composition-dependent rheologyand buoyancy, Earth Planet. Sci. Lett., 391, 224–233, doi:10.1016/j.epsl.2014.01.038.
Ward, J. D., and H. Martin (1987), A terrestrial conglomerate of Cretaceous age—A new record from the Skeleton Coast, Namib Desert,Commun. Geol. Surv. South West Afr./Namibia, 3, 57–58.
Journal of Geophysical Research: Solid Earth 10.1002/2016JB013478
WILDMAN ET AL. MESOZOIC EVOLUTION OF SOUTHERN AFRICA 30
Waters, D. J. (1989), Metamorphic evidence for the heating and cooling path of Namaqualand granulites, Geol. Soc. London, Spec. Publ., 43(1),357–363, doi:10.1144/gsl.sp.1989.043.01.31.
Wildman, M., R. Brown, R. Watkins, A. Carter, A. Gleadow, and M. Summerfield (2015), Post break-up tectonic inversion across thesouthwestern cape of South Africa: New insights from apatite and zircon fission track thermochronometry, Tectonophysics, 654, 30–55,doi:10.1016/j.tecto.2015.04.012.
Wildman, M., R. Brown, R. Beucher, C. Persano, F. Stuart, K. Gallagher, J. Schwanethal, and A. Carter (2016), The chronology and tectonic styleof landscape evolution along the elevated Atlantic continental margin of South Africa resolved by joint apatite fission track and (U-Th-Sm)/He thermochronology, Tectonics, 35, 511–545, doi:10.1002/2015TC004042.
Wilson, A., S. Flint, T. Payenberg, E. Tohver, and L. Lanci (2014), Architectural styles and sedimentology of the fluvial lower Beaufort Group,Karoo Basin, South Africa, J. Sediment. Res., 84(4), 326–348, doi:10.2110/jsr.2014.28.
Youssof, M., H. Thybo, I. M. Artemieva, and A. Levander (2013), Moho depth and crustal composition in Southern Africa, Tectonophysics, 609,267–287, doi:10.1016/j.tecto.2013.09.001.
Youssof, M., H. Thybo, I. M. Artemieva, and A. Levander (2015), Upper mantle structure beneath southern African cratons from seismic finite-frequency P-and S-body wave tomography, Earth Planet. Sci. Lett., 420, 174–186, doi:doi:10.1016/j.epsl.2015.01.034
Zachos, J., M. Pagani, L. Sloan, E. Thomas, and K. Billups (2001), Trends, rhythms, and aberrations in global climate 65 Ma to present, Science,292(5517), 686–693, doi:10.1126/science.1059412.
Journal of Geophysical Research: Solid Earth 10.1002/2016JB013478
WILDMAN ET AL. MESOZOIC EVOLUTION OF SOUTHERN AFRICA 31