METHODS published: 21 July 2015 doi: 10.3389/feart.2015.00040 Frontiers in Earth Science | www.frontiersin.org 1 July 2015 | Volume 3 | Article 40 Edited by: Eric Font, University of Lisbon, Portugal Reviewed by: Jean-Luc Bouchez, Toulouse University, France Hervé Regnauld, University of Rennes 2, France *Correspondence: Patrick C. Wassmer, Laboratoire de Geographie Physique, UMR-Centre National de la Recherche Scientifique 8591, 1, Place Aristide Briand, 92195 Meudon, France [email protected]Specialty section: This article was submitted to Geomagnetism and Paleomagnetism, a section of the journal Frontiers in Earth Science Received: 05 May 2015 Accepted: 03 July 2015 Published: 21 July 2015 Citation: Wassmer PC, Gomez CA, Iskandasyah TYWM, Lavigne F and Sartohadi J (2015) Contribution of anisotropy of magnetic susceptibility (AMS) to reconstruct flooding characteristics of a 4220 BP tsunami from a thick unconsolidated structureless deposit (Banda Aceh, Sumatra). Front. Earth Sci. 3:40. doi: 10.3389/feart.2015.00040 Contribution of anisotropy of magnetic susceptibility (AMS) to reconstruct flooding characteristics of a 4220 BP tsunami from a thick unconsolidated structureless deposit (Banda Aceh, Sumatra) Patrick C. Wassmer 1, 2, 3 *, Christopher A. Gomez 3 , T. Yan W. M. Iskandarsyah 2, 4 , Franck Lavigne 1 and Junun Sartohadi 5 1 Laboratory of Physical Geography, UMR- Centre National de la Recherche Scientifique 8591, University of Paris 1, Panthéon-Sorbonne, Meudon, France, 2 Laboratoire Image, Ville, Environnement, Université de Strasbourg, UMR 7362, Strasbourg, France, 3 Department of Geography, College of Sciences, University of Canterbury, Christchurch, New Zealand, 4 Laboratorium Geologi Lingkungan dan Hidrogeologi, Fakultas Teknik Geologi, Universitas Padjadjaran, Bandung, Indonesia, 5 Faculty of Geography, Gadjah Mada University, Yogjakarta, Indonesia One of the main concerns of deciphering tsunami sedimentary records along seashore is to link the emplaced layers with marine high energy events. Based on a combination of morphologic features, sedimentary figures, grain size characteristics, fossils content, microfossils assemblages, geochemical elements, heavy minerals presence; it is, in principle, possible to relate the sedimentary record to a tsunami event. However, experience shows that sometimes, in reason of a lack of any visible sedimentary features, it is hard to decide between a storm and a tsunami origin. To solve this issue, the authors have used the Anisotropy of Magnetic Susceptibility technique (AMS) to characterize the sediment fabric. The validity of the method for reconstructing flow direction has been proved when applied on sediments in the aftermath of a tsunami event, for which the behavior was well-documented like the 2004 Indian Ocean Tsunami (IOT). We present herein an application of this method for a 56 cm thick paleo-deposit dated 4220 BP laying below the soil covered by the 2004 IOT at Lampuuk, SE of Banda Aceh, North Sumatra. We analyzed this homogenous deposit, lacking of any visible structure, using methods of classic sedimentology to confirm the occurrence of a high energy event. We then applied AMS technique that allowed the reconstruction of flow characteristics during sediment deposition. We show that the whole sequence was emplaced by successive uprush phases and that the local topography played a role on the re-orientation of a part of the uprush flow, creating strong reverse current. This particular behavior was reported by eyewitnesses for the 2004 IOT event. Keywords: paleo-tsunami, flow behavior reconstruction, anisotropy of magnetic susceptibility, structureless sediment deposit, Banda Aceh
Transcript
METHODSpublished: 21 July 2015
doi: 10.3389/feart.2015.00040
Frontiers in Earth Science | www.frontiersin.org 1 July 2015 | Volume 3 | Article 40
Contribution of anisotropy ofmagnetic susceptibility (AMS) toreconstruct flooding characteristicsof a 4220 BP tsunami from a thickunconsolidated structureless deposit(Banda Aceh, Sumatra)Patrick C. Wassmer 1, 2, 3*, Christopher A. Gomez 3, T. Yan W. M. Iskandarsyah 2, 4,
Franck Lavigne 1 and Junun Sartohadi 5
1 Laboratory of Physical Geography, UMR- Centre National de la Recherche Scientifique 8591, University of Paris 1,
Panthéon-Sorbonne, Meudon, France, 2 Laboratoire Image, Ville, Environnement, Université de Strasbourg, UMR 7362,
Strasbourg, France, 3Department of Geography, College of Sciences, University of Canterbury, Christchurch, New Zealand,4 Laboratorium Geologi Lingkungan dan Hidrogeologi, Fakultas Teknik Geologi, Universitas Padjadjaran, Bandung, Indonesia,5 Faculty of Geography, Gadjah Mada University, Yogjakarta, Indonesia
One of the main concerns of deciphering tsunami sedimentary records along seashore
is to link the emplaced layers with marine high energy events. Based on a combination
of morphologic features, sedimentary figures, grain size characteristics, fossils content,
microfossils assemblages, geochemical elements, heavy minerals presence; it is, in
principle, possible to relate the sedimentary record to a tsunami event. However,
experience shows that sometimes, in reason of a lack of any visible sedimentary features,
it is hard to decide between a storm and a tsunami origin. To solve this issue, the authors
have used the Anisotropy of Magnetic Susceptibility technique (AMS) to characterize the
sediment fabric. The validity of the method for reconstructing flow direction has been
proved when applied on sediments in the aftermath of a tsunami event, for which the
behavior was well-documented like the 2004 Indian Ocean Tsunami (IOT). We present
herein an application of this method for a 56 cm thick paleo-deposit dated 4220 BP
laying below the soil covered by the 2004 IOT at Lampuuk, SE of Banda Aceh, North
Sumatra. We analyzed this homogenous deposit, lacking of any visible structure, using
methods of classic sedimentology to confirm the occurrence of a high energy event. We
then applied AMS technique that allowed the reconstruction of flow characteristics during
sediment deposition. We show that the whole sequence was emplaced by successive
uprush phases and that the local topography played a role on the re-orientation of a part
of the uprush flow, creating strong reverse current. This particular behavior was reported
by eyewitnesses for the 2004 IOT event.
Keywords: paleo-tsunami, flow behavior reconstruction, anisotropy of magnetic susceptibility, structureless
Wassmer et al. AMS and paleo-current reconstruction
Introduction
The Anisotropy of Magnetic Susceptibility (AMS) of rocks andsediments is certainly one of the most versatile techniques ingeology, as it finds usage from Archean rocks (e.g., Borradaileet al., 2012) to contemporary deposits (e.g., Wassmer et al.,2010; Wassmer and Gomez, 2011). The method, known as AMS,based on a first inference that ferromagnetic minerals realignafter a rock is subject to deformation, started with the earlyfindings of Graham (1954) on sedimentary rocks and Balsley andBuddington (1960) who proved that the AMS could detect thefabric of minerals in orthogneiss and granites. Since then themethod has been recognized as an effective petrofabric tool forgranites (Bouchez et al., 1990; Bouchez, 1997; Benn et al., 2001;Esmaeily et al., 2007; Njanko et al., 2010; Raposo et al., 2012).By extension, the method has also been used for other types ofmagma and lava emplacement, such asmid-oceanic ridges basaltsfor instance (Veloso et al., 2014).
As mentioned above, sedimentary rocks have also been thesubjects of similar research: Graham (1954) used the AMS toevidence the deformation of sedimentary rocks of the AppalachiaMountain (Graham, 1966). The method has then been extendedto a variety of sedimentary environment, either consolidatedmaterial, e.g., the non-deformed Callovo-Oxfordian argillites ofthe Paris Basin, France (Esteban et al., 2006), the tectonicallyimpacted marine clays of the Crotone basin, Italy (Macri et al.,2014), deep-sea sediments transport (Housen et al., 2014); orunconsolidated material, e.g., tsunami washover deposits inIndonesia (Wassmer et al., 2010; Wassmer and Gomez, 2011)and New Zealand (Kain et al., 2014), or lake sediments in China(Dong et al., 2013).
The AMS technique reveals the fabric acquired by sedimentsduring deposition, i.e., the statistical common organization ofthe grains, providing that the grains have an oblong shape. AMSis based on the induction of a magnetic field (H) applied toa small sample of undisturbed sediment. The material exposedthen produces an induced magnetic field (M) from which thevolumic magnetic susceptibility can be calculated (M = k.H).This volumic magnetic susceptibility can vary along differentorientations of the inductor magnetic field H, depending on thevarious magnetic minerals present in the sample. The inducedmagnetic field of the sample can be measured from differentdirections, for example by spinning the sample to the signalsource in all three axes. These data characterize the shape ofthe induced field anisotropy. If this shape is a sphere, thefield is perfectly isotropic but usually the field is close toan ellipsoid figured by a long, a short, and an intermediaryaxis, Kmax, Kmin, Kint. For sedimentary deposits, the maximumsusceptibility axis, Kmax, generally parallel to the mean longaxis of the individual particles, reflects the internal fabric of thematerial.
AMS Applied on the 2004 Indian OceanTsunami (IOT) Deposits in Banda Aceh
The research team has investigated tsunami deposits using theAMS technique at different locations worldwide, e.g., in Japan,
in New Zealand (Kain et al., 2014), along the coast of Morocco,and in Indonesia near Banda Aceh (Wassmer et al., 2010;Wassmer and Gomez, 2011) and in the Sunda Strait (Paris et al.,2014).
The 2004 IOT offers a unique chance to link the flowcharacteristics over land with the sediment deposits. From theavailable sedimentary material, Wassmer et al. (2010) have (1)clearly identified tsunami sandy deposits, lying on the often-truncated ante-2004 soil; and (2) linked the sedimentary recordsto the flood characteristics described by numerous eyewitnesses(Lavigne et al., 2009). Despite the breadth of available data,numerous points remained unveiled, prior to the usage of AMS.Indeed, eyewitnesses agreed on the emplacement of most ofthe deposits by the landward flow or uprush, but traditionaltechniques of sediment analysis could not provide convincingcorroborating evidence, and especially no recording of theprecise wave orientation. Trying to solve this issue, the researchteam tested several methods, such as deposits peelings, resinimpregnations and thin sections in order to derive a proxy of thesediment fabric, but none of these method provided conclusiveresults, and we therefore turned toward the AMS method todraw conclusion at the fine scale. The combination of AMS withother traditional sediment analysis techniques proved that it waspossible:
1) to reconstruct the flow direction of each individual wave ofthe wave-train that contributed to the sedimentary signatureof the event (Wassmer and Gomez, 2011);
2) to evidence that not all the waves have left perennial records,the deposit of the first wave being erased by the second andmore energetic wave while the influence of the last waves, withless energy was restricted to the proximal zone Lavigne et al.,2009; Wassmer et al., 2010);
3) to estimate the sediment stock brought by each wave, sortingout the part emplaced after the turbulent front passed throughand the part emplaced by the tail of the wave (unpublisheddata);
4) to identify the sediment sources that provided the materialfor the sediment recording of the event (Wassmer et al., 2007,2010);
5) to evaluate, in a bay context, the role played by therefraction/reflexion of the waves along the surrounding shoreson the incidence angle of each wave during the event(unpublished data);
6) to reconstruct the characteristics of each wave:
i. identifying the layers emplaced during the different phasesof the tsunami swash cycle of the waves, i.e., uprush, slack,or backwash (Wassmer et al., 2010);
ii. retrieving the variations of sedimentation dynamics frombase to top for each deposit interval corresponding to thematerial emplaced by individual waves within the wavetrain (ibidem);
All these studies helped us to build the knowledge necessaryto tackle paleo-tsunami deposits investigation usingAMS, for which both topography and flow dynamics areunknown.
Frontiers in Earth Science | www.frontiersin.org 2 July 2015 | Volume 3 | Article 40
Wassmer et al. AMS and paleo-current reconstruction
Objectives
Building on this extensive broad experience, the presentarticle aims to contribute to the research-body on AMS onunconsolidated sediments, with a central focus on the recordingof the 4220 BP thick tsunami deposit near the present-dayvillage of Lampuuk, South Banda Aceh, Sumatra (Wassmer,2015). The AMS technique, tested, and applied on contemporarydeposits will therefore prove to be efficient to characterizesediments deposited by paleo-extreme energy events, such aspaleo-tsunami.
Study Material and Location
The very flat coastal plain of Lampuuk is delimited to theNorth and the North-West by an amphitheater-like morphologyrealized by the steep lowest slopes of the small mountain rangeending Sumatra Island to the NW, and by the small crest lineoriented SE-NW closing the plain to the NE (Figure 1). A 800mlarge pass interrupts the amphitheater continuity at the levelof Lampisang village. This particular morphology had a role incontrolling the flow behavior during the 2004 tsunami event.
Investigations carried out at Lampuuk Bay in 2005, 2006, and2007 allow identifying, below the 25 cm thick ante-2004 soil, a56 cm thick tsunami deposit displaying the same characteristicsthan those of the 2004 IOT deposits. This paleo-event, that hasbeen dated 4220± 40 BP (Poz. 16331) fromwood debris collectedat the base of the sediment layer, has never been revealed in thisarea before (Wassmer, 2015). This finding is most probably tobe linked to tsunami deposits of the same period identified inMaldives (Mörner, 2007); in Sri Lanka (Jackson et al., 2008, 2014;Ranasinghage, 2010) and near Padang,West Sumatra (Dura et al.,2011).
Methodology
Field SamplingThe sampling of unconsolidated sediments for AMS analysisis a delicate operation. To ensure reliability of the results, thesampling must be done meticulously when dealing with soft-sediments, the fabric of unconsolidated grains being easily alteredduring sampling.
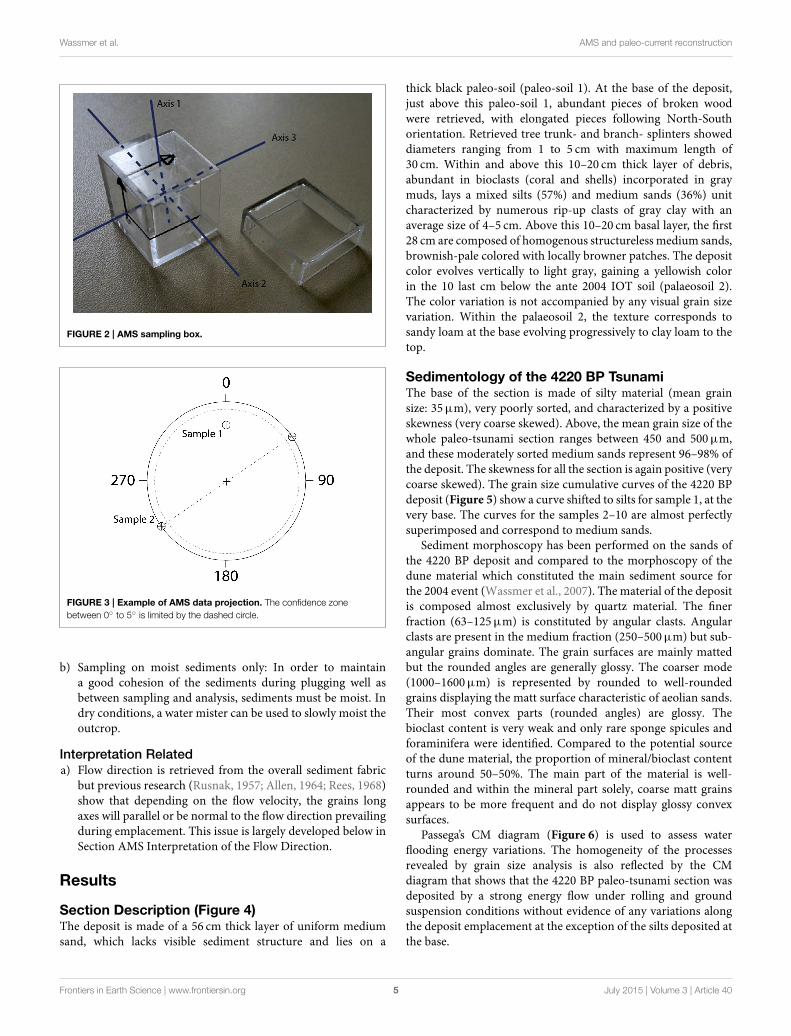
During the field work campaign of March 2007, the authorsdug a trench for sediment sampling from the wall. The outcropwas reworked using a trowel, until the clinometer attested ofperfectly vertical wall. To collect the samples, boxes with a smallhole of 1mm diameter at the bottom—to allow air to escape—were plugged horizontally in identified tsunami layers (Figure 2).A clinometer was used during the process, in order to keep a stricthorizontality. Azimuth and plunge of the plugging axis (axis 3)of the box have been noted on the box side (permanent ink) aswell as the axis 3 direction, and the two other axes of the box(1 and 2).
The removal of the box from the wall must be done withthe outmost care in order to avoid any disturbance of thestructure of the sample. The material, once leveled to the rim,the box is sealed with a tape in order to keep its moisture, which
guarantees the best preservation of the fabric. The samplingboxes must be propped up in a hard-box and away fromany shock before laboratory analysis. The time slot betweensampling and laboratory measurements must be as short aspossible.
Laboratory Analysis and Data RepresentationGrain SizeBefore analysis, organic matter was removed from the sampleswith hydrogen peroxide, then washed with KCl or HCl to removethe flocculating ions, and agitated in distilled water and sodiumhexametaphosphate during 4–6 h. Particles of size exceeding2000µm were separated thanks to the help of a T-34 sieve size.From normal samples, grain size measurement was performedusing a Beckman Coulter LS-230 (Range: 0.04 to 2000µm) at theEOST Laboratory, University of Strasbourg, France.
The data are represented by cumulative grain size curves(Figure 5, Section Sedimentology of the 4220 BP Tsunami).
Grain size parameters were calculated: Mean grain size (µm,Trask); Sorting (ô, Folk and Ward) and Skewness (mm, Trask).Each parameter was plotted vs. depth (Figure 4, Section SectionDescription) in order to enlight the hydrodynamic characteristicsvariations along the tsunami event.
The sedimentary material of the deposit is made of almost100% of quartz grains containing some very small individualblack grains. This very weak content has been reported by Costaet al. (2015), for the same area of Lampuuk—Lhok Nga, whomentioned values ranging from 0.352 to 0.003%. The low bulkmagnetic susceptibilities (76.10 to 149.95 10−6 SI) reflect a lackof ferromagnetic particles.
Frontiers in Earth Science | www.frontiersin.org 3 July 2015 | Volume 3 | Article 40
Wassmer et al. AMS and paleo-current reconstruction
FIGURE 1 | General map of Banda Aceh area, North Sumatra, Indonesia. Black circle corresponds to investigation site.
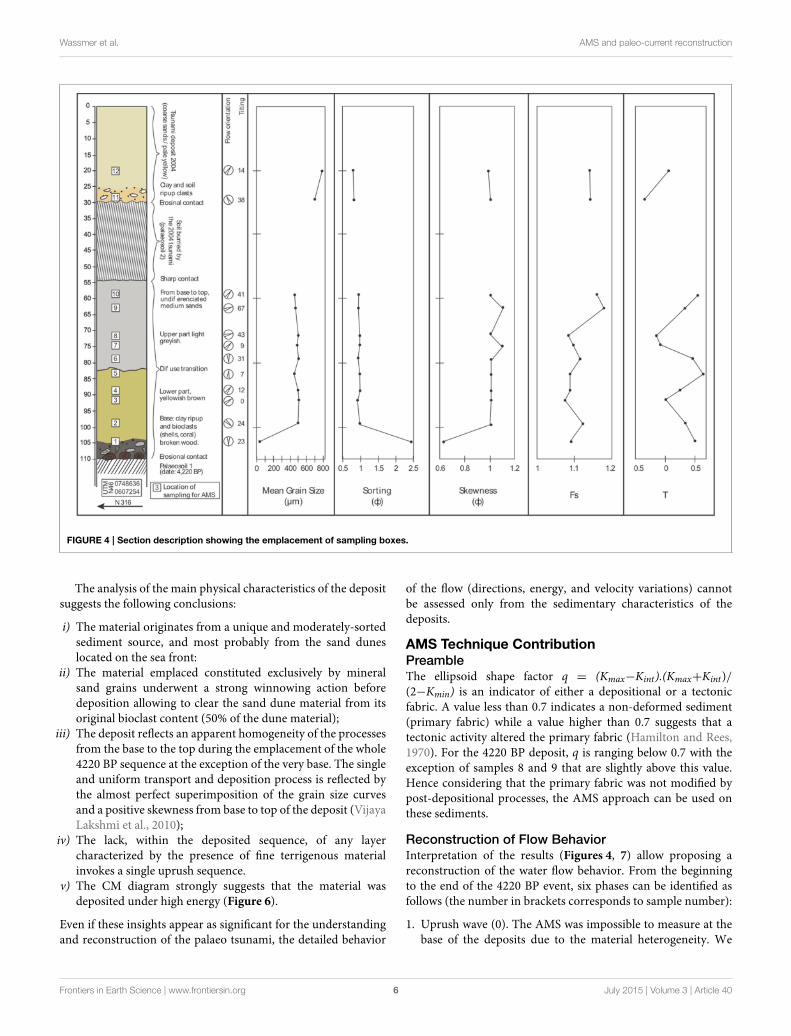
Weaknesses of the MethodSampling Relateda) Careful sampling is a key point for the accuracy of AMS
measurement. The sampling boxes must be plugged perfectly
horizontally otherwise a light tilting of the box might
induce a bias in the tilting interpretation. As a horizontalplugging is sometimes hard to realize, we interpret with
caution the plunge values located within the bracket 0◦ to 5◦
(Figure 3).
b) Sampling box size: the 20mm.-side of the sampling boxes
may constitute a limit for sampling layers thinner than
20mm.Within a tsunami sequence, sediment layers emplacedare sometimes very thin in reason of a weak deposition or
a post-depositional scouring. For fine sediments displayinga good cohesion we circumvent this issue in uncovering thesurface of the thin layer and we plugged successively twiceor three times in the sediment in order to fill the box. Therepetition of this unconventional technique (three pluggingfor a single sample) five times on the same layer gave resultsperfectly identical.
Material Relateda) Sampling is not possible on coarse sand: unsorted material
containing coarse sands or gravels cannot be sampled. If thebox edge meets a granule during plugging, a perturbation ofthe fabric of the sample may occur.
Frontiers in Earth Science | www.frontiersin.org 4 July 2015 | Volume 3 | Article 40
Wassmer et al. AMS and paleo-current reconstruction
FIGURE 2 | AMS sampling box.
FIGURE 3 | Example of AMS data projection. The confidence zone
between 0◦ to 5◦ is limited by the dashed circle.
b) Sampling on moist sediments only: In order to maintaina good cohesion of the sediments during plugging well asbetween sampling and analysis, sediments must be moist. Indry conditions, a water mister can be used to slowly moist theoutcrop.
Interpretation Relateda) Flow direction is retrieved from the overall sediment fabric
but previous research (Rusnak, 1957; Allen, 1964; Rees, 1968)show that depending on the flow velocity, the grains longaxes will parallel or be normal to the flow direction prevailingduring emplacement. This issue is largely developed below inSection AMS Interpretation of the Flow Direction.
Results
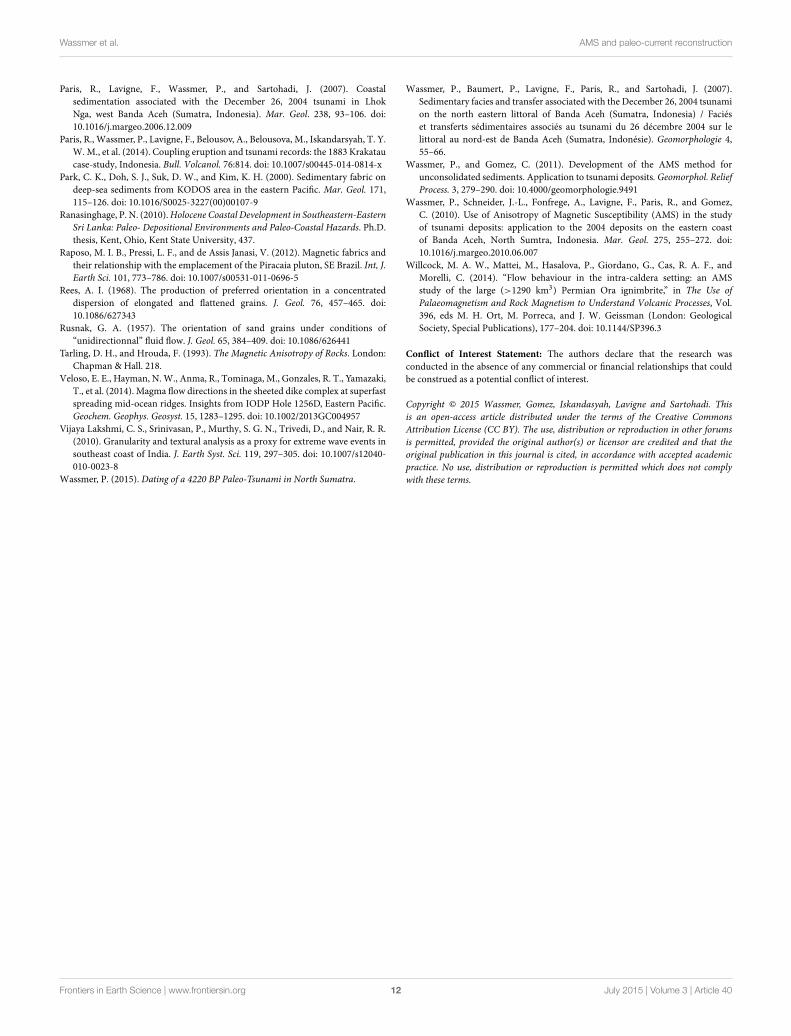
Section Description (Figure 4)The deposit is made of a 56 cm thick layer of uniform mediumsand, which lacks visible sediment structure and lies on a
thick black paleo-soil (paleo-soil 1). At the base of the deposit,just above this paleo-soil 1, abundant pieces of broken woodwere retrieved, with elongated pieces following North-Southorientation. Retrieved tree trunk- and branch- splinters showeddiameters ranging from 1 to 5 cm with maximum length of30 cm. Within and above this 10–20 cm thick layer of debris,abundant in bioclasts (coral and shells) incorporated in graymuds, lays a mixed silts (57%) and medium sands (36%) unitcharacterized by numerous rip-up clasts of gray clay with anaverage size of 4–5 cm. Above this 10–20 cm basal layer, the first28 cm are composed of homogenous structureless medium sands,brownish-pale colored with locally browner patches. The depositcolor evolves vertically to light gray, gaining a yellowish colorin the 10 last cm below the ante 2004 IOT soil (palaeosoil 2).The color variation is not accompanied by any visual grain sizevariation. Within the palaeosoil 2, the texture corresponds tosandy loam at the base evolving progressively to clay loam to thetop.
Sedimentology of the 4220 BP TsunamiThe base of the section is made of silty material (mean grainsize: 35µm), very poorly sorted, and characterized by a positiveskewness (very coarse skewed). Above, the mean grain size of thewhole paleo-tsunami section ranges between 450 and 500µm,and these moderately sorted medium sands represent 96–98% ofthe deposit. The skewness for all the section is again positive (verycoarse skewed). The grain size cumulative curves of the 4220 BPdeposit (Figure 5) show a curve shifted to silts for sample 1, at thevery base. The curves for the samples 2–10 are almost perfectlysuperimposed and correspond to medium sands.
Sediment morphoscopy has been performed on the sands ofthe 4220 BP deposit and compared to the morphoscopy of thedune material which constituted the main sediment source forthe 2004 event (Wassmer et al., 2007). The material of the depositis composed almost exclusively by quartz material. The finerfraction (63–125µm) is constituted by angular clasts. Angularclasts are present in the medium fraction (250–500µm) but sub-angular grains dominate. The grain surfaces are mainly mattedbut the rounded angles are generally glossy. The coarser mode(1000–1600µm) is represented by rounded to well-roundedgrains displaying the matt surface characteristic of aeolian sands.Their most convex parts (rounded angles) are glossy. Thebioclast content is very weak and only rare sponge spicules andforaminifera were identified. Compared to the potential sourceof the dune material, the proportion of mineral/bioclast contentturns around 50–50%. The main part of the material is well-rounded and within the mineral part solely, coarse matt grainsappears to be more frequent and do not display glossy convexsurfaces.
Passega’s CM diagram (Figure 6) is used to assess waterflooding energy variations. The homogeneity of the processesrevealed by grain size analysis is also reflected by the CMdiagram that shows that the 4220 BP paleo-tsunami section wasdeposited by a strong energy flow under rolling and groundsuspension conditions without evidence of any variations alongthe deposit emplacement at the exception of the silts deposited atthe base.
Frontiers in Earth Science | www.frontiersin.org 5 July 2015 | Volume 3 | Article 40
Wassmer et al. AMS and paleo-current reconstruction
FIGURE 4 | Section description showing the emplacement of sampling boxes.
The analysis of the main physical characteristics of the depositsuggests the following conclusions:
i) The material originates from a unique and moderately-sortedsediment source, and most probably from the sand duneslocated on the sea front:
ii) The material emplaced constituted exclusively by mineralsand grains underwent a strong winnowing action beforedeposition allowing to clear the sand dune material from itsoriginal bioclast content (50% of the dune material);
iii) The deposit reflects an apparent homogeneity of the processesfrom the base to the top during the emplacement of the whole4220 BP sequence at the exception of the very base. The singleand uniform transport and deposition process is reflected bythe almost perfect superimposition of the grain size curvesand a positive skewness from base to top of the deposit (VijayaLakshmi et al., 2010);
iv) The lack, within the deposited sequence, of any layercharacterized by the presence of fine terrigenous materialinvokes a single uprush sequence.
v) The CM diagram strongly suggests that the material wasdeposited under high energy (Figure 6).
Even if these insights appear as significant for the understandingand reconstruction of the palaeo tsunami, the detailed behavior
of the flow (directions, energy, and velocity variations) cannotbe assessed only from the sedimentary characteristics of thedeposits.
AMS Technique ContributionPreambleThe ellipsoid shape factor q = (Kmax−Kint).(Kmax+Kint)/(2−Kmin) is an indicator of either a depositional or a tectonicfabric. A value less than 0.7 indicates a non-deformed sediment(primary fabric) while a value higher than 0.7 suggests that atectonic activity altered the primary fabric (Hamilton and Rees,1970). For the 4220 BP deposit, q is ranging below 0.7 with theexception of samples 8 and 9 that are slightly above this value.Hence considering that the primary fabric was not modified bypost-depositional processes, the AMS approach can be used onthese sediments.
Reconstruction of Flow BehaviorInterpretation of the results (Figures 4, 7) allow proposing areconstruction of the water flow behavior. From the beginningto the end of the 4220 BP event, six phases can be identified asfollows (the number in brackets corresponds to sample number):
1. Uprush wave (0). The AMS was impossible to measure at thebase of the deposits due to the material heterogeneity. We
Frontiers in Earth Science | www.frontiersin.org 6 July 2015 | Volume 3 | Article 40
Wassmer et al. AMS and paleo-current reconstruction
FIGURE 5 | Cumulative grain size curves for 4220 BP and 2002 tsunamis deposits.
FIGURE 6 | Passega CM diagram.
assume however, from field evidence that the first wave washeading for North with an energy strong enough to bringnumerous marine bioclasts and coarse sands, to break trees,and align the debris with a roughNorth-South orientation andto remove rip-up clasts of palaeosoil 1.
method: rolling/tilting) no evidence of tilting (3)4. Second uprush stage, to the NNE first (4) and then due N (5).
5. Backwash stage to the South (6).6. Third uprush stage to the NNE (7), to the NE (8 and 9) and to
the NNE (10).
If one considers the 24 cm thick soil developed from thepaleo-tsunami deposit (paleo-soil 2), the sedimentary sequenceemplaced by the 4220 BP event increases in thickness up to65–70 cm. The clay loam texture of the upper part of thepaleo-soil corresponds to the last slack and backwash stages,
Frontiers in Earth Science | www.frontiersin.org 7 July 2015 | Volume 3 | Article 40
Wassmer et al. AMS and paleo-current reconstruction
FIGURE 7 | Equal angle, lower hemisphere projection of the Kmax for
each layer investigated: 1-10 from bottom to top of the paleo-tsunami
deposit, 11 and 12 for the 2004 IOT tsunami deposit.
when the high concentration of fines in suspension resultingof the high turbulence of the water begins to settle in alaminar dominated flow. This fine material has been subjectto paedogenesis processes. Bioturbation has erased the originalfabric making useless an AMS approach.
Reconstructing Other Characteristics of
Emplacement Processes from AMSBesides the flow direction that constitutes the major contributionof AMS, additional parameters, calculated from the intensities ofaxes of the anisotropy ellipsoid, or from their logarithmic values,allow us to precise some characteristics of the emplacementprocess (Figure 4: T, Fs) The shape parameter (T) quantifies therelative role of lineation and foliation, i.e., indicates a depositionunder the domination of settling or traction. The 4220 BPsediments have been emplaced mainly under a settling process(foliation dominant) with the exception of samples 7 and 8 wherelineation dominates.
The alignment parameter (Fs), related to the intensity ofthe Kmax, is supposed to increases with the energy of thebottom currents (de Menocal, 1986; Park et al., 2000). It canbe a sensitive recorder of paleo-velocity variations (Ellwood andLedbetter, 1977) as for the 4220 BP tsunami (Figure 4). Duringthe backwash stage a slight velocity increase (1) to (2) can benoted before a velocity drop (3). The uprush is rather low (4)and (5) while the following backwash is characterized by a highervelocity. The second uprush phase, first corresponds to a ratherweak flow (7) and (8) before an acceleration of the flow (9)and (10).
The angle of imbrications being larger for a turbulent flowover a rough bottom (coarse grain size) than for a turbulentflow over a smooth bottom (small grain size; Rusnak, 1957), theplunge value (Figure 4) is considered to be related to the velocityof the flow and to the density of the particles in the bottomtraction carpet. The 4220 BP deposit displays strong tilting valuesranging from 12◦ to 67◦ with the exception of three weaker
values. This is consistent with a grain inertia regime at the base ofthe water column (Hamilton et al., 1968) and with the medium tocoarse grain size of the material.
The 2004 IOT deposit is thinner than the 4220 BP deposit. Thesedimentary characteristics of its base reveal the domination oftraction under high velocity current during deposition. Withinthe upper part of the deposit foliation dominates reflecting avelocity drop accompanied by an important settling under astable current.
Discussion
Reconstruction of Water Behavior CombiningSedimentology and AMSIf we take into account the data provided by sedimentology andAMS, it is possible to reconstruct hydrodynamic conditions thatprevailed during this paleo high-energy flooding on the coastalplain of Lampuuk (Figure 4).
This 4220 BP event was composed of:
a) A first northward oriented uprush; the strong flow is onlyattested by the abundance, composition and orientation of thedebris laying on the paleo-soil 1;
b) A backwash flow oriented southward (1) with low velocitycurrents, followed by an increasing velocity of bottomcurrents with settling processes (2). Water accelerationin the proximal domain has been reported frequently byeyewitnesses at the end of the backwash stage of the 2004event.
c) A weak flow to the southeast with an equilibrium betweensettling and traction corresponding to the end of thebackwash stage (3);
d) A drastic increasing of sediment settling during a rather lowvelocity uprush phase [(4) and (5)];
e) Bottom currents increasing during this backwash phase (6)dominated by settling;
f) Last uprush phase recorded: first traction dominates [(7) and(8)] with a rather weak current then settling increases strongly[(9) and (10)] under conditions of strong bottom current.This part of the deposit may come from the contributionof different pulsations, the variations in Kmax azimuths thusreflecting wave refraction or diffraction along the bay.
Comparison with the 2004 TsunamiThe homogeneity of the 4220 BP deposit reflected by Figure 6
can be explained by two elements of local context:
1. A unique source for the sediments: by analogy with the 2004event, the 15 m-height sand dunes may have been shaved tothe ground by the two first waves, the moderately sorted sandstock being spread on the wide flat coastal plain. The grainsize distribution of sand collected on a remnant part of a duneeroded during the 2004 event, and cleared out of bioclasts(constituting around 50% of the material), almost perfectlysuperimposes to the grain size distribution of sedimentsemplaced by the 2004 tsunami (lacking of any bioclast in thisarea in reason of an efficient winnowing action of the turbulentwaves). Moreover, the sand morphoscopy analysis from the
Frontiers in Earth Science | www.frontiersin.org 8 July 2015 | Volume 3 | Article 40
Wassmer et al. AMS and paleo-current reconstruction
remnant parts of the dunes and the deposits of 2004 confirmthat the sands are similar to the 4220 BP paleo-deposits.Therefore, the source of the paleo-deposit had likely similarcharacteristics than the 2004 event, i.e., the material mainlycame from coastal sand dunes. This finding is consistent:(i) with the sedimentary records of the 2004 tsunami thatwere composed of moderately sorted sands with a mean grainsize around 700–800µm and very coarse skewed provided at88–100% by sand from the dunes eroded on the sea front(Wassmer et al., 2007), and (ii)with the 2004 oral testimony ofa New Zealander eyewitness who describes a huge yellowish-colored “geyser” of water and sand, higher than the dunes row,produced by the two first waves impacting and eroding thedunes (ibidem).
2. The energy of the surging waves in the investigated zone:on the eastern coast of Banda Aceh, Wassmer et al. (2010)showed that the energy of the flooding decreased landward,producing a progressive differentiation in the sedimentarysignature. Near shore, in the proximal zone, the deposits arecoarse and undifferentiated. In the distal zone, far inland, nearthe slack zone or “point of zero velocity prior to backwashflow” according to Dawson and Stewart (2007), fining upwardsequences are superimposed and correspond to the record ofindividual successive waves. Lampuuk’s palaeo tsunami sitewas located within the proximal zone, on the very flat coastalplain.
Huge Storm or Tsunami?If the wood debris and the bioclasts abundance at the base ofthe sequence could be linked to a high-energy event, such as acatastrophic storm or a tsunami, the presence of large pieces ofbroken tree trunks and the clay rip-up clasts (Figure 8) strictlypoint toward a tsunami origin. The distance to the sea also callsfor a tsunami hypothesis: 1.65 km at present day, this distancewas probably slightly longer for thousands years ago, in reasonof a local subsidence mentioned by Meltzner et al. (2006, 2010).Kawata et al. (2005) showed a co-seismic subsidence of 20 to60 cm in Banda Aceh for the 2004 IOT, while Dura et al. (2011)state that the coastal lowlands of western Sumatra preserve anevidence of two Holocene ruptures (4200 and 3100 BP) of theMentawai segment of the Sunda mega-thrust and that theseruptures resulted in a co-seismic subsidence of the coastline. Thedistance from the sea was therefore more important 4220 yearsBP at Lampuuk, rendering the site out of reach of the storminfluence.
Additionally, the 2004 tsunami deposited coarser sands thanthe 4220 BP tsunami, suggesting a possible higher energytsunami. This is also attested by the erosive basal contact withthe soil and the presence of numerous rip-up clasts of soilwithin the sequence (Figures 4, 8). One of the characteristicsof tsunami deposits is the landward fining grain size of thesediments (Kortekaas and Dawson, 2007; Morton et al., 2007;Paris et al., 2007; Jankaew et al., 2008). If the 2004 and4220 BP tsunamis emplaced at the same site material ofdifferent grain size in all likelihood from the same sea-frontdunes (450–500µm for the 4220 BP event and 700–800µmfor 2004 IOT), source, then it is reasonable to consider that
when the 4220 BP tsunami took place the seashore was moredistant.
In summary, in giving access to the flow direction thatprevailed during sediment emplacement, the application ofAMS technique to unconsolidated sandy material related topaleo-tsunamis drastically increases our knowledge about thecharacteristics of such events.
The 2004 tsunami flooding orientation map was realized post-event in the same area of Lampuuk on the base of thousandsmeasurements we performed on the orientation of elongatedmaterial laying on the ground as tree trunks, poles, fence posts(Figure 9). This map, which mainly reflects the behavior of thelast energetic wave of the 2004 tsunami, shows a good correlationwith the last recorded energetic waves of the paleo-tsunami (8, 9,and 10). The orientation of the 2004 first waves recorded (11 and12) is well conforms to the orientation of the 4220 BP first waves(0, 4, and 5). In 2004 the first wave was followed by a recedingand then, the following waves pushed inland without recedingbetween them. At the end a strong backwash occurred. AMSdata performed on the paleo-deposit show that the first wave (0)was followed by a backwash oriented first to the South (1) thento the southeast (2). This latter direction was also reported in2004 by eyewitness that described the whirling movement of thewater along the foot of the western slopes of the bay, guided bythe amphitheater-like topography of the foothills (Figure 1), andthe following receding toward southeast. The second receding(6) that is found for the paleo-event is likely due to a contrarybottom current oriented southeast initiated by the same whirlingmovement described in 2004 resulting from the strong impact ofthe second wave (34m in this zone in 2004; Lavigne et al., 2009).The deposit emplaced by these two “apparent” backwash stagesare then more related to impeded surging waves, producing astrong contrary seaward current, than actual backwash stages.This explanation is consistent with the homogeneity of thegrain size and the positive skewness that otherwise would havebeen modified by a real backwash bringing a mixture of sandy
Frontiers in Earth Science | www.frontiersin.org 9 July 2015 | Volume 3 | Article 40
Wassmer et al. AMS and paleo-current reconstruction
FIGURE 9 | 2004 IOT flooding directions evidenced from the orientation
of elongated material laying on the ground after the event as tree
trunks, poles, fence posts (from Grancher et al., 2011).
and terrigenous material. Such behavior is, in this context, sitedependant.
AMS Interpretation of the Flow DirectionAs presented above (section AMS) the flow direction is retrievedfrom the overall sediment fabric but previous research (Rusnak,1957; Allen, 1964; Rees, 1968) show that depending on theflow velocity, the grains long axes will be parallel or normal tothe flow direction prevailing during emplacement. In fact thegeneral orientation of the long axis of the particles dependson the flow strength. For relatively strong currents (usuallyturbulent), the rolling and sliding of the prolate particles leadto their long-axis perpendicular to the flow direction, whereas aflow-parallel orientation dominates for weaker currents (laminarflow). Determination of the bulk orientation of the long axis ofmagnetic prolate particles (Kmax) through AMS measurementsleads to similar conclusions (Hamilton and Rees, 1970; Hrouda,1982; Tarling and Hrouda, 1993). Consequently, the orientationof Kmax is parallel to the direction of weak or laminar flow,whereas it is normal for stronger currents (Granar, 1958). Thismay render the flow directions evidenced by Kmax hard tointerpret.
For the present study, informations from the Kmax weresufficiently clear (regarding the topographical context and the
flooding behavior of the 2004 tsunami on the same area) toextract orientation data. In order to avoid misinterpretations inconsidering the flow direction as parallel to the long axis Kmax
of the susceptibility ellipsoid, several authors have shown thatthe pole of the magnetic foliation (Kmin) points out the flowdirection regardless of the depositional process, shingling, orrolling (Palmer et al., 1996; Ort et al., 2003; Giordano et al., 2008;Laberge et al., 2009; Willcock et al., 2014).
However, the method has several limitations, and resultscan’t be yield from deposits modified by bioturbation andpaedogenesis. The sediment records of high energy eventslike tsunamis along sea shore are prone to a more or lessquick vegetation recovery, depending on the climate and theenvironmental conditions. This lead to a progressive lossof information, with soil construction, about the depositcharacteristics for the upper part of the sequence deposited. Thisloss affected 20% of the original deposit thickness for the 4220 BPevent, but we measured a loss of 14% from a 30 cm thick depositin Kajhu area 5 years only after the 2004 IOT tsunami due to anactive paedogenesis under tropical conditions).
Conclusions
The present contribution has demonstrated that the AMStechnique applied to unconsolidated sediments can provideimportant proxies for paleo-events reconstructions, for whichsedimentary signatures are preserved. In the present study,a 4220 BP tsunami deposit was clearly identified and itscharacteristics confirmed it to be a significant predecessorcomparable to the 2004 Boxing Day tsunami. The AMSresults helped the reconstruction of the flooding characteristics(orientation, energy, uprush flow patterns) and most especiallythe identification of at least three distinctive uprush pulsationsduring the paleo-event. AMS technique has contributed to showthat the 4220 BP and the 2004 events behaved very similarlyover the coastal plain of Lampuuk. The similarity here is mostprobably linked to the topographical context of the bay thatcontrolled the uprush flow directions. Consequently, retrievedpaleo-flow patterns from AMS also provided keys to unveilpast-topographic features that would have disappeared.
Acknowledgments
Field work has been carried out in the frame of the Tsunariskprogramme (coordinators: FL and R. Paris), funded by theFrench “Délégation Interministérielle pour l’Aide Post-tsunami”(DIPT). The authors are in debt to the reviewers who providedconstructive comments, especially to Jean-Luc Bouchez andHervé Regnauld, who conducted a very meticulous reading of themanuscript and contributes to significantly improve the originalmanuscript. We would like to express our gratitude to the editorfor his prompt handling. The research has also been supportedby Martine Trautmann, who helped with the sediment grain-sizeanalysis.
Frontiers in Earth Science | www.frontiersin.org 10 July 2015 | Volume 3 | Article 40