Contribution of Brackish and Freshwater Aquaculture to Livelihood of Small-Scale Rural Aquaculture Farmers in Kedah, Malaysia
Roslina, K.Department of Economics and Agribusiness, College of Business, Universiti Utara Malaysia, 06010 Sintok Kedah, Malaysia
ABSTRACT
This case study examines the livelihood of small-scale fish farmers in the state of Kedah, Malaysia, with emphasis on their asset possession, livelihood strategies performed and livelihood outcomes achieved. The relationship between these livelihood elements was also analyzed in order to identify the triggering factors contributing to their sustainable livelihood. Data were obtained through systematic socio economic survey of 216 small-scale freshwater and brackish-water pond fish farmers using stratified random sampling. The Structural Equation Modelling method was applied to analyze the relationship between the three elements of the fish farmers’ livelihood. The results show that there are significant differences between freshwater and brackish-water systems, particularly in terms of profitability and contribution to the livelihood of farmers due to their involvement level in the activity. Human and financial assets are important components in the livelihood of small-scale fish farmers based on their positive influence on the level of Good Aquaculture Practices, species cultured, total household income and social impact variables. Thus, measures related to the enhancement of farmer’s knowledge and their financial status should be emphasized in order to improve the livelihood of small-scale fish farmers in Malaysia.
Keywords: Livelihood, Malaysia, rural aquaculture, small-scale fish farmer
INTRODUCTION
Aquaculture in Malaysia was produced nationwide with three principal objectives namely, to enhance the country’s food security; to increase income and export earnings; and to maximise the income of the producers and to alleviate poverty. In the year 2013, the fisheries sub-sector
contributed 14.4% to the agriculture GDP, which ranked the third among the important sub-sectors in agriculture after oil palm (36.5%) and food crops (18.2%) (Department of Statistics, 2013). The total fisheries production in terms of value was RM11.47 billion in 2013, of which aquaculture accounted for 26.5% (DoF, 2013). Aquaculture had registered an annual average growth rate of 10.6% compared to the marine capture fisheries of only 4.7% per year over the 60 years (1950 to 2012). In fact, among the food commodities sector, aquaculture is the fastest growing sub-sector as the sector expanded at an average annual rate of 19.50% over the previous five years (2008-2012) (Department of Statistics, 2012). It also contributed to employment opportunities and income for the population, with 52,260 persons directly involved in aquaculture, as fish farmers accounted for about 28% of the total fisheries workforce in 2012.
Aquaculture farmers in Malaysia are those who are engaged in aquaculture activity either on part-time or full-time basis who had registered with the Department of Fisheries (DoF, 2013). They are classified into three groups based on farm size i.e. small-scale farmers with pond size less than 2 ha, semi-commercial scale farmers with pond size between 2 and 10 ha and commercial scale with farm size more than 10 ha. Aquacultural activity in Malaysia is mostly dominated by small-scale aquaculture (SSA) farmers, who account for about 70% of total aquaculture farmers. In general, SSA is the farming of aquatic organisms
by small-scale households using mainly extensive and semi-intensive husbandry (Edwards & Demaine, 1997), with low input used and low output produced and little or no routine management but employing a large percentage of labour, which is usually provided by household members (FAO, 1996; Siar & Sajise, 2009). Depending on access to resources and seasonality, small-scale aquaculture may be carried out on part-time or full-time basis and integrated with other activities such as crop and livestock farming (Siar & Sajise, 2009), providing a supplement to incomes, a source of extra food and a diversification strategy.
This study was conducted in the state of Kedah, Malaysia. Kedah is situated in the north-western part of Peninsular Malaysia and covers an area of 9427km2, with a population of 1.89 mil (Department of Statistics Malaysia, 2013). Kedah is divided into 12 districts, and all of them widely practise aquaculture. Known as the rice bowl of Malaysia, Kedah is also one of the most important places for aquaculture development in the country, especially after 2007. In 2007, development policy in Malaysia was divided into six economic regions namely, the Northern Corridor Economic Region (NCER), the East Coast Economic Region (ECER), Iskandar Malaysia in Southern Johor (IRDA), the Sabah Development Corridor (SDC), the Sarawak Corridor of Renewable Energy (SCORE) and the Labuan International Business and Financial Centre (Labuan IBFC). The idea of development by corridor was conceived with the objective
Livelihoods of Small-scale Rural Aquaculture Farmers
of maximizing the economic potential of the areas and closing the development and income gap between the different regions in Malaysia (EPU, 2014). Kedah, together with other states in the north of Peninsular Malaysia such as Penang, Perlis and north Perak, were placed under the NCER. With huge agricultural land endowment, the NCER was set to transform the region into a modern food zone for Malaysia, helping the country to increase its efficiency in food production. The NCER blueprint has classified 40% or 932,581 ha in the northern region (4.9% in Penang, 6.6% in Perlis, 27.8% in Perak and 60.7% in Kedah), for agricultural use (NCIA, 2009). Among the main agricultural sub-sectors that have been given serious attention under this development policy are paddy, livestock and aquaculture.
Considering that the main economic activity of Kedah is agriculture and it is among the poorer states of Malaysia, the government has promoted aquaculture as a side economic activity for low-income farmers as a way to increase their household income. Most low-income households receive assistance in terms of cash or pond facilities to start their aquaculture project. Training and monitoring are also provided to increase their technical knowledge and skill in operating their aquaculture project. Now, Kedah’s aquaculture sub-sector is one of the most successful development programmes in the NCER region, yielding an average annual growth rate of up to 36% for the period 1997 to 2013 (DoF, 2007-2013). In 2013, Kedah produced 9,860 tons of fish,
which came mainly from freshwater (49%) and brackish-water (30%) pond systems, while the remaining 21% came from freshwater and brackish-water cages, cement tanks and cockles, with the involvement of 966 aquaculture farmers (DoF, 2013). The pond system is a very popular system adopted by the farmers; about 95% of freshwater aquaculture farmers and 60% of brackish-water aquaculture farmers were involved in pond system farming in 2010, according to the Department of Fisheries Kedah/Perlis.
The aggregate statistics of production presented above implies the achievement of the first and second objectives of aquaculture development in Malaysia, but do not necessarily reflect the achievement of the third goal i.e. to improve the livelihood of farm families by increasing their household income. Furthermore in Malaysia, data and research regarding the socio-economic status and livelihood of fish farmers are limited, making it difficult to prove that aquaculture development has succeeded in improving the livelihood of farm families in rural areas. Studies on the economics of aquaculture production have been conducted by Linuma, Sharma and Leung (1999); Chua and Teng (1980), but there is no discussion related to fish farmers’ livelihood. A great majority of aquaculture development research in Malaysia has concentrated on fish health and disease (Budiati et al., 2013; Harikrishnan et al., 2010; Harikrishnan et al., 2011; Ransangan et al., 2011; Subasinghe & Shariff, 1992), fish genetics (Khaw et al., 2012; Rahim et al., 2012) aquaculture
technology (Retnam et al., 2013; Lananan et al., 2014; Yap & Ong, 1988) and safety of aquacultural food products (Mok et al., 2012).
Lack of information on the status and the potential contribution of aquaculture to the livelihood of farmers might be a major constraint in formulating an effective policy. Baseline and scoping studies are required to determine the contribution of small-scale aquaculture to rural livelihood and to identify priorities for further action, particularly for the freshwater and brackish-water pond systems, as these are the popular systems adopted by most small-scale farmers. Key questions emerging from this scenario are: Depending on the aquaculture system practiced, what are the contributions of aquaculture to farmers’ household income? Can aquaculture increase farmers’ household income? What are the available livelihood assets possessed by farmers? What are the appropriate livelihood strategies pursued by farmers to increase their household income? What is the influence of this set of livelihood assets and strategies on the livelihood outcomes of farmers? This article sought to describe the contribution of aquaculture to the livelihood of fish farmers in terms of their income distribution by economic activities, livelihood strategies pursued and livelihood asset possession. The relationship of these elements were also analyzed in order to identify the main factors influencing fish farmers’ livelihood. Understanding the livelihood of aquaculture farmers is essential as it aids policy-makers
in monitoring and evaluating the success of the aquaculture development projects being implemented.
METHODS
A systematic survey was designed to quantify household livelihood assets (human, physical, natural, social, financial) and to characterise associated livelihood strategies and outcomes. The analytical analysis was then conducted to analyse the relationship between those three elements of livelihood. Most of the Sustainable Livelihood Framework by Carney (1998); Scoones (1998), and Ellis (2000) comprises other components of livelihood such as vulnerability and institution aspects. However, this study focussed on the three elements of livelihood that fell within the individual’s control. Structural Equation Modelling (SEM) applied in this study required a set of data answered by individual in the sampled group of respondents that had the same criteria. However, the vulnerability and institutional aspects were beyond the individual’s control to answer and must come from other sources. SEM is a technique to specify, estimate and evaluate models of linear relationships among a set of observed variables in terms of a generally smaller number of unobserved variables. SEM models consist of observed variables (also called manifest or measured) and unobserved variables (also called underlying or latent) that can be independent (exogenous) or dependent (endogenous) in nature (Reisenger & Turner, 1999; Shah &
Livelihoods of Small-scale Rural Aquaculture Farmers
Goldstein, 2006). In the primary form of analysis, SEM carries out factor analysis and multiple regressions analysis simultaneously (Hair, Anderson, Tatham, & Black, 2006).
In this study, the samples were drawn through application of stratified random sampling strategy. The unit analysis for this study was the aquaculture farmer. Aquaculture farmers in this study referred to those who were engaged in aquaculture activity either on part- or full-time basis and who had registered with the Department of Fisheries. Based on the list of aquaculture farmers provided by the Department of Fisheries, the total number of aquaculture farmers for the pond system in Kedah was 854 i.e. 700 from the freshwater pond system and 154 from brackish-water pond system. The sample were then stratified by district. There are eight districts in the mainland of the state of Kedah (Kubang Pasu, Padang Terap, Kota Setar, Pendang, Sik, Baling, Kuala Muda and Bandar Bharu/Kulim). However, for the brackish-water pond system, only three districts were involved (Kubang Pasu, Kota Setar and Kuala Muda), as pond brackish-water farmers were scattered around these areas. The researcher then selected a random sample from each district for the freshwater and brackish-water pond systems. Thus, the sampling procedure consisted of one random sample of freshwater pond farmers in eight districts and one random sample of brackish-water pond farmers in three districts. Finally, an equal ratio of farmers was selected through random sampling to give a total sample size of 216 (171
freshwater farmers and 45 brackish-water farmers) for investigation, representing almost 30% of the total population.
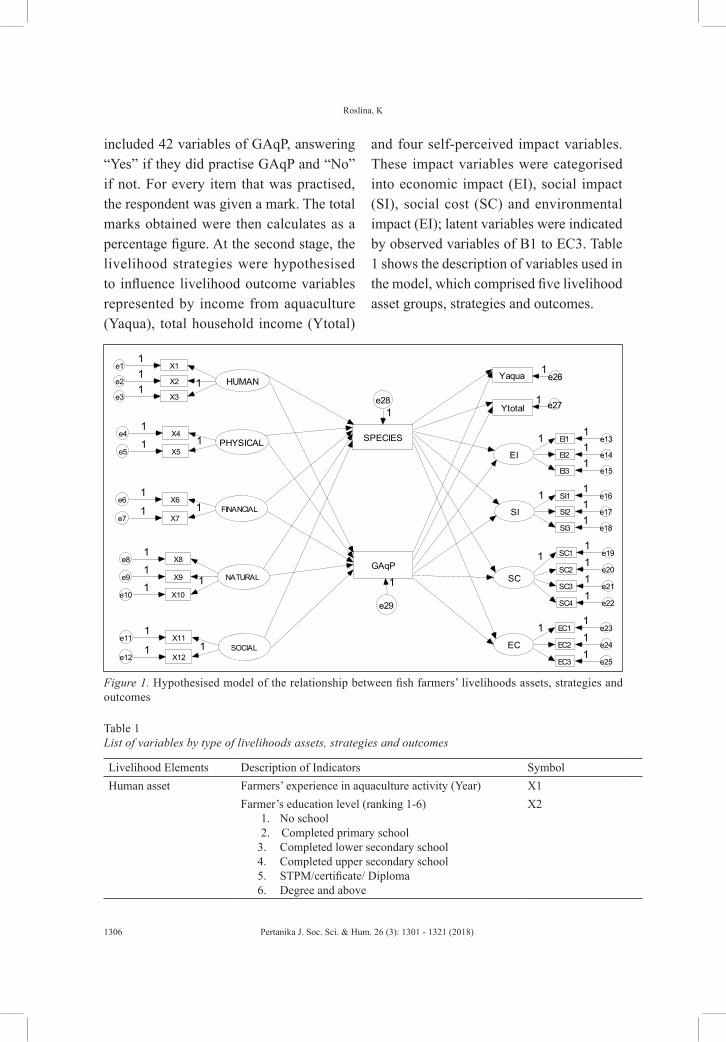
A set of structured questionnaires was developed that consisted of information on various livelihood assets, strategies and outcomes. A face-to-face interview with 216 aquaculture farmers was conducted from October to December 2011. The Structural Equation Modelling (SEM) method was used to analyse the relationship between livelihood asset, strategies and outcomes by using the AMOS version 8 software published by SPSS Inc. The hypothesised model is shown in Figure 1, which assumes that all asset categories namely, human assets, financial assets, physical assest, social assets and natural assets would influence the livelihood strategies that were represented by observed variables of level of Good Aquaculture Practices (GaqP) and the selection of species being cultured (SPECIES) variables in a positive way. All livelihood asset variables were latent variables that were indicated by observed variables of X1 to X12, as shown in Figure 1.
G o o d A q u a c u l t u r e P r a c t i c e s refers to aquaculture practices that are environmentally friendly to produce safe and high-quality products and are consistent and competitive based on the criteria, guidelines and standards set by the Department of Fisheries and on international standards (DoF, 2004). In order to collect data on the level of GAqP, the respondents were asked whether they practised every item listed in the questionnaire, which
included 42 variables of GAqP, answering “Yes” if they did practise GAqP and “No” if not. For every item that was practised, the respondent was given a mark. The total marks obtained were then calculates as a percentage figure. At the second stage, the livelihood strategies were hypothesised to influence livelihood outcome variables represented by income from aquaculture (Yaqua), total household income (Ytotal)
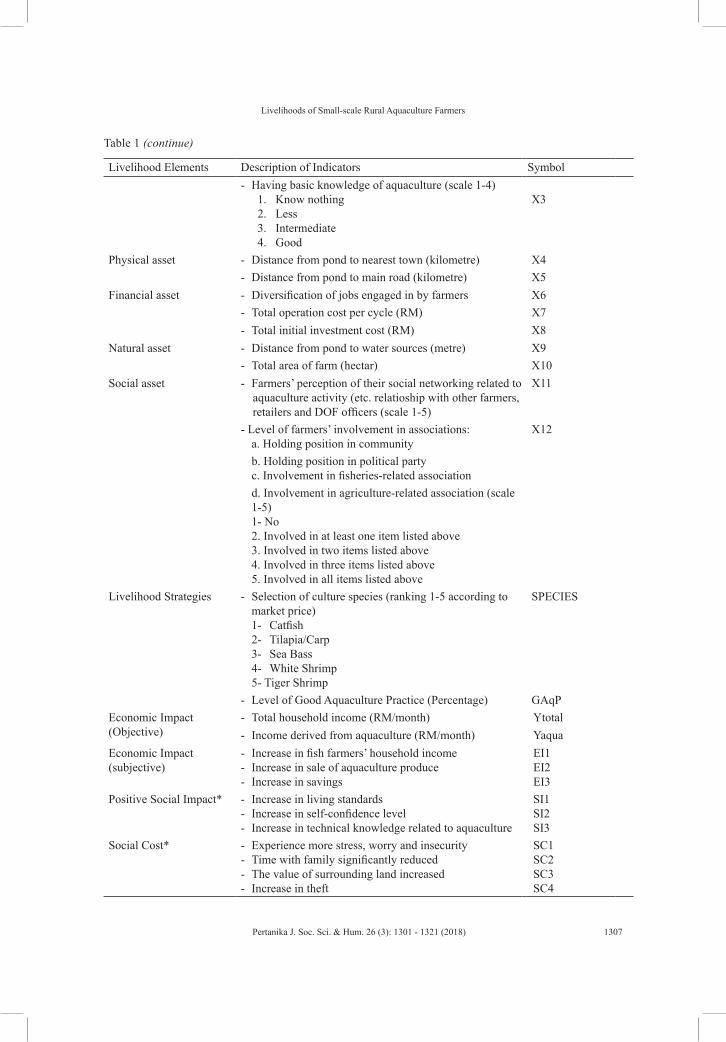
and four self-perceived impact variables. These impact variables were categorised into economic impact (EI), social impact (SI), social cost (SC) and environmental impact (EI); latent variables were indicated by observed variables of B1 to EC3. Table 1 shows the description of variables used in the model, which comprised five livelihood asset groups, strategies and outcomes.
Figure 1. Hypothesised model of the relationship between fish farmers’ livelihoods assets, strategies and outcomes
HUMAN
PHYSICAL
FINANCIAL
NATURAL
SOCIAL
SC
EC
SPECIES
GAqP
Yaqua
YtotalX3e3
11X2e2
1X1e1
1
X5e511
X4e41
X7e711
X6e61
X10e10
11X9e9
1X8e8
1
X12e1211
X11e111
SC1 e1911
SC2 e201
SC3 e211
SC4 e221
EC1 e2311
EC2 e241
EC3 e251
SI
EI
EI1 e131 1
EI2 e141
EI3 e151
SI1 e161 1
SI2 e171
SI3 e181
e281
e29
e26
e27
1
1
1
Table 1List of variables by type of livelihoods assets, strategies and outcomes
Livelihood Elements Description of Indicators Symbol Human asset Farmers’ experience in aquaculture activity (Year) X1
Farmer’s education level (ranking 1-6)1. No school2. Completed primary school
Livelihood Elements Description of Indicators Symbol - Having basic knowledge of aquaculture (scale 1-4)
1. Know nothing 2. Less3. Intermediate4. Good
X3
Physical asset - Distance from pond to nearest town (kilometre) X4- Distance from pond to main road (kilometre) X5
Financial asset - Diversification of jobs engaged in by farmers X6- Total operation cost per cycle (RM) X7- Total initial investment cost (RM) X8
Natural asset - Distance from pond to water sources (metre) X9- Total area of farm (hectar) X10
Social asset - Farmers’ perception of their social networking related to aquaculture activity (etc. relatioship with other farmers, retailers and DOF officers (scale 1-5)
X11
- Level of farmers’ involvement in associations:a. Holding position in community
X12
b. Holding position in political party c. Involvement in fisheries-related associationd. Involvement in agriculture-related association (scale 1-5)1- No2. Involved in at least one item listed above3. Involved in two items listed above4. Involved in three items listed above 5. Involved in all items listed above
Livelihood Strategies - Selection of culture species (ranking 1-5 according to market price)1- Catfish 2- Tilapia/Carp 3- Sea Bass4- White Shrimp5- Tiger Shrimp
SPECIES
- Level of Good Aquaculture Practice (Percentage) GAqPEconomic Impact (Objective)
- Total household income (RM/month) Ytotal- Income derived from aquaculture (RM/month) Yaqua
Economic Impact (subjective)
- Increase in fish farmers’ household income- Increase in sale of aquaculture produce - Increase in savings
EI1EI2EI3
Positive Social Impact* - Increase in living standards - Increase in self-confidence level- Increase in technical knowledge related to aquaculture
SI1SI2SI3
Social Cost* - Experience more stress, worry and insecurity - Time with family significantly reduced- The value of surrounding land increased- Increase in theft
Livelihood Elements Description of Indicators Symbol Environmental Cost* - Aquacultural activity has been polluting the
environment- Damage to road near aquaculture site is getting worse- Aquaculture has resulted in noise and smell pollution
in community
EC1EC2EC3
Note: * indicates variables based on farmers’ perception using a Likert scale of 1-5 (1 = Strongly Disagree, 2 = Disagree, 3 = Neither Agree nor Disagree, 4 = Agree, 5 = Strongly Agree)
RESULTS
Description of Livelihood Outcomes, Strategies and Asset Possession
The contribution of aquaculture to livelihood outcomes is quite different between the brackish-water and freshwater pond systems. On average, the total household income for brackish-water fish farmers was higher at RM4, 208 per month compared with that of freshwater fish farmers, who only obtained RM1, 735 per month. The majority (77.8%) of the brackish-water fish farmers had a total monthly income of more than RM2, 000, while most freshwater fish farmers (62.7%) had a total monthly income of less than RM1,500. The contribution of aquaculture to total household income was quite high for brackish-water fish farmers i.e. about 40 to 88% of their total income, but only 17 to 47% for freshwater fish farmers.
The farmers’ involvement status in aquaculture probably contributed to the differences in the contribution of aquaculture to the livelihood of farmers. Most of the brackish-water fish farmers (87%) had made aquacultural activity their main occupation. On the other hand, aquaculture was not a major economic activity for most freshwater fish farmers. However, it was among the
best options as a secondary economic activity to increase household income and provide a free source of protein for family members. Their main economic activity was agriculture-based such as rubber tapping and paddy farming. The combination of aquacultural and agricultural activities was a popular livelihood option, and 62% of freshwater fish farmers had chosen this combination. As for the brackish-water system, 47% of the farmers were involved in other economic activities as a supplement to their involvement in aquacultural activities; were either involved in other agricultural activities (27%) or non-agricultural activities (18%); or were involved in a combination of these three activities (2%).
Economic activity is more diverse for freshwater fish farmers compared with brackish-water fish farmers’ about 90% of freshwater fish farmers are involved in at least two economic activities to earn an income. This fact can be related to the type of species cultured in both systems. The popular species cultured by freshwater fish farmers in this study area was catfish and tilapia while tiger shrimp and white shrimp were the main species for the brackish-water environment. The biological differences
Livelihoods of Small-scale Rural Aquaculture Farmers
between these species require different care, time and pond management from the farmers. The brackish-water species is more sensitive and risky, requiring more attention from the operator. Cost and return pattern as
shown in Table 2 are also among the factors why most brackish-water farmers involve in aquaculture on full-time or part-time basis have to diversify their livelihood strategies.
Table 2Structure of cost and return for small-scale aquaculture in state of Kedah, Malaysia
The difference in type of species cultured, inputs used and size of pond contributes to the differences in the cost of production and profit earned by fish farmers. In terms of production, white shrimp farmers obtain the highest production of about 7.4 tons/ha, generating an average net profit per cycle of RM56,703/hectare with an average production cost incurred
of RM26,638/hectare/cycle. Furthermore, it was a first attempt for most white shrimp farmers, who had originally farmed black tiger shrimp before making the switch after an outbreak of Early Mortality Syndrome (EMS) hit most black tiger shrimp farms in Malaysia. EMS typically affects shrimp during the first seven to 40 days after culturing. Thus, to prevent greater losses,
most farmers harvested their shrimp before they had reached marketable size and sold it at the low price of RM12 to RM15 per kg at the average size of about 0.016 g per shrimp, generating a net profit of RM22,664/cycle/ha, which was two times lower than usual. For freshwater aquaculture, tilapia farming is the most profitable compared to catfish and polyculture of carps, generating a net profit of RM3,312/cycle/ha. This shows that there is an immense difference in terms of cost and return structure for freshwater and brackish-water species. This is why most freshwater aquaculture farmers become involved in aquaculture as a secondary activity on top of other agricultural activities.
In fact, the cost and return structure in aquaculture also depends on the level of pond management, while pond management is influenced by the status of the farmer’s involvement in aquaculture. Pond management is an important aspect in determining the sustainability of an aquaculture project. The Code of Good Aquaculture Practices (GAqP) was introduced by the Department of Fisheries to provide a practical guide for fish farmers about the key aspects of fish farm management to ensure the production of good quality and safe products that can be marketed widely and at the same time not harm the environment (DoF, 2004). Farm management aspects outlined in the GaqP include the preparation of the pond; the management of seed, water, feed, fish health and waste; harvesting and post-harvest handling; and data recording (DoF, 2004).
The results revealed that the management of pond by brackish-water fish farmers was better than that by freshwater fish farmers, whereas 77% of brackish-water fish farmers adopted the GAqP at a level of 60% and above compared with only 20% of freshwater fish farmers. The low level of GAqP practice among freshwater famers, especially for catfish, was due to the usage of low quality and unhygienic feed and mismanagement of water quality. Although freshwater species such as catfish and tilapia are quite hardy, hardiness is not an advantage for freshwater operators as they are still required to take care of the environmental aspects of the aquacultural project. On the other hand, as for brackish-water pond farmers, the biological aspect of brackish-water species such as tiger prawn, white shrimp and sea bass require great care in terms of seeding rate, nutrition and the environment. Hence, both systems have to comply with the GAqP to ensure a high survival rate and to produce the best quality products.
Due to the high risk of brackish-water aquaculture, high investment and operating costs and technical knowledge are required, implying that the farmer’s livelihood assets for this system are better than those of the freshwater system farmer. The results showed that most brackish-water farmers are younger, educated and experienced, as shown in Table 3. The majority (35.56%) of brackish-water farmers in the sample were aged between 40 and 49 years compared with freshwater fish farmers, who were mostly 50 to 59 years old. In terms of
Livelihoods of Small-scale Rural Aquaculture Farmers
education, the majority of brackish-water farmers (62%) had attained at least a PMR/SRP/LCE certificate at lower secondary school level, while 62% of freshwater fish farmers were made up of those with primary school qualification and lower (never been to school). As for experience, 75% of the brackish-water fish farmers had experience of more than five years and about 63% of freshwater fish farmers had less than five years’ experience. In fact, 35% of the brackish-water fish farmers had more than 10 years’ experience. The results also showed that only 23.60% of freshwater fish farmers and 40% of brackish-water fish farmers had attended aquaculture courses that were mostly organized by the Department of Fisheries.
As for financial assets, the majority (71%) of the fish farmers used their own financial resources and were more likely to
borrow money from relatives and friends. Due to the high investment costs, about 18% of brackish-water fish farmers were financed by commercial banks and certain agencies. In addition, 11% of the fish farmers received assistance from government agencies to start their project under certain schemes such as the ‘Integrated Agriculture Development Project’ (IADP) in the 1980s and the AZAM project in 2000s monitored by the Department of Fisheries. The percentage of freshwater fish farmers who used their own financial resources was higher than that of the brackish-water fish farmers due to the cost of investment that was far lower than for brackish-water aquaculture that ranged between RM3,000 and RM10,000 depending on the size of the pond.
Water and land resources are the two important natural assets of fish farmers. Usually, aquaculture ponds are located near
Table 3Percentage of famers according to the status of Human Asset Indicators
Items Freshwater (N=171) Brackish-
Water (N=45)
No (%) No (%)Age of Fish Farmer29 years old and below 4 2.5 3 6.730-39 14 8 10 22.240-49 46 26.7 16 35.650-59 64 37.3 11 24.460 years old and above 44 25.5 5 11.1Education Achievement Never been to school 21 12.4 5 11.1Primary school 84 49.1 4 8.9Lower Secondary school (PMR/SRP/LCE) 44 25.5 16 35.6Upper secondary school (SPM/SPMV/MCE) 17 9.9 12 26.7STPM/Diploma/Skill Certificate 2 1.2 6 13.3Degree/Master/PhD 3 1.9 2 4.4
a river or the sea. The average distance from the aquaculture pond to the water resource in this study was 0.1 miles for freshwater and 0.21 miles for brackish-water aquaculture. With regard to land tenancy, the majority (94.4%) of freshwater fish farmers owned their land, with the average farm size being 0.48 ha. However, different scenarios were true among the brackish-water aquaculture farmers, with only 28.9% of the fish farmers owning their land. The remaining 60% rented their land from others and 11.1% who were renting government reserve land had been granted temporary ownership. The average brackish-water farm size was 1.21 ha.
In terms of social assets, indicators such as holding an important position in society and political parties and involvement in associations related to aquaculture or other agricultural activities among the variables were considered in this study. Only 33.33% of brackish-water fish farmers
and 28.57% of freshwater fish farmers held important positions in political parties. In fact, the results also showed that nearly 70% of freshwater fish farmers and 88% of brackish-water fish farmers did not engage in agriculture-related associations.
Physical assets include infrastructure such as roads, fences, storage, gates and retention ponds. Overall, the fish farming equipment of brackish-water farmers was more complete than that of freshwater farmers. This was due to activities such as tiger and white shrimp farming that are more complicated compared with freshwater species farming such as catfish and tilapia farming. In addition, the distance of the aquaculture pond from major infrastructure such as the main road, wet market and relevant institutions or agencies responsible for aquaculture development might also contribute to the expanding in aquaculture production.
Table 3Percentage of famers according to the status of Human Asset Indicators
Items Freshwater (N=171) Brackish-
Water (N=45)
No (%) No (%)Experience in Aquaculture Less than 5 years 107 62.7 11 24.4Between 6 and10 years 24 14.3 18 40Between 11 and 15 years 15 8.7 8 17.8Between 16 and 20 years 9 5 6 13.320 years and above 16 9.3 2 4.4Attending Aquaculture Training/CourseYes 40 23.6 18 40No 131 76.4 27 60
Source: Analysed from survey data
Livelihoods of Small-scale Rural Aquaculture Farmers
The Structural Equation Modelling analysis showed only human, financial and physical assets were significant influences on GaqP with a probability value less than 0.05, shown in Table 4. The positive sign for the standardized coefficient value of human and financial assets means increasing human assets (indicated by education level and experience in aquaculture farming) and financial assets (indicated by investment and operating costs) will increase the level of GAqP. However, the negative sign for the standardized coefficient value of physical assets (indicated by distance of pond to
main road and town) suggests that remote aquaculture ponds i.e. those far from main roads and towns have fewer GAqP and vice versa. Natural and social assets do not significantly affect GaqP. In fact, indicators that represented social assets were removed from the model due to a multicollinearity problem with a coefficient value more than one. This is why the social asset variable was not included in Table 4. For livelihood strategy of species cultured (SPECIES), only financial assets were significant influences showing a positive sign, meaning that the greater the number of financial assets possessed by farmers, the higher the value of the species to be cultured.
Table 4Influence of livelihood assets on livelihood strategies
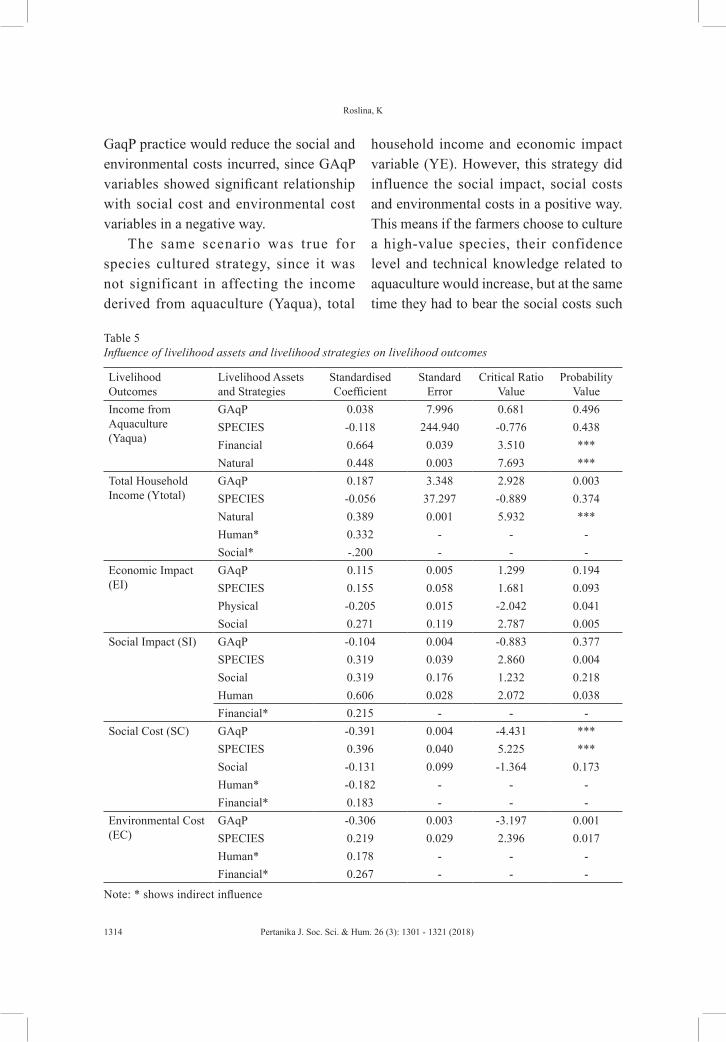
As for livelihood outcomes, there were variations in the influence of livelihood assets and the variables of livelihood strategies. This is highlighted in Table 5, which shows that most of the asset groups had a significant influence on livelihood outcome variables either through direct or indirect relationship, while the livelihood strategies showed a weak influence on most
of the livelihood outcome variables. For example, the level of Good Aquaculture Practice (GAqP) was not significant in influencing Yaqua, YE and YS, but it was significant in influencing the Ytotal. However, the coefficient value equal to 0.187 indicated a weak relationship between these two variables. On the other hand, the results suggested that increasing the level of
GaqP practice would reduce the social and environmental costs incurred, since GAqP variables showed significant relationship with social cost and environmental cost variables in a negative way.
The same scenario was true for species cultured strategy, since it was not significant in affecting the income derived from aquaculture (Yaqua), total
household income and economic impact variable (YE). However, this strategy did influence the social impact, social costs and environmental costs in a positive way. This means if the farmers choose to culture a high-value species, their confidence level and technical knowledge related to aquaculture would increase, but at the same time they had to bear the social costs such
Table 5Influence of livelihood assets and livelihood strategies on livelihood outcomes
as stress, worry and anxiety if something adverse happened to their aquaculture activity. The culture of high-value species such as tiger shrimp and white shrimp is a high-risk activity that needs intensive care. The analysis also found that the higher the value of the species being cultured the greater the impact on the environment. This was due to the high value of the species such as tiger shrimp and white shrimp, which require a variety of inputs, particularly fertilisers and antibiotics compared with low-value species like catfish and tilapia.
As for livelihood assets, the results showed that the financial assets and natural assets significantly affected the farmers’ income derived from aquaculture activity (Yakua) directly with a positive relationship,
meaning an increase in both assets would increase income from aquaculture activities. As for total household income, natural assets appeared as a very significant component in influencing household income, with a coefficient value of 0.389, followed by human assets (0.332) and social assets (-0.200). Human assets and financial assets significantly influenced the social impact (SI) and environmental cost (EC) variables, while physical assets and social assets significantly influenced the economic impact variables indicated by an increase in aquaculture sales, household income and savings. The summary of the relationships between the three components is presented in Figure 2.
Figure 2. Final model of the relationship between fish farmers’ livelihood assets, strategies and outcomes
This study showed there were significant differences between freshwater and brackish-water systems, particularly in terms of profitability and contribution to the livelihood of farmers. The freshwater system was an alternative side economic activity for the rural population for improving their household income by utilising available land, while the brackish-water system is seen as a career option in modern agriculture. Most brackish-water farmers are younger at 40 to 49 years old and are educated and experienced. This is quite consistent with the study done by Ifejika, Ayanda and Sule (2007), which reported that about 60% of Nigerian fish farmers were 41 to 50 years old. In Asia, according to Dey et al. (2008), the average age of fish farmers is 43 to 52 years.
However, most freshwater farmers are quite old, ranging in age from 50 to 59 years old and have less experience and limited knowledge about aquaculture. Most of them are involved in aquacultural activity and are receiving assistance from the government either in terms of capital, input and farm equipment. To retain this group in the sector, encouragement to attend training in aquaculture should be emphasised to increase their interest, knowledge and skills. Regular visits by fisheries officers are also important for monitoring their progress. On the other hand, the production and profitability of the freshwater aquaculture system can be enhanced by intensification and modernisation. The young generation should be encouraged to be involved in
this sub-sector, since age has significant implication on the modernisation of the sector. The youth are fast learners, energetic and innovative compared with older groups, who tend also to be slow to accept change, being more comfortable with the traditional way of conducting activities (Malaysian Institute Economic Research [MIER], 1999); however, to ensure the efficiency, productivity and competitiveness of the sector, the use of modern technology is a must. Experience in aquaculture activity is crucial and it contributes to the success of Asian aquaculture (Sevilleja, 2000; Dey et al., 2008; Edwards, 2000). In fact, farmers’ experience in aquaculture can reduce management risk (Krause, 1995). Fish farmers can enhance their aquaculture knowledge by attending courses or training related to aquaculture organised by various agencies.
The good profit generated by the brackish-water system can attract the involvement of educated youths in this sector. Farm renting could be an alternative means for promoting and attracting youths to fish farming (Ifejika et al., 2007) since land is the main obstacle preventing youths from getting involved in agricultural activity. This study has proven that most brackish-water farmers earn a high profit although they are renting their farms. Tenancy status does not limit the output produced, but rather, motivates the producer to achieve a maximum benefit (Sevilleja, 2000).
The significant influence of livelihood asset components on livelihood strategies and livelihood outcome variables has
Livelihoods of Small-scale Rural Aquaculture Farmers
shown that it is an important element in fish farmers’ livelihood. Based on the strong relationship between most of the livelihood strategies and outcomes variables, it would be wise to enhance the related human and financial assets in order to improve the living standard of fish farmers. The results showed that human assets had a positive influence on the level of GaqP, total household income, social impact and social cost, implying that measures relating to the enhancement of farmers’ knowledge should be emphasised. Educated and experienced fish farmers will consider practising GaqP in order to produce high quality products that can be sold at a high price and obtain a higher profit. However, the result showed only 23.60% and 40% of freshwater and brackish-water fish farmers, respectively, attended courses on aquaculture. Only by attending such an aquaculture course, can fish farmers be well-exposed to GaqP. Information dissemination about aquaculture courses should be expanded either through electronic media or print media since these are the most convenient media that are accessible to everyone. This is to ensure that all information about aquaculture training and courses can reach everyone, especially new entrepreneurs. In addition, teaching modules should be concise and use simple language that is easily understood by farmers. Aquaculture training also should be provided to extension officials in order to ensure that they have sufficient and adequate knowledge and skills to train the farmers.
Financial assets are the most important factor affecting the level of GaqP practised and selection of species being cultured. Investment and operating cost are high, especially for the brackish-water system, and most farmers use their own financial resources or are likely to borrow from relatives rather than financial institutions due to the difficulty they face in acquiring credit. Credit institutions should review the conditions and procedures of credit or loan schemes by taking into account the importance of small-scale farmers in aquaculture development. Furthermore, in Malaysia almost 70% of farmers are in the small- and medium-scale category (DOF, 2016). Most of them cannot apply for a bank loan due to the lack of assets or resources to be used as collateral. Therefore, credit institutions should provide credit or loan schemes with simpler procedures that specially cater for small-scale farmers by considering their unique profile.
The insignificant result for the influence of social assets on livelihood strategies might be due to the use of indicators (as listed in Table 1) that are not too relevant to this study as most of the farmers used their private resources. These indicators might have been more relevant if aquaculture were more reliant on common-property resources. As for natural assets, it is supposed to be an important influence on livelihood strategies. However, the results showed there was no correlation between natural assets and GAqP or the species cultured. As brackish water is required for producing high-value shrimp, water salinity should be used as one of the indicators.
The Code of Good Aquaculture Practices (GaqP) is used to measure pond management by farmers. Many international bodies such as the Food and Agriculture Organization (FAO) recognise that Good Aquaculture Practices or Best Management Practices play an important part in the sustainable development of aquaculture for both large-scale and small-scale producers (FAO, 2006). The results show that the level of GaqP among freshwater farmers is lower compared with among brackish-water farmers due to biological differences of species cultured and lack of knowledge and information related to the practice. Furthermore, shrimp aquaculture in brackish-water ponds is a high risk activity particularly for intensive production and it requires better standards for compliance with export standards.
Nevertheless, the SEM analysis found no significant influence of GAqP on income derived from aquaculture, implying that the practice of GAqP had no impact on profit. This means that farmers who do not comply with GAqP will also earn a higher income. In fact, most small-scale farmers in Malaysia supply their produce to domestic markets, where private standards are prevalent; currently, there is no labelling or a special price system that could encourage farmers to practise GaqP. It is likely that only large fish and shrimp farms producing export products will adopt GaqP so as to comply with the product quality requirement for export market.
Thus, the introduction of a labelling and pricing system that can differentiate GaqP
produce from non-GaqP produce probably might give an opportunity for consumers to choose a high-quality product produced by the GaqP system. Benefits of GaqP produce must be disseminated to the community to raise awareness about the consumption of high-quality and safe fish. The government can do its part by detailing a description of GaqP that covers the practice, the benefits gained when employers adopt it and possible effects if farmers are not compliant should be extended to all farmers. Then enforcement of GaqP could be implemented by imposing fines or penalties on farmers who refuse to practise it.
CONCLUSION
Most freshwater fish farmers (62%) were not involved full-time in aquaculture; instead, their main economic activity was rice farming, rubber tapping and working in government and private service. On the other hand, for most brackish-water fish farmers (87%), aquaculture is their main economic activity. These percentages also could imply the profitability of both systems; brackish-water aquaculture of shrimp in particular is more profitable compared with freshwater farming of catfish and tilapia. However, based on the farmers’ perception analysis, most fish farmers, either freshwater or brackish-water farmers, recognized that aquaculture activities have succeeded in increasing their income. This means that despite the fact that the profits generated by freshwater aquaculture were low, the farmers still felt that the income from aquaculture had succeeded in raising
Livelihoods of Small-scale Rural Aquaculture Farmers
their total household income together with other sources of income.
However, in order to ensure the sustainability of rural fish farmers’ livelihood, measures related to human and financial assets must be given priority since these two factors are the most significant factors determining the livelihood strategies and livelihood outcomes variables. Besides their livelihood, the quality and safety of aquaculture produce also need to be considered by fish farmers as their social responsibility. GaqP is one of the measures for sustainable farm management that could produce safe aquaculture products. Therefore, compliance with the level of GAqP should be further enhanced by all fish farmers.
Fish farmers and fisheries officers must work in cooperation to ensure that fish produced are safe for domestic and foreign consumption. Consumer awareness of the importance of GAqP for producing high quality and safe food should be increased. To date, there is no specific research into consumer awareness of fish consumption. Hence, further research into consumer awareness of fish consumption with regard to GAqP produce should be undertaken. Fish farmers, the Department of Fisheries and consumers should share responsibility for the production of the best quality and safe farmed fish to ensure the sustainability of aquaculture development and hence, the sustainability of small-scale fish farmers’ livelihood.
ACKNOWLEDGEMENT
The author would like to acknowledge University Utara Malaysia for awarding me with the University Grant Scheme (S/O:12043) and RIMC UUM for their administrative helps to carry out this research project. Acknowledge also goes to respondents for providing valuable information and data. We are very grateful to the officer from Fisheries Department in the state of Kedah for their kind cooperation during data collection process of this study.
REFERENCESBudiati, T., Rusul, G., Wan-Abdullah, W. N., Mat
Arip, Y., Ahmad, R., & Thong, K. L. (2013). Prevalence, antibiotic resistance and plasmid profiling of Salmonella in catfish (Clarias gariepinus) and tilapia (Tilapia mossambica) obtained from wet markets and ponds in Malaysia. Aquaculture, 372, 127–132.
Carney, D. (1998). Implementing the sustainable rural livelihoods approach. In D. Carney (Ed.), Sustainable rural livelihoods, what contribution can we make, (p. 3–23). London: DFID.
Chua, T. E., & Teng, S. K. (1980). Economic production of estuary grouper, Epinephelus salmoides Maxwell, reared in floating net cages. Aquaculture, 20(3), 187–228.
Dey, M. M., Briones, R. M., Garcia, Y. T., Nissapa, A., Rodriguez, U. P., Taluker, R. K., … & Paraguas, F. J. (2008). Strategies and options for increasing and sustaining fisheries and aquaculture production to benefit poorer households in Asia. WorldFish Center Studies and Reviews No. 1823. The WorldFish Centre, Penang, Malaysia.
Department of Fisheries (DoF). (2004). Malaysian aquaculture farm certification scheme (SPLAM). Kuala Lumpur: Department of Fisheries Malaysia.
Department of Fisheries Kedah/Perlis. (2010). List of aquaculture farmer in the state of Kedah/Perlis. 2010, Mac (in Malay). Kuala Lumpur: Department of Fisheries Malaysia.
Department of Fisheries (DoF). (2007-2016). Annual fisheries statistics 2007-2016. Kuala Lumpur: Ministry of Agriculture and Agro-Based Industry Malaysia.
Department of Statistics. (2012). Selected agricultural indicators 2012. Kuala Lumpur: Department of Statistics Malaysia.
Department of Statistics. (2013). Selected agricultural indicators 2013. Kuala Lumpur: Department of Statistics Malaysia.
Edwards, P. (2000). Aquaculture, poverty impacts and livelihoods. ODI Natural Resource Perspective No. 56. London: ODI.
Edwards, P., & Demaine, H. (1997). Rural aquaculture: Overview & framework for country reviews. RAP Publication no. 1997/36. Bangkok: RAP/FAO.
Ellis, F. (2000). The determinants of rural livelihood diversification in developing countries. Journal of Agricultural Economics, 51(2), 289–302.
EPU (Economic Planning Unit). (2014). Regional corridor development in Malaysia. Kuala Lumpur : Malays ian Pr ime Minis te r ’s Department. Retrieved May 6, 2016, from http://www.carecprogram.org/uploads/events/2014/CAREC-IMT-Workshop-KL/Presentation-Materials%20/009_134_209_Regional-Corridor-Development-in-Malaysia.pdf
Food and Agriculture Organization. (1996). Report of the expert consultation on small scale rural aquaculture. Retrieved May 8, 2016, from http://www.fao.org/docrep/x5821e/x5821e06.htm#TopOfPage
Hair, J. H., Anderson, R. E., Tatham, R. L., & Black, W. C. (2006). Multivariate data analysis (2nd
ed.). New Jersey: Prentice-Hall.
Harikrishnan, R., Balasundaram, C., & Heo, M. S. (2010). Molecular studies, disease status and prophylactic measures in grouper aquaculture: Economic importance, diseases and immunology. Aquaculture, 309(1-4), 1–14.
Harikrishnan, R., Balasundaram, C., & Heo, M. S. (2011). Fish health aspects in grouper aquaculture. Aquaculture, 320(1-2), 1–21.
Ifejika, P. I., Ayanda, J. O., & Sule, A. M. (2007). Socio-economic variables affecting aquaculture production practices in Borgu local government area of Niger state Nigeria. Journal of Agriculture and Social Research, 7(2), 20–28.
Khaw, H. L., Ponzoni, R. W., & Hamzah, A., Abu-Bakar, K. R., & Bijma, P. (2012). Genotype by production environment interaction in the GIFT strain of Nile tilapia (Oreochromis niloticus). Aquaculture, 326–329, 53–60.
Krause, M. (1995). Practical framing: Rural poverty planning risks management. Australia: Reed International Books.
Lananan, F., Abdul-Hamid, S. H., Din, W. N. S., Ali, N., Khatoon, H., Jusoh, A., & Endut, A. (2014). Symbiotic bioremediation of aquaculture wastewater in reducing ammonia and phosphorus utilizing effective microorganism (EM-1) and microalgae (Chlorella sp.). International Biodeterioration & Biodegradation, 95, 127–134.
Linuma, M., Sharma, K. R., & Leung, P. S. (1999). Technical efficiency of carp pond culture in Peninsular Malaysia: An application of stochastic production frontier and technical inefficiency model. Aquaculture, 175(3-4), 199–213.
Livelihoods of Small-scale Rural Aquaculture Farmers
Malaysian Institute Economic Research. (1999). Interim report on fisheries development study in Malaysia submitted to the economic planning unit. Kuala Lumpur: Prime Minister’s Department.
Mok, W. J., Senoo, S., Itoh, T., Tsukamasa, Y., Kawasaki, K. I., & Ando, M. (2012). Assessment of concentrations of toxic elements in aquaculture food products in Malaysia. Food Chemistry, 133(4), 1326–1332.
Northern Corridor Implementation Authority (NCIA). (2009). Northern corridor economic region – Koridor utara. Retrieved May 8, 2016, from http://www.koridorutara.com.my/download/download/Koridor%20Utara%20Brochure.pdf
Rahim, M. H. A, Ismail, P., Alias, R., Muhammad, N., & Jais, A. M. M. (2012). PCR-RFLP analysis of mitochondrial DNA cytochrome b gene among haruan (Channa striatus) in Malaysia. Gene, 494(1), 1–10.
Ransangan, J., Manin, B. O., Abdullah, A., Roli, Z., & Sharudin, E. F. (2011). Betanodavirus infection in golden pompano, Trachinotus blochii, fingerlings cultured in deep-sea cage culture facility in Langkawi, Malaysia. Aquaculture, 315(3-4), 327–334.
Reisinger, Y., & Turner, L. (1999). Structural equation modeling with Lisrel: Application in tourism. Tourism Management, 20(1), 71–88.
Retnam, A., Zakaria, M. P., Juahir, H., Aris, A. Z., Abdul-Zali, M., & Kasim, M. F. (2013). Chemometric techniques in distribution,
characterisation and source apportionment of polycyclic aromatic hydrocarbons (PAHS) in aquaculture sediments in Malaysia. Marine Pollution Bulletin, 69(1-2), 55–66.
Scoones, I. (1998). Sustainable rural livelihoods: A framework for analysis. IDS working paper 72. Brighton: IDS.
Sevilleja, R. O. (2000). Adoption and economics of tilapia farming technology in the Philippines. Retrieved May 8, 2016, from state.edu/dept/IIFET/2000/papers/ Sevilleja.
Shah, R., & Goldstein, S. M. (2006). Use of structural equation modeling in operations management research: Looking back and forward. Journal of Operations Management, 24(2), 148–169.
Siar, S. V., & Sajise, P. E. (2009). Access rights for sustainable small-scale aquaculture and rural development. In M. G. Bondad-Reantaso, & Prein, M. (Eds.), Measuring the contribution of small-scale aquaculture: An assessment (p.87–94). Rome: Fisheries and Aquaculture Department (FAO).
Subasinghe, R. P., & Shariff, M. (1992). Multiple bacteriosis, with special reference to spoilage bacterium Shewanella putrefaciens, in cage-cultured barramundi perch in Malaysia. Journal of Aquatic Animal Health, 4(4), 309–311.
Yap, S. Y., & Ong, H. T. (1988). Formulation of aquaculture development at an ox-bow lake in Malaysia. I. Technical Evaluations of Site Suitability. Aquacultural Engineering, 7(4), 245–264.