Contribution of CD8� T Cells to Control of Mycobacteriumtuberculosis Infection1
Dhruv Sud,*‡ Carolyn Bigbee,† JoAnne L. Flynn,† and Denise E. Kirschner2*‡
Tuberculosis is the number one cause of death due to infectious disease in the world today. Understanding the dynamics of theimmune response is crucial to elaborating differences between individuals who contain infection vs those who suffer active disease.Key cells in an adaptive immune response to intracellular pathogens include CD8� T cells. Once stimulated, these cells providea number of different effector functions, each aimed at clearing or containing the pathogen. To explore the role of CD8� T cellsin an integrative way, we synthesize both published and unpublished data to build and test a mathematical model of the immuneresponse to Mycobacterium tuberculosis in the lung. The model is then used to perform a series of simulations mimicking exper-imental situations. Selective deletion of CD8� T cell subsets suggests a differential contribution for CD8� T cell effectors that arecytotoxic as compared with those that produce IFN-�. We also determined the minimum levels of effector memory cells of eachT cell subset (CD4� and CD8�) in providing effective protection following vaccination. The Journal of Immunology, 2006, 176:4296–4314.
T uberculosis (TB)3 is one of the most pervasive diseasestoday, with over one-third of the world population in-fected with Mycobacterium tuberculosis (Mtb) and 2 mil-
lion deaths every year. The unique nature of Mtb pathogenesisresults in only 5–10% of infected persons developing active tu-berculosis within 1–5 years postinfection (1), whereas the remain-der experience latent infection, which is generally accepted as astate of equilibrium between bacteria and host. Depending on thenature and extent of the host response to infection, there may betissue damage, fluid accumulation in the lungs, and even death (2).Thus, it is of great interest to identify mechanisms that not onlydetermine differences in infection outcome but also those that aremost influential in controlling host damage.
A cell-mediated immune response is essential for control of Mtbinfection. Mtb infection initiates in the lungs, where resident mac-rophages take up bacteria. Mtb can effectively evade killing pro-cesses in resting macrophages, thus avoiding elimination (3).Clearance of bacteria by macrophages is in part dependent onmacrophage activation by the cytokine IFN-� secreted byCD4� T cells, CD8� T cells, and NK cells (4, 5). Infectedmacrophages secrete other proinflammatory cytokines such asTNF and IL-12 as well as chemokines that recruit immune cellsto the site of infection (2).
Several hypotheses have been proposed to explain different out-comes of infection (i.e., active tuberculosis vs latent infection), inpart based on studies of isolated components of the host responseto Mtb infection in animal models. In particular, many studiesfocus on genetic knockout (KO) studies and/or depletion experi-ments (6–12). Although such methods contribute significantly toour understanding of TB, it can be difficult to analyze the breadthof the entire immune response in such models, particularly whenthe KO mouse succumbs quickly to TB. In addition, there arelimitations to animal models, including differences between certainmolecules in humans and mice, difficulty in modeling latent infec-tion, and the possibility of KO mutations affecting other pathways.
To offer another approach, our group previously developedmathematical models that track major elements of the cell-medi-ated immune response to Mtb infection (13–15). The first modelaccounts for the dynamics of six cell populations, including mac-rophages (resting, infected, and activated subpopulations) andCD4� T cells (Th0, Th1 and Th2 effector subpopulations), fourcytokines (IFN-�, IL-12, IL-10, and IL-4), and two bacterial sub-populations (intracellular and extracellular mycobacteria) (15).Key regulatory mechanisms involving pathology and protectionwere identified, and the importance of a fine-tuned balance in im-munity-regulating control of infection and tissue damage was dis-cussed. The second model additionally considered the role of den-dritic cells and the relevance of their trafficking between lung andlymph node in priming the immune response (13).
CD8� T cells and TNF are believed to participate in the immuneresponse to Mtb infection in humans (6, 7, 16–21). The role ofCD8� T cells in immunity against Mtb infection has been contro-versial. However, there are data supporting a role for these cells inprotection against TB (9, 22–24). It has been demonstrated repeat-edly that mycobacteria-specific CD8� T cells are induced in re-sponse to Mtb infection and that these cells can recognize Mtb-infected macrophages (22, 25). Cytotoxic activity of CD8� T cellsincludes at least two separate mechanisms: apoptosis via the Fas-FasL pathway and killing via perforin and granulysin (26). In hu-mans, CD8� T cells can kill intracellular mycobacteria via therelease of the antimicrobial peptide granulysin (27); however, thismolecule is not present in the mouse. The fact that no mouse an-alog of granulysin exists may in part explain why CD8� T cells are
*Department of Biomedical Engineering, College of Engineering, University ofMichigan, Ann Arbor, MI 48109; †Department of Molecular Genetics and Biochem-istry, University of Pittsburgh School of Medicine, Pittsburgh, PA 15261; and ‡De-partment of Microbiology and Immunology, University of Michigan Medical School,Ann Arbor, MI 48109
Received for publication September 12, 2005. Accepted for publication December2, 2005.
The costs of publication of this article were defrayed in part by the payment of pagecharges. This article must therefore be hereby marked advertisement in accordancewith 18 U.S.C. Section 1734 solely to indicate this fact.1 This work was supported by National Institutes of Health Grants ROI HL62119 andROI HL68526 (to D.E.K.) and AI37859 (to J.L.F.) and by a grant from the EllisonMedical Foundation (to J.L.F.).2 Address correspondence and reprint requests to Dr. Denise E. Kirschner, Depart-ment of Microbiology and Immunology, 6730 Medical Sciences Building II, Univer-sity of Michigan, Ann Arbor, MI 48109-0620. E-mail address: [email protected] Abbreviations used in this paper: TB, tuberculosis; KO, knockout; Mtb, Mycobac-terium tuberculosis.
not as important in the control of infection in mouse models of TB(12). The cytotoxic potential of CD8� T cells to kill infected cells(CTL activity) in vivo has been shown to be dependent on CD4�
T cells in the mouse model, suggesting that the susceptibility ofCD4� T cell KO mice to Mtb infection might be due in part toimpaired CTL activity (10).
Mtb-specific CD8� T cells are also involved in cytokine pro-duction, particularly that of IFN-� and TNF (28, 29). Mechanismsthat regulate relative cytokine or cytolytic activity of CD8� T cellsduring Mtb infection are not yet known. Recent data from ourlaboratory indicate that there are different effector functions ofCD8� T cells depending on the stage of Mtb infection (30). Inaddition, data from viral systems as well as our own data supportthe idea that cells that produce perforin do not usually produceIFN-� (30, 31). Finally, Ag load can influence the cytotoxic vscytokine-producing phenotypes (31, 32).
In a previous study (15) we had included the effects of TNF andCD8� T cells in an indirect (nonmechanistic) fashion. The objec-tive of this work is to explicitly examine the effects of these twoadditional elements. We include both CD8� T cells and TNF, butprimarily focus our analysis on the role of CD8� T cell dynamics.Other work analyzes the role of TNF in more detail (S. Marino, D.Sud, J. Chan, J. L. Flynn, and D. E. Kirschner, manuscript inpreparation). We derive four additional equations describing therate of change for each of these cell populations (including a pre-cursor, T80 cells) and TNF. We add or modify terms in the exist-ing model (15) to account for CD8� T cell interactions.
We apply our updated model to simulate different infection out-comes (clearance, latent infection, and active tuberculosis) andvalidate cell numbers, bacterial numbers, and cytokine levels withexperimental data. To further corroborate the model and test therole of CD8� T cells, we perform virtual deletion studies mim-icking gene KOs or depletion studies mimicking neutralizationstudies where a component can be eliminated for part of the in-fection or at specific time points. In addition, we examine the im-portance of each CD8� T cell subset in control of infection, whichis difficult to approach in an animal model. These results add to ourunderstanding of TB and are not obtainable via standard experi-mental protocols. Based on these studies, we explore the role ofboth CD4� and CD8� T cells in a number of vaccination schemes.
In each of these situations, a mathematical modeling approach isadvantageous to simulate a multitude of possible scenarios and togenerate hypotheses that can then be tested in an experimental orclinical setting.
Materials and MethodsRole of CD8� T cells
The dynamics of recruitment, turnover, and effector and cytokine-produc-ing functions of CD8� T cells are illustrated in Fig. 1A. We define T8 asthe class of effector CD8� T cells that produce IFN-� but do not exhibitcytotoxic activity, and TC is defined as those cells that have CTL activitybut do not produce IFN-�. CD8� T cells are recruited in the majority asT80 cells (although a small percentage are recruited directly as T8 or TCcells). T80 cells undergo differentiation into T8s and TC cells. Althoughstudies directly assessing cytotoxic capacity and IFN-� production in thesame cells are relatively rare, studies have indicated that perforin expres-sion or cytotoxic function can coexist with IFN-� expression (30–32). Weallow for possible overlap of function via a parameter, m, which definesthis percentage. The main roles of each of the subclasses are shown in Fig.1A. The full equations with a complete explanation of the terms and howthey are incorporated into the model are shown in the Appendix.
The action of TNF
For the purpose of focusing specifically on the CD8� T cell response in thiswork, we only describe how we included TNF action in our updated modeland present the results of TNF dynamics elsewhere (S. Marino, D. Sud, J.Chan, J. L. Flynn, and D. E. Kirschner, manuscript in preparation). Our
previously published model of Mtb infection (15) simulated cell recruit-ment as a function of activated and infected macrophages, the main che-mokine and TNF producers. We now include an equation representing thedynamics of TNF in the system (see Fig. 1B and Appendix). We include aTNF-dependent recruitment term for both macrophages and T cells (33).We maintain the previous terms that account for additional recruitment dueto chemokines not dependent on TNF (33) (Equations 1 and 4–9 in Ap-pendix). We also include the effect of TNF on macrophage activation,which was previously accounted for indirectly (Equations 1 and 3 in Ap-pendix). Lastly, we add an extra term into both the infected macrophageand the bacterial equations to account for the appropriate gain/loss esti-mates (Equations 2, 15, and 16 in Appendix).
Effects of IL-10 on TNF production
To examine the effect of IL-10 on TNF production, in vitro experimentswith wild-type and IL-10-deficient macrophages were performed. Bonemarrow macrophages (2.5 � 106 per well) were infected with Mtb strainErdman (multiplicity of infection of 2), and TNF expression was deter-mined at 2, 4, 8, and 24 h postinfection. Expression was measured byreal-time RT-PCR for mRNA levels and by WEHI assay for TNF activity(Fig. 2). There was no difference in TNF mRNA expression or in proteinproduction (ELISA data not shown) or activity between wild-type and
FIGURE 1. CD8� T cell and TNF dynamics. A, Schematic showingCD8� T cell dynamics and activities. CD8� T cells are recruited by bothTNF-dependent and independent pathways. They are killed by the apopto-tic action of IFN-� and also undergo natural death (based on their half-life;both apoptosis and natural death are indicated by the skull and cross-bonessymbols in the cartoon). T80 cells can differentiate into TC or T8. Weallow this to occur at the site of infection because we model only the lungsand not the corresponding lymph nodes. T8 and TC can both be recruitedas well. Depending on the activity of CD8� T cells, they may be classifiedas having effector CTL and apoptosis-inducing functions (TC cells) or acytokine-secreting (TNF, IFN-�, or IL-10 production) function (T8 cells).B, Schematic showing TNF dynamics and activities. TNF is produced bymacrophages (infected and activated) as well as T cells (TH1, T8, and TC).TNF has a known half-life. Functions for TNF include macrophage and Tcell recruitment, macrophage activation (along with IFN-� and bacterialsignal), and induction of apoptosis in infected macrophages.
4297The Journal of Immunology
IL-10�/� macrophages. Addition of exogenous IL-10 (10 ng/ml) to thewild-type macrophages at the time of infection also had no effect on TNFexpression or production. Thus, we have not included an effect of IL-10 onTNF production in our mathematical model.
RNA isolation for TNF/IL-10 studies
RNA was isolated from the cells using the TRIzol isolation protocol withmodifications. The cells were lysed in TRIzol reagent (1 ml of TRIzol per2 � 106 cells), and then two chloroform extractions were performed. Afteran isopropanol precipitation, the RNA was washed with 70% ethanol andtreated with RNase inhibitor (Applied Biosystems) for 45 min. After treat-ment at 65°C for 15 min (to fully resuspend the RNA), the RNA wascleaned, and DNA was removed with DNase using the Qiagen RNA iso-lation kit as directed by the manufacturer.
Real-time RT-PCR for TNF expression
RNA was reverse transcribed using the SuperScript II enzyme as directedby the manufacturer (Invitrogen Life Technologies). For real-time RT-PCRwe used the relative gene expression method (34). Hypoxanthine phospho-ribosyltransferase served as the normalizer, and macrophages served as thecalibrator. Each primer and probe set was tested for efficiency (results were�97% efficiency for all primer/probe sets) as previously described (33).All samples were run in triplicate and with no reverse transcriptase controlson an ABI PRISM Sequence Detector 7700. Relative gene expression wascalculated as 2(�cycle threshold (Ct)), where Ct � Ct (gene of interest) �Ct (normalizer) and Ct � Ct (sample) � Ct (calibrator). Results are ex-pressed as relative gene expression to uninfected samples. The primer andprobe concentrations were used as suggested by Applied Biosystems, withthe final concentration of each primer at 400 nM and that of probe at250 nM.
WEHI assay for TNF activity
In this assay, TNF induces death of WEHI cells in a dose-dependent man-ner (35, 36). Using this assay, the active TNF in a culture can be estimated.At indicated time points following Mtb infection, supernatants were re-moved and the filter was sterilized and frozen at �80°C. For the TNFactivity assay, WEHI 164 subclone 13 (American Type Culture Collection)cells were placed in 96-well plates (1 � 105 cells/well in 200 �l) andgrown overnight at 37°C. Medium was removed, and 100 �l of fresh me-dium was added to each well. Then 100-�l samples, TNF standards, andcontrols were added. Samples were run in triplicate and incubated over-night at 37°C. The 100-�l medium was removed from the wells, and 50 �gof MTT was added. Following a 4-h incubation at 37°C, medium wasremoved from the wells, and 100 �l of 0.04 N HCl/isopropanol was added.OD570 was read after 20 min, and TNF activity in samples was estimatedby comparison with the standard curve generated using recombinant mu-rine TNF. These controls were run concurrently for each assay.
The CD8� T cell model
Based on our description above, we derived four nonlinear ordinary dif-ferential equations to describe the dynamics of three CD8� T cell sub-populations (T80, T8, and TC) and TNF (see Appendix). Using similarmass action and kinetic law techniques as described (15), the interactions
of these variables with other cells and cytokines were incorporated into theprevious model equations (see Appendix and Ref. 15). Parameter values forinteractions are estimated as described in the Parameter Estimation sectionof the Appendix and in Table III.
IFN-� dependent apoptosis of T cells
Recent studies suggest a host homeostatic mechanism whereby activatedmacrophages in the presence of IFN-� induce apoptosis of T cells to pre-vent excessive IFN-� production and further activation (37–39). The needfor IFN-� as well as activated macrophages for inducing T cell apoptosisseems redundant, but experimental data indicate that the effect of IFN-� isindirect (likely via activated macrophages), although exact mechanisms areyet to be elucidated (38). We have now included IFN-�-induced apoptosisof T cells in the model.
Computer simulations
Our model is designed to represent the temporal immune response occur-ring dynamically in total lung. After deriving the model, we solve thenonlinear ordinary differential equation system to obtain temporal dynam-ics for each element of the model. For this purpose we use C code imple-menting the Runga-Kutta adaptive step-size solvers and appropriate finitedifference methods. Finally, we validate our model output wherever pos-sible with published experimental data.
As a marker of disease progression, we consider bacterial load as themost informative based on results from animal models (see a completediscussion of this in Refs. 13–15). We observe two stable states with themodel: latent infection (controlled and low bacterial numbers) and activetuberculosis (uncontrolled bacterial growth). Reactivation is consequentlydefined as the transition from latency to active disease. Because latency isa stable state, it logically follows that reactivation can only occur due toperturbations to the system, e.g., waning immune response due to aging,HIV infection, malnutrition, or immunotherapy, etc. (e.g., TNFneutralization).
Because all parameters exhibit a range of values, it is important to notethat a single simulation is not a unique representation of a certain state(latency or disease). Differential equation models yield as their output arepresentation of a sample average dependent on the parameter valuesused. Parameters may trade off to attain these states in a variety of ways andexhibit variable cellular/cytokine compositions for each of these states (seebelow).
Given the temporal nature of the model, we are unable to track lungphysiology to study the extent and localization of tissue damage. We assessdamage by measuring the effector cell (i.e., effector CD4� and CD8� T cellsubsets) to target cell (infected macrophage (MI)) ratio. A very large ratiowould indicate greater tissue damage and vice versa.
All dynamics are plotted as described (linear or log scale), and all num-bers indicate cell numbers/cytokine concentration per whole lung, but weconsider the primary effector functions to occur within the context of thetuberculous granuloma. We have used available experimental and/or clin-ical data to establish parameters of our models. There are available data oncytokine concentrations in bronchoalveolar lavage fluid from human TBstudies, although such data are not available from whole lung tissue inhuman TB. However, because TB is a disease that is primarily manifestedin the parenchyma, we assume that our modeling space represents whole
FIGURE 2. TNF production by macrophages is not strongly influenced by IL-10 in the setting of Mtb infection. Bone marrow-derived macrophages(from C57BL/6 wild-type (WT) or IL-10�/� mice) were infected with Mtb in vitro (multiplicity of infection of 2). IL-10 was added exogenously towild-type macrophages in one set of samples. Supernatants were harvested, and cells were used to prepare RNA at the time points indicated. mRNAexpression of TNF was determined by quantitative real-time RT-PCR and expressed as the fold increase over uninfected macrophages. The supernatantswere used in a bioactivity assay with WEHI cells, and the concentration of bioactive TNF was estimated based on a standard curve with recombinant TNF.There were no significant differences between wild-type and IL-10�/� macrophages with respect to TNF production, and exogenous IL-10 had nosignificant effect on TNF production by wild-type macrophages. Error bars represent SD. The experiment was repeated twice.
4298 ROLE OF CD8� T CELLS IN CONTROLLING TUBERCULOSIS INFECTION
lung. Additional data from mouse and nonhuman primate models of TB(Refs. 6, 10, and 40, and our unpublished data) have been incorporatedwhere appropriate. All parameters are studied using a detailed uncertaintyand sensitivity analysis (see below).
Deletion and depletion simulations
Simulations are performed mimicking in vivo experiments for the deletionof cells or effector molecules before infection (similar to a gene KO in amouse model) and for the depletion of cells or effectors, where an elementwas removed from the system after latency had been achieved (day 500)(similar to Ab-mediated neutralization studies). Deletion experiments helpus ascertain which elements of the system allow it to achieve latency,whereas depletion experiments help us understand which factors helpmaintain latency.
CD8� T cell kinetic studies
To explore the contributions of different subclasses of CD8� T cells oninfection dynamics, we perform two experiments in which T8 and TC cellsare differentially present, as suggested by Ref. 30. First, we allow only TCcells to be present for the first 200 days postinfection. Then we stop inputof any further TC cells and allow those present to turn over naturally, basedon their half-life. At that same day 200 time point we allow T8 cells tobegin to develop, and they remain present until the end of the simulation.In another similar but opposite simulation we introduce T8 cells first, andthen at day 200 postinfection we stop all further input of T8 cells and allowthem to decay in two manners, fast or slow. At the same time point weallow TC cells to begin to develop, and they remain present until the endof the simulation. We track the effects to all model variables in the abovesimulations but only report the effects on total bacterial load.
Vaccine studies
To test what the model predicts about the effects of vaccination, we studyfour distinct scenarios. Each of these studies was performed with all pa-rameters set to their latency values (Table III). First, we allow for only aclass of CD4� Th1 memory effector cells to be present at the time of firstchallenge with Mtb. We simulate this by varying a given background levelof memory cells that theoretically could be present in the lungs upon chal-lenge. Second, we repeat the previous scenario by adding a backgroundlevel of memory T8 cells while fixing the value of memory CD4� Th cellsto a very small number that by itself would not lead to clearance. Third, werepeat this second scenario with TC cells rather than T8 cells. Values formemory cell levels used in each simulation are given in Table V. Finally,we include all three classes of memory cells in a number of simulationswhere we vary the levels of each subclass present to determine the effectsof various combinations. In each of these simulations we assume that theinput cells have a very long half-life, capturing their memory cell status.We track the effects of the presence of these memory cells for all modelvariables but only report them for total bacterial load.
Determining mechanisms that affect infection outcome
Rates measured from in vivo or in vitro studies likely vary with eachrepeated experiment due to inherent differences among hosts, even whenusing inbred mice, as well as to intrinsic errors of measurement. Further,some interactions in the Mtb-host system are not currently measurable. Toexplore the effects of uncertainty in the model, we evaluate all of theparameters using our own C code based on Latin hypercube sampling (41,42). The Latin hypercube sampling method is a stratified Monte Carlosampling mechanism that allows simultaneous, random, and evenly dis-tributed sampling of each defined parameter that we contrast over a widerange. We vary each parameter by a factor of 1000 above and below re-ported literature data or mathematical estimates to assess the effects ofparameter variations on model outcome (total bacterial load in this case).We combine the resulting uncertainty data with a sensitivity analysis usingpartial rank correlation to ascertain the sensitivity of the outcome variable(total bacterial load) against variations in parameter values. The Student’st test is then used to determine the significance of each partial rank cor-relation obtained, giving us a standard measure of sensitivity. Using thesemethods we are not only able to reveal key parameters that govern infec-tion outcome but also able to evaluate temporal changes in the significanceof these parameters as they relate to bacterial load. We provide only cor-responding significance ( p values) for brevity.
Control experiments
As a negative control the model simulates no infection, yielding an equi-librium value of resting macrophage population (3 � 105 cells), and allother variables are zero (infected and activated macrophages, all T cell
subsets, and cytokines). If the innate response is up-regulated so that theinitial macrophage interaction kills the bacteria, the model indicates that it isindeed possible to clear an initial low dose (�10 bacilli) infection without anymemory of the response and no damage to the host (data not shown) (1).
Qualitative behavior of the previous model (15) is recapitulated by thisupdated model. Virtual IFN-� and IL-12 deletion experimental results arein agreement with the outcomes reported in literature and also agree withthose presented previously (15). We discuss TNF deletion and depletionelsewhere (S. Marino, D. Sud, J. Chan, J. L. Flynn, and D. E. Kirschner,manuscript in preparation). Recent availability of data on Mtb infectionstudies in humans and nonhuman primates (Refs. 43–49 and our unpub-lished data) have contributed to a more precise model of human infection.
ResultsSimulating latent infection and active disease
The model simulates both infection outcomes of latent and activeTB depending on the parameter values. As discussed previously(15), we used an extracellular bacterial load as a marker of diseaseprogression, where uncontrolled growth of extracellular bacteria isindicative of active TB. These extracellular bacteria are derived intwo ways: 1) from intracellular bacteria when infected macro-phages are killed by CTL action or burst due to high bacterial load;and 2) from bacteria dividing in the extracellular spaces (at aslower rate than intracellular bacteria) (50–52).
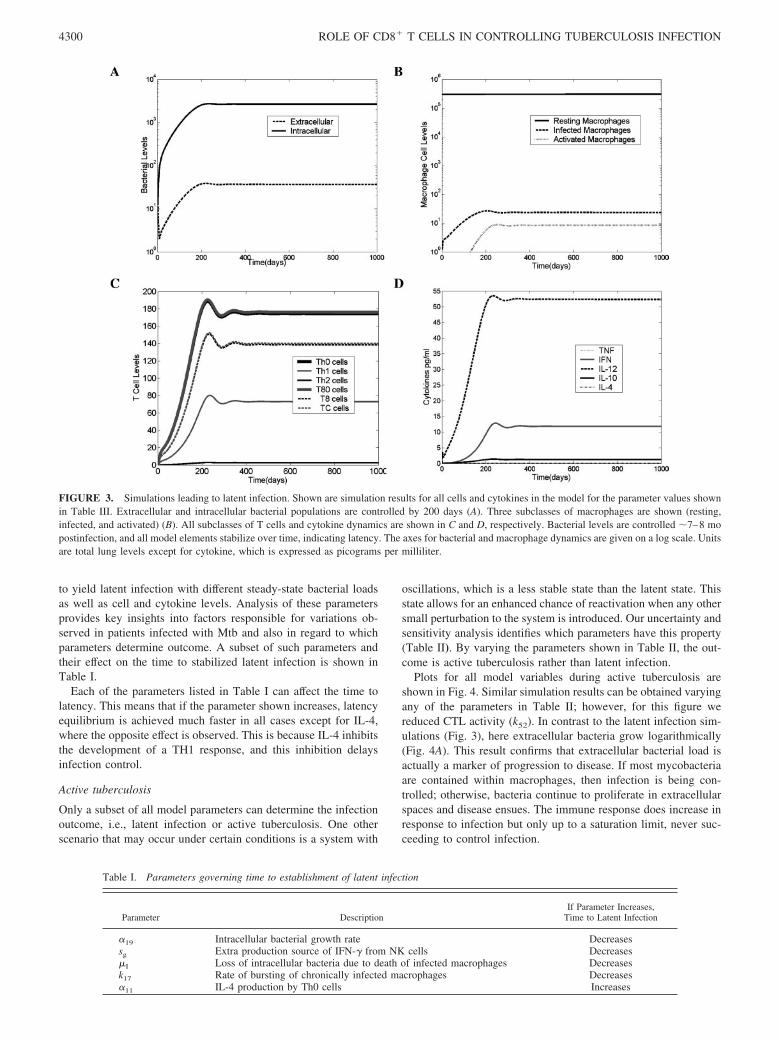
Latent infection
The various cell and cytokine profiles associated with latency canbe seen in Fig. 3. Extracellular bacterial load is extremely low (Fig.3A) (�40 bacteria per whole lung), and all intracellular bacteriareside within a small number of chronically infected macrophages(Fig. 3B). The relationship between infected macrophages and in-tracellular bacterial numbers implies that during latency there areon average 50 bacteria within each of �25 infected macrophages.Because some bacteria may be contained within resting and acti-vated macrophages and thus quickly cleared, they are not includedin this calculation. Resting macrophages maintain their numbersduring latency due to the balance between their recruitment andsubsequent activation or infection (Fig. 3B).
The CD4� T cell subset is composed mostly of Th0 cells, fol-lowed by Th1 cells and an extremely low level of Th2 cells (Fig.3C). The total T cell population (CD4� and CD8� T cells com-bined) is comparable to numbers found experimentally (45). In thisstudy we have assumed that the number of subclasses of CD8� Tcells, namely T8 and TC, are equal in number with a 10% overlapin function. Later, we studied what happens when this ratio differsover the time course of infection. Here also, the T80 cells comprisemost of the CD8� T cell population.
Simulated TNF levels are extremely low, because levels of in-fected and activated macrophages (the major TNF producers) arerelatively low (Fig. 3D). This condition results in limited inflam-mation. Predicted ranges for IFN-� and IL-10 correlate with stud-ies measuring cytokine levels at the site of disease (47, 53, 54),whereas simulated IL-4 is present at essentially undetectable levelsduring latency (�0.1 pg/ml), possibly explaining why IL-4 is dif-ficult to detect in humans with latent infection (54, 55). IL-12levels in this particular latency simulation are higher than whatmight be found within the lungs, but this is likely due to the con-straints of modeling within a single compartment, which meansthat priming of the T cell response occurs in the lungs instead oflymph nodes in this model. In other work from our group (14)involving a two-compartment system (lung and lymph node),IL-12 is higher in the lymphoid compartment.
Simulations indicate that latency is achieved by �7–8 mo, andbacterial numbers are controlled (Fig. 3). Depending on certainparameter values associated with bacterial turnover and infectionas well as cytokine production, these time points can be manipulated
4299The Journal of Immunology
to yield latent infection with different steady-state bacterial loadsas well as cell and cytokine levels. Analysis of these parametersprovides key insights into factors responsible for variations ob-served in patients infected with Mtb and also in regard to whichparameters determine outcome. A subset of such parameters andtheir effect on the time to stabilized latent infection is shown inTable I.
Each of the parameters listed in Table I can affect the time tolatency. This means that if the parameter shown increases, latencyequilibrium is achieved much faster in all cases except for IL-4,where the opposite effect is observed. This is because IL-4 inhibitsthe development of a TH1 response, and this inhibition delaysinfection control.
Active tuberculosis
Only a subset of all model parameters can determine the infectionoutcome, i.e., latent infection or active tuberculosis. One otherscenario that may occur under certain conditions is a system with
oscillations, which is a less stable state than the latent state. Thisstate allows for an enhanced chance of reactivation when any othersmall perturbation to the system is introduced. Our uncertainty andsensitivity analysis identifies which parameters have this property(Table II). By varying the parameters shown in Table II, the out-come is active tuberculosis rather than latent infection.
Plots for all model variables during active tuberculosis areshown in Fig. 4. Similar simulation results can be obtained varyingany of the parameters in Table II; however, for this figure wereduced CTL activity (k52). In contrast to the latent infection sim-ulations (Fig. 3), here extracellular bacteria grow logarithmically(Fig. 4A). This result confirms that extracellular bacterial load isactually a marker of progression to disease. If most mycobacteriaare contained within macrophages, then infection is being con-trolled; otherwise, bacteria continue to proliferate in extracellularspaces and disease ensues. The immune response does increase inresponse to infection but only up to a saturation limit, never suc-ceeding to control infection.
FIGURE 3. Simulations leading to latent infection. Shown are simulation results for all cells and cytokines in the model for the parameter values shownin Table III. Extracellular and intracellular bacterial populations are controlled by 200 days (A). Three subclasses of macrophages are shown (resting,infected, and activated) (B). All subclasses of T cells and cytokine dynamics are shown in C and D, respectively. Bacterial levels are controlled �7–8 mopostinfection, and all model elements stabilize over time, indicating latency. The axes for bacterial and macrophage dynamics are given on a log scale. Unitsare total lung levels except for cytokine, which is expressed as picograms per milliliter.
Table I. Parameters governing time to establishment of latent infection
Parameter DescriptionIf Parameter Increases,
Time to Latent Infection
�19 Intracellular bacterial growth rate Decreasessg Extra production source of IFN-� from NK cells Decreases�I Loss of intracellular bacteria due to death of infected macrophages Decreasesk17 Rate of bursting of chronically infected macrophages Decreases�11 IL-4 production by Th0 cells Increases
4300 ROLE OF CD8� T CELLS IN CONTROLLING TUBERCULOSIS INFECTION
FIGURE 4. Simulations leading to active disease. Shown are simulation results for all cells and cytokines in the model for the parameter values shownin Table III; with one parameter different CTL activity is reduced (k52). Bacterial population dynamics are shown in A. Note that, in contrast to Fig. 2, at1 year postinfection the extracellular bacteria are growing logarithmically, whereas intracellular levels saturate infected macrophages. Macrophages areshown in B, and the level of infected macrophages has increased four orders of magnitude compared with latency. T cells and cytokines respond by increases intheir numbers and concentration, but infection is not controlled (C and D). The axes for bacterial and T cell dynamics are indicated on a log scale, whereasmacrophage and cytokines dynamics are specified on a linear scale. Units are total lung levels except for cytokine, which is expressed as picograms per milliliter.
Table II. Parameters that affect Infection outcome
MechanismParameter
NameaSignificance andTiming of Effect
IFN-� productionBy NK cells sg (c10) �0.01b
By CD4� T cells (c5a) �0.001By CD8� T cells �5b (c5b) �0.001
Macrophage activationActivation rate k3 �0.001Strength of IFN-� signal (s1) �0.001Strength of either TNF/LAMc signal (c8) �0.01d
Inhibitory effectsIL-4 inhibition of IFN-� action ( f1) �0.001d
IL-10 inhibition of IL-12 production s �0.05Rate of IL-10 prod. by T cells (�18) �0.0001
CytotoxicityPerforin/granulysin activity of CTLs k52 �0.001
Bacterial factorsIntracellular growth rate �19 �0.001Extracellular growth rate �20 �0.001Rate of bursting of infected macs k17 �0.001e
Rate of phagocytosis k18 �0.05d
a Bacterial loads are increased or decreased significantly. Parameters in parentheses are positively correlated. Others arenegatively correlated.
b First 50 days.c Lipoarabinomannan.d After 100 days.e First 100 days.
4301The Journal of Immunology
Table III. Estimated values for parametersa
Parameter Description Range Reference Units
�5a IFN-� production by Th1 1–100 (50) Estimated pg/Th1 day�30 TNF production by MI 1e-3–2e-2 (3e-3) Estimated pg/ml MI day�5c IFN-� production by MI 0.02–0.06 (0.03) Estimated pg/ml MI�4a TNF-independent recruitment of MR 3e-3, 5e-3 (5e-3) Estimated 1/day�23 IL-12 production by MR 1e-4–0.1 (2e-4) Estimated pg/ml MR�5b IFN-� production by T8 cells 1–100 (50) Estimated pg/T8 day�18 IL-10 production by TCs and T8s 2e-4–6e-2 (2e-2) Estimated pg/(CD8 total) day�3a2 Th2 recruitment by chemokines 0.001 (0.001) Estimated 1/day�3ac TNF-independent recruitment of TC/T8 9e-4, 1.45e-2 (3e-3) Ref. 83 and estimated 1/day�31 TNF production by MA 0.3e-3–1.5e-2 (4e-3) Estimated pg/ml MA day�1a TNF-independent recruitment of Th0 5e-3 (5e-3) Ref. 83 and estimated 1/day�32 TNF production by Th1 8.16e-4 (8.16e-4) Ref. 84 pg/ml Th1 day�33 TNF production by T8 0.6e-4, 1.1e-4 (0.6e-4) Ref. 29 pg/ml T8 day�3a TNF-independent recruitment of Th1 5e-3 (5e-3) Ref. 83 and estimated 1/daysr3b2 TNF-dependent recruitment of Th2 1e3–1e5 (1e3) Estimated 1/daysr4b TNF-dependent recruitment of MR 1e3, 5e5 (2e4) Estimated MR/daysr1b TNF-dependent recruitment of Th0 1e4–1e6 (2e5) Ref. 83 and estimated Th0/daysr3b TNF-dependent recruitment of Th1 1e4–1e5 (2e4) Ref. 83 and estimated Th1/daysr3bc TNF-dependent recruitment of TC/T8 1e3–8e4 (8e4) Ref. 83 and estimated T/dayf9 Ratio adjustment, TNF/IL10 1–100 (50) Estimated Scalarf7 Effect of IL-10 on IFN-�-induced Th0 to Th1 1 (1) Estimated Scalarf8 Ratio Adjustment, IL-10/TNF on MR
recruitment1,100 (1) Ref. 85
s4b1 Half-sat, effect of TNF on Th1 recruitment 160–200 (165) Estimated pg/mls4b2 Half-sat, effect of TNF on Th0 recruitment 100–500 (450) Estimated pg/mls4b Half-sat, TNF on MR recruitment 138, 556 (200) Ref. 85 pg/ml day�2 Scaling factor of BT for TNF production by MA 1e-3, 1e-4 (1e-3) Estimated� Scaling factor of TNF for MR to MA 1e2–1e5 (1e2) Estimated BT/pgc Half-sat, IFN-� on Th1 death 1067, 1173 (1100) Ref. 86 pg/mlcc Half-sat, IFN-� on TC/T8 death 530, 600 (550) Ref. 86 pg/mlc52 Half-sat, TC on MI killing 10–100 (50) Estimated TCcT1 Half-sat, effect of Th1 on TC cytotoxicity 1–1e4 (10) Estimated Th1c5a Half-sat, MA on IFN-� by Th1 5e3–2e4 (7e3) Estimated MA/mlcT Half-sat, BT on TNF production by Th1/T8 1e3, 1e4 (1e4) Estimated BTc5b Half-sat, MA on IFN-� by T8 1e3–1e6 (7e3) Estimated MA/mlc230 Half-sat, BT on IL-12 by dendritic cells 1e3–1e5 (1e3) Estimated BT/mlc23 Half-sat, BT on IL-12 by MR 1e3–5e6 (5e3) Estimated BT/mlc4 Half-sat, (TC � Th1)/MI on MI apoptosis 20, 60 (40) Ref. 87 and estimated T/MIw3 Max percentage contribution by Th1 to Fas-FasL
apoptosis of MI0.4 (0.4) Estimated
w2 Max, percentage contribution of MI-producedchemokines to MR recruitment
0.15 (0.15) Estimated
w1 Max percentage contribution of Th1 tocytotoxicity
0.5 (0.5) Estimated
m Percentage overlap between TC and T8 subsets 0.5–1 (0.6) Estimated Scalar�T� IFN-�-induced apoptosis rate of Th1 1e-5–1e-3 (1e-4) Ref. 86 1/MA day�Tc� Th1 IFN-�-induced apoptosis rate of TC/T8 1e-5–1e-3 (1e-4) Ref. 86 1/MA day�T8 T8 death rate 0.33 (0.33) Estimated 1/day�Tc Tc death rate 0.33 (0.33) Estimated 1/day�T80 T80 death rate 0.33 (0.33) Estimated 1/day�i BI turnover to BE due to MI death, other
mechanisms0–0.005 (0.004) Estimated 1/day
�TNF TNF decay rate 1.112 (1.112) Ref. 88 1/dayk14a Fas-FasL-induced apoptosis of MI 0.01–0.1 (0.1) Estimated 1/dayk14b TNF induced apoptosis of MI 0.1–0.8 (0.1) Estimated 1/dayk52 Cytotoxic killing of MI 0.07–1 (0.5) Estimated 1/days10 Half-sat, IFN-� on TNF production by MA 50–100 (80) Estimated pg/mls12 Dendritic cell production of IL-12 200–1000 (300) Estimated pg/ml days Describes IL-10 downregulation of IL-12 by MA 1–100 (10) Estimated pg/ml�7 IL-10 production by MA 0.001–0.01 (0.01) Estimated pg/ml MANfraca Average no. of bacteria within a single MI
released upon TNF-induced apoptosis0.4–0.8 (0.5) Estimated Scalar
Nfracc Average no. of bacteria within a single MIreleased upon Fas-FasL apoptosis
0.05–0.2 (0.1) Estimated Scalar
�20 BE growth rateb 0–0.26 (0.05) 1/day�19 BI growth rateb 0.17–0.6 (0.4) 1/day�12 IL-4 production by Th2b 1e-3–9.1e-3 (1e-3) pg/Th2 day�11 IL-4 production by Th0b 2.8e-4–4e-3 (5e-4) pg/Th0 day�17 IL-10 production by Th2b 6e-4–6e-2 (6e-2) pg/Th2 day�8 IL-12 production by MAb 8e–5 (8e-5) pg/MA day�7 IFN-� production by Th0b 0.02–0.06 (0.03) pg/ml Th0�16 IL-10 production by Th1b 2e-4–1e-3 (2e-3) pg/Th1 day
(Continued)
4302 ROLE OF CD8� T CELLS IN CONTROLLING TUBERCULOSIS INFECTION
Macrophage dynamics are shown in Fig. 4B. In the model, whena macrophage contains a threshold number of bacteria it bursts,releasing those bacteria to the extracellular environment wherethey can grow or be taken up by other macrophages. In progressionto active TB, resting macrophages are depleted by an order ofmagnitude due to high levels of infection. Activated macrophagenumbers increase and then fall off due to the following: 1) the shortlife span of activated macrophages; and 2) depletion of the restingmacrophage pool due to infection (56). This transient rise in num-bers indicates that severe tissue damage will occur (discussed be-low in the paragraph entitled Measuring immunopathology).
The total T cell population reaches a level comparable to that ofthe macrophage population (Fig. 4C). Because of the IFN-�-in-duced apoptosis of Th1 cells, we observe a transient delay (beforeattaining peak values) that also correlates inversely with activatedmacrophage dynamics. This observation compares well with avail-able experimental data regarding the necessity of activated mac-rophages for T cell apoptosis (37, 57, 58). CD8� T cell numbersare comparable to those of CD4� T cells and show dynamics mostsimilar to those of Th1 cells due to IFN-� induced apoptosis (Fig.4C).
All cytokine levels are significantly elevated during disease.TNF levels are increased by several orders of magnitude to �1000pg/ml (Fig. 4D), which has been associated with severe pathology(59). Other cytokine levels correlate with experimental data (47,
60). In unpublished data from our nonhuman primate studies withactive TB, CD4� and CD8� T cell production of IFN-� increasessubstantially compared with that of latently infected monkeys. Inaddition, there is an increase in CD4� and CD8� T cells in thelungs of mice with fulminant TB compared with controlled infec-tion (61) (our unpublished data).
Factors that determine infection outcome
The model consists of �100 parameters that govern rates and in-teractions between various components that can differ among in-dividuals and potentially can affect progression to active tubercu-losis or to latent infection (see Table III and Appendix). Varyingeach of these parameters over a large range simultaneously to per-form sensitivity analyses demonstrates that changes in only a smallsubset of parameters are influential in distinguishing between in-fection outcomes (Table II). Logically, a tradeoff exists betweenthese parameters; changing a parameter toward more stringentcontrol can be compensated for by varying another to aggravateinfection with no resulting change in outcome. For example, anincreased extracellular bacterial reproduction rate (�20) can becontrolled by increasing the rate of CTL activity (k52).
IFN-� is an important cytokine for macrophage activation and,not surprisingly, is relevant in determining infection outcome (Ta-ble II). The rate of production of IFN-� from all three sources(CD4� and CD8� T cells and NK cells) has a positive effect on
Table III. (Continued)
Parameter Description Range Reference Units
�2 Max growth rate of Th0b 1e-4–2.8 (5e-3) 1/daysrm MR recruitment rateb 600–1000 (1000) MR/dayf6 Adjustment, IFN-� on IL-10b 0.025–0.053 (0.025) Scalarf4 Adjustment, IL-10/IL-12 on IFN-�b 0.76–3.2 (2) Scalarf2 Adjustment, IFN-�/IL-4b 0.0012–1.6 (1) Scalarf1 Adjustment, IL-4/IFN-�b 3–410 (200) Scalars2 Half-sat, IL-4b 1–10 (5) pg/mls6 Half-sat, IL-10 self-inhibition in MAb 51–60 (60) pg/mls4 Half-sat, IL-12 on IFNb 50–100 (50) pg/mls7 Half-sat, IL-12 on IFN-� by NK cellsb 5–100 (40) pg/mls1 Half-sat, IFN-� on MR to MAb 50–110 (70) pg/mls8 Half-sat, IL-10 on MA deactivationb 1–1000 (1) pg/mlc9 Half-sat, BE on MR infectionb 1e6–1e7 (2e6) BEc8 Half-sat, BT on MR activationb 5e4–5e5 (1e5) BT/mlc4 Half-sat, T/MI ratio for MI lysisb 1–60 (40) T/MIc15 Half-sat, MA on IFN-� by Th1b 1e4–5e5 (2e5) MAc10 Half-sat, bacteria on IFN by NK cellsb 1e3–1e4 (1e3) BT/ml�MR Death rate, MRb 0.0033 (0.0033) 1/day�MI MI death rateb 0.0011 (0.0011) 1/day�MA MA death rateb 0.07 (0.07) 1/day�i� IFN-� decay rateb 2.16–33.2 (2.16) 1/day�i4 IL-4 decay rateb 2.77 (2.77) 1/day�i10 IL-10 decay rateb 3.7–7.23 (5) 1/day�i12 IL-12 decay rateb 1.188 (1.188) 1/day�T2 Th2 death rateb 0.33 (0.33) 1/day�T1 Th1 death rateb 0.33 (0.330) 1/day�T0 Th0 death rateb 0.33 (0.33) 1/dayk2 MR infection rateb 0.2–0.4 (0.4) 1/dayk3 MR activation rateb 0.2–0.4 (0.1) 1/dayk17 Max. MI death due to BIb 0.02–0.8 (0.02) 1/dayk4 MA deactivation by IL-10b 0.01–0.4 (0.08) 1/dayk6 Max Th0 to Th1 rateb 2.9e-4, 5e-3 (5e-3) ml/pg dayk7 Max Th0 to Th2 rateb 0.02–0.7 (0.02) ml/pg dayk18 BE killing by MRb 1.2e-9–1.2e-8 (5e-9) ml/MR dayk15 BE killing by MAb 1.25e-7 (1.25e-7) ml/MA daysg IFN-� production by NK cellsb 0–1000 (100) pg/ml dayN Carrying capacity of infected macrophagesb 10–100 (20) BI/MI
a BE, extracellular bacteria; BI, intracellular bacteria; BT, total bacteria; Half-sat, half-saturation; MA, activated macrophages; MI, infected macrophages; MR, restingmacrophages; T, naive T cells.
b Parameter that was estimated previously in Ref. 15.
4303The Journal of Immunology
control of infection. However, the contribution of NK cells is par-ticularly important in the initial phases of the infection ( p � 0.01for the first 50 days), whereas the contribution from T cells isimportant throughout the infection ( p � 0.001). Related to thefindings with respect to IFN-� production, cytokine parametersthat control the rate of macrophage activation (IFN-� and TNF)determine the outcome of infection as well, with increased mac-rophage activation promoting establishment of latency. Parametersthat influence IL-12 production by macrophages and dendritic cells(c23, �23, and c230) and, therefore, the robustness of the type 1response, can determine the outcome of infection and are impor-tant throughout the course of infection. Along these same lines,those parameters that inhibit a type 1 (IFN-� producing) T cellresponse, such as IL-4 inhibition of IFN-� effects ( f1) and IL-10mediated inhibition of IL-12 production (s), have a negative effecton the establishment of latency. Increasing the rate of productionof IL-10 from T cells (�18) results in progression to disease due tomultiple effects of this cytokine, including inhibition of macro-phage activation, IFN-� production, and TNF-mediated apoptosis.
In addition to the IFN-� production by CD8� T cells, a param-eter (k52) that governs the perforin/granulysin-mediated cytotox-icity of infected macrophages with the subsequent killing of intra-cellular bacteria influences infection outcome. Decreasing the rateof these killing mechanisms leads to disease.
Bacterial factors that determine infection outcome include boththe intracellular (�19) and extracellular (�20) bacterial replicationrates, the ability of bacteria to be taken up into macrophages anddestroyed by phagocytosis (k18), the rate of bursting of infectedmacrophages due to bacterial overload (k17), and the turnover ofbacteria from intracellular to extracellular due to natural death ofinfected macrophages (�I) (Table II). This suggests that certainbacterial factors that are strain dependent can influence infectionoutcome. In particular, factors in the model that increase the ex-tracellular bacterial load are all influential in infection outcome.Also suggested from these data is the idea that the growth rateinside macrophages, as well as perhaps cell wall factors that affectphagocytosis, should influence the ability of a strain to cause dis-ease. This possibility is supported by literature comparing the vir-ulence of different clinical strains of bacteria (62–64).
Recruitment of cells to the site of infection is clearly relevant tocontrol of infection. Based on our previous data in animal models(33), we include both TNF-dependent and independent recruitmentterms. There are several recruitment parameters in the model thatare crucial in determining infection outcome (data not shown).Interestingly, those parameters that are most important are TNF-dependent. A full discussion of the predicted roles of TNF in TBfrom this mathematical model is the subject of another manuscript(S. Marino, D. Sud, J. Chan, J. L. Flynn, and D. E. Kirschner,manuscript in preparation).
Measuring immunopathology
Because we do not specifically track the lung tissue environmentwhere infection is occurring, we define tissue damage based on theratio of effector T cells to infected macrophages (see Materials andMethods). In other work (65) we focused on granuloma formation,examining the spatial aspects of infection together with the devel-opment of necrosis. An overexuberant immune response can leadto tissue damage, including necrosis. Caseous necrosis within a gran-uloma may actually contribute to control of infection (66), perhaps bycreating anoxic (anaerobic) conditions (our unpublished data). In thiswork we specifically address the contribution of TNF and CD8� Tcells to immunopathology. Presented in Table IV are those factors thatplay a role in tissue damage, including those identified in our previouswork (15). The model predicts that increased TNF production beyonda threshold level results in a high effector T cell to infected macro-phage ratio, thereby causing tissue damage.
Inhibition of macrophage/T cell recruitment by IL-10 is impor-tant for controlling immunopathology. Modulation of T cell num-bers within the lungs also influences pathology. An importantmechanism that controls T cell numbers in mycobacterial infectionis IFN-�-induced apoptosis, which may prevent excessive activa-tion of resting macrophages and the resulting tissue damage (37).The model indicates that decreased T cell apoptosis results in im-proved control of infection, but with a cost of increased tissuedamage (�Tc; Table IV). Such delicate balances emphasize thetradeoff between tissue-damaging responses and important down-regulatory mechanisms, as suggested by others (66).
Cytokine dynamics
Shown in Fig. 5 are the infection outcomes following deletion(Fig. 5A) and depletion (Fig. 5B) for four key cytokines in themodel. Note that TNF deletion or depletion results by far in thefastest progression to disease as compared with deletion of IL-12or IFN-�. IL-12 and IFN-� deletion simulations both approachdisease with similar kinetics, and IL-10 deletion is only slightlydifferent from that of the latency control. Results are consistentacross deletion and depletion studies, indicating that those cyto-kines that are important in establishment of latency are also rele-vant for maintaining the infection in a latent state.
T cell contributions to immunity
Our updated model is consistent with experimental data predictingthat key immune components responsible for controlling initialand latent Mtb infection are CD8� CTL activity and IFN-� pro-duction (4, 30, 67–69). Cytotoxic activity of CD8� T cells ac-counts for �80–90% of the killing of infected macrophages andup to 80% of the granulysin-mediated killing of bacteria withinthose macrophages; this activity is crucial to control of infection
Table IV. Parameters affecting immunopathology
Parameter DescriptionIncreased Damage
Occurs When Value Isa
�30 TNF production rate by MI Increased�7 IL-10 production rate by MI Decreasedsr3bc TNF-dependent recruitment rate of TC and T8 Increased�11 IL-4 production rate by Th0 Decreasedf8 Extent of inhibition of macrophage recruitment by IL-10 Decreased�Tc IFN�-induced apoptosis rate of Th1 Decreasedk52 Rate of cytotoxic killing of MI by TC Increased�TNF Decay rate of TNF Decreased
a Compared to values used to generate latent infection simulation (Table III).
4304 ROLE OF CD8� T CELLS IN CONTROLLING TUBERCULOSIS INFECTION
(k52; Table II). The Fas-FasL apoptosis of infected macrophagesinduced by CD8� T cells also appears to be important early ininfection, in contrast to published in vitro studies (26, 70) thatexamined the effects of this pathway on killing intracellularmycobacteria.
T cell deletion studies
The updated model reflects the contribution of all of the major Tcell subsets, which allows us to analyze the importance of eachsubset at different times in infection. Fig. 6 presents deletion (Fig.6A) and depletion (Fig. 6B) simulations of various T cell popula-tion subsets. As stated previously, deletion simulates the loss of acomponent from the beginning of infection (similar to a KOmouse). Depletion studies simulate loss of a component during alatent infection (500 days postinfection), similar to Ab-mediateddepletion or neutralization of cells or cytokines. Depletion studiesclosely match the deletion results (compare Fig. 6, A and B), sup-porting the hypothesis that similar factors are important for con-trolling both initial and latent infection.
Simulations in which either total CD4� or CD8� T cell popu-lations are deleted always result in disease. Disease (as marked bytotal lung bacterial load) develops more slowly when CD8� T cellsare deleted as compared with CD4� T cell deletion (Fig. 6), whichis consistent with experimental studies (12). In the CD8� T celldeletion simulation, overall cell numbers are maintained as in-creased macrophage numbers compensate for a decline in CD8� T
cell numbers, and CTL killing of infected macrophages is greatlyreduced (data not shown). All cytokine levels are similar to thoseobserved during disease (Fig. 4), which is in agreement with pub-lished data (20) on IFN-� and TNF production in mice withoutCD8� T cells.
Selective T8 or TC deletion
We exploit the model to specifically delete either T8 or TC subsetsat day 0 to determine the relative contribution of each to control ofinfection. The resulting bacterial loads from selective T8 and TCdeletion are shown in Fig. 6A. For T8 deletion, latent infection isachieved, although bacterial numbers are slightly higher than thestandard latent infection values (wild type). In the absence of T8cells, IFN-� production by CD4 T cells (Th1) and NK cells in-creases to maintain total levels of IFN-� (data not shown).
For TC deletion, latent infection is achieved; however, bacterialloads are an order of magnitude higher, and oscillations appear.The presence of oscillations in total bacterial numbers indicates aless stable state of latency. This result suggests that an additional,even minor, perturbation of the system could result in reactivation,whereas the same perturbation in the presence of TC cells wouldnot affect the latency state. To test this hypothesis, an experimentwas performed in which TC cells were deleted and the rate ofIL-10 production by Th1 was increased (over a range of values)compared with the standard latency values. In this case, the outcomewas always uncontrolled bacterial growth (data not shown). Varyingthe IL-10 values over the same range in the presence of TC cells(normal latency levels) did not affect the outcome of infection.
FIGURE 5. Cytokine deletion and depletion. Shown are the simulationdynamics of total bacteria levels during deletion (indicated by �/�) (A)and depletion (indicated by �) (B). Deletions and depletions were per-formed for IFN-� (thin, dark, solid lines), TNF (thick, dark, solid lines),IL-12 (gray dashed lines), and IL-10 (gray solid lines). Deletions imply thata cytokine was removed from the system at day 0, whereas for deletion itis removed at day 500. Simulations are shown compared with latency (wildtype; dark dashed lines) as a positive control.
FIGURE 6. T cell deletion and depletion. Simulations of total bacterialdynamics are shown for deletion (indicated by �/�) (A) and depletion(indicated by �) (B) simulations. For deletions, T cells were removed fromthe system at day 0. For depletions, cells were removed at day 500 after thesystem has achieved latency. Deletion and depletion simulations were per-formed for total CD4� T cells, total CD8� T cells, T8 cells, and TC cells.These were compared with latency (wild type) as a positive control.
4305The Journal of Immunology
An unexpected result of the CD8� T cell subset deletion sim-ulations was the apparent synergy between these subsets that isimportant in the immune response to Mtb. When both T cell sub-sets were removed simultaneously, the system was driven to activedisease. However, when T8 and TC were removed individually,latency was still achieved, but at a cost to either bacterial numbersor system stability, respectively. Taken together, these deletion anddepletion studies support the view that T8 and TC cell subsets actin synergy to control infection.
T cell depletion
To explore the role of T cells in maintaining a latent infection, weperformed depletions by removing CD4� and CD8� T cells as
well as both functional subsets (T8 and TC cells) from our systemat 500 days postinfection (while the system is in latency). Fig. 6Billustrates the dynamics of the total bacterial population in thelungs during latency (�500 days), depletion, and subsequent ad-vancement to disease (�500 days). The results match those of thedeletion cases (Fig. 6A). This finding implies that T cells are cru-cial in both establishing as well as maintaining latent infection.
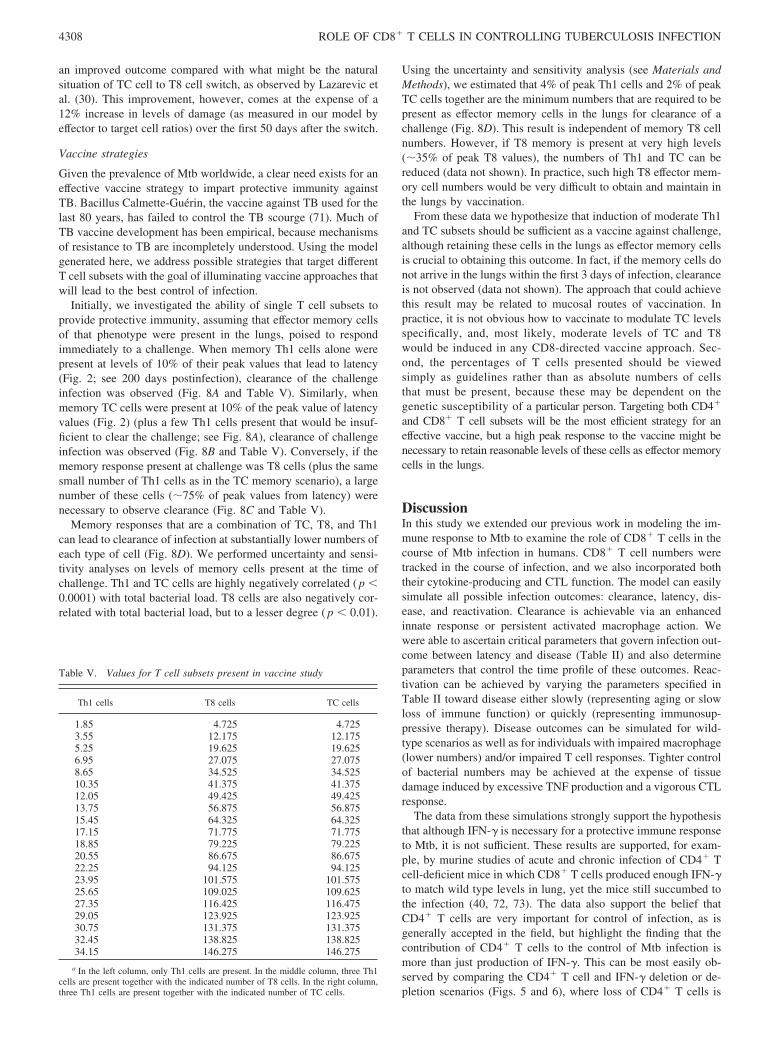
CD8� T cell subsets: dynamic changes during the course ofinfection
Experimental data from a C57BL/6 mouse model suggest that thefunctions of CD8� T cells are differentially regulated duringinfection (30). Cytotoxic function was observed only during the
FIGURE 7. CD8� T cell kinetic studies. A, Data from Ref. 30 indicating the differential presence of T8 and TC populations a mouse model of TB. Theprogression time frame for a murine model is likely faster than that observed in humans. B–F, Simulations exploring the timing of CD8� T cell kinetics.B, Dynamics of two subsets of CD8� T cells when TC cells are present first and then, at the 200 day time point, they die off naturally and T8 cells areintroduced and are allowed to increase. C, The corresponding bacterial subpopulations. Notice that oscillations are now present in the system as comparedwith latency (Fig. 3A). D and E, The opposite orientation, where T8 cells are present first for 200 days and are allowed to die off either fast (D) or slow(E) while the TC cell subset replaces the T8 cell subset. F, total bacterial dynamics during the fast (dashed line) and slow (solid line) T cell dynamics fromD and E, respectively.
4306 ROLE OF CD8� T CELLS IN CONTROLLING TUBERCULOSIS INFECTION
initial phase of infection, whereas IFN-� production by CD8� Tcells did not occur until the chronic phase of infection (see Fig. 7A,adapted from Ref. 30). Until now, we assumed that the total CD8�
T cell population was comprised of equal numbers of T8 and TCcell subsets. We can now vary this assumption to test the experi-mental predictions of Lazarevic et al (30). In the murine system,the dynamics of infection occur on a faster time scale than that ofhumans and nonhuman primates. In the studies of Lazarevic et al.(30), the observed a switch in CD8� T cell phenotype in � 50days. In the simulations in this study, we allowed the system toevolve further for 200 days (just into the latent state; see Fig. 3)before we induced a switch. We first simulated the situation de-scribed in Lazarevic et al. (30) in which TC cells existed exclu-sively for 200 days and, as they declined, we introduced IFN-�-producing activity via T8 cells in an increasing and also exclusivefashion (Fig. 7B). In this case, the system no longer approacheslatency as a steady state but instead reveals oscillations in bacterialnumbers (Fig. 7C), suggesting a less stable latent state. Further, theaverage levels of bacteria during the course of infection in thissimulation are higher than when both subclasses of CD8� T cellsare present throughout infection.
It is possible that this naturally occurring order of effector T celldominance scenario (TC cells first, then T8 cells) may not be the
most effective in controlling infection. To address this question, wecompared the effects of opposite differential timing of CD8� T cellfunction on the outcome of infection (Fig. 7, D and E) when IFN-�producing activity is introduced first and exclusively followed bycytotoxic activity. This was done in two ways: first, a rapid declinein T8 cells (to zero from 180 to 220 days) while TC cells wereincreasing (beginning at 200 days) (Fig. 7D) and, second, wherethe decline in T8 cells was very slow (over a period of �1000days) (Fig. 7E). In both simulations, total bacterial numbers in-creased dramatically during the first 100 days of infection and thenwere controlled (Fig. 7F). In the situation where T8 cells declinedquickly a latent state was achieved at, however, a higher bacteriallevel than normal latency levels (compare Figs. 7F and 3A). Incontrast, when T8 cell levels decreased very slowly, the infectionwas actually cleared. We interpret this to mean that modestly in-creased bacterial numbers during the initiation of an immune re-sponse, caused by a lack of TC cells, enhances the overall induc-tion of an immune response (by having more Ag driving strongerT cell responses). When T8 cells are declining slowly and TC cellsenter the lung, the stronger immune response can clear infection.In contrast, if T8 cells are not maintained, TC cells are sufficient tocontrol infection (when TH1 cells are also present), but at aslightly higher bacterial load. Thus, a T8 cell to TC cell switch has
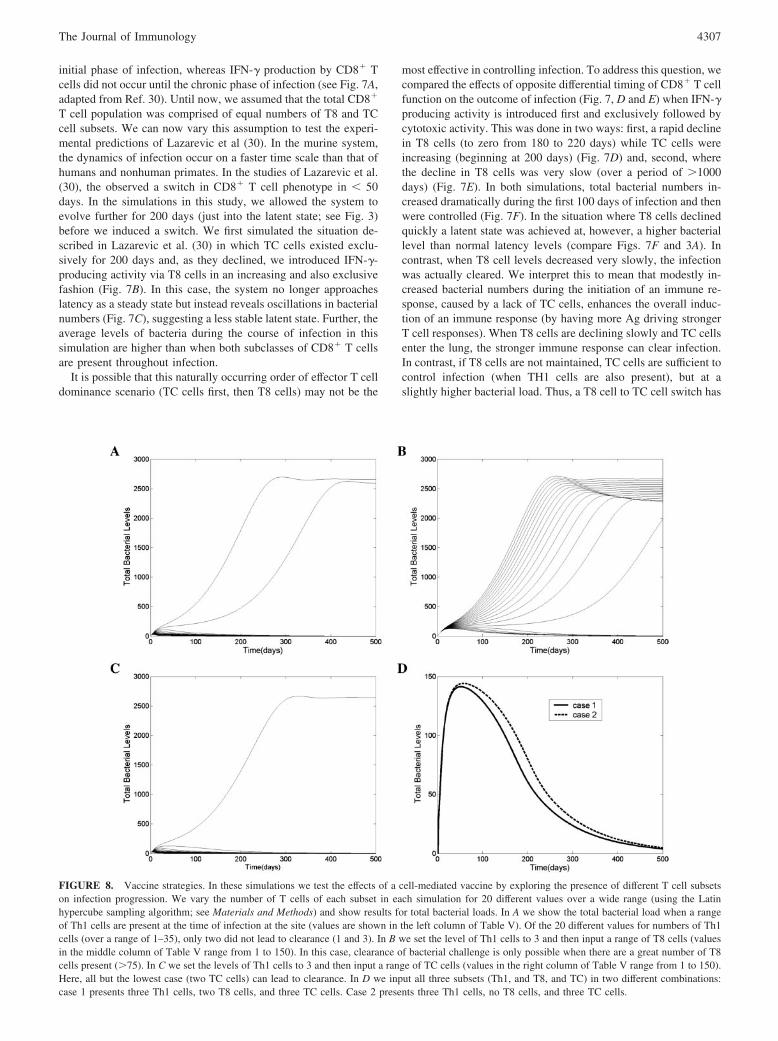
FIGURE 8. Vaccine strategies. In these simulations we test the effects of a cell-mediated vaccine by exploring the presence of different T cell subsetson infection progression. We vary the number of T cells of each subset in each simulation for 20 different values over a wide range (using the Latinhypercube sampling algorithm; see Materials and Methods) and show results for total bacterial loads. In A we show the total bacterial load when a rangeof Th1 cells are present at the time of infection at the site (values are shown in the left column of Table V). Of the 20 different values for numbers of Th1cells (over a range of 1–35), only two did not lead to clearance (1 and 3). In B we set the level of Th1 cells to 3 and then input a range of T8 cells (valuesin the middle column of Table V range from 1 to 150). In this case, clearance of bacterial challenge is only possible when there are a great number of T8cells present (�75). In C we set the levels of Th1 cells to 3 and then input a range of TC cells (values in the right column of Table V range from 1 to 150).Here, all but the lowest case (two TC cells) can lead to clearance. In D we input all three subsets (Th1, and T8, and TC) in two different combinations:case 1 presents three Th1 cells, two T8 cells, and three TC cells. Case 2 presents three Th1 cells, no T8 cells, and three TC cells.
4307The Journal of Immunology
an improved outcome compared with what might be the naturalsituation of TC cell to T8 cell switch, as observed by Lazarevic etal. (30). This improvement, however, comes at the expense of a12% increase in levels of damage (as measured in our model byeffector to target cell ratios) over the first 50 days after the switch.
Vaccine strategies
Given the prevalence of Mtb worldwide, a clear need exists for aneffective vaccine strategy to impart protective immunity againstTB. Bacillus Calmette-Guerin, the vaccine against TB used for thelast 80 years, has failed to control the TB scourge (71). Much ofTB vaccine development has been empirical, because mechanismsof resistance to TB are incompletely understood. Using the modelgenerated here, we address possible strategies that target differentT cell subsets with the goal of illuminating vaccine approaches thatwill lead to the best control of infection.
Initially, we investigated the ability of single T cell subsets toprovide protective immunity, assuming that effector memory cellsof that phenotype were present in the lungs, poised to respondimmediately to a challenge. When memory Th1 cells alone werepresent at levels of 10% of their peak values that lead to latency(Fig. 2; see 200 days postinfection), clearance of the challengeinfection was observed (Fig. 8A and Table V). Similarly, whenmemory TC cells were present at 10% of the peak value of latencyvalues (Fig. 2) (plus a few Th1 cells present that would be insuf-ficient to clear the challenge; see Fig. 8A), clearance of challengeinfection was observed (Fig. 8B and Table V). Conversely, if thememory response present at challenge was T8 cells (plus the samesmall number of Th1 cells as in the TC memory scenario), a largenumber of these cells (�75% of peak values from latency) werenecessary to observe clearance (Fig. 8C and Table V).
Memory responses that are a combination of TC, T8, and Th1can lead to clearance of infection at substantially lower numbers ofeach type of cell (Fig. 8D). We performed uncertainty and sensi-tivity analyses on levels of memory cells present at the time ofchallenge. Th1 and TC cells are highly negatively correlated ( p �0.0001) with total bacterial load. T8 cells are also negatively cor-related with total bacterial load, but to a lesser degree ( p � 0.01).
Using the uncertainty and sensitivity analysis (see Materials andMethods), we estimated that 4% of peak Th1 cells and 2% of peakTC cells together are the minimum numbers that are required to bepresent as effector memory cells in the lungs for clearance of achallenge (Fig. 8D). This result is independent of memory T8 cellnumbers. However, if T8 memory is present at very high levels(�35% of peak T8 values), the numbers of Th1 and TC can bereduced (data not shown). In practice, such high T8 effector mem-ory cell numbers would be very difficult to obtain and maintain inthe lungs by vaccination.
From these data we hypothesize that induction of moderate Th1and TC subsets should be sufficient as a vaccine against challenge,although retaining these cells in the lungs as effector memory cellsis crucial to obtaining this outcome. In fact, if the memory cells donot arrive in the lungs within the first 3 days of infection, clearanceis not observed (data not shown). The approach that could achievethis result may be related to mucosal routes of vaccination. Inpractice, it is not obvious how to vaccinate to modulate TC levelsspecifically, and, most likely, moderate levels of TC and T8would be induced in any CD8-directed vaccine approach. Sec-ond, the percentages of T cells presented should be viewedsimply as guidelines rather than as absolute numbers of cellsthat must be present, because these may be dependent on thegenetic susceptibility of a particular person. Targeting both CD4�
and CD8� T cell subsets will be the most efficient strategy for aneffective vaccine, but a high peak response to the vaccine might benecessary to retain reasonable levels of these cells as effector memorycells in the lungs.
DiscussionIn this study we extended our previous work in modeling the im-mune response to Mtb to examine the role of CD8� T cells in thecourse of Mtb infection in humans. CD8� T cell numbers weretracked in the course of infection, and we also incorporated boththeir cytokine-producing and CTL function. The model can easilysimulate all possible infection outcomes: clearance, latency, dis-ease, and reactivation. Clearance is achievable via an enhancedinnate response or persistent activated macrophage action. Wewere able to ascertain critical parameters that govern infection out-come between latency and disease (Table II) and also determineparameters that control the time profile of these outcomes. Reac-tivation can be achieved by varying the parameters specified inTable II toward disease either slowly (representing aging or slowloss of immune function) or quickly (representing immunosup-pressive therapy). Disease outcomes can be simulated for wild-type scenarios as well as for individuals with impaired macrophage(lower numbers) and/or impaired T cell responses. Tighter controlof bacterial numbers may be achieved at the expense of tissuedamage induced by excessive TNF production and a vigorous CTLresponse.
The data from these simulations strongly support the hypothesisthat although IFN-� is necessary for a protective immune responseto Mtb, it is not sufficient. These results are supported, for exam-ple, by murine studies of acute and chronic infection of CD4� Tcell-deficient mice in which CD8� T cells produced enough IFN-�to match wild type levels in lung, yet the mice still succumbed tothe infection (40, 72, 73). The data also support the belief thatCD4� T cells are very important for control of infection, as isgenerally accepted in the field, but highlight the finding that thecontribution of CD4� T cells to the control of Mtb infection ismore than just production of IFN-�. This can be most easily ob-served by comparing the CD4� T cell and IFN-� deletion or de-pletion scenarios (Figs. 5 and 6), where loss of CD4� T cells is
Table V. Values for T cell subsets present in vaccine study
a In the left column, only Th1 cells are present. In the middle column, three Th1cells are present together with the indicated number of T8 cells. In the right column,three Th1 cells are present together with the indicated number of TC cells.
4308 ROLE OF CD8� T CELLS IN CONTROLLING TUBERCULOSIS INFECTION
more detrimental in terms of time to active disease than loss ofIFN-�.
A consistent theme observed in all simulations performed wasthat mechanisms important in controlling initial infection also con-tributed to the maintenance of latent infection. This observation issupported by some (4–6, 40, 72–76) but not all (77) experimentalfindings in the literature. These results further suggest that there iscontinual need for dynamic control of infection rather than aspecial state attributed to latent infection. In the simulations wherewe study the mechanisms yielding different infection outcomes(using the uncertainty and sensitivity analysis), the values for allcells and cytokines adjust their levels slightly, yielding myriaddifferent routes to latency or active disease for each combination ofparameters. This variation could account for differences amongindividuals (and possibly between animals and humans) in re-sponse to infection and suggests that levels of effector cells andmolecules necessary for achieving and maintaining latency maydiffer.
Using the updated model, we were able to assess the contribu-tions of the various T cell subsets to the control of Mtb, both in thesetting of natural infection and in a vaccinated individual. CD8� Tcells have at least two major functions that are important in controlof Mtb infection: 1) cytotoxic activity, which can result in intra-cellular bacterial killing as well as killing of the infected macro-phage; and 2) cytokine production. In this study we defined twosubsets, TC (cytotoxic CD8� T cells) and T8 (IFN-� producingCD8� T cells), based on literature indicating that these two subsetsmay be differentially regulated (1, 5, 6). This provided the oppor-tunity to determine the contribution of each subset to control ofinfection. Although no human or primate TB data for such dele-tion/depletion experiments are available, we were able to compareour results to murine experiments involving T cell depletion viaAb treatment, as well as genetic KOs resulting in dysfunctionalCD8� T cells (12, 20, 78). However, in the mouse model it istechnically challenging or impossible to selectively deplete eithercytotoxic or IFN-� producing subsets during chronic infection. Inaddition, KO mice can have dysregulated immune responses thatprevent accurate analysis of the exclusive effects of the mutation.For example, we and others (9, 79) demonstrated previously thatperforin KO mice (i.e., with CD8� T cells impaired in cytotoxicpotential) had dysregulated IFN-� production (up to 4-fold higher)during Mtb infection, making it impossible to determine the truecontribution of CTL to the control of the infection. In contrast,mathematical models are not subject to these complications. Fi-nally, mice are lacking in what appears to be a crucial factor,granulysin, in the ability of CD8� T cells to control Mtb infection.Using the mathematical model, we were able to include granulysinaction in the CTL subset and directly study the effects of the ac-tions of this molecule in the immune response to Mtb.
Our findings indicate that both subclasses of CD8� T cells canplay a role in the immune response to Mtb. Deletion or depletionof either subset can still allow the host to control the infection, buteither total bacterial numbers during latency are slightly higher (inthe case of absence of T8 cells) or total bacterial numbers oscillate(in the case of loss of TC), indicating a less stable latent state. Theless stable latent state is more susceptible to minor perturbations,and small changes can lead to reactivation in this setting (data notshown). However, given the data regarding removal of a singleCD8� T cell subset, the surprising finding is that removal of bothCD8� T cell subsets together always results in active disease, sug-gesting that some contribution from either CD8� T cell subset isnecessary to control infection.
This model was used to explore the timing of CD8� T celleffector functions. In the literature, Ag load or extent of priming in
viral infections has been postulated to influence CD8� T cell ef-fector functions, with higher Ag load leading to a more cytokine-producing phenotype. Our group has published data (30) suggest-ing that, early in infection (in C57BL/6 mice), cytotoxic activitybut little IFN-� production from CD8� T cells is observed in thelungs. When infection reaches the chronic stage there is a buildupof Ag in the lungs, and the CD8� T cell phenotype appears toswitch to IFN-� production. Using the model, we compared thescenarios of first initiating TC function followed by T8 function(the naturally occurring situation) with the opposite orientation,i.e., T8 cells appearing first and then switching to TC cell function.In the first scenario (the early appearance and then decline of TCcells, with T8 cells appearing later in infection), the system couldreach latency but with a higher and oscillating bacterial load (i.e.,a less stable latent state). In contrast, if T8 cells were present ini-tially but declined quickly as TC cells were introduced into thesystem, a stable latency was achieved. Furthermore, if the T8 cellswere declining more slowly during the introduction of TC cells,clearance of the infection was achieved. This was the result of ahigher bacterial load during the initiation of the response (causedby a lack of TC cells) and a stronger T cell response induced byincreased Ag load in the system. This outcome was recapitulatedby removing Th1 cells from the intact system for the first 100 daysand then adding them back; this scenario also led to clearance dueto higher total bacterial numbers (and Ag) during the primingphase of the response. These results confirm the importance of theTC subset in the control of infection but also suggest that a higheramount of Ag (perhaps more bacteria) in the system initially mightlead to a stronger response and better protection against disease.The results further suggest that the low ID50 of Mtb may serve asa key virulence strategy.
The updated model lends itself to the study of mechanisms ofvaccine-induced protection. Vaccine development for TB has beenmostly empirical because little is known about the protectivemechanisms for this disease, and there are no useful surrogatemarkers of protection. In this work, we sought to define the re-quirements for protective vaccination against Mtb infection basedon a T cell-mediated immune response. The model allows one tocreate scenarios that are impossible in animal models or humansystems to elucidate key elements of protection. We identified theminimum level of memory TH1, T8, or TC cells that would benecessary to obtain clearance of a challenge infection. For Th1alone or TC alone (with a small number of Th1 cells), effectormemory populations at levels of �10% of the peak values (�200days in the latency scenario) would need to be maintained in thelungs to offer protection. In contrast, enormous numbers of mem-ory T8 cells (75% of peak initial expansion) would need to bepresent in the lungs at time of challenge to lead to clearance. Acombination of moderate levels of memory Th1 and TC cells weremuch more effective in achieving protection against challenge. Inthis situation, the minimum memory T cell percentages were 4 and2%, respectively, of normal infection peak values, and no T8 cellswere required. It is important to keep in mind that this may be truefor infection with Mtb but that different levels of each of the threesubsets may be necessary for control of different pathogens (80).These results strongly support the belief that vaccination strategiestargeting both CD4� and CD8� T cells are likely to be most ef-fective against Mtb infection.
We also determined that it is crucial that the memory T cells bepresent in the lungs at the time of infection (or shortly thereafter).If memory cells arrived in the lungs by 1 day postchallenge, thevaccination was effective. However, if cells arrived even by 3 dayspostchallenge, the vaccination was ineffective at clearing bacterialload but served to delay time to latency. There has been extensive
4309The Journal of Immunology
mathematical modeling exploring the generation of CD8� T cellimmune memory (81). In our present work we have assumed thatmemory cells were already generated by a vaccine and only testeddifferences between numbers of cells in each subset present. Futurework could include the generation as well as maintenance of mem-ory T cell subsets for both CD4� and CD8� T cells directly intothis model.
The current model incorporates IFN-�-induced apoptosis of Th1and CD8� T cells (both subsets) by activated macrophages andindicates that disease is always accompanied by a delayed Th1 andCTL response due to this activity. We also conclude that vigorousinternalization of bacteria (macrophage infection rate) is impera-tive to infection control. Taken together, these two hypotheses pro-vide a possible explanation of disease outcome, i.e., any mecha-nism that increases extracellular bacterial turnover beyond acritical point results in an enhanced infected and activated macro-phage response. The augmented macrophage response feeds backand results in an excessive killing of Th1 and CTL cells that, inturn, further exacerbates infection. This cycle continues until bac-terial load is high enough to overwhelm the system. That event ischaracterized by a decline in activated macrophage numbers and asimultaneous rise in Th1 and CD8� T cell numbers to saturablelevels. Evidently, extracellular bacterial turnover, macrophage ac-tivation, and T cell killing need to be tightly regulated to achievecontrol over infection.
The model, despite being updated from previous work, is stilllimited by several assumptions. Some suppositions of the earliermodel (15) still hold for the current model, including whetherbronchoalveolar lavage is a valid site for deriving experimentalnumbers for TB (for human data) and whether we model Ag pre-sentation at the site of infection in the lungs instead of the lymphnodes. More importantly, although the model emulates diseaseprogression in primate studies, parameter values include a hybridof primate and mouse data. Results match well qualitatively withexperimental outcomes, and we do observe quantitative differencesin some cases. A key strength of the model, however, remains thatparameter values can be easily updated when data are availablewhile still providing important qualitative results.
In summary, the results from the updated and inclusive mathe-matical model provide the opportunity to address challenging andinteresting questions regarding the immune response to Mtb. Theseresults can guide vaccine development, provide data on basic im-munologic mechanisms in the lung, and open up new avenues ofstudy for experimentalists. In this context, the model can be usedto test existing hypotheses as well as identify new factors for studyin animal models and humans with tuberculosis.
AppendixModel equations
In this section, we present the equations comprising the updatedordinary differential equations model of immune system-Mtb dy-namics. The model simulates interactions between two bacterialsubpopulations, eight cell populations, and five cytokines. Equa-tions 7, 8, 9 and 10 are the new equations for T80, T8, TC, andTNF, respectively. Other equations are similar to those in the studyby Wigginton and Kirschner (15), with some minor modificationswhere we included the affects of these new variables as well asupdated biological information regarding IFN-�-inducedapoptosis.
Macrophage dynamics. The equations describing rates of changefor the macrophage subpopulations are given by Equations 1–3.
dMR
dt� srM � �4A(MA � w2M1)
� sr4B� F�
F� � f8I10 � s4b� � k2MR� BE
BE�c9�
� k3MR� I�
I� � f1I4 � s1�� BT � �F�
BT � �F� � c8�
� �MRMR (1)
dM1
dt� k2MR� BE
BE � c9� � k17M1� B1
2
B12 � �NM1
2�� k14AM1� �Tc � w3T1/MI
�Tc � w3T1/M1 � c4�
� k14BMI� F�
F��f9I10�s4B�
� k52MI� �Tc{T1/�T1 � cT1)} � w1T1/MI
(Tc{T1/�T1 � cT1)} � w1T1/M1 � c52�
� �MIMI (2)
dMA
dt� k3MR� I�
I� � f1I4 � s1�� BT � �F�
BT � �F� � c8�
� k4MA� I10
I10 � s8� � �MAMA (3)
The rate of change of resting macrophages (Equation 1) includes asource term (srM) and a natural death term (��MRMR). This isreasonable, because even in the absence of infection, macrophagesundergo constant turnover to maintain an equilibrium value, givenby MR � srM/�MR (negative control). In the course of infection,additional resting macrophages are recruited in a TNF-dependentfashion (33) at a rate of sr4B, and this process is inhibited by IL-10(88). We also account for the recruitment of macrophages due toTNF-independent mechanisms such as chemokines secreted pri-marily by activated and infected macrophages (33) at rates of �4A
and w2*�4A (0 � w2 � 1), respectively.Resting macrophages at the site of infection can become chron-
ically infected at a maximum rate of k2, which is dependent on thelevel of infection characterized by the extracellular bacterial load.Macrophages are activated at rate of k3, which is dependent on twosignals: the primary from IFN-�, and the second either by bacteriaor TNF (89). Note that because of the difference in measurementunits, TNF is scaled by a factor �. IFN-�-induced activation isinhibited by IL-4.
Infected macrophages (Equation 2) can be cleared by one ofseveral different mechanisms. Given an average maximal intracel-lular bacterial carrying capacity of N, we assume that one-half ofthe infected macrophages burst when the intracellular bacterialload reaches NMI. This mechanism has a maximal rate of k17 andis described by a Hill process. Immune responses also contribute toinfected macrophage killing by several mechanisms. Both CD8�
and CD4� T cells can use the Fas-FasL apoptotic pathway to in-duce apoptosis in these cells at a maximum rate of k14A. The half-saturation constant c4 describes the effector-target ratio (Ttotal:MI)at which this process is half-maximal. TNF can also induce apo-ptosis by binding to the 55-kDa TNF-receptor (90). This process isdown-regulated by IL-10 and occurs at a rate of k14B. Finally, CTLkilling by CD8� and CD4� T cells happens at a rate of k52. Spe-cifically, CD4� T cells have a limited contribution, and this is
4310 ROLE OF CD8� T CELLS IN CONTROLLING TUBERCULOSIS INFECTION
accounted for by scaling the CD4� T cell numbers (0 � w1 � 1).CD8� T cell numbers are scaled by a term accounting for theirindirect dependence on CD4� T cells for effector capability (10).
Activated macrophages are generated from the term in Equation1 and also undergo natural death at a rate proportional to theirnumber (��MAMA). Activated macrophages can be deactivated(or lose activation status) by IL-10 (91) at a rate of k4.
T cell dynamics. The equations for T cell dynamics are given byEquations 4–9.
dT0
dt� �1A(MA � w2M1)
� sr1B� F�
F� � f8I10 � s4b2� � �2T0� MA
MA � c15�
� k6I12T0� I�
I�� f1I4 � f7I10 � s1� � k7T0� I4
I4 � f2I� � s2�
� �T0T0 (4)
dT1
dt� �3A(MA � w2MI) � sr3B� F�
F� � f8I10 � s4b1�
� k6I12T0� I�
I� � � f1I4 � f7I10 � s1�
� �T�� I�
I� � c�T1MA � �T1T1 (5)
dT2
dt� �3A2(MA � w2MI) � sr3B2� F�
F� � f8I10 � s4b1�
� k7T0� I4
I4 � f2I� � s2� � �T2T2 (6)
dT80
dt� �1A(MA � wM1)
� sr1B� F�
F� � f8I10 � s4b2� � �2T80� MA
MA � c15�
� k6I12T80� I�
I�� f1I4 � f7I10 � s1� � �T80T80 (7)
dT8
dt� m * �3Ac(MA � w2MI) � m * sr3Bc� F�
F� � f8I10 � s4b1�
� m * k6I12T80� I�
I�� f1I4 � f7I10 � s1�
� �Tc�� I�
I� � cc�T8MA� �T8T8 (8)
dTc
dt� m * �3Ac(MA � w2MI) � m * sr3Bc� F�
F� � f8I10 � s4b1�
� m * k6I12T80� I�
I�� f1I4 � f7I10 � s1�
� �Tc�� I�
I� � cc�TcMA � �TcTc (9)
Similar to resting macrophages, recruitment of T cells is bothTNF-independent and TNF-dependent (33). The terms are similar,using different rates for the different T cell subsets (�1A, sr1B forTh0 and T80 cells; �3A, sr3B for Th1 and Th2 cells; and �3AC,
sr3BC for CD8� T cells; respectively). We assume that CD4� Tcells can arrive at the site of infection either as Th0 (majority) orthat a small fraction may arrive already differentiated into Th1 orTh2 cells (see Ref. 15 for a complete discussion).
Upon arriving at the site of infection, Th0 cells (Equation 4) canproliferate further in response to signals released by activated mac-rophages at a rate �2. Th0 cells can also differentiate into Th1(Equation 5) and Th2 (Equation 6) cells. Th1 differentiation iscontrolled by IL-12 and IFN-� and opposed by IL-4 and IL-10.Th2 differentiation is induced by IL-4 and inhibited by IFN-�. Th0cells undergo natural death at a rate of ��T0T0). Th1 cells can bekilled due to IFN-�-induced apoptosis in the presence of activatedmacrophages (37–39) at a rate of �T�. Both Th1 and Th2 cells dienaturally at rates �T1 and �T2, respectively.
As is the case for CD4� T cells, we assume that CD8� T cellscan arrive at the site of infection either as T80 (majority) (Equation7) or that a small fraction may arrive already differentiated intoeffector cells of either T8 (Equation 8) or TC (Equation 9) type.T80 cells are activated due to interaction with Th1 cells and cy-tokines and have a natural half-life.
CD8� T cells also undergo IFN-� induced apoptosis at a peakrate of �Tc� and die at a rate of �Tc. Because the T8 cells (Equation8) and Tc cells (Equation 9) are functional subsets of the CD8� Tcell population (see Introduction), the equations are identical forboth. We introduce a parameter m that accounts for possible over-lap between T8 and TC subsets. Although studies directly assess-ing cytotoxic capacity and IFN-� production in the same cells arerelatively rare, studies have indicated that perforin expression (orcytotoxic function) and IFN-� expression can occur in the samecell (30–32). Thus, we allow for a small overlap (10%) here of celltypes that perform both functions; hence the value of m is 60%.This assumption is studied further in the paragraph entitled Role ofCD8� T cells in Materials and Methods.
TNF (Equation 10) is produced primarily by infected macrophages(33) at a rate of �30. Activated macrophages secrete TNF at a rate
4311The Journal of Immunology
of �31 in response to IFN-� or bacteria, and this process is inhib-ited by IL-4. Other sources of TNF are Th1 cells (rate of �32) andCD8� T cells (rate of �33) (92), and TNF has a given half-life.
IFN-� (Equation 11) is produced by Th0, Th1, and CD8� Tcells in response to Ag presentation by activated macrophages (30)at rates of �5A and �5B, respectively. Production by Th0 and T80cells is further enhanced by IL-12 and inhibited by IL-10. Othersources of IFN-�, such as NK and NKT cells, are also believed toplay a role in TB infection (24, 93, 94). Because these sources arenot accounted for in the model, we include an extra source term(sg) dependent on the extent of infection and the IL-12 level. Fu-ture work will include these cells to test the roles of NK and NKTcells in the dynamics of TB infection, both as IFN-� producers andcytotoxic cells.
IL-12 (Equation 12) is produced by resting macrophages at arate of �23 in response to infection (95). Activated macrophagesalso produce IL-12, and this process is inhibited by IL-10 (95).Dendritic cells are the primary source of IL-12 upon Mtb infection(95) and are accounted for by an infection-dependent source term,s12. Finally, there is a natural half-life for IL-12.
IL-10 (Equation 13) is produced mostly by activated macro-phages (95), and this process is opposed by IFN-� and IL-10 itselfat a rate of �7. Other sources such as Th1 cells, Th2 cells, andCD8� T cells produce IL-10 at rates of �16, �17, and �18,respectively.
IL-4 (Equation 14) is produced by Th0 cells at a rate of �11, andTh2 cells at rate of �12. IL-4 has a given half-life of �i4.
Bacterial dynamics. Equations 15 and 16 illustrate bacterial dy-namics.
dBI
dt� �19BI�1 �
BI2
BI2 � �NMI
2� � k2�N
2�MR� BE
BE � c9�
� k17NMI� BI2
BI2 � �NMI
2�� k14ANMI� �TC � w3TI / MI
�TC � w3TI / MI � c4�
� k14BNMI� F�
F� � f8I10 � S4b�
� k52NMI� �TCTI / �TI � cTI� � wITI / MI
�TCT1 / �T1 � cTI� � wITI / MI � c52� � �IBI
(15)
dBE
dt� �20BE � �IBI � k15MABE � k18MRBE
� k17NMI� BI2
BI2 � �NMI
2� � k2�N
2�MR� BE
BE � c9�
� k14AN * NfraccMI� �TC � w3TI / MI
�TC � w3T1 / MI � c4�
� k14BN * NfracaMI� F�
F� � f9I10 � s4b� (16)
Intracellular bacteria (Equation 15) grow at a maximal rate of �19
with logistic Hill kinetics accounting for a maximal carrying ca-pacity of a macrophage. Extracellular bacteria (Equation 16) be-come intracellular when a macrophage becomes chronically in-fected at an assumed threshold of N/2 bacteria, and, hence, thisrepresents a gain term for the intracellular bacteria. Bursting of
macrophages (k17) adds to the extracellular subpopulation. Intra-cellular bacteria are lost in various proportions due to differentkilling mechanisms. A corresponding gain in extracellular bacteriadepends on the mechanism of killing. Whereas Fas-FasL-inducedapoptosis (k14A) releases all intracellular bacteria (N) (26), TNF-induced apoptosis (k14B) eliminates �50% of the bacteria withinthe macrophage (90, 96), and this is shown by the Nfraca multiplierin the BE equation. CTL activity (k52) kills virtually all of theintracellular bacteria (Nfracc) due to granulysin action (26) anddoes not add to the BE population. Lastly, we assume that naturaldeath of infected macrophages also releases all intracellular bac-teria, and this assumption is modeled as a constant turnover of thebacteria (�IBI) from intracellular to extracellular.
Extracellular bacteria grow at a maximum rate of �20. They aretaken up and killed by activated and resting macrophages at ratesof k15 and k18, respectively.
Parameter estimation
Before simulations can be performed, parameters must be esti-mated from data or by mathematical means. Values for most modelparameters are estimated from published experimental data or datagenerated by our group. Data from human studies and Mtb exper-iments are favored over mice and other mycobacterial species,respectively. We also use nonhuman primate data where available.Where no appropriate data are available for a given parameter, weconduct uncertainty analysis to obtain a range within orders ofmagnitude.
A detailed description of techniques used to evaluate model pa-rameters, as well as a listing of parameters already estimated, canbe found in work previously published by our group (15). Allparameters newly estimated for the purpose of this work are listedin Table III and have been estimated using approaches similar tothose described (15).
AcknowledgmentsWe are grateful to Dr. Vanja Lazarevic for providing data on CD8� T cellfunction in the mouse. We thank Drs. John Chan and Simeone Marino forhelpful discussions. We also thank Dr. Brian Murphy and Dongxiao Zhufor early efforts on this project.
DisclosuresThe authors have no financial conflict of interest.
References1. Comstock, G. W. 1982. Epidemiology of tuberculosis. Am. Rev. Respir. Dis. 125:
8–15.2. Flynn, J. L., and J. Chan. 2001. Immunology of tuberculosis. Annu. Rev. Immu-
nol. 19: 93–129.3. Manabe, Y. C., and W. R. Bishai. 2000. Latent Mycobacterium tuberculosis:
persistence, patience, and winning by waiting. Nat. Med. 6: 1327–1329.4. Flynn, J. L., J. Chan, K. J. Triebold, D. K. Dalton, T. A. Stewart, and
B. R. Bloom. 1993. An essential role for interferon � in resistance to Mycobac-terium tuberculosis infection. J. Exp. Med. 178: 2249–2254.
5. Cooper, A. M., D. K. Dalton, T. A. Stewart, J. P. Griffen, D. G. Russell, andI. M. Orme. 1993. Disseminated tuberculosis in IFN-� gene-disrupted mice.J. Exp. Med. 178: 2243–2248.
6. Flynn, J. L., M. M. Goldstein, J. Chan, K. J. Triebold, K. Pfeffer,C. J. Lowenstein, R. Schreiber, T. W. Mak, and B. R. Bloom. 1995. Tumornecrosis factor-� is required in the protective immune response against Myco-bacterium tuberculosis in mice. Immunity 2: 561–572.
7. Bean, A. G., D. R. Roach, H. Briscoe, M. P. France, H. Korner, J. D. Sedgwick,and W. J. Britton. 1999. Structural deficiencies in granuloma formation in TNFgene-targeted mice underlie the heightened susceptibility to aerosol Mycobacte-rium tuberculosis infection, which is not compensated for by lymphotoxin. J. Im-munol. 162: 3504–3511.
8. Botha, T., and B. Ryffel. 2003. Reactivation of latent tuberculosis infection inTNF-deficient mice. J. Immunol. 171: 3110–3118.
9. Serbina, N. V., and J. L. Flynn. 2001. CD8(�) T cells participate in the memoryimmune response to Mycobacterium tuberculosis. Infect. Immun. 69:4320–4328.
4312 ROLE OF CD8� T CELLS IN CONTROLLING TUBERCULOSIS INFECTION
10. Serbina, N. V., V. Lazarevic, and J. L. Flynn. 2001. CD4(�) T cells are requiredfor the development of cytotoxic CD8(�) T cells during Mycobacterium tuber-culosis infection. J. Immunol. 167: 6991–7000.
11. Murray, P. J., and R. A. Young. 1999. Increased antimycobacterial immunity ininterleukin-10-deficient mice. Infect. Immun. 67: 3087–3095.
12. Mogues, T., M. E. Goodrich, L. Ryan, R. LaCourse, and R. J. North. 2001. Therelative importance of T cell subsets in immunity and immunopathology of air-borne Mycobacterium tuberculosis infection in mice. J. Exp. Med. 193: 271–280.
13. Marino, S., and D. E. Kirschner. 2004. The human immune response to Myco-bacterium tuberculosis in lung and lymph node. J. Theor. Biol. 227: 463–486.
14. Marino, S., S. Pawar, C. L. Fuller, T. A. Reinhart, J. L. Flynn, andD. E. Kirschner. 2004. Dendritic cell trafficking and antigen presentation in thehuman immune response to Mycobacterium tuberculosis. J. Immunol. 173:494–506.
15. Wigginton, J. E., and D. Kirschner. 2001. A model to predict cell-mediated im-mune regulatory mechanisms during human infection with Mycobacterium tu-berculosis. J. Immunol. 166: 1951–1967.
16. Algood, H. M., J. Chan, and J. L. Flynn. 2003. Chemokines and tuberculosis.Cytokine Growth Factor Rev. 14: 467–477.
17. Bemelmans, M. H., L. J. van Tits, and W. A. Buurman. 1996. Tumor necrosisfactor: function, release, and clearance. Crit. Rev. Immunol. 16: 1–11.
18. Brookes, R. H., A. A. Pathan, H. McShane, M. Hensmann, D. A. Price, andA. V. Hill. 2003. CD8� T cell-mediated suppression of intracellular Mycobac-terium tuberculosis growth in activated human macrophages. Eur. J. Immunol.33: 3293–3302.
19. Canaday, D. H., R. J. Wilkinson, Q. Li, C. V. Harding, R. F. Silver, andW. H. Boom. 2001. CD4(�) and CD8(�) T cells kill intracellular Mycobacte-rium tuberculosis by a perforin and Fas/Fas ligand-independent mechanism.J. Immunol. 167: 2734–2742.
20. Flynn, J. L., M. M. Goldstein, K. J. Triebold, B. Koller, and B. R. Bloom. 1992.Major histocompatibility complex class I-restricted T cells are required for re-sistance to Mycobacterium tuberculosis infection. Proc. Natl. Acad. Sci. USA 89:12013–12017.
21. Harty, J. T., A. R. Tvinnereim, and D. W. White. 2000. CD8� T cell effectormechanisms in resistance to infection. Annu. Rev. Immunol. 18: 275–308.
22. Lazarevic, V., and J. Flynn. 2002. CD8� T cells in tuberculosis. Am. J. Respir.Crit. Care Med. 166: 1116–1121.
23. Pathan, A. A., K. A. Wilkinson, R. J. Wilkinson, M. Latif, H. McShane,G. Pasvol, A. V. Hill, and A. Lalvani. 2000. High frequencies of circulatingIFN-�-secreting CD8 cytotoxic T cells specific for a novel MHC class I-restrictedMycobacterium tuberculosis epitope in M. tuberculosis-infected subjects withoutdisease. Eur. J. Immunol. 30: 2713–2721.
24. Vankayalapati, R., P. Klucar, B. Wizel, S. E. Weis, B. Samten, H. Safi, H. Shams,and P. F. Barnes. 2004. NK cells regulate CD8� T cell effector function inresponse to an intracellular pathogen. J. Immunol. 172: 130–137.
25. Kamath, A. B., J. Woodworth, X. Xiong, C. Taylor, Y. Weng, and S. M. Behar.2004. Cytolytic CD8� T cells recognizing CFP10 are recruited to the lung afterMycobacterium tuberculosis infection. J. Exp. Med. 200: 1479–1489.
26. Stenger, S., R. Mazzaccaro, K. Uyemura, S. Cho, P. Barnes, J. Rosat, A. Sette,M. Brenner, S. Porcelli, B. Bloom, and R. Modlin. 1997. Differential effects ofcytolytic T cell subsets on intracellular infection. Science 276: 1684–1687.
27. Stenger, S., D. A. Hanson, R. Teitelbaum, P. Dewan, K. R. Niazi, C. J. Froelich,T. Ganz, S. Thoma-Uszynski, A. Melian, C. Bogdan, et al. 1998. An antimicro-bial activity of cytolytic T cells mediated by granulysin. Science 282: 121–125.
28. Lalvani, A., R. Brookes, R. J. Wilkinson, A. S. Malin, A. A. Pathan, P. Andersen,H. Dockrell, G. Pasvol, and A. V. Hill. 1998. Human cytolytic and interferon�-secreting CD8� T lymphocytes specific for Mycobacterium tuberculosis. Proc.Natl. Acad. Sci. USA 95: 270–275.
29. Li, L., S. Sad, D. Kagi, and T. R. Mosmann. 1997. CD8Tc1 and Tc2 cells secretedistinct cytokine patterns in vitro and in vivo but induce similar inflammatoryreactions. J. Immunol. 158: 4152–4161.
30. Lazarevic, V., D. Nolt, and J. L. Flynn. 2005. Long-term control of Mycobacte-rium tuberculosis infection is mediated by dynamic immune responses. J. Im-munol. 175: 1107–1117.
31. Sad, S., D. Kagi, and T. R. Mosmann. 1996. Perforin and Fas killing by CD8�
T cells limits their cytokine synthesis and proliferation. J. Exp. Med. 184:1543–1547.
32. Valitutti, S., S. Muller, M. Dessing, and A. Lanzavecchia. 1996. Different re-sponses are elicited in cytotoxic T lymphocytes by different levels of T cellreceptor occupancy. J. Exp. Med. 153: 1917–1921.
33. Algood, H. M., P. L. Lin, D. Yankura, A. Jones, J. Chan, and J. L. Flynn. 2004.TNF influences chemokine expression of macrophages in vitro and that ofCD11b� cells in vivo during Mycobacterium tuberculosis infection. J. Immunol.172: 6846–6857.
34. Liu, W., and D. A. Saint. 2002. Validation of a quantitative method for real timePCR kinetics. Biochem. Biophys. Res. Commun. 294: 347–353.
35. Mosmann, T. 1983. Rapid colorimetric assay for cellular growth and survival:application to proliferation and cytotoxicity assays. J. Immunol. Methods 65:55–63.
36. Eskandari, M. K., D. T. Nguyen, S. L. Kunkel, and D. G. Remick. 1990. WEHI164 subclone 13 assay for TNF: sensitivity, specificity, and reliability. Immunol.Invest. 19: 69–79.
37. Dalton, D. K., L. Haynes, C. Q. Chu, S. L. Swain, and S. Wittmer. 2000. Inter-feron � eliminates responding CD4 T cells during mycobacterial infection byinducing apoptosis of activated CD4 T cells. J. Exp. Med. 192: 117–122.
38. Roger, P. M., and L. E. Bermudez. 2001. Infection of mice with Mycobacteriumavium primes CD8� lymphocytes for apoptosis upon exposure to macrophages.Clin. Immunol. 99: 378–386.
39. Fayyazi, A., B. Eichmeyer, A. Soruri, S. Schweyer, J. Herms, P. Schwarz, andH. J. Radzun. 2000. Apoptosis of macrophages and T cells in tuberculosis-asso-ciated caseous necrosis. J. Pathol. 191: 417–425.
40. Caruso, A. M., N. Serbina, E. Klein, K. Triebold, B. R. Bloom, and J. L. Flynn.1999. Mice deficient in CD4 T cells have only transiently diminished levels ofIFN-�, yet succumb to tuberculosis. J. Immunol. 162: 5407–5416.
41. Sanchez, M. A., and S. M. Blower. 1997. Uncertainty and sensitivity analysis ofthe basic reproductive rate: tuberculosis as an example. Am. J. Epidemiol. 145:1127–1137.
42. Helton, J. C., and F. J. Davis. 2002. Illustration of sampling-based methods foruncertainty and sensitivity analysis. Risk Anal. 22: 591–622.
43. Zhang, M., Y. Lin, D. V. Iyer, J. Gong, J. S. Abrams, and P. F. Barnes. 1995.T-cell cytokine responses in human infection with Mycobacterium tuberculosis.Infect. Immun. 63: 3231–3234.
44. van Crevel, R., E. Karyadi, F. Preyers, M. Leenders, B. J. Kullberg,R. H. Nelwan, and J. W. van der Meer. 2000. Increased production of interleukin4 by CD4� and CD8� T cells from patients with tuberculosis is related to thepresence of pulmonary cavities. J. Infect. Dis. 181: 1194–1197.
45. Tsao, T. C., C. H. Chen, J. H. Hong, M. J. Hsieh, K. C. Tsao, and C. H. Lee. 2002.Shifts of T4/T8 T lymphocytes from BAL fluid and peripheral blood by clinicalgrade in patients with pulmonary tuberculosis. Chest 122: 1285–1291.
46. Tsao, T. C., J. Hong, C. Huang, P. Yang, S. K. Liao, and K. S. Chang. 1999.Increased TNF-�, IL-1 � and IL-6 levels in the bronchoalveolar lavage fluid withthe up-regulation of their mRNA in macrophages lavaged from patients withactive pulmonary tuberculosis. Tuber Lung Dis. 79: 279–285.
47. Pereira, C. B., M. Palaci, O. H. Leite, A. J. Duarte, and G. Benard. 2004. Mono-cyte cytokine secretion in patients with pulmonary tuberculosis differs from thatof healthy infected subjects and correlates with clinical manifestations. MicrobesInfect 6: 25–33.
48. Morikawa, F., A. Nakano, H. Nakano, F. Oseko, and S. Morikawa. 1989. En-hanced natural killer cell activity in patients with pulmonary tuberculosis. Jpn.J. Med. 28: 316–322.
49. Capuano, S. V. III, D. A. Croix, S. Pawar, A. Zinovik, A. Myers, P. L. Lin,S. Bissel, C. Fuhrman, E. Klein, and J. L. Flynn. 2003. Experimental Mycobac-terium tuberculosis infection of cynomolgus macaques closely resembles the var-ious manifestations of human M. tuberculosis infection. Infect. Immun. 71:5831–5844.
50. Silver, R. F., Q. Li, W. H. Boom, and J. J. Ellner. 1998. Lymphocyte-dependentinhibition of growth of virulent Mycobacterium tuberculosis H37Rv within hu-man monocytes: requirement for CD4� T cells in purified protein derivative-positive, but not in purified protein derivative-negative subjects. J. Immunol. 160:2408–2417.
51. Silver, R. F., Q. Li, and J. J. Ellner. 1998. Expression of virulence of Mycobac-terium tuberculosis within human monocytes: virulence correlates with intracel-lular growth and induction of tumor necrosis factor � but not with evasion oflymphocyte-dependent monocyte effector functions. Infect. Immun. 66:1190–1199.
52. Rojas, M., L. F. Barrera, G. Puzo, and L. F. Garcia. 1997. Differential inductionof apoptosis by virulent Mycobacterium tuberculosis in resistant and susceptiblemurine macrophages: role of nitric oxide and mycobacterial products. J. Immu-nol. 159: 1352–1361.
53. Wong, C. F., W. W. Yew, S. K. Leung, C. Y. Chan, M. Hui, C. Au-Yeang, andA. F. Cheng. 2003. Assay of pleural fluid interleukin-6, tumour necrosis factor-�and interferon-� in the diagnosis and outcome correlation of tuberculous effusion.Respir. Med. 97: 1289–1295.
54. Lin, Y., M. Zhang, F. M. Hofman, J. Gong, and P. F. Barnes. 1996. Absence ofa prominent Th2 cytokine response in human tuberculosis. Infect. Immun. 64:1351–1356.
55. Fenhalls, G., A. Wong, J. Bezuidenhout, P. van Helden, P. Bardin, andP. T. Lukey. 2000. In situ production of � interferon, interleukin-4, and tumornecrosis factor � mRNA in human lung tuberculous granulomas. Infect. Immun.68: 2827–2836.
56. Dannenberg, A. M., Jr. 2003. Macrophage turnover, division and activationwithin developing, peak and “healed” tuberculous lesions produced in rabbits byBCG. Tuberculosis (Edinb.) 83: 251–260.
57. Badovinac, V. P., K. A. Messingham, S. E. Hamilton, and J. T. Harty. 2003.Regulation of CD8� T cells undergoing primary and secondary responses toinfection in the same host. J. Immunol. 170: 4933–4942.
58. Hirsch, C. S., Z. Toossi, G. Vanham, J. L. Johnson, P. Peters, A. Okwera,R. Mugerwa, P. Mugyenyi, and J. J. Ellner. 1999. Apoptosis and T cell hypore-sponsiveness in pulmonary tuberculosis. J. Infect. Dis. 179: 945–953.
59. Law, K., M. Weiden, T. Harkin, K. Tchou-Wong, C. Chi, and W. N. Rom. 1996.Increased release of interleukin-1 �, interleukin-6, and tumor necrosis factor-� bybronchoalveolar cells lavaged from involved sites in pulmonary tuberculosis.Am. J. Respir. Crit. Care Med. 153: 799–804.
60. Casarini, M., F. Ameglio, L. Alemanno, P. Zangrilli, P. Mattia, G. Paone,A. Bisetti, and S. Giosue. 1999. Cytokine levels correlate with a radiologic scorein active pulmonary tuberculosis. Am. J. Respir. Crit. Care Med. 159: 143–148.
61. Scott, H. M., and J. L. Flynn. 2002. Mycobacterium tuberculosis in chemokinereceptor 2-deficient mice: influence of dose on disease progression. Infect. Im-mun. 70: 5946–5954.
62. Zhang, M., J. Gong, Y. Lin, and P. F. Barnes. 1998. Growth of virulent andavirulent Mycobacterium tuberculosis strains in human macrophages. Infect. Im-mun. 66: 794–799.
4313The Journal of Immunology
63. Tsenova, L., E. Ellison, R. Harbacheuski, A. L. Moreira, N. Kurepina,M. B. Reed, B. Mathema, C. E. Barry III, and G. Kaplan. 2005. Virulence ofselected Mycobacterium tuberculosis clinical isolates in the rabbit model of men-ingitis is dependent on phenolic glycolipid produced by the bacilli. J. Infect. Dis.192: 98–106.
64. Reed, M. B., P. Domenech, C. Manca, H. Su, A. K. Barczak, B. N. Kreiswirth,G. Kaplan, and C. E. Barry III. 2004. A glycolipid of hypervirulent tuberculosisstrains that inhibits the innate immune response. Nature 431: 84–87.
65. Gammack, D., S. Ganguli, S. Marino, J. Segovia-Juarez, and D. E. Kirschner.2005. Understanding the immune response in tuberculosis using different math-ematical models and scales. Multiscale Model. Simul. 3: 312–345.
66. Dannenberg, A. M., Jr. 1991. Delayed-type hypersensitivity and cell-mediatedimmunity in the pathogenesis of tuberculosis. Immunol. Today 12: 228–233.
67. Shams, H., B. Wizel, S. E. Weis, B. Samten, and P. F. Barnes. 2001. Contributionof CD8(�) T cells to � interferon production in human tuberculosis. Infect. Im-mun. 69: 3497–3501.
68. Smith, S. M., and H. M. Dockrell. 2000. Role of CD8 T cells in mycobacterialinfections. Immunol. Cell Biol. 78: 325–333.
69. Cho, S., V. Mehra, S. Thoma-Uszynski, S. Stenger, N. Serbina, R. J. Mazzaccaro,J. L. Flynn, P. F. Barnes, S. Southwood, E. Celis, et al. Antimicrobial activity ofMHC class I-restricted CD8� T cells in human tuberculosis. Proc. Natl. Acad.Sci. USA 97: 12210–12215.
70. Mustafa, T., S. Phyu, R. Nilsen, G. Bjune, and R. Jonsson. 1999. Increasedexpression of Fas ligand on Mycobacterium tuberculosis-infected macrophages:a potential novel mechanism of immune evasion by Mycobacterium tuberculosis?Inflammation 23: 507–521.
71. Kendrick, M. A., and G. W. Comstock. 1981. BCG vaccination and the subse-quent development of cancer in humans. J. Natl. Cancer Inst. 66: 431–437.
72. Scanga, C. A., V. P. Mohan, K. Yu, H. Joseph, K. Tanaka, J. Chan, andJ. L. Flynn. 2000. Depletion of CD4� T cells causes reactivation of murinepersistent tuberculosis despite continued expression of IFN-� and NOS2. J. Exp.Med. 192: 347–358.
73. Tascon, R. E., E. Stavropoulos, K. V. Lukacs, and M. J. Colston. 1998. Protectionagainst Mycobacterium tuberculosis infection by CD8 T cells requires productionof � interferon. Infect. Immun. 66: 830–834.
74. Cooper, A. M., J. Magram, J. Ferrante, and I. M. Orme. 1997. Interleukin 12(IL-12) is crucial to the development of protective immunity in mice intrave-nously infected with Mycobacterium tuberculosis. J. Exp. Med. 186: 39–45.
75. Mohan, V. P., C. A. Scanga, K. Yu, H. M. Scott, K. E. Tanaka, E. Tsang,M. M. Tsai, J. L. Flynn, and J. Chan. 2001. Effects of tumor necrosis factor � onhost immune response in chronic persistent tuberculosis: possible role for limitingpathology. Infect. Immun. 69: 1847–1855.
76. Feng, C. G., D. Jankovic, M. Kullberg, A. Cheever, C. A. Scanga, S. Hieny,P. Caspar, G. S. Yap, and A. Sher. 2005. Maintenance of pulmonary Th1 effectorfunction in chronic tuberculosis requires persistent IL-12 production. J. Immunol.174: 4185–4192.
77. van Pinxteren, L. A. H., J. P. Cassidy, B. H. C. Smedegaard, E. M. Agger, andP. Andersen. 2000. Control of latent Mycobacterium tuberculosis infection isdependent on CD8 T cells. Eur. J. Immunol. 30: 3689–3698.
78. Behar, S. M., C. C. Dascher, M. J. Grusby, C. R. Wang, and M. B. Brenner. 1999.Susceptibility of mice deficient in CD1D or TAP1 to infection with Mycobacte-rium tuberculosis. J. Exp. Med. 189: 1973–1980.
79. Laochumroonvorapong, P., J. Wang, C. C. Liu, W. Ye, A. L. Moreira,K. B. Elkon, V. H. Freedman, and G. Kaplan. 1997. Perforin, a cytotoxic mol-ecule which mediates cell necrosis, is not required for the early control of my-cobacterial infection in mice. Infect. Immun. 65: 127–132.
80. Kaech, S. M., E. J. Wherry, and R. Ahmed. 2002. Effector and memory T-celldifferentiation: implications for vaccine development. Nat. Rev. Immunol. 2:251–262.
81. Antia, R., V. V. Ganusov, and R. Ahmed. 2005. The role of models in under-standing CD8� T-cell memory. Nat. Rev. Immunol. 5: 101–111.
82. Pace, E., M. Gjomarkaj, M. Melis, M. Profita, M. Spatafora, A. M. Vignola,G. Bonsignore, and C. H. Mody. 1999. Interleukin-8 induces lymphocyte che-motaxis into the pleural space: role of pleural macrophages. Am. J. Respir. Crit.Care Med. 159: 1592–1599.
83. Tsukaguchi, K., B. de Lange, and W. H. Boom. 1999. Differential regulation ofIFN-�, TNF-�, and IL-10 production by CD4(�) �� TCR� T cells and V�2(�)�� T cells in response to monocytes infected with Mycobacterium tuberculosis-H37Ra. Cell Immunol. 194: 12–20.
84. Rojas, M., M. Olivier, P. Gros, L. F. Barrera, and L. F. Garcia. 1999. TNF-� andIL-10 modulate the induction of apoptosis by virulent Mycobacterium tubercu-losis in murine macrophages. J. Immunol. 162: 6122–6131.
85. Gilbertson, B., J. Zhong, and C. Cheers. 1999. Anergy, IFN-� production, andapoptosis in terminal infection of mice with Mycobacterium avium. J. Immunol.163: 2073–2080.
86. Oddo, M., T. Renno, A. Attinger, T. Bakker, H. R. MacDonald, andP. R. Meylan. 1998. Fas ligand-induced apoptosis of infected human macro-phages reduces the viability of intracellular Mycobacterium tuberculosis. J. Im-munol. 160: 5448–5454.
87. Denys, A., I. A. Udalova, C. Smith, L. M. Williams, C. J. Ciesielski, J. Campbell,C. Andrews, D. Kwaitkowski, and B. M. Foxwell. 2002. Evidence for a dualmechanism for IL-10 suppression of TNF-� production that does not involveinhibition of p38 mitogen-activated protein kinase or NF-B in primary humanmacrophages. J. Immunol. 168: 4837–4845.
88. D’Amico, G., G. Frascaroli, G. Bianchi, P. Transidico, A. Doni, A. Vecchi,S. Sozzani, P. Allavena, and A. Mantovani. 2000. Uncoupling of inflammatorychemokine receptors by IL-10: generation of functional decoys. Nat. Immunol. 1:387–391.
89. Flynn, J. L., and J. Chan. 2001. Tuberculosis: latency and reactivation. Infect.Immun. 69: 4195–4201.
90. Keane, J., H. G. Remold, and H. Kornfeld. 2000. Virulent Mycobacterium tu-berculosis strains evade apoptosis of infected alveolar macrophages. J. Immunol.164: 2016–2020.
91. Bogdan, C., Y. Vodovotz, and C. Nathan. 1991. Macrophage deactivation byinterleukin 10. J. Exp. Med. 174: 1549.
92. Serbina, N. V., and J. L. Flynn. 1999. Early emergence of CD8(�) T cells primedfor production of type 1 cytokines in the lungs of Mycobacterium tuberculosis-infected mice. Infect. Immun. 67: 3980–3988.
93. Chackerian, A., J. Alt, V. Perera, and S. M. Behar. 2002. Activation of NKT cellsprotects mice from tuberculosis. Infect. Immun. 70: 6302–6309.
94. Junqueira-Kipnis, A. P., A. Kipnis, A. Jamieson, M. G. Juarrero, A. Diefenbach,D. H. Raulet, J. Turner, and I. M. Orme. 2003. NK cells respond to pulmonaryinfection with Mycobacterium tuberculosis, but play a minimal role in protection.J. Immunol. 171: 6039–6045.
95. Hickman, S. P., J. Chan, and P. Salgame. 2002. Mycobacterium tuberculosisinduces differential cytokine production from dendritic cells and macrophageswith divergent effects on naive T cell polarization. J. Immunol. 168: 4636–4642.
96. Ciaramella, A., A. Cavone, M. B. Santucci, M. Amicosante, A. Martino,G. Auricchio, L. P. Pucillo, V. Colizzi, and M. Fraziano. 2002. Proinflammatorycytokines in the course of Mycobacterium tuberculosis-induced apoptosis inmonocytes/macrophages. J. Infect. Dis. 186: 1277–1282.
4314 ROLE OF CD8� T CELLS IN CONTROLLING TUBERCULOSIS INFECTION