Contribution of Efflux to the Emergence of Isoniazid and Multidrug Resistance in Mycobacterium tuberculosis Diana Machado 1 , Isabel Couto 1,2 , Joa ˜ o Perdiga ˜o 3 , Liliana Rodrigues 1 , Isabel Portugal 3 , Pedro Baptista 4 , Bruno Veigas 4 , Leonard Amaral 1,5 , Miguel Viveiros 1,5 * 1 Grupo de Micobacte ´rias, Unidade de Microbiologia Me ´dica, Instituto de Higiene e Medicina Tropical, Universidade Nova de Lisboa (IHMT/UNL), Lisboa, Portugal, 2 Centro de Recursos Microbiolo ´ gicos (CREM), Faculdade de Cie ˆ ncias e Tecnologia, Universidade Nova de Lisboa, Caparica, Portugal, 3 Centro de Patoge ´nese Molecular/ URIA, Faculdade de Farma ´cia, Universidade de Lisboa, Lisboa, Portugal, 4 CIGMH, Departamento de Cie ˆncias da Vida, Faculdade de Cie ˆncias e Tecnologia, Universidade Nova de Lisboa, Caparica, Portugal, 5 COST ACTION BM0701 (ATENS), Brusells, Belgium Abstract Multidrug resistant (MDR) tuberculosis is caused by Mycobacterium tuberculosis resistant to isoniazid and rifampicin, the two most effective drugs used in tuberculosis therapy. Here, we investigated the mechanism by which resistance towards isoniazid develops and how overexpression of efflux pumps favors accumulation of mutations in isoniazid targets, thus establishing a MDR phenotype. The study was based on the in vitro induction of an isoniazid resistant phenotype by prolonged serial exposure of M. tuberculosis strains to the critical concentration of isoniazid employed for determination of drug susceptibility testing in clinical isolates. Results show that susceptible and rifampicin monoresistant strains exposed to this concentration become resistant to isoniazid after three weeks; and that resistance observed for the majority of these strains could be reduced by means of efflux pumps inhibitors. RT-qPCR assessment of efflux pump genes expression showed overexpression of all tested genes. Enhanced real-time efflux of ethidium bromide, a common efflux pump substrate, was also observed, showing a clear relation between overexpression of the genes and increased efflux pump function. Further exposure to isoniazid resulted in the selection and stabilization of spontaneous mutations and deletions in the katG gene along with sustained increased efflux activity. Together, results demonstrate the relevance of efflux pumps as one of the factors of isoniazid resistance in M. tuberculosis. These results support the hypothesis that activity of efflux pumps allows the maintenance of an isoniazid resistant population in a sub-optimally treated patient from which isoniazid genetically resistant mutants emerge. Therefore, the use of inhibitors of efflux should be considered in the development of new therapeutic strategies for preventing the emergence of MDR-TB during treatment. Citation: Machado D, Couto I, Perdiga ˜o J, Rodrigues L, Portugal I, et al. (2012) Contribution of Efflux to the Emergence of Isoniazid and Multidrug Resistance in Mycobacterium tuberculosis. PLoS ONE 7(4): e34538. doi:10.1371/journal.pone.0034538 Editor: Igor Mokrousov, St. Petersburg Pasteur Institute, Russian Federation Received December 21, 2011; Accepted March 1, 2012; Published April 6, 2012 Copyright: ß 2012 Machado et al. This is an open-access article distributed under the terms of the Creative Commons Attribution License, which permits unrestricted use, distribution, and reproduction in any medium, provided the original author and source are credited. Funding: This work was supported by grant EU-FSE/FEDER-PTDC/BIA-MIC/71280/2006 and EU-QREN/COMPETE-PTDC/SAU-FCF/102807/2008 from Fundac ¸a ˜o para a Cie ˆncia e a Tecnologia (FCT), Portugal and Project ‘‘Early Molecular Detection of M/XDRTB in the Great Lisbon Healthcare Region’’, Refa SDH49, from Fundac ¸a ˜o Calouste Gulbenkian (FCG), Portugal. Authors DM and LR were supported by grants SFRH/BD/65060/2009 and SFRH/BD/24931/2005 from FCT of Portugal. The funders had no role in study design, data collection and analysis, decision to publish, or preparation of the manuscript. Competing Interests: The authors have declared that no competing interests exist. * E-mail: [email protected]Introduction Tuberculosis (TB) remains a serious public health threat around the world, and according to the World Health Organization, nearly two billion people are infected with Mycobacterium tuberculosis, with about 8.8 million of new TB cases and 1.3 million deaths in 2010 [1]. Moreover, multidrug resistant tuberculosis (MDR-TB), caused by M. tuberculosis simultaneously resistant to isoniazid and rifampicin, the two most effective anti-bacillary drugs used in TB therapy, represents a challenge to the control of the disease since 650,000 of the TB cases in 2010 are estimated to be MDR-TB cases [1]. Chromosomal gene mutation has been considered the single cause for antibiotic resistance in M. tuberculosis, with multidrug resistance arising as a consequence of sequential accumulation of spontaneous mutations in target genes [2]. Resistance to rifampicin is almost always due to point mutations in the rpoB gene encoding the b subunit of the RNA polymerase [3]. Furthermore, monoresistance to rifampicin is rare and almost all M. tuberculosis strains resistant to rifampicin are also resistant to isoniazid [2,4,5]. Isoniazid is a prodrug that requires activation by the catalase-peroxidase enzyme (KatG) [6] and its molecular target is InhA, a NADH-dependent enoyl acyl carrier protein reductase involved in the synthesis of mycolic acids [7]. The main mechanism of resistance to isoniazid is the occurrence of mutations in its activator, KatG [6,8], whereas mutations in the inhA gene represent the second most common mechanism. Together, mutations in these two genes are responsible for approximately 75% of the cases of M. tuberculosis resistance to isoniazid in the clinical setting [9]. Resistance to isoniazid has also been associated with mutations in several other genes (e.g. ndh, kasA and oxyR–ahpC intergenic region) [10], but its direct association with resistance is still unclear. Isoniazid is highly effective against M. tuberculosis (bactericidal at low concentrations), the reason why it remains a key component in multiple drug treatment regimens. However, resistant isolates are rapidly generated during monotherapy or inappropriate treat- ment, and many clinical isolates with no identified mutation have PLoS ONE | www.plosone.org 1 April 2012 | Volume 7 | Issue 4 | e34538
Transcript
Contribution of Efflux to the Emergence of Isoniazid andMultidrug Resistance in Mycobacterium tuberculosisDiana Machado1, Isabel Couto1,2, Joao Perdigao3, Liliana Rodrigues1, Isabel Portugal3, Pedro Baptista4,
Bruno Veigas4, Leonard Amaral1,5, Miguel Viveiros1,5*
1 Grupo de Micobacterias, Unidade de Microbiologia Medica, Instituto de Higiene e Medicina Tropical, Universidade Nova de Lisboa (IHMT/UNL), Lisboa, Portugal,
2 Centro de Recursos Microbiologicos (CREM), Faculdade de Ciencias e Tecnologia, Universidade Nova de Lisboa, Caparica, Portugal, 3 Centro de Patogenese Molecular/
URIA, Faculdade de Farmacia, Universidade de Lisboa, Lisboa, Portugal, 4 CIGMH, Departamento de Ciencias da Vida, Faculdade de Ciencias e Tecnologia, Universidade
Nova de Lisboa, Caparica, Portugal, 5 COST ACTION BM0701 (ATENS), Brusells, Belgium
Abstract
Multidrug resistant (MDR) tuberculosis is caused by Mycobacterium tuberculosis resistant to isoniazid and rifampicin, the twomost effective drugs used in tuberculosis therapy. Here, we investigated the mechanism by which resistance towardsisoniazid develops and how overexpression of efflux pumps favors accumulation of mutations in isoniazid targets, thusestablishing a MDR phenotype. The study was based on the in vitro induction of an isoniazid resistant phenotype byprolonged serial exposure of M. tuberculosis strains to the critical concentration of isoniazid employed for determination ofdrug susceptibility testing in clinical isolates. Results show that susceptible and rifampicin monoresistant strains exposed tothis concentration become resistant to isoniazid after three weeks; and that resistance observed for the majority of thesestrains could be reduced by means of efflux pumps inhibitors. RT-qPCR assessment of efflux pump genes expressionshowed overexpression of all tested genes. Enhanced real-time efflux of ethidium bromide, a common efflux pumpsubstrate, was also observed, showing a clear relation between overexpression of the genes and increased efflux pumpfunction. Further exposure to isoniazid resulted in the selection and stabilization of spontaneous mutations and deletions inthe katG gene along with sustained increased efflux activity. Together, results demonstrate the relevance of efflux pumps asone of the factors of isoniazid resistance in M. tuberculosis. These results support the hypothesis that activity of efflux pumpsallows the maintenance of an isoniazid resistant population in a sub-optimally treated patient from which isoniazidgenetically resistant mutants emerge. Therefore, the use of inhibitors of efflux should be considered in the development ofnew therapeutic strategies for preventing the emergence of MDR-TB during treatment.
Citation: Machado D, Couto I, Perdigao J, Rodrigues L, Portugal I, et al. (2012) Contribution of Efflux to the Emergence of Isoniazid and Multidrug Resistance inMycobacterium tuberculosis. PLoS ONE 7(4): e34538. doi:10.1371/journal.pone.0034538
Editor: Igor Mokrousov, St. Petersburg Pasteur Institute, Russian Federation
Received December 21, 2011; Accepted March 1, 2012; Published April 6, 2012
Copyright: � 2012 Machado et al. This is an open-access article distributed under the terms of the Creative Commons Attribution License, which permitsunrestricted use, distribution, and reproduction in any medium, provided the original author and source are credited.
Funding: This work was supported by grant EU-FSE/FEDER-PTDC/BIA-MIC/71280/2006 and EU-QREN/COMPETE-PTDC/SAU-FCF/102807/2008 from Fundacaopara a Ciencia e a Tecnologia (FCT), Portugal and Project ‘‘Early Molecular Detection of M/XDRTB in the Great Lisbon Healthcare Region’’, Refa SDH49, fromFundacao Calouste Gulbenkian (FCG), Portugal. Authors DM and LR were supported by grants SFRH/BD/65060/2009 and SFRH/BD/24931/2005 from FCT ofPortugal. The funders had no role in study design, data collection and analysis, decision to publish, or preparation of the manuscript.
Competing Interests: The authors have declared that no competing interests exist.
caused by M. tuberculosis simultaneously resistant to isoniazid and
rifampicin, the two most effective anti-bacillary drugs used in TB
therapy, represents a challenge to the control of the disease since
650,000 of the TB cases in 2010 are estimated to be MDR-TB
cases [1].
Chromosomal gene mutation has been considered the single
cause for antibiotic resistance in M. tuberculosis, with multidrug
resistance arising as a consequence of sequential accumulation of
spontaneous mutations in target genes [2]. Resistance to
rifampicin is almost always due to point mutations in the rpoB
gene encoding the b subunit of the RNA polymerase [3].
Furthermore, monoresistance to rifampicin is rare and almost all
M. tuberculosis strains resistant to rifampicin are also resistant to
isoniazid [2,4,5]. Isoniazid is a prodrug that requires activation by
the catalase-peroxidase enzyme (KatG) [6] and its molecular
target is InhA, a NADH-dependent enoyl acyl carrier protein
reductase involved in the synthesis of mycolic acids [7]. The main
mechanism of resistance to isoniazid is the occurrence of
mutations in its activator, KatG [6,8], whereas mutations in the
inhA gene represent the second most common mechanism.
Together, mutations in these two genes are responsible for
approximately 75% of the cases of M. tuberculosis resistance to
isoniazid in the clinical setting [9]. Resistance to isoniazid has also
been associated with mutations in several other genes (e.g. ndh, kasA
and oxyR–ahpC intergenic region) [10], but its direct association
with resistance is still unclear.
Isoniazid is highly effective against M. tuberculosis (bactericidal at
low concentrations), the reason why it remains a key component in
multiple drug treatment regimens. However, resistant isolates are
rapidly generated during monotherapy or inappropriate treat-
ment, and many clinical isolates with no identified mutation have
PLoS ONE | www.plosone.org 1 April 2012 | Volume 7 | Issue 4 | e34538
been described [9,11]. As with other bacterial species, these
resistant phenotypes also receive significant contributions from
membrane transport proteins that prevent the compound from
reaching the cellular target [12,13]. The analysis of genome
sequences has shown that mycobacteria have multiple putative
efflux pumps [14] and to date, several pumps have been identified
in various species of mycobacteria in association with low level
resistance to various compounds, including isoniazid [15–20].
In general, increased activity of efflux systems is responsible for
conferring low-level resistance to antibiotics, contrasting with the
high-level resistance caused by mutations in genes encoding for the
primary targets of these antibiotics [21]. Increased activity of efflux
systems results in the reduction of intracellular levels of the
antibiotic, which may enable the survival of a bacterial
subpopulation under constant stress promoted by a sub-lethal
level of antibiotic. During this period, mutants with alterations in
the genes that favour resistance can be selected, therefore insuring
the establishment of an antibiotic resistant population that is
clinically significant [22–24]. It is this sub-population of bacteria
that may then accumulate mutations with prolonged exposure to a
constant concentration of antibiotic [25,26].
Here, we investigated the mechanisms underlying the develop-
ment of multidrug resistance in M. tuberculosis via the constant
exposure of several isoniazid susceptible M. tuberculosis strains to
the critical concentration of isoniazid, 0.1 mg/ml; followed by the
evaluation of the effect of efflux inhibitors on the isoniazid
minimum inhibitory concentration for the original and isoniazid
exposed resistant strains. Analysis of gene expression of six efflux
pumps related to isoniazid resistance in M. tuberculosis [12,15,19]
and its correlation with the cell’s ability to efflux ethidium bromide
(a common efflux substrate), provides strong evidence that when
challenged with isoniazid, M. tuberculosis reacts by a prompt efflux-
mediated response. We further demonstrate that this isoniazid
induced resistance can be reverted by efflux inhibitors, supporting
their role as adjuvants in anti-tuberculosis therapy and prevention
of MDR-TB emergence.
Results
Exposure to isoniazidTwo M. tuberculosis strains susceptible to the first-line antibiotics
(including the H37Rv reference strain) and two clinical strains
monoresistant to rifampicin were constantly exposed to the critical
concentration of isoniazid, 0.1 mg/ml, during an extended period
of time – see Figure 1. Two independent exposure processes were
carried out for each strain (exposure process A and B in Figure 1)
to assess the stochastic behaviour of the biological events involved.
The effect of 0.1 mg/ml isoniazid exposure on the minimum
inhibitory concentration of isoniazid (INH MIC) is summarised in
Table 1. Briefly, INH MIC increases from an initial value of 0.05–
0.1 mg/ml to as high as 256 mg/ml (Table 1). Exposure to
isoniazid had no effect on the MIC of rifampicin against all strains
(data not shown). Additionally, susceptibility testing for the five 1st
line antibiotics (streptomycin, isoniazid, rifampicin, ethambutol
and pyrazinamide) applied to all strains at the beginning of the
experiments and after the last passage in isoniazid indicated that
development of resistance was restricted to isoniazid only (data not
shown). We also observed that the time required for growth
detection decreased with the number of passages (Table 1).
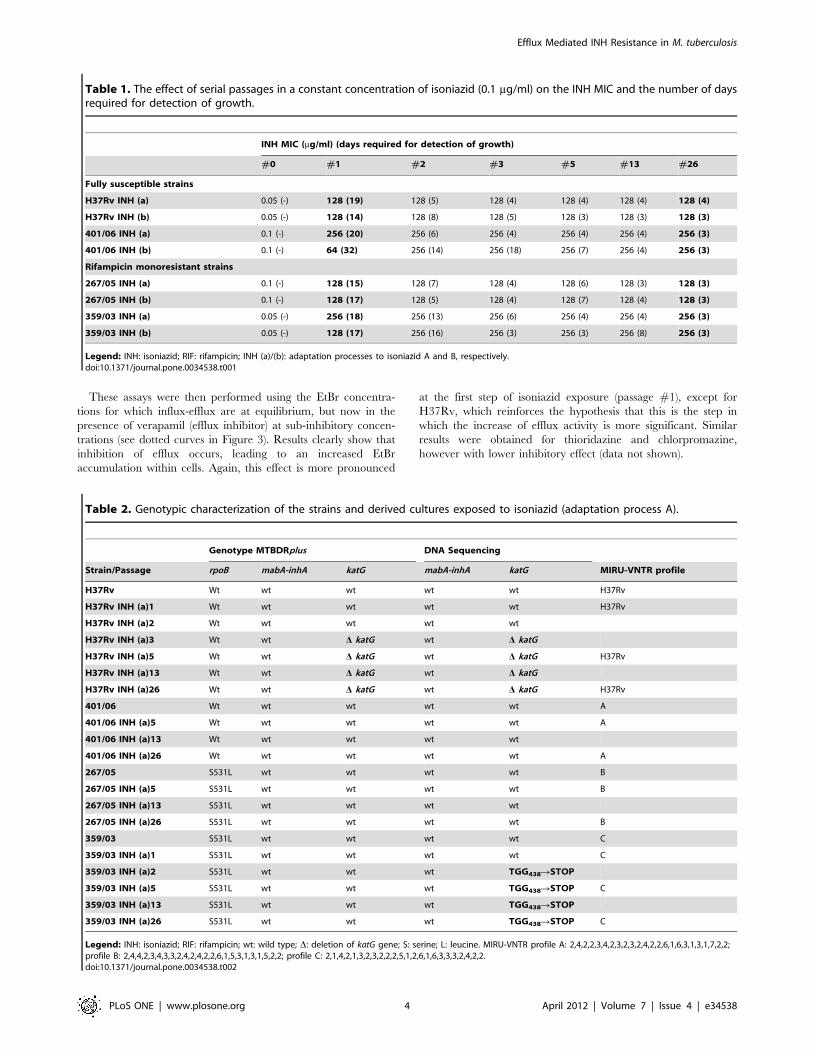
Typing by MIRU-VNTR analysisTo confirm the isogenic nature of the exposed and initial
parental strains, all strains were subjected to molecular typing by
MIRU-VNTR analysis, which confirmed the identity of each
culture during the antibiotic exposure processes (Tables 2 and 3).
Detection of mutations associated with isoniazidresistance
Cultures corresponding to selected passages of isoniazid
exposure were preliminarily monitored for mutations in katG and
mabA-inhA operon by the Genotype MTBDRplus system. These
strains were later analyzed by DNA sequencing of specific
fragments of these same genes – see Tables 2 and 3.
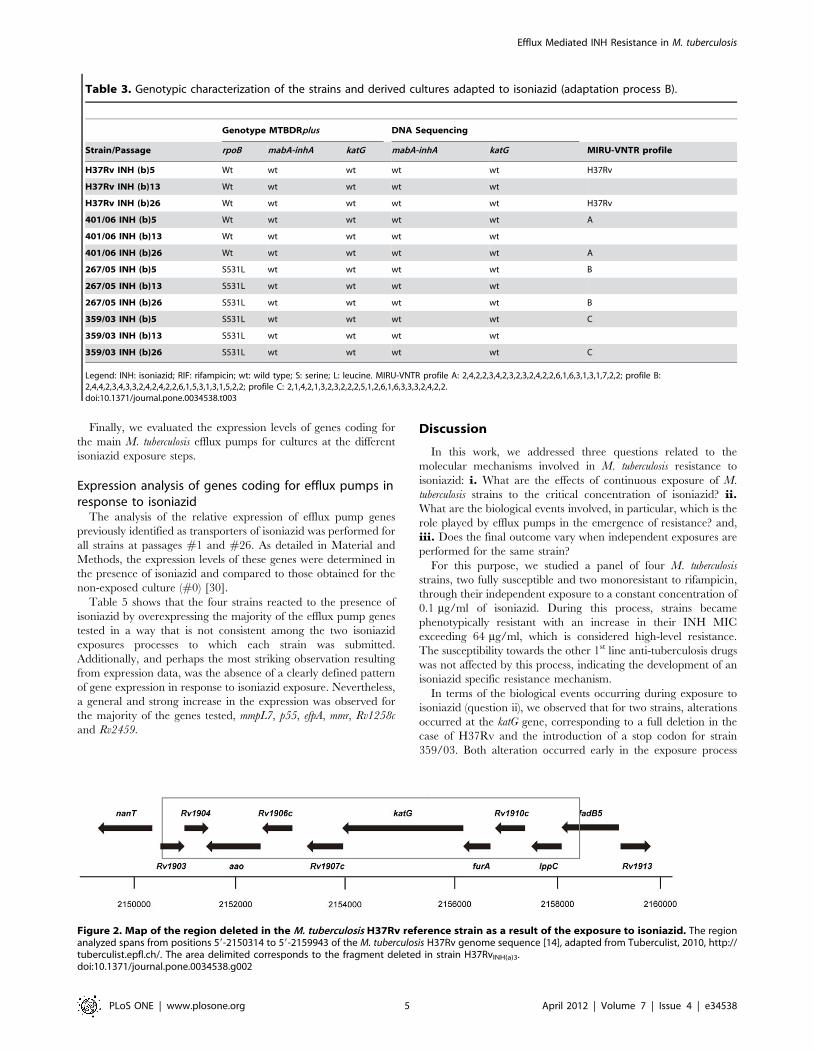
For strain H37Rv, two different results were obtained for the
two independent isoniazid exposure processes. In one of the
duplicates, total deletion of katG gene was observed at passage #3
(H37RvINH(a)3, GenBank accession number JQ406585). The
precise extent and location of this deletion was defined by
sequencing and chromosomal primer walking to be located
between positions 59-2150314 and 59-2159943 of the M. tuberculosis
H37Rv genome [14]. This deletion, 8084 bp in length, resulted in
the complete loss of genes Rv1903, Rv1904, aao, Rv1906c, Rv1907c,
katG, furA, Rv1910c, lppc and disruption of fadB5 (Figure 2).
Conversely, no alterations were detected on katG or any of the
other gene targets tested during strain H37Rv second isoniazid
exposure process (cf. Tables 2 and 3). Interestingly, both isoniazid-
exposed cultures evidenced the same levels of resistance at
equivalent passages of the exposure process (Table 1). For the
three clinical strains subjected to the same isoniazid exposure
process, no alterations were detected, except for the appearance of
a STOP codon in position 1314 of the katG gene (codon 438) for
strain 359/03 This alteration occurred at passage #2 (359/
03INH(a)2, accession number JQ316462) of the first exposure
process (Table 2), whereas no alteration was detected in the second
exposure process of this same strain (Table 3). Again, no
differences were observed between the isoniazid resistance levels
of the two isoniazid-exposed 359/03 cultures (Table 1).
Effect of EIs on the susceptibility to isoniazidTo test for the involvement of efflux on the increased resistance
to isoniazid noticed through the exposure process, we determined
the INH MIC in the first passage where this increased resistance
was first noticed and in last passage (#26) of the exposure process,
in the absence and presence of compounds known to act as efflux
inhibitors (EIs). The compounds selected were thioridazine,
chlorpromazine and verapamil, for which inhibitory activity
against mycobacterial efflux pumps was already demonstrated
[16,27,28]. The effects of these EIs on the INH MICs are
summarized in Table 4. The INH MIC was reduced by
thioridazine, chlorpromazine and verapamil to levels equal or
below the critical concentration used for the standard susceptibility
testing of this antibiotic in the majority of cases. We then assayed
the efflux activity of these cultures by a semi-automated
fluorometric method [27,29], which uses the broad-range efflux
substrate EtBr, in the presence and absence of an EI.
Real-time detection of efflux activityThe assays were performed for all isoniazid non-exposed strains
(#0) and at passages #1 and #26 of the two exposure processes (A
and B).
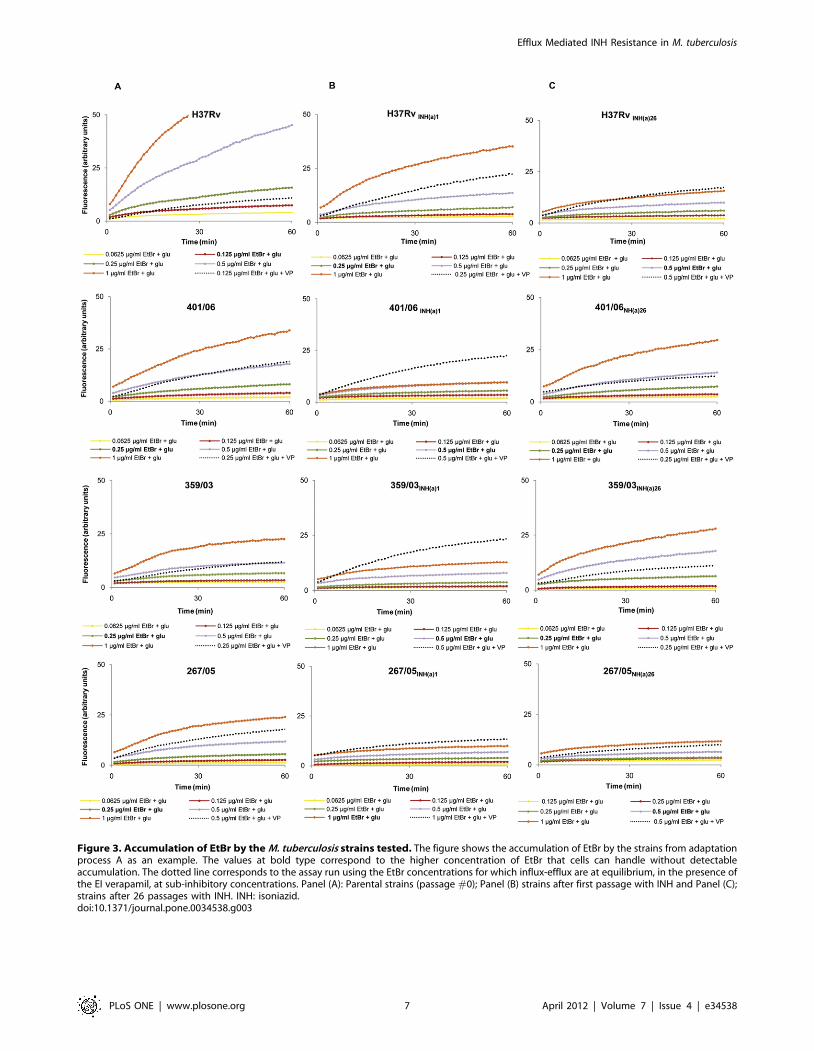
The EtBr accumulation assays, used to determine the highest
concentration of EtBr that cells can handle without detectable
accumulation (see Material and Materials), showed that the
clinical strains are able to handle higher EtBr concentrations than
H37Rv (0.25–0.5 and 0.125 mg/ml of EtBr, respectively – see
values at bold type in legends of Figure 3A). This means that the
Efflux Mediated INH Resistance in M. tuberculosis
PLoS ONE | www.plosone.org 2 April 2012 | Volume 7 | Issue 4 | e34538
concentration at which EtBr influx and efflux reach steady state
equilibrium is higher for the clinical strains than for H37Rv, i.e.
that the former have higher efflux capacity than that of the
reference strain [29]. With exposure to isoniazid, this efflux
capacity increase, as shown by the flatness of the accumulation
curves observed for all cultures at the first step of isoniazid
exposure (Fig. 3B). With continuation of exposure to isoniazid, this
efflux activity decreases, as shown by the lower EtBr concentra-
tions needed to reach observable accumulation for cultures at
passage #26 (cf. Fig. 3C with 3B), however not to the original
levels shown by the non-exposed cultures (cf. Fig. 3C with 3A).
Interestingly, this decrease of efflux activity with the prolonged
exposure to isoniazid is observable for the clinical strains but not
for H37Rv. For the sake of space, only the results for exposure
process A are shown in Figure 3, but the same behavior was
obtained for the exposure process B, for all the strains.
Figure 1. Schematic representation of exposure of strain H37Rv to 0.1 mg/ml INH using the BACTECTM MGITTM 960 andcharacterization assays performed at selected points. For each strain, exposure to INH was done in duplicate, in two independent assays -processes A and B. INH(a): exposure process A; INH(b): exposure process B; INH: isoniazid; EI: efflux inhibitor. Vertical arrows represent transfer to newMGIT tubes containing 0.1 mg/ml INH. Seq: nucleotide sequence determination for specific fragments of the genes involved in the resistance to INH;AST: susceptibility testing to all first line antibiotics. MICINH: minimum inhibitory concentration determination of isoniazid. Note: This same procedure,here depicted as an example, was carried out for isoniazid exposure of each strain involved in this study.doi:10.1371/journal.pone.0034538.g001
Efflux Mediated INH Resistance in M. tuberculosis
PLoS ONE | www.plosone.org 3 April 2012 | Volume 7 | Issue 4 | e34538
These assays were then performed using the EtBr concentra-
tions for which influx-efflux are at equilibrium, but now in the
presence of verapamil (efflux inhibitor) at sub-inhibitory concen-
trations (see dotted curves in Figure 3). Results clearly show that
inhibition of efflux occurs, leading to an increased EtBr
accumulation within cells. Again, this effect is more pronounced
at the first step of isoniazid exposure (passage #1), except for
H37Rv, which reinforces the hypothesis that this is the step in
which the increase of efflux activity is more significant. Similar
results were obtained for thioridazine and chlorpromazine,
however with lower inhibitory effect (data not shown).
Table 1. The effect of serial passages in a constant concentration of isoniazid (0.1 mg/ml) on the INH MIC and the number of daysrequired for detection of growth.
INH MIC (mg/ml) (days required for detection of growth)
Figure 2. Map of the region deleted in the M. tuberculosis H37Rv reference strain as a result of the exposure to isoniazid. The regionanalyzed spans from positions 59-2150314 to 59-2159943 of the M. tuberculosis H37Rv genome sequence [14], adapted from Tuberculist, 2010, http://tuberculist.epfl.ch/. The area delimited corresponds to the fragment deleted in strain H37RvINH(a)3.doi:10.1371/journal.pone.0034538.g002
Efflux Mediated INH Resistance in M. tuberculosis
PLoS ONE | www.plosone.org 5 April 2012 | Volume 7 | Issue 4 | e34538
and were maintained for the remaining of the assays. These
alterations in katG correlated with the loss of catalase activity (data
not shown). The mutation found in clinical isolate 359/03 is rarely
described in literature; however it fits into the known strategy of
KatG functional weakening by introduction of mutations during
isoniazid exposure [10,31]. Others have also reported the in vitro
deletion of total or part of the katG gene in strains exposed to
isoniazid [31,32], and total/partial deletion of the katG gene of
isoniazid-resistant clinical isolates has also been previously
reported [8,33]. Interestingly, no genetic changes were detected
in the second isoniazid-exposure procedure, run in parallel for
these same strains, indicating that evolution of the same strain in
the same conditions can bring about, in a non-deterministic
course, cells that significantly differ both phenotypically and
genetically.
Our results clearly show that, in addition to the occurrence of
spontaneous mutations, efflux systems play a role in the
development of isoniazid resistance. This occurs quite early during
exposure to isoniazid and allows cells to survive in the presence of
this antibiotic until a mutation conferring high level and stable
resistance emerges. Recently, Srivastava et al., suggested a model
for the development of drug resistance in the M. tuberculosis
reference strain H37Rv, enabling the rapid emergence of high
level resistance to both ethambutol and isoniazid [34]. In this
model, it is proposed that induction of an efflux pump which
transports two or more drugs is the first step to the emergence of
resistance. Our results provide the experimental data that confirm
the model proposed by these authors and demonstrate that this
mechanism is extendable to clinical isolates.
Moreover, our work provides, for the first time, data captured
on a real-time basis for increased efflux activity as the first-line
response of M. tuberculosis to the critical concentration of isoniazid.
This efflux-mediated response was detected for both susceptible
and rifampicin monoresistant, reference or clinical strains and
provide the cells with a rapid, non specific response to a highly
noxious agent. As the isoniazid exposure process continues, two
different patterns were observed: the susceptible reference strain
H37Rv increased its efflux activity, even after deletion of the entire
katG gene, whereas the clinical strains showed a decreased efflux
activity in the last passage of isoniazid exposure. During the entire
process, the clinical strains showed a capacity to handle higher
EtBr concentrations than H37Rv, an additional evidence of their
higher efflux capacity. Overall, the clinical strains appear to be
more prompt to respond, via an efflux-mediated pathway, to
noxious agents, such as EtBr or isoniazid, whereas H37Rv shows a
less prompt, but more stable/prolonged use of efflux as a
detoxifying response to these drugs. These results suggest that
clinical M. tuberculosis strains are primed to efflux noxious
compounds, as already observed in other bacteria [35]. The
presence of such efflux system(s) and their role in resistance to
these drugs was additionally confirmed by the use of efflux
inhibitors in both real-time efflux assays and MIC determinations.
While in the first assays, these compounds were able to reduce
efflux of EtBr, their use in INH MIC determination showed the
involvement of efflux on the high level resistance to this antibiotic.
For some strains, the reduction on INH MIC by the EIs tested
reached levels identical to their susceptible parental counterparts.
This clearly shows that in these cases, high level isoniazid
resistance is mainly efflux-driven. From the several inhibitors
tested, chlorpromazine and verapamil were the two most effective
for inhibiting isoniazid efflux in M. tuberculosis, as previously
demonstrated for M. tuberculosis complex [36].
It is worth noticing that EIs show a more significant effect on the
MICs for cultures at first passage compared to their effect on the
MICs of the last passage (#26). For strain 401/06, submitted to
exposure process A, despite the fact that no evident genetic
alteration was detected, the high INH MIC obtained after
isoniazid exposure could not be reduced by any of the EIs tested
(Table 4). This result suggests that, for this culture, the isoniazid
high level resistance detectable at first passage is already mutation-
driven. Interestingly strain 267/05, without detectable mutations is
the one with the highest level of expression of genes for efflux
further supporting that overexpression of efflux-pumps can sustain
isoniazid resistance to levels as high as those achieved by the
canonical mutations.
To identify the efflux system(s) involved in this first-line response
to isoniazid, we selected a set of genes coding for efflux pumps
reported to be involved in the transport of noxious substances,
Table 4. MIC determination and susceptibility testing for the strains exposed to isoniazid in the presence and absence of effluxinhibitors.
INH MIC (mg/ml) (Susceptibility testing for INH)
#0 #1 #26
Strain +TZ +CPZ +VP no EI +TZ +CPZ +VP no EI +TZ +CPZ +VP
H37Rv INH (a) 0.05 (S) 0.05 (S) 0.05 (S) 128 (R) 128 (R) 0.05 (S) 0.06 (S) 128 (R) 128 (R) 128 (R) 128 (R)
H37Rv INH (b) 0.05 (S) 0.05 (S) 0.05 (S) 128 (R) 128 (R) 0.1 (S) 0.1 (S) 128 (R) 128 (R) 0.1 (S) 0.1 (S)
401/06 INH (a) 0.1 (S) 0.1 (S) 0.1 (S) 256 (R) 256 (R) 128 (R) 256 (R) 256 (R) 256 (R) 128 (R) 256 (R)
401/06 INH (b) 0.1 (S) 0.1 (S) 0.1 (S) 64 (R) 0.1(S) 0.1 (S) 0.1 (S) 256 (R) 256 (R) 64 (R) 256 (R)
267/05 INH (a) 0.1 (S) 0.1 (S) 0.1 (S) 128 (R) 0.1 (S) 0.1 (S) 128 (R) 128 (R) 0.1 (S) 0.1 (S) 128 (R)
267/05 INH (b) 0.1 (S) 0.1 (S) 0.1 (S) 128 (R) 0.1 (S) 0.1 (S) 128 (R) 128 (R) 0.1 (S) 0.1 (S) 128 (R)
359/03 INH (a) 0.05 (S) 0.05 (S) 0.05 (S) 256 (R) 128 (R) 0.1 (S) 0.03 (S) 256 (R) 128 (R) 0.1 (S) 0.03 (S)
359/03 INH (b) 0.05 (S) 0.05 (S) 0.05 (S) 128 (R) 0.1 (S) 0.1 (S) 0.1 (S) 256 (R) 128 (R) 0.1 (S) 0.1 (S)
Legend: INH: isoniazid; INH (a): exposure process A; INH (b): exposure process B. S: susceptible; R: resistant. Values in bold correspond to full reversion of the INHresistance phenotype. EIs were used at K of their MIC. MICs for the EIs (passage 1): thioridazine (TZ): H37Rv and 359/03: 15 mg/ml, 401/06 and 267/05: 30 mg/ml;chlorpromazine (CPZ): 30 mg/ml for all strains; verapamil (VP): 256 mg/ml for all strains. MICs for the EIs (passage 26): TZ: H37Rv and 359/03: 15 mg/ml, 401/06(a)26:15 mg/ml; 401/06(b)26: 30 mg/ml; 267/05: 30 mg/ml; CPZ: MIC of 30 mg/ml for all strains except H37Rv INH(a)26: 15 mg/ml; VP: 256 mg/ml for all strains except H37RvINH(a)26 and 401/06: 128 mg/ml.doi:10.1371/journal.pone.0034538.t004
Efflux Mediated INH Resistance in M. tuberculosis
PLoS ONE | www.plosone.org 6 April 2012 | Volume 7 | Issue 4 | e34538
Figure 3. Accumulation of EtBr by the M. tuberculosis strains tested. The figure shows the accumulation of EtBr by the strains from adaptationprocess A as an example. The values at bold type correspond to the higher concentration of EtBr that cells can handle without detectableaccumulation. The dotted line corresponds to the assay run using the EtBr concentrations for which influx-efflux are at equilibrium, in the presence ofthe EI verapamil, at sub-inhibitory concentrations. Panel (A): Parental strains (passage #0); Panel (B) strains after first passage with INH and Panel (C);strains after 26 passages with INH. INH: isoniazid.doi:10.1371/journal.pone.0034538.g003
Efflux Mediated INH Resistance in M. tuberculosis
PLoS ONE | www.plosone.org 7 April 2012 | Volume 7 | Issue 4 | e34538
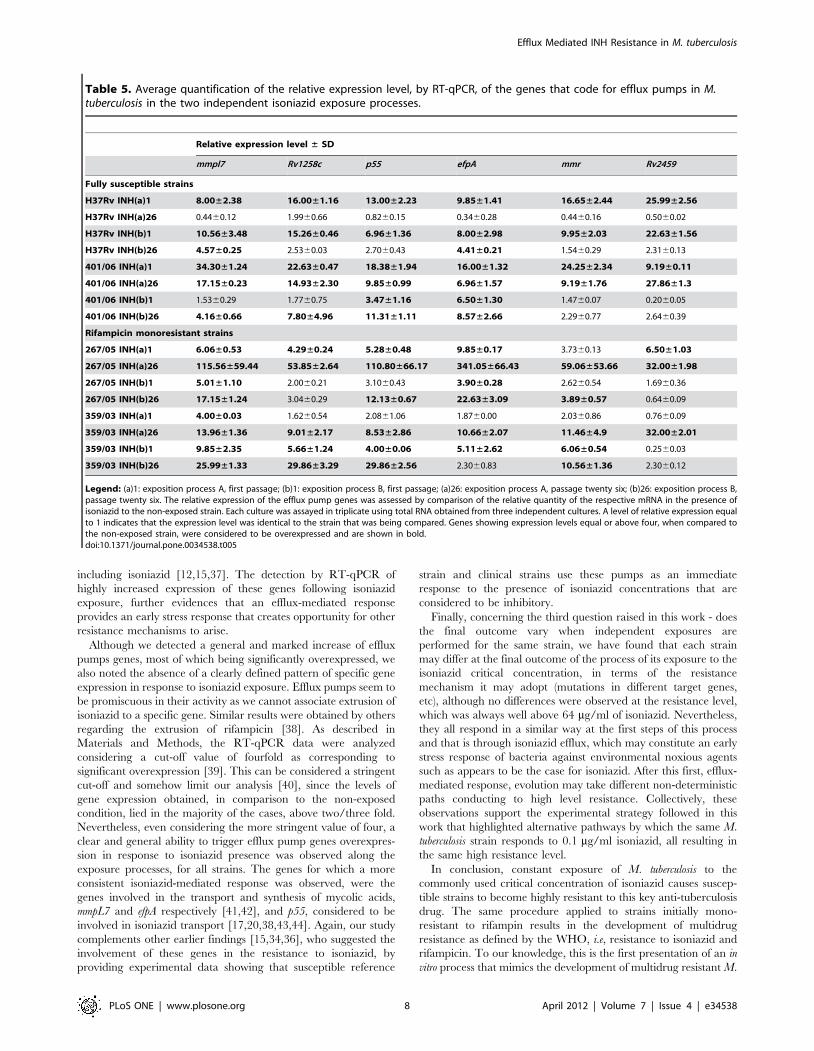
including isoniazid [12,15,37]. The detection by RT-qPCR of
highly increased expression of these genes following isoniazid
exposure, further evidences that an efflux-mediated response
provides an early stress response that creates opportunity for other
resistance mechanisms to arise.
Although we detected a general and marked increase of efflux
pumps genes, most of which being significantly overexpressed, we
also noted the absence of a clearly defined pattern of specific gene
expression in response to isoniazid exposure. Efflux pumps seem to
be promiscuous in their activity as we cannot associate extrusion of
isoniazid to a specific gene. Similar results were obtained by others
regarding the extrusion of rifampicin [38]. As described in
Materials and Methods, the RT-qPCR data were analyzed
considering a cut-off value of fourfold as corresponding to
significant overexpression [39]. This can be considered a stringent
cut-off and somehow limit our analysis [40], since the levels of
gene expression obtained, in comparison to the non-exposed
condition, lied in the majority of the cases, above two/three fold.
Nevertheless, even considering the more stringent value of four, a
clear and general ability to trigger efflux pump genes overexpres-
sion in response to isoniazid presence was observed along the
exposure processes, for all strains. The genes for which a more
consistent isoniazid-mediated response was observed, were the
genes involved in the transport and synthesis of mycolic acids,
mmpL7 and efpA respectively [41,42], and p55, considered to be
involved in isoniazid transport [17,20,38,43,44]. Again, our study
complements other earlier findings [15,34,36], who suggested the
involvement of these genes in the resistance to isoniazid, by
providing experimental data showing that susceptible reference
strain and clinical strains use these pumps as an immediate
response to the presence of isoniazid concentrations that are
considered to be inhibitory.
Finally, concerning the third question raised in this work - does
the final outcome vary when independent exposures are
performed for the same strain, we have found that each strain
may differ at the final outcome of the process of its exposure to the
isoniazid critical concentration, in terms of the resistance
mechanism it may adopt (mutations in different target genes,
etc), although no differences were observed at the resistance level,
which was always well above 64 mg/ml of isoniazid. Nevertheless,
they all respond in a similar way at the first steps of this process
and that is through isoniazid efflux, which may constitute an early
stress response of bacteria against environmental noxious agents
such as appears to be the case for isoniazid. After this first, efflux-
mediated response, evolution may take different non-deterministic
paths conducting to high level resistance. Collectively, these
observations support the experimental strategy followed in this
work that highlighted alternative pathways by which the same M.
tuberculosis strain responds to 0.1 mg/ml isoniazid, all resulting in
the same high resistance level.
In conclusion, constant exposure of M. tuberculosis to the
commonly used critical concentration of isoniazid causes suscep-
tible strains to become highly resistant to this key anti-tuberculosis
drug. The same procedure applied to strains initially mono-
resistant to rifampin results in the development of multidrug
resistance as defined by the WHO, i.e, resistance to isoniazid and
rifampicin. To our knowledge, this is the first presentation of an in
vitro process that mimics the development of multidrug resistant M.
Table 5. Average quantification of the relative expression level, by RT-qPCR, of the genes that code for efflux pumps in M.tuberculosis in the two independent isoniazid exposure processes.
Legend: (a)1: exposition process A, first passage; (b)1: exposition process B, first passage; (a)26: exposition process A, passage twenty six; (b)26: exposition process B,passage twenty six. The relative expression of the efflux pump genes was assessed by comparison of the relative quantity of the respective mRNA in the presence ofisoniazid to the non-exposed strain. Each culture was assayed in triplicate using total RNA obtained from three independent cultures. A level of relative expression equalto 1 indicates that the expression level was identical to the strain that was being compared. Genes showing expression levels equal or above four, when compared tothe non-exposed strain, were considered to be overexpressed and are shown in bold.doi:10.1371/journal.pone.0034538.t005
Efflux Mediated INH Resistance in M. tuberculosis
PLoS ONE | www.plosone.org 8 April 2012 | Volume 7 | Issue 4 | e34538
tuberculosis strains, which correlates with the anticipated develop-
ment of MDR-TB in a patient treated for prolonged periods with a
constant dose of isoniazid, as needed for effective therapy.
Therefore, the results obtained in this work emphasize the need
for revising isoniazid critical concentration and reinforce the
importance of multiple drug therapy in all anti-tuberculosis
regimens [45,46]. Furthermore, efflux inhibitors like the ones
tested in this work represent relevant alternatives in the search for
new effective compounds and new therapeutic strategies for
preventing the emergence of and possibly in the treatment of
MDR-TB.
Materials and Methods
M. tuberculosis strainsThe strains studied included two M. tuberculosis strains
susceptible to the first-line antibiotics, the reference strain
H37Rv ATCC27294T and a clinical isolate 401/06, plus; two
clinical isolates 359/03 and 267/05, both monoresistant to
rifampicin, harboring the most common rpoB mutation in clinical
isolates, S531L, all from the culture collection of Grupo de
Micobacterias, Unidade de Microbiologia Medica, Instituto de
24. Viveiros M, Portugal I, Bettencourt R, Victor TC, Jordaan AM, et al. (2002)
Isoniazid-induced transient high-level resistance in Mycobacterium tuberculosis.
Antimicrob Agents Chemother 46: 2804–2810.
25. Pasipanodya JG, Gumbo T (2011) A new evolutionary and pharmacokinetic-
pharmacodynamic scenario for rapid emergence of resistance to single andmultiple anti-tuberculosis drugs. Curr Opin Pharmacol 11: 457–463.
26. Martins A, Iversen C, Rodrigues L, Spengler G, Ramos J, et al. (2009) An
AcrAB-mediated multidrug-resistant phenotype is maintained following resto-ration of wild-type activities by efflux pump genes and their regulators.
Int J Antimicrob Agents 34: 602–604.
27. Rodrigues L, Wagner D, Viveiros M, Sampaio D, Couto I, et al. (2008)Thioridazine and chlorpromazine inhibition of ethidium bromide efflux in
Mycobacterium avium and Mycobacterium smegmatis. J Antimicrob Chemother 61:1076–1082.
28. Rodrigues L, Sampaio D, Couto I, Machado D, Kern WV, et al. (2009) The role
of efflux pumps in macrolide resistance in Mycobacterium avium complex.Int J Antimicrob Agents 34: 529–533.
29. Paixao L, Rodrigues L, Couto I, Martins M, Fernandes P, et al. (2009)
Fluorometric determination of ethidium bromide efflux kinetics in Escherichia coli.J Biol Eng 3: 18.
30. Viveiros M, Dupont M, Rodrigues L, Couto I, Davin-Regli A, et al. (2007)
Antibiotic stress, genetic response and altered permeability of E. coli. PLoS ONE2(4): e365.
31. de Steenwinkel JE, de Knegt GJ, Kate MT, van Belkum A, Verbrugh HA, et al.
(2010) Time-kill kinetics of anti-tuberculosis drugs, and emergence of resistance,in relation to metabolic activity of Mycobacterium tuberculosis. J Antimicrob
Chemother 65: 2582–2589.
32. Bergval IL, Schuitema ARJ, Klatser PR, Anthony RM (2009) Resistant mutants
of Mycobacterium tuberculosis selected in vitro do not reflect the in vivo mechanism of
37. da Silva PEA, Groll AV, Martin A, Palomino JC (2011) Efflux as a mechanism
for drug resistance in Mycobacterium tuberculosis. FEMS Immunol Med Microbiol63: 1–9.
38. Louw GE, Warren RM, van Pittius NC, Leon R, Jimenez A, et al. (2011)
Rifampicin reduces susceptibility to ofloxacin in rifampicin resistant Mycobacte-
rium tuberculosis through efflux. Am J Respir Crit Care Med 184: 269–276.
39. DeMarco CE, Cushing LA, Frempong-Manso E, Seo SM, Jaravaza TA, et al.
(2007) Efflux-related resistance to norfloxacin, dyes and biocides in bloodstreamisolates of Staphylococcus aureus. Antimicrob Agents Chemother 51: 3235–3239.
40. Livak KJ, Schmittgen TD (2001) Analysis of relative gene expression data using
real-time quantitative PCR and the 2-DDCt method. Methods 25: 402–408.
41. Portevin D, de Sousa-D’Auria C, Houssin C, Grimaldi C, Daffe MCM, et al.
(2004) A polyketide synthase catalyses the last condensation step of mycolic acid
biosynthesis in mycobacteria and related organisms. Proc Natl Acad Sci USA101: 314–319.
42. Cox JS, Chen B, McNeil M, Jabobs WR, Jr. (1999) Complex lipid determines
tissue replication of Mycobacterium tuberculosis in mice. Nature 52: 2503–2511.