Contributions of microtubule dynamic instability and rotational diffusion to kinetochore capture R. Blackwell, O. Sweezy-Schindler, C. Edelmaier, Z. R. Gergely, P. J. Flynn, S. Montes, A. Crapo, A. Doostan, J. R. McIntosh, M. A. Glaser, and M. D. Betterton arXiv:1606.07847v2 [physics.bio-ph] 9 Dec 2016
Transcript
Contributions of microtubule dynamic instability and rotational
diffusion to kinetochore capture
R. Blackwell, O. Sweezy-Schindler, C. Edelmaier, Z. R. Gergely, P. J. Flynn, S. Montes,A. Crapo, A. Doostan, J. R. McIntosh, M. A. Glaser, and M. D. Betterton
arX
iv:1
606.
0784
7v2
[ph
ysic
s.bi
o-ph
] 9
Dec
201
6
Abstract
Microtubule dynamic instability allows search and capture of kinetochores during spindle forma-tion, an important process for accurate chromosome segregation during cell division. Recent workhas found that microtubule rotational diffusion about minus-end attachment points contributesto kinetochore capture in fission yeast, but the relative contributions of dynamic instability androtational diffusion are not well understood. We have developed a biophysical model of kinetochorecapture in small fission-yeast nuclei using hybrid Brownian dynamics/kinetic Monte Carlo simu-lation techniques. With this model, we have studied the importance of dynamic instability andmicrotubule rotational diffusion for kinetochore capture, both to the lateral surface of a microtubuleand at or near its end. Over a range of biologically relevant parameters, microtubule rotationaldiffusion decreased capture time, but made a relatively small contribution compared to dynamicinstability. At most, rotational diffusion reduced capture time by 25%. Our results suggest thatwhile microtubule rotational diffusion can speed up kinetochore capture, it is unlikely to be thedominant physical mechanism for typical conditions in fission yeast. In addition, we found thatwhen microtubules undergo dynamic instability, lateral captures predominate even in the absenceof rotational diffusion. Counterintuitively, adding rotational diffusion to a dynamic microtubuleincreases the probability of end-on capture.
Cell division is essential to the propagation of life. For a cell to divide successfully, each daughtercell must inherit the correct genetic material. In eukaryotes, segregation of duplicated chromo-somes is performed by the mitotic spindle, a cellular machine composed of microtubules (MTs)and their associated proteins (1). Specialized sites on the chromosomes called kinetochores (KCs)attach to spindle MTs, and these KC-MT attachments are necessary for proper chromosome segre-gation. Understanding KC capture by spindle MTs and the subsequent chromosome movements ischallenging because the process depends on multiple overlapping mechanisms (2–4), including theaction of multiple KC-associated motors and highly dynamic MTs that maintain KC attachmentduring significant MT turnover. Numerous proteins localize to MT plus ends and KCs, but theroles of these different proteins are not yet clear (5–7). Problems in kinetochore-MT attachmentand chromosome segregation can lead to aneuploidy, which is associated with birth defects andcancer progression (8).
The discovery of MT dynamic instability 30 years ago (9) led to the proposal that MT searchand capture is the primary mechanism of initial KC-MT attachment in mitosis. In this picture,dynamic MTs grow in different directions from centrosomes and make end-on attachments withKCs (10–13). Perturbations to MT dynamics are predicted to have significant effects on KC capture(12), suggesting that dynamic instability is a key component of any KC capture model. Search andcapture has been directly observed in large cells (14). However, the simplest search-and-capturemechanism does not appear rapid enough to capture multiple chromosomes quickly enough tomatch measured time in mitosis. Extensions to the search-and-capture mechanism that can makeKC capture more rapid in large cells or cell extracts include KC diffusion (12, 15), MT growth thatis spatially biased toward chromosomes (16–18), chromosome spatial arrangements and rotation(15, 19, 20) and KC-initiated MTs that can interact with searching MTs (15, 21, 22). KCs inhuman cells change size and shape during mitosis, which can both speed up capture and minimizeerrors (20).
KC capture may occur differently in smaller cells. Lateral KC contacts have been directlyobserved both in budding yeast (23) and fission yeast (24). Recent work on the small cells offission yeast found that lateral KC attachment to MTs that rotationally diffuse about their attach-ment points at the spindle-pole bodies (SPBs, the yeast centrosomes) enabled rapid KC capture,even for relatively less dynamic MTs (24). Here we use the term rotational diffusion for diffusivemovements about MT minus-end attachment points, termed pivoting in previous work. Based onexperiments and a biophysical model, this work concluded that MT rotational diffusion was theprimary determinant of the time to capture lost KCs in these cells. This important finding sug-gests that MT rotational diffusion may significantly contribute to efficient KC capture, an effectthat has been neglected previously. Since initial KC captures are typically lateral rather than end-on (14, 19, 20, 23–25), MT rotational diffusion about minus-end attachment points could be animportant determinant of the capture time.
We have sought to evaluate the relative importance of MT dynamic instability versus MTrotational diffusion to KC capture. Previous theoretical work has focused either on MT dynamicinstability (11, 12, 15, 17, 20, 26) or rotational diffusion (24); as a result, this work has been unableto compare the two mechanisms and determine their relative importance. One model examined therelative contributions of dynamic instability and rotational diffusion for a single parameter set andfound that turning off rotational diffusion caused a modest increase in the mean capture time (27).Because MT rotational diffusion can lead to significant increases in the effective volume searched bya single MT, search-and-capture models that neglect MT rotational diffusion could lead to incorrectconclusions.
Mechanisms of kinetochore capture 3
R
L(t)
x
y
z
a
z
x
y
x
y
z
0 s
10.2 s
0 0.2 0.4 0.6 0.8 1 1.2 1.4Time t (min)
0
0.5
1
1.5
2
2.5
3
Leng
th L
(m
)
Slow dynamicsFast dynamics
0 1 2 3 4 5 6 7Time t (min)
0
0.1
0.2
0.3
0.4
0.5
0.6
0.7
0.8
0.9
1
Frac
tion
of lo
st k
inet
ocho
res
Slow dynamicsFast dynamics
A B C
D E
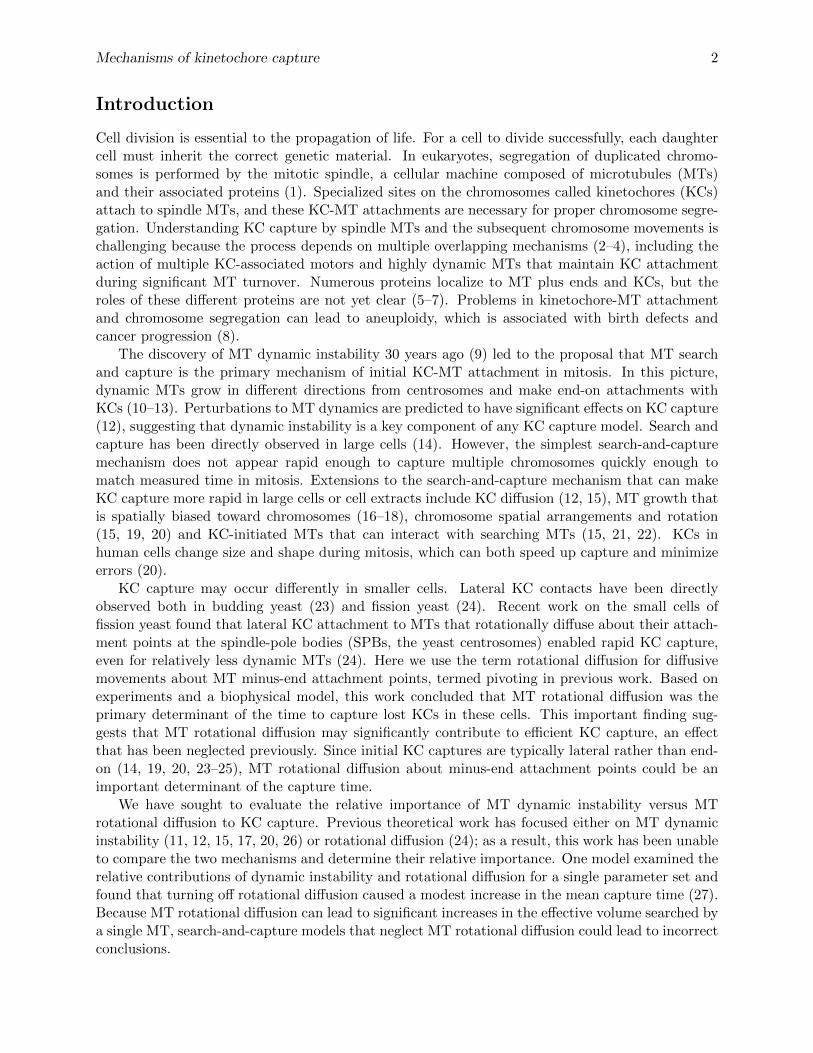
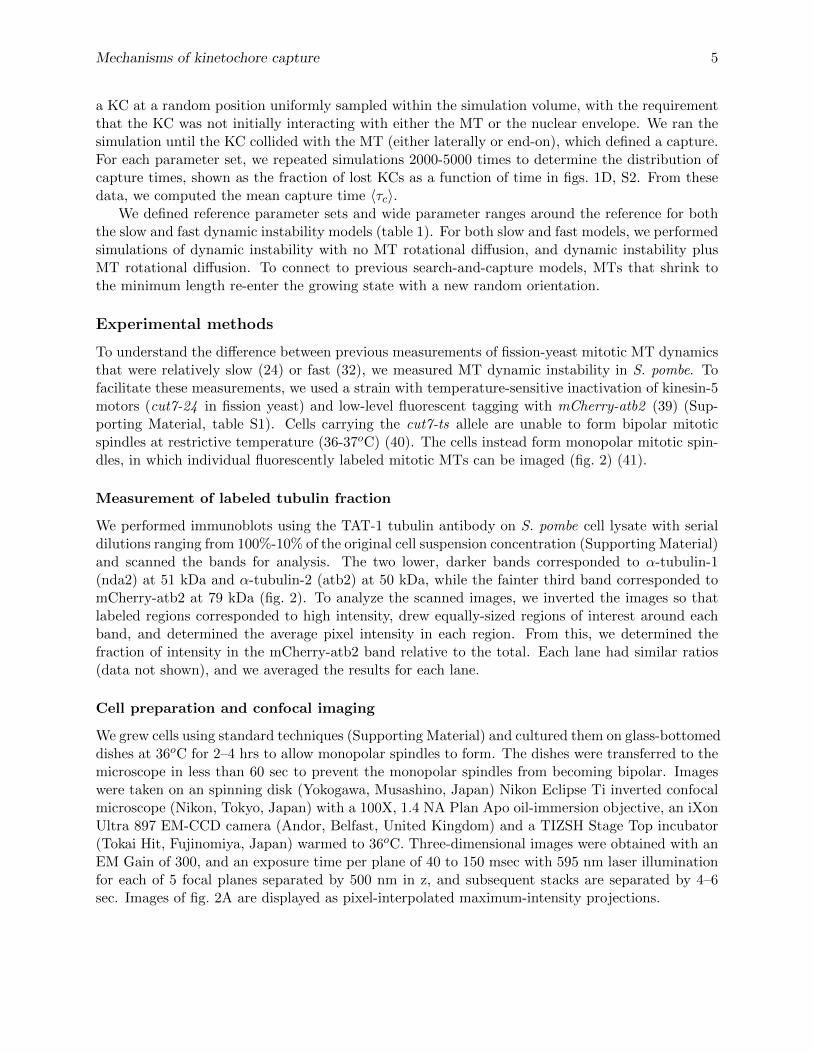
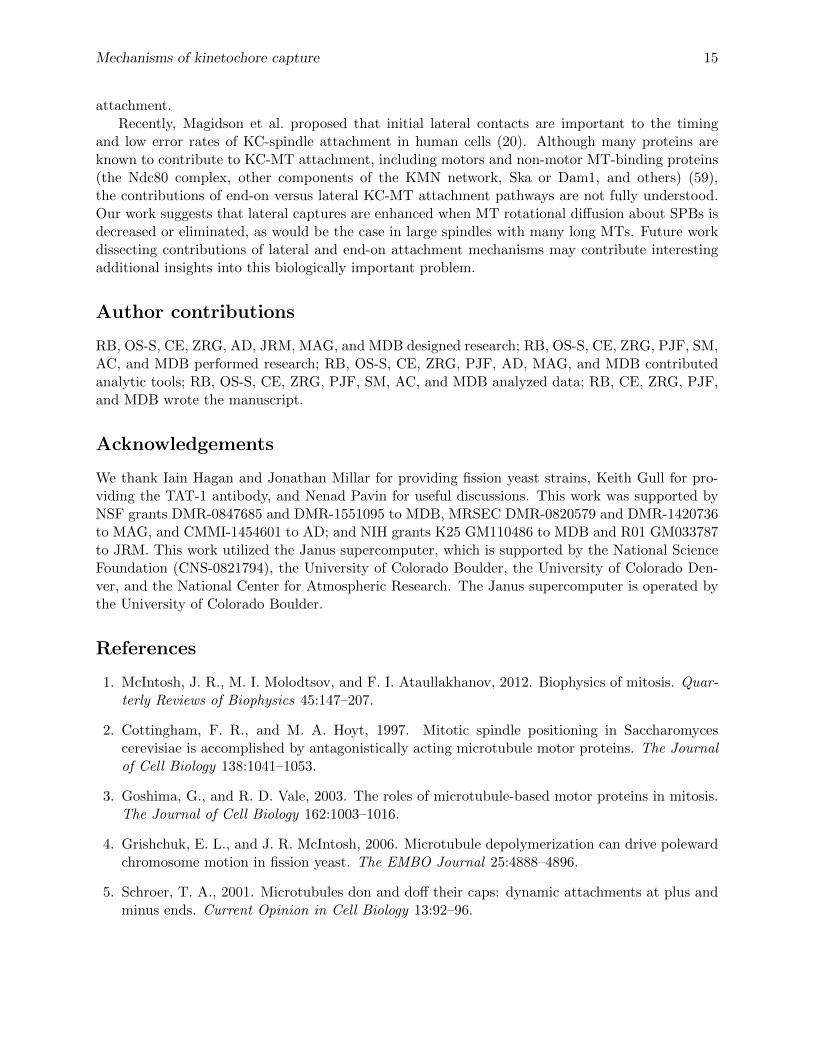
Figure 1: Kinetochore capture model overview. (A) Model schematic. A dynamic microtubule (blue) undergoesdynamic instability and rotational diffusion about its minus-end attachment point; a kinetochore (red) undergoestranslational diffusion within the spherical fission-yeast nucleus (gray). (B,C) Images created from simulation datashowing microtubule (line) and kinetochore (circle) dynamics. Color indicates time, where red reflects an earlyposition, purple a late one. (B) Model with microtubule dynamic instability but no rotational diffusion. (C) Modelwith dynamic instability and microtubule rotational diffusion. (D) Microtubule length and (E) fraction of lostkinetochores versus time for slow (blue) and fast (orange) models with the reference parameters (table 1).
We extended the Kalinina et al. model of fission-yeast KC capture (24) to include both MTrotational diffusion and dynamic instability in order to gauge their relative importance to KCcapture. We modeled both relatively slow dynamic instability (using measured parameters (24))and faster dynamic instability based on our measurements of single mitotic MTs in fission yeast.Rotational diffusion typically gave only a modest speed-up of KC capture in our model. For slowdynamics, rotational diffusion decreased the KC capture time by up to 25%, while for faster MTdynamics, rotational diffusion caused at most a 16% decrease in the capture time. Our resultssuggest that the capture time in fission yeast is primarily determined by MT search and capture.We also found that while lateral captures are typical even in the model with no rotational diffusion,including MT diffusion made end-on attachments more likely. This occurred because rotationaldiffusion sweeps the tip of the MT through space, increasing the volume searched by the tip.Our findings suggest that associating search and capture with end-on attachment and rotationaldiffusion with lateral attachment is oversimplified.
Mechanisms of kinetochore capture 4
Materials and methods
Kinetochore capture model
We developed a computational model of KC capture in fission yeast that includes the key physicaleffects of MT dynamic instability and rotational diffusion. Capture occurs within the sphericalnucleus of radius R = 1.5 µm. A dynamic MT has its minus end attached to the SPB (which isfixed for this study), rotationally diffuses, and has a length L(t) that changes with time due todynamic instability (fig. 1, S1). Simultaneously, a spherical KC of radius a = 100 nm diffuses in thenucleus (24). We assumed the fission yeast KC size remained constant during mitosis, in contrastto recent work on human KCs (20). KC capture occurs when the KC contacts the MT, either atits end or along its lateral wall.
The simulations used a hybrid Brownian dynamics-kinetic Monte Carlo scheme approach basedon our previous work (28–31). Brownian dynamics model the diffusive random motion of MTs andKCs; kinetic Monte Carlo models the stochastic MT dynamic instability (Supporting Material).
Slow and fast microtubule dynamics
We studied two MT dynamic instability models that represent relatively slow and fast dynamics(Supporting Material, fig. 1, table 1). Kalinina et al. found that MT dynamics were relativelyslow and MTs spent most of their time paused (24). Therefore, we modeled MTs with growing,shrinking, or paused states; the fixed-length paused state is an intermediate between the growingand shrinking states (Supporting Material). In other work on single fission yeast mitotic (32) andmeiotic (27) MTs and our measurements, MT dynamics were faster and pausing was rarely seen.We modeled this with growing and shrinking states only, where catastrophe is the transition fromgrowing to shrinking, and rescue the transition from shrinking to growing.
In our model, MTs in the growing or shrinking state increase or decrease in length at theconstant speed vg or vs. For MTs that are not interacting with the nuclear envelope boundaries,the state switching frequencies are constant in time. Any shrinking MTs that reach the minimumlength of 4σMT = 100 nm switch to the growing state (Supporting Material).
Microtubule interactions with the nuclear envelope
MTs that touch the nuclear envelope experience steric forces and torques from the interaction ofthe MT tip with the envelope (Supporting Material). The torque can cause the MT tip to slipalong the edge of the envelope, reorienting the MT, as has been measured and modeled previouslyfor MTs interacting with microchamber boundaries (33–35). In addition, MTs that grow intoa boundary exhibit increased catastrophe frequency (36). The force component along the MTlong axis increases the catastrophe frequency, as measured previously (37, 38). By combiningthese previous measurements of the force dependence of MT growth speed with the growth speeddependence of the catastrophe time, we wrote the catastrophe frequency fc(F||) = fc exp(αF||),where F|| is the component of the steric force along the MT long axis, α is the force sensitivity ofcatastrophe (table 1), and fc is the zero-force catastrophe frequency (or the analogous grow-to-pausefrequency in the model with pausing).
Initial conditions and measurements
We began simulations with a single MT of length 4σMT (100 nm) placed at a random angle subjectto the requirement that the MT was not initially interacting with the nuclear envelope. We inserted
Mechanisms of kinetochore capture 5
a KC at a random position uniformly sampled within the simulation volume, with the requirementthat the KC was not initially interacting with either the MT or the nuclear envelope. We ran thesimulation until the KC collided with the MT (either laterally or end-on), which defined a capture.For each parameter set, we repeated simulations 2000-5000 times to determine the distribution ofcapture times, shown as the fraction of lost KCs as a function of time in figs. 1D, S2. From thesedata, we computed the mean capture time 〈τc〉.
We defined reference parameter sets and wide parameter ranges around the reference for boththe slow and fast dynamic instability models (table 1). For both slow and fast models, we performedsimulations of dynamic instability with no MT rotational diffusion, and dynamic instability plusMT rotational diffusion. To connect to previous search-and-capture models, MTs that shrink tothe minimum length re-enter the growing state with a new random orientation.
Experimental methods
To understand the difference between previous measurements of fission-yeast mitotic MT dynamicsthat were relatively slow (24) or fast (32), we measured MT dynamic instability in S. pombe. Tofacilitate these measurements, we used a strain with temperature-sensitive inactivation of kinesin-5motors (cut7-24 in fission yeast) and low-level fluorescent tagging with mCherry-atb2 (39) (Sup-porting Material, table S1). Cells carrying the cut7-ts allele are unable to form bipolar mitoticspindles at restrictive temperature (36-37oC) (40). The cells instead form monopolar mitotic spin-dles, in which individual fluorescently labeled mitotic MTs can be imaged (fig. 2) (41).
Measurement of labeled tubulin fraction
We performed immunoblots using the TAT-1 tubulin antibody on S. pombe cell lysate with serialdilutions ranging from 100%-10% of the original cell suspension concentration (Supporting Material)and scanned the bands for analysis. The two lower, darker bands corresponded to α-tubulin-1(nda2) at 51 kDa and α-tubulin-2 (atb2) at 50 kDa, while the fainter third band corresponded tomCherry-atb2 at 79 kDa (fig. 2). To analyze the scanned images, we inverted the images so thatlabeled regions corresponded to high intensity, drew equally-sized regions of interest around eachband, and determined the average pixel intensity in each region. From this, we determined thefraction of intensity in the mCherry-atb2 band relative to the total. Each lane had similar ratios(data not shown), and we averaged the results for each lane.
Cell preparation and confocal imaging
We grew cells using standard techniques (Supporting Material) and cultured them on glass-bottomeddishes at 36oC for 2–4 hrs to allow monopolar spindles to form. The dishes were transferred to themicroscope in less than 60 sec to prevent the monopolar spindles from becoming bipolar. Imageswere taken on an spinning disk (Yokogawa, Musashino, Japan) Nikon Eclipse Ti inverted confocalmicroscope (Nikon, Tokyo, Japan) with a 100X, 1.4 NA Plan Apo oil-immersion objective, an iXonUltra 897 EM-CCD camera (Andor, Belfast, United Kingdom) and a TIZSH Stage Top incubator(Tokai Hit, Fujinomiya, Japan) warmed to 36oC. Three-dimensional images were obtained with anEM Gain of 300, and an exposure time per plane of 40 to 150 msec with 595 nm laser illuminationfor each of 5 focal planes separated by 500 nm in z, and subsequent stacks are separated by 4–6sec. Images of fig. 2A are displayed as pixel-interpolated maximum-intensity projections.
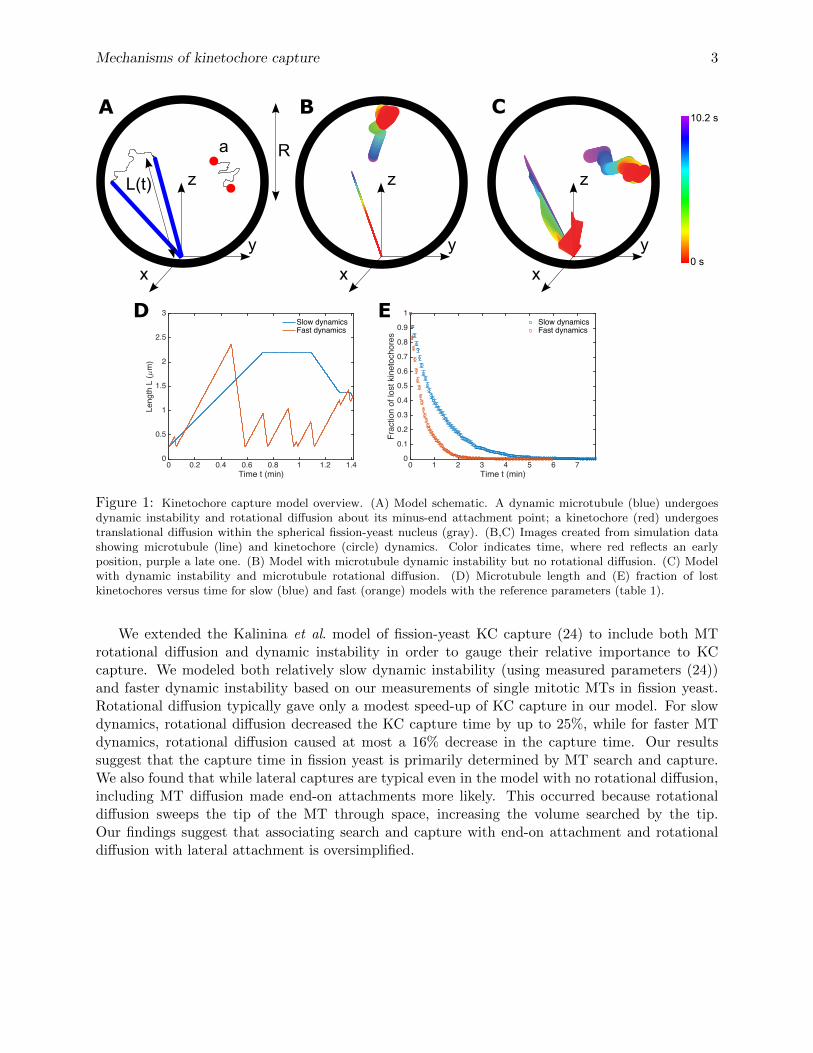
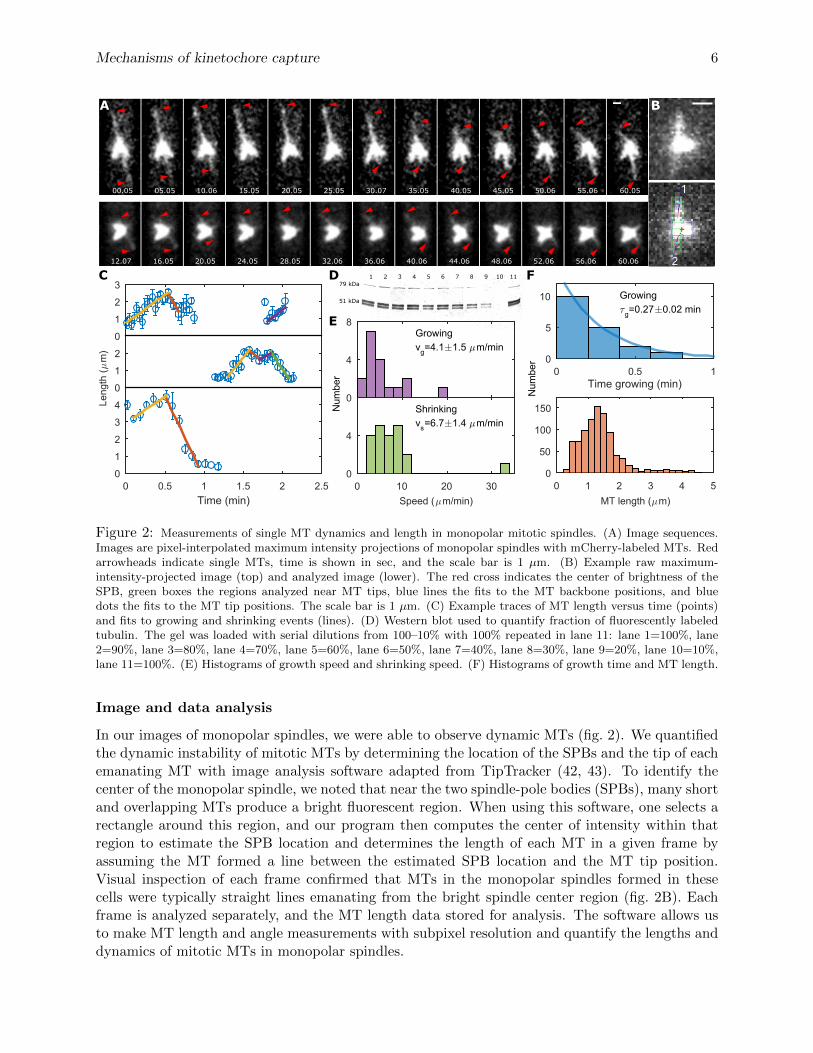
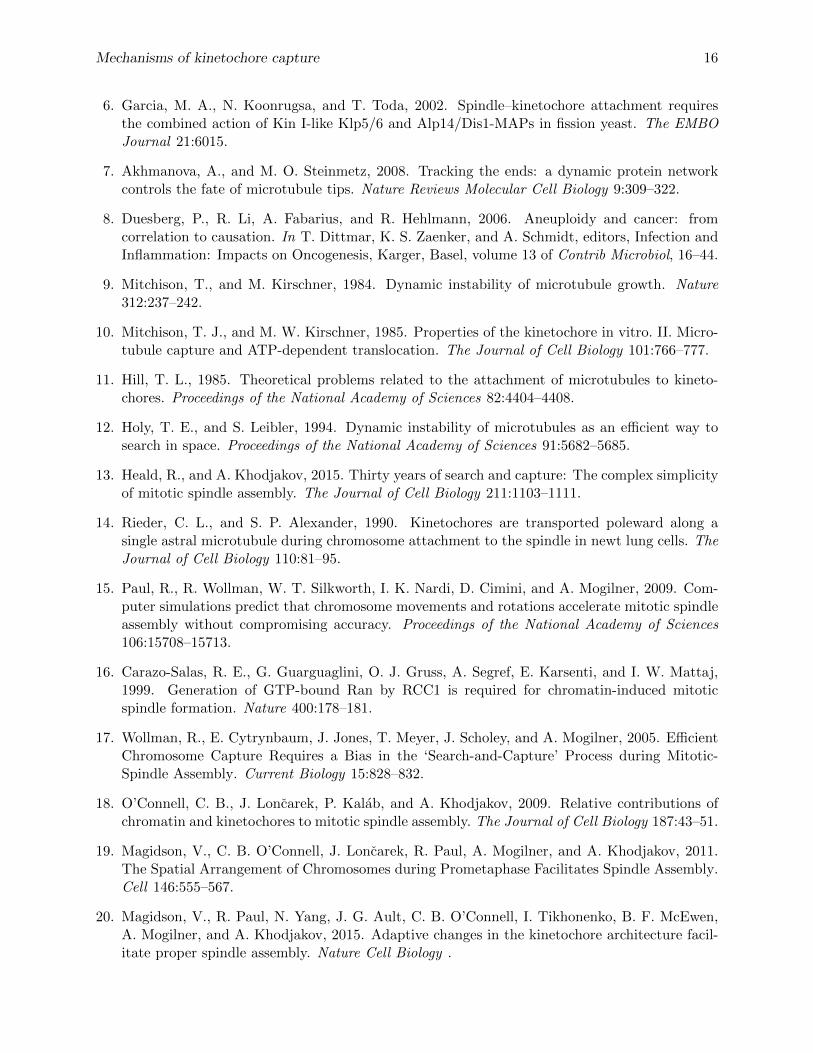
Figure 2: Measurements of single MT dynamics and length in monopolar mitotic spindles. (A) Image sequences.Images are pixel-interpolated maximum intensity projections of monopolar spindles with mCherry-labeled MTs. Redarrowheads indicate single MTs, time is shown in sec, and the scale bar is 1 µm. (B) Example raw maximum-intensity-projected image (top) and analyzed image (lower). The red cross indicates the center of brightness of theSPB, green boxes the regions analyzed near MT tips, blue lines the fits to the MT backbone positions, and bluedots the fits to the MT tip positions. The scale bar is 1 µm. (C) Example traces of MT length versus time (points)and fits to growing and shrinking events (lines). (D) Western blot used to quantify fraction of fluorescently labeledtubulin. The gel was loaded with serial dilutions from 100–10% with 100% repeated in lane 11: lane 1=100%, lane2=90%, lane 3=80%, lane 4=70%, lane 5=60%, lane 6=50%, lane 7=40%, lane 8=30%, lane 9=20%, lane 10=10%,lane 11=100%. (E) Histograms of growth speed and shrinking speed. (F) Histograms of growth time and MT length.
Image and data analysis
In our images of monopolar spindles, we were able to observe dynamic MTs (fig. 2). We quantifiedthe dynamic instability of mitotic MTs by determining the location of the SPBs and the tip of eachemanating MT with image analysis software adapted from TipTracker (42, 43). To identify thecenter of the monopolar spindle, we noted that near the two spindle-pole bodies (SPBs), many shortand overlapping MTs produce a bright fluorescent region. When using this software, one selects arectangle around this region, and our program then computes the center of intensity within thatregion to estimate the SPB location and determines the length of each MT in a given frame byassuming the MT formed a line between the estimated SPB location and the MT tip position.Visual inspection of each frame confirmed that MTs in the monopolar spindles formed in thesecells were typically straight lines emanating from the bright spindle center region (fig. 2B). Eachframe is analyzed separately, and the MT length data stored for analysis. The software allows usto make MT length and angle measurements with subpixel resolution and quantify the lengths anddynamics of mitotic MTs in monopolar spindles.
Mechanisms of kinetochore capture 7
Parameter Symbol Reference value Range NotesNuclear envelope radius R 1.5 µm – Kalinina et al. (24)KC diameter σKC 200 nm – Ding et al. (44)MT diameter σMT 25 nm – Alberts et al. (45)MT angular diffusion coefficient Dθ – Varies with MT length Kalinina et al. (24),
Slow dynamic instability modelGrowth speed vg 2.7 µm min−1 0.7–11 µm min−1 Kalinina et al. (24)Shrinking speed vs 3.8 µm min−1 1–16 µm min−1 Kalinina et al. (24)Grow-to-pause frequency f+0 1.8 min−1 0.4–7.1 min−1 Kalinina et al. (24)Shrink-to-pause frequency f−0 2.53 min−1 1.2–5 min−1 Kalinina et al. (24)Pause-to-shrink frequency f0− 0.49 min−1 0.2–1 min−1 Kalinina et al. (24)Pause-to-grow frequency f0+ 0 min−1 – Transitions from
pausing to growingappeared infrequentin Kalinina et al.(24)
Fast dynamic instability modelGrowth speed vg 4.1 µm min−1 1–10 µm min−1 This workShrinking speed vs 6.7 µm min−1 5–25 µm min−1 This work and
Sagolla et al. (32)Catastrophe frequency fcat 3.7 min−1 1–8 min−1 This workRescue frequency fres 0.175 min−1 0–8 min−1 This work
Table 1: Model parameter values.
We identified growth and shrinking events by comparing the movies and plots of MT lengthversus time to identify starting and ending times of events. We then performed weighted least-squares linear fits to the MT length versus time during each event (fig. 2). Growth and shrinkingspeeds were the slopes determined from the fits, and the catastrophe and rescue times were theduration of the events before a switch.
Results and discussion
Experimental results
Kalinina et al. (24) found that fission yeast mitotic MTs on average spent 75% of their time in apaused state and had lifetimes of 3 min, growth speed vg = 2.7 µm min−1, and shrinking speedvs = 3.8 µm min−1. These results differed from the results of Sagolla et al. (32), who observedhighly dynamic polar MTs in early mitosis (before spindle formation), with lifetimes of secondsand a shrinking speed vs = 20 µm min−1, and more recent work on meiotic MTs (27). Thesedifferences in lifetime and dynamics could be related to the stage of mitosis (before and afterspindle formation), the number of MTs per bundle, and/or to the fraction of fluorescent tubulin inthe cells (which affects MT dynamics (46)). The differences are most likely due to MT bundling,which alters MT dynamics (47, 48). Since KC capture could occur either by single MTs that aremore dynamic or bundled MTs that are more stable, we undertook additional measurements ofmitotic MT dynamic instability in S. pombe.
We adapted the strategy of Costa et al. (41), who used temperature-sensitive inactivation ofthe kinesin-5 motor (cut7-24 ) to obtain cells stably arrested in a monopolar state. Fission yeastcarrying the cut7-ts allele arrest in early mitosis at restrictive temperature (36-37oC), because
Mechanisms of kinetochore capture 8
bipolar spindles cannot form when cut7p is inactive (40). These cells instead form monopolarmitotic spindles, in which individual fluorescently labeled mitotic MTs can be imaged and tracked(fig. 2A, B) (41).
To measure MT length, we adapted the TipTracker algorithm (42, 43) to measure MT lengthsin monopolar spindles (Methods, fig. 2B). Brighter MTs showed lengths that were more stable intime, and dimmer MTs showed more rapid dynamics (fig. 2A). We identified the dimmer, moredynamic MTs as single MTs, as in previous work (41). We analyzed 20 MTs from 15 cells thatshowed low intensity compared to other MTs in the same cell and relatively fast dynamics. Wedetermined growth and shrinking events and their associated speeds and times (fig. 2C, Methods).
Fluorescent-protein fusions to tubulin in fission yeast can alter MT dynamics (46). We studiedfission yeast carrying mCherry-atb2 that is an additional copy of this α-tubulin gene under a weakpromoter (39). We used Western blotting to determine the fraction of tubulin our cells that wasfluorescently tagged (fig. 2D, Methods) and found a low fraction of 8.8% ± 0.5% labeled α-tubulin.
These MTs had a median growth speed vg = 4.1 ± 1.5 µm min−1 and shrinking speed vs =6.7± 1.4 µm min−1 (fig. 2E). The distribution of times in the growing state appeared exponentialwith a characteristic time τg = 0.27 ± 0.02 min, implying a catastrophe frequency of 3.7 min−1
(fig. 2F). Measuring the rescue frequency was challenging, because it was difficult to distinguishrescue from complete shrinkage followed by regrowth of a different MT in the same area. We sawone possible rescue event, which gave a bound fr ≤ 0.175 min−1.
Our data were collected at 37oC, and MT dynamic instability is sensitive to temperature (49).However, Kalinina et al. found relatively little change in fission-yeast MT dynamic instabilityparameters between 24oC and 32oC (24), suggesting that S. pombe mitotic MT dynamic instabilitymay not vary markedly with temperature in this regime. Another possible complication is that MTdynamics might be altered in the monopolar spindle system where kinesin-5 is inactive. Previouswork in budding yeast found that kinesin-5s promote disassembly of longer MTs (50). However,since we found similar MT mean lengths to those of Kalinina et al. (24), it appears that ourmeasurements do not show a strong bias toward longer MTs due to loss of kinesin-5-associateddepolymerization activity.
Pooled length measurements of MTs we identified as single MTs (including all measurements,not just points identified as growing/shrinking events) had a median 〈L〉 = 1.31±0.02 µm (fig. 2F).We compared this to the predicted mean length for dynamic instability in an infinite volume(neglecting boundary effects): in the bounded growth regime 〈L〉 = vgvs/(vsfc − vgfr) (51). If weestimate the mean length using our median dynamic instability parameters with the upper boundon the rescue frequency of fr ≤ 0.175 min−1, we predict 〈L〉 = 1.14 µm, while using fr = 0 gives〈L〉 = 1.11 µm. There is little difference between these values, showing that the mean MT length isprimarily determined by the growth speed and catastrophe frequency in this low-rescue-frequencyregime. This typical MT length estimated from the dynamic instability parameters is consistentwith our direct measurements of MT length.
Model results
Kinetochore capture by single microtubules with fast or slow dynamic instability
Since KC capture could occur either by single MTs that are more dynamic or bundled MTs that aremore stable, we sought to understand how these different MT arrangements affect KC capture infission yeast. We studied two reference parameter sets that we denote slow (based on the Kalininaet al. measurements) and fast (based on our measurements). In the slow model, MTs can begrowing, shrinking, or paused. The reference parameter values (table 1) were taken from Kalinina
Mechanisms of kinetochore capture 9
0 0.2 0.4 0.6 0.8 1 1.2 1.4Mean length L ( m)
-0.10
0.10.2
Frac
tiona
l cha
nge
inca
ptur
e tim
e c
0
50
100
150
200
250
300
350
400M
ean
capt
ure
time
c (m
in)
Slow dynamicsSlow dynamics + diffusion
0 0.5 1 1.5 2Mean length L ( m)
-0.10
0.10.2
Frac
tiona
l cha
nge
inca
ptur
e tim
e c
0
50
100
150
200
250
Mea
n ca
ptur
e tim
ec
(min
)
Fast dynamicsFast dynamics + diffusion
A B
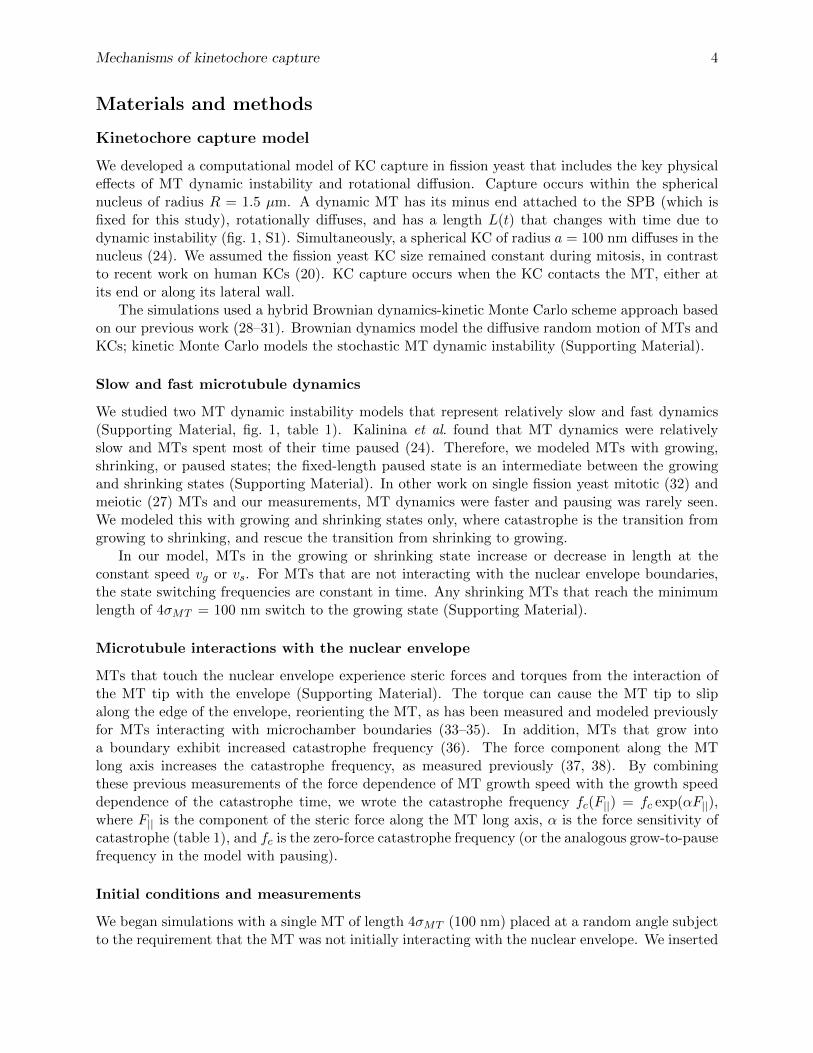
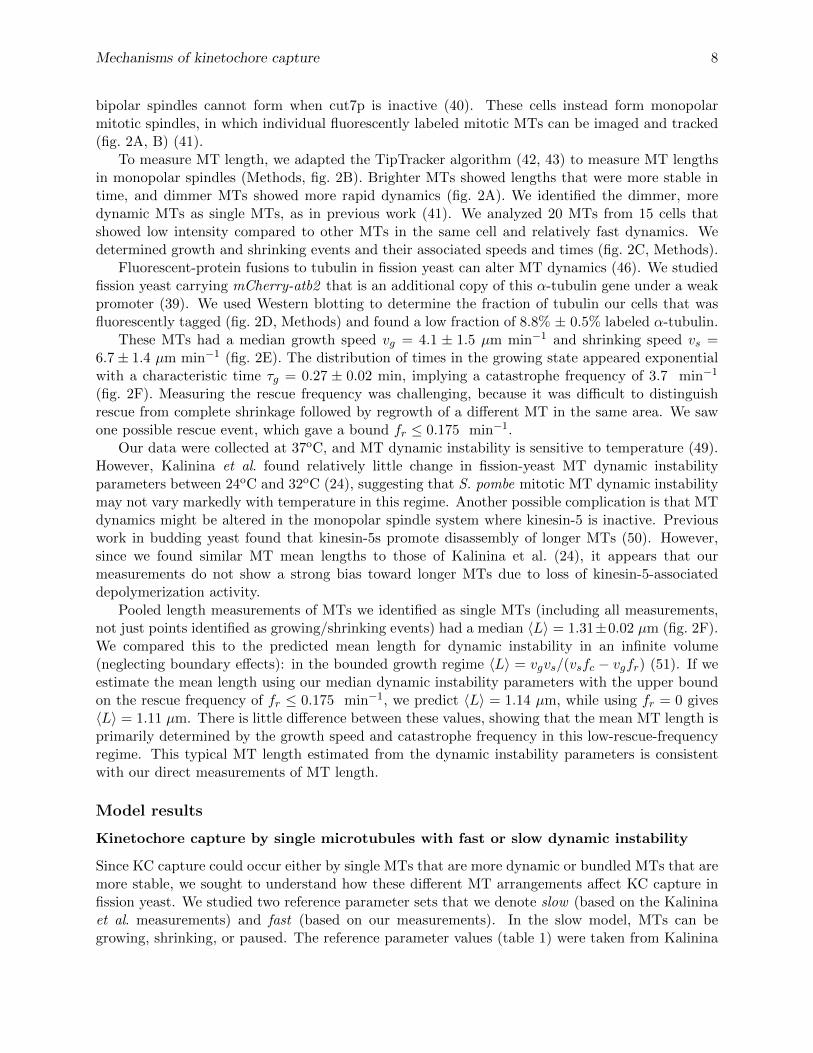
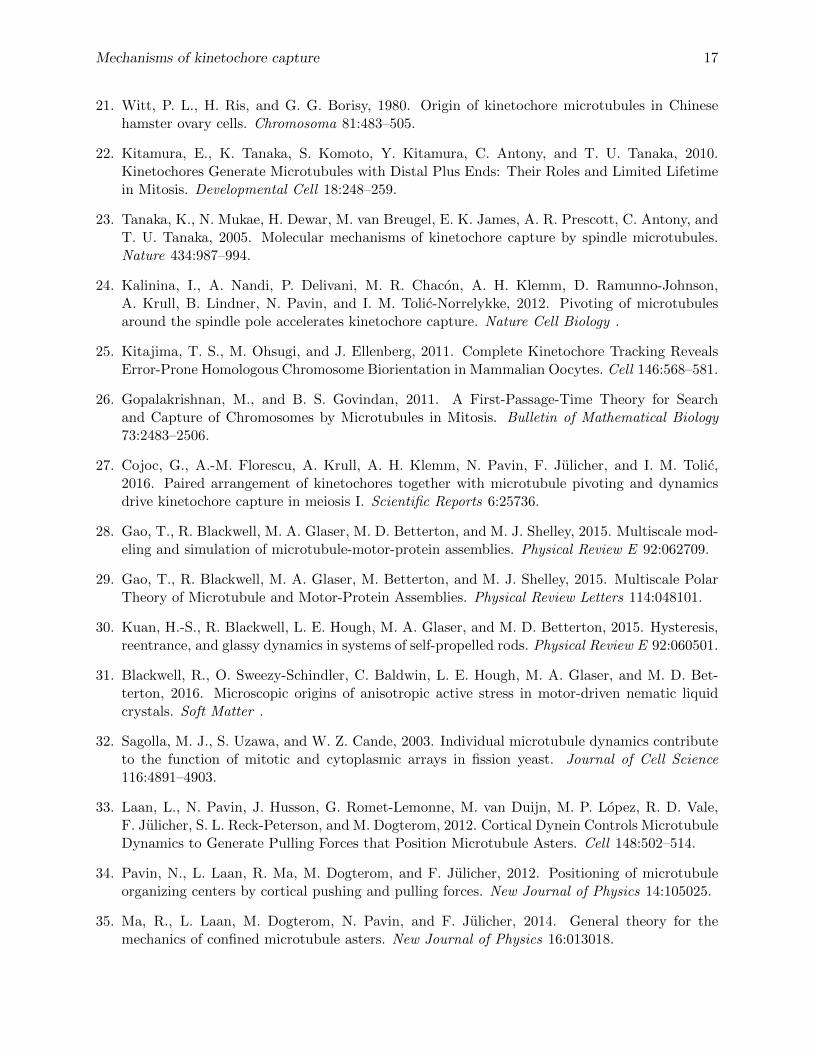
Figure 3: Dependence of capture time on MT length and rotational diffusion. (A) Slow model. (B) Fast model.Points are results simulations with all dynamics parameters varied for search and capture only (blue) and searchand capture with microtubule rotational diffusion (orange). Lines are fits to 〈τc〉 = A〈L〉−1 + B. Insets, fractionaldecrease in capture time when rotational diffusion is added to the model. Error bars are determined using standarderror propagation techniques from the standard error of the mean capture time in each bin of simulations.
et al., (24) assuming that transitions from pausing to growing did not occur. In the fast model,we considered only growing and shrinking states with reference parameter values determined fromour measurements. Examples of the resulting MT length as a function of time and the dynamicsof KC capture are shown in figure 1. For each model, we varied parameters around the referencevalues by factors of 4–20 (table 1) so that we could study the dependence of the capture time onparameter values. We then studied both slow and fast models with and without MT rotationaldiffusion, to determine the contributions of dynamic instability alone and dynamic instability withrotational diffusion to the capture time.
Kalinina et al. found that 3 polar MTs were typically visible during their KC capture exper-iments, and that the time of KC capture was sensitive to MT number (24). Here we determinedcapture times for a single MT. Our model results for capture by a single MT and slow dynamicinstability agree well with those of Kalinina et al. (fig. S2). Studying capture by single MTs allowedus to focus on the effect of dynamic instability parameters and rotational diffusion.
Parametric study using polynomial chaos expansion
To understand how the mean capture time 〈τc〉 and the mean MT length 〈L〉 depend on modelparameters (table 1), we used polynomial chaos (PC) expansion (52, 53), a widely used techniquefor uncertainty quantification. PC expansion is a type of spectral method in which we represent 〈τc〉and 〈L〉 as functions of the dynamic instability parameters in a high-order, multivariate, orthogonalpolynomial basis, here of Legendre type. This allowed us to use a relatively small number ofsimulations, corresponding to random samples of input parameters generated uniformly over theirallowed ranges (table 1), to accurately approximate 〈τc〉 and 〈L〉 over the full multidimensionalparameter space (54–56). We then used this expansion to perform global and local sensitivityanalysis to determine which dynamic instability parameters are of most importance to 〈τc〉 and〈L〉. The global sensitivity analysis provides information on the importance of each parameterin terms of its contribution to the overall solution variability, while the local analysis identifiesthe dependence of the solution on each parameter in the small neighborhood of its nominal value.To construct the PC expansions, here of total degree three, we used a regression approach based
Mechanisms of kinetochore capture 10
on `1-minimization (54–56) using 250 randomly sampled parameter sets, and the correspondingrealizations of 〈τc〉 and 〈L〉. In figs. 3 and 4–6 below, each point corresponds to one of the 250parameter sets.
Effects of varying mean MT length
The rotational diffusion coefficient of a rod varies as L−3, making MT length important for KCcapture by a fixed-length MT (24). We found that the MT mean length was also important forKC capture with dynamic instability. Indeed, the primary determinant of the capture time was themean MT length (fig. 3), for all models studied. The capture time decreased by approximately afactor of 10 as 〈L〉 increased from short (. 0.3 µm) to long (& 1.5 µm, half the nuclear diameter).A longer MT increases the effective number of binding sites for a KC, lowering the capture time.If the number of binding sites were the sole factor determining the rate of KC capture, we wouldexpect 〈τc〉 ∼ 〈L〉−1. The dependence in our model is more complex, because the MT dynamicsalso change with 〈L〉. Nevertheless, fitting the capture time as a function of the mean length tothe form 〈τc〉 = A〈L〉−1 + B (solid lines in fig. 3) gave reasonable agreement with our simulationresults.
For all MT lengths and both slow and fast dynamic instability, adding MT rotational diffusionto a model with only dynamic instability reduced the capture time. The contribution of rotationaldiffusion depended on the MT dynamics: 〈τc〉 decreased by 23% on average (25% at most) for theslow model, and by 9% on average (16% at most) for the fast model. The speed up due to rotationaldiffusion was larger for slower MT dynamics and shorter MTs (fig. 3). For the most relevant MTlengths in fission yeast of around 1 µm, rotational diffusion shortened the capture time by at most14% for the slow model and 6% for the fast model. This suggests that while rotational diffusiondoes speed up KC capture, it makes a relatively small quantitative contribution, consistent withrecent work (27).
Sensitivity analysis
We performed sensitivity analysis to check how the capture time and MT mean length vary withmodel parameters. For dynamic instability with no boundary effects, we would expect a meanlength of 〈L〉 = vg/f+0 in the slow model and 〈L〉 = vgvs/(vsfc − vgfr) ≈ vg/fc in the fast model((51) and Supporting Material). While interactions of MTs with the nuclear envelope alter thisrelationship, we expected that the MT mean length and therefore the capture time depend primarilyon the MT growth speed and the catastrophe frequency (or its analogue in the slow model, thegrow-to-pause frequency).
To test these relationships, we performed a global sensitivity analysis of the mean capture timeand MT length to the dynamic instability parameters using the analysis of the variance of 〈τc〉 and〈L〉 based on the so-called Sobol’ decomposition (57), which we computed directly using the PCexpansion ((58) and Supporting Material). The PC expansion gave low errors of a few percent(table S2), indicating that it accurately describes the full simulation model. As expected, 〈τc〉 and〈L〉 are most sensitive to the growth speed and effective catastrophe frequency, and this dependenceis not altered significantly by the addition of rotational diffusion to the model (table S3). We alsodetermined the local sensitivity of the capture time to these parameters (Supporting Material, fig.S3).
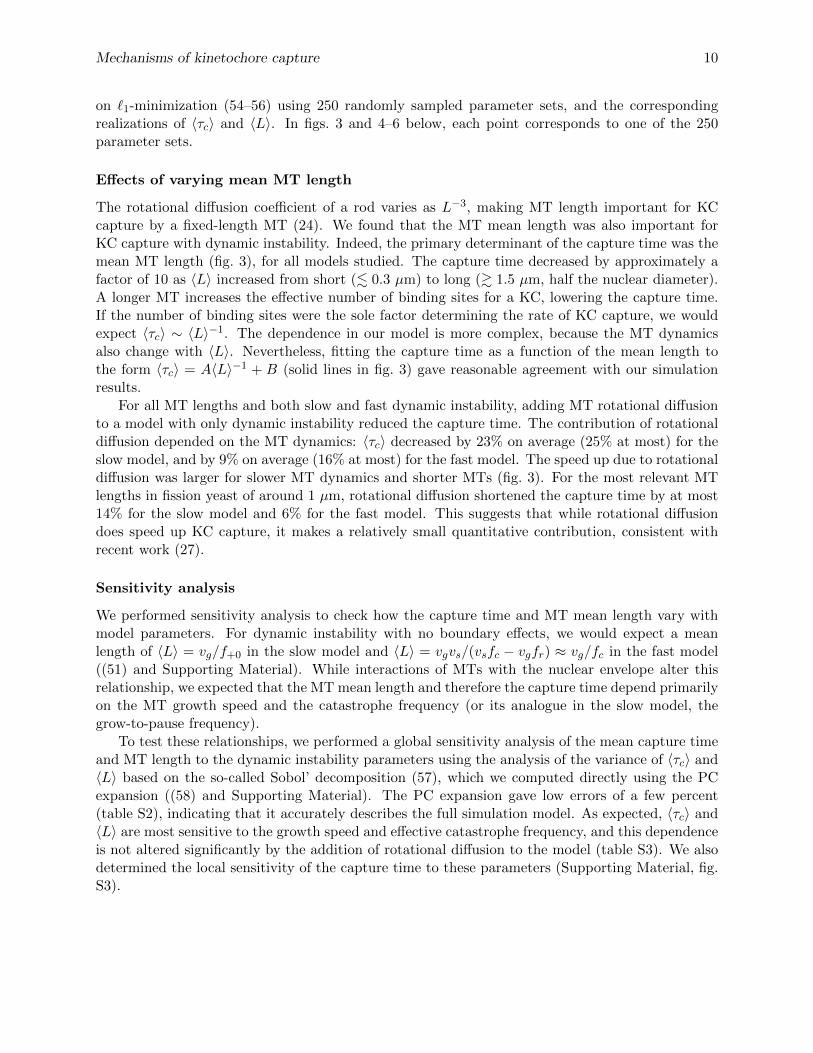
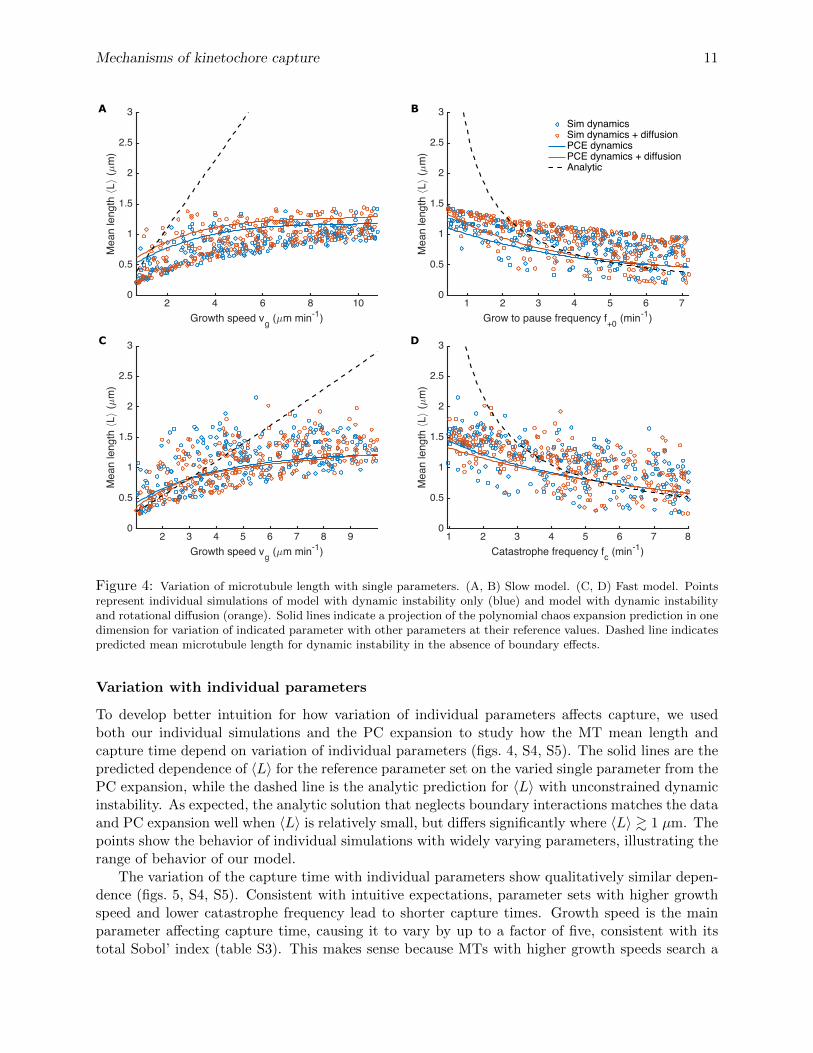
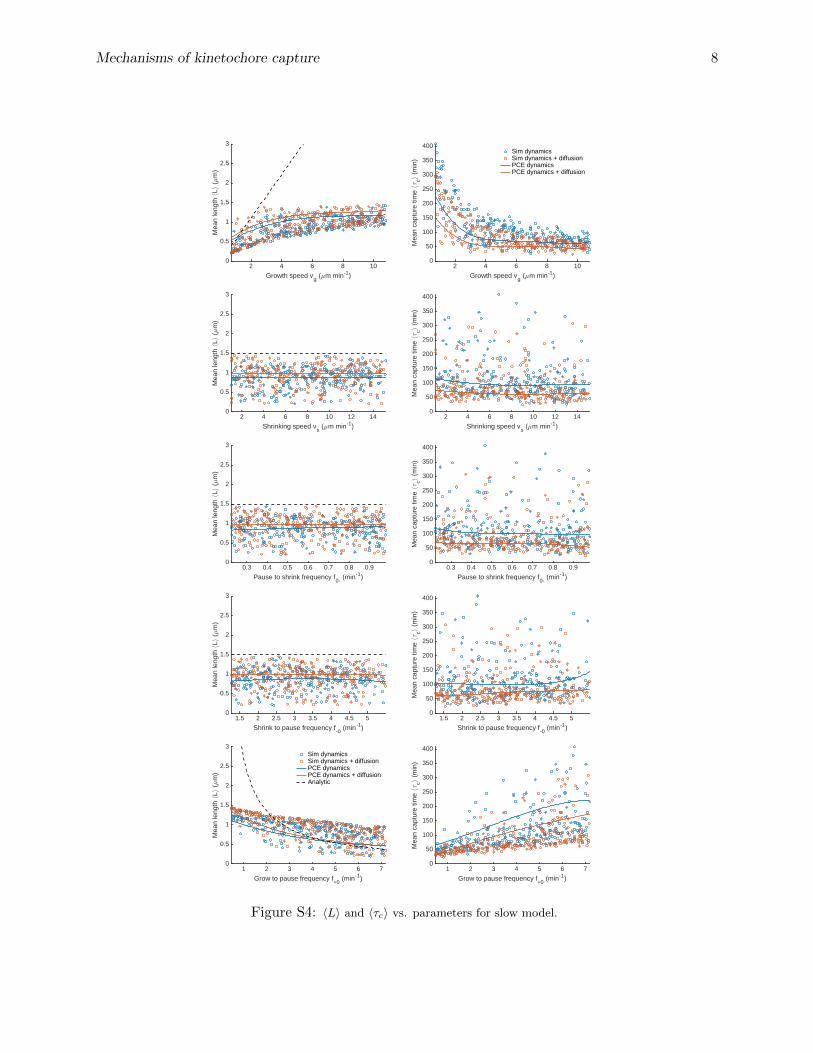
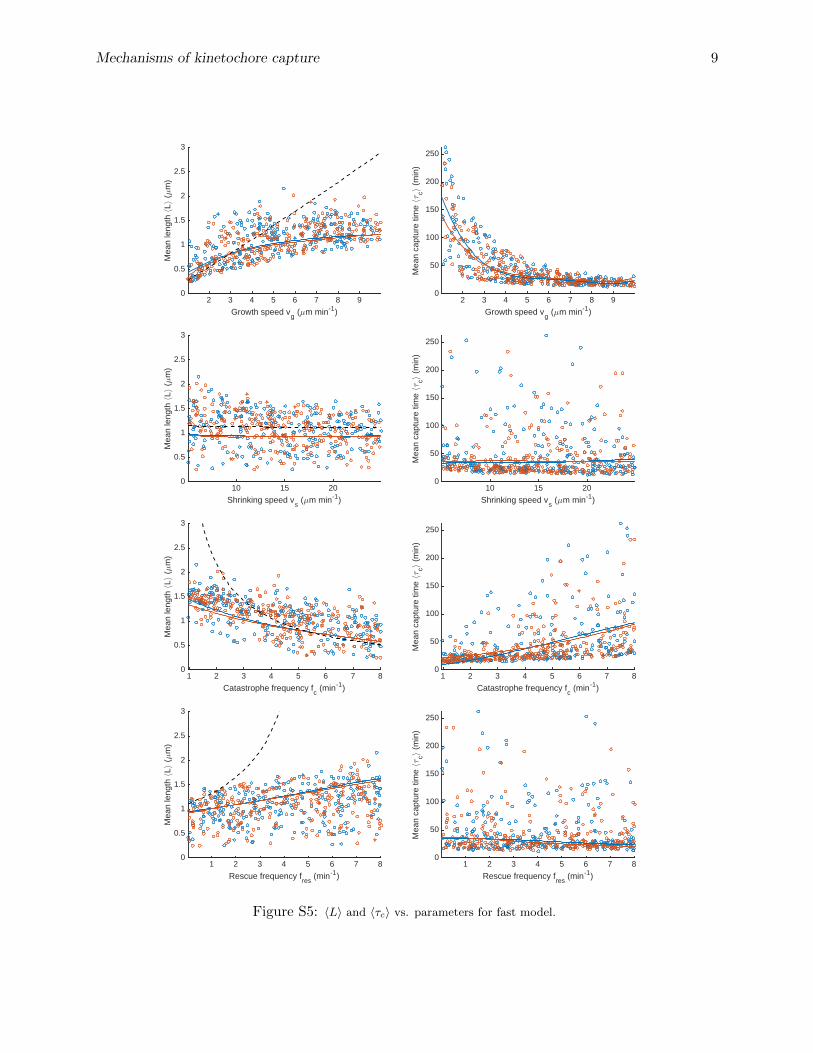
Figure 4: Variation of microtubule length with single parameters. (A, B) Slow model. (C, D) Fast model. Pointsrepresent individual simulations of model with dynamic instability only (blue) and model with dynamic instabilityand rotational diffusion (orange). Solid lines indicate a projection of the polynomial chaos expansion prediction in onedimension for variation of indicated parameter with other parameters at their reference values. Dashed line indicatespredicted mean microtubule length for dynamic instability in the absence of boundary effects.
Variation with individual parameters
To develop better intuition for how variation of individual parameters affects capture, we usedboth our individual simulations and the PC expansion to study how the MT mean length andcapture time depend on variation of individual parameters (figs. 4, S4, S5). The solid lines are thepredicted dependence of 〈L〉 for the reference parameter set on the varied single parameter from thePC expansion, while the dashed line is the analytic prediction for 〈L〉 with unconstrained dynamicinstability. As expected, the analytic solution that neglects boundary interactions matches the dataand PC expansion well when 〈L〉 is relatively small, but differs significantly where 〈L〉 & 1 µm. Thepoints show the behavior of individual simulations with widely varying parameters, illustrating therange of behavior of our model.
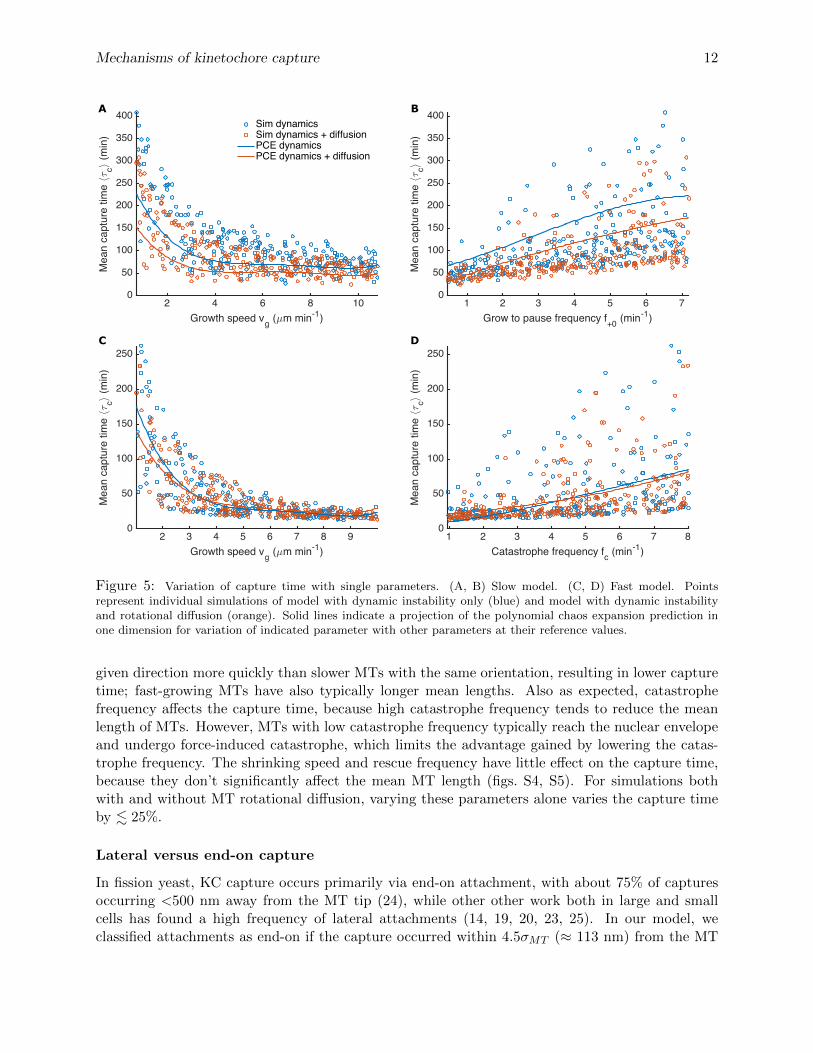
The variation of the capture time with individual parameters show qualitatively similar depen-dence (figs. 5, S4, S5). Consistent with intuitive expectations, parameter sets with higher growthspeed and lower catastrophe frequency lead to shorter capture times. Growth speed is the mainparameter affecting capture time, causing it to vary by up to a factor of five, consistent with itstotal Sobol’ index (table S3). This makes sense because MTs with higher growth speeds search a
Figure 5: Variation of capture time with single parameters. (A, B) Slow model. (C, D) Fast model. Pointsrepresent individual simulations of model with dynamic instability only (blue) and model with dynamic instabilityand rotational diffusion (orange). Solid lines indicate a projection of the polynomial chaos expansion prediction inone dimension for variation of indicated parameter with other parameters at their reference values.
given direction more quickly than slower MTs with the same orientation, resulting in lower capturetime; fast-growing MTs have also typically longer mean lengths. Also as expected, catastrophefrequency affects the capture time, because high catastrophe frequency tends to reduce the meanlength of MTs. However, MTs with low catastrophe frequency typically reach the nuclear envelopeand undergo force-induced catastrophe, which limits the advantage gained by lowering the catas-trophe frequency. The shrinking speed and rescue frequency have little effect on the capture time,because they don’t significantly affect the mean MT length (figs. S4, S5). For simulations bothwith and without MT rotational diffusion, varying these parameters alone varies the capture timeby . 25%.
Lateral versus end-on capture
In fission yeast, KC capture occurs primarily via end-on attachment, with about 75% of capturesoccurring <500 nm away from the MT tip (24), while other other work both in large and smallcells has found a high frequency of lateral attachments (14, 19, 20, 23, 25). In our model, weclassified attachments as end-on if the capture occurred within 4.5σMT (≈ 113 nm) from the MT
Mechanisms of kinetochore capture 13
0.5 1 1.5 2Mean length L ( m)
0
0.1
0.2
0.3
0.4
0.5
0.6
0.7
0.8
0.9
1
Prob
abilit
y of
late
ral c
aptu
re
Fast dynamicsFast dynamics + diffusion
0.4 0.6 0.8 1 1.2 1.4Mean length L ( m)
0
0.1
0.2
0.3
0.4
0.5
0.6
0.7
0.8
0.9
1Pr
obab
ility
of la
tera
l cap
ture
Slow dynamicsSlow dynamics + diffusion
BA
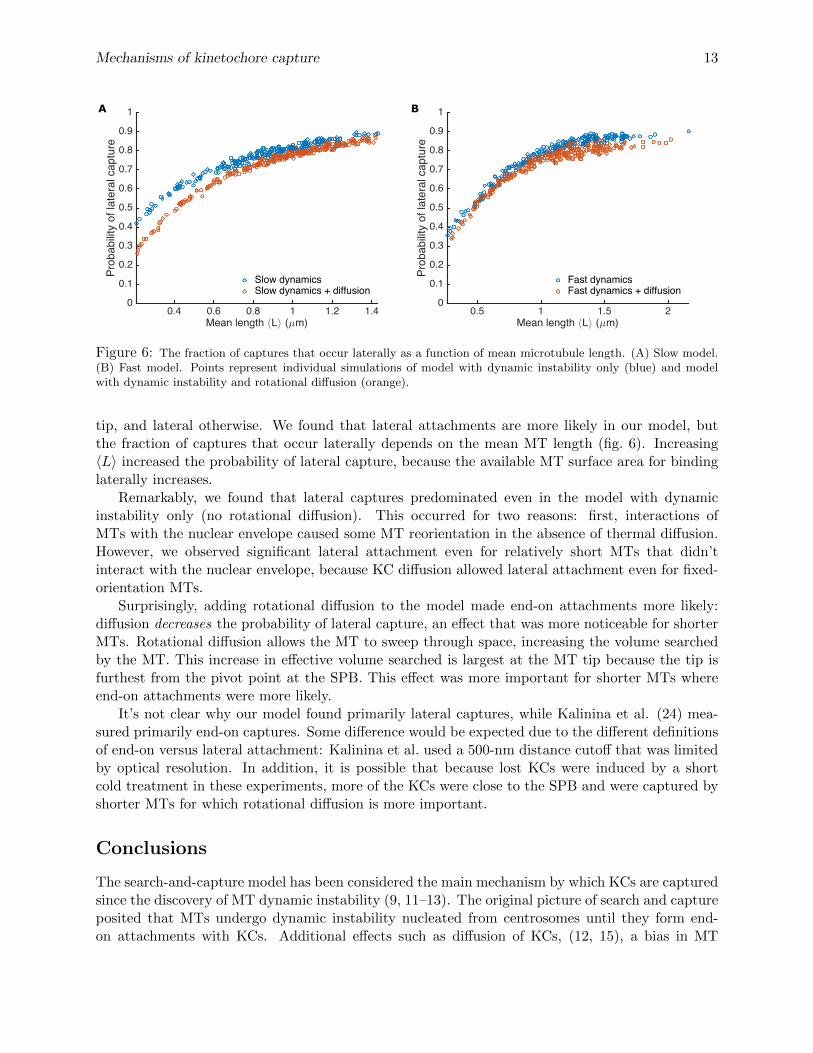
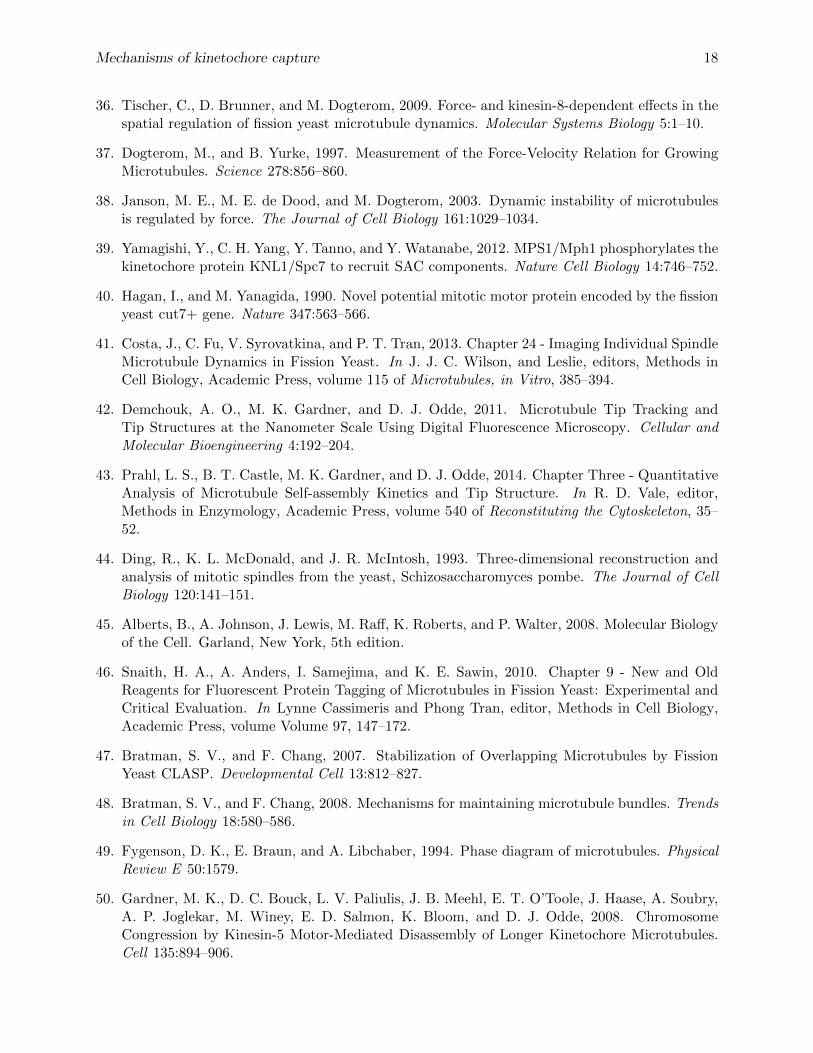
Figure 6: The fraction of captures that occur laterally as a function of mean microtubule length. (A) Slow model.(B) Fast model. Points represent individual simulations of model with dynamic instability only (blue) and modelwith dynamic instability and rotational diffusion (orange).
tip, and lateral otherwise. We found that lateral attachments are more likely in our model, butthe fraction of captures that occur laterally depends on the mean MT length (fig. 6). Increasing〈L〉 increased the probability of lateral capture, because the available MT surface area for bindinglaterally increases.
Remarkably, we found that lateral captures predominated even in the model with dynamicinstability only (no rotational diffusion). This occurred for two reasons: first, interactions ofMTs with the nuclear envelope caused some MT reorientation in the absence of thermal diffusion.However, we observed significant lateral attachment even for relatively short MTs that didn’tinteract with the nuclear envelope, because KC diffusion allowed lateral attachment even for fixed-orientation MTs.
Surprisingly, adding rotational diffusion to the model made end-on attachments more likely:diffusion decreases the probability of lateral capture, an effect that was more noticeable for shorterMTs. Rotational diffusion allows the MT to sweep through space, increasing the volume searchedby the MT. This increase in effective volume searched is largest at the MT tip because the tip isfurthest from the pivot point at the SPB. This effect was more important for shorter MTs whereend-on attachments were more likely.
It’s not clear why our model found primarily lateral captures, while Kalinina et al. (24) mea-sured primarily end-on captures. Some difference would be expected due to the different definitionsof end-on versus lateral attachment: Kalinina et al. used a 500-nm distance cutoff that was limitedby optical resolution. In addition, it is possible that because lost KCs were induced by a shortcold treatment in these experiments, more of the KCs were close to the SPB and were captured byshorter MTs for which rotational diffusion is more important.
Conclusions
The search-and-capture model has been considered the main mechanism by which KCs are capturedsince the discovery of MT dynamic instability (9, 11–13). The original picture of search and captureposited that MTs undergo dynamic instability nucleated from centrosomes until they form end-on attachments with KCs. Additional effects such as diffusion of KCs, (12, 15), a bias in MT
Mechanisms of kinetochore capture 14
growth toward chromosomes (16–18), MT nucleation from KCs (15, 21, 22), spatial distributionand rotation of chromosomes (15, 19, 20), and KC size decreases after capture (20) can makesearch and capture more rapid. MT rotational diffusion and lateral capture were found to beimportant mechanisms in fission yeast (24). This work suggested that MT rotational diffusionabout centrosomes is important, but because the model assumed fixed-length MTs it was unableto directly evaluate the relative importance of rotational diffusion and dynamic instability to KCcapture.
We developed a biophysical model of KC capture in fission yeast that includes MT dynamicinstability and rotational diffusion, KC diffusion, and interactions with the nuclear envelope (fig. 1).We used the model to compare the time course of KC capture in models with and without MTrotational diffusion. The mitotic MTs measured by Kalinina et al. were primarily paused (24), andthe measured dynamics appeared slow compared to previous measurements (32). Therefore, weperformed further measurements of the dynamics of MTs in fission yeast monopolar spindles withlow-level fluorescent tubulin labeling. We found more rapid dynamic instability of single MTs, withlittle pausing (fig. 2). This motivated us to consider two dynamic instability models: a slow modelwith dynamics measured by Kalinina et al., and a fast model with dynamics measured in this work(table 1).
We studied KC capture by single MTs in our model both for the reference parameter sets andfor broad ranges of parameters around the reference sets. In all cases, KC capture occurred morequickly when rotational diffusion about SPBs was added to a model with only dynamic instability(fig. 3): 〈τc〉 decreased by 23% on average for the slow model, and by 9% on average for the fastmodel, similar to recent work (27). We found that the primary determinant of the capture time wasthe mean MT length. Longer MTs have a larger surface on which the KC can bind, which suggeststhat the capture time 〈τc〉 ∼ 〈L〉−1, as we observed. Since the MT growth speed and catastrophefrequency controlled the mean length in the parameter regimes we studied, these parameters hadthe biggest effect on the capture time (table S3, fig. S3).
For the experimentally measured mitotic polar MT lengths of ∼ 1 µm in fission yeast, addingrotational diffusion to our model shortened the capture time by 14% for the slow model and 6%for the fast model. This suggests that rotational diffusion causes relatively small changes to thecapture time for typical conditions in fission yeast. We note that our model, like that of Kalininaet al. (24) considered the capturing MT only and neglected the bipolar spindle that assembles inprometaphase and the possibility of capturing MTs from the other spindle-pole body. Because theassembled spindle alters the rotational freedom of mitotic polar MTs, in future work it would beinteresting to study how the presence of the spindle affects the kinetics of KC capture.
We further examined how MT length (fig. 4) and capture time (fig. 5) varied with the growthspeed and catastrophe frequency. The mean length varied qualitatively as expected from thepredictions of analytic theory that neglects MT interactions with the nuclear envelope. In thecomputational model, changes from this theory became significant for longer MTs. Parameter setswith higher growth speed and lower catastrophe frequency that lead to longer mean MT lengthshad shorter capture times.
The original search-and-capture model supposed that KC attachments to MTs are end on, con-sistent with the results of Kalinina et al. (24), while others observed primarily lateral attachments(14, 19, 20, 23, 25). Therefore, we studied how the probability of lateral or end-on attachmentvaried with MT length and the presence or absence of rotational diffusion in the model (fig. 6).Lateral captures predominated, even in the absence of MT rotational diffusion. Somewhat coun-terintuitively, we found that adding rotational diffusion to the model made end-on attachmentsmore likely. A diffusing MT searches a larger volume of space than a rotationally constrainedMT, an effect which is largest for the MT tip. Therefore, rotational diffusion can decrease lateral
Mechanisms of kinetochore capture 15
attachment.Recently, Magidson et al. proposed that initial lateral contacts are important to the timing
and low error rates of KC-spindle attachment in human cells (20). Although many proteins areknown to contribute to KC-MT attachment, including motors and non-motor MT-binding proteins(the Ndc80 complex, other components of the KMN network, Ska or Dam1, and others) (59),the contributions of end-on versus lateral KC-MT attachment pathways are not fully understood.Our work suggests that lateral captures are enhanced when MT rotational diffusion about SPBs isdecreased or eliminated, as would be the case in large spindles with many long MTs. Future workdissecting contributions of lateral and end-on attachment mechanisms may contribute interestingadditional insights into this biologically important problem.
Author contributions
RB, OS-S, CE, ZRG, AD, JRM, MAG, and MDB designed research; RB, OS-S, CE, ZRG, PJF, SM,AC, and MDB performed research; RB, OS-S, CE, ZRG, PJF, AD, MAG, and MDB contributedanalytic tools; RB, OS-S, CE, ZRG, PJF, SM, AC, and MDB analyzed data; RB, CE, ZRG, PJF,and MDB wrote the manuscript.
Acknowledgements
We thank Iain Hagan and Jonathan Millar for providing fission yeast strains, Keith Gull for pro-viding the TAT-1 antibody, and Nenad Pavin for useful discussions. This work was supported byNSF grants DMR-0847685 and DMR-1551095 to MDB, MRSEC DMR-0820579 and DMR-1420736to MAG, and CMMI-1454601 to AD; and NIH grants K25 GM110486 to MDB and R01 GM033787to JRM. This work utilized the Janus supercomputer, which is supported by the National ScienceFoundation (CNS-0821794), the University of Colorado Boulder, the University of Colorado Den-ver, and the National Center for Atmospheric Research. The Janus supercomputer is operated bythe University of Colorado Boulder.
References
1. McIntosh, J. R., M. I. Molodtsov, and F. I. Ataullakhanov, 2012. Biophysics of mitosis. Quar-terly Reviews of Biophysics 45:147–207.
2. Cottingham, F. R., and M. A. Hoyt, 1997. Mitotic spindle positioning in Saccharomycescerevisiae is accomplished by antagonistically acting microtubule motor proteins. The Journalof Cell Biology 138:1041–1053.
3. Goshima, G., and R. D. Vale, 2003. The roles of microtubule-based motor proteins in mitosis.The Journal of Cell Biology 162:1003–1016.
4. Grishchuk, E. L., and J. R. McIntosh, 2006. Microtubule depolymerization can drive polewardchromosome motion in fission yeast. The EMBO Journal 25:4888–4896.
5. Schroer, T. A., 2001. Microtubules don and doff their caps: dynamic attachments at plus andminus ends. Current Opinion in Cell Biology 13:92–96.
Mechanisms of kinetochore capture 16
6. Garcia, M. A., N. Koonrugsa, and T. Toda, 2002. Spindle–kinetochore attachment requiresthe combined action of Kin I-like Klp5/6 and Alp14/Dis1-MAPs in fission yeast. The EMBOJournal 21:6015.
7. Akhmanova, A., and M. O. Steinmetz, 2008. Tracking the ends: a dynamic protein networkcontrols the fate of microtubule tips. Nature Reviews Molecular Cell Biology 9:309–322.
8. Duesberg, P., R. Li, A. Fabarius, and R. Hehlmann, 2006. Aneuploidy and cancer: fromcorrelation to causation. In T. Dittmar, K. S. Zaenker, and A. Schmidt, editors, Infection andInflammation: Impacts on Oncogenesis, Karger, Basel, volume 13 of Contrib Microbiol, 16–44.
9. Mitchison, T., and M. Kirschner, 1984. Dynamic instability of microtubule growth. Nature312:237–242.
10. Mitchison, T. J., and M. W. Kirschner, 1985. Properties of the kinetochore in vitro. II. Micro-tubule capture and ATP-dependent translocation. The Journal of Cell Biology 101:766–777.
11. Hill, T. L., 1985. Theoretical problems related to the attachment of microtubules to kineto-chores. Proceedings of the National Academy of Sciences 82:4404–4408.
12. Holy, T. E., and S. Leibler, 1994. Dynamic instability of microtubules as an efficient way tosearch in space. Proceedings of the National Academy of Sciences 91:5682–5685.
13. Heald, R., and A. Khodjakov, 2015. Thirty years of search and capture: The complex simplicityof mitotic spindle assembly. The Journal of Cell Biology 211:1103–1111.
14. Rieder, C. L., and S. P. Alexander, 1990. Kinetochores are transported poleward along asingle astral microtubule during chromosome attachment to the spindle in newt lung cells. TheJournal of Cell Biology 110:81–95.
15. Paul, R., R. Wollman, W. T. Silkworth, I. K. Nardi, D. Cimini, and A. Mogilner, 2009. Com-puter simulations predict that chromosome movements and rotations accelerate mitotic spindleassembly without compromising accuracy. Proceedings of the National Academy of Sciences106:15708–15713.
16. Carazo-Salas, R. E., G. Guarguaglini, O. J. Gruss, A. Segref, E. Karsenti, and I. W. Mattaj,1999. Generation of GTP-bound Ran by RCC1 is required for chromatin-induced mitoticspindle formation. Nature 400:178–181.
17. Wollman, R., E. Cytrynbaum, J. Jones, T. Meyer, J. Scholey, and A. Mogilner, 2005. EfficientChromosome Capture Requires a Bias in the ‘Search-and-Capture’ Process during Mitotic-Spindle Assembly. Current Biology 15:828–832.
18. O’Connell, C. B., J. Loncarek, P. Kalab, and A. Khodjakov, 2009. Relative contributions ofchromatin and kinetochores to mitotic spindle assembly. The Journal of Cell Biology 187:43–51.
19. Magidson, V., C. B. O’Connell, J. Loncarek, R. Paul, A. Mogilner, and A. Khodjakov, 2011.The Spatial Arrangement of Chromosomes during Prometaphase Facilitates Spindle Assembly.Cell 146:555–567.
20. Magidson, V., R. Paul, N. Yang, J. G. Ault, C. B. O’Connell, I. Tikhonenko, B. F. McEwen,A. Mogilner, and A. Khodjakov, 2015. Adaptive changes in the kinetochore architecture facil-itate proper spindle assembly. Nature Cell Biology .
Mechanisms of kinetochore capture 17
21. Witt, P. L., H. Ris, and G. G. Borisy, 1980. Origin of kinetochore microtubules in Chinesehamster ovary cells. Chromosoma 81:483–505.
22. Kitamura, E., K. Tanaka, S. Komoto, Y. Kitamura, C. Antony, and T. U. Tanaka, 2010.Kinetochores Generate Microtubules with Distal Plus Ends: Their Roles and Limited Lifetimein Mitosis. Developmental Cell 18:248–259.
23. Tanaka, K., N. Mukae, H. Dewar, M. van Breugel, E. K. James, A. R. Prescott, C. Antony, andT. U. Tanaka, 2005. Molecular mechanisms of kinetochore capture by spindle microtubules.Nature 434:987–994.
24. Kalinina, I., A. Nandi, P. Delivani, M. R. Chacon, A. H. Klemm, D. Ramunno-Johnson,A. Krull, B. Lindner, N. Pavin, and I. M. Tolic-Norrelykke, 2012. Pivoting of microtubulesaround the spindle pole accelerates kinetochore capture. Nature Cell Biology .
25. Kitajima, T. S., M. Ohsugi, and J. Ellenberg, 2011. Complete Kinetochore Tracking RevealsError-Prone Homologous Chromosome Biorientation in Mammalian Oocytes. Cell 146:568–581.
26. Gopalakrishnan, M., and B. S. Govindan, 2011. A First-Passage-Time Theory for Searchand Capture of Chromosomes by Microtubules in Mitosis. Bulletin of Mathematical Biology73:2483–2506.
27. Cojoc, G., A.-M. Florescu, A. Krull, A. H. Klemm, N. Pavin, F. Julicher, and I. M. Tolic,2016. Paired arrangement of kinetochores together with microtubule pivoting and dynamicsdrive kinetochore capture in meiosis I. Scientific Reports 6:25736.
28. Gao, T., R. Blackwell, M. A. Glaser, M. D. Betterton, and M. J. Shelley, 2015. Multiscale mod-eling and simulation of microtubule-motor-protein assemblies. Physical Review E 92:062709.
29. Gao, T., R. Blackwell, M. A. Glaser, M. Betterton, and M. J. Shelley, 2015. Multiscale PolarTheory of Microtubule and Motor-Protein Assemblies. Physical Review Letters 114:048101.
30. Kuan, H.-S., R. Blackwell, L. E. Hough, M. A. Glaser, and M. D. Betterton, 2015. Hysteresis,reentrance, and glassy dynamics in systems of self-propelled rods. Physical Review E 92:060501.
31. Blackwell, R., O. Sweezy-Schindler, C. Baldwin, L. E. Hough, M. A. Glaser, and M. D. Bet-terton, 2016. Microscopic origins of anisotropic active stress in motor-driven nematic liquidcrystals. Soft Matter .
32. Sagolla, M. J., S. Uzawa, and W. Z. Cande, 2003. Individual microtubule dynamics contributeto the function of mitotic and cytoplasmic arrays in fission yeast. Journal of Cell Science116:4891–4903.
33. Laan, L., N. Pavin, J. Husson, G. Romet-Lemonne, M. van Duijn, M. P. Lopez, R. D. Vale,F. Julicher, S. L. Reck-Peterson, and M. Dogterom, 2012. Cortical Dynein Controls MicrotubuleDynamics to Generate Pulling Forces that Position Microtubule Asters. Cell 148:502–514.
34. Pavin, N., L. Laan, R. Ma, M. Dogterom, and F. Julicher, 2012. Positioning of microtubuleorganizing centers by cortical pushing and pulling forces. New Journal of Physics 14:105025.
35. Ma, R., L. Laan, M. Dogterom, N. Pavin, and F. Julicher, 2014. General theory for themechanics of confined microtubule asters. New Journal of Physics 16:013018.
Mechanisms of kinetochore capture 18
36. Tischer, C., D. Brunner, and M. Dogterom, 2009. Force- and kinesin-8-dependent effects in thespatial regulation of fission yeast microtubule dynamics. Molecular Systems Biology 5:1–10.
37. Dogterom, M., and B. Yurke, 1997. Measurement of the Force-Velocity Relation for GrowingMicrotubules. Science 278:856–860.
38. Janson, M. E., M. E. de Dood, and M. Dogterom, 2003. Dynamic instability of microtubulesis regulated by force. The Journal of Cell Biology 161:1029–1034.
39. Yamagishi, Y., C. H. Yang, Y. Tanno, and Y. Watanabe, 2012. MPS1/Mph1 phosphorylates thekinetochore protein KNL1/Spc7 to recruit SAC components. Nature Cell Biology 14:746–752.
40. Hagan, I., and M. Yanagida, 1990. Novel potential mitotic motor protein encoded by the fissionyeast cut7+ gene. Nature 347:563–566.
41. Costa, J., C. Fu, V. Syrovatkina, and P. T. Tran, 2013. Chapter 24 - Imaging Individual SpindleMicrotubule Dynamics in Fission Yeast. In J. J. C. Wilson, and Leslie, editors, Methods inCell Biology, Academic Press, volume 115 of Microtubules, in Vitro, 385–394.
42. Demchouk, A. O., M. K. Gardner, and D. J. Odde, 2011. Microtubule Tip Tracking andTip Structures at the Nanometer Scale Using Digital Fluorescence Microscopy. Cellular andMolecular Bioengineering 4:192–204.
43. Prahl, L. S., B. T. Castle, M. K. Gardner, and D. J. Odde, 2014. Chapter Three - QuantitativeAnalysis of Microtubule Self-assembly Kinetics and Tip Structure. In R. D. Vale, editor,Methods in Enzymology, Academic Press, volume 540 of Reconstituting the Cytoskeleton, 35–52.
44. Ding, R., K. L. McDonald, and J. R. McIntosh, 1993. Three-dimensional reconstruction andanalysis of mitotic spindles from the yeast, Schizosaccharomyces pombe. The Journal of CellBiology 120:141–151.
45. Alberts, B., A. Johnson, J. Lewis, M. Raff, K. Roberts, and P. Walter, 2008. Molecular Biologyof the Cell. Garland, New York, 5th edition.
46. Snaith, H. A., A. Anders, I. Samejima, and K. E. Sawin, 2010. Chapter 9 - New and OldReagents for Fluorescent Protein Tagging of Microtubules in Fission Yeast: Experimental andCritical Evaluation. In Lynne Cassimeris and Phong Tran, editor, Methods in Cell Biology,Academic Press, volume Volume 97, 147–172.
47. Bratman, S. V., and F. Chang, 2007. Stabilization of Overlapping Microtubules by FissionYeast CLASP. Developmental Cell 13:812–827.
48. Bratman, S. V., and F. Chang, 2008. Mechanisms for maintaining microtubule bundles. Trendsin Cell Biology 18:580–586.
49. Fygenson, D. K., E. Braun, and A. Libchaber, 1994. Phase diagram of microtubules. PhysicalReview E 50:1579.
50. Gardner, M. K., D. C. Bouck, L. V. Paliulis, J. B. Meehl, E. T. O’Toole, J. Haase, A. Soubry,A. P. Joglekar, M. Winey, E. D. Salmon, K. Bloom, and D. J. Odde, 2008. ChromosomeCongression by Kinesin-5 Motor-Mediated Disassembly of Longer Kinetochore Microtubules.Cell 135:894–906.
Mechanisms of kinetochore capture 19
51. Dogterom, M., and S. Leibler, 1993. Physical aspects of the growth and regulation of micro-tubule structures. Physical Review Letters 70:1347–1350.
52. Ghanem, R., and P. Spanos, 2002. Stochastic Finite Elements: A Spectral Approach. Dover.
53. Xiu, D., and G. Karniadakis, 2002. The Wiener-Askey polynomial chaos for stochastic differ-ential equations. SIAM Journal on Scientific Computing 24:619–644.
54. Doostan, A., and H. Owhadi, 2011. A non-adapted sparse approximation of PDEs with stochas-tic inputs. Journal of Computational Physics 230:3015–3034.
55. Hampton, J., and A. Doostan, 2015. Compressive sampling of polynomial chaos expansions:Convergence analysis and sampling strategies. Journal of Computational Physics 280:363 –386.
56. Hadigol, M., K. Maute, and A. Doostan, 2015. On uncertainty quantification of lithium-ionbatteries: Application to an LiC6/LiCoO2 cell. Journal of Power Sources 300:507–524.
57. Sobol’, I., 1990. On sensitivity estimation for nonlinear mathematical models. MatematicheskoeModelirovanie 2:112–118.
58. Sudret, B., 2008. Global sensitivity analysis using polynomial chaos expansions. ReliabilityEngineering and System Safety 93:964 – 979.
59. Cheeseman, I. M., and A. Desai, 2008. Molecular architecture of the kinetochore–microtubuleinterface. Nature Reviews Molecular Cell Biology 9:33–46.
60. Lowen, H., 1994. Brownian dynamics of hard spherocylinders. Physical Review E 50:1232–1242.
61. Weeks, J. D., D. Chandler, and H. C. Andersen, 1971. Role of Repulsive Forces in Determiningthe Equilibrium Structure of Simple Liquids. The Journal of Chemical Physics 54:5237–5247.
62. Moreno, S., A. Klar, and P. Nurse, 1991. Molecular genetic analysis of fission yeast Schizosac-charomyces pombe. In Guide to Yeast Genetics and Molecular Biology, Academic Press, volumeVolume 194, 795–823.
Mechanisms of kinetochore capture 1
Supporting Material
1 Model
MTs are rigid spherocylinders (cylinders with hemispherical ends) with length L(t) and diameterσMT . One end of the MT is fixed to a point on the nuclear envelope. The equations of motion formicrotubule reorientation are
ui(t+ δt) = ui(t) +Dθ(L)
kBTTi(t)× ui(t)δt+ δui(t), (S1)
where Dθ(L) is the rotational diffusion coefficient, Ti(t) is the systematic torque on particlei, and the random reorientation δui(t) is Gaussian-distributed, with variance 〈δui(t)δui(t)〉 =2Dθ(L) [I− ui(t)ui(t)] δt. MTs have a length-dependent rotational diffusion coefficient Dθ (L) ∼L−3. Using the formula for spherocylinder rotational diffusion from Lowen et al. (60), we calculatedDθ (L) for each timestep of the simulation:
Dθ (L(t)) =3kbT
πη(L(t) + 1)3(ln aMT − 0.662 + 0.917/aMT − 0.050/a2
MT ), (S2)
where η is the fluid viscosity, and aMT = L(t)/σMT .The MT minimum length is 4 σMT . We tested shorter minimum lengths, but found that
decreasing below 4 σMT did not significantly change the capture time; this choice of minimumlength makes the simulations more stable.
KCs are spheres with diameter σKC and diffusion coefficient Dkc (Table 1) that obey theequation of motion
ri(t+ δt) = ri(t) +Dkc
kBTFi(t) + δri(t), (S3)
with Gaussian random displacements with variance 〈δri(t)δri(t)〉 = 2Dkcδt.To account for variations in the relative diffusion of KCs and MTs, we defined the MT and
KC diffusion coefficients independently (fig. S1). We nondimensionalized the parameters using thereference length σMT of a MT diameter (25 nm), and the reference diffusion coefficient D0; thesetogether determine the unit of time τ = σ2
MT /D0. A kinetochore of size 200nm has a diffusionconstant of Dkc = 5.9 × 10⁻⁴ µm2 s−1. Using Stokes calculation for D, we see that Dkc = 1
8D0,yielding D0 = 4.72× 10⁻³ µm2 s−1.
1.1 Boundary interactions
To ensure that MTs and KCs remained within the nuclear envelope, both MT free ends and KCsinteracted with the envelope via the Weeks-Chandler-Anderson potential (61)
uwca,fil(rmin) =
4kBT
[(σ
rmin
)12−(
σrmin
)6]
+ kBT, rmin < 21/6σ
0, rmin ≥ 21/6σ,(S4)
where rmin is minimum distance between the free end of the filament and the enclosing sphere withradius R + σ/2, and σ is the finite distance at which the potential goes to zero. This allows forsmooth continuation of the dynamics at the boundary; the nuclear envelope then has an effectiveradius of R.
Mechanisms of kinetochore capture 2
0 1 2 3 4 5Time t (=)
0
0.5
1
1.5
2
2.5
3
3.5
Mea
n sq
uare
d di
spla
cem
ent h
r(t)
2i
(<)
Simulation data
Fit to hr(t)2i = 6Dkc
t
0 1 2 3 4 5Time t (=)
0
0.5
1
1.5
2
2.5
Mea
n sq
uare
d an
gula
r di
spla
cem
ent
h3(t
)2i
(rad
ians
)
#10-3
Simulation dataFit to h3(t)2i = 4D
3t
0 20 40 60 80 100 120 140Filament length L (b)
10-5
10-4
10-3
10-2
10-1
Fila
men
t diff
usio
n co
effic
ient
D3(L
) MeasuredTheoretical
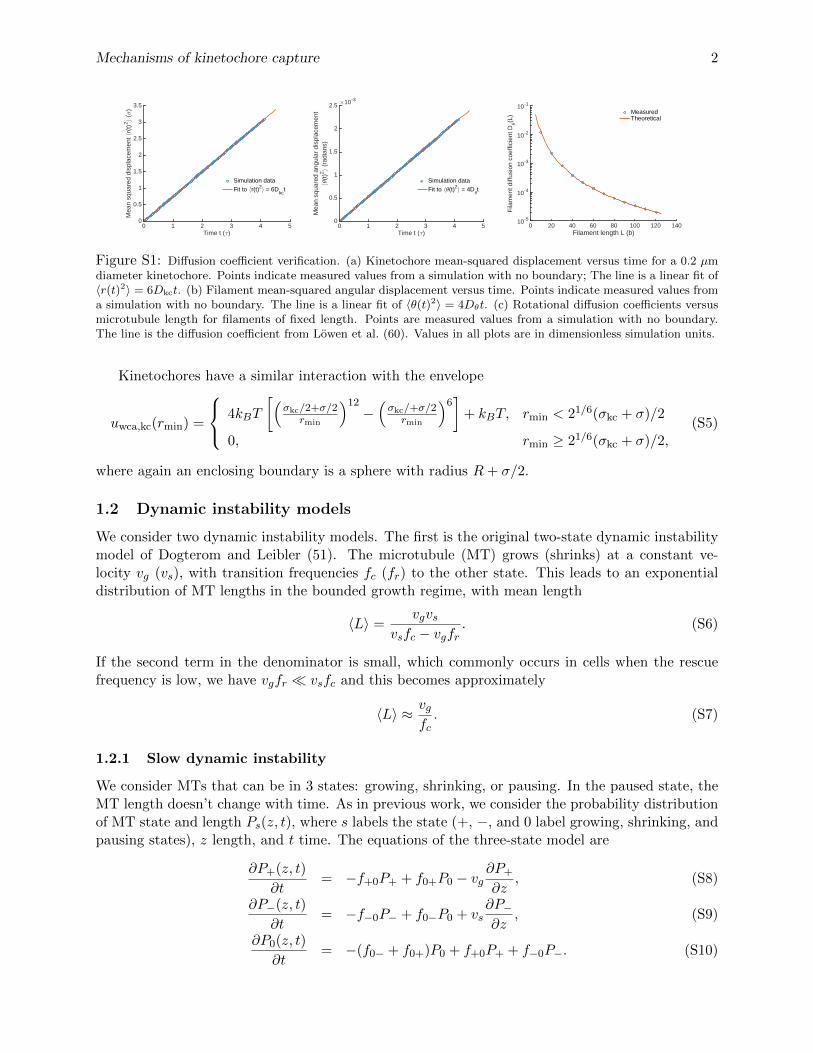
Figure S1: Diffusion coefficient verification. (a) Kinetochore mean-squared displacement versus time for a 0.2 µmdiameter kinetochore. Points indicate measured values from a simulation with no boundary; The line is a linear fit of〈r(t)2〉 = 6Dkct. (b) Filament mean-squared angular displacement versus time. Points indicate measured values froma simulation with no boundary. The line is a linear fit of 〈θ(t)2〉 = 4Dθt. (c) Rotational diffusion coefficients versusmicrotubule length for filaments of fixed length. Points are measured values from a simulation with no boundary.The line is the diffusion coefficient from Lowen et al. (60). Values in all plots are in dimensionless simulation units.
Kinetochores have a similar interaction with the envelope
uwca,kc(rmin) =
4kBT
[(σkc/2+σ/2
rmin
)12−(σkc/+σ/2rmin
)6]
+ kBT, rmin < 21/6(σkc + σ)/2
0, rmin ≥ 21/6(σkc + σ)/2,(S5)
where again an enclosing boundary is a sphere with radius R+ σ/2.
1.2 Dynamic instability models
We consider two dynamic instability models. The first is the original two-state dynamic instabilitymodel of Dogterom and Leibler (51). The microtubule (MT) grows (shrinks) at a constant ve-locity vg (vs), with transition frequencies fc (fr) to the other state. This leads to an exponentialdistribution of MT lengths in the bounded growth regime, with mean length
〈L〉 =vgvs
vsfc − vgfr. (S6)
If the second term in the denominator is small, which commonly occurs in cells when the rescuefrequency is low, we have vgfr � vsfc and this becomes approximately
〈L〉 ≈ vgfc. (S7)
1.2.1 Slow dynamic instability
We consider MTs that can be in 3 states: growing, shrinking, or pausing. In the paused state, theMT length doesn’t change with time. As in previous work, we consider the probability distributionof MT state and length Ps(z, t), where s labels the state (+, −, and 0 label growing, shrinking, andpausing states), z length, and t time. The equations of the three-state model are
∂P+(z, t)
∂t= −f+0P+ + f0+P0 − vg
∂P+
∂z, (S8)
∂P−(z, t)
∂t= −f−0P− + f0−P0 + vs
∂P−∂z
, (S9)
∂P0(z, t)
∂t= −(f0− + f0+)P0 + f+0P+ + f−0P−. (S10)
Mechanisms of kinetochore capture 3
0 2 4 6 8 10Time t (=)
0
0.2
0.4
0.6
0.8
1
1.2
Fra
ctio
n of
lost
kin
etoc
hore
s
Simulation dataKalinina
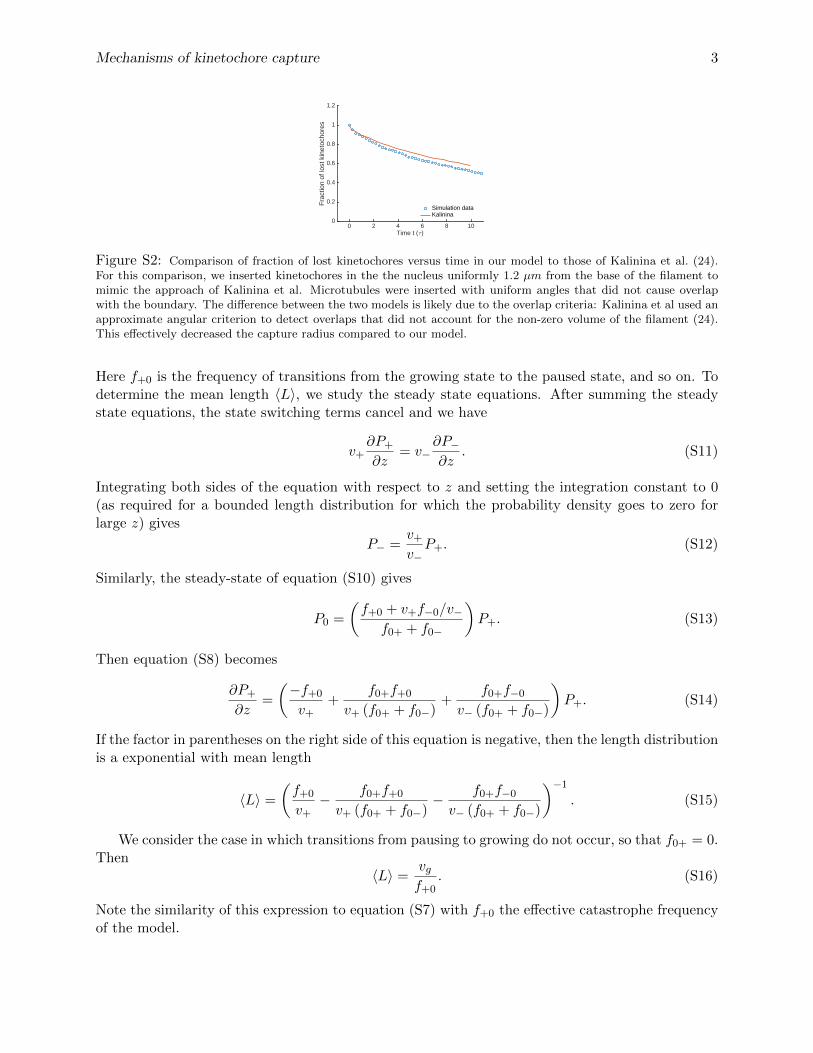
Figure S2: Comparison of fraction of lost kinetochores versus time in our model to those of Kalinina et al. (24).For this comparison, we inserted kinetochores in the the nucleus uniformly 1.2 µm from the base of the filament tomimic the approach of Kalinina et al. Microtubules were inserted with uniform angles that did not cause overlapwith the boundary. The difference between the two models is likely due to the overlap criteria: Kalinina et al used anapproximate angular criterion to detect overlaps that did not account for the non-zero volume of the filament (24).This effectively decreased the capture radius compared to our model.
Here f+0 is the frequency of transitions from the growing state to the paused state, and so on. Todetermine the mean length 〈L〉, we study the steady state equations. After summing the steadystate equations, the state switching terms cancel and we have
v+∂P+
∂z= v−
∂P−∂z
. (S11)
Integrating both sides of the equation with respect to z and setting the integration constant to 0(as required for a bounded length distribution for which the probability density goes to zero forlarge z) gives
P− =v+
v−P+. (S12)
Similarly, the steady-state of equation (S10) gives
P0 =
(f+0 + v+f−0/v−
f0+ + f0−
)P+. (S13)
Then equation (S8) becomes
∂P+
∂z=
(−f+0
v++
f0+f+0
v+ (f0+ + f0−)+
f0+f−0
v− (f0+ + f0−)
)P+. (S14)
If the factor in parentheses on the right side of this equation is negative, then the length distributionis a exponential with mean length
〈L〉 =
(f+0
v+− f0+f+0
v+ (f0+ + f0−)− f0+f−0
v− (f0+ + f0−)
)−1
. (S15)
We consider the case in which transitions from pausing to growing do not occur, so that f0+ = 0.Then
〈L〉 =vgf+0
. (S16)
Note the similarity of this expression to equation (S7) with f+0 the effective catastrophe frequencyof the model.
Mechanisms of kinetochore capture 4
2 Experiment
2.1 Cut7-ts strain construction
Cells were cultured using standard fission yeast techniques (62). To construct cut7-ts strains withmCherry-tagged tubulin, parent strains with the low-expression mCherry-atb2 MT marker (39)and the cut7-24 allele (40) were crossed on malt extract agar plates. Zygotic asci were isolated bydigestion with glusulase (PerkinElmer, Waltham, Massachusetts), counted on a haemocytometer,plated onto YE5S agar plates and allowed to grow into colonies. The colonies were replica platedsequentially onto two different plates, first onto YEP (YE5S plus phloxin B) agar plates. Colonieswere allowed to grow at 25oC overnight and then placed at 36oC. After 1-2 days, dark pink coloniesindicated dead or dying cells and were selected from the parent plates as being positive for cut7-24. Next, colonies were replica plated onto YES + 100 µg/mL nourseothricin (Gold Biotechnology,Olivette, Missouri) agar plates. Candidate colonies that grew were selected as positive for mCherry-atb2. Candidates with both cut7-24 and mCherry-atb2 were validated by imaging fluorescent MTsin monopolar spindles at 36oC using fluorescence microscopy on an Axioplan II light microscope(Carl Zeiss, Jena, Germany) with a 100x, 1.45 NA Plan Fluor oil-immersion objective, a Bioptechsobjective heater (Bioptechs, Butler, PA) and a Photometrics Cascade 650 CCD camera (RoperScientific, Sarasota, Florida).
2.2 Measurement of labeled tubulin fraction
A preculture was grown in YPD from which a 50 mL YPD overnight cell culture was grown to latelog phase. These cell cultures were pelleted in a tabletop Beckman CS-6 centrifuge, the supernatantwas removed, and they were resuspended in 1 mL of NaCl (150 mM)-Tris (50 mM) buffer at pH8. The cells were washed twice in buffer and resuspended in the same buffer plus 1/2 tablet ofcomplete Mini EDTA-free protease inhibitors (Roche Diagnostics, Mannheim, Germany). The cellswere then lysed with a FastPrep FP120 ribolyser (MP Biomedicals, Santa Ana, CA). Lysing tubeswere prepared with 1 cm 0.5 µm glass beads on the bottom. 1 mL of cell suspension per tube waslysed on setting 6 for 20 sec for a total of three runs. In between each run, the cells were placedon ice for 10 min. The tubes were spun in a tabletop centrifuge at 5,000 rpm for 6 min and thenat 14,000 rpm for 30 min. The clarified lysate was removed and flash frozen with liquid nitrogen.
The cell lysate was mixed 1:1 with Laemmli sample buffer (Bio-Rad, Hercules, CA) plus 5% β-mercaptoethanol. 20 µL samples for ten different lanes were prepared with serial dilutions rangingfrom 100%-10% of the original cell suspension concentration, and the samples were boiled in waterfor 7 min. The samples were run on Any KD pre-cast gels in a BioRad Miniprotean II system(Bio-Rad, Hercules, CA) with a Tris (25 mM), glycine (192 mM), 0.1% SDS running buffer. Thegels were run for 90 min at 100V with ice packs around the gel box.
Immunoblots were then prepared using a modification of standard techniques. Once transfersandwiches were assembled, samples were transferred to either a nitrocellulose or a PVDF mem-brane in transfer buffer consisting of Tris (25 mM), glycine (192 mM), 20% methanol, and 0.05%SDS. Blots were run for 1 hr at 80V. The membranes were transferred to a 5% nonfat milk block-ing solution in 1x TBS-T (Tris Buffered Saline plus 0.05% Tween 20) and blocked overnight. Theblocked membrane was transferred to a sealable bag containing the primary antibody TAT-1 ata 1:1000 dilution for 1 hr at room temperature. The blots were washed 3 times for 15 min inTBS-T and transferred to a sealable bag containing the secondary antibody Goat-anti-Mouse-AP(Bio-Rad, Hercules, CA) at a 1:1000 dilution for 1 hr at room temperature. The blots were washed3 times for 15 min in TBS-T and transferred to 20 mL of 1-Step NBI/BCIP developing solution(Thermo Scientific, Waltham, MA) for 30 min.
McI 804 z:adh15:mcherry-atb2:natMX6, cut7-24, leu1-32, ura4-d18, h90 This studyOriginal StrainsMcI 728 z:adh15:mcherry-atb2:natMX6, leu1-32, ura4-d18, h+ Y. WantanabeMcI 789 cut7-24, leu1-32, ura4-d18, h+ I. Hagan
Table S1: Fission yeast strains used in this study.
2.3 Cell preparation for imaging
We grew cells in liquid Edinburgh Minimal Medium (EMM) plus supplements in an overnightpreculture, then diluted them over the next 24 hours to keep the cells in mid-exponential growth.Cells were centrifuged at 2,000 rpm for 5 min on a Beckman CS-6 centrifuge (Beckman Coulter,Brea, California). The supernatant was removed and the cells were suspended in 100 µL of EMMfiltered with a 0.2 µm filter to reduce background fluorescence from the medium. The solution wasplaced onto 35 mm no. 1.5 glass bottom dishes (MatTek, Ashland, Massachusetts) coated with 8µL of 2 mg/mL lectins from Bandeiraea simplicifolia (Sigma-Aldrich, St. Louis, Missouri). Thecells were allowed to settle and adhere to the lectins for 10 min, then the remaining loose cells werewashed away twice with fresh, filtered EMM. 3 mL of fresh, filtered EMM was added to each dish,and the dishes were placed at 36oC.
3 Results
3.1 Sensitivity analysis
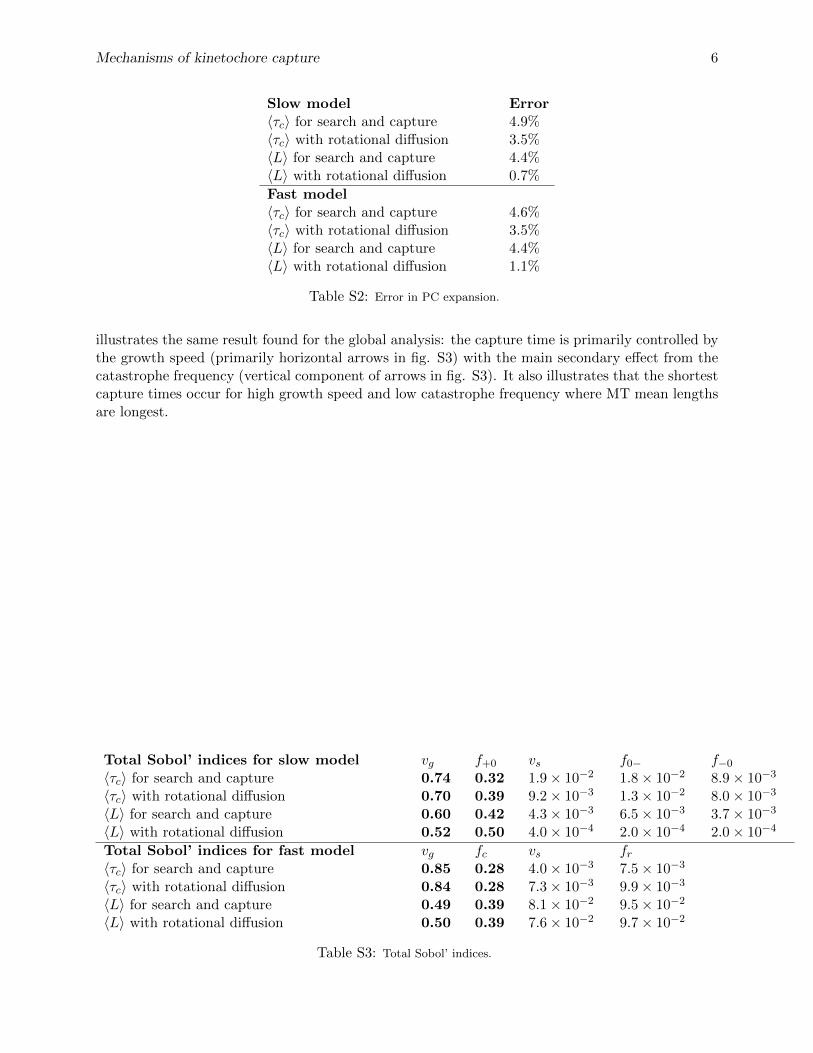
We performed sensitivity analysis to check how the capture time and MT mean length vary withmodel parameters. As discussed in the main text and above, dynamic instability with no boundaryeffects gives a mean length of 〈L〉 = vg/f+0 in the slow model and 〈L〉 = vgvs/(vsfc−vgfr) ≈ vg/fcin the fast model. To test these relationships, we performed a global sensitivity analysis of the meancapture time and MT length to the dynamic instability parameters. To quantify this sensitivity, werelied on the analysis of the variance of 〈τc〉 and 〈L〉 based on the so-called Sobol’ decomposition(57), which we computed directly using the PC expansion (58). The dynamic instability parameterswere treated as random variables uniformly distributed over the ranges in table 1. The errors fromthe PC expansion were typically a few percent (ranging from 1-5% depending on which variableand model were fit, table S2). This indicates that the PC expansion is accurately capturing thefull simulation results.
The overall contribution of each parameter to the solution variance was quantified using itstotal Sobol’ index (58); a larger value indicates a higher degree of sensitivity of the model to thatparameter (table S3). As expected, 〈τc〉 and 〈L〉 are most sensitive to the growth speed and effectivecatastrophe frequency, and this dependence is not altered significantly by the addition of rotationaldiffusion to the model.
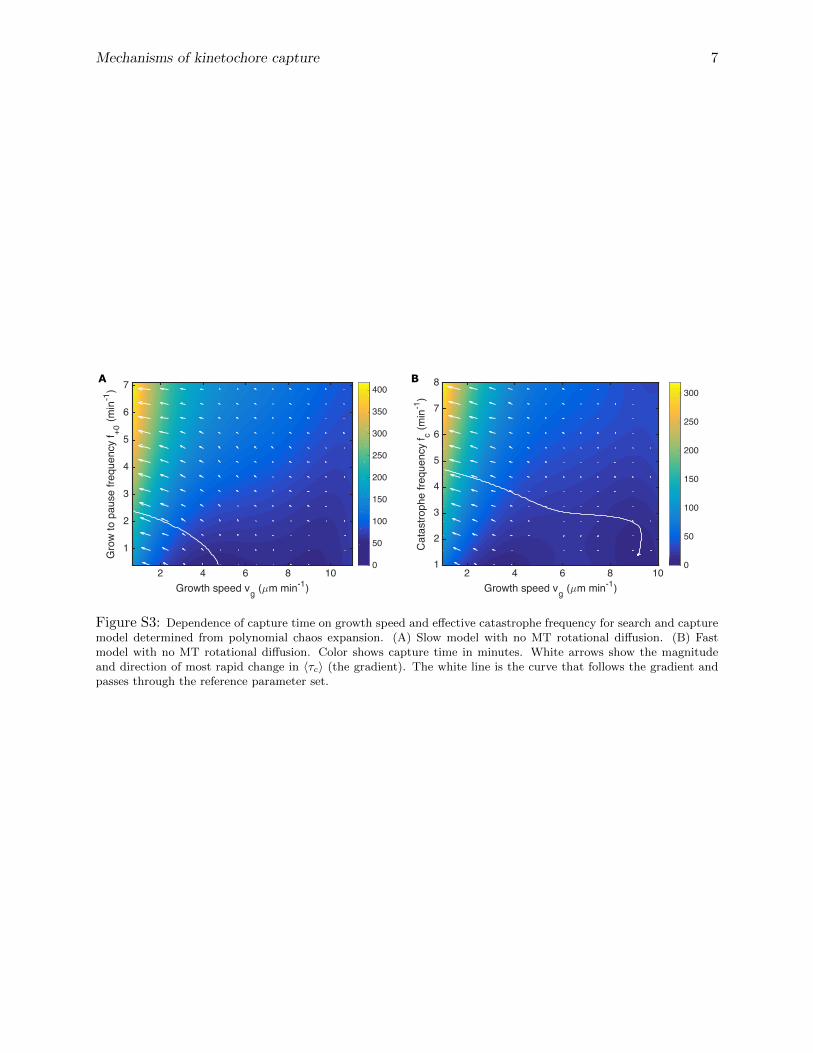
We also determined the local sensitivity of the capture time to these parameters by computingthe gradient (the local direction of steepest change) of 〈τc〉 as a function of the growth speed andcatastrophe frequency from the PC expansion, with other parameters fixed at their reference values(fig. S3 shows results for the models without MT rotational diffusion; here the white line followsthe local gradient and passes through the reference parameters). This local sensitivity analysis
Mechanisms of kinetochore capture 6
Slow model Error〈τc〉 for search and capture 4.9%〈τc〉 with rotational diffusion 3.5%〈L〉 for search and capture 4.4%〈L〉 with rotational diffusion 0.7%
Fast model〈τc〉 for search and capture 4.6%〈τc〉 with rotational diffusion 3.5%〈L〉 for search and capture 4.4%〈L〉 with rotational diffusion 1.1%
Table S2: Error in PC expansion.
illustrates the same result found for the global analysis: the capture time is primarily controlled bythe growth speed (primarily horizontal arrows in fig. S3) with the main secondary effect from thecatastrophe frequency (vertical component of arrows in fig. S3). It also illustrates that the shortestcapture times occur for high growth speed and low catastrophe frequency where MT mean lengthsare longest.
Total Sobol’ indices for slow model vg f+0 vs f0− f−0
〈τc〉 for search and capture 0.74 0.32 1.9× 10⁻² 1.8× 10⁻² 8.9× 10⁻³
Total Sobol’ indices for fast model vg fc vs fr〈τc〉 for search and capture 0.85 0.28 4.0× 10⁻³ 7.5× 10⁻³
〈τc〉 with rotational diffusion 0.84 0.28 7.3× 10⁻³ 9.9× 10⁻³
〈L〉 for search and capture 0.49 0.39 8.1× 10⁻² 9.5× 10⁻²
〈L〉 with rotational diffusion 0.50 0.39 7.6× 10⁻² 9.7× 10⁻²
Table S3: Total Sobol’ indices.
Mechanisms of kinetochore capture 7
2 4 6 8 10Growth speed vg ( m min-1)
1
2
3
4
5
6
7
Gro
w to
pau
se fr
eque
ncy
f +0 (m
in-1
)
0
50
100
150
200
250
300
350
400
2 4 6 8 10Growth speed vg ( m min-1)
1
2
3
4
5
6
7
8
Cat
astro
phe
frequ
ency
f c (min
-1)
0
50
100
150
200
250
300A B
Figure S3: Dependence of capture time on growth speed and effective catastrophe frequency for search and capturemodel determined from polynomial chaos expansion. (A) Slow model with no MT rotational diffusion. (B) Fastmodel with no MT rotational diffusion. Color shows capture time in minutes. White arrows show the magnitudeand direction of most rapid change in 〈τc〉 (the gradient). The white line is the curve that follows the gradient andpasses through the reference parameter set.