27
QMS Quick Learning Activity www.aphl.org Controls and Control Charting Control Charts and Trend Analysis for ISO/IEC 17025:2005

QMS Quick Learning Activity
www.aphl.org
Controls and Control ChartingControl Charts and Trend Analysis for ISO/IEC 17025:2005
QMS Quick Learning Activity
Abbreviation and Acronyms
• CRM-Certified Reference Materials• RM-Reference Materials• PT-Proficiency Test(ing)• QMS-Quality Management Sytem• QC-Quality Control• STD-Standard Deviation• Ct-cycle threshold
QMS Quick Learning Activity
ISO/IEC 17025 Requirements
• quality control procedures for monitoring the validity of tests undertaken
• data recorded so trends are detected• where practicable, statistical techniques
applied to the reviewing of the results
Section 5.9 - Assuring the quality of test results and calibration results

QMS Quick Learning Activity
ISO/IEC 17025 Requirements
• Planned• Reviewed• May include
o Use of Certified Reference Materials (CRM) and/or Reference Materials (RM)
o Proficiency testing (PT)o Replicate testso Retestingo Correlation of results for different characteristics
Monitoring

QMS Quick Learning Activity
Quality Management System (QMS)
The term ‘Quality Management System’ covers the quality, technical, and administrative system that governs the operations of the laboratory.
The laboratory’s QMS will have procedures for monitoring the validity of tests and calibrations undertaken in the laboratory.

QMS Quick Learning Activity
Quality Management System (QMS)
Quality Manual may state:The laboratory monitors the quality of test results by the inclusion of quality control measures in the performance of tests and participation in proficiency testing programs. The laboratory runs Quality Control (QC) samples with each batch of samples.
QMS Quick Learning Activity
ISO/IEC 17025 Requirements
• quality control data analyzed and when found to be outside of predefined criteria planned action shall be taken to correct the problem and prevent incorrect results from being reported
Section 5.9.2
QMS Quick Learning Activity
Range Control Charts• Control Charts for Duplicate Sample Data
– Used when impossible to use same QC over time
– Two samples of a batch are analyzed in duplicate
• % difference plotted• Absolute difference plotted
– After 10-20 points collected calculate mean range of duplicates
– Tables (Youden) for determining % that should fall above/below 50% line

QMS Quick Learning Activity
Mean Value Control Charts Types• Laboratory Control Sample (QC samples)
– Charting the results over time of the same sample
• Matrix Spike Control Samples– With each batch (however defined) of
samples a blank matrix sampleis spiked with desired analyte.
Recoveries (percent, count) are charted each time.

QMS Quick Learning Activity
Laboratory Control Sample Control Charts
• Charting “QC samples” – must have known value associated with it. – Reference material– Old PT sample– Characterized by your laboratory
• Optimal QC sample – Similar matrix as samples– Value close in range of expected results
QMS Quick Learning Activity
Matrix Spike Sample Control Charts• Charting blank matrix that has been spiked
with known concentration of analyte. – Finding blank to use is often a challenge
especially when looking at trace levels – Used when appropriate reference material is
unavailable– RM not available in appropriate matrix– RM cost prohibitive

QMS Quick Learning Activity
Matrix Spike Sample Control Charts• Typical acceptance for matrix spike recovery
– 70 – 120%– When large screens with many analytes or
when trace levels are being analyzed acceptance can be 50 – 150%
QMS Quick Learning Activity
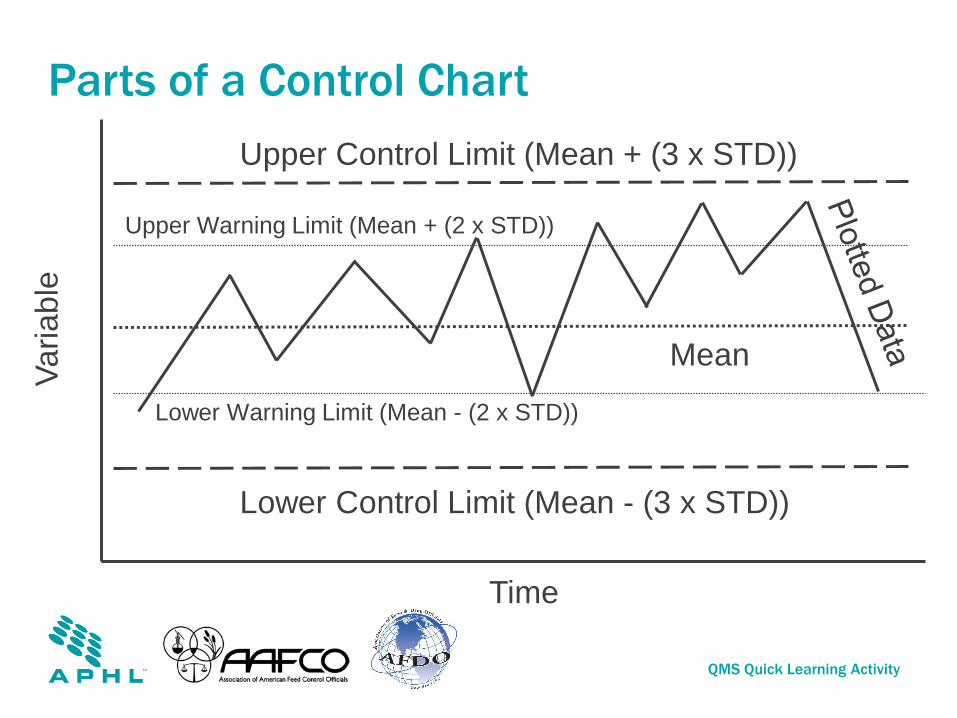
Parts of a Control Chart
Mean
Upper Control Limit (Mean + (3 x STD))
Lower Control Limit (Mean - (3 x STD))
Time
Varia
ble
Upper Warning Limit (Mean + (2 x STD))
Lower Warning Limit (Mean - (2 x STD))
QMS Quick Learning Activity
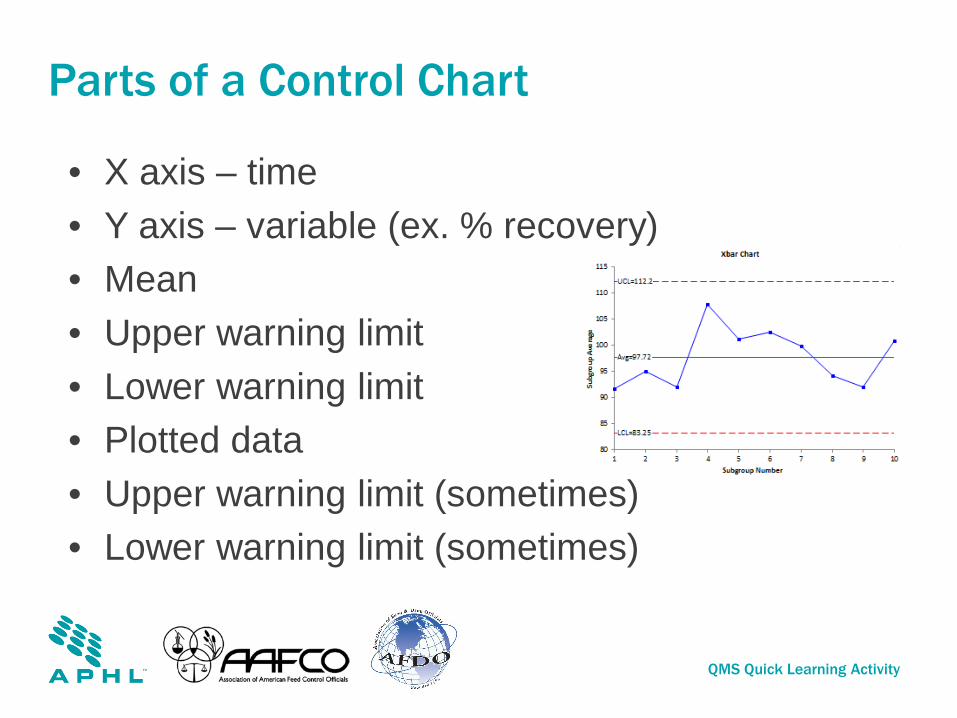
Parts of a Control Chart
• X axis – time• Y axis – variable (ex. % recovery)• Mean • Upper warning limit• Lower warning limit• Plotted data• Upper warning limit (sometimes)• Lower warning limit (sometimes)

QMS Quick Learning Activity
Parts of a Control Chart - Axis• X axis
– Each time QC sample/matrix spike is analyzed result is plotted. Could be the date run, or the instance (first time run, second time run, etc.)
• Y axis – variable (ex. % recovery, Ct value)y-axis
x-axis
QMS Quick Learning Activity
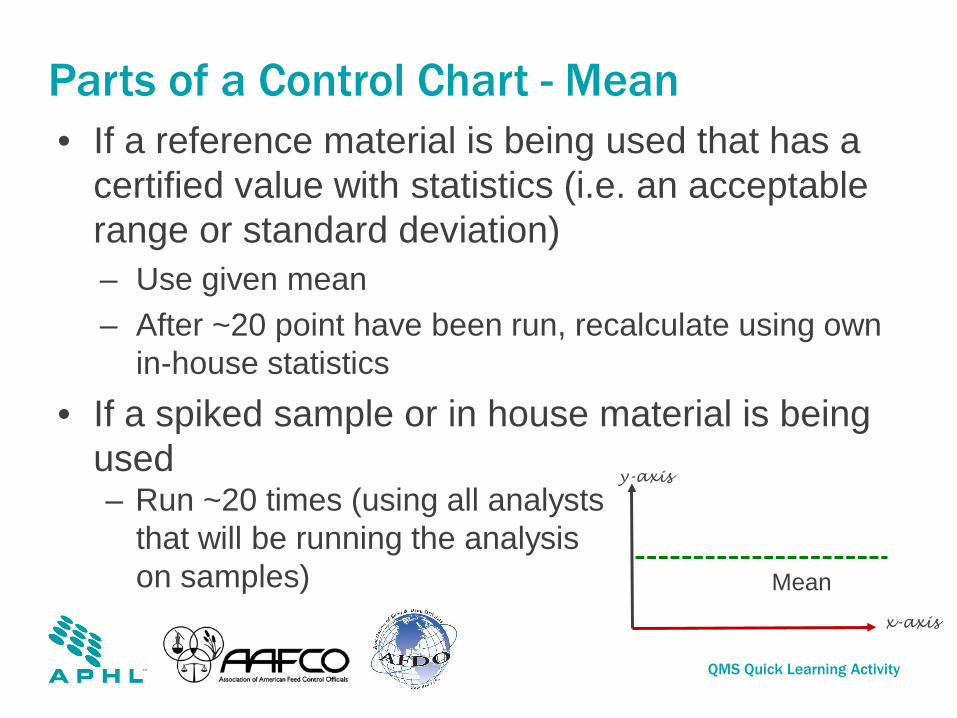
Parts of a Control Chart - Mean• If a reference material is being used that has a
certified value with statistics (i.e. an acceptable range or standard deviation) – Use given mean– After ~20 point have been run, recalculate using own
in-house statistics• If a spiked sample or in house material is being
used – Run ~20 times (using all analysts
that will be running the analysis on samples)
y-axis
x-axis
Mean

QMS Quick Learning Activity
Parts of a Control Chart –Upper/Lower Control Limits• Calculate standard deviation (STD) of points
used to determine mean• Upper and lower control limits
– calculated by multiplying the STD x 3– Add (STD x 3) to mean
(Upper Control Limit)– Subtract (STD x 3)
from mean (Lower Control Limit)
Upper Control Limit
Lower Control Limit
y-axis
x-axis
Mean
3 x STD
3 x STD

QMS Quick Learning Activity
Parts of a Control Chart –Upper/Lower Warning Limits
• Some control charts will have upper and lower warning limits– Calculate standard deviation (STD) of points used to
determine mean• Upper and lower warning limits
– calculated by multiplying the STD x 2– Add (STD x 2) to mean
(Upper Limit)– Subtract (STD x 2)
from mean (Lower Limit)
y-axis
x-axis
Mean
2 x STD
2 x STD
Upper Control Limit
Lower Control Limit
Upper Warning Limit
Lower Warning Limit

QMS Quick Learning Activity
Parts of a Control Chart –Plotted Value
• Value of the control being charted– % recovery– Ct value– Fluorescence reading

QMS Quick Learning Activity
Control Charting Statistics
• QMS will set interval at which control charting statistics (average, upper/lower control limits, etc.) are recalculated.

QMS Quick Learning Activity
Statistical Control
• Control limits based on probability • System in statistical control
– 2/3 of values should be within mean ± 1 STD– 19/20 or 95% of values should be within ± 2
STD (Upper/Lower Warning Limits)– “All” or 99.7% of values should fall within ± 3
STD (Upper/Lower Control Limits)
QMS Quick Learning Activity
Out of control!• Laboratory’s QMS will dictate when a
process (method) is considered “out of (statistical) control”– When the QC falls outside of the upper or lower limit– Two or more consecutive values fall outside 2 STD
(outside the upper or lower warning limits) on the same side of the mean
– A series of seven or eight consecutive values fall all above or all below the mean
– An increasing or decreasing trend is detected(TRENDING analysis)
QMS Quick Learning Activity
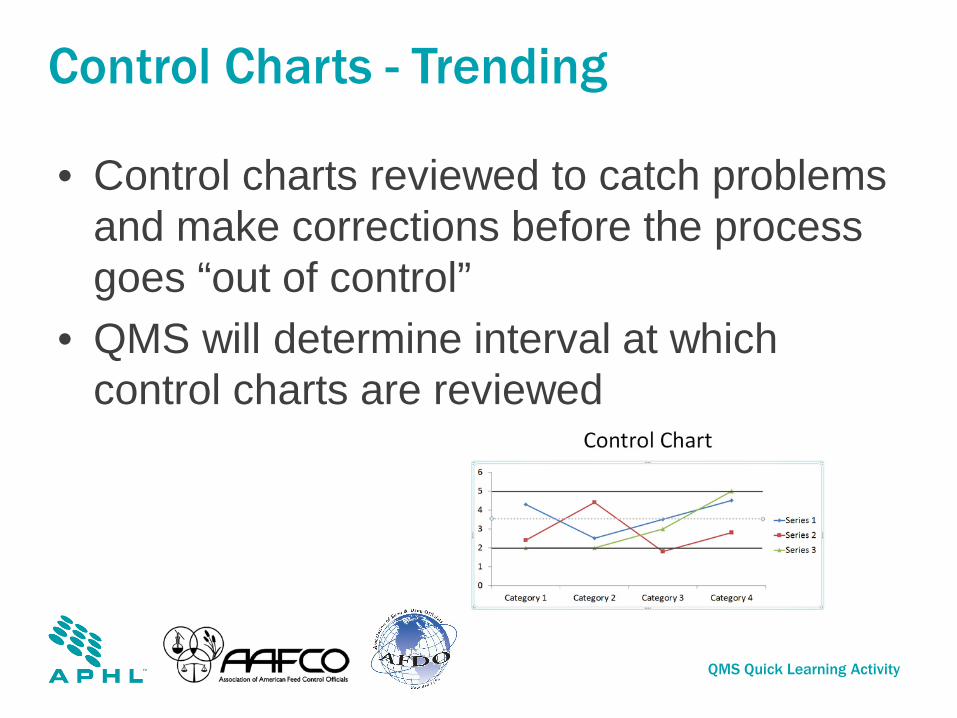
Control Charts - Trending
• Control charts reviewed to catch problems and make corrections before the process goes “out of control”
• QMS will determine interval at which control charts are reviewed
QMS Quick Learning Activity
Control Charts – Qualitative Trending
• Qualitative (presence/absence) analyses do not need to have control charts for charting QC; however, the laboratory’s QMS may require this
• Qualitative analyses do need to be evaluated for trending. This can be done using control charts
QMS Quick Learning Activity
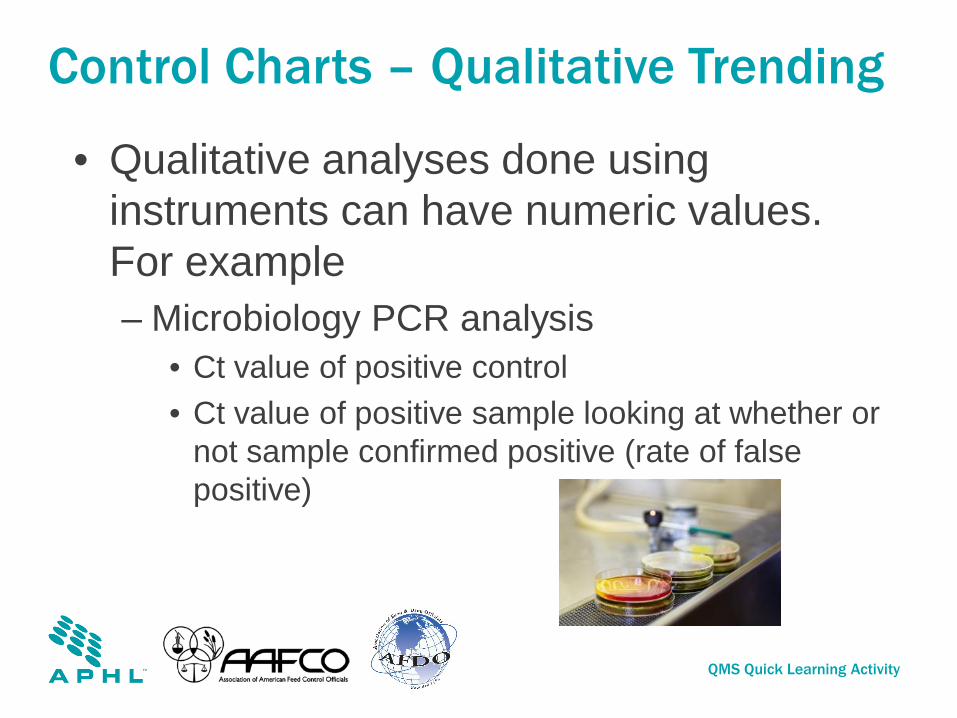
Control Charts – Qualitative Trending
• Qualitative analyses done using instruments can have numeric values. For example– Microbiology PCR analysis
• Ct value of positive control• Ct value of positive sample looking at whether or
not sample confirmed positive (rate of false positive)

QMS Quick Learning Activity
Conclusions – Control charts• Are used to meet the requirements of the
ISO/IEC 17025 standard by providing a way for laboratories to monitor the validity of test performed
• Use RM, spiked samples, laboratory characterized materials, percent/absolute difference in duplicate samples
• Make it possible for the laboratory to track trends in analysis

QMS Quick Learning Activity
References
• ISO/IEC 17025:2005–https://www.iso.org/standard/39883.html
• Youden WJ (1959) Graphical diagnosis of interlaboratory test results. Industrial Quality Control, 15, 24-28.


