Control of Binder Distribution in Bituminous Surface Treatments DAVID C. MAHONE and STEPHEN N. RUNKLE, Virginia Highway Research Council The control of binder distribution has long been a factor of major concern to those responsible for bituminous surface treatment work. Experimental work was conducted during the summers of 1964 and 1965 in Virginia with the trough test, cup test, and cotton pad test in order to determine and define reasonable vari- ability from the specified mean binder application rate both trans- versely and longitudinally; and to provide a method of test to be used in end result specifications for the control of binder application. The investigation was limited in that most of the work was performed on state secondary roads, and the distributors, most of which were state-owned, were those in use during 1964 and 1965. It was found that the trough test and cup test were not suited for field use and, more importantly, could not be used for en- forcement of end result specifications. The cotton pad test was found to be suited for field use, and can be used in end result specifications. It was found that both the longitudinal and transverse con- sistency could be checked periodically by running a cotton pad test. Also, based on the tests made, it was determined that for the equipment tested the longitudinal variation should be no more than ± 8 percent from the intended rate, and that the transverse variation as indicated by one cotton pad test should be 8 percent coefficient of variation or less. (It was decided the coefficient of variation was the best measure of transverse variability.) tll'HE very best materials and design can go into a bituminous surface treatment and the results still be unsatisfactory unless the binder is evenly distributed to the proper depth. Poor control of the binder application could result in streaking, excessive loss of cover stone, bleeding, and in fact, almost any of the types of failure common in surface treat- ments. Since this control is of utmost importance in every surface treatment regard- less of the physical characteristics of the aggregate or binder, the natural elements, or the traffic that the road will carry, it is a factor of major concern to those responsible for surface treatments. Consequently, this investigation was devised and included in the 5-yr bituminous surface treatment study being conducted in Virginia in an attempt to improve the quality and service life of such treatments. PURPOSE AND SCOPE Specifically, the purpose of this investigation was twofold: (a) to determine and de- fine reasonable variability from the specified mean binder application rate both trans- versely and longitudinally; and (b) to provide a method of te~t to be used in end result specifications with regard to binder application. Paper sponsored by Committee on Bituminous Surface Treatments and presented at the 47th Annual Meeting. 19
Transcript
Control of Binder Distribution in Bituminous Surface Treatments DAVID C. MAHONE and STEPHEN N. RUNKLE, Virginia Highway Research Council
The control of binder distribution has long been a factor of major concern to those responsible for bituminous surface treatment work. Experimental work was conducted during the summers of 1964 and 1965 in Virginia with the trough test, cup test, and cotton pad test in order to determine and define reasonable vari-ability from the specified mean binder application rate both trans-versely and longitudinally; and to provide a method of test to be used in end result specifications for the control of binder application.
The investigation was limited in that most of the work was performed on state secondary roads, and the distributors, most of which were state-owned, were those in use during 1964 and 1965.
It was found that the trough test and cup test were not suited for field use and, more importantly, could not be used for enforcement of end result specifications. The cotton pad test was found to be suited for field use, and can be used in end result specifications.
It was found that both the longitudinal and transverse consistency could be checked periodically by running a cotton pad test. Also, based on the tests made, it was determined that for the equipment tested the longitudinal variation should be no more than ± 8 percent from the intended rate, and that the transverse variation as indicated by one cotton pad test should be 8 percent coefficient of variation or less. (It was decided the coefficient of variation was the best measure of transverse variability.)
tll'HE very best materials and design can go into a bituminous surface treatment and the results still be unsatisfactory unless the binder is evenly distributed to the proper depth. Poor control of the binder application could result in streaking, excessive loss of cover stone, bleeding, and in fact, almost any of the types of failure common in surface treatments. Since this control is of utmost importance in every surface treatment regardless of the physical characteristics of the aggregate or binder, the natural elements, or the traffic that the road will carry, it is a factor of major concern to those responsible for surface treatments. Consequently, this investigation was devised and included in the 5-yr bituminous surface treatment study being conducted in Virginia in an attempt to improve the quality and service life of such treatments.
PURPOSE AND SCOPE
Specifically, the purpose of this investigation was twofold: (a) to determine and define reasonable variability from the specified mean binder application rate both transversely and longitudinally; and (b) to provide a method of te~t to be used in end result specifications with regard to binder application.
Paper sponsored by Committee on Bituminous Surface Treatments and presented at the 47th Annual Meeting.
19
20
The scope was limited in that the findings are based on the performance of binder distributors in use in Virginia during 1964 and 1965 (most of which were state-owned) and three types of asphalt: CAE-2, RC-2, and AP-00.
To evaluate the performance of the machines, three test methods -the cup test, trough test, and cotton pad test-were used. However, only the last lends itself to end result specifications.
The experimental work was conducted during the summers of 1964 and 1965 on state roads, mostly secondary, through the cooperation of the Central Office and the field personnel of the Department of Highways. During 1964 a total of 10 bituminous distributors were investigated for distribution characteristics, and during 1965 14 more were tested in an attempt to evaluate the usefulness of the cotton pad method.
TEST PROCEDURES
The cup test and trough test require that the distributor be stationary, whereas the cotton pad test is employed during actual operation.
Distributor Stationary
Two test methods were used to evaluate the lateral distribution of the spray bar while the distributor was stationary: one was a measure of the quantity discharge from each nozzle; the other was a measure of the distribution pattern across the bar. The quantity of asphalt is influenced by the nozzle discharge only, whereas the distribution pattern is influenced by both the nozzle discharge and nozzle angle.
The amount of binder discharge from the individual nozzles was measured by placing quart paper containers under each nozzle and spraying into them simultaneously. A rack was used to keep the cups from turning over (Fig. 1).
The second stationary method of checking the spray bar was a check on the distribution pattern of the binder. As previously mentioned, this is influenced by both nozzle discharge and nozzle angle. Figure 2 shows the 12-ft metal trough used in this test. It is divided into forty-eight 3-in. sections, 7 in. deep, and it is 18 in. wide at the top and 9 in. at the bottom. The trough, which was modeled after a larger unit used in Pretoria, Transvaal, South Africa, for calibrating distributor spray nozzles and bars, can be disassembled into two equal units for transportation (_; ~).
Obv10usiy the trougn test ana cup test are not usetul m ena result spec111cat1ons smce they are tests on the machines and not the work. It was hoped, however, that they would be useful in determining what standard of work should be expected from the equipment available.
Figure 1. Paper cup arrangement for measuring nozzle discharge.
21
Figure 2. Calibration trough, disassembled.
Figure 3. Cotton pad test strips being used to measure lateral distribution.
Distributor Operating
The lateral and longitudinal distribution of the spray bar may be evaluated while the distributor is operating, i.e., actually spraying binder onto a road. The procedure, developed by the California Division of Highways, is to glue 4-in. wide cotton pads to sheets of paper, which are in turn placed on metal sheets. The sheets are placed on the roadway just ahead of the distributor (Fig. 3). The term "test" is used to identify
22
this operation, while the term "sample" refers to one 4 by 8-in. pad. The cotton prevents the binder from flowing until the sample can be weighed. In each test the end pads (the last pad on each end that appears to be covered) are discarded.
The major advantage of the cotton pad test is that it tests for the amount of binder actually being applied on the roadway. Thus, the transverse and longitudinal variability of binder on the road can be measured.
PRELIMINARY INVESTIGATION
During 1964, ten asphalt distributors were tested in order to determine the usefulness of the three tests. It was found that neither the trough test nor cup test was suitable for field use. The following difficulties were encountered with these two methods.
1. Although the binder was circulated through the bar for 5 minutes before shooting, it was noted that the nozzles did not always come on at full force simultaneously. This could be due in part to clogged nozzles, or to all sections of the bar failing to activate simultaneously. However, another possible cause, which was suggested by leakage on many spray bars, was worn parts.
2. It is almost impossible to find a level place in the field and on most distributors the header bars are not truly horizontal extensions of the spray bar. Therefore, when the highest nozzles were low enough to insure shooting into a specific cup, other points along the bar were resting on cups. This interfered with the activation of the spray bar and also bent cups, causing loss of binder, and at times, turned cups partially over.
3. The difficulty in finding level testing sites and the nonhorizontal extensions of the spray bars also affected the trough test since the height and angle of the spray fan over the trough affected the distribution pattern.
4. The relatively small size of the cups and trough sections resulted in a very short shooting time, thus exaggerating any error due to the difficulties mentioned previously.
5. Both processes were time consuming and tied the distributor up for longer periods than desirable. This of course held up the entire surface treating operation.
6. Since there was no way to recover the binder shot into the trough or cups, much was wasted.
Aunough the t:esi:s were jucigeci i:o be unsaiisiactory ior iieici use, in uur upm10n ihey could be most useful in checking and calibrating distributors at a specially prepared central location.
It was found that the cotton pad test was much more suitable for field work than either of the other methods. Most of the problems encountered with this test have the common origin of motion. Because the distributor is moving it is difficult to determine which spray fans are covering specific pads. Since the pads have to be removed from the sheets and transported to the weighing area there is a tendency for the binder to flow from pad to pad. For this reason it is recommended that the test not be used when the amount of binder being applied is greater than 0. 40 gsy.
Since the test was performed after the distributor had been operating for a while the problem of uneven bar activation did not exist. Any variability in the transverse distribution could be assumed to be a continuing condition.
Despite the problems associated with motion, it was decided that the cotton pad test could be used as a method of test for end result specifications with regard to binder application. It was also decided more field work was necessary during 1965 to determine reasonable transverse and longitudinal variability.
COTTON PAD TESTS-1965 INVESTIGATION
Specifically, the following were to be determined during 1965: (a) the best method of expressing variability, and with regard to transverse distribution, the amount of variability that should be expected in the measurement from test to test without any adjustments to the equipment; and (b) based on the work in 1964 and 1965, the allowed standards for transverse and longitudinal variation, and the number of tests required to insure that the standards are met under various assumptions.
TABLE 1
LARGEST SAMPLE SIZE REQUIRED TO DETERMINE MEAN ± 8 PERCENT AT A 95 PERCENT
Cllorgest sample size re qui red of 7 tests made on each machine.
23
Fourteen distributors were used dur -ing the summer. With the first 7 distributors , 7 sheets of cotton pads were placed side by side in as close an area as possible. As soon as the distributor had passed over all 7 sheets, the individual cotton pads were removed and weighed immediately. With the last 7 distributors, the tests were taken in approximately 200-ft intervals in order to help determine how consistent the longitudinal application should be.
Longitudinal Variation
In all the tests (Table 1), it was rarely necessary to have a sample size greater than 10 cotton pads in order to predict the mean within ± 8 percent at a 95 percent confidence level (6 out of 96
tests and 4 times with the same distributor). Thus, the longitudinal consistency of binder application could be checked by randomly selecting and weighing 10 pads from each test made. In this way a check could be made as to whether the actual average amount being applied is within ± 8 percent of the intended application.
Perhaps an even better approach to checking longitudinal consistency only is simply to weigh at one time all of the pads covered by binder. If this was manageable, it would reduce the time required to complete the test and be more accurate than weighing 10 pads. No attempts were made to take the test in this manner during the field work, but it certainly seems to be feasible.
It should be remembered also that the sample size of 10 pads is only tentative in any case. If adjustments are made to a distributor and they reduce the transverse variability, the sample size necessary for predicting the average will decrease.
The results also indicate that the sample sizes required are larger with RC-2 (cutback) and CAE-2 (emulsion) than with AP-00 (200-300 penetration). This is true probably because RC-2 and CAE-2 are usually applied in greater quantities than is AP-00, and therefore have a greater tendency to flow from pad to pad during handling and thus cause greater variation. As mentioned earlier, the test is not recommended when the amount applied is greater than 0. 40 gsy.
Transverse Variation
Since normally the absolute variation would increase as the test mean increases and decrease as the test mean decreases, it was decided that the best measure of transverse variation was the coefficient of variation, which is the standard deviation of the test expressed as a percentage of the test mean (V = 100 s/X). By using the variation coefficient as the measure of variability, the relative variability between tests is determined and is therefore uninfluenced by the magnitude of the test mean. Table 2gives the amount of variation to be expected in the variation coefficients between tests for the same machine when no adjustments are made between tests.
For only three machines was the standard deviation of the variation coefficients more than 2. 0 percent (machines 11, 13, and 14), and in two of these (machines 13 and 14) the tests were taken on roads where it was difficult to find level test sites, which perhaps caused a greater coefficient of variation in some of the tests. Judging from the results, it seems safe to say that the normal standard deviation to be expected with level test sites usually would not exceed 2. 0 percent.
The standard deviation determines the position of the control limit in relation to the standard in testing for compliance with standards. For instance, if a standard of 8 percent was desired and only one test was taken in various intervals then the control limit to determine if the standard was met would be above the 8 percent standard, the amount
Tes
t
I 2 3 4 s 6 7
Ave
rag
e
Sta
nd
ard
de
via
tio
n
TA
BL
E
2
CO
EF
FIC
IEN
TS
OF
VA
RIA
TIO
N
Tes
ts T
aken
To
get
her
Mac
h.1
M
ach.
2
Mac
h. 3
M
ach.
4
Mac
h. 5
M
ach.
6
AP
-00
A
P-0
0
AP
-00
C
AE
-2
CA
E-2
C
AE
-2
10
.0,
12.
74,
9.5
~
6. 2
<t
8. U
9.
4<!1
10
. 4
10. 4
9.
4
6. 5
10
. 2
6. 4
9
.8
10.
7 10
. 2
7. 3
8.
7
7. 6
10
. 2
10. 8
8.
7
9.7
11
. 6
7. 3
10
. 1
9. 2
9.
6
10.
4 9
.8
7. D
10
. 4
10.
3 9.
6
7. 6
11
. 0
10.
4 11
. 4
-10
. 2
7. 4
9.
9 8.
6
10.
3<!1
10.7
1,
9.H
7.
94,
9.9<
!1
8. l
<!I
o. 5
o. 11
o.
5 1.
6
1. 2
1.
4
TA
BL
E
3
CO
EF
FIC
IEN
TS
OF
VA
RIA
TIO
N B
Y
AS
PH
AL
T
TY
PE
Asp
hal
t T
ype
Av
erag
e R
ange
AP
-00
0. 9
0.
5-1
. 3
CA
E-2
1. 6
1
.3-2
.2
R•>
2
::. 0
l.
C•-
2. 8
Mac
h. 7
R
C-2
6.6o
\S
7. 3
7.
4
5. 8
6.
8
4.6
6.
7
6.5
1,
1.0
Tes
ts T
aken
in
200
-Ft
Inte
rval
s
Mac
h.8
M
ach.
9
Mac
h.1
0
Mac
h. 1
1 M
ach.
12
Mac
h.1
3
AP
-00
A
P-0
0
CA
E-2
C
AE
-2
RC
-2
RC
-2
7.5
<t 10
. 91,
12. O
'\\ 6
.6~
9.
6<!1
14
.H
10.
7 10
. 1
11. 9
1
1.9
6.
0
-8.
9
8. 8
12
. 3
7.7
9.
6
11.
6 8.
9
8. 9
12
. 9
6. 3
10
. 8
9.0
8.
5
7. 6
13
. 4
7. 2
10
. 1
8. 0
8.
5
7. 2
16
. 4
4. 8
10
. 9
8. 5
9.
0 8.
4
13. 9
7.
1
8. 1
8.
5
8. 9
( 8.
84.
13.
34,
7.4
4 9
.34
10.
Qd
1.0
1.
3
1. 6
2.
2
1. 7
2.
5
.28
0
.27
0t
--
+ 8
PE
RC
EN
T_:
-. -
.26
0
.25
0
INTE
ND
ED
AP
PL
ICA
TIO
N.a
......
.,.--
--~
~
.24
0
.23
0 ~ -
--
--
8 PE
RC
ENT
--
.22
0
I I
I I
I I
I -N
M"
lllf
'lt,-
0"
tiit
;;ti
;t-t
;;t;
t;
t!!~~e~~~
MA
CH
INE
8
I I
I -..
. ..,
t; .
... ....
...
"'"'
~ ....
.. ~~
I I
I ., "'
,0
....
....
.... ....
.... "'U
'I "'
"'
~~~=
MA
CH
INE
9
Fig
ure
4.
Lon
gitu
dina
l v
aria
bil
ity
.
N
,s,.
Mac
h. 1
4 R
C-2
14.
14
5.
8
11.
7 9.
2
7. 9
8.
7
7. 7
9. 3
-t
2. 8
25
+ .o30
~ +.020
9 +.010
LEGEND ·-MACHINE! •·MACHINE2 0 -MACHINEJ
~MEAN +-------.-----..,---;--r;--~~ ' .
depending on what confidence of not rejecting a good job is desired. Plus two standard deviations (4 per -cent) would set the control limit at 12 percent and mean that only about 2. 5 percent of the time would a test show that the standard is not met when actually it is.
~ . . 010
:i · .020 (!)
- .030L--_,__...___.__....____. _ _.___,
AVERAGES
The variation is less for AP-00 than for the other two types of asphalt. The comparisons of the standard deviations for the different asphalts are given in Table 3. On the basis of these figures, it may be wise to consider the type of asphalt both in setting a standard for transverse variation and in measuring to determine if.the standard is being met.
Figure 5. AP-00 asphalts (machines 1, 2, and 3).
In addition to the determination of transverse variation by testing the overall variability of a test, an analysis was made to determine if the means of one pad (4 in. wide) and if 1-ft transverse sections could be determined within± 10 percent at a 95 per
cent confidence level with a reasonable number of tests. This was done by determining the percent deviation of each pad from its test mean and then comparing corresponding pads on separate tests. It was found that for 1-pad wide sections 4 to 9 tests would be required, and for 1-ft wide sections only 2 tests would be required. This method of analysis is possible but requires more computation and offers no advantage over testing for overall variation. Although it is possible to determine what pads of the test are high, it is difficult to determine what pads are covered by what nozzle and which nozzles need adjusting. Also, for end product specifications it makes more sense to deal with overall variation. Therefore the analysis is not presented.
Standard Longitudinal Variability
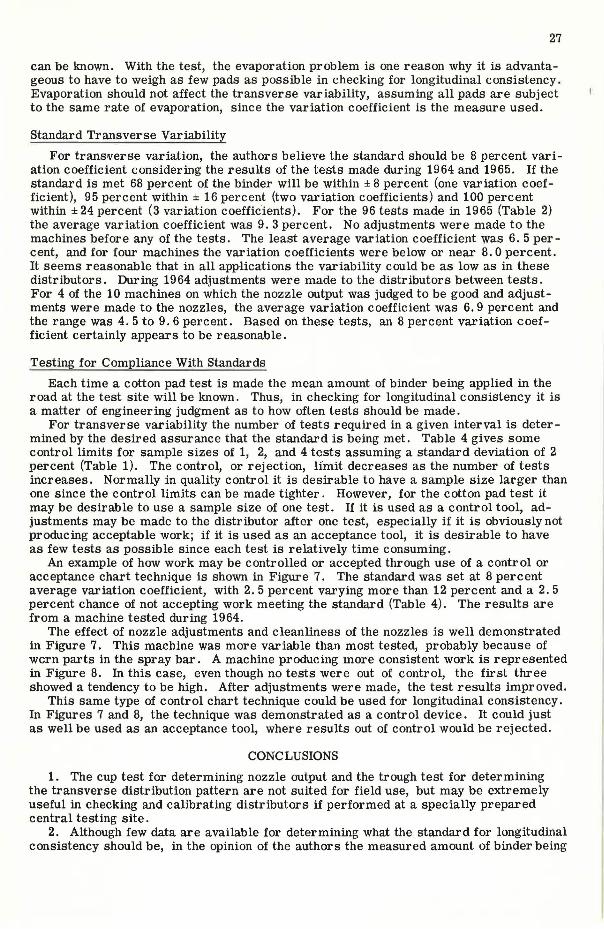
Not many data are available for determining the standard for longitudinal consistency; however, the available data indicate that the mean amount being applied should be within at least ± 8 percent of the intended application rate. Also, some 1964 data which are not presented substantiate this standard. The variation of the test means for the two sets of tests taken in 200-ft intervals in which AP-00 was used is shown in Figure 4.
Based on these tests, the ± 8 percent standard appears to be very reasonable. Although for machine 8 the application amount is 10 percent below the intended application, the consistency from test to test is extremely close. In our opinion the standard could be lower, and certainly should be no more than ± 8 percent.
Meeting the ± 8 percent standard for longitudinal consistency means only that the test mean is within 8 percent of the intended rate and indicates nothing about the transverse variability. Thus the standard for longitudinal consistency could be met and the transverse distribution be extremely variable.
Seven machines were tested in 200-ft inter -vals, but only the two shooting AP - 00 were con -sidered in determining the longitudinal standard because of evaporation. In Figure 5, the binder is AP-00 and there obviously is no evaporation from the first to the last test; but in Figure 6 with CAE-2 there obviously is evaporation. In using the cotton pad test to check for the amount of binder being applied when those types of binder which are not pure asphalts are used, it is most important to weigh each test immediately or to have a control sample so that the evaporation rate
can be known. With the test, the evaporation problem is one reason why it is advantageous to have to weigh as few pads as possible in checking for longitudinal consistency. Evaporation should not affect the transverse variability, assuming all pads are subject to the same rate of evaporation, since the variation coefficient is the measure used.
Standard Transverse Variability
For trans,verse variation, the authors believe the standard should be 8 percent variation coefficient considering the results of the tests made during 1964 and 1965. If the standard is met 68 percent of the binder will be within ± 8 percent (one variation coefficient), 95 percent within± 16 percent (two variation coefficients) and 100 percent within ± 24 percent (3 variation coefficients). For the 96 tests made in 1965 (Table 2) the average variation coefficient was 9. 3 percent. No adjustments were made to the machines before any of the tests. The least average variation coefficient was 6. 5 percent, and for four machines the variation coefficients were below or near 8. 0 percent. It seems reasonable that in all applications the variability could be as low as in these distributors. During 1964 adjustments were made to the distributors between tests. For 4 of the 10 machines on which the nozzle output was judged to be good and adjustments were made to the nozzles, the average variation coefficient was 6. 9 percent and the range was 4. 5 to 9. 6 percent. Based on these tests, an 8 percent variation coefficient certainly appears to be reasonable.
Testing for Compliance With Standards
Each time a cotton pad test is made the mean amount of binder being applied in the road at the test site will be known. Thus, in checking for longitudinal consistency it is a matter of engineering judgment as to how often tests should be made.
For transverse variability the number of tests required in a given interval is determined by the desired assurance that the standard is being met. Table 4 gives some control limits for sample sizes of 1, 2, and 4 tests assuming a standard deviation of 2 percent (Table 1). The control, or rejection, lfmit decreases as the number of tests increases. Normally in quality control it is desirable to have a sample size larger than one since the control limits can be made tighter. However, for the cotton pad test it may be desirable to use a sample size of one test. If it is used as a control tool, adjustments may be made to the distributor after one test, especially if it is obviously not producing acceptable work; if it is used as an acceptance tool, it is desirable to have as few tests as possible since each test is relatively time consuming.
An example of how work may be controlled or accepted through use of a control or acceptance chart technique is shown in Figure 7. The standard was set at 8 percent average variation coefficient, with 2. 5 percent varying more than 12 percent and a 2. 5 percent chance of not accepting work meeting the standard (Table 4). The results are from a machine tested during 1964.
The effect of nozzle adjustments and cleanliness of the nozzles is well demonstrated in Figure 7. This machine was more variable than most tested, probably because of wcrn parts in the spray bar. A machine producing more consistent work is represented in Figure 8. In this case, even though no tests were out of control, the first three showed a tendency to be high. After adjustments were made, the test results improved.
This same type of control chart technique could be used for longitudinal consistency. In Figures 7 and 8, the technique was demonstrated as a control device. It could just as well be used as an acceptance tool, where results out of control would be rejected.
CONCLUSIONS
1. The cup test for determining nozzle output and the trough test for determining the transverse distribution pattern are not suited for field use, but may be extremely useful in checking and calibrating distributors if performed at a specially prepared central testing site.
2. Although few data are available for determining what the standard for longitudinal consistency should be, in the opinion of the authors the measured amount of binder being
28
applied should be no more than ±8 percent from the intended application rate and perhaps less.
3. Longitudinal consistency can be checked periodically by running a cotton pad test. For the tests run, rarely was it necessary to weigh more than 10 randomly selected 4-in. pads to determine the mean within ± 8 percent at a 95 percent confidence level. The best approach for checking longitudinal consistency may be to weigh all pads at once, although this was not tried during the field work.
4. In checking longitudinal consistency, care must be taken when binders subjectto evaporation are used. Either the test pads must be weighed immediately or a control sample made.
5. The best measure of transverse variability is the coefficient of variation. When this measure is used the standard deviation to be expected is about 2 percent. However, for AP-00 asphalt it is lower, so in setting control or rejection limits it may be wise to consider the type of asphalt being used. (Although the means of various size transverse segments can be determined within ± 10 percent at a 95 percent confidence level, it is our opinion that the best approach to determining transverse variability is by testing the overall test variability.)
6. The standard for transverse variability should be 8 percent coefficient of variation or less based on the data collected in 1964 and 1965.
7. The cotton pad test could be a most useful tool for controlling, and for accepting or rejecting, binder applications with regard to both longitudinal and transverse variability. Although they were not demonstrated in this paper, analytical techniques could be used to reduce greatly the statistical work necessary in using the test and make it more applicable for field use.
REFERENCES
1. Zube, Ernest. Seal Coats: Laboratory Contributions Toward Better Performance. HRB Bull. 215, p. 14-37, 1959.
2. McLeod, Norman W. Basic Principles for the Design and Construction of Seal Coats and Surface Treatments with Cut-back Asphalt Cements. Supplement to Vol. 29, Proc., AAPT, Technical Sessions at Memphis, Tenn., Jan. 25, 1960.
3. South African Council for Scientific and Industrial Research. Binder Distributors. Nation:il Tm::titntP. for R.o::iil R.P.!'IP.llrl'h, R11ll. No . 1, P:rPtori~, .Tn]y l~!'if:l _
4. Asphalt Surface Treatments. Asphalt Institute, MS No. 13, Dec. 1965. 5. Enrick, N. L. Quality Control. The Industrial Press, New York, 1960.