Page 1
KTH Industrial Engineering
and Management
Control of Wear-Resistant Properties in Ti-added
Hypereutectic High Chromium Cast Iron
Qiang Liu
Licentiate Thesis
Stockholm 2012
Division of Applied Process Metallurgy
Department of Materials Science and Engineering
Royal Institute of Technology
SE-100 44 Stockholm
Sweden
Akademisk avhandling som med tillstånd av Kungliga Tekniska Högskolan i Stockholm,
framlägges för offentlig granskning för avläggande av Teknologie Licentiatexamen,
fredag den 14 december, kl. 10.00 i Kuben (N111), Materialvetenskap,
Brinellvägen 23, Kungliga Tekniska Högskolan, Stockholm
ISRN KTH/MSE--12/28--SE+APRMETU/AVH
ISBN 978-91-7501-581-1
Page 2
Qiang Liu Control of Wear-Resistant Properties in Ti-added Hypereutectic High
Chromium Cast Iron
Division of Applied Process Metallurgy
Department of Materials Science and Engineering
School of Industrial Engineering and Management
Royal Institute of Technology
SE-100 44 Stockholm
Sweden
ISRN KTH/MSE--12/28--SE+APRMETU/AVH
ISBN 978-91-7501-581-1
© Qiang Liu (刘强), September, 2012
Page 3
Abstract
High chromium cast iron (HCCI) is considered as one of the most useful wear resistance
materials and their usage are widely spread in industry. The wear resistance and mechanical
properties of HCCI mainly depend on type, size, number, morphology of hard carbides and
the matrix structure (γ or α). The Hypereutectic HCCI with large volume fractions of hard
carbides is preferred to apply in wear applications. However, the coarser and larger primary
M7C3 carbides will be precipitated during the solidification of the hypereutectic alloy and
these will have a negative influence on the wear resistance.
In this thesis, the Ti-added hypereutectic HCCI with a main composition of Fe-17mass%Cr-
4mass%C is quantitatively studied based on the type, size distribution, composition and
morphology of hard carbides and martensite units. A 11.2μm border size is suggested to
classify the primary M7C3 carbides and eutectic M7C3 carbides. Thereafter, the change of the
solidification structure and especially the refinement of carbides (M7C3 and TiC) size by
changing the cooling rates and Ti addition is determined and discussed. Furthermore, the
mechanical properties of hypereutectic HCCI related to the solidification structure are
discussed.
Mechanical properties of HCCI can normally be improved by a heat treatment process. The
size distribution and the volume fraction of carbides (M7C3 and TiC) as well as the matrix
structure (martensite) were examined by means of scanning electron microscopy (SEM) and
electron backscattered diffraction (EBSD). Especially for the matrix structure, EBSD is a
useful tool to classify the fcc (γ) and bcc (α) phases. In conclusion, low holding temperatures
close to the eutectic temperature and long holding times are the best heat treatment strategies
in order to improve wear resistance and hardness of Ti-alloyed hypereutectic HCCI.
Keywords: High Chromium Cast Iron, cooling rate, Ti addition, M7C3, TiC, carbides size
distributions, volume fraction, heat treatment, microstructure, mechanical properties, wear
resistance
Page 5
Acknowledgements
I would like to take this opportunity to thank the people who have contributed to this work.
All of first, I would like to express my sincere thanks to my supervisors Professor Keiji
Nakajima and Professor Pär Jönsson. Your endless support, enthusiasm, knowledge and
scientific discussion are very helpful for me during my growth in KTH.
I would like to thank Professor Qiang Wang, associate Professor Hongwei Zhang, associate
Professor Kai Wang and Mr. Xiangkui Zhou from Northeastern University in China. Many
thanks for their simulation support, experiment support and friendly help.
I also appreciate the help from Dr. Peter Hedström. Thanks for your experiment support, very
nice discussion and many good suggestions.
Mr. Oskar Karlsson from Swerea KIMAB is acknowledged, who has been very helpful on
EBSD measurements and analysis. Thanks also to Ms. Wenli Long, who help me a lot on the
technical problem in the KTH lab.
All colleagues in the division of TPM are thanked for their help and friendship, for sharing
Chinese food, ice-cream time, and innebandy time, in particular to Mr. Erik Roos, who teach
me many Swedish words.
Finical support by the China Scholarship Council is acknowledged.
Finally, I would like thank to my parents in China for their endless love and support.
Qiang Liu, Stockholm, September 2012.
Page 7
Preface
This is a systematic study from melting and solidification to heat treatment of a wear resistant
high chromium cast iron. The results on Ti-added hypereutectic high chromium cast iron can
be widely be applied to improvements of wear resistant parts in mineral industry plants,
power plants, steel making plants, and others. Moreover, for the development of new superior
wear resistant materials. I wish you can get some `hint` when you read this thesis, which is
intend to contribute with new knowledge in the production of wear parts.
The present thesis is based on the following supplements:
Supplement 1:
“Effect of Cooling Rate and Ti Addition on the Microstructure and Mechanical
Properties in As-Cast Condition of Hypereutectic High Chromium Cast Irons”
Qiang Liu, Hongwei Zhang, Qiang Wang, Xiangkui Zhou, Pär G. Jönsson, Keiji Nakajima
Accepted for publication in ISIJ Int., 52(2012), No. 12.
Supplement 2:
“Effect of Heat Treatment on Microstructure and Mechanical Properties of Ti-alloyed
Hypereutectic High Chromium Cast Iron”
Qiang Liu, Peter Hedström, Hongwei Zhang, Qiang Wang, Pär G. Jönsson, Keiji Nakajima
Accepted for publication in ISIJ Int., 52(2012), No. 12.
Qiang Liu performed the literature survey, a major part of the experimental work, and a
major part of the writing.
Page 9
Contents Chapter 1 General Overview ..................................................................................................... 1
1.1 Introduction ................................................................................................................................... 1
1.2 The purpose and outline of thesis .................................................................................................. 2
Chapter 2 Experiment Methods and Theoretical Works ......................................................... 5
2.1 Experiment Methods ..................................................................................................................... 5
2.1.1 Melting and solidification process .......................................................................................... 5
2.1.2 Heat treatment process ........................................................................................................... 7
2.1.3 Microstructure observations and image analysis… ................................................................ 8
2.1.4 Mechanical properties measurement .................................................................................... 10
2.2 Theoretical works ........................................................................................................................ 11
Chapter 3 Microstructure and Properties in As Cast Condition ........................................... 13
3.1 Microstructure of Ti-added hypereutectic HCCI......................................................................... 13
3.2 Phase diagram.............................................................................................................................. 14
3.3 Effect of Cooling Rate on Solidification Structure ..................................................................... 15
3.4 Effect of Ti addition on Solidification Structure ......................................................................... 17
3.4.1 Effect of Ti addition on the carbides distributions ............................................................... 17
3.4.2 Effect of Ti addition and cooling rate on the volume fraction ............................................. 21
3.5 Classification of M7C3 carbides ................................................................................................... 22
3.6 Effect of Cooling Rate and Ti Addition on the Mechanical Properties in As-Cast Condition of
the hypereutectic HCCIs ................................................................................................................... 26
Chapter 4 Improvement of Properties by Heat Treatment .................................................... 29
4.1 Phase diagram.............................................................................................................................. 29
4.2 Evolution of M7C3 ....................................................................................................................... 30
4.3 Evolution of TiC .......................................................................................................................... 33
4.4 Evolution of Matrix ..................................................................................................................... 34
4.5 Mechanical properties ................................................................................................................. 37
Chapter 5 Conclusions ............................................................................................................ 39
Suggestions for Future Work .................................................................................................. 41
References ................................................................................................................................ 43
Page 11
1
Chapter 1
General Overview
1.1 Introduction
The Fe-Cr-C system alloys have widely been applied to wear resistant parts in steel making
plants, power plants, mineral industry plants, and others [1,2]. In all industrial fields, however,
the improvement of the abrasion wear-resistance is strongly required because of its short life.
In the first half of the 1980s, High Chromium Cast Iron (HCCI) with a composition range of
2.0-4.3%C [2] and 12-30%Cr [3] were started to be applied to roll materials for hot rolling.
The wear performance level of hypereutectic HCCIs is mainly controlled by a high volume
fraction (30 to 60%) of M7C3 type carbides (1200~1600 HV) [4], M23C6 type carbides (1600-
2520HV) [5], MC type carbides (2400-4000HV) [5], etc. These carbides will precipitate
during the solidification and heat treatment and will influence the final material properties.
Compared to the Hypoeutectic HCCI, as the result of carbonization inside the Hypereutectic
HCCIs highly increased, the hardness of Hypereutectic HCCIs is obviously improved via a
higher carbon and chromium content. These higher addition will also cause an increase of the
volume fraction of carbides. However, the coarser and larger primary carbides will be
precipitated during the solidification of the hypereutectic HCCI. These coarser primary
carbides have a negative effect on the improvement of the wear resistance of all alloy.
Therefore, many investigations have been executed with the aim of refining the solidification
structure and improving the properties of hypereutectic HCCIs. Here, additions of alloy
elements have been used to form the NaCl type carbides, such as Ti, Nb, V, Nb, Zr etc.[6-13]
Those elements, which are strong carbide forming elements, will react with carbon and form
NaCl type carbides, such as TiC, NbC, VC etc.. These can act as heterogeneous nuclei for the
precipitation of M7C3 type carbides during the cooling and solidification of the melt.[6-8]
This, in turn, results in significant refinements of the final carbides size. Moreover, we should
point out that the size, volume fraction and distribution of these carbides will also affect the
final properties of the hypereutectic HCCIs significantly.
For many applications, a higher wear resistance is required to improve the service life of the
wear components. In comparison to as-cast cast iron, heat-treated cast irons with higher wear
Page 12
2
resistance are prior to service. The reason is that the matrix changes from an austenitic
structure (fcc, γ) into a martensitic structure (bct, α’) and new carbide precipitates (M7C3 [3,
14] or M23C6 [15-17] form within the matrix. Therefore, many studies [4, 14-15, 18-22]
focusing on improving the properties of cast iron, by alternative heat treatment processes,
have been reported. Most of the previous studies are focused on identifying the new carbides
by using transmission electron microscopy (TEM). [14, 16-20, 22-24] They have furthermore
studied how the new carbides influence the final properties. However, we also should point
out that the mechanical properties to a large extent are determined by the shape, size
distribution and volume fraction of martensite and carbides formed in the HCCI.
1.2 The purpose and outline of thesis
At present, few reports discuss how the carbide size distribution influences their final
solidification structure and properties. However, they only show the effects of the average
diameter and volume fraction of the total amount of carbides on the material properties. [6-9,
11] In addition, for heat treated HCCI, only a few studies quantitatively discuss how the size
distribution of carbides and martensite units affect the final properties of hypereutectic HCCI.
Therefore, a quantitative study on the carbides, martensite units and their influence on
mechanical properties is desired.
In this thesis, in order to develop superior abrasion resistant castings, a research is done on
solidification and heat treatment related to the control of carbides precipitation and final
material properties in Ti-added hypereutectic high chromium cast iron. We quantitatively
study the size distribution, composition and morphology of carbides and martensite units in
the Ti-added hypereutectic HCCI with main composition of Fe-17mass%Cr-4mass%C.
An outline of thesis is given and organized as follows:
Supplement 1:
(Melting and solidification)
In order to refine the primary M7C3 type carbides in Hypereutectic HCCI, different
cooling rates and Ti addition were used. The size distribution, composition, volume
fraction and morphology of carbides (M7C3, TiC) are quantitatively measured and
their influence on the mechanical is discussed.
Page 13
3
Prediction of precipitation, solidification structure phase diagram and fraction of
HCCI (Fe-17mass%Cr-4mass%C multicomponent alloys) is done by using a
multiphase micro-segregation model, which is coupled with the CALPHAD method
using the Thermo-Calc software. Overall, the prediction results agree well with the
experimental results.
Supplement 2:
(Heat treatment)
The relationship between carbide precipitation, martensite units and mechanical
properties are discussed based on the volume fraction and the size distribution of
carbide precipitates (M7C3 and TiC) as well as the martensite units. A possible
mechanism is finally proposed to explain the improvement of mechanical properties
through the heat treatment process. In addition, the best heat treatment strategy is
suggested.
Page 15
5
Chapter 2
Experiment Methods and Theoretical Works
In the present thesis, carbides precipitation behavior, phase transformation and their influence
on the mechanical properties in the Ti-added Hypereutectic HCCI were studied both
experimentally and theoretically. However, experimental studies were taken as the major
research tools in this thesis.
2.1 Experiment Methods
2.1.1 Melting and solidification process
Based on the requirements during actual production, melts were prepared in a laboratory
furnace. High-carbon ferro-chromium (Fe-8mass%C-60mass%Cr), ferro-molybdenum (Fe-
0.05mass%C-58.4mass%Mo), pure iron, pig iron (Fe-3.8mass%C-0.34mass%Mn-
1.8mass%Si), ferro-titanium(Fe-30mass%Ti), ferro-manganese(Fe-75.9mass%Mn), and pure
nickel were melted in a 8 kg capacity graphite crucible. This was done using a medium
frequency induction furnace (45Kw, 7k Hz) and using an air atmosphere.
Table 2.1 Chemical compositions of high chromium cast iron (HCCI) used in the experiments. (mass.%)
C Cr Ti Mn Mo Ni Si N S O P Fe
Sand
4.01 16.2 - 2.04 1.01 1.24 0.775 0.020 0.018 0.0086 0.026 Bal.
3.79 17.0 1.53 2.08 1.05 1.09 0.416 0.016 0.017 0.014 0.025 Bal.
Graphite
4.9 16.4 - 1.59 0.75 1.09 0.845 0.019 0.022 0.0046 0.025 Bal.
4.03 15.6 0.74 1.72 0.93 1.08 0.992 0.014 0.020 0.0047 0.023 Bal.
4.01 17.4 1.48 1.91 0.89 1.11 0.951 0.015 0.017 0.011 0.024 Bal.
3.91 17.5 3.36 1.95 1.01 1.08 0.966 0.025 0.025 0.031 0.022 Bal.
Metal
3.92 14.7 - 1.950 0.95 1.05 0.529 0.015 0.020 0.0037 0.024 Bal.
3.90 16.8 1.06 1.95 0.99 1.15 0.708 0.014 0.014 0.0094 0.024 Bal.
Composition
s Mold
Page 16
6
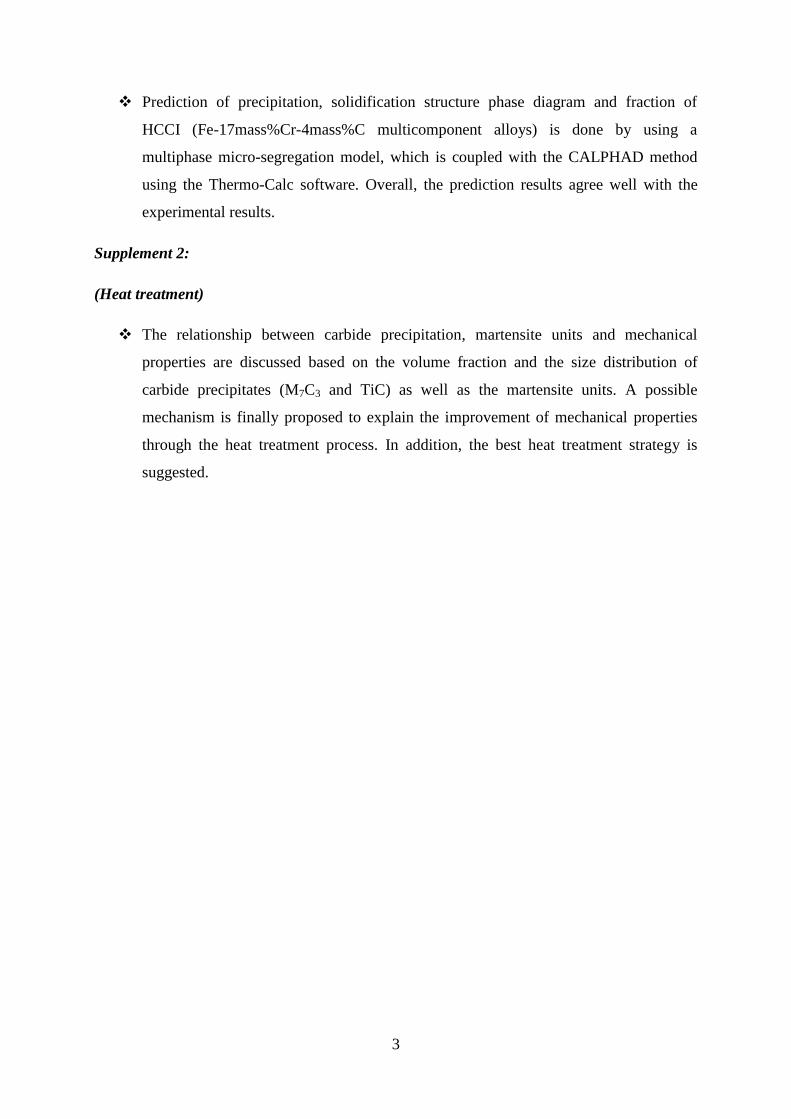
The alloy compositions are shown in Table 2.1. Pure iron, pig iron and high carbon ferro-
chromium were first melted. Then, ferro-manganese and ferro-molybdenum were added. At
last, pure nickel and ferro-titanium were added into this mother alloy.
Fig. 2.1. Schematic diagram of melting process of hypereutectic HCCIs with 1.5mass% Ti addition and casting
in the graphite mold.
The holding time over the TiC precipitation temperature was controlled as 3min±1min, in
order to prevent the agglomeration of TiC carbide precipitation. Finally, the molten
hypereutectic HCCIs were poured into the mold at 1450±10°C. The following three mold
types were used: sand mold (silica sand), graphite mold, metal mold (ASTM: 1045). The
schematic diagram of melting process is shown in Fig. 2.1.
The dimension of the ingot is 120mm L×84mm W×55mm H. A schematic view of the ingot
and the thermocouple (Type-B) position is shown in Fig. 2.2.
Fig. 2.2 Schematic view of ingot and cutting position of sample for microstructure observation.
Page 17
7
0 100 200 300 400 500 600 7001000
1100
1200
1300
1400
1500
Time, s
Tem
pera
ture
, oC
Sand mold
Metal mold
Graphite mold
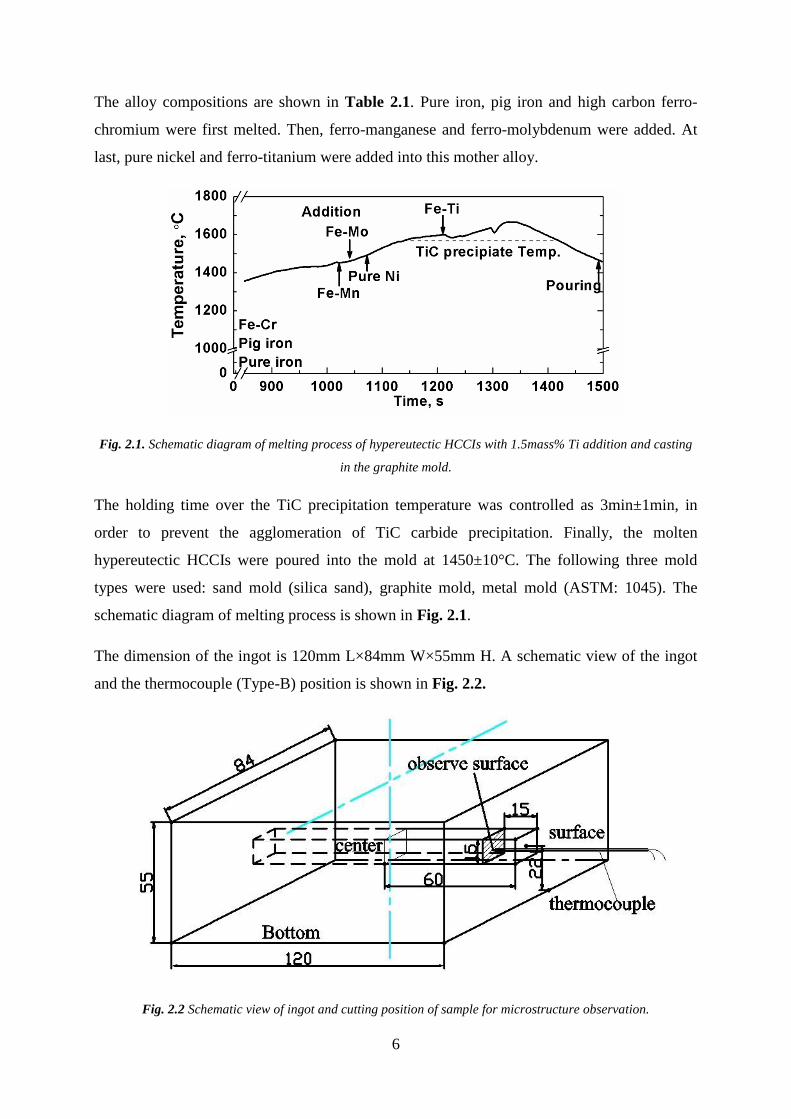
Fig. 2.3.Typical cooling curves measured in three kinds of molds for hypereutectic HCCIs with 1.5mass% Ti
addition.
Sand mold Graphite mold Metal mold
Cooling rate condition: 25oC/min, 80
oC/min 110
oC/min
In addition, the cooling curves obtained from the three different molds are shown in Fig. 2.3.
From this information the following different cooling rates were obtained: 25oC/min, 80
oC/min and 110
oC/min within 10% errors for the sand mold, graphite mold and metal mold,
respectively.
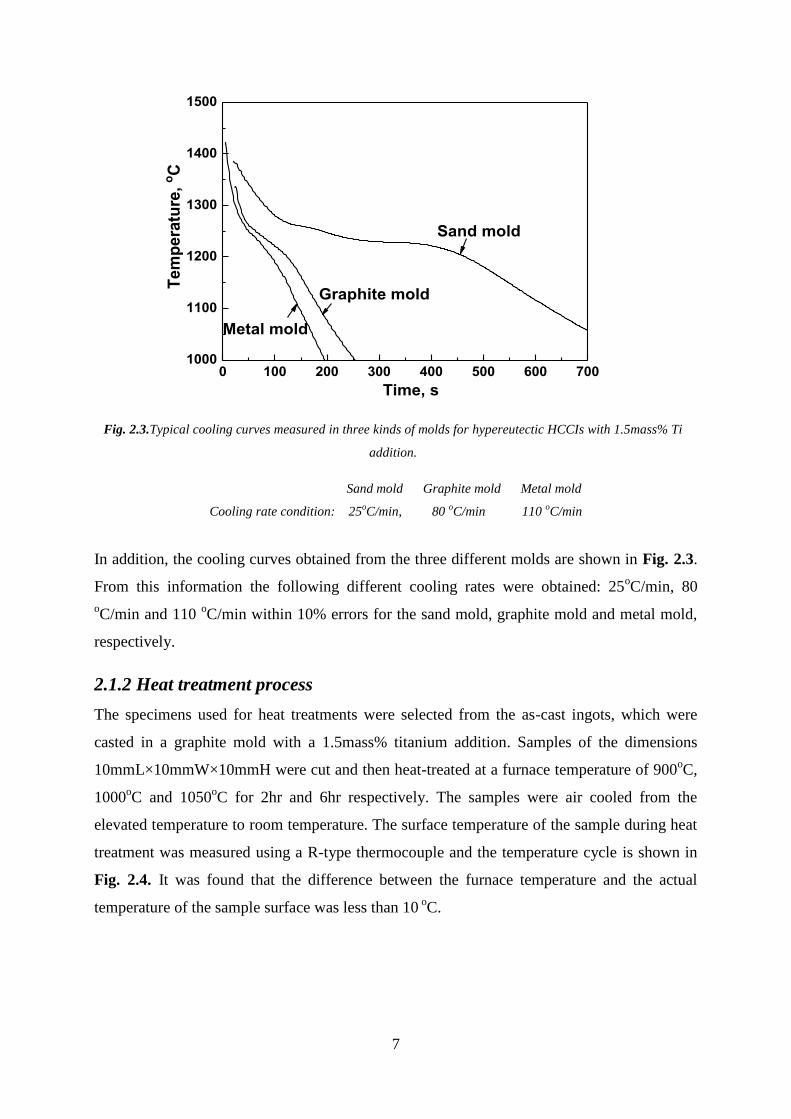
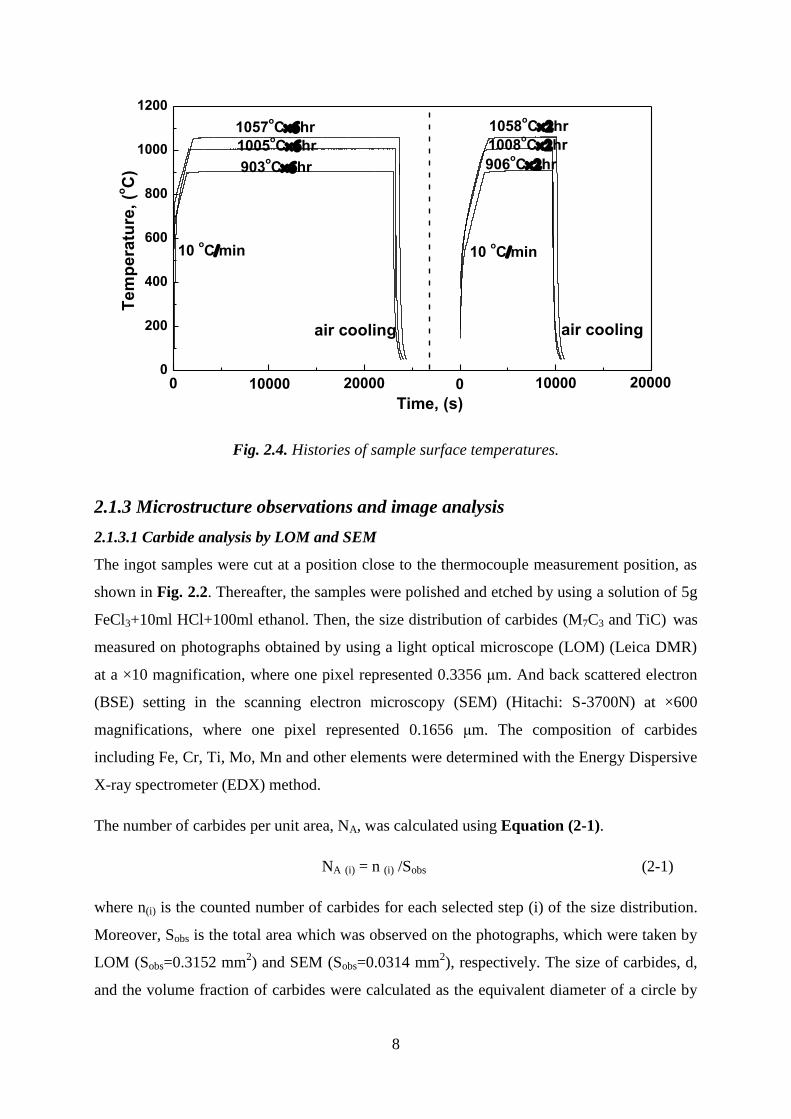
2.1.2 Heat treatment process
The specimens used for heat treatments were selected from the as-cast ingots, which were
casted in a graphite mold with a 1.5mass% titanium addition. Samples of the dimensions
10mmL×10mmW×10mmH were cut and then heat-treated at a furnace temperature of 900oC,
1000oC and 1050
oC for 2hr and 6hr respectively. The samples were air cooled from the
elevated temperature to room temperature. The surface temperature of the sample during heat
treatment was measured using a R-type thermocouple and the temperature cycle is shown in
Fig. 2.4. It was found that the difference between the furnace temperature and the actual
temperature of the sample surface was less than 10 oC.
Page 18
8
0
200
400
600
800
1000
1200
200000
10 oCmin10
oCmin
906oChr
1008oChr
1058oChr
air cooling
1005oChr
903oChr
T
em
pe
ratu
re,
(oC
)
Time, (s)
1057oChr
air cooling
10000 200000 10000
Fig. 2.4. Histories of sample surface temperatures.
2.1.3 Microstructure observations and image analysis
2.1.3.1 Carbide analysis by LOM and SEM
The ingot samples were cut at a position close to the thermocouple measurement position, as
shown in Fig. 2.2. Thereafter, the samples were polished and etched by using a solution of 5g
FeCl3+10ml HCl+100ml ethanol. Then, the size distribution of carbides (M7C3 and TiC) was
measured on photographs obtained by using a light optical microscope (LOM) (Leica DMR)
at a ×10 magnification, where one pixel represented 0.3356 μm. And back scattered electron
(BSE) setting in the scanning electron microscopy (SEM) (Hitachi: S-3700N) at ×600
magnifications, where one pixel represented 0.1656 μm. The composition of carbides
including Fe, Cr, Ti, Mo, Mn and other elements were determined with the Energy Dispersive
X-ray spectrometer (EDX) method.
The number of carbides per unit area, NA, was calculated using Equation (2-1).
NA (i) = n (i) /Sobs (2-1)
where n(i) is the counted number of carbides for each selected step (i) of the size distribution.
Moreover, Sobs is the total area which was observed on the photographs, which were taken by
LOM (Sobs=0.3152 mm2) and SEM (Sobs=0.0314 mm
2), respectively. The size of carbides, d,
and the volume fraction of carbides were calculated as the equivalent diameter of a circle by
Page 19
9
using an image analyzer, which is commercial software, Winroof ©
. The size distributions for
carbides and martensite unit are plotted using a logarithmic scale. The value of size d(j), for
the j-th step, ∆(j), of a log-normal distribution can be determined as follows:
d(j) or D(j) = 10∆
(j) (2-2)
where ∆(j) is the width of the j-th step for log-normal distributions (∆(j)= ∆(j-1)+0.15). This
range is from -0.15 to 2.4 for M7C3 carbides (d), from -1.05 to 2.1 for TiC carbides (d) and
from -2.25 to 2.4 for martensite unit (D). In this case, the mean value for the j-th step of the
size distribution, d(j) or D(j) varies from 0.85 to 214.51 μm, from 0.11 to 107.51 μm, and from
0.0068 to 214.5038μm respectively.
2.1.3.2 Carbide and matrix analysis by EBSD
Electron backscattered diffraction (EBSD) analysis was carried out to identify the phases in
the specimens. [25, 27] Austenite (fcc, γ), martensite (bct, α’) and carbides (M23C6, M7C3 and
TiC) were included in the analysis. The flatness and surface quality of specimens is crucial for
EBSD analysis [26] in order to properly index phases such as e.g. martensite. [27]
In this
study, the specimens used for EBSD analysis were polished; first by manual polishing using
SiC abrasive papers (P240-P320) together with water, secondly with 9 μm and 3 μm diamond
suspensions. Finally, specimens were polished with a 0.05μm colloidal SiO2 by automatic
polishing. The detailed preparation procedure for the hypereutectic HCCI is shown in Table
2.2.
Table 2.2 EBSD sample preparation for the hypereutectic HCCI
Step
Disk name and type No.
(Company: BUEHLER)
Abrasive Size and
suspension
Load(N)
Speed(rpm) and
Direction
Time
(minutes)
Step 1
ApexHercules® S rigid
No.41-27400-412-001
9μm
diamond suspension
30
150
(Comply)
5
Step 2
MicroFloc
No.40-8322
3μm
diamond suspension
30
150
(Comply)
5
Step 3
ChemoMet®
No.40-7922
0.05μm
colloidal silica
30
150
(Contrary)
2
Page 20
10
The EBSD measurements were performed using a LEO 1530 FEG (Field Emission Gun)-
SEM installed with the HKL system and the HKL Channel 5 software. The specimens were
tilted 70o
towards the detector and the microscope was operated at an acceleration voltage of
15kV, in high current mode, and using an aperture of 120μm. Two different step sizes of
0.1μm and 0.03μm were used. The area scanned with a 0.1μm step size was 200μm×150μm
and the area scanned with the step size 0.03μm was 10μm×10μm. The reason for using two
step sizes was the rather broad size distribution. The size and volume fraction of carbide and
martensite units were determined using image analysis made on EBSD maps.
The EBSD measurements were further complemented by energy dispersive X-ray
spectroscopy (EDS) mapping using the INCA software. The EDS analysis was conducted
using a 20kV acceleration voltage and a 30μm aperture in high current mode. The EDS
analysis enabled a more sound identification of the phases since both crystal symmetry
(EBSD) as well as chemical composition (EDS) could be considered for the observed
microstructural features.
The number of carbide precipitates and martensite units per unit area (NA) was calculated by
Equation (2-1). In this case, the parameter Sobs is the total area of the micrographs, which was
0.0314 mm2
for SEM. For EBSD Sobs=0.0001 mm2 (0.03μm step) and Sobs=0.03 mm
2 (0.1μm
step) was used.
The size of martensite units (D) was calculated as the equivalent diameter of a circle, which
has the same area as the measured martensite unit.
2.1.4 Mechanical properties measurement
The mechanical properties: bulk hardness and wear loss of the hypereutectic HCCIs was
investigated in the as-cast condition and each heat treatment. The bulk hardness was measured
by using a Rockwell type hardness tester, HR-150A with the Rockwell C scale (HRC).
Overall, eight measurements were done for each sample. The wear resistance was evaluated
by using a single platform rotary abraser (model: ML-100 type, Zhangjiakou Taihua Machine
Factory). The wear tests were performed at a platform speed of 60rpm under a load of 100N.
The size of the wear test samples was 4.1mm (φ)×l0mm(H). The tests were performed on a 80
mesh Al2O3 abrasive paper at room temperature. The total sliding distance and the testing
time of the samples on the abrasive paper were 9m and 25s, respectively. The mass loss of the
specimens due to abrasion was calculated by measuring the weight of the specimens before
and after tests with a 0.001mg accuracy. Three measurements were carried out per sample.
Page 21
11
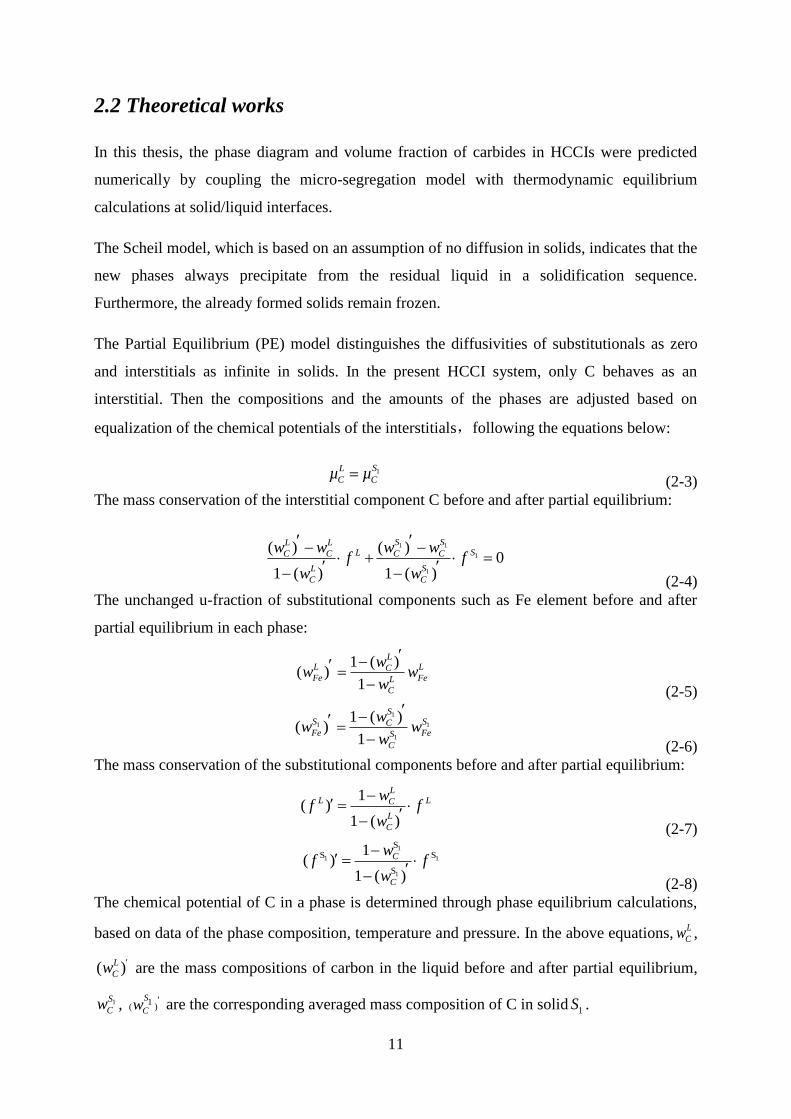
2.2 Theoretical works
In this thesis, the phase diagram and volume fraction of carbides in HCCIs were predicted
numerically by coupling the micro-segregation model with thermodynamic equilibrium
calculations at solid/liquid interfaces.
The Scheil model, which is based on an assumption of no diffusion in solids, indicates that the
new phases always precipitate from the residual liquid in a solidification sequence.
Furthermore, the already formed solids remain frozen.
The Partial Equilibrium (PE) model distinguishes the diffusivities of substitutionals as zero
and interstitials as infinite in solids. In the present HCCI system, only C behaves as an
interstitial. Then the compositions and the amounts of the phases are adjusted based on
equalization of the chemical potentials of the interstitials,following the equations below:
1SL
C Cµ µ (2-3)
The mass conservation of the interstitial component C before and after partial equilibrium:
1 1
1
1
( ) ( )0
1 ( ) 1 ( )
S SL LSLC C C C
SL
C C
w w w wf f
w w
(2-4)
The unchanged u-fraction of substitutional components such as Fe element before and after
partial equilibrium in each phase:
1 ( )( )
1
LL LCFe FeL
C
ww w
w
(2-5)
1
1 1
1
1 ( )( )
1
SS SCFe FeS
C
ww w
w
(2-6)
The mass conservation of the substitutional components before and after partial equilibrium:
1( )
1 ( )
LL LC
L
C
wf f
w
(2-7)
1
1 1
1
SS S
S
1( )
1 ( )
C
C
wf f
w
(2-8)
The chemical potential of C in a phase is determined through phase equilibrium calculations,
based on data of the phase composition, temperature and pressure. In the above equations,L
Cw ,
( )L
Cw are the mass compositions of carbon in the liquid before and after partial equilibrium,
1S
Cw , 1( )
S
Cw are the corresponding averaged mass composition of C in solid 1S .
Page 22
12
1 1 1 1* ( ) /S S S Sk k
C C
k k
w w f f (2-9)
where 1* S
Cw is the newly formed composition in S1 at the k th step. The parameters Lf , 1Sf (
1S
kk
f ) are the mass fractions of the liquid and the solid phases 1S at k th step, respectively.
The partial equilibrium among several phases (i.e. liquid and solid phase j =1, m) is regarded
as equivalent to several partial equilibriums between two phases (e.g. liquid and one of the
solids,1S ). Therefore, the mass conservation of the interstitial component among all phases
follows equation (2-10) instead of equation (2-4),
( ) ( )0
1 ( ) 1 ( )
j j
j
j
S SL LSLC C C C
SLj
C C
w w w wf f
w w
(2-10)
The calculations are based on the ideas of Chen and Sundman. [28, 29] They are performed in
Thermo-Calc/TQ interface [30] by a coupling of thermodynamic equilibrium calculations
with the alloy database TCFE6. [31] A temperature step of -1 °C was used in the calculations.
The calculations by the PE and Scheil models were stopped when the liquid fraction in mass
was less than 10-4
.
Page 23
13
Chapter 3
Microstructure and Properties in As Cast Condition
This chapter concerns the solidification structure evolution and its influence on the final
properties of Ti-added hypereutectic HCCI with a main composition of Fe-17mass%Cr-
4mass%C. Different cooling rates and Ti additions were applied to refine M7C3 type carbides.
A quantitative discussion for carbides (M7C3, TiC) was done based on the size distribution,
composition, volume fraction and morphology of these carbides. Finally, the effect of cooling
rates and Ti addition on the mechanical properties in as cast condition of hypereutectic HCCI
is discussed.
3.1 Microstructure of Ti-added hypereutectic HCCI
The solidification microstructure consists of primary M7C3 carbides with a large hexagonal
columnar structure, eutectic M7C3 carbides with an irregular shape, TiC carbides with a cubic
structure and a matrix containing mainly of an austenite phase (γ), as shown in Fig. 3.1(a)-
3.1(c). After heat treatment, matrix changes from austenite into martensite, as shown in Fig.
3.1(c)- 3.1(d), and the secondary carbides also precipitate, as shown in Fig. 3.1(d).
Fig. 3.1. Microstructure of Ti-added hypereutectic HCCI, (a) LOM and (b) SEM for carbides, (c) and (d) EBSD
for matrix
Page 24
14
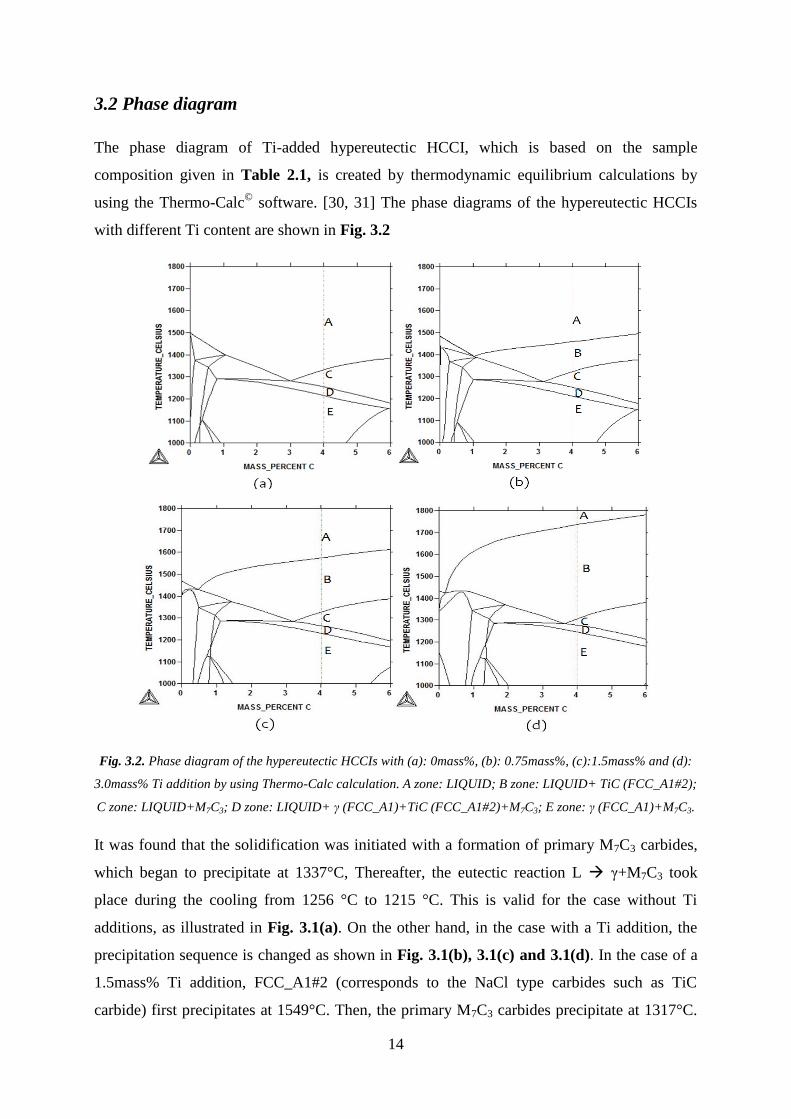
3.2 Phase diagram
The phase diagram of Ti-added hypereutectic HCCI, which is based on the sample
composition given in Table 2.1, is created by thermodynamic equilibrium calculations by
using the Thermo-Calc©
software. [30, 31] The phase diagrams of the hypereutectic HCCIs
with different Ti content are shown in Fig. 3.2
Fig. 3.2. Phase diagram of the hypereutectic HCCIs with (a): 0mass%, (b): 0.75mass%, (c):1.5mass% and (d):
3.0mass% Ti addition by using Thermo-Calc calculation. A zone: LIQUID; B zone: LIQUID+ TiC (FCC_A1#2);
C zone: LIQUID+M7C3; D zone: LIQUID+ γ (FCC_A1)+TiC (FCC_A1#2)+M7C3; E zone: γ (FCC_A1)+M7C3.
It was found that the solidification was initiated with a formation of primary M7C3 carbides,
which began to precipitate at 1337°C, Thereafter, the eutectic reaction L γ+M7C3 took
place during the cooling from 1256 °C to 1215 °C. This is valid for the case without Ti
additions, as illustrated in Fig. 3.1(a). On the other hand, in the case with a Ti addition, the
precipitation sequence is changed as shown in Fig. 3.1(b), 3.1(c) and 3.1(d). In the case of a
1.5mass% Ti addition, FCC_A1#2 (corresponds to the NaCl type carbides such as TiC
carbide) first precipitates at 1549°C. Then, the primary M7C3 carbides precipitate at 1317°C.
Page 25
15
Finally, the eutectic reaction L γ+M7C3 occur from 1258°C. Moreover, the precipitation
temperature of the TiC carbide increases from 1459°C to 1734°C with an increased Ti content
from 0.75mass% to 3.0mass%.
3.3 Effect of Cooling Rate on Solidification Structure
As mention in chapter 2, we obtained three kinds of cooling rates, which were examined in
the three kinds of mold. The idea for refining the microstructure by increasing cooling rates is
based on: that the nucleation probability of primary M7C3 carbides increases due to the
increase of the precipitation undercooling degree.
It is apparent from the photographs in Fig. 3.3(a) that in the case without Ti addition, the size
of primary M7C3 carbides decreases as the cooling rate increase. It is also apparent from the
comparison between Fig. 3.3(a) and 3.3(b) that the size of M7C3 carbides in the case of a
1.5mass% Ti addition is significantly smaller than that in the case without a Ti addition. This
is due to a precipitation of TiC carbides.
Fig. 3.3. Optical Microscope Observations for M7C3 carbide under different cooling rate,
(a) Ti=0mass%, (b) Ti=1.5mass%
As shown in Fig. 3.4(a) representing a case without Ti additions, the maximum size of
primary M7C3 carbides (>11.2 μm) decreases from 151.9 to 53.9 μm with an increased
cooling rate (from a sand mold to a metal mold). In addition, the number of eutectic M7C3
carbides, which in general has a size less than 11.2 μm, increases from 0.81×103 mm
-2 to
4.80×103 mm
-2 with an increased cooling rate. Moreover, as shown in Fig 3.4(b) representing
a case with a 1.5mass% Ti addition, the maximum size of primary M7C3 carbides (>11.2 μm)
is not changed too a large degree. However, the number of eutectic M7C3 carbides (<11.2 μm)
Page 26
16
10-1
100
101
102
103
10-1
100
101
102
103
104
4.80103
mm-2
0.81103
mm-2
53.9 um
151.9 um
Eutectic M7C
3
Ti=0%
Sand mold
Graphite mold
Metal mold
N
A(m
m-2)
d (um)
Primary M7C
3
Peak value
(a)
10-1
100
101
102
103
10-1
100
101
102
103
104
(b)
Peak value
53.9 um
Eutectic M7C
3
Ti=1.5%
Sand mold
Graphite mold
Metal mold
N
A(m
m-2
)
d (um)
Primary M7C
3
2.49103
mm-2
1.29103
mm-2
Fig. 3.4. Effect of cooling rate on M7C3 carbide size distribution of the hypereutectic HCCIs with (a): without Ti
addition; (b): 1.5mass% Ti addition by using optical microscope photos.
increases from 1.29×103 mm
-2 to 2.49×10
3 mm
-2 with an increased cooling rate, when a
1.5mass% Ti addition is used.
Comparing Fig. 3.4(a) with Fig. 3.4(b), it can be seen that the size of primary M7C3 carbides
in the case of a 1.5mass%Ti addition is significantly smaller than that in the case without a Ti
addition. Furthermore, that the maximum sizes are 53.9 μm and 151.9 μm respectively.
Making the story short, the size of primary M7C3 carbides of the hypereutectic HCCIs can be
refined both by Ti additions and by increasing the cooling rate.
Page 27
17
3.4 Effect of Ti addition on Solidification Structure
As mentioned in chapter 1, strong carbide forming elements, such as Ti, Nb, V, Nb, Zr etc.,
will react with carbon to form NaCl (MC) type carbides. Those MC type carbides can act as
heterogeneous nuclei for the precipitation of M7C3 type carbides during the cooling and
solidification of the melt. Therefore, based on this idea, we chose Ti to study its influence on
the solidification structure of HCCI.
Fig. 3.5. SEM and EDX analysis for TiC carbide with 1.5mass% Ti addition in the graphite mold.
(Point A and C : Ti(C,N); Point B and D: (Ti,Mo)C)
As shown in Fig. 3.5, it is confirmed that the TiC carbides can act as a nuclei of M7C3
carbides. More specifically, it was found that TiC carbides can not only act as nuclei of M7C3
carbides, but they also contain a Ti(C, N) core. This is illustrated by the black point A, C in
Fig. 3.5. Furthermore, EDX results show that the main composition particle in B and D is Ti,
Mo and C, it should be (Ti, Mo)C. However, the chemical composition of the black points A
and C shows that Ti, C and N are dominant, and that the TiC carbides should be Ti(C, N).
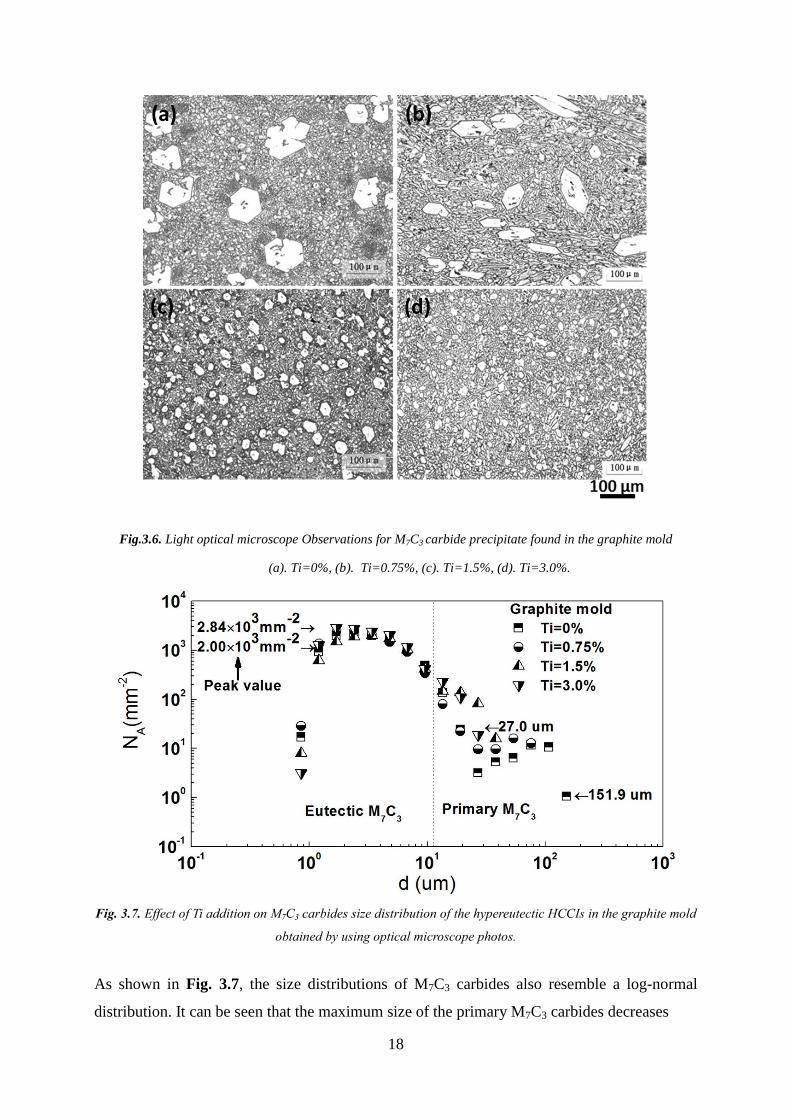
3.4.1 Effect of Ti addition on the carbides distributions
Fig. 3.6 shows the micrographs solidification structure for different Ti additions. The
microstructure of M7C3 carbides is refined significantly with increasing Ti contents.
Page 28
18
Fig.3.6. Light optical microscope Observations for M7C3 carbide precipitate found in the graphite mold
(a). Ti=0%, (b). Ti=0.75%, (c). Ti=1.5%, (d). Ti=3.0%.
Fig. 3.7. Effect of Ti addition on M7C3 carbides size distribution of the hypereutectic HCCIs in the graphite mold
obtained by using optical microscope photos.
As shown in Fig. 3.7, the size distributions of M7C3 carbides also resemble a log-normal
distribution. It can be seen that the maximum size of the primary M7C3 carbides decreases
Page 29
19
Fig. 3.8. SEM observation for TiC carbide, (a): Ti=0.75mass%, (b): Ti=1.5mass%, (c): Ti=3.0mass%.
from 151.9 to 27.0 μm with an increased Ti addition in the graphite mold. However, the size
and number of eutectic M7C3 precipitates do not change too a large degree (from 2.00×10³
mm-2
to 2.84×103 mm
-2) with an increased Ti content. The reason for this will be explained in
section 3.2.3. The back scattered electron (BSE) observations for TiC carbides are shown in
Fig. 3.8. TiC carbides are mostly located inside or at the boundary of M7C3 carbides, as
shown in Fig. 12. Moreover, TiC carbides starts to grow and agglomerate when the Ti content
is 1.5mass%, as shown in Fig. 3.8 (b). It is also apparent from the photographs in Fig. 3.8(c)
that larger and coarser clusters of TiC carbides exist.
The size distribution of TiC carbides in the graphite mold for different Ti additions is shown
in Fig. 3.9. These carbides generally have a size less than 10 μm. Moreover, it can be seen
that both the size and number of TiC carbides increase with an increased Ti addition.
Also, Fig. 3.10 shows the size distribution of TiC carbides with 1.5mass% Ti addition in a
sand mold, a graphite mold and a metal mold. The average size of TiC carbides with a
1.5mass% Ti addition does not change practically with an increased cooling rate. Also, the
number of TiC carbides does not change due to the increased cooling rate. Consequently, it is
clear that the precipitation of TiC carbides was not seemingly affected by the cooling rate.
Page 30
20
Thus, it is confirmed that the cooling rate will not affect the precipitation behavior of TiC
carbides.
Fig. 3.9. Effect of Ti addition on TiC carbide size distribution of the hypereutectic HCCIs in the graphite
obtained by using SEM photos
Fig. 3.10. Effect of cooling rate on TiC carbide size distribution of the hypereutectic HCCIs with 1.5mass% Ti
addition obtained by using SEM photos
Page 31
21
3.4.2 Effect of Ti addition and cooling rate on the volume fraction
Calculation results and experiment results of the volume fractions of M7C3 carbides and TiC
carbides are shown in Fig. 3.11. It can be seen that the volume fraction of M7C3 carbides
Fig.3.11. Calculation results and experiment results on volume fraction of M7C3 carbides and TiC carbide
decreases with an increased cooling rate. The condition in the low cooling rate seems to be
more close to the condition in the equilibrium state. However, the 5-10vol.% of M7C3
carbides did not fully precipitate in the high cooling rate condition. Moreover, the volume
fraction of M7C3 carbides decreases with a Ti addition due to the reaction between Ti and C.
Furthermore, the volume fraction of Ti carbides increases with increased Ti additions in the
graphite mold. However, the volume fraction of TiC carbides does not change although the
cooling rate changed.
If the experimental results are compared to the calculation results, it can be seen that the
tendency is the same. Moreover, that the experimental results are closer to the PE calculation
results. The agreement between experiment and calculation results is within 5%, which is
Page 32
22
encouraging. This is due to that the PE calculation considers the carbon back diffusion and
consequently the results will be closer to the real experimental situation.
3.5 Classification of M7C3 carbides
In this study, it is suggested that the M7C3 type carbides in the HCCIs can be classified into
primary M7C3 carbides and eutectic M7C3 carbides depending on the time of precipitation.
The primary carbides precipitate in the melt before solidification (that is during cooling of the
melt until the solidification temperature is reached). The eutectic M7C3 carbides precipitate
during the eutectic reaction. The precipitation possibility of M7C3 carbides before and during
solidification is estimated for the sample composition given in Table 2.1. This was done
based on thermodynamic equilibrium calculations by using Thermo-Calc©
. The volume
fraction of precipitated primary M7C3 carbides, eutectic M7C3 carbides and TiC carbides are
plotted against the temperature in Fig. 3.12.
1000 1100 1200 1300 1400 1500 1600 1700 18000.00
0.05
0.10
0.15
0.20
0.25
0.30
0.35
0.40
M7C
3:
Ti=0%
Ti=0.74%
Ti=1.48%
Ti=3.36%
TiC:
Ti=0.74%
Ti=1.48%
Ti=3.36%
V
olu
me
Fra
cti
on
, (%
)
T, (C)
Eutectic M7C
3
Primary M7C
3
TiC
Fig. 3.12. Volume fraction of M7C3 carbide and TiC carbide of the hypereutectic HCCIs with different Ti addition
obtained by using PE model calculation for Fe-3.98mass%C-16.8 mass%Cr-1.86 mass%Mn-0.943 mass%Mo-
1.09 mass%Ni-0.970 mass% Si. "∙": transformation points of M7C3 carbide
Page 33
23
It can be seen that the precipitation temperature of primary M7C3 carbides decreases with an
increased Ti content. However, the precipitation temperature of TiC carbides increases
slightly with an increased Ti content.
0.0 0.5 1.0 1.5 2.0 2.5 3.0 3.50
5
10
15
20
25
30
35
40
(a) border size: 7.9m
Total M7
C3
PE Scheil Experiment
Total M7C
3:
Primary M7C
3:
Eutectic M7C
3:
Vo
lum
e F
rac
tio
n,
(%)
Ti, (mass%)
4.9mass%C
4.9mass%C
4.0mass%C
4.9mass%C
4.0mass%C Eutectic M7
C3
Primary M7
C3
0.0 0.5 1.0 1.5 2.0 2.5 3.0 3.50
5
10
15
20
25
30
35
40
PE Scheil Experiment
Total M7C3:
Primary M7C3:
Eutectic M7C3:
Vo
lum
e F
rac
tio
n,
(%)
Ti, (mass%)
4.9mass%C
(b) border size: 11.2m
4.9mass%C
4.0mass%C
4.9mass%C
4.0mass%C
Total M7
C3
Eutectic M7
C3
Primary M7
C3
Fig. 3.13. Thermo-Calc calculation and experimental results of total, primary and eutectic M7C3 carbides in the
hypereutectic HCCIs with different Ti additions. M7C3 carbide’s border size: (a) d=7.9 μm, (b) d=11.2 μm
Fig. 3.13 shows Thermo-Calc calculation and experiment results of total, primary and eutectic
M7C3 carbides in the hypereutectic HCCIs for different Ti additions. Here, (a) d=7.9 μm and
Page 34
24
(b) d=11.2 μm were adopted as the M7C3 carbide’s border size, d. Comparing Fig. 3.13(a)
with 3.13(b), it can be seen that experimental results with a 11.2 μm border size are closer to
the calculation results from the viewpoint of the primary M7C3 carbides volume fraction (see
○ mark). Regarding eutectic M7C3 carbides (see ∆ mark), the experiment data are 5% lower
than the calculation curve. This might be due to the difficulty of deciding the threshold from
the gray images of the optical microscope photos. Moreover, the experimental results are
close to the Partial Equilibrium (PE) prediction. The difference between the experimental
results and the calculation results is lower than 5%. This can be explained by that the carbon
back diffusion is taken into consideration in the PE calculation. Therefore, the results will be
closer to experiment results. It is also found that the C content has a large influence on the
total volume fraction of M7C3 carbides. More specifically, the total volume fraction increases
with an increased C content, as shown in Fig. 3.13.
In summary, Fig. 3.13 shows that the total volume fraction of M7C3 carbides decreases as the
Ti content increases; the volume fraction of primary M7C3 carbides decreases with an
increased Ti content. However, the volume fraction of eutectic M7C3 carbides increases with
an increased Ti content.
The contents of Fe, Cr, Ti, Mo, Mn in primary M7C3 carbides and eutectic M7C3 carbides are
plotted against the carbide sizes in Fig. 3.14 for the sand, graphite and metal molds for a
1.5mass% Ti addition. As a general characteristic, it is shown that the content of Cr and Ti
increases with an increased M7C3 carbide size, d.
Page 35
25
0 2 4 6 8 10 30 40 50 60 70 80 90 1000
1
2
3
4
30
40
50
60
70
Co
mp
os
itio
n o
f c
arb
ide
, (a
t%)
(b):
Graphite mold
d, (um)
Fe
Cr
Ti
Mo
Mn
Primary M7C
3Eutectic M7C
3
0 2 4 6 8 10 30 40 50 60 70 80 90 1000
1
2
3
4
30
40
50
60
70
Co
mp
os
itio
n o
f c
arb
ide
, (a
t%)
(c):
Sand mold
Fe
Cr
Ti
Mo
Mn
d, (um)
Primary M7C
3Eutectic M
7C
3
Fig. 3.14. Relationship between composition and size of primary M7C3 carbides and eutectic M7C3 carbides of
the hypereutectic HCCIs with 1.5mass% Ti addition under different cooling rate: (a) Metal mold, (b) Graphite
mold and Sand mold.
However, the content of Fe and Mo decreases with an increased M7C3 carbide size; Moreover,
the content of Mn does not change with an increased M7C3 carbide size for the sand, graphite
and metal molds. It is concluded that the primary M7C3 carbides are dominant at higher Cr
contents, and that the eutectic M7C3 carbides have lower Cr contents.
In summary, based on the analysis of size distribution and chemical composition, the M7C3
carbides were roughly classified into primary M7C3 carbides, which in general have size
larger than 11.2 μm. Moreover, into eutectic M7C3 carbides which in general have a size
smaller than 11.2 μm.
Page 36
26
3.6 Effect of Cooling Rate and Ti Addition on the Mechanical Properties in
As-Cast Condition of the hypereutectic HCCIs
In this chapter, the effect of cooling rate and Ti addition on the mechanical properties of the
hypereutectic HCCIs is discussed, but only for as-cast conditions.
The bulk hardness of the hypereutectic HCCIs is determined by the hardness of carbides, such
as TiC and M7C3 [21] and the matrix. The matrix of the hypereutectic HCCIs will obviously
not change by a Ti addition. This is due to that it will mainly exist as a single austenite phase
(γ-phase) together with small amounts of martensite (α-phase) under as-cast conditions.
Therefore, the bulk hardness of the hypereutectic HCCIs is mainly affected by the volume
fraction of carbides.
Fig. 3.15 shows the bulk hardness of the hypereutectic HCCIs with different Ti additions for
different cooling rates. The tendency is that the bulk hardness increases slightly with
increased titanium contents. As shown in Fig. 3.11, when Ti is added, the volume fraction of
TiC carbides increase and the volume fraction of M7C3 carbides decrease. TiC carbides might
make a bigger contribution to the bulk hardness than M7C3 carbides, because the hardness of
TiC carbides is in the range of 2000-3200HV. [4] However, the bulk hardness of the
hypereutectic HCCIs in the graphite mold shows a big scatter because the TiC carbides are
not uniformly distributed.
Fig 3.15. Mechanical properties of the hypereutectic HCCIs with different Ti additions and different cooling
rates.
Page 37
27
The wear loss of the hypereutectic HCCIs is determined by the amount of matrix and M7C3
carbides, although the hardness of TiC carbides is larger than that of the M7C3 carbides and
the matrix. However, the presence of a small amount of TiC carbides will not contribute to the
wear loss.
It can be seen that there is a tendency of an increased wear loss with an increased Ti content
in the graphite mold experiments. This is due to the decrease of the volume fraction of M7C3
carbides. It seems that the austenite phase (γ-phase) which surrounds the agglomerated TiC
might be easily peeled off during the wear process. This is leads to an increased Ti content. In
summary, the hardness and wear loss of the hypereutectic HCCIs do not change significantly
with increased Ti contents and cooling rates under as-cast conditions.
As a summary for this chapter, the mainly focus point on the carbides (M7C3 and TiC)
evolution is quantitative discussed for as-cast condition by changing the cooling rates and
titanium contents. Base on this work, the heat treatment process was performed in order to
improve the mechanical properties of the hypereutectic HCCIs.
Page 39
29
Chapter 4
Improvement of Properties by Heat Treatment
As mention in the previous chapter, the specimens, which were casted in a graphite mold with
a 1.5mass% titanium addition, were used for heat treatments. The reason for the casting
process and selected chemical composition (Table 2.1) is that: 1) primary M7C3 carbides
becomes finer because of the higher cooling rate provided by the graphite mold and the Ti
addition, which enables TiC precipitations that can act as favorable nucleation sites for the
primary M7C3 carbides, 2) and it is possible to form secondary M7C3 carbides during heat
treatment, since the total volume fraction of primary M7C3 carbides and eutectic M7C3
carbides do not reach the equilibrium fractions in the as-cast condition.
In this chapter, we will set our focus point on how carbides (M7C3 and TiC) and martensite
evolution and their influence on the mechanical properties after heat treatment.
4.1 Phase diagram
Estimation of the Fe-17mass%Cr-4mass%C multicomponent system phase diagram is done
by using the Thermo-Calc software, as shown in Fig. 4.1.
Fig. 4.1. Phase diagram for the Ti-alloyed hypereutectic HCCI with the composition Fe-(3-6)mass%.C-
17.4mass%.Cr-1.48mass%.Ti-1.91mass%.Mn-0.89mass%.Mo-1.11mass%.Ni-0.95mass%.Si
Page 40
30
It shows that the matrix phase changes from a fcc phase (an austenitic structure) into a bcc
phase (a martensitic structure) at around 800 oC. The MC type carbides (TiC carbides), M7C3
type carbides (primary, eutectic and secondary carbides) and bcc phase remained after the
final cooling. It is in agreement with the experimental observations by SEM and EBSD.
4.2 Evolution of M7C3
The carbides mainly include primary M7C3 carbides and eutectic M7C3 carbides both before
and after heat treatment, as shown in Fig. 4.2 and Fig. 4.3.
Fig.4.2. SEM observations of M7C3 and TiC after different heat treatments.
Fig. 4.3. EBSD phase colored maps using 0.1μm step size.
(Color in phase maps: Blue: M7C3; TiC: Yellow; Green: Austenite; Red: Martensite; Greyscale: band contrast)
Page 41
31
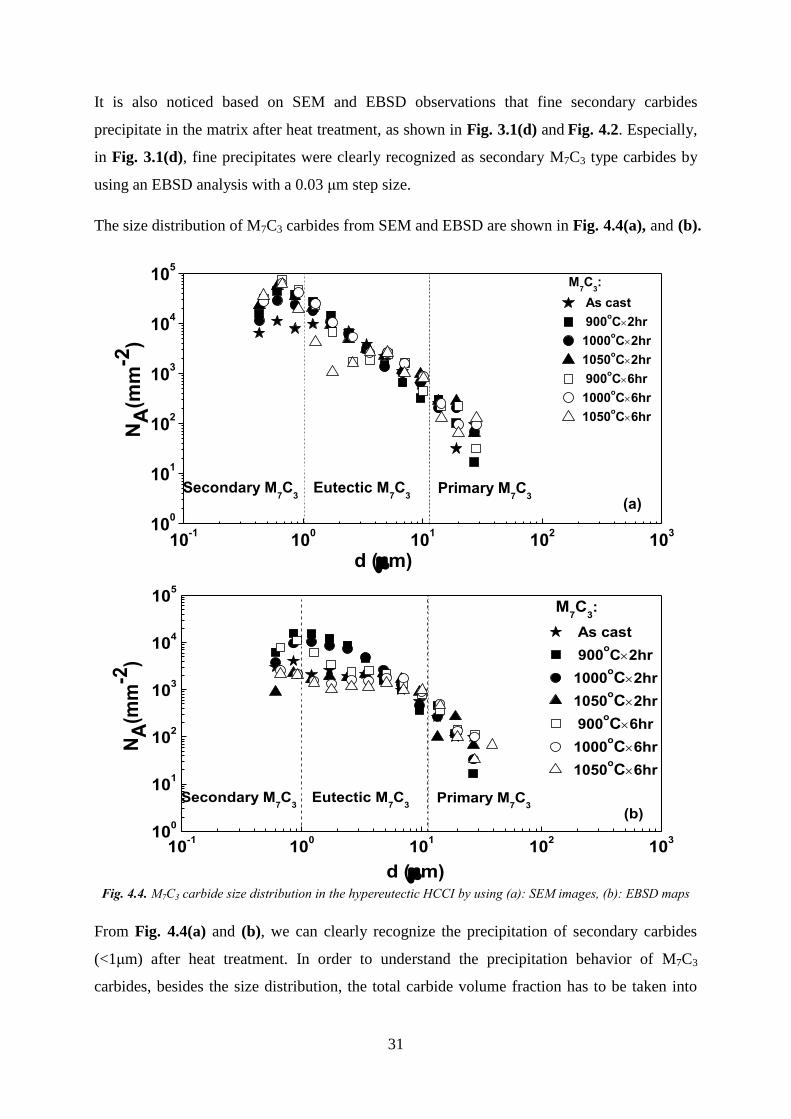
It is also noticed based on SEM and EBSD observations that fine secondary carbides
precipitate in the matrix after heat treatment, as shown in Fig. 3.1(d) and Fig. 4.2. Especially,
in Fig. 3.1(d), fine precipitates were clearly recognized as secondary M7C3 type carbides by
using an EBSD analysis with a 0.03 μm step size.
The size distribution of M7C3 carbides from SEM and EBSD are shown in Fig. 4.4(a), and (b).
10-1
100
101
102
103
100
101
102
103
104
105
M7C
3:
As cast
900oC2hr
1000oC2hr
1050oC2hr
900oC6hr
1000oC6hr
1050oC6hr
Eutectic M7C
3
NA
(mm
-2)
d (m)
Secondary M7C
3Primary M
7C
3(a)
10-1
100
101
102
103
100
101
102
103
104
105
M7C
3:
As cast
900oC2hr
1000oC2hr
1050oC2hr
900oC6hr
1000oC6hr
1050oC6hr
Eutectic M7C
3
NA
(mm
-2)
d (m)
Secondary M7C
3Primary M
7C
3
(b)
Fig. 4.4. M7C3 carbide size distribution in the hypereutectic HCCI by using (a): SEM images, (b): EBSD maps
From Fig. 4.4(a) and (b), we can clearly recognize the precipitation of secondary carbides
(<1μm) after heat treatment. In order to understand the precipitation behavior of M7C3
carbides, besides the size distribution, the total carbide volume fraction has to be taken into
Page 42
32
consideration. The total volume fraction of M7C3 carbides (primary, eutectic and secondary)
obtained from SEM images and EBSD maps using image analysis is shown in Fig. 4.5.
Fig. 4.5. Volume fraction of M7C3 and TiC carbides
From the size distribution in Fig. 4.4 and the total carbide volume fraction in Fig. 4.5, the
precipitation behavior of M7C3 carbides is summarized as follows:
(1) For lower holding temperatures and shorter holding times during the heat treatment, such
as 900oCx2hr, the number of fine secondary M7C3 carbides (less than 1 μm) and eutectic
M7C3 carbides (less than 11.2 μm) increases. On the contrary, at higher holding temperatures
and longer holding times of heat treatment, such as 1050oCx6hr, the size of coarse primary
M7C3 carbides larger than 11.2 μm increases.
(2) This behavior is due to the following reasons. The precipitation of secondary M7C3 occurs
actively at 900oC close to the eutectic temperature and finishes completely within 2hr. The
coarsening of all sizes of M7C3 carbides occur actively at higher holding temperatures and
longer holding times during heat treatment.
(3) Thus, from the viewpoint of the precipitation of M7C3 (volume fraction) and the growth
control/refinement of M7C3 (size distribution), a lower holding temperature such as 900oC is
preferred. This is regardless of the holding time during heat treatment.
Page 43
33
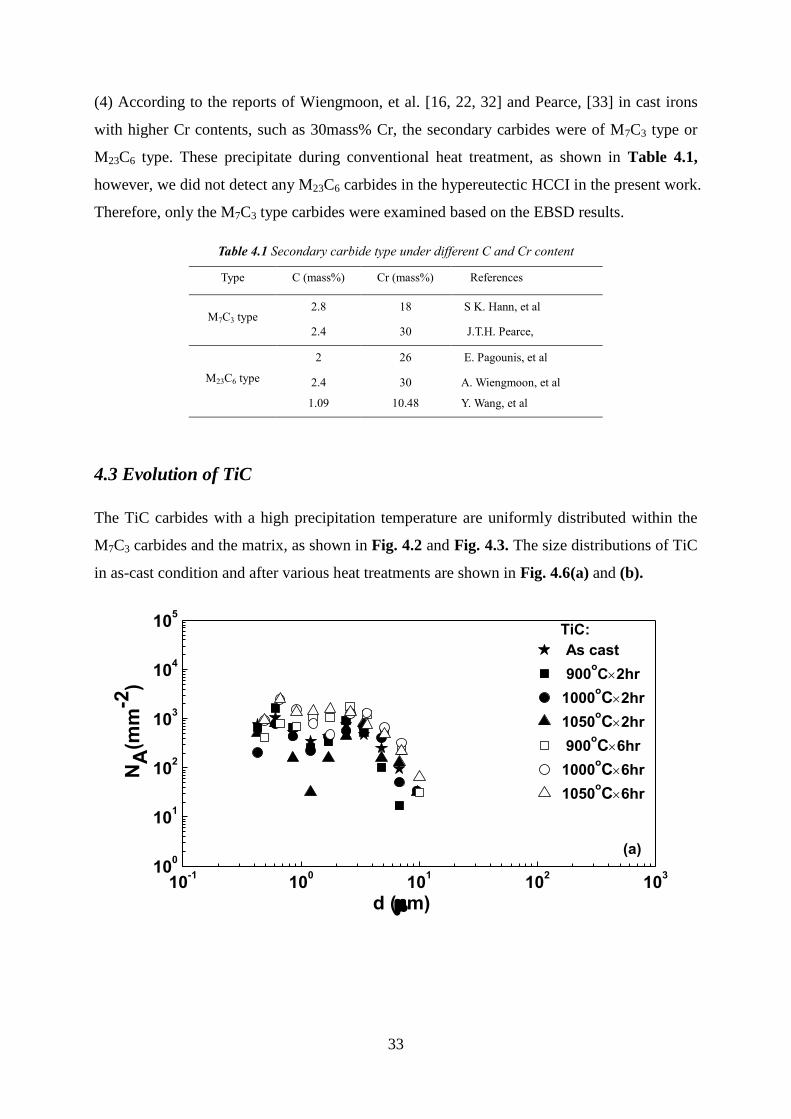
(4) According to the reports of Wiengmoon, et al. [16, 22, 32] and Pearce, [33] in cast irons
with higher Cr contents, such as 30mass% Cr, the secondary carbides were of M7C3 type or
M23C6 type. These precipitate during conventional heat treatment, as shown in Table 4.1,
however, we did not detect any M23C6 carbides in the hypereutectic HCCI in the present work.
Therefore, only the M7C3 type carbides were examined based on the EBSD results.
Table 4.1 Secondary carbide type under different C and Cr content
Type C (mass%) Cr (mass%) References
M7C3 type 2.8 18 S K. Hann, et al
2.4 30 J.T.H. Pearce,
M23C6 type
2 26 E. Pagounis, et al
2.4 30 A. Wiengmoon, et al
1.09 10.48 Y. Wang, et al
4.3 Evolution of TiC
The TiC carbides with a high precipitation temperature are uniformly distributed within the
M7C3 carbides and the matrix, as shown in Fig. 4.2 and Fig. 4.3. The size distributions of TiC
in as-cast condition and after various heat treatments are shown in Fig. 4.6(a) and (b).
10-1
100
101
102
103
100
101
102
103
104
105
TiC:
As cast
900oC2hr
1000oC2hr
1050oC2hr
900oC6hr
1000oC6hr
1050oC6hr
N
A(m
m-2
)
d (m)
(a)
Page 44
34
10-1
100
101
102
103
100
101
102
103
104
105
(b)
NA
(mm
-2)
d (m)
TiC:
As cast
900oC2hr
1000oC2hr
1050oC2hr
900oC6hr
1000oC6hr
1050oC6hr
Fig. 4.6. TiC size distribution of the hypereutectic HCCI by using (a): SEM images and (b): EBSD maps
Based on the volume fraction in Fig. 4.5 and the size distribution in Fig. 4.6, the precipitation
behavior of TiC can be summarized as follows:
(1) At longer holding times of heat treatment, such as 6hr, the number of all sizes of TiC
carbides increases.
(2) This behavior is caused due to the following reasons. The precipitation of TiC occurs
mainly in the melt and finishes completely at higher temperatures above 1100oC. Moreover,
the coarsening of all sizes of TiC particles occurs actively under longer holding times during
heat treatment.
(3) Thus, from the viewpoint of the precipitation of TiC (volume fraction, size and number),
longer holding time such as 6hr is preferred, regardless of the holding temperature level, as
the heat treatment condition.
4.4 Evolution of Matrix
The matrix of hypereutectic HCCI includes both austenite and martensite before and after heat
treatment, as shown in Fig. 4.3 and Fig. 4.7. However, the austenite is dominating in the as-
cast condition and the martensite dominates after heat treatment.
EBSD phase maps with 0.1μm and 0.03μm step sizes are shown in Fig. 4.3 and Fig. 4.7,
Page 45
35
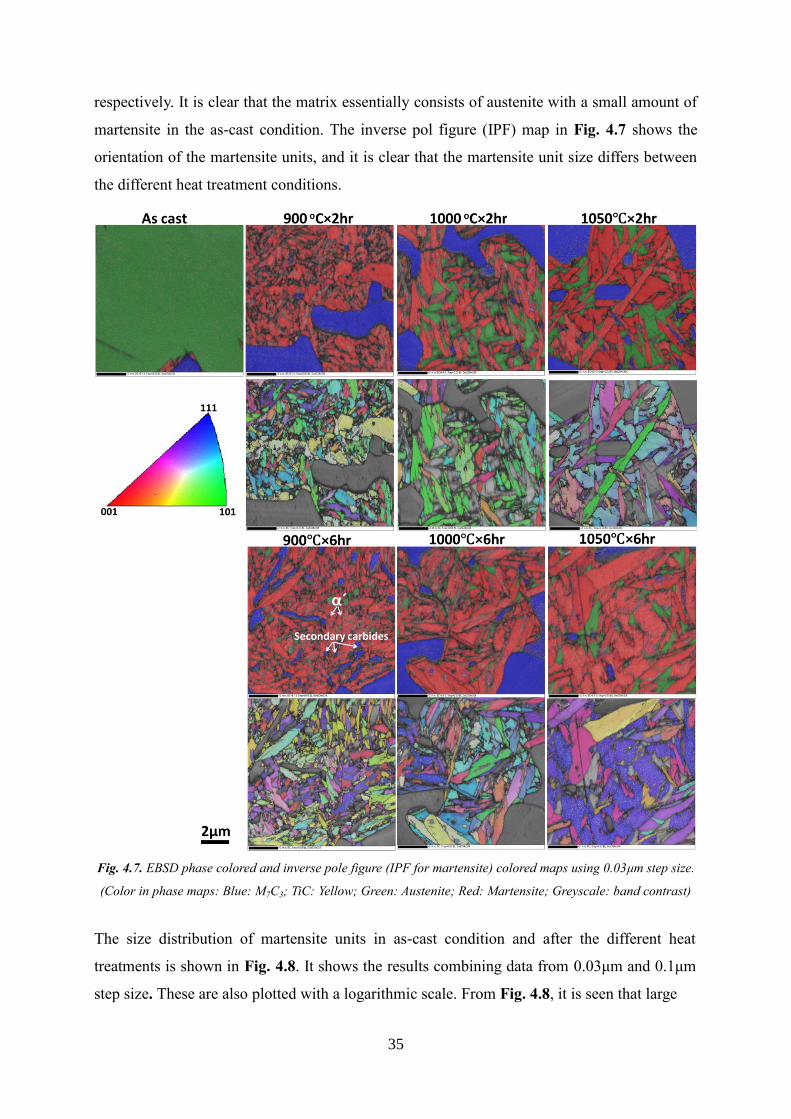
respectively. It is clear that the matrix essentially consists of austenite with a small amount of
martensite in the as-cast condition. The inverse pol figure (IPF) map in Fig. 4.7 shows the
orientation of the martensite units, and it is clear that the martensite unit size differs between
the different heat treatment conditions.
Fig. 4.7. EBSD phase colored and inverse pole figure (IPF for martensite) colored maps using 0.03μm step size.
(Color in phase maps: Blue: M7C3; TiC: Yellow; Green: Austenite; Red: Martensite; Greyscale: band contrast)
The size distribution of martensite units in as-cast condition and after the different heat
treatments is shown in Fig. 4.8. It shows the results combining data from 0.03μm and 0.1μm
step size. These are also plotted with a logarithmic scale. From Fig. 4.8, it is seen that large
Page 46
36
10-2
10-1
100
101
102
103
100
101
102
103
104
105
106
107
NA
(mm
-2)
D (m)
Martensite:
As cast
900oC2hr
1000oC2hr
1050oC2hr
900oC6hr
1000oC6hr
1050oC6hr
0.1m step0.03m step
Fig.4.8. Size distribution of martensite unit.
martensite units above 4μm is present under the conditions of high temperatures or long
holding time: 900oC×6hr, 1000
oC×6hr and 1050
oC×6hr.
0 2 4 6 80
10
20
30
40
50
60
70
Minimum
Martensite
0.1m step:
As cast
900oC
1000oC
1050oC
Maximum
Vo
lum
e F
racti
on
, (%
)
Time, (hr)
0.03m step:
As cast
900oC
1000oC
1050oC
Fig. 4.9. Volume fraction of martensite
Compared to the higher temperatures, the size of the martensite unit decreased at lower heat
treatment temperatures. The volume fraction of martensite is shown in Fig. 4.9.
The EBSD maps, which were used for calculating the volume fraction of martensite includes
the non-indexed regions. The volume fraction of martensite calculated by using the 0.1 μm
and the 0.03 μm step size EBSD maps give quite different results, as shown in Fig. 4.9. Thus,
from the viewpoint of size distribution and volume fraction of martensite, the formation
Page 47
37
behavior of martensite is summarized as follows:
(1) At longer holding times during heat treatment, such as 6hr, the volume fraction of
martensite increases.
(2) At long holding times, such as 6hr, a lower holding temperature results in a more refined
martensite.
(3) Thus, from the viewpoint of the transformation promotion of martensite (volume fraction)
and the refinement of martensite unit (size distribution), longer holding time such as 6hr and
lower holding temperatures such as 900oC is recommended.
4.5 Mechanical properties
Previous studies on the effect of a matrix structure on the wear resistance suggest that a
martensitic matrix offers a better wear resistance than an austenitic matrix. [33, 34] It is also
reported [1,2] that two competing effects will influence the final properties. These effects are
(a) a high carbon martensite phase, which forms at higher temperatures tends to increase the
hardness, and (b) the increasing retained austenite content at higher temperatures, tends to
reduce the hardness.
Fig. 4.10 gives the correlation between hardness and wear resistance in as-cast condition and
after heat treatment. It is seen that both the hardness and the wear resistance is improved
markedly after heat treatment. In addition, the wear resistance increases with an increased
holding time from 2hr to 6hr. However, both the hardness and wear resistance decrease with
an increased holding temperature from 900°C to 1050°C.
48 50 52 54 56 58 60 62 64 660.30
0.32
0.34
0.36
0.38
0.40
0.42
0.44
0.46
0.48
0.50
0.52
As cast
900C,1000C,10502hr
900C,1000C,10506hr
Wear
loss (
g/m
in)
Hardness (HRC)
900C6hr
1000C6hr
1050C6hr 900C2hr
1050C2hr
1000C2hr
As cast
Fig. 4.10. Mechanical properties of the hypereutectic HCCI.
Page 48
38
In the as-cast condition, the matrix almost consists solely of austenite. Clearly the hardness of
austenite is lower than that of martensite.
By considering the results of volume fraction and size distribution of M7C3, TiC and
martensite units in sections 4.2, 4.3, 4.4, on the observed properties in Fig. 4.10, the
mechanism of improved mechanical properties was deduced as follows:
Longer holding time leads to the growth promotion of TiC (volume fractions), and the
transformation promotion of martensite (volume fraction) as well as the refinement of
martensite units (size distribution). However, it also leads to a coarsening of M7C3.
Consequently, longer holding times will increase the wear resistance, due to the altered matrix
toughness and the decreased hardness, which is due to the coarsening of M7C3.
A lower holding temperature leads to precipitation promotion of M7C3 (volume fraction) and
the growth control/ refinement of martensite unit (size distribution). Consequently, lower
holding temperatures will generate increased wear resistance and hardness due to the fine
dispersion of M7C3.
Finally, a lower holding temperature close to eutectic temperature and a longer holding time is
the most suitable heat treatment conditions for Ti- added hypereutectic HCCI.
As a summary, the relationship between carbide precipitation, martensite units and
mechanical properties are discussed base on the volume fraction and the size distribution of
carbide precipitates (M7C3 and TiC) as well as martensite units. Possible mechanism is
proposed to explain the improvement of mechanical properties through the heat treatment
process. And the best heat treatment strategy is found.
Page 49
39
Chapter 5
Conclusions
This thesis focus on refining the microstructure and improving the properties of Ti-added
hypereutectic high chromium cast iron. The size distribution, composition and morphology of
carbides and martensite units in the Ti-added hypereutectic HCCI with main composition of
Fe-17mass%Cr-4mass%C are quantitatively studied. The most important conclusions reached
in this study can be summarized as follows:
General conclusions of supplement 1:
1) M7C3 carbides were classified into “primary M7C3 carbides” and “eutectic M7C3
carbides” with a 11.2μm border size;
2) The maximum size of the primary M7C3 carbides decreased to 53.9 μm and the
number of eutectic M7C3 carbides increased to 4.80×103 mm
-2 when the cooling rate
was 110 oC/min;
3) Meanwhile, the maximum size of the primary M7C3 carbides decreased from151.9 to
27.0 μm and the total volume fraction of M7C3 carbides decreased with an increased
Ti content. Moreover, The size and number of TiC carbides both increase with an
increased Ti addition;
4) TiC carbides with high formation temperatures can not only act as nuclei of M7C3
carbides, but they also contain a core, Ti(C, N). It was also found that TiC carbides
precipitation was not obviously affected by the cooling rate;
5) The properties (hardness and wear loss) of the hypereutectic HCCIs do not change
significantly with increased Ti contents and cooling rates under as-cast conditions.
General conclusions of supplement 2:
1) From the viewpoint of the precipitation promotion of M7C3 (volume fraction) and the
growth control/ refinement of M7C3, the growth promotion of TiC (volume fractions)
and the transformation promotion of martensite (volume fraction) and the refinement
of martensite unit (size distribution), the best heat treatment process is 900oC×6hr;
2) Moreover, both wear resistance and hardness were improved in case of lower holding
temperatures and longer holding time M7C3 carbides.
Page 51
41
Suggestions for Future Work
In this thesis, we select Ti as a carbide promoter to refine the microstructure of Hypereutectic
HCCI. Actually, other strong carbides forming elements, such as Zr, Hf, V, Nb and B can also
be used to refine the microstructure of Hypereutectic HCCI. Moreover, the complex addition
of those elements in Hypereutectic HCCI may also improve the microstructure.
In order to control and understand the carbide precipitation behavior of Hypereutectic HCCI
in as cast condition deeply, the accurate transformation temperature from a liquid phase to a
solid phase should be clear. In this case, differential scanning calorimetry (DSC) thermal-
analysis method can be applied to predict the accurate transformation temperature.
Although the volume fraction of the secondary carbides is low (~5%), the precipitation
behavior of Hypereutectic HCCI during the heat treatment should be discussed deeply. It will
help us to understand the mechanism of improvement of mechanical properties after heat
treatment.
Statistical analysis of carbides is also very important to understand the characteristic of
carbides. We can analysis the maximum size of carbides by using extreme value of statistics
and estimate the 3D carbides size distribution base on 2D carbides size distribution by using
Schwartz-Saltykov (ss) method. Furthermore, the electric extraction experiment for
Hypereutectic HCCI can be used to separate carbides from the matrix. Thus, it will be
possible to get more clearly three-dimensional experimental results on the carbides size
distribution. These results may thereafter be used to verify the calculation.
Page 53
43
References
[1] F. Maratray, A. Poulation: Trans. AFS, 90(1982) 795.
[2] F. Maratray: Trans. AFS, 79(1971) 121.
[3] J.T.H. Pearce: Journal of Materials Science Letters, 2(1983), 428.’
[4] Ö.N.Dogan, J.A.Hawk and J.H. Tylczak: Wear, 250(2001), 462
[5] Hirofumi MIYAHARA, Sergio Villanueva BRAVO, Kaoru YAMAMOTO and
Keisaku OGI: ISIJ International, 49(2009), 1075.
[6] H. G. Fu, X. J. Wu, X. Y. Li, J. D. Xing, Y. P. Lei and X. H. Zhi: Journal of Materials
Engineering and Performance, 18(2009), 1109.
[7] X. J. Wu, J. D. Xing, H. G. Fu and X. H. Zhi: Materials Science and Engineering A,
457(2007), 180.
[8] X. H. Zhi, J. D. Xing, H. G. Fu and Y. M. Gao: Materials Characterization, 59(2008),
1221.
[9] R.J.Chung, X. Tang, D.Y. Li, B. Hinckley and K. Dolman: Wear, 267(2009), 356.
[10] M.M. Arikan, H. Çimenoglu and E.S. Kayali: Wear, 247(2001), 231.
[11] A. Bedolla-Jacuinde, R. Correa, J.G. Quezada and C. Maldonado: Materials Science
and Engineering A, 398(2005), 297.
[12] A. Bedolla-Jacuinde, R. Correa, I. Mejıa, J.G. Quezada and W.M. Rainforth: Wear,
263(2007), 808.
[13] A. Bedolla-Jacuinde, S. Aguilar and C. Maldonado: Journal of Materials Engineering
and Performance, 14(2005), 301.
[14] S K. Hann, J.D. Gates and J.V. Bee: Journal of Materials Science, 32(1997), 3443.
[15] E. Pagounis, M. Talvitie and V.K. Lindroos: Metallurgical and Materials
Transactions A, 27A(1996), 4171.
[16] A. Wiengmoon, T. Chairuangsri, A. Brown, R. Brydson, D.V. Edmonds and J.T.H.
Pearce: Acta Materialia, 53(2005), 4143.
[17] Y. Wang, M.Y. Li, B. Han, T. Han and Y.Y. Cheng: J. Mater. Sci., 45(2010), 3442.
[18] J. Wang, C. Li, H. H Liu, H.S. Yang, B. L. Shen, S. J. Gao and S. J. Huang:
Materials Characterization, 56(2006), 73.
[19] Z. P. Sun, R. Zuo, C. Li, B. L. Shen, J. Yan and S. J. Huang: Materials
Characterization, 53(2004), 403.
[20] G. L. F. Powell: Journal of Materials Science, 31(1996), 707.
Page 54
44
[21] X. Zhi, J. Xing and Y. Gao: Materials Science and Engineering A, 487(2008), 171.
[22] A. Wiengmoon, T. Chairuangsri and J.T.H. Pearce: ISIJ International, 44(2004), 396.
[23] A.Wiengmoon, T. Chairuangsri and N. Chomsang: J. Mater. Sci. Technol., 24(2008),
330.
[24] A. Wiengmoon and T. Chairuangsri: Materials Science and Engineering A,
480(2008), 333.
[25] J. A. SMALL and J. R. MICHAEL: Journal of Microscopy, 201(2001), 59.
[26] M. Godec, B.Š. Batič, D. Mandrino, A. Nagode, V. Leskovšek, S.D. Škapin and M.
Jenko: Materials Characterization, 61(2010 ), 452.
[27] F.J. Humphreys: Journal of Materials Science, 36(2001), 3833.
[28] Chen, Q.; Sundman, B.: Computation of Partial Equilibrium Solidification with
Complete Interstitial and Negligible Substitutional Solute Back Diffusion; Mater.
Trans., JIM, 2002, No. 3, P. 551
[29] Zhang, H.W.; Gandin, Ch. -A.; He, J.C. and Nakajima, K.: Prediction of
solidification path and carbide precipitation in Fe-C-V-Cr-Mo-W high speed steels,
MCWASP XIII 2012.
[30] Sundman, B. and Chen, Q.: Thermodynamic Calculation Interface TQ-Interface V7.0,
2008, Thermo-Calc software AB (Stockholm, SE)
[31] Shi, P.: TCS steels/Fe-alloys database V6.0, 2008, Thermo-Calc Software AB
(Stockholm, SE)
[32] J.T.H. Pearce, T. Chairuangsri, A. Wiengmoon, N. Poolthong and H. Nomura: China
Foundry, 4(2007), 38.
[33] I.R. Sare and B.K. Arnold: Met. Mater. Trans. A, 26A(1995), 357.
[34] A. Bedolla-Jacuinde, R. Correa, I. Mejia, J.G. Quezada and W.M. Rainforth: Wear,
263(2007), 808.