Abstract: We report controlled manipulation of mode splitting in anoptical microresonator coupled to two nanoprobes. It is demonstrated that,by controlling the positions of the nanoprobes, the split modes can be tunedsimultaneously or individually and experience crossing or anti-crossingin frequency and linewidth. A tunable transition between standing wavemode and travelling wave mode is also observed. Underlying physics isdiscussed by developing a two-scatterer model which can be extended tomultiple scatterers. Observed rich dynamics and tunability of split modesin a single microresonator will find immediate applications in opticalsensing, opto-mechanics, filters and will provide a platform to study stronglight-matter interactions in two-mode cavities.
References and links1. K. J. Vahala, “Optical microcavities,” Nature 424, 839–846 (2003).2. F. Vollmer and S. Arnold, “Whispering-gallery-mode biosensing: label-free detection down to single molecules,”
Nat. Methods 5, 591–596 (2008).3. F. Vollmer, S. Arnold, and D. Keng, “Single virus detection from the reactive shift of a whispering-gallery mode,”
Proc. Natl. Acad. Sci. U.S.A. 105, 20701–20704 (2008).4. J. Zhu, S. K. Ozdemir, Y.-F. Xiao, L. Li, L. He, D.-R. Chen, and L. Yang, “On-chip single nanoparticle detection
and sizing by mode splitting in an ultrahigh-Q microresonator,” Nat. Photonics 4, 46 (2009).5. T. J. Kippenberg, H. Rokhsari, T. Carmon, A. Scherer, and K. J. Vahala, “Analysis of Radiation-Pressure Induced
Mechanical Oscillation of an Optical Microcavity,” Phys. Rev. Lett. 95, 033901 (2005).6. T. J. Kippenberg and K. J. Vahala, “Cavity Opto-Mechanics,” Opt. Express 15, 17172–17205 (2007).7. S.-B. Lee, J. Yang, S. Moon, S.-Y. Lee, J.-B. Shim, S. W. Kim, J.-H. Lee, and K. An, “Observation of an Excep-
tional Point in a Chaotic Optical Microcavity,” Phys. Rev. Lett. 103, 134101 (2009).8. T. Carmon, H. G. L. Schwefel, L. Yang, M. Oxborrow, A. D. Stone, and K. J. Vahala, “Static Envelope Patterns
in Composite Resonances Generated by Level Crossing in Optical Toroidal Microcavities,” Phys. Rev. Lett. 100,103905 (2008).
9. D. S. Weiss, V. Sandoghdar, J. Hare, V. Lefvre-Seguin, J.-M. Raimond, and S. Haroche, “Splitting of high-Q Miemodes induced by light backscattering in silica microspheres,” Opt. Express 20, 1835–1837 (1995).
10. T. J. Kippenberg, S. M. Spillane, and K. J. Vahala, “Modal coupling in traveling-wave resonators,” Opt. Lett. 27,1669 (2002).
11. A. Mazzei, S. Gotzinger, L. de S. Menezes, G. Zumofen, O. Benson, and V. Sandoghdar, “Controlled Couplingof Counterpropagating Whispering-Gallery Modes by a Single Rayleigh Scatterer: A Classical Problem in aQuantum Optical Light,” Phys. Rev. Lett. 99, 173603 (2007).
12. L. Deych and J. Rubin, “Rayleigh scattering of whispering gallery modes of microspheres due to a single dipolescatterer,” Phys. Rev. A 80, 061805 (2009).
#131982 - $15.00 USD Received 20 Jul 2010; revised 22 Sep 2010; accepted 16 Oct 2010; published 26 Oct 2010(C) 2010 OSA 8 November 2010 / Vol. 18, No. 23 / OPTICS EXPRESS 23535
13. L. Chantada, N. I. Nikolaev, A. L. Ivanov, P. Borri, and W. Langbein, “Optical resonances in microcylinders:response to perturbations for biosensing,” J. Opt. Soc. Am. B 25, 1312 (2008).
14. R. G. Knollenberg, “The measurement of latex particle sizes using scattering ratios in the rayleigh scattering sizerange,” J. Aerosol Sci. 20, 331-345 (1989).
1. Introduction
Whispering-gallery-mode (WGM) optical microresonators with ultra-high quality factors andmicroscale mode volumes are of interest for a variety of scientific disciplines ranging from fun-damental science to engineering physics. Significantly enhanced light-matter interactions [1]make WGM resonators remarkably sensitive transducers for detecting perturbations in andaround the resonator, e.g., virus/nanoparticle detection at single particle resolution [2–4] andultrasensitive detection of micromechnical displacement [5]. Moreover, the coupling of opti-cal and mechanical modes mediated by enhanced radiation pressure within the microresonatorprovides a superb platform to study parametric oscillation instabilities and radiation pressureinduced cooling of mechanical modes [6]. In addition, WGM microresonators with asymmetry(e.g., induced by structural deformations etc.) have been useful for investigating the correspon-dence between quasieigenstates and associated classical dynamics in mesoscopic systems [7].Level crossing have been demonstrated in microtoroids by tuning the microtoroid aspect ra-tio [8].
One interesting phenomenon associated with enhanced light-matter interactions is the split-ting of the initially degenerate cavity modes in the strong coupling regime [9–12]. Mode split-ting manifests itself as a doublet (two resonances) in the transmission spectrum of the resonator.Here we show, for the first time, that by tuning the coupling strength using nanoprobes or sub-wavelength scatterers, the split modes can be manipulated individually or together forming atunable two-mode microcavity. We demonstrate that the modes can be tuned to cross or anti-cross in frequency and linewidth. Particularly interesting experimental observation is the tun-able transition between standing wave mode (SWM) to travelling wave mode (TWM) and viceversa. In order to explain the observed rich dynamics, we develop a model which takes intoaccount the interactions between WGMs and finite number of sub-wavelength scatterers. Re-sults of the numerical simulations based on this model explains and confirms the experimentalobservations as well as suggests a rather surprising dynamics, i.e., the two split modes can bemade to cross each other twice in linewidth with frequencies undergoing anticrossing in one ofthe linewidth crossing region. All the observed phenomena imply there are exceptional pointsin this cavity-scatterers system.
2. Experiments, theoretical model and discussions
Figure 1 depicts the schematics of our experimental scheme which is composed of a WGM sil-ica microtoroid resonator coupled to two nanoprobes prepared by heat-and-pull of optical fiberson a hydrogen flame followed by buffered HF etching. To couple light in and out of the res-onator, a fiber taper is used. Positions of the nanoprobes and the fiber taper are finely controlledby 3D translational stages. We place the first nanoprobe in the resonator mode volume and fixits position when mode splitting is observed. We denote individual resonances of the doublet asω−(lower frequency) and ω+(higher frequency) modes with corresponding linewidths γ− andγ+ (γ− > γ+), respectively. Then the second probe is introduced. This probe bends down andslides along the surface vertically as it contacts the rim of the microtoroid. Due to cone-likeshape of the tip, vertical movement gradually increases its diameter allowing to simulate a scat-terer of increasing size within mode volume without changing lateral position. This does notcause any significant damage to the microtoroid as witnessed by no observable change in thevalue of Q factor. As the size increases, the nanoprobe starts disturbing the already established
#131982 - $15.00 USD Received 20 Jul 2010; revised 22 Sep 2010; accepted 16 Oct 2010; published 26 Oct 2010(C) 2010 OSA 8 November 2010 / Vol. 18, No. 23 / OPTICS EXPRESS 23536
SWMs. The evolution of SWMs and the amount of disturbance applied to ω∓ and γ∓ dependon the size and location of the second probe relative to the first.
Fig. 1. (a) Schematics of the experiment showing a fiber taper coupled to a microtoroid, andtwo nano-fiber tips introduced into the mode volume. Transmission spectra are captured bya photo detector (PD). (b) SEM image of a microtoroid. (c) SEM image of a fiber tip. Insetshows the enlarged image of the tip. (d) Cross-section of a microtoroid ring showing theposition of a fiber tip in the field of a WGM.
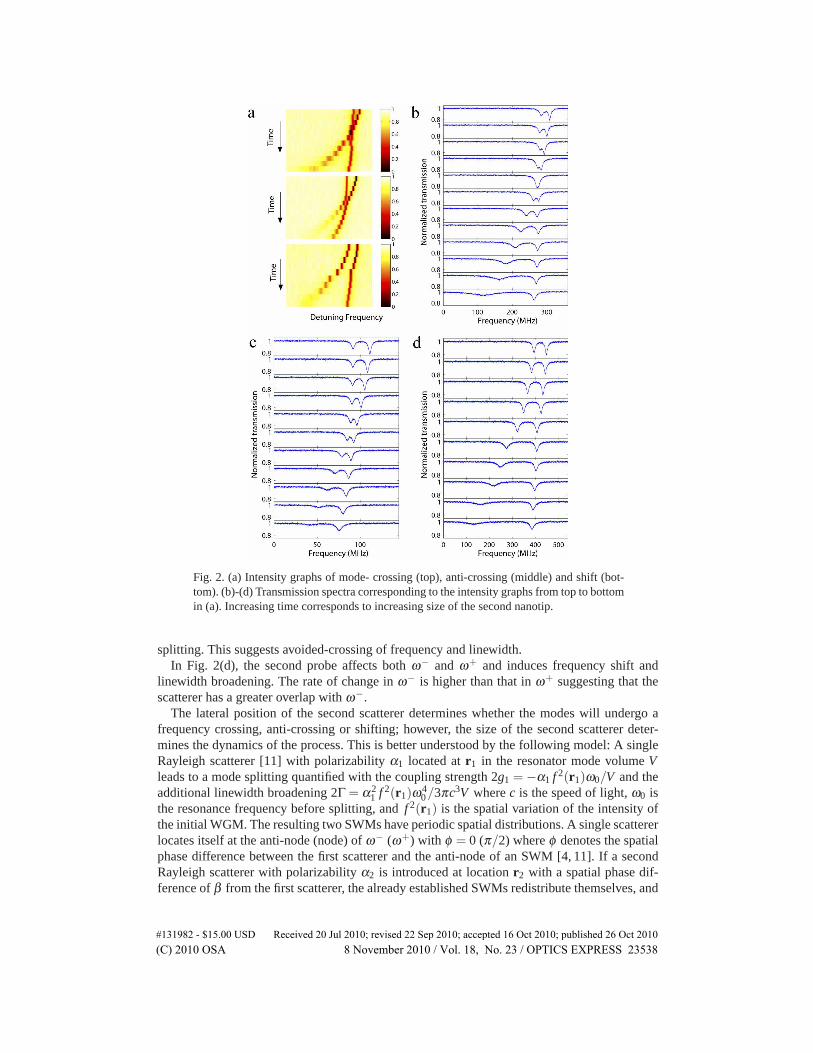
Figure 2 shows intensity graphs and transmission spectra recorded while the size of thesecond probe is increased. The second probe is used to tune the splitting between the modesand their linewidths. Crossing [Fig. 2(b)], anti-crossing [Fig. 2(c)] and shifting [Fig. 2(d)] oflinewidths and resonance frequencies at different lateral positions of the second probe are ob-served.
In Fig. 2(b), the initial ω+ mode experiences red shift and linewidth broadening with in-creasing size of the second probe, while the ω− mode is not perturbed much. At a specific sizeboth modes coincide, i.e., ω− = ω+ and γ− = γ+. Thus, a single resonance is seen in transmis-sion spectrum. With further increase of the second scatterer’s size, the modes become separatedwith ω− mode now having a larger linewidth than ω+ whose linewidth equals to the initial γ−.This suggests that both frequency and linewidth crossings have occurred. At the crossing point,back-scattering into the resonator vanishes as the back-scattered fields from the two scatterershave the same strength but π-phase shift. Thus the vanishing of backward reflection coupledto the taper suggests a transition from SWM to TWM. The conditions for these to take placewill become clear in the discussion of the theoretical model below. This observation impliesthat SWM, which limits nonclassical features of coherent matter-cavity field interaction due tothe position dependence of the coupling strength, can be eliminated using external tuning withnanoprobes. This is particularly crucial in ultra-high-Q microresonators because SWMs areusually formed due to mode splitting caused by structural defects and material inhomogenety.
In Fig. 2(c), the second probe first disturbs ω+ mode with no significant disturbance toω−. Thus ω+ experiences linewidth broadening and red shift gradually approaching to ω−. Ata specific scatterer size, the frequency difference between the modes reduces from its initialvalue of 19.6 MHz to 7 MHz, and the linewidths become very close to each other. At this point,modes are strongly coupled to the scatterer and to each other. With further increase in size, ω−strongly couples to the scatterer, and the modes start to repel each other leading to increased
#131982 - $15.00 USD Received 20 Jul 2010; revised 22 Sep 2010; accepted 16 Oct 2010; published 26 Oct 2010(C) 2010 OSA 8 November 2010 / Vol. 18, No. 23 / OPTICS EXPRESS 23537
Fig. 2. (a) Intensity graphs of mode- crossing (top), anti-crossing (middle) and shift (bot-tom). (b)-(d) Transmission spectra corresponding to the intensity graphs from top to bottomin (a). Increasing time corresponds to increasing size of the second nanotip.
splitting. This suggests avoided-crossing of frequency and linewidth.In Fig. 2(d), the second probe affects both ω− and ω+ and induces frequency shift and
linewidth broadening. The rate of change in ω− is higher than that in ω+ suggesting that thescatterer has a greater overlap with ω−.
The lateral position of the second scatterer determines whether the modes will undergo afrequency crossing, anti-crossing or shifting; however, the size of the second scatterer deter-mines the dynamics of the process. This is better understood by the following model: A singleRayleigh scatterer [11] with polarizability α1 located at r1 in the resonator mode volume Vleads to a mode splitting quantified with the coupling strength 2g1 =−α1 f 2(r1)ω0/V and theadditional linewidth broadening 2Γ = α2
1 f 2(r1)ω40/3πc3V where c is the speed of light, ω0 is
the resonance frequency before splitting, and f 2(r1) is the spatial variation of the intensity ofthe initial WGM. The resulting two SWMs have periodic spatial distributions. A single scattererlocates itself at the anti-node (node) of ω− (ω+) with φ = 0 (π/2) where φ denotes the spatialphase difference between the first scatterer and the anti-node of an SWM [4, 11]. If a secondRayleigh scatterer with polarizability α2 is introduced at location r2 with a spatial phase dif-ference of β from the first scatterer, the already established SWMs redistribute themselves, and
#131982 - $15.00 USD Received 20 Jul 2010; revised 22 Sep 2010; accepted 16 Oct 2010; published 26 Oct 2010(C) 2010 OSA 8 November 2010 / Vol. 18, No. 23 / OPTICS EXPRESS 23538
the amount of disturbance experienced by split modes depends on their overlap with the twoscatterers [Fig. 3(a)]. Subsequently, the frequency shift (Δω− = ω− −ω0) and the linewidthbroadening (Δγ− = γ− − γ0) of ω− with respect to the pre-scatterer resonance frequency ω0
and linewidth γ0 become
Δω− = 2g1 cos2(φ)+2g2 cos2(φ −β ) (1)
Δγ− = 2Γ1 cos2(φ)+2Γ2 cos2(φ −β ) (2)
where subscripts (1,2) represents the first and second scatterers. The cos2(·) terms scale the
ff
b
0 0.1 0.2 0.3 0.4 0.50
0.1
0.2
0.3
0.4
0.5
β (π)
φ(π)
a
b
Fig. 3. (a) Field distribution of a standing wave mode (SWM) obtained from finite-elementsimulation and the definitions of φ and β . Black circles represent the position of two scatter-ers in the mode. (b) The relation between φ and β . Solid curve is calculated from Eq. (3) and∗ represent the values calculated using finite-element simulations for χ = 0.5 and ξ = 1.
interaction strength depending on the position of the scatterer on SWMs [13]. Similar expres-sions for Δω+ and Δγ+ are obtained by replacing cos(·) with sin(·). Although we focus ontwo-scatterer case in this letter, this model can be extended to arbitrary number N of scatter-ers by adding in Eqs. (1) and (2) the terms 2gi cos2(φ −βi) and 2Γi cos2(φ −βi), respectively,for each of the 3 ≤ i ≤ N scatterer. With the positions of the two scatterers fixed, the estab-lished orthonormal SWMs are distributed in such a way that the coupling rate between the twocounter-propagating modes is maximized, in other words, the frequency splitting is maximized.It leads to:
tan(2φ) =g2 sin(2β )
g1 +g2 cos(2β )=
sin(2β )χξ 2 + cos(2β )
(3)
#131982 - $15.00 USD Received 20 Jul 2010; revised 22 Sep 2010; accepted 16 Oct 2010; published 26 Oct 2010(C) 2010 OSA 8 November 2010 / Vol. 18, No. 23 / OPTICS EXPRESS 23539
where ξ = f (r1)/ f (r2) and χ = α1/α2 are positive real numbers. The two solutions of φ haveπ/2 phase difference and correspond to the two orthogonal SWMs. Verification of Eq. (3) isdone by extensive finite-element simulations, and one example is presented in Fig. 3(b), wherefinite-element simulation results match very well with the calculated values from Eq. (3).
Defining δ = Δω+−Δω− = ω+−ω− and ρ = Δγ−−Δγ+ as the frequency and linewidthdifferences of the resonance modes ω− and ω+, we find
δ =2|g1|χξ 2 [χ2ξ 4 +2χξ 2 cos(2β )+1]
12 (4)
and
ρ =4Γ1|g1|δ χ3ξ 4 [χ
3ξ 4 + χ(1+χ)ξ 2 cos(2β )+1] (5)
from which frequency and linewidth crossings of the resonance modes can be calculated bysetting δ = 0 and ρ = 0, respectively.
Detuning Frequency
Tip
Size
Incr
ease
s
0
0.2
0.4
0.6
0.8
1a b
c dDetuning Frequency
Tip
Size
Incr
ease
s
0
0.2
0.4
0.6
0.8
1
Detuning Frequency
Tip
Size
Incr
ease
s
0
0.2
0.4
0.6
0.8
1
−610 −590 −570 −55036
40
44
48
52
Δω (MHz)
Δλ (M
Hz)
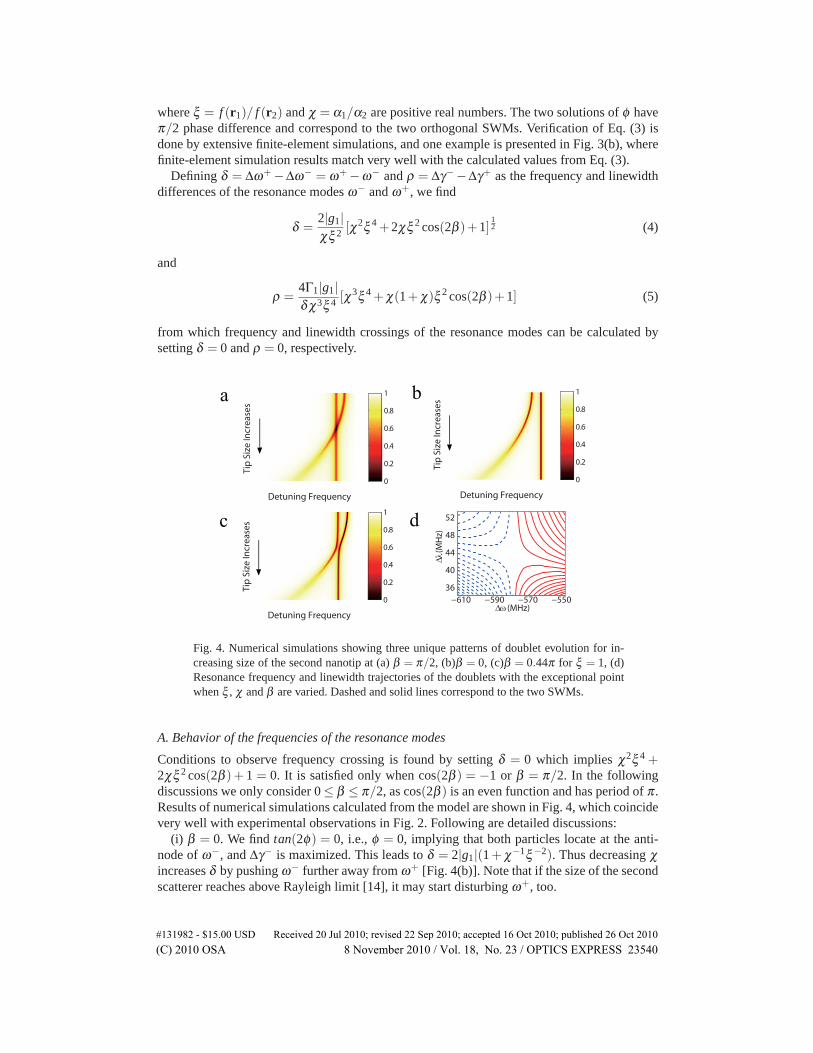
Fig. 4. Numerical simulations showing three unique patterns of doublet evolution for in-creasing size of the second nanotip at (a) β = π/2, (b)β = 0, (c)β = 0.44π for ξ = 1, (d)Resonance frequency and linewidth trajectories of the doublets with the exceptional pointwhen ξ , χ and β are varied. Dashed and solid lines correspond to the two SWMs.
A. Behavior of the frequencies of the resonance modes
Conditions to observe frequency crossing is found by setting δ = 0 which implies χ2ξ 4 +2χξ 2 cos(2β )+ 1 = 0. It is satisfied only when cos(2β ) = −1 or β = π/2. In the followingdiscussions we only consider 0 ≤ β ≤ π/2, as cos(2β ) is an even function and has period of π .Results of numerical simulations calculated from the model are shown in Fig. 4, which coincidevery well with experimental observations in Fig. 2. Following are detailed discussions:
(i) β = 0. We find tan(2φ) = 0, i.e., φ = 0, implying that both particles locate at the anti-node of ω−, and Δγ− is maximized. This leads to δ = 2|g1|(1+ χ−1ξ−2). Thus decreasing χincreases δ by pushing ω− further away from ω+ [Fig. 4(b)]. Note that if the size of the secondscatterer reaches above Rayleigh limit [14], it may start disturbing ω+, too.
#131982 - $15.00 USD Received 20 Jul 2010; revised 22 Sep 2010; accepted 16 Oct 2010; published 26 Oct 2010(C) 2010 OSA 8 November 2010 / Vol. 18, No. 23 / OPTICS EXPRESS 23540
(ii) β = π/2. The second particle stays at the anti-node of ω+, thus increasing its size sig-nificantly affects the frequency and the linewidth of ω+ while its effect on ω− is minimal.Then we find δ = 2|g1|(1− χ−1ξ−2). This implies only one frequency crossing which occursat χ = ξ−2, i.e., g1 = g2. For ξ = 1, frequency crossing occurs at χ = 1 [Figs. 4(a)].
(iii) 0 < β ≤ π/4. We have 0 ≤ cos2β < 1 (i.e., cosine is positive in the first quadrantof the unit circle) which implies that for a fixed β in this interval, δ is always greater thanzero (δ > 0) and it increases with decreasing χ , that is with increasing α2. Physically, this isunderstood as follows. The second scatterer affects both SWMs with strengths depending onits overlap with each mode. In this interval of β , the overlap of the second scatterer with ω−mode is always larger than that with ω+. Consequently, as α2 increases, ω− mode is furtherred-shifted increasing δ .
(iv) π/4< β < π/2. We have −1≤ cos2β < 0 (i.e., cosine is negative in the second quadrantof the unit circle) implying that for a fixed β in this interval, δ is always greater than zero(δ > 0); however, contrary to the case (iii) δ has a minimum at χξ 2 = 1/|cos(2β )| > 1 withδmin = 2|g1|(1−χ−2ξ−4)1/2 > 0. The physical process is explained as follows. In this case, too,the second scatterer affects both SWMs with strengths depending on its overlap with each mode.When the size of the second scatterer is small, ω+ feels it strongly and undergoes frequencyshift coming closer to ω− as χ decreases. This changes φ and increases the overlap of thesecond scatterer with ω− leading to their stronger interaction which consequently, red-shiftsω− and helps avoid crossing ω+ [Fig. 3(c)]. With a sufficiently large α2, φ > π/4 will beachieved which means ω− will have larger overlap with the second scatterer than the first one.
B. Behavior of the linewidths of the resonance modes
Setting ρ = 0 in Eq. (5), we find the condition for linewidth crossing as 1+ ξ 4χ3 + χ(1+χ)ξ 2 cos(2β ) = 0 which can be satisfied only when cos(2β ) < 0 or π/4 < β ≤ π/2, becauseboth ξ and χ are positive real numbers.
(i) β = π/2. We have φ = 0 and the two scatterers locate themselves at the anti-nodes of theeach SWMs, i.e., 1st scatterer at ω− and 2nd scatterer at ω+. Thus scatterers independentlyaffect the two SWMs. We find that a linewidth crossing takes place at χ2ξ 2 = 1, which meansΓ1 = Γ2. In this case if we also have χ = ξ = 1, which gives g1 = g2 and Γ1 = Γ2 implying thetwo SWMs have identical frequency and linewidth, but have orthogonal spatial distributions.The two SWMs merge to a TWM in the direction of the initial WGM. The other directionalTWM vanishes as witnessed in experiments by vanishing of backward reflection in the fiber.
(ii) π/4< β < π/2. The roots of ρ = 0 can be found by setting χ3ξ 4+χ(1+χ)ξ 2 cos(2β )+1 = 0. This is a transcendental third-order polynominal equation whose roots are too lengthy togive here. Given π/4 < β < π/2, either none or two positive real roots can be found for χ atspecific values of β and χ . This suggests that two linewidth crossing points may be observed.Indeed the double crossing patterns are seen in the calculated patterns shown in Fig. 4(a) and4(b). In both cases, one ”symmetric” linewidth crossing [indicated by arrows in Fig. 4(a) and4(b)] coincides with a frequency anti-crossing. From the plot of mode position φ , we see thatthe two SWMs ”switch” distributions (φ shifts by π/2) around this point. This switching takesplace around χξ 2 = 1 and is the source of the symmetry of linewidth crossing. The otherlinewidth crossing takes place around χ2ξ 2 = 1, where the linewidth of one SWM changessignificantly faster than that of the other one. This indicates that mode [red line in Fig. 4(a) andblue line in Fig. 4(b)] has much larger overlap with the second scatterer. Depending on whetherξ > 1 or ξ < 1, the ”symmetric” linewidth crossing is observed before or after the other one.In experiments both scenarios were observed [Fig. 4(c) and 4(d)].
Moreover, in the case that no positive real roots are found for ρ = 0, there is no linewidthcrossing although one can always find χ for specific ξ and β which minimize ρ . On either
#131982 - $15.00 USD Received 20 Jul 2010; revised 22 Sep 2010; accepted 16 Oct 2010; published 26 Oct 2010(C) 2010 OSA 8 November 2010 / Vol. 18, No. 23 / OPTICS EXPRESS 23541
Frequency (MHz)
Nor
mal
ized
tran
smis
sion
0 100 200 300
0.81
0.81
0.81
0.81
0.81
0.81
0.81
0.81
0.81
0.81
0.81
0.81
0.81
0.81
Frequency (MHz)
Nor
mal
ized
tran
smis
sion
0 50 100 150 2000.8
10.8
10.8
10.8
10.8
10.8
10.8
10.8
10.8
10.8
10.8
10.8
10.8
1
−400 −200 0
0.2
0.4
0.6
0.8
Size
Fac
tor
Frequency Shift (MHz)0 1 2 3
Mode Position φ (rad)2 4 6 8 10 12
Additional Damping (MHz)
−2000 −1000 0
0.5
1
1.5
2
2.5
3
3.5
Size
Fac
tor
Frequency Shift (MHz)0 1 2 3
Mode Position φ (rad)0 500 1000
Additional Damping (MHz)
dc
a
b
Fig. 5. Calculated frequency shift, linewidth broadening of the doublet and SWM positionφ as a function of the ratio of second scatterer size over the first one, for (a) β = 0.44π ,ξ = 1/4, and (b) β = 0.44π , ξ = 4. Dotted and solid lines correspond to the two SWMs.(c),(d) Experimental observations corresponding to (a) and (b), respectively.
#131982 - $15.00 USD Received 20 Jul 2010; revised 22 Sep 2010; accepted 16 Oct 2010; published 26 Oct 2010(C) 2010 OSA 8 November 2010 / Vol. 18, No. 23 / OPTICS EXPRESS 23542
side of this minimum, ρ increases implying linewidth anti-crossing. This can be explained in asimilar way as the frequency anti-crossing when π/4 < β < π/2.
(iii) 0 ≤ β ≤ π/4. In this case ρ �= 0 and similar to δ in this regime, ρ increases as α2
increases. Neither crossing nor anti-crossing can be observed.Note that the above discussed behaviors are associated with exceptional points [Fig. 4(d)] [7]
and suggest that exceptional points can be observed in a single optical resonator by precisecontrol of external nanoprobes.
3. Conclusion
In conclusion, we have discussed the controlled manipulation of WGMs in a microcavity usingtwo external nanoprobes. The theory and method described here provide guidelines for manip-ulating the coupling of two SWMs and probing the mode splitting related phenomena. Thiswork suggests that many application (e.g., filters, gyroscopes, delays) which are thought to re-quire multi-cavity configurations could be realized within a single microcavity. It also paves theground for the discussions on tunable dual wavelength lasing with active material doped mi-croresonators, detection of consecutively introduced nanoparticles using microresonators andstudying level dynamics of interacting modes. Continuous tunability of the split WGM modesby external probes will enable to selectively amplify mechanical modes as well as help efficientcooling of mechanical modes.
Acknowledgments
The authors are grateful to the McDonnell Academy Global Energy and Environment Partner-ship(MAGEEP) and the Center for Materials Innovation (CMI) at Washington University inSt. Louis, and the National Science Foundation (NSF) (Grant No. 0954941) for financial sup-port. This work was performed in part at the NRF/NNIN (NSF award No. ECS-0335765) ofWashington University in St. Louis.
#131982 - $15.00 USD Received 20 Jul 2010; revised 22 Sep 2010; accepted 16 Oct 2010; published 26 Oct 2010(C) 2010 OSA 8 November 2010 / Vol. 18, No. 23 / OPTICS EXPRESS 23543