Controlled Phase Transition in Titania Nanoparticles –Effect of Calcination Temperature M. Imran 1) , *S. Mudassar Muzaffar 2) , Saira Riaz 3) and Shahzad Naseem 4) 2), 3), 4) Centre of Excellence in Solid State Physics, University of the Punjab, Lahore, Pakistan 3) [email protected]ABSTRACT Titania (TiO 2 ) nanoparticles (NPs) have attracted worldwide attraction because of their high refractive index, high dielectric constant, excellent photocatalytic abilities, high photoelectric conversion efficiency. These advantages of titania have led its applications in solar cells as a window layer and other optoelectronic devices. Titania NPs are synthesized via sol-gel method using TiCl 4 as precursor. NPs are prepared at low temperature of 60˚C. Presence of (020), (202), (321), (402), (322), (040), (400) and (513) diffraction peaks correspond to brookite phase of titania under as-synthesized conditions. NPs are calcined in temperature range of 100 to1000˚C. XRD results indicate that brookite to anatase phase transformation starts at 300˚C. In the calcination temperature range of 300-400˚C phase transformation from brookite to anatase completes. Increasing the calcination temperature to 500-800˚C results in formation of pure rutile phase of titania. Further increase in calcination temperature results in phase stability of rutile phase. SEM results indicate the formation of spherical NPs with diameter ~20- 50nm. Comparison of structural and dielectric properties indicates that dielectric constant and tangent loss are strongly affected by the formation of different phases of titania. Highest dielectric constant of 225 (log f = 6.0) is observed for nanoparticles calcined at 400˚C. Titania nanoparticles show high transmission in the visible and infrared region with band gap in the range of 2.98eV-3.05eV with variation in phases of titania. 1. INTRODUCTION Nanotechnology is the manipulation of matter at nanometer scale. It is the technique in which physical principles are used to make structures at nanometer scale, having at least one dimension ranging from 1 to 100 nm. In 1959 Feynman presented the idea of nano regime in American Physical Society annual meeting, by saying historic words “There’s Plenty of Room at the Bottom”. Since then a lot of scientist and engineers are working and exploiting the interesting facts of nanoscale structures, and in recent years the main research interest is working on nanoscale, where all the
Transcript
Controlled Phase Transition in Titania Nanoparticles –Effect ofCalcination Temperature
M. Imran1), *S. Mudassar Muzaffar2), Saira Riaz3) and Shahzad Naseem4)
2), 3), 4) Centre of Excellence in Solid State Physics, University of the Punjab, Lahore,Pakistan
Titania (TiO2) nanoparticles (NPs) have attracted worldwide attraction because oftheir high refractive index, high dielectric constant, excellent photocatalytic abilities,high photoelectric conversion efficiency. These advantages of titania have led itsapplications in solar cells as a window layer and other optoelectronic devices. TitaniaNPs are synthesized via sol-gel method using TiCl4 as precursor. NPs are prepared atlow temperature of 60˚C. Presence of (020), (202), (321), (402), (322), (040), (400) and (513) diffraction peaks correspond to brookite phase of titania under as-synthesizedconditions.NPs are calcined in temperature range of 100 to1000˚C. XRD results indicate thatbrookite to anatase phase transformation starts at 300˚C. In the calcination temperature range of 300-400˚C phase transformation from brookite to anatase completes. Increasing the calcination temperature to 500-800˚C results in formation of pure rutile phase of titania. Further increase in calcination temperature results in phase stability ofrutile phase. SEM results indicate the formation of spherical NPs with diameter ~20-50nm. Comparison of structural and dielectric properties indicates that dielectricconstant and tangent loss are strongly affected by the formation of different phases oftitania. Highest dielectric constant of 225 (log f = 6.0) is observed for nanoparticlescalcined at 400˚C. Titania nanoparticles show high transmission in the visible and infrared region with band gap in the range of 2.98eV-3.05eV with variation in phases oftitania.
1. INTRODUCTION
Nanotechnology is the manipulation of matter at nanometer scale. It is thetechnique in which physical principles are used to make structures at nanometer scale,having at least one dimension ranging from 1 to 100 nm. In 1959 Feynman presentedthe idea of nano regime in American Physical Society annual meeting, by sayinghistoric words “There’s Plenty of Room at the Bottom”. Since then a lot of scientist andengineers are working and exploiting the interesting facts of nanoscale structures, andin recent years the main research interest is working on nanoscale, where all the
research has shifted from micro scale to nanoscale (Carneiro et al. 2009, Moser et al.2013).
At nanometer scale materials’ physical, chemical and biological properties changewhen the size is reduced to 100 nm and below. These properties arise from thequantum mechanical nature of the nano structured materials. When the matter ispushed to nanometer scale, with decrease in the size, the surface area is increasedwhich accounts for an increase in the surface free energy. This arises due to the factthat with decrease in the size there occurs a change in interatomic spacing. Thischange in interatomic spacing also leads to the lowering of melting point (Sakai et al.2013, Wu et al. 2012).
Among various materials studied at nanoscale titania (TiO2) is a promisingcandidate owing to its high refractive index, high dielectric constant and low absorptioncapability. Among various crystallized polymorphs of titania three importantcrystallographic structures are: 1) Rutile with tetragonal crystal structure; 2) Anatasewith tetragonal structure; 3) Brookite with orthorhombic structure (Riaz and Naseem2015).
As a stable semiconducting material titania has been used in variousoptoelectronic devices. Brookite, anatase and rutile has optical band gaps of ~3.3eV,3.4eV and 3.0eV, respectively (Landmann et al. 2012). The basic building block of titaniais composed of Ti atom which is surrounded by six oxygen atoms with elongated Ti-Obond (Ulrike 2003).
Phase transition between different phases of titania is the topic of research as thesynthesis and calcination conditions dictate the phases present in titania. We herereport sol-gel synthesis of titania nanoparticles. The particles are studied under as-synthesized conditions as well as after annealing in the temperature range of 100-1000oC. However, results of as-synthesized and annealed at 400˚C and 1000˚C are reported in this paper.
2. EXPERIMENTAL DETAILS
Titania nanoparticles were synthesized using sol-gel method. Titaniumtetrachloride was used as precursor. Deionized (DI) water and ethanol were used assolvents. Titanium tetrachloride was dissolved in DI water and ethanol. Reaction wasexothermic and was carried out in water bath. Detailed sol-gel synthesis was reportedearlier (Riaz and Naseem 2015). Titania sol was heat treated at 60˚C to obtain titania nanoparticles.
These nanoparticles were studied under as-synthesized and calcined conditions.However, results of few samples under optimized conditions have been reported in thispaper i.e. as synthesized and after calcination at 400˚C and 1000˚C. Bruker B8 Advance X-ray diffractometer and 6500B Precision Impedance Analyzer were used tostudy structural and dielectric properties. Optical analysis was carried out using JAWollam M-2000 Variable Angle Spectroscopic Ellipsometer.
3. RESULTS AND DISCUSSION
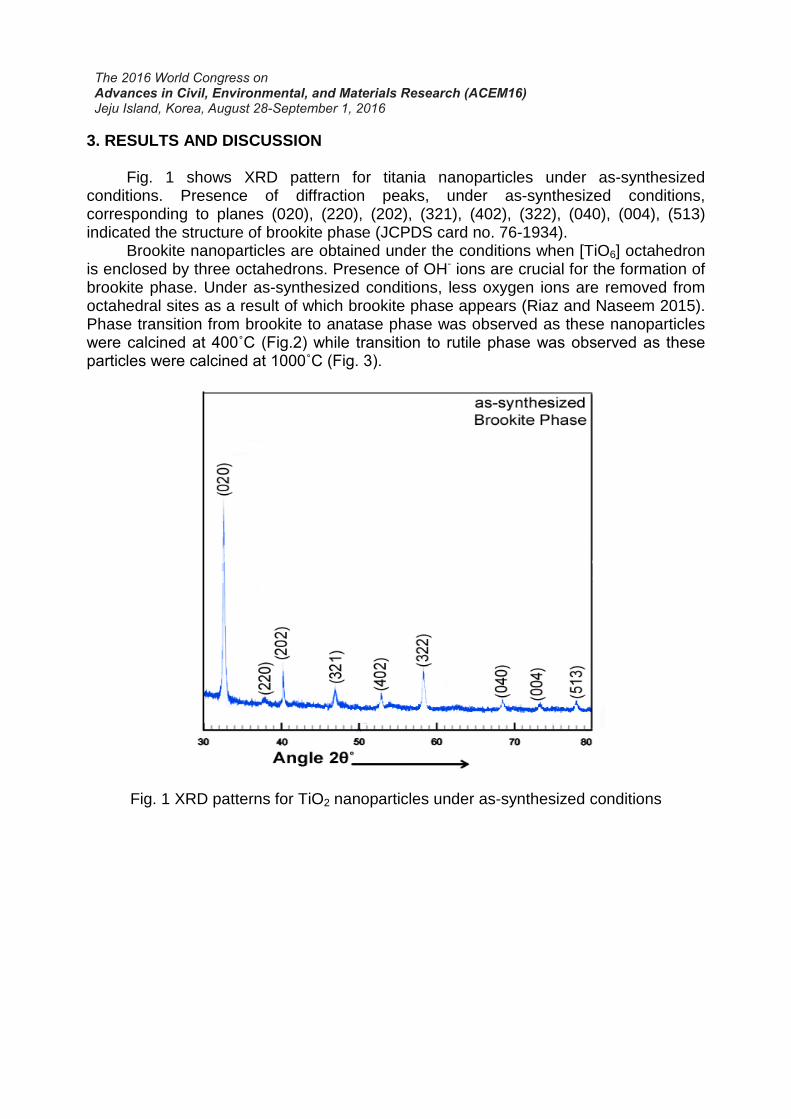
Fig. 1 shows XRD pattern for titania nanoparticles under as-synthesizedconditions. Presence of diffraction peaks, under as-synthesized conditions,corresponding to planes (020), (220), (202), (321), (402), (322), (040), (004), (513)indicated the structure of brookite phase (JCPDS card no. 76-1934).
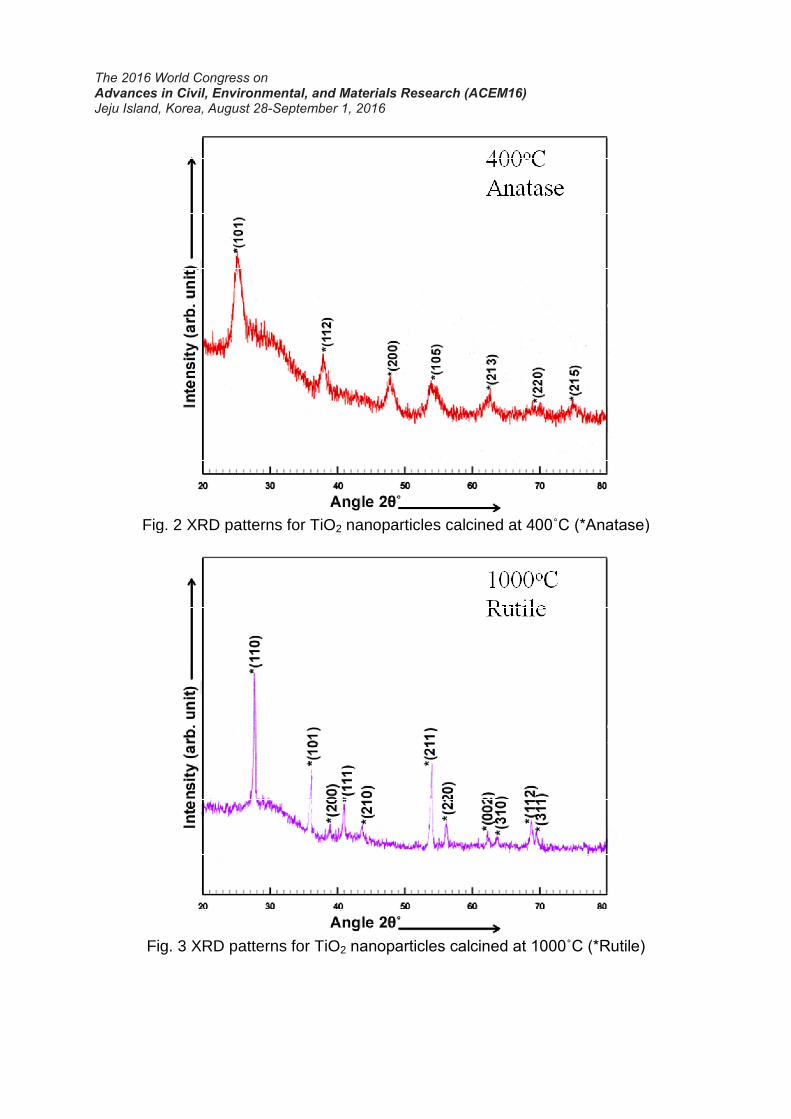
Brookite nanoparticles are obtained under the conditions when [TiO6] octahedronis enclosed by three octahedrons. Presence of OH- ions are crucial for the formation ofbrookite phase. Under as-synthesized conditions, less oxygen ions are removed fromoctahedral sites as a result of which brookite phase appears (Riaz and Naseem 2015).Phase transition from brookite to anatase phase was observed as these nanoparticleswere calcined at 400˚C (Fig.2) while transition to rutile phase was observed as these particles were calcined at 1000˚C (Fig. 3).
Fig. 1 XRD patterns for TiO2 nanoparticles under as-synthesized conditions
Fig. 2 XRD patterns for TiO
Fig. 3 XRD patterns for TiO
Fig. 2 XRD patterns for TiO2 nanoparticles calcined at 400˚C (*Anatase)
Fig. 3 XRD patterns for TiO2 nanoparticles calcined at 1000˚C (*Rutile)
00˚C (*Anatase)
nanoparticles calcined at 1000˚C (*Rutile)
Crystallite size (t) (Cullity 1956) and dislocation density (δ) (Kumar et al. 2011)were calculated using Eqs. 1-2
θ
λ
cos
9.0
Bt = (1)
2
1
t=δ (2)
Where, θ is the diffraction angle, λ is the wavelength (1.5406Å) and B is FullWidth at Half Maximum. Crystallite size (Table 1) decreased as calcination temperaturewas increased to 400˚C. However, increase in crystallite size was observed with increase in calcination temperature to 1000˚C. Lattice parameters for titania nanoparticles are close to those reported in literature (Ulrike 2003, Landmann et al.2012, Riaz and Naseem 2015).
Table 1 Structural parameters for titania nanoparticles
Temperature(˚C)
Crystallitesize (nm)
Dislocationdensity (1015
lines/m2)
Latticeparameters
Structure
As-synthesized
25.56 1.530658a=9.2Å
b=5.5ÅÅc=5.16Å
Brookite(Orthorhomic)
400 18.25 3.002439a=3.8Åc=9.51Å
Anatase(Tetragonal)
1000 23.45 1.818504a=4.6Åc=2.94Å
Rutile(Tetragonal)
Dielectric constant (ε) and tangent loss (tan δ) were determined using Eqs. 3 and4 (Barsoukov and Macdonald 2005).
Ao
Cd
εε = (3)
ερεπδ
of2
1tan = (4)
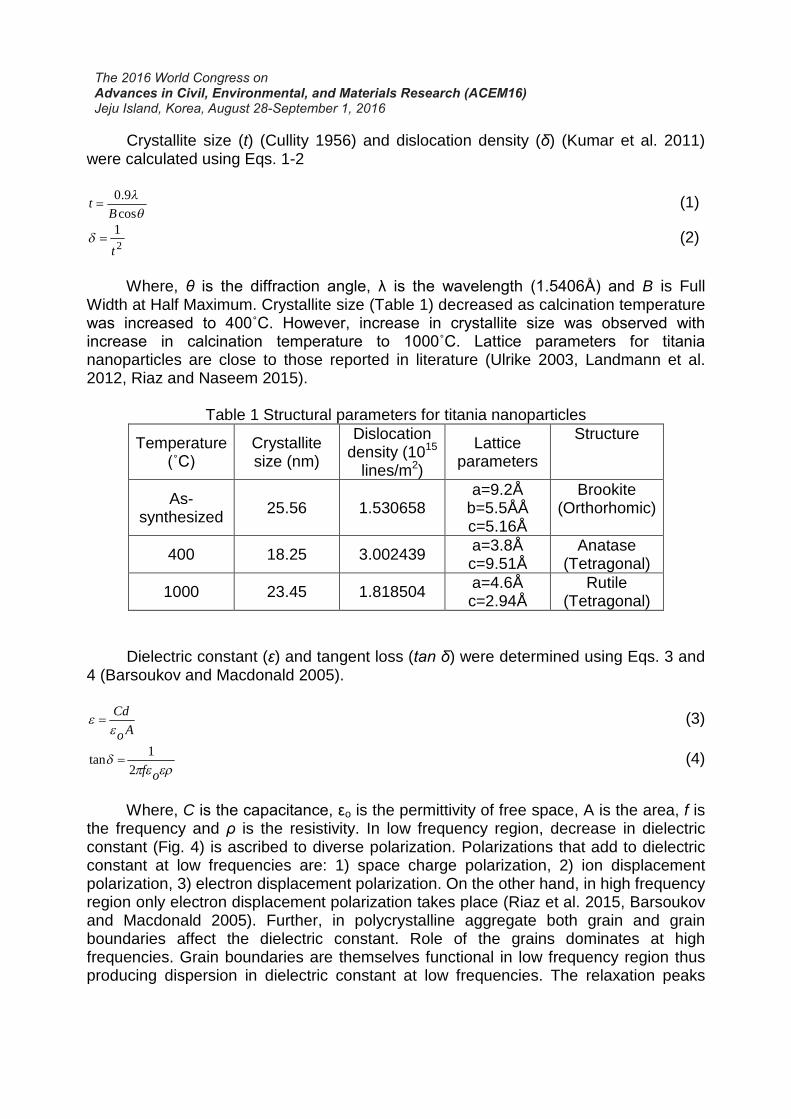
Where, C is the capacitance, εo is the permittivity of free space, A is the area, f isthe frequency and ρ is the resistivity. In low frequency region, decrease in dielectricconstant (Fig. 4) is ascribed to diverse polarization. Polarizations that add to dielectricconstant at low frequencies are: 1) space charge polarization, 2) ion displacementpolarization, 3) electron displacement polarization. On the other hand, in high frequencyregion only electron displacement polarization takes place (Riaz et al. 2015, Barsoukovand Macdonald 2005). Further, in polycrystalline aggregate both grain and grainboundaries affect the dielectric constant. Role of the grains dominates at highfrequencies. Grain boundaries are themselves functional in low frequency region thusproducing dispersion in dielectric constant at low frequencies. The relaxation peaks
observed in tangent loss data is ascribed to resonance effect. This effect arises whenfrequency of externally applied field becomes equal to jumping frequency of ionset al. 2015).
Dielectric constant and tangent loss of titania nanoparticles can be seen in table 2.It can be seen that dielectric constant increases from 150 (log f = 6.0) toas titania nanoparticles were calcined at 400˚C. This increase in dielectric constant and tangent loss is associated with phase transition from brookite to anatase phase i.e.structural transition from orthorhombic to tetragonal phase asaddition, it was observed in Table 1 that crystallite size reduces from 25.56nm to18.25nm as titania nanoparticles were calcined at 400˚C. size increases number of grain boundaries. Electrons that travel through the moreconducting grain boundaries,that offer more resistance (Riaz et al. 2015dielectric constant increases. Decrease in dielectric constanttemperature is associated with increase in crystallite size and phase transition to rutilephase (Table1).
observed in tangent loss data is ascribed to resonance effect. This effect arises whenexternally applied field becomes equal to jumping frequency of ions
Dielectric constant and tangent loss of titania nanoparticles can be seen in table 2.It can be seen that dielectric constant increases from 150 (log f = 6.0) toas titania nanoparticles were calcined at 400˚C. This increase in dielectric constant and tangent loss is associated with phase transition from brookite to anatase phase i.e.structural transition from orthorhombic to tetragonal phase as was observed in Fig. 1.
it was observed in Table 1 that crystallite size reduces from 25.56nm to18.25nm as titania nanoparticles were calcined at 400˚C. The reduction in crystallitesize increases number of grain boundaries. Electrons that travel through the moreconducting grain boundaries, under the application of field, pile at the grain boundaries
(Riaz et al. 2015, Barsoukov and Macdonald 2005dielectric constant increases. Decrease in dielectric constant at high calcinationtemperature is associated with increase in crystallite size and phase transition to rutile
Table 2 Dielectric constant and tangent loss for Titania nanoparticlesPhase Dielectric
observed in tangent loss data is ascribed to resonance effect. This effect arises whenexternally applied field becomes equal to jumping frequency of ions (Riaz
Dielectric constant and tangent loss of titania nanoparticles can be seen in table 2.It can be seen that dielectric constant increases from 150 (log f = 6.0) to 225 (log f = 6.0)as titania nanoparticles were calcined at 400˚C. This increase in dielectric constant and tangent loss is associated with phase transition from brookite to anatase phase i.e.
was observed in Fig. 1. Init was observed in Table 1 that crystallite size reduces from 25.56nm to
The reduction in crystallitesize increases number of grain boundaries. Electrons that travel through the more
field, pile at the grain boundariesand Macdonald 2005). Thus,
at high calcinationtemperature is associated with increase in crystallite size and phase transition to rutile
tangent loss for Titania nanoparticlesTangent loss(log f =
0.00600.00180.0020
Fig. 4 Dielectric constant and
Fig. 5 shows transmission curves for titania nanoparticles. It can be seen thattitania nanoparticles exhibit high transmission in the visible and infrared region.increase in transmission at wavelength 375titania nanoparticles. It can be seen that transmission of titania nanoparticles decreasesas these nanoparticles were calcined at 400˚C. This decrease in transmission is associated with decrease in crystallite size (Table 1). Decrease in crystallite size resultsin increase in number of grain boundaries that act as scattering centres for incidentphotons thus resulting in decrease in transmissionin transmission with increase in calcination temperature is associated withcrystallite size. This leads to decrease in grain boundaries and hence less scatteringfrom grain boundaries. α2 vs. E (eV) curve for titania nanoparticles can be seen in Fig.6. Titania nanoparticles exhibit direct band of 3.05eV, 3.01eV and 2.98eV fornanoparticles under as-synthesized conditions and after calcination at 400˚C and 1000˚C. band gap vales are close to that reported in literature (Ulrike 2003, Landmannet al. 2012, Riaz and Naseem 2015
Fig. 4 Dielectric constant and tangent loss for TiO2 nanoparticles
5 shows transmission curves for titania nanoparticles. It can be seen thattitania nanoparticles exhibit high transmission in the visible and infrared region.increase in transmission at wavelength 375-425nm is indicative of direct band gap of
It can be seen that transmission of titania nanoparticles decreasesas these nanoparticles were calcined at 400˚C. This decrease in transmission is associated with decrease in crystallite size (Table 1). Decrease in crystallite size results
number of grain boundaries that act as scattering centres for incidentphotons thus resulting in decrease in transmission (Riaz and Naseem 2015)
transmission with increase in calcination temperature is associated withize. This leads to decrease in grain boundaries and hence less scattering
vs. E (eV) curve for titania nanoparticles can be seen in Fig.6. Titania nanoparticles exhibit direct band of 3.05eV, 3.01eV and 2.98eV for
synthesized conditions and after calcination at 400˚C and band gap vales are close to that reported in literature (Ulrike 2003, Landmann
, Riaz and Naseem 2015).
nanoparticles
5 shows transmission curves for titania nanoparticles. It can be seen thattitania nanoparticles exhibit high transmission in the visible and infrared region. Sharp
of direct band gap ofIt can be seen that transmission of titania nanoparticles decreases
as these nanoparticles were calcined at 400˚C. This decrease in transmission is associated with decrease in crystallite size (Table 1). Decrease in crystallite size results
number of grain boundaries that act as scattering centres for incident(Riaz and Naseem 2015). Increase
transmission with increase in calcination temperature is associated with increase inize. This leads to decrease in grain boundaries and hence less scattering
vs. E (eV) curve for titania nanoparticles can be seen in Fig.6. Titania nanoparticles exhibit direct band of 3.05eV, 3.01eV and 2.98eV for
synthesized conditions and after calcination at 400˚C and band gap vales are close to that reported in literature (Ulrike 2003, Landmann
Fig. 5 Transmission curves for titania nanoparticles
Fig. 6 α2 vs. E(eV) curve for titiania nanoparticles indicating direct band gap
4. CONCLUSIONS
Titania nanoparticles were prepared using sol-gel method with titanium tetrachloride asprecursor. These nanoparticles were studied under as-synthesized conditions and aftercalcination. Brookite, anatase and rutile phases of titania were obtained under as-synthesized conditions and after calcination at 400˚C and 1000˚C, respectively.
Dielectric constant and tangent loss both demonstrated normal dispersion behavior.Comparison of structural and dielectric properties revealed that highest dielectricconstant of 225 (log f = 6.0) was observed for nanoparticles calcined at 400˚C. Titania nanoparticles showed high transmission in visible and infrared region with band gap of3.05eV, 3.01eV and 2.98eV under as-synthesized conditions and after calcination at400˚C and 1000˚C, respectively.
REFERENCES
Carneiro, J.O., Teixeira, V., Martins, A.J., Mendes, M., Ribeiro, M. and Vieira, A.(2009), “Surface properties of doped and undoped TiO2 thin films deposited bymagnetron sputtering”, Vacuum, 83, 1303–1306
Cullity, B.D. (1956), “Elements of x-ray diffraction,” Addison Wesley PublishingCompany, USA.
Diebold, U. (2003), “The surface science of titanium dioxide,” Surf. Sci. Rep., 48, 53-229
Kumar, N., Sharma, V., Parihar, U., Sachdeva, R., Padha, N. and Panchal, C.J. (2011)“Structure, optical and electrical characterization of tin selenide thin films depositedat room temperature using thermal evaporation method,” J. Nano- Electron. Phys., 3,117-126
Landmann, M., Rauls, E. and Schmidt, W.G. (2012), “The electronic structure andoptical response of rutile, anatase and brookite TiO2,” J. Phys.: Condens. Matter, 24,195503
Moser, E.M., Chappuis, S. and Olleros, J. (2013), “Production of photocatalyticallyactive titania layers: A comparison of plasma processes and coating properties”,Surf. Coat. Technol., http://dx.doi.org/10.1016/j.surfcoat.2013.01.050.
Riaz, S. and Naseem, S. (2015), “Controlled nanostructuring of TiO2 nanoparticles: asol–gel approach,” J. Sol-Gel Sci. Technol., 74, 299–309
Riaz, S., Shah, S.M.H., Akbar, A., Atiq, S. and Naseem, S. (2015), “Effect of Mn dopingon structural, dielectric and magnetic properties of BiFeO3 thin films,” J. Sol-Gel Sci.Technol. 74, 310-319.
Sakai, E., Amemiya, K., Chikamatsu, A., Hirose, Y., Shimada, T. and Hasegawa, T.(2013), “X-ray absorption and magnetic circular dichroism characterization ofFedopedTiO2- δ thin films,” J. Magn. Magn. Mater., 333, 130-133
Wu, Q.L., Subramanian, N., Strzalka, J., Zhang Jiang, Z. and Rankin, S.E. (2012),“Tuning the mesopore structure of 3D hexagonal thin films using butanol as acosolvent”, Thin Solid Films, 520, 3558–3566.


![SYNTHESIS AND CHARACTERIZATION OF CORE/SHELL ......Functionalized nanoparticles such as core/shell silica coated gold [2], alumina coated Titania [3], silver coated magnetite [4],](https://static.documents.pub/doc/80x56/60bd533bb67f6c68462c9209/synthesis-and-characterization-of-coreshell-functionalized-nanoparticles.jpg)


