36
esearcli Report Series 2001 Controlling for Rater Effects When Comparing Survey Items With Incomplete Likert Data E. Matthew Schulz Anji Sun ACT February 2001
esearcli R ep o rt S eries 2 0 0 1
Controlling for Rater Effects When Comparing Survey Items With Incomplete Likert Data
E. Matthew Schulz
Anji Sun
ACT F ebruary 2 0 0 1

For additional copies write:ACT Research Report Series PO Box 168Iowa City, Iowa 52243-0168
© 2001 by ACT, Inc. All rights reserved.

Controlling for Rater Effects When Comparing Survey Items With Incomplete Likert Data
E. Matthew Schulz Anji Sun
Abstract
This study is concerned with ranking items with Likert scale data when the items are
subject to systematic (non-random) patterns o f non-response. We applied Aldrich’s (1978)
rating scale model to data from a survey in which the item response rate varied from less than
one percent to over ninety percent. The person parameter in the rating scale model measured
each rater’s tendency to give higher or lower ratings in a fashion that was consistent across
items. This tendency was named "pleasability" according to the Likert scale used in this study.
Survey respondents differed substantially in pleasability. Groups responding to different items
differed in average pleasability. Item parameter estimates in the rating scale model corrected for
the differential exposure o f survey items to pleasability. Compared to available case means, the
rank order o f items by their parameter estimates in the rating scale model had higher internal
order consistency.
Controlling for Rater Effects When Comparing Survey Items With Incomplete Likert Data
The problem to be addressed in this study arises when Likert ratings o f items are not
missing at random with regard to a personal factor that affects ratings. Since the ratings in this
study reflect satisfaction with college services, we will refer to this personal factor as
“pleasability.” Brady (1989) used different terms, but illustrated the basic issue: “Cynics” don’t
like to provide positive assessments for anything and therefore tend to confine their ratings to the
lower range o f the Likert scale, e.g., "very dissatisfied." “Pollyannas” see good in everything,
and therefore confine their ratings to the upper range o f the scale, e.g., "very satisfied." Now it is
possible that some items, for whatever reason, are more likely to be experienced, and therefore
rated, by cynics than by Pollyannas. This implies a problem for comparing items through their
available case means. Items more often rated by cynics are disadvantaged, and items more often
rated by Pollyannas advantaged, if available case mean ratings are used to evaluate item
performance.
A variety o f latent variable models have been used to solve the problem o f nonrandomly
missing data when the goal is to compare items or persons on a single dimension. For ordinal
data, item response theory (IRT) models have been applied to Likert ratings in educational
performance assessment (Engelhard, 1992; Lunz, Wright, and Linacre, 1990), and to numerically
coded course grade data (Young, 1990; Lyerla and Elmore, 1996). Latent variable models
similar to IRT models have been developed specifically for course grade data (Johnson, 1997)
and for Likert ratings from a consumer satisfaction survey (Bradlow and Zaslavsky, 1999).
In this study, we use the rating scale model (Andrich, 1978). The rating scale model is a
latent variable model for a person completing j ordered steps on an item. When there are a total
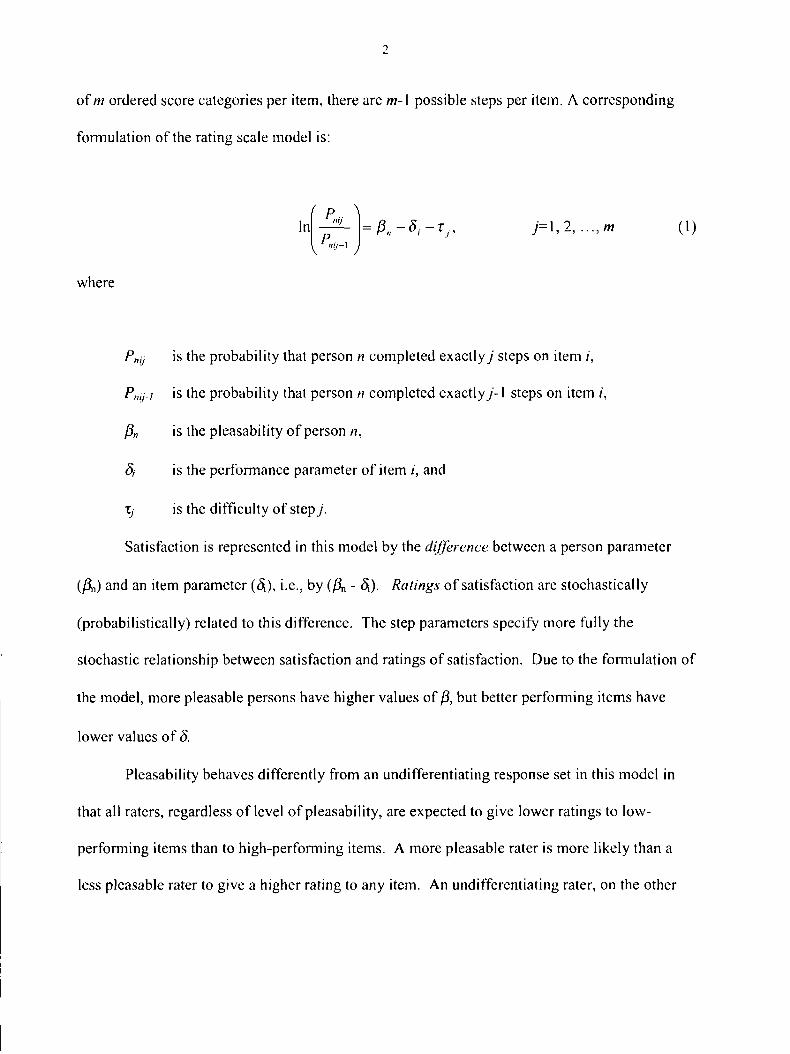
of m ordered score categories per item, there are m- 1 possible steps per item. A corresponding
formulation of the rating scale model is:
2
In "Vp
V "(/_l J
= A, j= 1, 2 , m (1)
where
Pmj is the probability that person n completed exactly j steps on item /,
Pnij.i is the probability that person n completed exactly jA steps on item /,
P„ is the pleasability o f person n,
8f is the performance parameter o f item i, and
xj is the difficulty o f step j .
Satisfaction is represented in this model by the difference between a person parameter
(pn) and an item parameter (<5i), i.e., by (A - <5i). Ratings o f satisfaction are stochastically
(probabilistically) related to this difference. The step parameters specify more fully the
stochastic relationship between satisfaction and ratings o f satisfaction. Due to the formulation o f
the model, more pleasable persons have higher values o f f$, but better performing items have
lower values o f 8.
Pleasability behaves differently from an undifferentiating response set in this model in
that all raters, regardless o f level o f pleasability, are expected to give lower ratings to low-
performing items than to high-performing items. A more pleasable rater is more likely than a
less pleasable rater to give a higher rating to any item. An undifferentiating rater, on the other
hand, gives the same rating to all items, as if item performance, <5, were not a factor in
determining ratings, or as if the effect o f this factor on ratings were muted.
Despite this distinction, we will make no attempt in this study to statistically distinguish
pleasability from an undifferentiating response set. Response sets are typically thought o f as
confounding the measurement of a person-variable, such as an attitude or opinion (Cronbach,
1946; Edwards, 1953; Swearingen, 1998). Pleasability may be thought o f as the person-variable
in this regard. In a future study, we may explore ways to distinguish pleasability from an
undifferentiating response set. For the purpose o f measuring and comparing survey items,
however, the distinction seems o f secondary importance. Both response tendencies confound
comparisons among items, particularly if they are distributed unevenly among the items.
As a Rasch model (Wright and Masters, 1982), the rating scale model is uniquely
regarded by survey researchers concerned with theoretical criteria for measurement (Duncan,
1984a, b; Green, 1996a). Rasch models have become widely used in survey work. (For
examples, see Edwards, Green & Lyons, 1996; Bergstrom & Lunz, 1998; Bode, 1995; Sun &
Schulz, 1999, 2000). Due to the existence of sufficient statistics for the parameters in Rasch
models, missing data present no special technical difficulties for estimating model parameters
(Linacre, 1999).
In one recent satisfaction survey, respondents could skip an item if they did not feel
strongly about it (Bradlow and Zaslavsky, 1999). The latent variable model used in that study
included an enhancement in which the decision to rate an item depended on the respondent's
level of satisfaction. The survey for the present study, however, directs respondents to first
indicate whether they have used each service and then to rate all o f the services that they have
used. With these directions, it is reasonable to assume that missingness in our data is
3
independent of satisfaction after conditioning on rating scale model parameters, and therefore is
"random" in the sense required for data imputation procedures (Little and Rubin, 1987) and
applications of standard IRT models (Wang, Wainer, & Thissen, 1995).
In this study, we address three research questions. These questions are not meant to be
complete but rather to represent a manageable, initial stage of inquiry as to whether a rating scale
analysis has certain advantages over computation o f available case means when survey items are
compared with incomplete Likert data.
0 Do raters vary in a latent response tendency to Likert items when the purpose o f the
survey is to compare items? This question can be answered by the standard deviation and
reliability o f estimates in this study. In order to assess the practical significance o f variation in
P, we will compare the SD o f /3 estimates to the SD o f <5estimates. This comparison is
meaningful because the parameters are expressed in the same metric and have equal effects on
observed ratings.
2) Are the survey items differentially exposed to a latent response tendency? This
question can be answered by measuring the difference between the mean ft of persons who rated
the item and the mean ft associated with all ratings in the data set (see methods). This difference
will be called the /3-bias o f the item. Large /3-bias could arise from chance alone if sample size
for an item is small and variation across all raters is large, or for systematic reasons, as when
students having certain personality characteristics associated with pleasability are more or less
likely to use a service. In the latter case, one would expect the direction of an item's /3-bias to be
consistent across colleges.
3) Do item parameter estimates from a rating scale analysis have higher internal order
consistency than available case means? Institutional reports, newspaper accounts, and research
4
papers often contain rank orderings o f survey items. Rank orderings are unidimensional
comparisons; they imply that any higher ranked item is more likely than any lower ranked item
to be viewed positively by any person who has experience with both items. Internal order
consistency (IOC) reflects the degree to which this expectation is met in a given set o f data. IOC
is the proportion o f times a model, by the rank order it gives to the objects o f measurement,
correctly predicts which o f two objects (e.g. items) received the higher score when both were
given non-tied scores under the same condition o f comparison (e.g., rated by the same person).
In a study o f college course grades (Johnson, 1997), the IOC o f the rank order o f students by a
latent variable analysis was higher than the IOC o f their rank order by available case means
(simple grade point averages). Similarly, we expect the rank order o f survey items by a rating
scale analysis to have a higher IOC than the rank order o f the same items by their available case
means.
Method
Data Description
Data for this study came from Section II o f the Student Opinion Survey (ACT, 1997).
(The items in Section II are listed in Table 2.) Ten colleges were selected from fifty-seven post
secondary education institutions that administered the SOS survey in 1998. The colleges are
labeled 1 through 10 throughout the study. Selection was according to sample size (N>300).
No attempt was made to control for characteristics o f the colleges such as public/private
affiliation, location, enrollment, etc.
Sample size information is shown by college in Table 1. The total number o f returned
surveys was 7,133. O f these, 6,477 students rated at least one item in Section II (Column 3). O f
these, 6,365 were non-extreme raters (Column 4). Raters who assigned all ones or all fives to the
5
items that they rated are referred to as extreme raters. Likewise, items that received all Is or all
5s from raters are referred to as extreme items. Non-extreme raters and items are referred to as
‘Measurable’ in Table 1 because their rating scale model parameters can be estimated using
maximum likelihood procedures. Within colleges, the number o f non-extreme, measurable raters
ranged from 321 to 1289. All 23 items in Section II of the SOS were measurable in eight o f the
ten colleges. In two colleges (Colleges 1 and 7) only 21 o f the items were measurable. [The
extreme items in both colleges were Item 22 (veterans services) and Item 23 (day care services).]
The average number o f items rated per person ranged from 6.8 (College 9) to 12.0 (College 5).
Since there were 23 items, this means that between half and three quarters o f the data was
missing within each college.
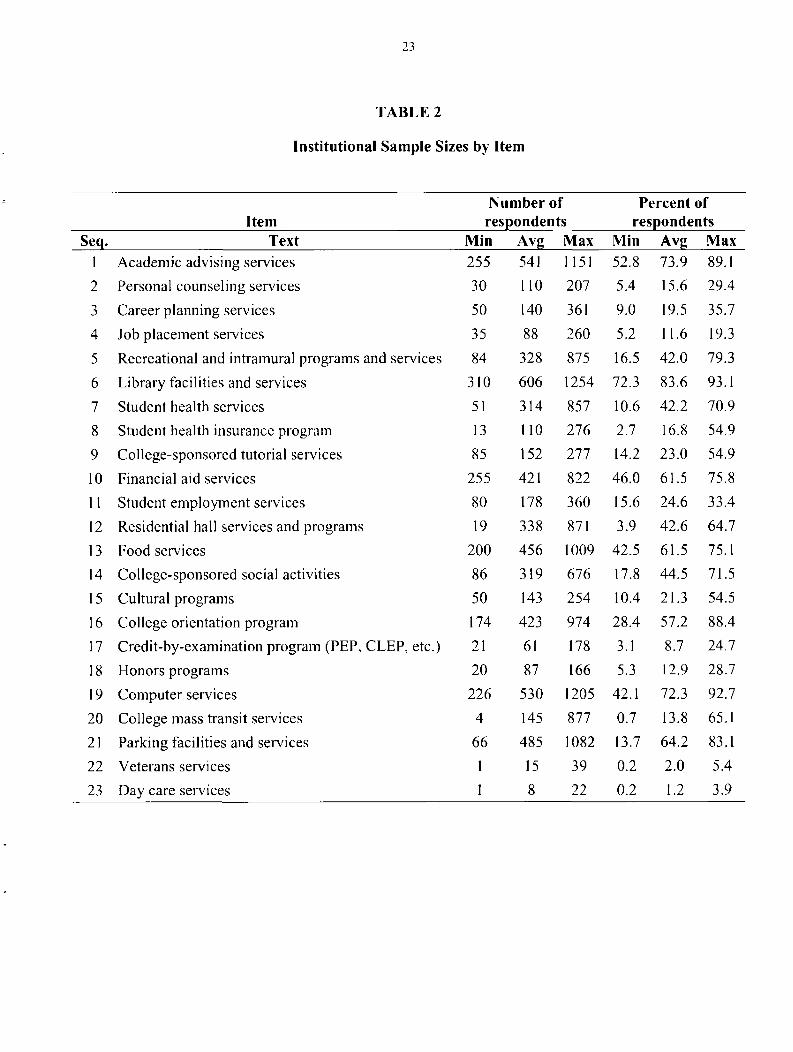
Item sample size information is shown in Table 2. Item sample sizes include extreme
raters. The minimum (MIN) and maximum (MAX) sample sizes pertain to specific colleges,
though the colleges are not identified here for each item. The average (AVG) figure is the
average across colleges. Item 23 (day care services) had the lowest average sample size (8) and
lowest average response rate ( 1.2%). Item 6 (library services) had the highest average sample
size (606) and highest average response rate (83.6%). Items with relatively high response rates
were essential services. These included academic advising, library services, food services, and
parking facilities. Items with relatively low response rates were special needs services. These
include day care services, veterans services, and credit-by-examination.
Computation o f A va liable Case Means
The available cases for an item consisted o f all o f the ratings given to the item within a
college. These included ratings by extreme persons. The minimum and maximum sample sizes

per item in Table 2 are the minimum and maximum numbers of available cases per item within a
college. Available case means were computed separately by college.
Rating Scale Analyses
Rating scale analyses were performed separately for each college using the computer
program Bigsteps (Wright and Linacre, 1991). Program output includes parameter estimates,
standard errors, and group summary statistics such as the mean, standard deviation, and
reliability of parameter estimates. Estimates of the parameters of non-extreme raters were based
on data from only non-extreme items and vice versa. The sample size for estimating the
parameter of an item in a college was therefore equal to or less than the sample size for its
corresponding available case mean. Reliability estimates are computed as one minus the ratio of
the mean squared measurement error to the variance of the parameter estimates. Only
non-extreme raters and non-extreme items are represented in the reliability estimates and group
summary statistics.
13-bias o f Items
The ^3-bias of an item was computed separately for each college as the difference between
the average ft of persons who rated the item and the average /3 represented in the ratings of all of
the measured items. The average ft represented in the ratings of all measured items within
college k was computed as:
N tl r j „
/?(*) = ^ ----- (2)tr,n = i
where N* is the number of measured raters within college k (Column 4, Table 1), and rn is the
number of items rated by person n. The /3-bias of item i within college k was then:
7
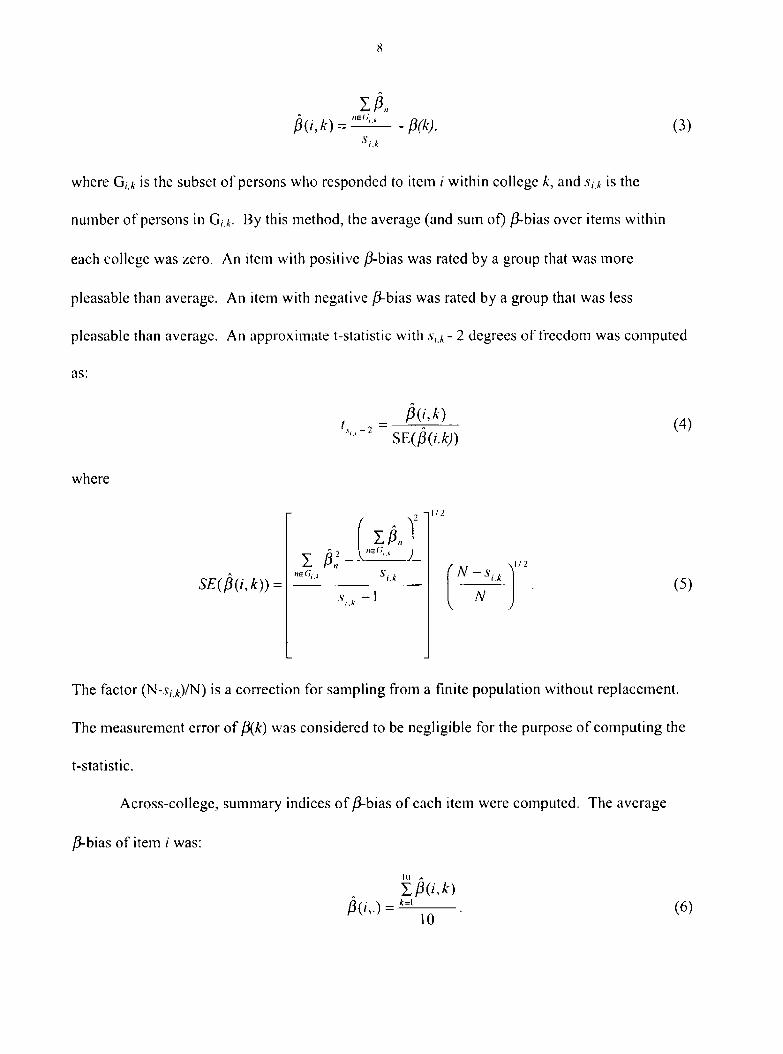
X Aw a ) = - m - (3)
i .k
where G,-* is the subset o f persons who responded to item i within college and * is the
number o f persons in G,> By this method, the average (and sum of) /2-bias over items within
each college was zero. An item with positive /?-bias was rated by a group that was more
pleasable than average. An item with negative /3-bias was rated by a group that was less
pleasable than average. An approximate t-statistic with Av.t- 2 degrees o f freedom was computed
as:
/? (a - )SE (p(i,k))
(4)
where
SE (P (i,k )) =
I A,2 - -I A
sa
1/2
N - s i.k
N(5)
The factor (N -s/^/N ) is a correction for sampling from a finite population without replacement.
The measurement error o f p(k) was considered to be negligible for the purpose o f computing the
t-statistic.
Across-college, summary indices o f fi-bias o f each item were computed. The average
^3-bias o f item i was:
10 *x/3(a)
£(/,.) = k=I
10(6)
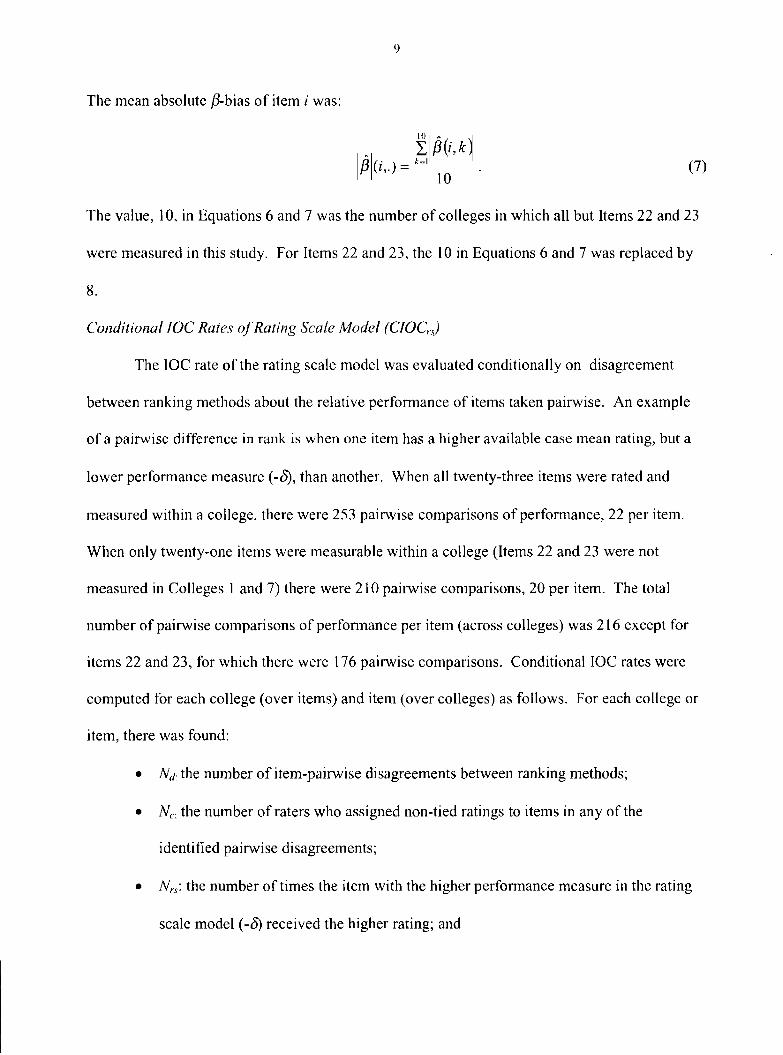
The mean absolute /3-bias o f item / was:
10I /»(«'.*,
P \ ( i , ) = *" |Q • (7)
The value, 10, in Equations 6 and 7 was the number o f colleges in which all but Items 22 and 23
were measured in this study. For Items 22 and 23, the 10 in Equations 6 and 7 was replaced by
Conditional IOC Rates o f Rating Scale Model (CIOCrs)
The IOC rate o f the rating scale model was evaluated conditionally on disagreement
between ranking methods about the relative performance of items taken pairwise. An example
o f a pairwise difference in rank is when one item has a higher available case mean rating, but a
lower performance measure (-5), than another. When all twenty-three items were rated and
measured within a college, there were 253 pairwise comparisons o f performance, 22 per item.
When only twenty-one items were measurable within a college (Items 22 and 23 were not
measured in Colleges 1 and 7) there were 210 pairwise comparisons, 20 per item. The total
number o f pairwise comparisons o f performance per item (across colleges) was 216 except for
items 22 and 23, for which there were 176 pairwise comparisons. Conditional IOC rates were
computed for each college (over items) and item (over colleges) as follows. For each college or
item, there was found:
• Nd: the number o f item-pairwise disagreements between ranking methods;
• Nc: the number of raters who assigned non-tied ratings to items in any of the
identified pairwise disagreements;
• jV„: the number o f times the item with the higher performance measure in the rating
scale model (-5) received the higher rating; and
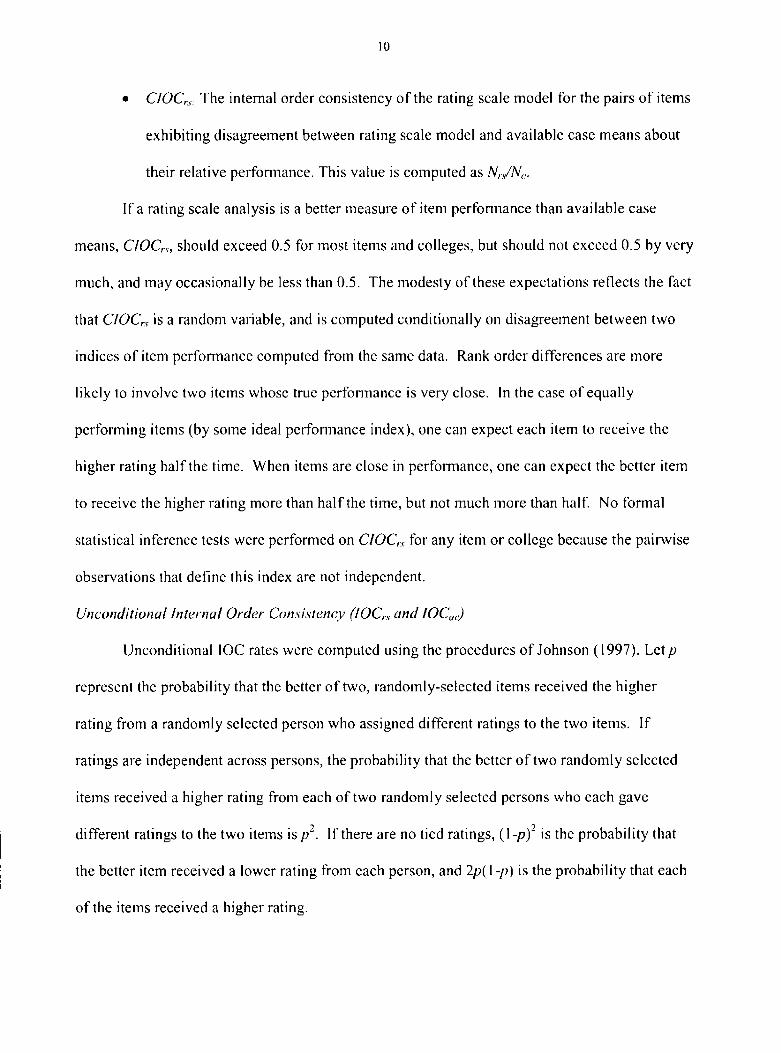
• ClOCrS: The internal order consistency o f the rating scale model for the pairs o f items
exhibiting disagreement between rating scale model and available case means about
their relative performance. This value is computed as Nrs/Nc.
If a rating scale analysis is a better measure o f item performance than available case
means, ClOCrs, should exceed 0.5 for most items and colleges, but should not exceed 0.5 by very
much, and may occasionally be less than 0.5. The modesty o f these expectations reflects the fact
that d O C ,s is a random variable, and is computed conditionally on disagreement between two
indices o f item performance computed from the same data. Rank order differences are more
likely to involve two items whose true performance is very close. In the case o f equally
performing items (by some ideal performance index), one can expect each item to receive the
higher rating half the time. When items are close in performance, one can expect the better item
to receive the higher rating more than half the time, but not much more than half. No formal
statistical inference tests were performed on CIOCrs for any item or college because the pairwise
observations that define this index are not independent.
Unconditional Internal Order Consistency (IOCrsand IOCac)
Unconditional IOC rates were computed using the procedures of Johnson (1997). Let p
represent the probability that the better o f two, randomly-selected items received the higher
rating from a randomly selected person who assigned different ratings to the two items. If
ratings are independent across persons, the probability that the better o f two randomly selected
items received a higher rating from each o f two randomly selected persons who each gave
2 2 * different ratings to the two items is p . If there are no tied ratings, (1 -p) is the probability that
the better item received a lower rating from each person, and 2p(\-p) is the probability that each
of the items received a higher rating.
10
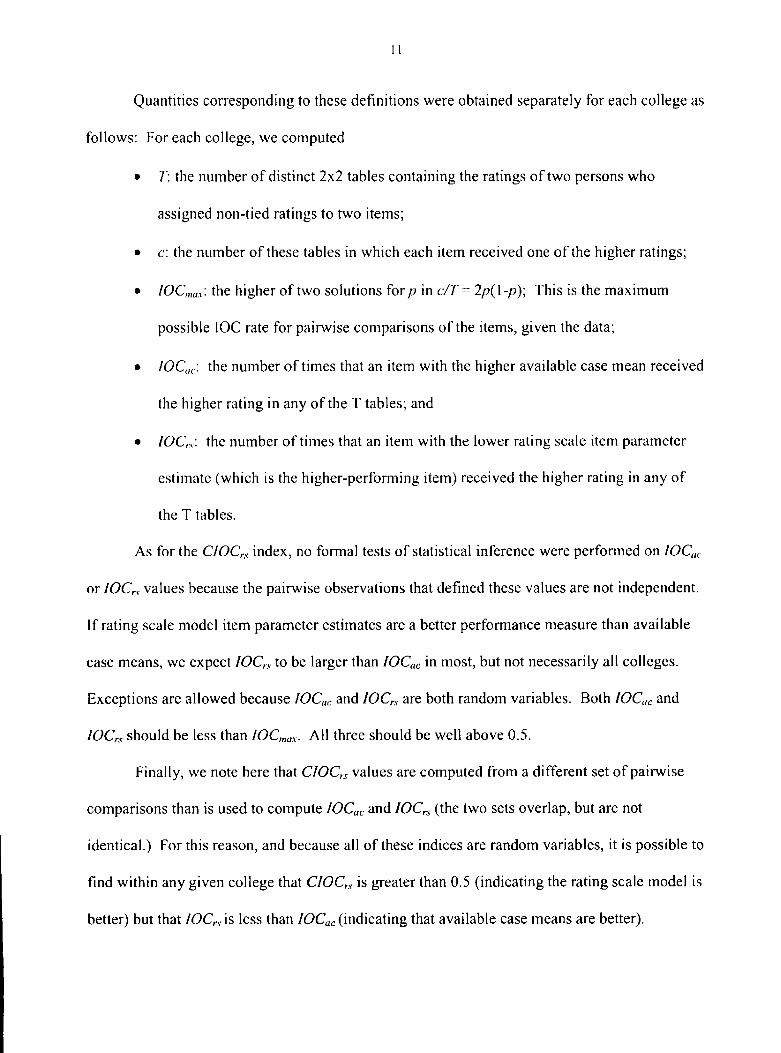
Quantities corresponding to these definitions were obtained separately for each college as
follows: For each college, we computed
• T: the number o f distinct 2x2 tables containing the ratings o f two persons who
assigned non-tied ratings to two items;
• c: the number o f these tables in which each item received one o f the higher ratings;
• IOCmax\ the higher of two solutions for p in c /T — 2p(\-p); This is the maximum
possible IOC rate for pairwise comparisons of the items, given the data;
• lOCac- the number o f times that an item with the higher available case mean received
the higher rating in any of the T tables; and
• IOCrs: the number o f times that an item with the lower rating scale item parameter
estimate (which is the higher-performing item) received the higher rating in any o f
the T tables.
As for the CIOCrs index, no formal tests o f statistical inference were performed on IOCac
or IOCrs values because the pairwise observations that defined these values are not independent.
If rating scale model item parameter estimates are a better performance measure than available
case means, we expect IOCrs to be larger than IOCac in most, but not necessarily all colleges.
Exceptions are allowed because IOCac and IOCrs are both random variables. Both IOCac and
IOCrx should be less than IOCmax. All three should be well above 0.5.
Finally, we note here that CIOCrs values are computed from a different set o f pairwise
comparisons than is used to compute IOCac and IOCrs (the two sets overlap, but are not
identical.) For this reason, and because all o f these indices are random variables, it is possible to
find within any given college that CIOCrs is greater than 0.5 (indicating the rating scale model is
better) but that lOCrs is less than IOCac (indicating that available case means are better).
11
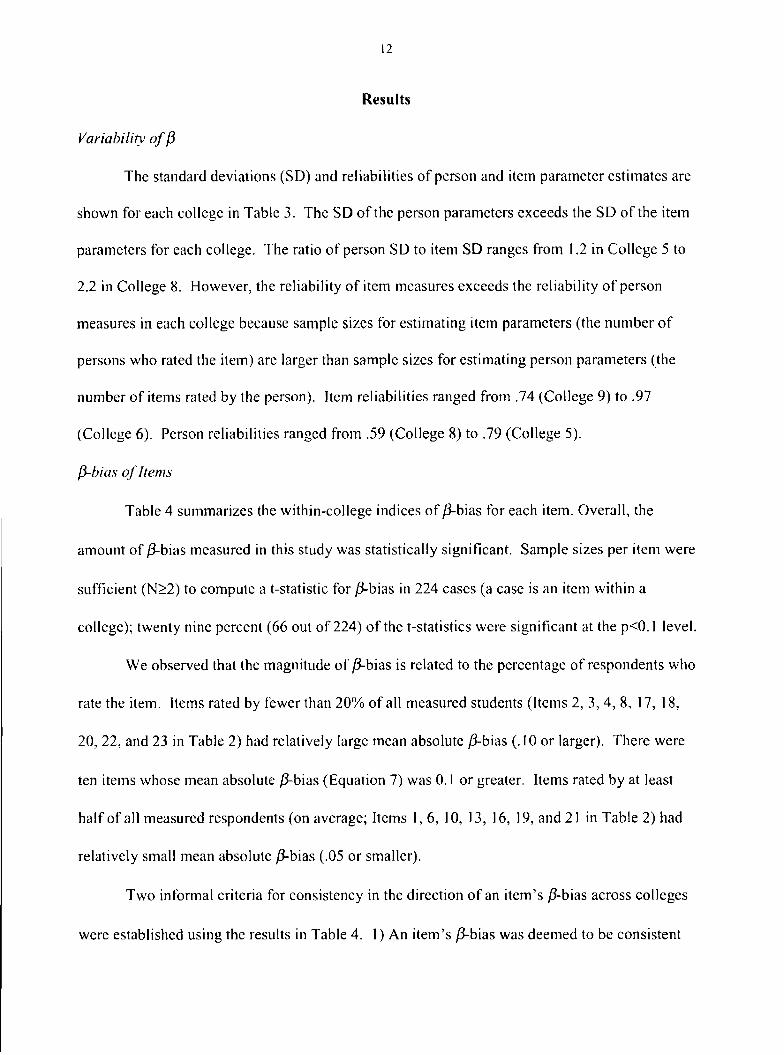
Results
Variability o f ft
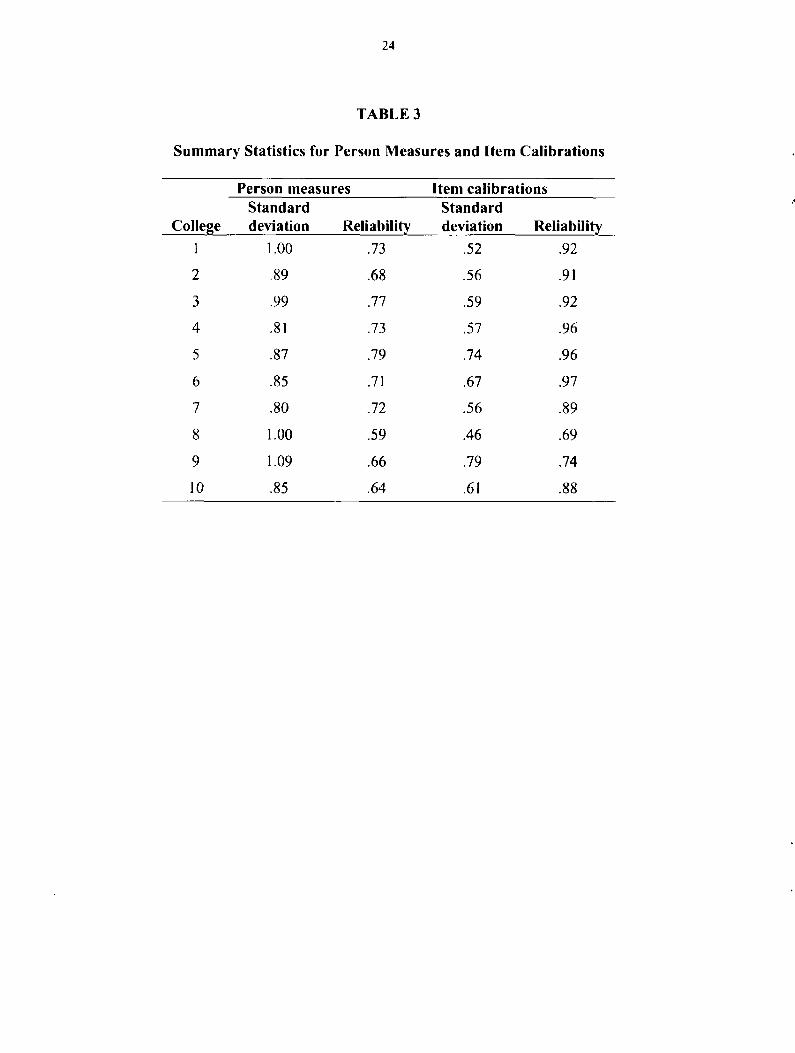
The standard deviations (SD) and reliabilities of person and item parameter estimates are
shown for each college in Table 3. The SD o f the person parameters exceeds the SD o f the item
parameters for each college. The ratio of person SD to item SD ranges from 1.2 in College 5 to
2.2 in College 8. However, the reliability o f item measures exceeds the reliability o f person
measures in each college because sample sizes for estimating item parameters (the number o f
persons who rated the item) are larger than sample sizes for estimating person parameters (the
number o f items rated by the person). Item reliabilities ranged from .74 (College 9) to .97
(College 6). Person reliabilities ranged from .59 (College 8) to .79 (College 5).
ft-bias o f Items
Table 4 summarizes the within-college indices o f /3-bias for each item. Overall, the
amount o f /3-bias measured in this study was statistically significant. Sample sizes per item were
sufficient (N>2) to compute a t-statistic for /3-bias in 224 cases (a case is an item within a
college); twenty nine percent (66 out o f 224) o f the t-statistics were significant at the p< 0 .1 level.
We observed that the magnitude o f /3-bias is related to the percentage o f respondents who
rate the item. Items rated by fewer than 20% o f all measured students (Items 2, 3, 4, 8, 17, 18,
20, 22, and 23 in Table 2) had relatively large mean absolute /3-bias (.10 or larger). There were
ten items whose mean absolute /3-bias (Equation 7) was 0.1 or greater. Items rated by at least
half o f all measured respondents (on average; Items 1,6, 10, 13, 16, 19, and 21 in Table 2) had
relatively small mean absolute /3-bias (.05 or smaller).
Two informal criteria for consistency in the direction of an item’s /3-bias across colleges
were established using the results in Table 4. 1) An item’s /3-bias was deemed to be consistent
12
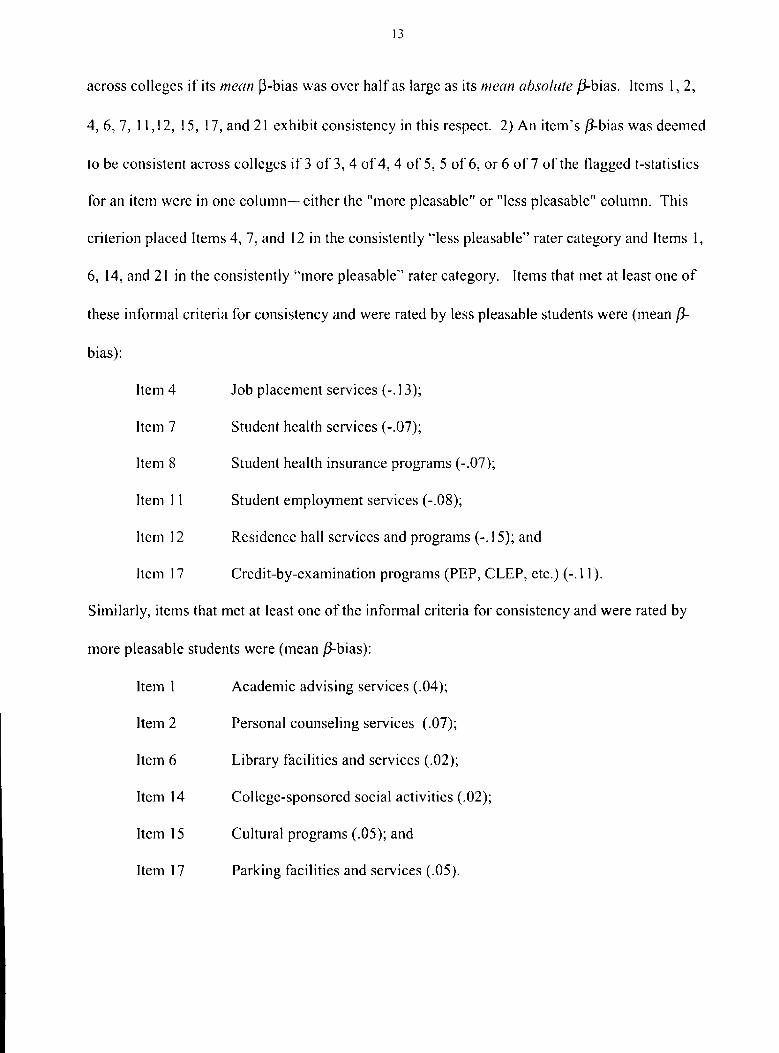
across colleges if its mean [3-bias was over half as large as its mean absolute /3-bias. Items I, 2,
4, 6, 7, 11,12, 15, 17, and 21 exhibit consistency in this respect. 2) An item’s /3-bias was deemed
to be consistent across colleges if 3 o f 3, 4 o f 4, 4 of 5, 5 of 6, or 6 o f 7 o f the flagged t-statistics
for an item were in one column— either the "more pleasable" or "less pleasable" column. This
criterion placed Items 4, 7, and 12 in the consistently “less pleasable” rater category and Items 1,
6, 14, and 21 in the consistently “more pleasable” rater category. Items that met at least one o f
these informal criteria for consistency and were rated by less pleasable students were (mean 13-
bias):
13
Item 4 Job placement services (-. 13);
Item 7 Student health services (-.07);
Item 8 Student health insurance programs (-.07);
Item 11 Student employment services (-.08);
Item 12 Residence hall services and programs (-. 15); and
Item 17 Credit-by-examination programs (PEP, CLEP, etc.) (-.11)
Similarly, items that met at least one o f the informal criteria for consistency and were rated by
more pleasable students were (mean /3-bias):
Item 1 Academic advising services (.04);
Item 2 Personal counseling services (.07);
Item 6 Library facilities and services (.02);
Item 14 College-sponsored social activities (.02);
Item 15 Cultural programs (.05); and
Item 17 Parking facilities and services (.05).
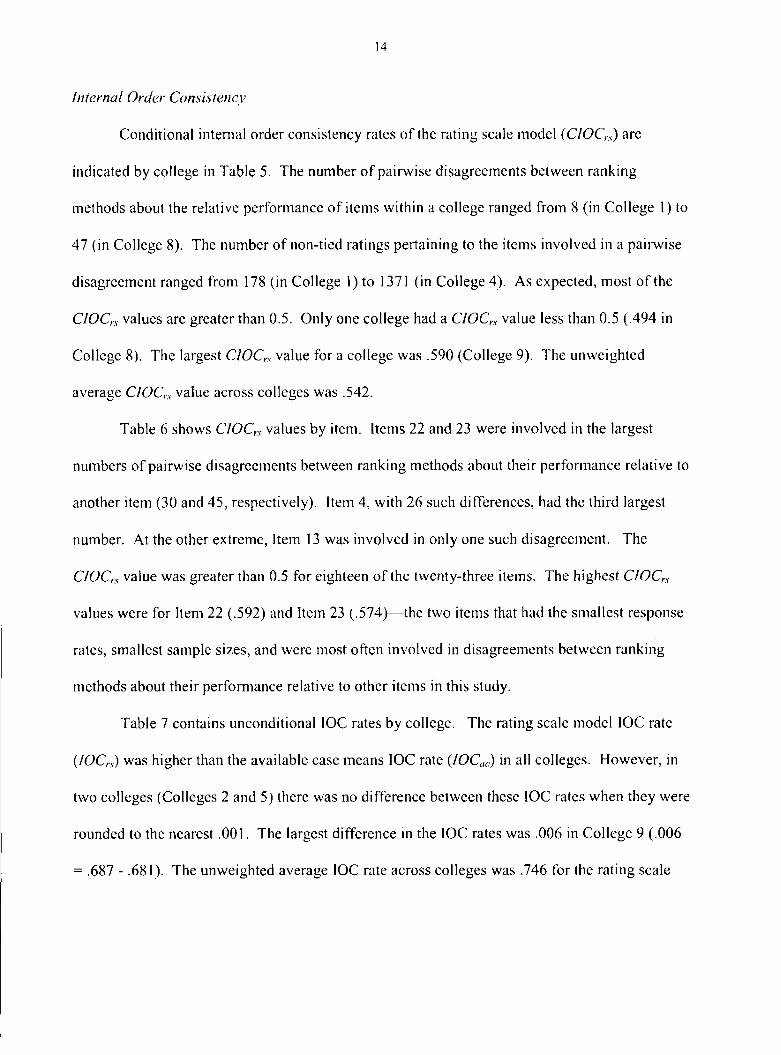
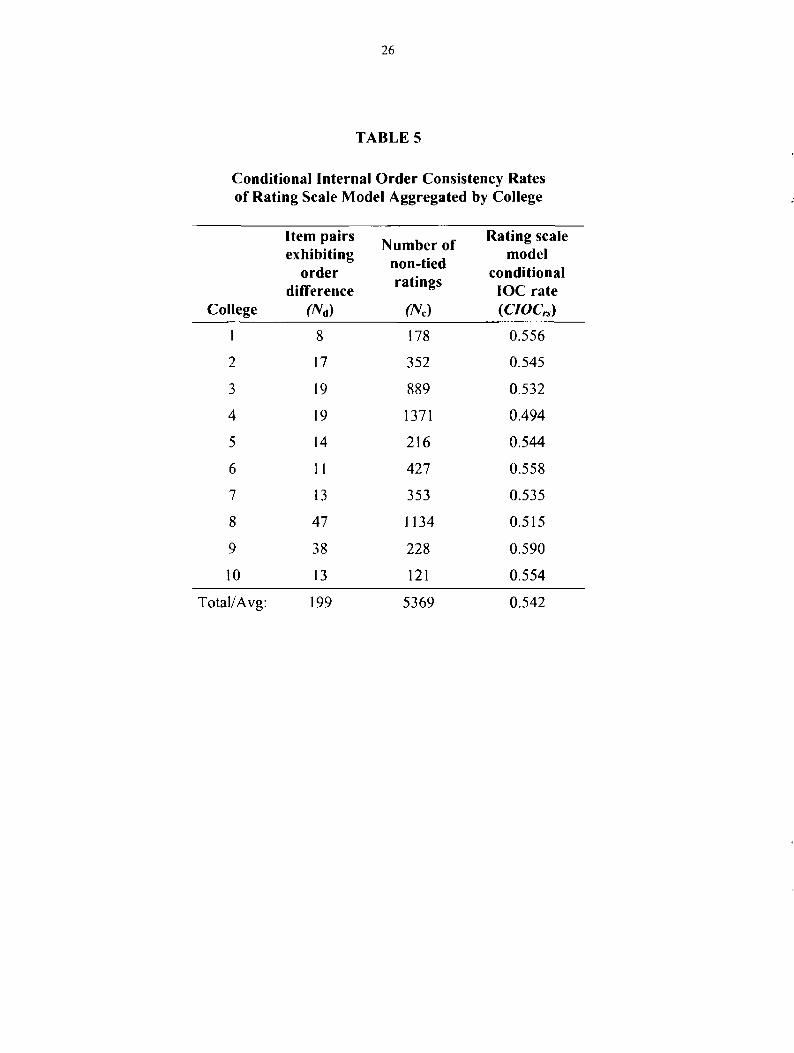
Internal Order Consistency
Conditional internal order consistency rates of the rating scale model (CIOCrs) are
indicated by college in Table 5. The number o f pairwise disagreements between ranking
methods about the relative performance o f items within a college ranged from 8 (in College 1) to
47 (in College 8). The number o f non-tied ratings pertaining to the items involved in a pairwise
disagreement ranged from 178 (in College 1) to 1371 (in College 4). As expected, most o f the
CIOC,s values are greater than 0.5. Only one college had a CIOCrs value less than 0.5 (.494 in
College 8). The largest CIOCrs value for a college was .590 (College 9). The unweighted
average ClOCvs value across colleges was .542.
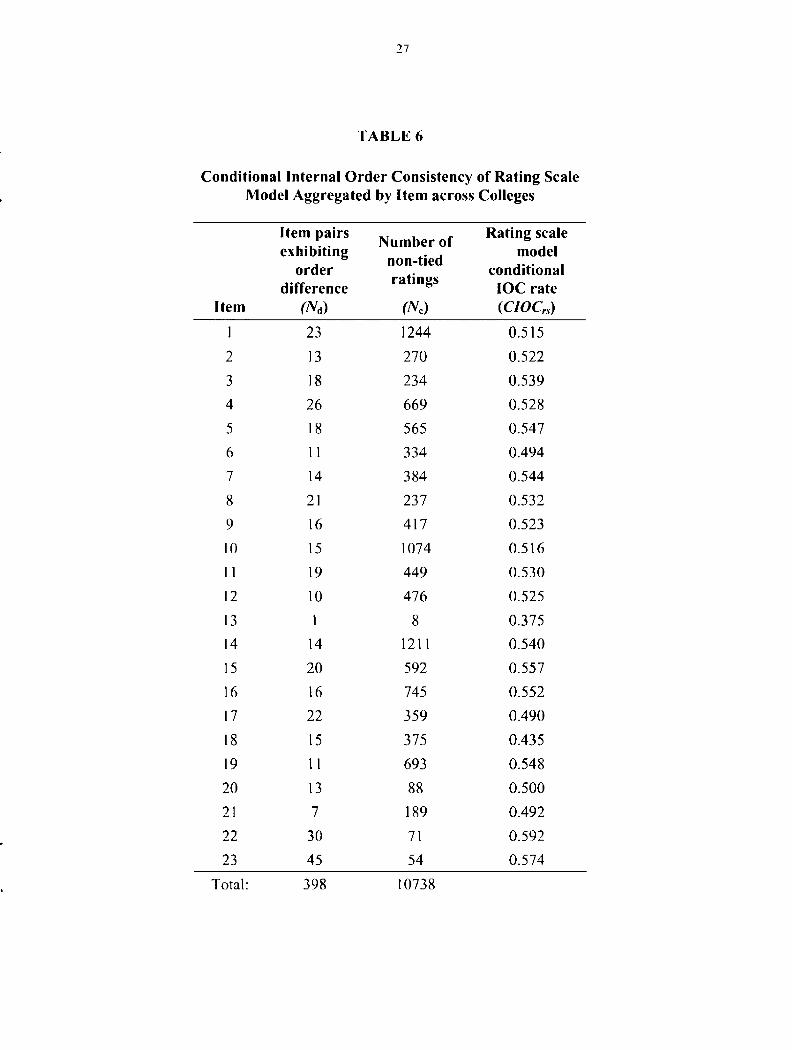
Table 6 shows CIOCrs values by item. Items 22 and 23 were involved in the largest
numbers of pairwise disagreements between ranking methods about their performance relative to
another item (30 and 45, respectively). Item 4, with 26 such differences, had the third largest
number. At the other extreme, Item 13 was involved in only one such disagreement. The
CIOCrs value was greater than 0.5 for eighteen o f the twenty-three items. The highest ClOCrs
values were for Item 22 (.592) and Item 23 (.574)— the two items that had the smallest response
rates, smallest sample sizes, and were most often involved in disagreements between ranking
methods about their performance relative to other items in this study.
Table 7 contains unconditional IOC rates by college. The rating scale model IOC rate
(lOCrs) was higher than the available case means IOC rate {IOCm) in all colleges. However, in
two colleges (Colleges 2 and 5) there was no difference between these IOC rates when they were
rounded to the nearest .001. The largest difference in the IOC rates was .006 in College 9 (.006
= .687 - .681). The unweighted average IOC rate across colleges was .746 for the rating scale
14
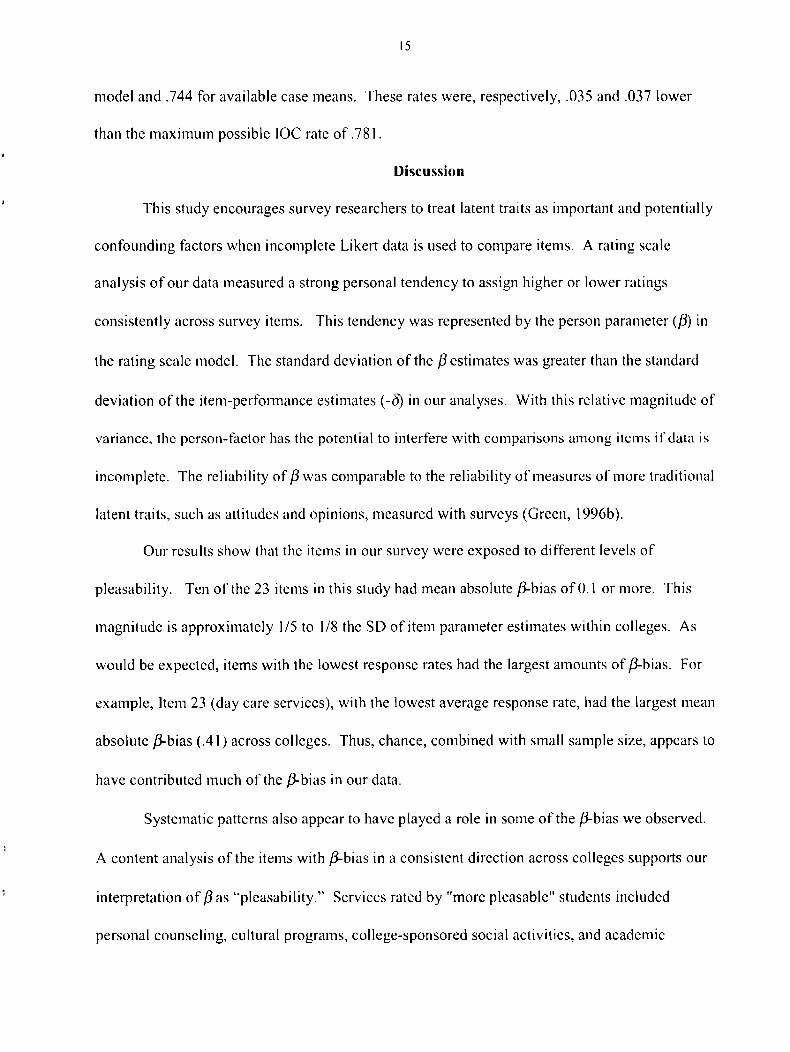
model and .744 for available case means. These rates were, respectively, .035 and .037 lower
than the maximum possible IOC rate o f .781.
Discussion
This study encourages survey researchers to treat latent traits as important and potentially
confounding factors when incomplete Likert data is used to compare items. A rating scale
analysis o f our data measured a strong personal tendency to assign higher or lower ratings
consistently across survey items. This tendency was represented by the person parameter (/3) in
the rating scale model. The standard deviation o f the /3 estimates was greater than the standard
deviation o f the item-performance estimates (-<5) in our analyses. With this relative magnitude of
variance, the pcrson-factor has the potential to interfere with comparisons among items if data is
incomplete. The reliability o f /3 was comparable to the reliability o f measures of more traditional
latent traits, such as attitudes and opinions, measured with surveys (Green, 1996b).
Our results show that the items in our survey were exposed to different levels o f
pleasability. Ten o f the 23 items in this study had mean absolute /3-bias o f 0.1 or more. This
magnitude is approximately 1/5 to 1/8 the SD o f item parameter estimates within colleges. As
would be expected, items with the lowest response rates had the largest amounts of /3-bias. For
example, Item 23 (day care services), with the lowest average response rate, had the largest mean
absolute /3-bias (.41) across colleges. Thus, chance, combined with small sample size, appears to
have contributed much o f the /3-bias in our data.
Systematic patterns also appear to have played a role in some o f the /3-bias we observed.
A content analysis o f the items with /3-bias in a consistent direction across colleges supports our
interpretation o f /3 as “pleasability.” Services rated by ’’more pleasable" students included
personal counseling, cultural programs, college-sponsored social activities, and academic
advising services. These services appear to serve more personal, as opposed to financial or
physical needs. Use o f these services may require trust, which seems to fit with a tendency to be
more pleasable. Services rated by less pleasable students included student employment services,
job placement services, and credit-by-examination programs. These services meet more
utilitarian needs. They may, therefore, be less dependent on trust for their usage, and therefore
less associated with pleasability.
The rank order o f items by rating scale analysis had higher internal order consistency
than the rank order by available case means. The rating scale model IOC rate, conditional on
pairwise disagreement with available case means about the relative performance o f items
(CIOCrs), was above 0.5 for most colleges and items. This means that the order given to any two
items by the rating scale analysis was more consistent with how the items were perceived by
persons who had experience with both items. Unconditional IOC rates by college (Table 7) have
a similar, but more consistent pattern. The rating scale model had the higher IOC rate in every
college.
Given the statistical significance o f /J-bias for many of the items, we would expect to find
generally higher IOC rates for the rating scale model on cross-validation. However, the
improvement over available case means might be smaller. The ranking o f items by rating scale
analysis involves more parameters than the ranking o f items by their available case means. It is
therefore possible that the rating scale model capitalizes on chance with respect to internal order
consistency.
The unconditional IOC rates o f this study differ in two important respects from those o f
Johnson (1997). First, the maximum rate in this study (.781) is smaller than that for Johnson's
course grade data (.869). This difference suggests to us that students are differentiated better and
16
more consistently by course grades than college services are differentiated by satisfaction
ratings. Second, the improvement over available case means in our study (.002 from .744 to
.746) is smaller. Johnson reported an improvement o f .038 (from .794 to .832). This difference
suggest to us that achievement and course-taking patterns (Johnson’s data) interact more strongly
than does pleasability with usage of college services. In course grade data, a systematic
pattern— the tendency o f higher ability students to take more difficult courses— specifically
degrades comparability of available case means (grade point averages). No such pattern is
evident in our study. That is, we do not see that more pleasable students tend to use lower-
performing services. Johnson did not measure conditional IOC rates.
Although our improvement in unconditional IOC rate seems small, the change in rank
order (from available case means to rating scale model rank) could be very important to the staff
associated with a given service or college, especially if administrative decisions are going to be
based on the service rankings. Forty-seven changes in the relative performance o f items taken
pairwise in College 8 seems quite substantial. Twenty-six changes in the performance o f Item 4
(job placement services) relative to other items is also a substantial number.
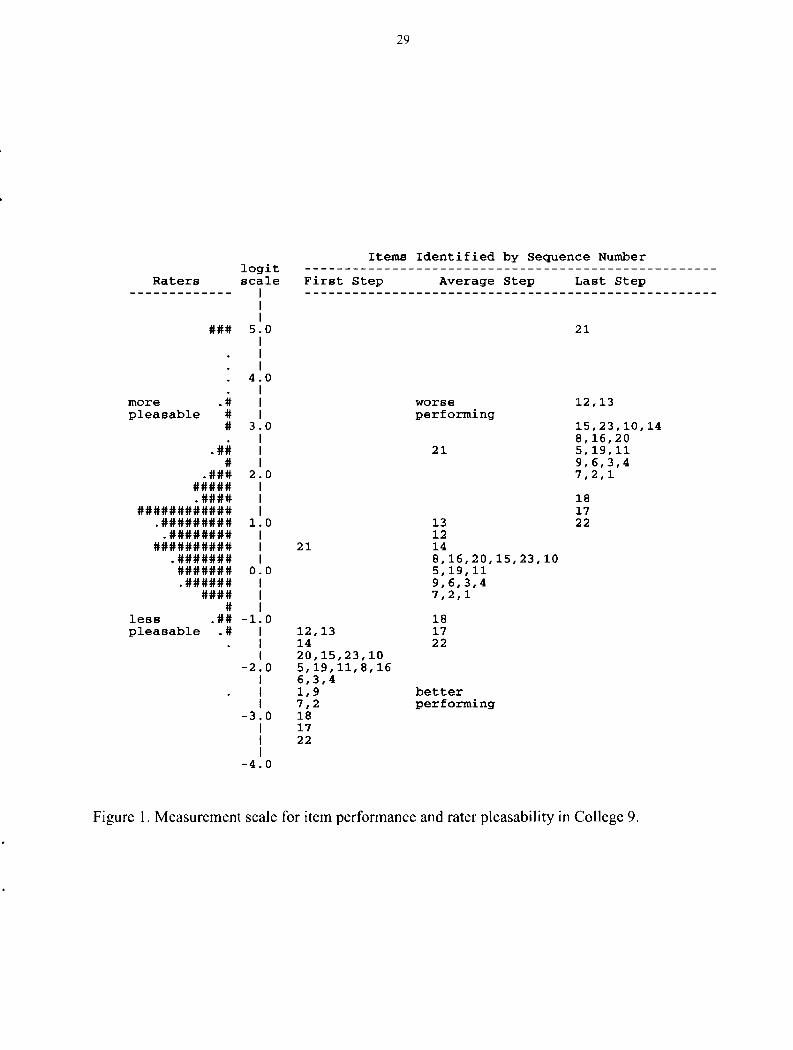
Parametric measures o f item performance might ultimately prove to be o f greater value to
survey users than improvements in the rank ordering of items. Rank order does not provide a
complete picture o f item performance. This point is illustrated in Figure 1 by the arrangement o f
persons and items on the latent variable scale for College 9. Differences among items are
illustrated by any one of the three item-difficulty histograms in Figure 1. From left to right,
these three histograms illustrate respectively 1) the item-difficulty o f the first step, S,+T/, i.e.,
deciding that one is at least not "very dissatisfied" with a service; 2) the average item-difficulty
(which is 8j because the sum of the step difficulties sum to zero); and 3) the item-difficulty o f the
last step, 8j+ T4. i.e., deciding that one is "very satisfied” rather than merely "satisfied" with the
service.
It can be seen, for example, that Items 21 and 13 differ by only one in rank order, yet
differ by a large amount on the <5 metric. The exact amount is 1.56 logits or log-odds units.
Conversely, Items 8 and 10 can be seen in Figure 1 as differing by five in rank order, but by no
more than 0.2 in <5. [These items are shown to be separated by four items within the same interval
in one o f the item-histograms (5„), with intervals 0.2 logits wide.]
We conclude that a rating scale analysis would improve comparisons among college
services in the SOS survey. Compared to available case means, a rating scale analysis controlled
for pleasability and improved rank-order comparisons among items, as measured by the internal
order consistency o f their rank. This was a modest, but fundamental improvement. Having
established improvement, or at least comparability, in ordinal comparisons among items, one is
in a stronger position to consider parametric comparisons among items using the rating scale
model.

19
References
ACT (1997). Student Opinion Survey. Iowa City, Iowa: ACT.
Andrich, D. (1978). A rating formulation for ordered response categories. Psychometrika, 43 ,
561-573.
Bergstrom, B. A. & Lunz, M. R. (1998). Measuring jo b satisfaction: reliability o f subscale
analysis. Paper presented at the annual meeting o f the American Educational Research
Association. San Diego, CA.
Bradlow, E. T., & Zaslavsky, A. M. (1999). A hierarchical latent variable model for ordinal data
from a consumer satisfaction survey with "No Answer" responses. Journal o f the American
Statistical Association , 94(445), 43-52.
Brady, H. E. (1989). Factor and ideal point analysis for interpersonally incomparable data.
Psychonietrica, 54, 181 -202.
Bode, R. K. (1995). Using Rasch to create measures from survey data. Paper presented at the
annual meeting o f the American Educational Research Association, San Francisco, CA.
Cronbach, L. J. (1946). Response sets and test validity. Educational and Psychological
Measurement, 6, 474-494.
Duncan, O.D. (1984a). Measurement and structure: strategies for the design and analysis of
subjective survey data. In C. F. Turner & E. Martin (Eds.), Surveying Subjective
Phenomena, Volume 1, (pp 179-229). New York: Russell Sage Foundation.
Duncan, O.D. (1984b). Rasch measurement in survey research: Further examples and
discussion. In C. F. Turner & E. Martin (Eds.), Surveying Subjective Phenomena, Volume 2,
(pp 367-403). New York: Russell Sage Foundation.
Edwards, A. L. (1953). The relationship between the judged desirability o f a trait and the
probability that the trait will be endorsed. Journal o f Applied Psychology, 37(2), 90-93.
Edwards, J. L., Green, K. E. & Lyons, C. A. (1996). Factor and Rasch analysis o f the School
Culture Survey. Paper presented at the annual meeting o f the American Educational
Research Association, New York, NY.
Englehard, G. Jr. (1992). The measurement o f writing ability with a many-faceted Rasch model.
Applied M easurement in Education, 5, 171-191.
Green, K. E. (1996a). Applications o f the Rasch model to evaluation o f survey data quality. In
M.T. Braverman & J.K. Slater (Eds.), Advances in Survey Research (pp 81-92). Number 70.
San Francisco: Jossey-Bass.
Green, KL. E. (1996b). The Use o f Person Fit Statistics in M ail Surveys, Paper presented at the
annual meeting o f the American Educational Research Association. New York, NY.
Johnson, V. E. (1997). An alternative to traditional GPA for evaluating student performance.
Statistical Science, 12, 251-278.
Linacre, J. M. (1999). Understanding Rasch measurement: Estimation methods for Rasch
measures. Journal o f Outcome Measurement, 4, 382-405.
Little, R. J. A. & Rubin, D. B. (1987). Statistical analysis with missing data. New York: John
Wiley & Sons.
Lunz, M. E., Wright, B. D., & Linacre, J. M. (1990). Measuring the impact o f judge severity on
examination scores. Applied Measurement in Education, 3, 331-345.
Lyerla, R. L., & Elmore, P. B. (April, 1996). Predicting academic success: An application o f
Young’s universal scale fo r grades. Paper presented at the Annual Meeting o f the American
Educational Research Association, New York, NY.
Sun, A., & Schulz, E. M. (1999). Rank ordering and comparing survey items using an IRT
Rating Scale Model. Paper presented at the annual meeting o f the American Educational
Research Association. Montreal, Canada.
Sun, A., & Schulz, E. M. (2000). A rating scale model procedure fo r comparing institutions
with incomplete Likert data. Paper presented at the annual meeting of the American
Educational Research Association. New Orleans, LA.
Swearingen, D. L. ( 1998). Extreme responding style and the conreteness-ahstractness
dimension. Paper presented at the Annual Meeting o f the American Educational Research
Association. San Diego, CA.
Wang, X., Wainer, H., & Thissen, D. (1995). On the viability o f some untestable assumptions in
equating exams that allow examinee choice. Applied Measurement in Education, 8, 21 1-225.
Wright, B. D. & Masters, G. N. (1982). Rating Scale Analysis. Chicago: MESA Press.
Wright, B. D. & Linacre, J. M. (1991). Bigsteps. A Rasch-model computer program. Chicago:
MESA Press.
Young, J. W. (1990). Adjusting the cumulative GPA using item response theory. Journal o f
Educational Measurement, 27, 175-186.
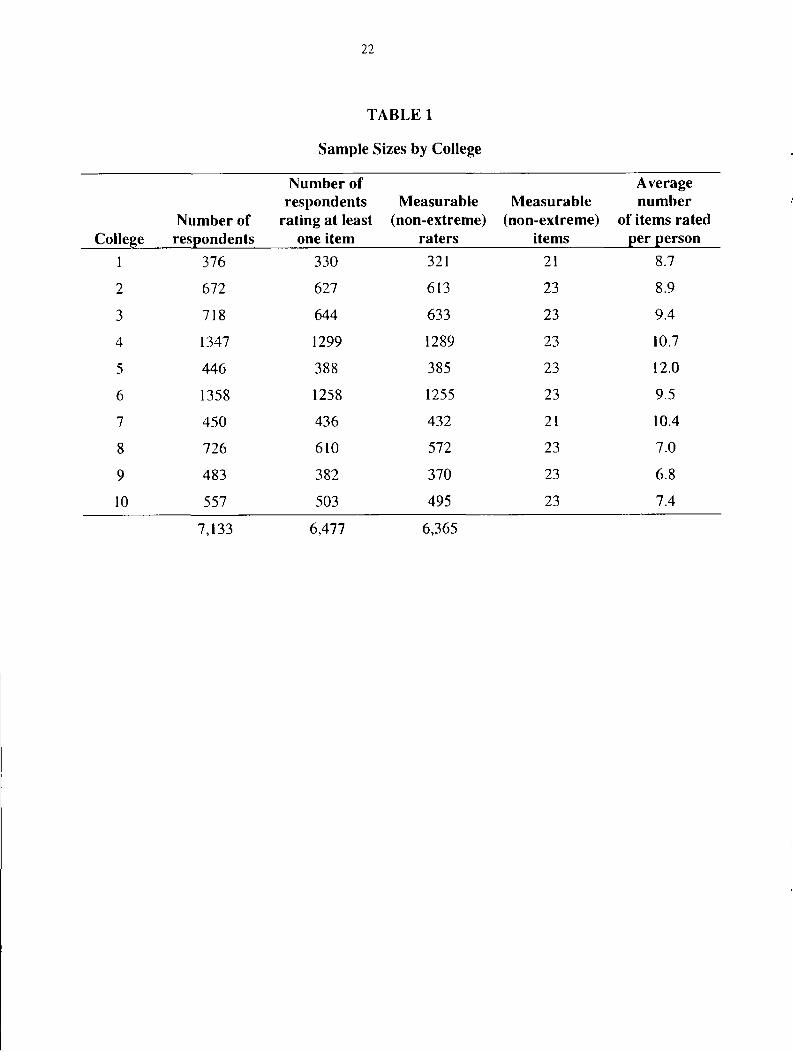
TABLE 1
Sample Sizes by College
CollegeNumber of
respondents
Number of respondents
rating at least one item
Measurable(non-extreme)
raters
Measurable(non-extreme)
items
Average number
of items rated per person
1 376 330 321 21 8.7
2 672 627 613 23 8.9
3 718 644 633 23 9.4
4 1347 1299 1289 23 10.7
5 446 388 385 23 12.0
6 1358 1258 1255 23 9.5
7 450 436 432 21 10.4
8 726 610 572 23 7.0
9 483 382 370 23 6.8
10 557 503 495 23 7.4
7,133 6,477 6,365
23
TABLE 2
Institutional Sample Sizes by Item
ItemNumber of
respondentsPercent of
respondentsSeq. Text Min Avg Max Min Avg Max
1 Academic advising services 255 541 1151 52.8 73.9 89.1
2 Personal counseling services 30 110 207 5.4 15.6 29.4
3 Career planning services 50 140 361 9.0 19.5 35.7
4 Job placement services 35 88 260 5.2 11.6 19.3
5 Recreational and intramural programs and services 84 328 875 16.5 42.0 79.3
6 Library facilities and services 310 606 1254 72.3 83.6 93.1
7 Student health services 51 314 857 10.6 42.2 70.9
8 Student health insurance program 13 110 276 2.7 16.8 54.9
9 College-sponsored tutorial services 85 152 277 14.2 23.0 54.9
10 Financial aid services 255 421 822 46.0 61.5 75.8
11 Student employment services 80 178 360 15.6 24.6 33.4
12 Residential hall services and programs 19 338 871 3.9 42.6 64.7
13 Food services 200 456 1009 42.5 61.5 75.1
14 College-sponsored social activities 86 319 676 17.8 44.5 71.5
15 Cultural programs 50 143 254 10.4 21.3 54.5
16 College orientation program 174 423 974 28.4 57.2 88.4
17 Credit-by-examination program (PEP, CLEP, etc.) 21 61 178 3.1 8.7 24.7
18 Honors programs 20 87 166 5.3 12.9 28.7
19 Computer services 226 530 1205 42.1 72.3 92.7
20 College mass transit services 4 145 877 0.7 13.8 65.1
21 Parking facilities and services 66 485 1082 13.7 64.2 83.1
22 Veterans services 1 15 39 0.2 2.0 5.4
23 Day care services 1 8 22 0.2 1.2 3.9
24
Summary Statistics for Person Measures and Item Calibrations
TABLE 3
Person measures___________ Item calibrations________Standard Standard
College deviation Reliability deviation Reliability1 LOO .73 .52 .92
2 .89 .68 .56 .91
3 .99 .77 .59 .92
4 .81 .73 .57 .96
5 .87 .79 .74 .96
6 .85 .71 .67 .97
7 .80 .72 .56 .89
8 1.00 .59 .46 .69
9 1.09 .66 .79 .74
10 .85 .64 .61 oo oo
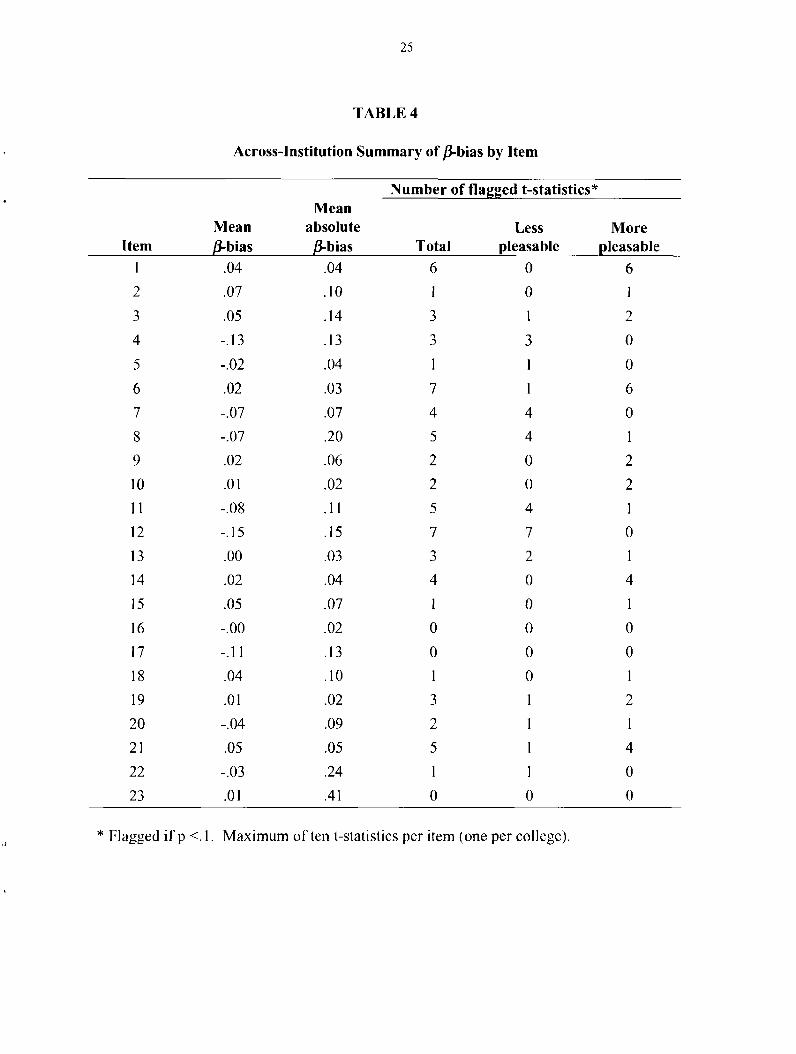
TABLE 4
Across-Institution Summary of /J-bias by Item
ItemMean/3-bias
Number of flagged t-statistics*Mean
absolute0-bias Total
Lesspleasable
Morepleasable
1 .04 .04 6 0 6
2 .07 .10 1 0 1
3 .05 .14 3 1 2
4 -.13 .13 3 3 0
5 -.02 .04 1 1 0
6 .02 .03 7 1 6
7 -.07 .07 4 4 0
8 -.07 .20 5 4 1
9 .02 .06 2 0 2
10 .01 .02 2 0 2
11 -.08 .11 5 4 1
12 -.15 .15 7 7 0
13 .00 .03 3 2 1
14 .02 .04 4 0 4
15 .05 .07 1 0 1
16 -.00 .02 0 0 0
17 -.11 .13 0 0 0
18 .04 .10 1 0 1
19 .01 .02 3 1 2
20 -.04 .09 2 1 1
21 .05 .05 5 1 4
22 -.03 .24 1 1 0
23 .01 .41 0 0 0
* Flagged if p < 1. Maximum o f ten t-statistics per item (one per college).
26
TABLE 5
Conditional Internal Order Consistency Rates of Rating Scale Model Aggregated by College
College
Item pairs exhibiting
order difference
M ,)
Number of non-tied ratings
m
Rating scale model
conditional IOC rate(CIOCrs)
1 8 178 0.556
2 17 352 0.545
3 19 889 0.532
4 19 1371 0.494
5 14 216 0.544
6 11 427 0.558
7 13 353 0.535
8 47 1134 0.515
9 38 228 0.590
10 13 121 0.554
Total/Avg: 199 5369 0.542
27
TABLE 6
Conditional Internal Order Consistency of Rating Scale Model Aggregated by Item across Colleges
Item
Item pairs exhibiting
order difference
M ,)
Number of non-tied ratings
f/Vc)
Rating scale model
conditional IOC rate(CIOCrs)
1 23 1244 0.515
2 13 270 0.522
3 18 234 0.539
4 26 669 0.528
5 18 565 0.547
6 11 334 0.494
7 14 384 0.544
8 21 237 0.532
9 16 417 0.523
10 15 1074 0.516
11 19 449 0.530
12 10 476 0.525
13 1 8 0.375
14 14 1211 0.540
15 20 592 0.557
16 16 745 0.552
17 22 359 0.490
18 15 375 0.435
19 11 693 0.548
20 13 88 0.500
21 7 189 0.492
22 30 71 0.592
23 45 54 0.574
Total: 398 10738

28
TABLE 7
Unconditional Internal Order Consistency Rates by Model
Model
CollegeBaseline(IOCmax)
Available-casemeans(IOCaJ
Rating scale model(IOCrs)
1 0.798 0.768 0.769
2 0.750 0.718 0.718
3 0.793 0.754 0.755
4 0.800 0.759 0.761
5 0.812 0.775 0.775
6 0.949 0.811 0.815
7 0.766 0.737 0.739
8 0.705 0.653 0.654
9 0.719 0.681 0.687
10 0.820 0.780 0.781
Avg: 0.781 0.744 0.746
29
Raters
morepleasable
Items Identified by Sequence Numberlogit ------------------------------------------------------scale First Step
###
.###
.###
.### 2 ##### .####
############ .######### 1
.######## ##########
.####### ####### 0 .######
#####
less .## -1pleasable .#
- 2
-3
- 4.0
Average Step Last Step
21
12,131420 , 15 , 23 ,10 5 , 19 , 11 , 8,166 , 3 ,4 1/9 7 ,2 1817 22
worseperforming
21
13 12148 , 16 , 2 0 , 15 , 23 ,105 , 19 ,119 , 6 , 3 ,47 , 2 ,1
181722
betterperforming
21
12,13
15 , 2 3 , 10,14 8 , 16,205 , 19 ,119 , 6 , 3,47 , 2 ,1
181722
Figure 1. Measurement scale for item performance and rater pleasability in College 9.