28
Controlling in the Wood Products Industry SS 2018 Albert Sickl

Controlling in the Wood Products Industry
SS 2018 Albert Sickl
Module 3Take aways from Module 2
25.05.20182
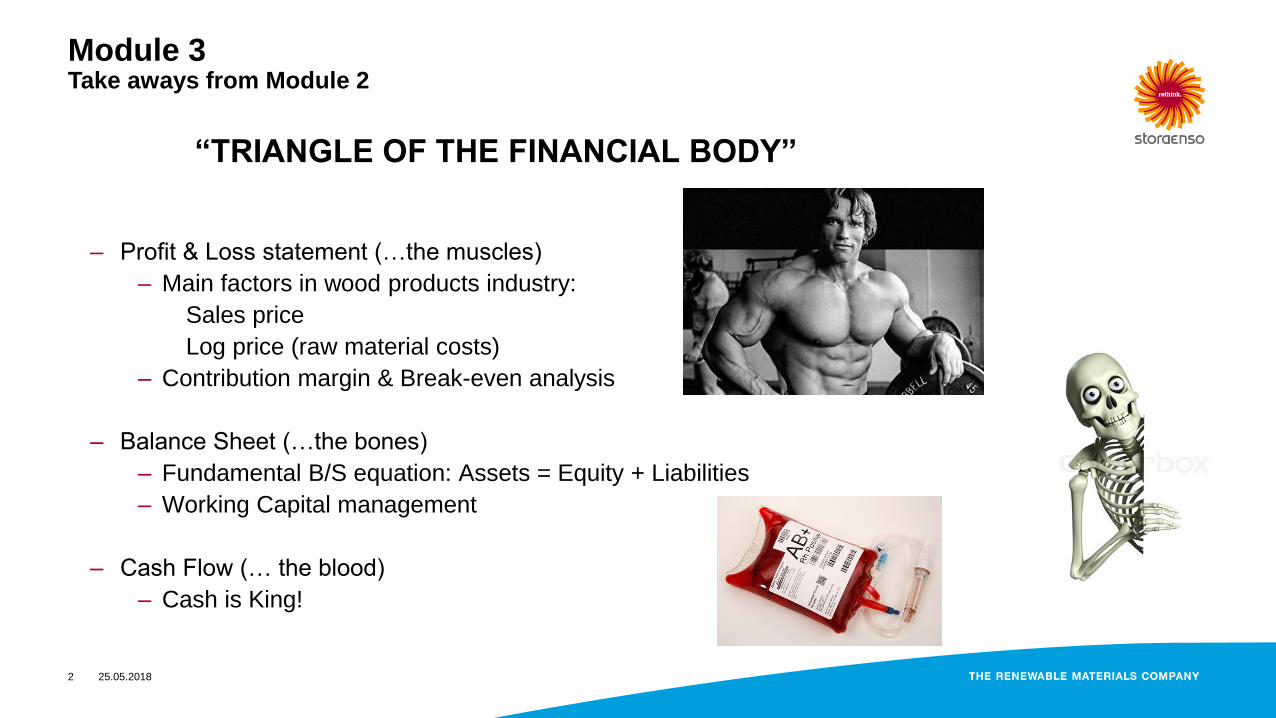
“TRIANGLE OF THE FINANCIAL BODY”
– Profit & Loss statement (…the muscles)
– Main factors in wood products industry:
Sales price
Log price (raw material costs)
– Contribution margin & Break-even analysis
– Balance Sheet (…the bones)
– Fundamental B/S equation: Assets = Equity + Liabilities
– Working Capital management
– Cash Flow (… the blood)
– Cash is King!

Module 3Take aways from Module 2
25.05.20183
– What is good for the P&L?
– Break-even analysis showed that a volume change has not
such a big effect on results as a price change (due to variable
costs)!
– What is good for the Cash Flow?
– A high operative result from the P&L of course.
– Efficient working capital management:
– Reduction of stock has a positive effect on the CF
– Reduction of receivables has a positive effect on the CF
– Increase of payables has a positive effect on the CF
– Effective investment policy

Module 3Take aways from Module 2
25.05.20184
– From Operations to Profits to Asset based Profitability
– ROCE is based on Strategic Drivers (Costs, Working Capital,
Sales drivers (Volume, Price, Mix).
– Improve ROCE by increasing EBIT and/or decreasing capital
employed.
– EVA = (ROCE – WACC) x Capital Invested
– Financial Concepts
– Efficiency in value creation (ROCE > WACC)
– Strength to cope with uncertainty (D/E, Equity ratio)
– Ability to reward stakeholders (Cash)

Module 3
Reporting, Forecasting & Budgeting – Overview
25.05.20185
– Reporting, Forecasting, Budgeting
– Looking back: Reporting of past events
– Looking ahead: Short-term forecasting & Budgeting
– Looking far ahead: Long-term forecasts
– Scenarios

Module 3
Reporting, Forecasting & Budgeting
25.05.20186
“ The controller is not the commander of the ship – that is the task
of the chief executive – but he may be likened to the navigator, the
one who keeps the charts. He must keep the commander informed
as to how far he has come, where he is, what speed he is making,
resistance encountered, variations from the course, dangerous
reefs which lie ahead, and where the charts indicate he should go
next in order to reach the port in safety.”¹
¹ Heckert, J.B. & Willson, J.D., 1952, Controllership – The work of the Accounting Executive, New York, Roland Press, 645pp.

Module 3
Reporting, Forecasting & Budgeting
25.05.20187
Looking back: Reporting of past events

Module 3
Reporting, Forecasting & Budgeting
25.05.20188
– Collection, processing, storage of information…
– …for all levels of management (top management – middle
management – unit management)
– Financial Reporting (P&L, B/S, CF)
– Cost centre reporting
– Working Capital reporting
– Production reporting
– Capex reporting
– …

Module 3
Reporting, Forecasting & Budgeting
25.05.20189
– What makes a report good & efficient to use?
– Clear to the audience and easy to interpret
– Possibility to drill down (automation)
– Graphs
– Trends, Targets / Goals (e.g. 3-months outlook)
– Indices
– Recommendations ( making decisions)
– …

Module 3
Reporting, Forecasting & Budgeting
25.05.201810
Looking ahead: Short-term forecasting & Budgeting

Module 3
Reporting, Forecasting & Budgeting
25.05.201811
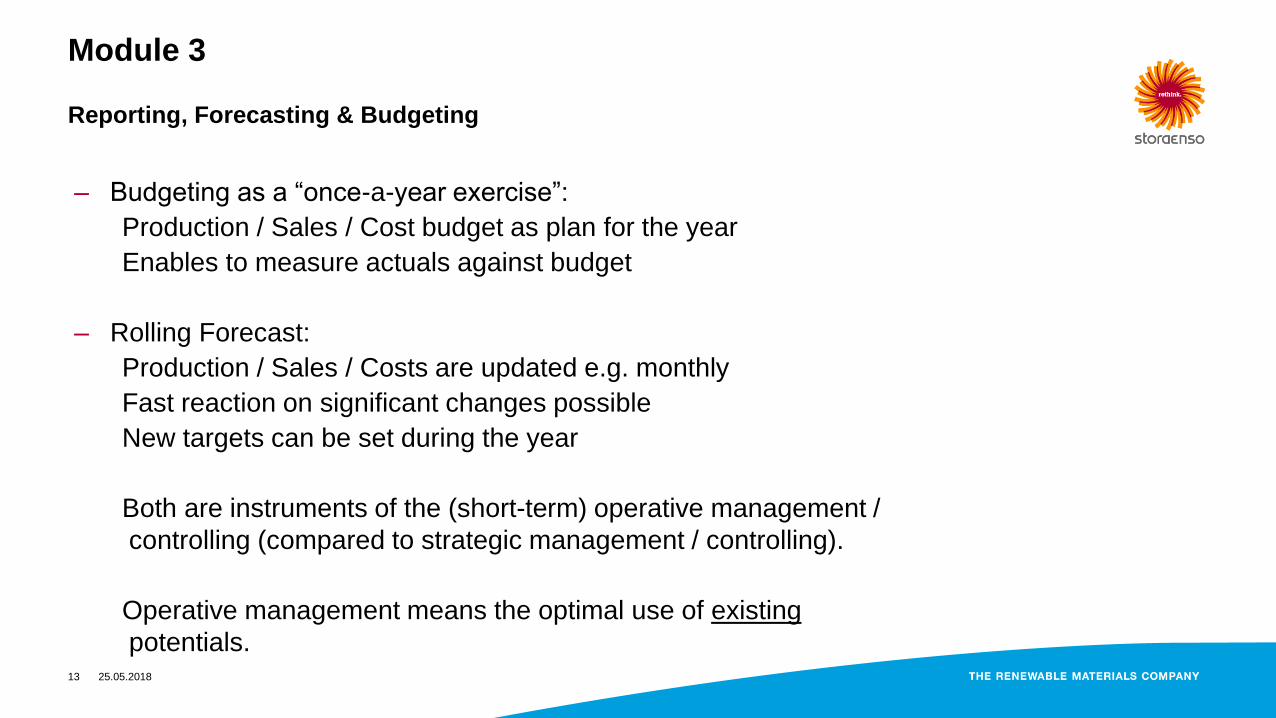
– Budgeting as a “once-a-year exercise”:
Production / Sales / Cost budget as plan for the year
Enables to measure actuals against budget

Module 3
Reporting, Forecasting & Budgeting
25.05.201812
Cost Center/Group 6871313 Controlling CE
Cost Element Group AT-BUD-08
Cost elements Costs 1-8/2015 EST 1-12/2015 Costs 1-12/2014 BUD 2015 BUD 2016
Wages & Salaries 610000 Wages & salaries pai 174.614,42
610030 Holiday pay, clerica 19.669,10
614020 Bonuses,PBRS, mgt bo -5.177,18
614030 Bonuses,PBRS paid Cl 12.920,40
615000 Clerical personnel, 7.913,54
615220 Prov.for hol.clerica -1.203,73
620000 Pension insurance co 1.011,09
630350 Oth p-e def ben,gene 5.106,48
640000 Social security cont 38.641,95
640210 Add. costs cle.pers. 444,41
653100 Statutory emp. con 9.669,56
654100 Statutory emp. adds. 859,48
655200 Local tax 6.446,37
Wages & Salaries Total 270.915,89 362.502,23 338.763,34 372.000,00 357.000,00
Training Costs SGA 763010 Training 45,00
Training Costs SGA Total 45,00 67,50 2.300,00 3.000,00 3.000,00
Travelling Costs 760000 Travel expenses 7.044,17
Travelling Costs Total 7.044,17 10.566,26 5.916,43 7.000,00 10.000,00
Module 3
Reporting, Forecasting & Budgeting
25.05.201813
– Budgeting as a “once-a-year exercise”:
Production / Sales / Cost budget as plan for the year
Enables to measure actuals against budget
– Rolling Forecast:
Production / Sales / Costs are updated e.g. monthly
Fast reaction on significant changes possible
New targets can be set during the year
Both are instruments of the (short-term) operative management /
controlling (compared to strategic management / controlling).
Operative management means the optimal use of existing
potentials.

Module 3
Reporting, Forecasting & Budgeting
25.05.201814
– Instruments of operative planning the magic triangle regarding the financial
body:
Profit & Loss Statement (…the muscles)
Balance Sheet (…the bones) Cash Flow (…the blood)
KPIs

Module 3
Reporting, Forecasting & Budgeting
25.05.201815
– Instruments of operative planning the magic triangle regarding the
financial body:
Profit & Loss Statement (…the muscles)
Balance Sheet (…the bones) Cash Flow (…the blood)
Sub plans: Sales plan, Production plan, Cost-centre budgets, Personnel,…
KPIs
PlanGuV
FinanzplanPlanbilanz

Module 3
Reporting, Forecasting & Budgeting
25.05.201816
Strategic Planning on
Corporate-, Business-, Functional level
Degre
e o
f A
bstr
action
Pla
nnin
g H
orizon
Deta
ils
Feedback
Mission Statement
Strategy
Operative Planning, -
Targets
Operative Budgets
http://www.mahindra.com/about-us/brand

Module 3
Reporting, Forecasting & Budgeting
25.05.201817
Looking far ahead: Long-term forecasts

Module 3
Reporting, Forecasting & Budgeting
25.05.201818
“We have two classes of forecasters: Those who don't know – and
those who don't know they don't know.” John Kenneth Galbraith
• Long-term plans usually cover a period of three to five years.
• Degree of abstraction is higher and details less important.
• Updated once or twice per year.
• Consisting of a base-case and several scenarios/development cases.
Forecasting that is objective and quantitative has the potential to help
almost any business; accurate business forecasting is a value-added
undertaking.¹
¹ Hirschey, Pappas: Managerial Ecomomics; 1996; p. 268

Module 3
Reporting, Forecasting & Budgeting
25.05.201819
Scenarios

Module 3
Reporting, Forecasting & Budgeting
25.05.201820
“Although it is surprisingly hard to create good scenarios, they help you
ask the right questions and prepare for the unexpected. That is
hugely valuable.”¹
“Whatever inspiration is, it comes from a continuous “I don´t know”.”²
¹ Charles Roxburgh; The use and abuse of scenarios; McKinsey Quarterly; 2009
² Wislawa Szymborska

Module 3
Reporting, Forecasting & Budgeting
25.05.201821
The power of scenarios¹:
Scenarios enable the strategist to steer a course between the false
certainty of a single forecast and the confused paralysis that often strike
in troubled times.
• Scenarios expand your thinking.
• Scenarios uncover inevitable or near-inevitable futures.
1) Demography is destiny; 2) “You canna change the laws of economics!”;
3) “Trees don´t grow to the sky”; 4) Scheduled events may fall beyond typical
planning horizons;
• Scenarios protect against “groupthink”.
• Scenarios allow people to challenge conventional wisdom.
¹ Charles Roxburgh; The use and abuse of scenarios; McKinsey Quarterly; 2009

Module 3
Reporting, Forecasting & Budgeting
25.05.201822
¹ Charles Roxburgh; The use and abuse of scenarios; McKinsey Quarterly; 2009
• Common traps in using scenarios¹:
• Don't become paralyzed.
“Deer in the headlights”
• Don't let scenarios muddy communications.
“Leaders can use scenarios without abdicating their leadership
responsibilities but should not communicate with the
organization via scenarios”
• Don't rely on an excessively narrow set of outcomes.
“We are typically too optimistic going into a downturn and too
pessimistic on the way out…..When the economy is heading
into a downturn, pessimistic scenarios should always be
pushed beyond what feels comfortable.”

Module 3
Reporting, Forecasting & Budgeting
25.05.201823
¹ Charles Roxburgh; The use and abuse of scenarios; McKinsey Quarterly; 2009
• Common traps in using scenarios¹:
• Don't chop the tails off the distribution.
“[Leaders] tend to choose one or two [scenarios] immediately
to the right and left of reality. stretch scenarios”
• Don't discard scenarios too quickly.
“Scenarios get better if revised over time.”
• Remember when to avoid scenarios altogether.
“…when uncertainty is so great that they cannot be build
reliably at any level of detail.”

Module 3
Reporting, Forecasting & Budgeting
25.05.201824
•Szenario 1:
•Marktvolumen bleibt konstant, Netmill aufgrund schwacher Konjunktur & niedrigem Ölpreis: -5%, +2%,+2%,+2%;
Supplied Sawn Goods bleiben auf 2017er Niveau; Fixkosten / Variable Kosten +2% p.a.
•Szenario 2:
•Marktvolumen : -5%, +2%,+2%,+2%; Netmill bleibt auf 2017er Niveau; Supplied Sawn Goods auf 2017er Niveau;
Fixkosten / Variable Kosten +2% p.a.
•Szenario 3:
•Marktvolumen bleibt konstant, Netmill bleibt auf 2017er Niveau; Supplied Sawn Goods und Fixkosten / Variable
Kosten +2% p.a.
•Szenario 4:
•Marktvolumen bleibt konstant, Netmill & Supplied Sawn Goods aufgrund schwacher Konjunktur & niedrigem
Ölpreis: -5%, +2%,+2%,+2%; Fixkosten / Variable Kosten +2% p.a.

Module 3
Variance Analysis
25.05.201825
– Having established a budget or rolling forecast (planning), it is the control that ensures
the realisation of targets.
Planned Targets Execution Realised Results
Variance Analysis
– Variances can have their reason in the planning (wrong / unrealistic targets, buffers) or
in the execution (targets not prioritized and followed, mistakes, intentional mistakes).
– Variance analysis supports to lead employees towards a targeted outcome.
– Variance analysis provides info for steering the business.
– Variance analysis helps to improve estimation and execution.
– Variance analysis is a basis for correcting mistakes.

Module 3
Variance Analysis
25.05.201826
Definition of Objectives
Measurement of
planned and realized
targets
Comparison of planned
vs. realized figures
Analysis of Variances
Proposal of correctional
actions or revision of
targets.
Co
ntr
ol in
a n
arr
ow
er
se
nse
Co
ntr
ol in
a w
ide
r se
nse
CO
NT
RO
LL
ING

Module 3
Variance Analysis
25.05.201827
(Act-Est Invoicing Price) * Actual Invoicing Volume
(Act-Est Invoicing Volume) * Actual Margin
(Act-Est calculated Price) * Actual calculated Volume
(Act-Est Log Price) * Actual Log Consumption
(Delta Yield * Log consumption) * Net rawmaterial cost / m³
Inventory Volume * Act-Est Valuation
Act var costs per m³ - Est var costs per m³ * Act Sales production
(Actual fixed costs – Estimated fixed costs (per category)
(Act-Est Sawn production Volume) * Actual Margin
(Act-Est Sales production Volume) * Actual Margin
(Actual depreciation – Estimated depreciation
Sales Differences:
Sales Price:
Sales Volume:
Income of by-products:
Raw material:
Raw material price:
Yield:
Inventory value:
Variable Costs (excl log costs):
Fixed costs:
Wages & Salaries
Maintenance
HQ costs
Other income internal
Other fixed costs
Production volume:
Sawn Production
Sales Production
Depreciation:
Other variances:
Total variance:
188.149
-53.003
-205.824
-70.678
189.437
92.140
281.577
-48.363
29.925
-26.659
25.947
-165.759
0
29.921
-136.549
-7.729
-3.966
-11.695
32.268
43.794
120.279

Module 3
Reporting, Forecasting & Budgeting
25.05.201828


