Controlling Indirect Selection under Healthcare Reform BY TIA GOSS SAWHNEY B.S.E., University Of Pennsylvania, Philadelphia, 1986 M.G.A., University of Pennsylvania, Philadelphia, 1992 THESIS Submitted as partial fulfillment of the requirements for the degree of Doctor of Public Health in the School of Public Health of the University of Illinois at Chicago, 2012 Chicago, Illinois
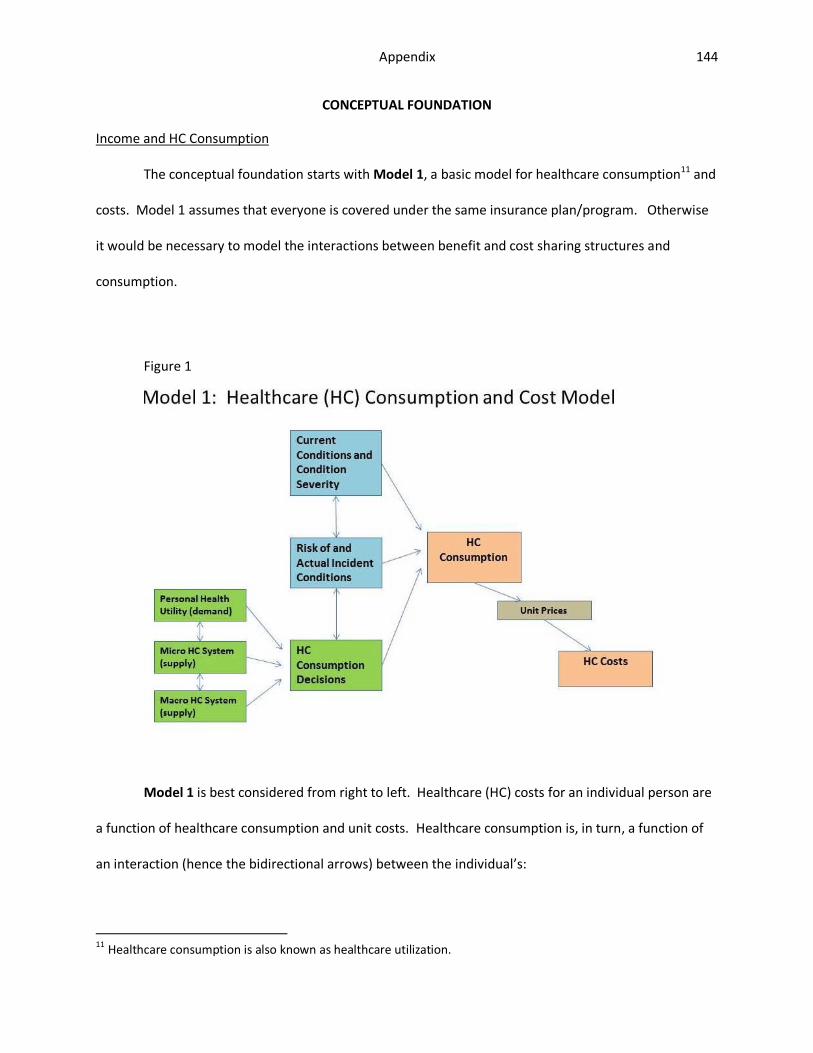
Transcript
Controlling Indirect Selection under Healthcare Reform
BY
TIA GOSS SAWHNEY B.S.E., University Of Pennsylvania, Philadelphia, 1986 M.G.A., University of Pennsylvania, Philadelphia, 1992
THESIS
Submitted as partial fulfillment of the requirements for the degree of Doctor of Public Health
in the School of Public Health of the University of Illinois at Chicago, 2012
Chicago, Illinois
iii
“I want to become a thought leader for public and private healthcare finance systems, using my
leadership to help build quality systems and to communicate reasonable expectations.”
Tia Goss Sawhney
March 2008, DrPH Application, Statement of Purpose, First Sentence
iv
ACKNOWLEDGEMENTS
I am thankful for support from the Center for Disease Control and Prevention (CDC) Training
Program Grant # 1 T01 CD000189-01 and the Society of Actuaries (SOA) James C. Hickman Scholar
Doctoral Stipend Program.
TGS
v
TABLE OF CONTENTS
CHAPTER PAGE
I. INTRODUCTION ............................................................................................................................. 1
II. Selection and Adverse Selection .................................................................................................... 4 A. Selection and Adverse Selection ..................................................................................... 4 B. Pre-Healthcare Reform Balanced Selection ..................................................................... 7 C. Direct Selection .............................................................................................................. 9 D. Indirect Selection ......................................................................................................... 11 E. Individual Insurers vs. The Collective ............................................................................ 13 F. Consumers Demand Change ......................................................................................... 15 G. Other Changes to Balance the System .......................................................................... 16 H. Risk Adjustment .......................................................................................................... 19
I. Deciding to Select ......................................................................................................... 37 J. Social Costs .................................................................................................................. 40
III. INDIRECT SELECTION UNDER HEALTHCARE REFORM ................................................................... 45
A. Intent ........................................................................................................................... 45 B. Consumer Marketing Data ............................................................................................ 48 C. Predictive Model Recipes ............................................................................................. 53 D. Selection Touch Points ................................................................................................. 58
1. Conceptual Model............................................................................................ 58 2. System Perspective .......................................................................................... 61
E. Market Segmentation ................................................................................................... 62 F. Academic Shortcomings ............................................................................................... 63 G. Neighborhoods ............................................................................................................. 65 H. Income ......................................................................................................................... 67 I. The Game .................................................................................................................... 67
IV. PUBLIC POLICY CHALLENGES........................................................................................................ 71
A. Regulating the Invisible ................................................................................................ 71 B. Legitimate Ambiguity ................................................................................................... 72 C. Asymmetrical Challenge ............................................................................................... 73 D. Moving Target .............................................................................................................. 74 E. Appropriate Incentives ................................................................................................. 74 F. Regulatory Costs........................................................................................................... 75 G. Political Acceptability ................................................................................................... 75 H. Regulatory Resources ................................................................................................... 77
V. CONTROLLING INDIRECT SELECTION ............................................................................................ 78
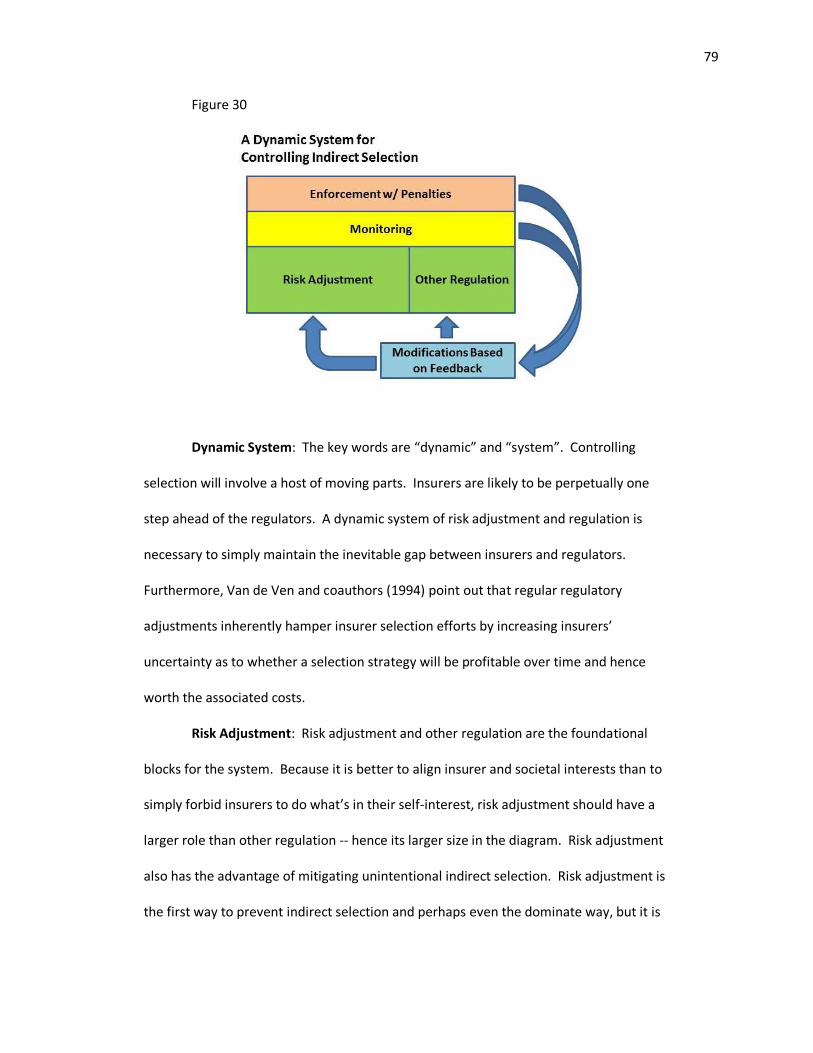
A. Conceptual Model ........................................................................................................ 78 B. Federal or State ............................................................................................................ 81
vi
C. Regulatory Timing ........................................................................................................ 82 D. Tools ............................................................................................................................ 84
E. Monitoring ................................................................................................................. 115 F. Enforcement with Penalties ........................................................................................ 118 G. Feedback Loops .......................................................................................................... 118
VI. CONCLUSION ............................................................................................................................. 120
Model ......................................................................................................................................... 9
4. Healthcare Reform Individual Health Insurance Market: What the Public Requested ............... 16
5. Post-Healthcare Reform Individual Health Insurance Market: The Compromise – As Ideally Envisioned ............................................................................................................................... 18
7. Other Predictive Variables: Public Health ................................................................................ 23
8. Other Predictive Variables: More ............................................................................................. 25
9. Other Predictive Variables: Final List ....................................................................................... 27
10. Demonstration: Starting Population ........................................................................................ 31
11. Demonstration: Healthy and Unhealthy People ....................................................................... 32
12. Demonstration: Further Differentiation of Healthy People ...................................................... 33
13. Demonstration: Financial Impact of Selecting on the Unidentified Risk .................................... 34
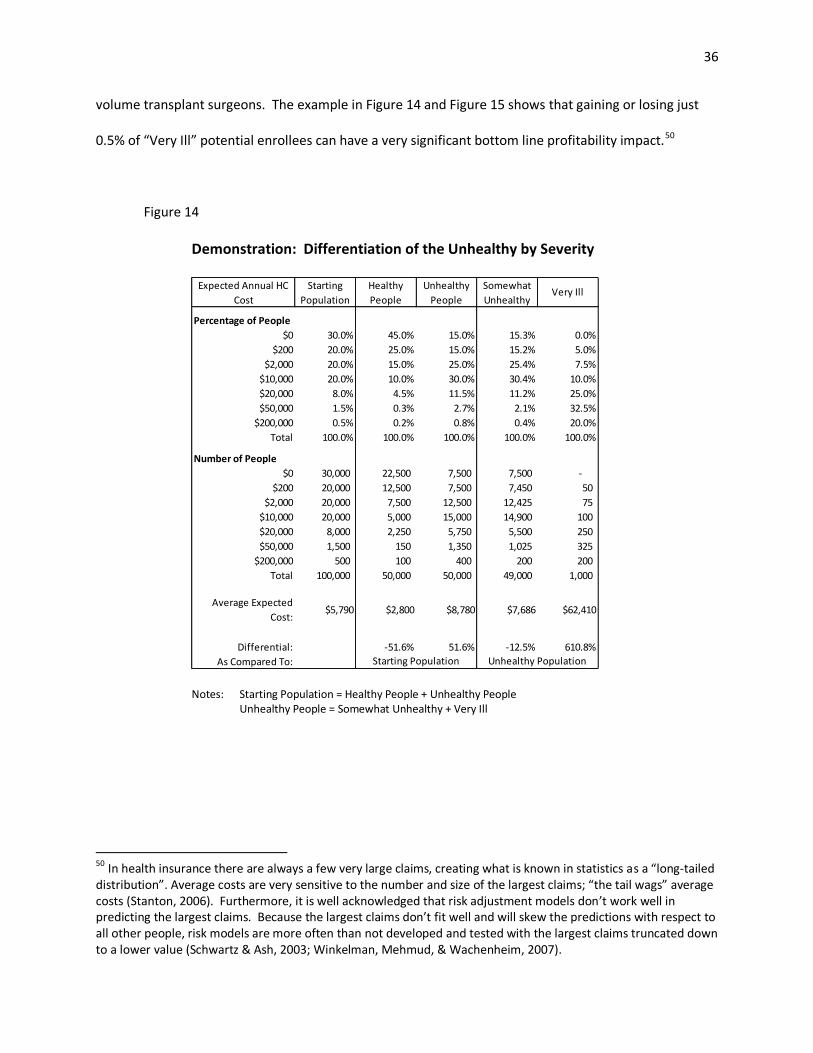
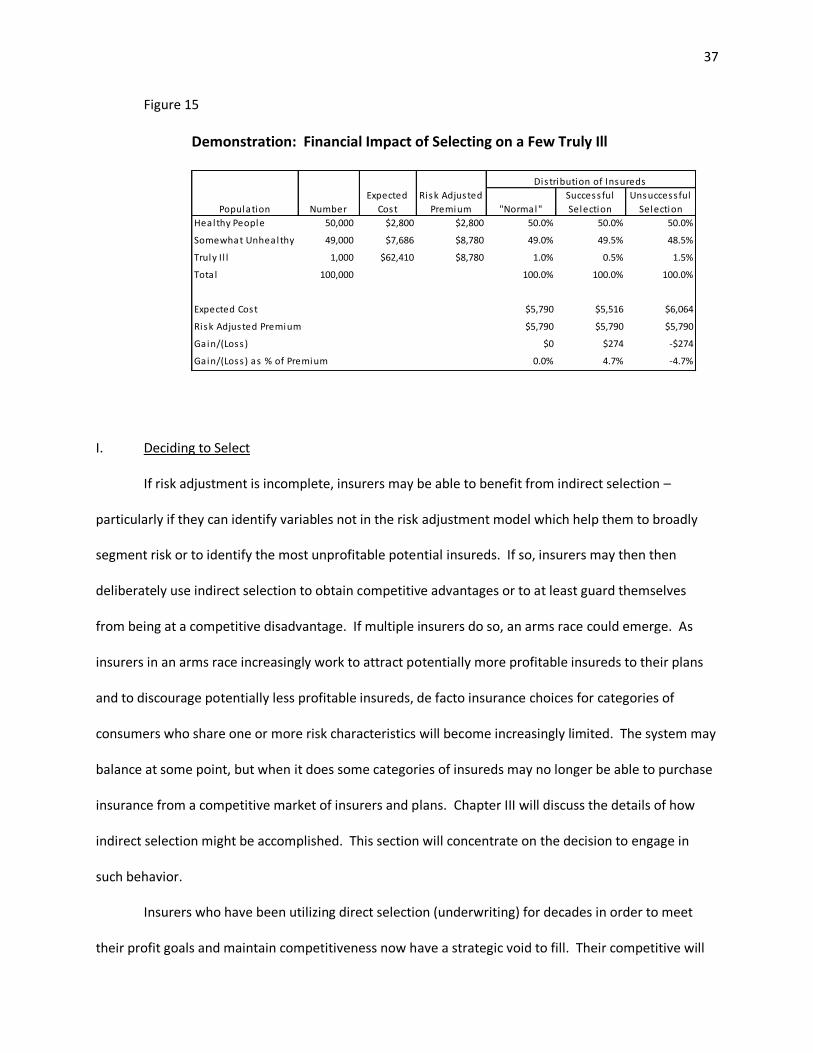
14. Demonstration: Differentiation of the Unhealthy by Severity .................................................. 36
15. Demonstration: Financial Impact of Selecting on a Few Truly Ill ............................................... 37
16. To Indirectly Select or Not: One Insurer’s Decision Framework ................................................ 38
17. One Insurer’s Decision to Select ............................................................................................... 42
18. Post-Healthcare Reform Individual Health Insurance Market: With Indirect Selection – If it Balances ................................................................................................................................... 43
19. Neighborhood-Level Data Available from EASI ......................................................................... 49
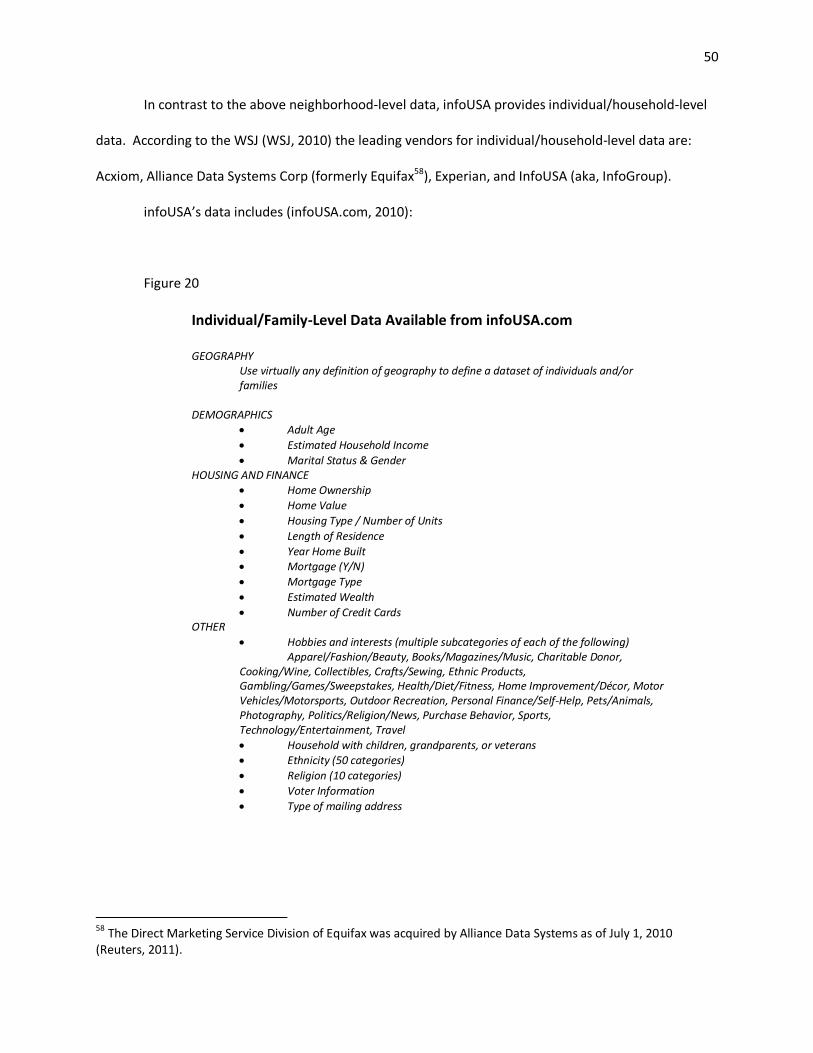
20. Individual/Family-Level Data Available from infoUSA.com ........................................................ 50
21. Consumer Marketing Databases Provide Missing Information .................................................. 53
39. Regulatory Monitoring to Assess Presence and Impact of Indirect Selection ........................... 115
ix
LIST OF ABBREVIATIONS
AAA American Academy of Actuaries
AHIP America’s Health Insurance Plans
AHRQ U.S. Department of Health and Human Services’ Agency for Healthcare
Research and Quality
AMA American Medical Association / American Marketing Association, distinguish
contextually
AP Associated Press
ASB Actuarial Standards Board
CDC Center for Disease Control and Prevention
CDPS Chronic Illness and Disability Payment System
CHIP Children’s Health Insurance Program
CMS Centers for Medicare and Medicaid Services
CO-OP Consumer Operated and Oriented Plan
DHHS U.S. Department of Health and Human Services
EASI Easy Analytic Software, Inc.
EMTALA Emergency Medical and Labor Act
ESRD End Stage Renal Disease
FCRA Fair Credit Reporting Act
FPL Federal Poverty Level
HC Healthcare
HCC-CMS Hierarchical Condition Category - Centers for Medicare and Medicaid Services (a
risk adjustment model)
HIPAA Health Insurance Portability and Accountability Act
ICD9 International Classification of Disease, Version 9
x
MEPS Medical Expenditure Panel Survey
P&C Property and Casualty
PBM Prescription Benefit Manager
PHI Protected Health Information
PPACA Patient Protection and Affordable Care Act
RA Risk Adjustment
SES Socioeconomic Status
SOA Society of Actuaries
TANF Temporary Aid to Needy Families
WHO World Health Organization
WSJ Wall Street Journal
xi
SUMMARY
This paper is intended to help regulators understand and be bettered prepared to address
indirect selection under healthcare reform. Specifically, the paper discusses the general concept of
selection, describes the potential indirect selection techniques under healthcare reform, discusses the
public policy implications of such selection, and suggests a range of potential regulatory interventions
and monitoring. The paper relies upon original, conceptual diagrams to explain concepts without
mathematical formulas. The paper is supported by “Health Insurance Risk Adjustment: The Income
Effect” (Appendix), a stand-alone paper which examines risk adjustment from a conceptual and
mathematical perspective.
1
I. INTRODUCTION
Consultants from the consulting firm of McKinsey & Company1 gave a presentation on
November 11 the America’s Health Insurance Plans’ (AHIP’s) 2010 Health Exchange Conference in
Chicago, Illinois. The consultants urged insurers to analyze potential post-healthcare reform business by
market segment and then to use the data to build products targeting certain customer profiles, to create
target marketing strategies, and to manage churn (lapsation) risk by customer profile, inside and outside
of the health insurance exchanges.2
During the question and answer portion of the session an actuary and academic from the
audience3 stood up. She pointed out that while medical underwriting, which will no longer be permitted
under healthcare reform, is direct selection, that market segmentation, differential product design,
target marketing, and churn management as described by McKinsey are indirect selection and that
either form of selection results in some people being categorized as desirable risks and others being
categorized as undesirable risks. She asked if McKinsey had considered the public policy implications of
indirect selection.
The question appeared to touch a nerve. The consultants took a deep breath, thanked the
audience member for the “excellent question”, took another deep breath and then said that it was the
job of the regulators, not consultants, to assess the public policy implications of indirect selection. The
consultants went on to say that while indirect selection is imperfect and that some undesirable risks will
always be covered, that insurers must, if permitted by regulation, actively indirectly select in order to
avoid the negative financial impact of insuring a disproportionate share of undesirable risks. Finally, the
1 Jenny Cordina, Principal and Alissa Meade, Consultant. 2 As witnessed by Tia Goss Sawhney. Presentations were not distributed in advance. The McKinsey speakers were the only conference participants who declined to make their presentations available in the after-event packet. 3 Tia Goss Sawhney, the author of this paper.
2
consultants noted that insureds or potential insureds with high risk scores4 are not necessarily
undesirable -- that McKinsey has identified “pockets of opportunity” among people with high risk scores.
The November presentation is not McKinsey’s only AHIP presentation advising insurers to adopt
target marketing strategies. In June 2010 McKinsey gave a talk at AHIP’s massive annual conference
which emphasized the need to build post-reform product and marketing strategies based on market
segmentation (McKinsey & Company, 2010). McKinsey reached a broad audience of health insurers as
AHIP bills itself as “the national association representing nearly 1,300 member companies providing
health insurance coverage to more than 200 million Americans” (AHIP, 2011).
Indirect selection is a threat to the intentions of healthcare reform. If there is any insurer-to-
insurer consistency in how insurers categorize desirable and undesirable risks and insurers have success
in differentially attracting and retaining the desirable risks, undesirable risks will have less access to
affordable, quality health insurance than other people – contrary to the intent of healthcare reform. At
a minimum, regulators need to watchful of this possibility.
Yet the regulators at the conference had nothing to say about indirect selection.5 The most
prominent regulator, the Director of the Office of Insurance Exchanges, U.S. Department of Health and
Human Services,6 who spoke the day before the McKinsey consultant, presented slides that implied that
selection will be eliminated under healthcare reform and that insurers will concentrate their efforts
exclusively on quality, price, and efficiency. Selection issues were not raised by any of the other
regulators7 speaking at the conference.
4 Presumably as defined by today’s commonly used risk adjustment methods, of which Medicare’s HCC method is
one. 5 As witnessed by Tia Goss Sawhney, confirmed by presentations distributed post-conference. 6 Joel Ario. Director of Office of Insurance Exchanges, Department of Health and Human Services. 7 Kimberly Belshe, Secretary of the California Health and Human Services Agency; Sean Dilweg, Commissioner of Insurance for the State of Wisconsin; Bruce Goldberg, Director of the Oregon Department of Human Services; and Molly Voris, Program Director, Health Division, National Governors Association.
3
This paper is meant to be a primer for regulators. Much of the post reform health insurance
regulatory burden falls upon the States. Overburdened and financially strained federal and state
healthcare reform regulators, struggling with the massive logistical challenges of healthcare reform and
with limited access to data sources and data analysis, are behind McKinsey8 and other consultants with
respect to understanding the potential for indirect selection under healthcare reform. The regulators
have not fully analyzed the public policy implications of indirect selection and are not yet prepared to
design appropriate selection control regulations and monitoring.
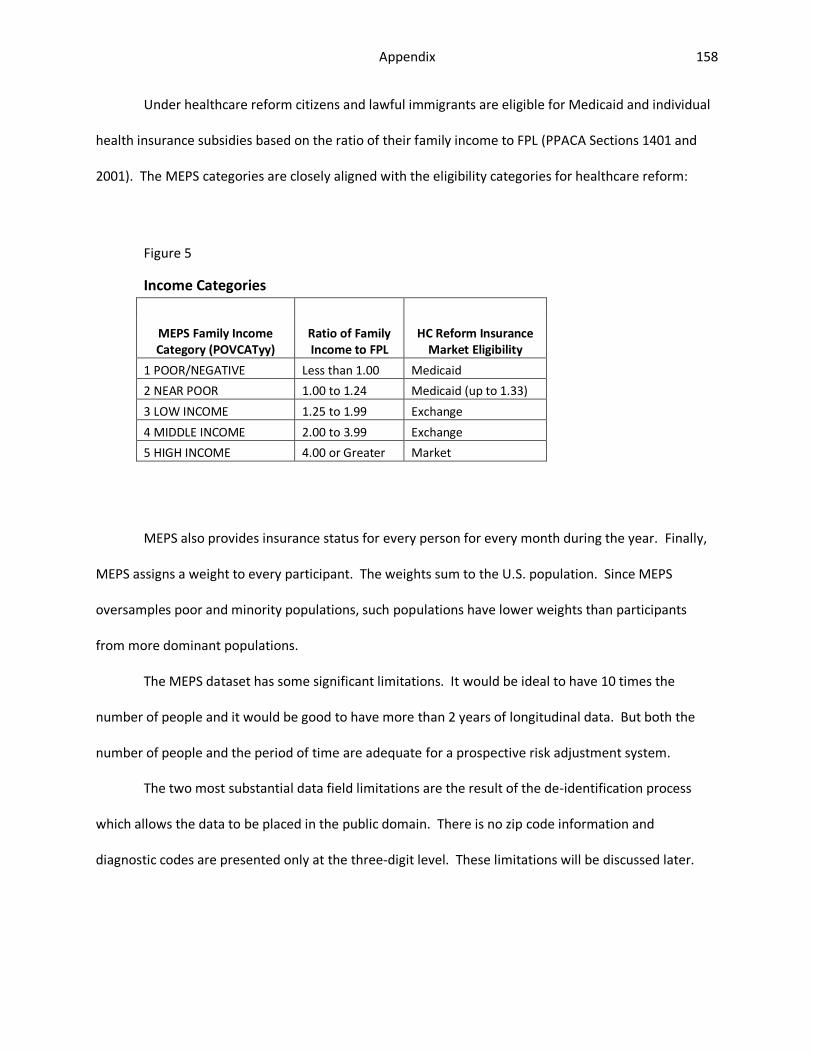
This paper will help regulators understand and be bettered prepared to address indirect
selection under healthcare reform. Specifically, the paper will discuss the general concept of selection,
describe the potential indirect selection techniques under healthcare reform, discuss the public policy
implications of such selection, and suggest a range of potential regulatory interventions and monitoring.
The paper will rely upon original, conceptual diagrams to explain concepts without mathematical
formulas.
The paper is supported by “Health Insurance Risk Adjustment: The Income Effect” (Appendix), a
stand-alone paper which examines risk adjustment from a conceptual and mathematical perspective.
8 McKinsey has and plans to devote significant resources to finding ways for insurers to profit from risk selection. McKinsey has established a Center for US Health System Reform. Within the center they have multi-disciplinary professionals assigned to the Center’s Risk Attraction Knowledge Development Team. The Team “aims to develop an approach to designing health insurance products which attract and retain a differentiated risk profile” (McKinsey, 2010).
4
II. SELECTION – CONCEPTUAL MODELS
A. Selection and Adverse Selection
Individual health insurance in the US is a contract, consummated in the private market between
a consumer and an insurer. Contracts require offer, acceptance, and consent (Lawyers.com, 2011).
Individual health insurance involves an insurer choosing to offer insurance and a consumer choosing to
accept the offer. The consumer becomes an insured only if and when the contract is finalized. Both
insurers and insureds therefore select. They presumably select, at least more often than not, out of
their own self-interest.
When insurance companies discuss selection, they inevitably discuss “adverse selection”, also
known as “anti-selection”. Adverse selection refers to the disproportionate tendency for high-risk
consumers to seek and retain insurance and low-risk consumers to avoid or drop out of voluntary
insurance pools. Adverse selection is a long accepted truth in insurance markets. 9 The selection
literature with respect to life insurance goes back to at least King (1876) and Lippincott (Lippincott,
1905).10 By 1957 (Angell) adverse selection was being discussed in the context of health insurance.11 A
portion of every insurance premium goes to insurer administrative expenses; the remainder is the risk
premium. A health insurance consumer (insured) is high risk when his or her expected healthcare costs
exceed his or her risk premium.12
A series of theoretical insurance papers in the 1970’s described the disproportionate tendency
of high-risk purchaser to buy more comprehensive (“richer”) insurance benefits than lower-risk
purchasers. These papers referred to “separating equilibrium” and “information asymmetries” (Akerlof,
9 And other markets, such as credit markets, which involve the pooling of risk.
10 As cited by Baker (2003). 11 As cited by Akerlof (1970). 12 This definition is commonly used in the health insurance literature. In statistics risk is defined in terms of variance, not expected values. But because health insurance claim cost variance is dominated by large “right tail” (highly skewed) claims, populations of people with high variance almost inevitably also have high expected costs.
5
1970; Rothschild & Stiglitz, 1976; Wilson, 1977; Miyazaki, 1977).13 In the 1990’s health insurance
benefit-level selection was substantiated empirically and incorporated under the general definition
Zeckhauser, 1997). Cutler and Zeckhauser (1997) explored not only the benefit level, but the fit
between the specific benefits and the insured’s personal health needs. Hence health insurance adverse
selection relates to 1) the decision to purchase insurance and 2) the benefit levels and specific benefits
associated with the purchase.14
At any insurance price, the people who buy and retain the insurance are disproportionately15
those who expect to benefit from the insurance -- those who expect to file claims in excess of their
insurance premiums. In a voluntary market, people who feel that the insurance “is a bad deal” by virtue
of expecting to file no or few claims relative to their premiums, disproportionately do not buy insurance
or discontinue their insurance. Yet in order to just break even health insurers typically need a large
number of people who will likely not benefit from the insurance in order to offset the few who will have
substantial healthcare costs.
“Disproportionately” is a key word. Because insurance average costs are so heavily influenced
by the minority of insureds with high costs, a modest shift in the proportions of low and high risk
insureds can be financially devastating or rewarding.
An insurer who sets a fixed price (community rate16) for insurance and sells the insurance to
anyone who chooses to buy (open enrollment) it is all but guaranteed losses due to consumer selection.
Raising rates is not a solution and can, in fact, lead to higher losses as more of the relatively low risk
13 As cited by Browne and Doerpinghaus (1993) 14
The expanded definition of adverse selection will be particularly relevant under healthcare reform where everyone (theoretically) is mandated to have insurance, but can select from among an array of benefit levels and designs. 15 Disproportionately is the key word. As will be demonstrated later in this paper a small change in the risk distribution can be very destabilizing to the system. 16 Because rates are allowed to vary by age and smoking status PPACA calls for what are strictly speaking “modified community” rates. Modified community rates, however, are often simply referred to as community rates.
6
insureds drop out and only the high risk insureds persist. Raising rates can lead to a cycle of increased
rates, disenrollment, and increased losses. The cycle is known as a “death spiral” or an “anti-selection
spiral”. The spiral ends when insurers, who are a cycle or more behind suffer sufficient losses to quit; in
the interim fewer and fewer people have insurance. Ultimately there may no longer be a competitive
(more than one insurer) private health insurance market.17
Adverse selection can be depicted as: 18,19
Figure 1
The picture suggests one way to bring the system into balance: remove consumer choice with
respect to whether to seek insurance and with respect to insurer and plan. This removes weight from
17
Although the near inevitability of death spirals for community rated open enrollment plans is widely accepted wisdom in the insurance industry, there are authors who disagree. The dissenters include Buchmueller and DiNardo (2002) and Barrett and Conlon (2002). 18
While they are informed by the work of many authors, the selection depictions featured in this paper are the original work of Tia Goss Sawhney, developed specifically for this paper. 19 The figures and discussion make reference to insurer profits and losses and the need to achieve “balance” at the breakeven point between profits and losses. This is a simplification for the sake of pictorial and verbal economy. Private companies, even not-for profits, need some amount of profit to stay in business. To be technically correct the pictures and discussion should reference “excess profits” and “insufficient profits/losses” rather than profits and losses.
7
the right side of the bar. With respect to health insurance some countries have done this. In Canada
health insurance is compulsory with premiums, if any, automatically deducted from paychecks, and
everyone is covered under the same provincial plan (see http://www.canadian-healthcare.org/). The
US, however, has rejected the possibility of a mandatory, single payer system.
The picture also suggests another way to bring the system into balance: use insurer selection to
offset insured selection, thus putting weight on the left side of the bar. This strategy compensates for
the effect of, rather than eliminates, adverse selection. The US has relied upon this strategy for the
individual health insurance market. While insurers and actuaries often refer to this strategy as “insurer
control of adverse selection”, I don’t prefer the term as it conjures images of consumers as villains who
need to be policed by insurers. I will refer to the strategy as “balanced selection”, a label that
acknowledges that both insureds and insurers are selecting.20 I will likewise henceforth tend to avoid
the term adverse selection and discuss insured and consumer selection and the respective components
thereof. When I must refer to adverse selection it will be as “adverse consumer selection”.
The final strategy for balancing the system is a hybrid of the above two strategies: reduce the
range of consumer choices on the insured side of the bar and thus reduce the required “weight” on the
insurer side of the bar.21 This strategy will be particularly important as I discuss potential interventions
to limit indirect selection under healthcare reform.
B. Pre-Healthcare Reform Balanced Selection
Insurers can directly and indirectly select in order to balance insured selection. Direct selection
occurs whenever an insurer makes an explicit choice with respect to an individual consumer. The
20 This perspective is consistent with Baker (Baker T. , 2003) and Heimer (Heimer, 2003) as published in “Risk and Morality” (Ericson & Doyle, 2003). They see adverse selection on the part of both insureds and insurers that, unless controlled by regulation, gets played out in the context of a dynamic game with adverse societal consequences. 21
consumer may be a potential or a current insured. Specifically, the insurer may decide whether to offer
the consumer insurance, what benefits to offer, and the price for the new or renewal offer.22 Indirect
selection occurs when the insurers make decisions that influence the propensity of consumers with
different risk characteristics to buy or retain insurance. Insurers indirectly select by influencing
consumers’ direct (explicit) selection. In recent decades, direct selection has been the dominant risk
balancing mechanism for the US individual health insurance market.23
This suggests the following model for balanced selection:
Figure 2
The model depicted in Figure 2, however, is incomplete with respect to consumer choice. While
direct and indirect selection preserves and even expands choice for low-risk consumers,24 it eliminates
choice for some high risk consumers (who cannot get any insurance from any insurer at any price) and
22
I will consistently use this definition within this paper. There is, however, not uniform agreement regarding indirect selection. For example, Zweifel (1997) asserts that target marketing, since it involves identifying specific consumers, is direct selection. Targeting a consumer is, however, is a much less direct selection than having the power to overtly deny a consumer coverage. Therefore van de Ven and Ellis (2000), Puig-Junoy (1999), and other authors feel that target marketing is indirect selection. 23 Health insurance first became available in the 1930’s. Underwriting in the fledgling individual health insurance market did not become accepted practice until the 1950’s (Cunningham III & Cunningham Jr., 1997). 24 A desirable outcome for low-risk insureds and a direct selection benefit often cited by the insurance industry (AAA, 2009).
9
limits choice for other high risk consumers (who may be able to get as little as one high premium,
restricted plan, from one company).
The balance therefore is more completely depicted as:
Figure 3
While they are integral to system balance, no choice and limited choice are arguably not choices
and are not socially desirable outcomes.
The next section concerns direct and indirect selection and the relationships between insurer
selection and insured selection.
C. Direct Selection
The process of directly selecting insureds is known as underwriting. Underwriting utilizes the
risk classification system established by the insurer’s actuaries,25 reinsurers, and technical consultants.
25 See Actuarial Standard of Practice No. 12 (ASB, 2005) for information concerning how actuaries design risk classification systems.
10
The insurer collects detailed information (risk characteristics) about the insured, assesses the insured’s
health risk, and assigns the insured to a risk classification. Based on the risk classification guidelines the
insurer decides whether to offer insurance and whether to surcharge the insured with extra premiums
or to restrict benefits (AAA, 2009). If the insurer subsequently finds out that the insured misrepresented
his or her risk characteristics, the insurer may rescind (cancel) the policy.26
The Society of Actuaries feels that risk classification is essential to the financial stability of
insurers in a competitive insurance market. They promote a “more is better” approach to risk
classification and posit that to the extent direct selection does not work to balance adverse selection, it
is because consumers have an information advantage over insurers with respect to their risk
characteristics or that the insurer has not been allowed by regulators to fully use the risk characteristics
information (ASB, 2005) -- the consumer has information which allows them to “take advantage of” the
insurer. This perspective leads to an actuarial definition of adverse selection which is quite different
than the academic definitions given above:
Adverse Selection—Actions taken by one party using risk characteristics or other
information known to or suspected by that party that cause a financial disadvantage to
the financial or personal security system (sometimes referred to as antiselection). (ASB,
2005)
Direct selection can be described in terms of impact and process:
1. Impact. Direct selection explicitly limits the choices of one consumer (or at
most a family).
26
Recently effective provisions of PPACA (Section 2712) curtail but don’t eliminate insurer rescissions.
11
2. Process. Direct selection is a defined process. As such, it has a beginning, an
end, and steps in between. There are underwriting manuals and risk classification charts. The
process can be evaluated and the outcomes measured (outcome example: applicants denied
coverage). The process can be regulated27 or even forbidden.
D. Indirect Selection
In contrast, indirect selection is much different than direct selection with respect to impact and
process:
1. Impact. Indirect selection influences rather than explicitly limits the choices of
consumers. As the result of indirect selection a particular insurer or plan is somewhat more or
somewhat less appealing to categories of consumers who share one or more risk characteristics.
2. Process. Indirect selection is embedded into the essential, everyday insurer
processes and cannot be entirely eliminated from those processes. There is no way to have a
multi-insurer, multi-plan, competitive insurance market and not have some degree of indirect
selection – some insurers or plans will have more or less appeal to specific categories of
consumers. Because indirect selection is embedded in necessary business processes it can be
very difficult to evaluate, measure, and regulate; it can be forbidden, but not eliminated.
Although indirect selection is embedded and not always obvious to outsiders, particularly
consumers, it can be and is purposefully manipulated by insurers. Any business activity that makes a
product more or less appealing to a category of customers can be used to affect selection. While
indirect selection possibilities include the traditional marketing activities, such as product design and
27 Insurers, for example, are not allowed to use race as an underwriting consideration regardless of the statistical relationship between race and health risk (AAA, 2009).
12
pricing, marketing, sales, and customer service, they also include any business activity which ultimately
affects the potential or actual customer. The possibilities are endless. For example, every insurer has
glossy brochures. The content, pictures, and layout of a brochure may make the insurance product
more or less appealing to certain categories of consumers without any changes to the underlying
insurance product.
The indirect selection is not always intentional. The definition of indirect selection only requires
an insurer (and its agents) to make a decision which differentially impacts the choices made by
consumers with different risk characteristics. Although “smarter” insurers might have a specific intent,
the definition does not require that the insurer even be aware of the potential impact on consumer
choices.28 I will discuss specific indirect selection techniques in a later section.
Later in this paper I will use “indirect selection” almost synonymously with “target marketing”.
Indirect selection is a term specific to insurance and a limited number of other fields. Target marketing
is a term specific to the field of marketing. The terms converge with respect to the marketing of
insurance products.
As of 2004, the official definition of marketing was “Marketing is an organizational function and
a set of processes for creating, communicating, and delivering value to customers and for managing
customer relationships in ways that benefit the organization and its stakeholders.” In 2007 the
definition was expanded to include societal value “Marketing is the activity, set of institutions, and
processes for creating, communicating, delivering, and exchanging offerings that have value for
customers, clients, partners, and society at large” (AMA, 2007). The AMA clearly states that the
definition is intended to position marketing “as a broader activity in a company/organization, and not
28 While indirect selection overall benefits insurers, a particular selection decision may in fact be detrimental to an insurer. In today’s market, insurers have the luxury of relying primarily on direct selection to achieve balanced selection. They can be “sloppy” with respect to indirect selection.
13
just a department. This expansive view of marketing is consistent with the concept of indirect selection
being embedded in a full range of insurance business processes.
Target marketing in turn refers to marketing activities and processes directed toward identified
populations. Target marketing follows from market segmentation – the process of recognizing the
differences among customers.29 Conceptually indirect selection is neither new nor unique to health
insurance; it is a well-established concept across a broad range of industries, albeit with a different
name.
Finally, while target marketing and indirect selection within the health insurance industry have
negative consequences, it is important to note that not all target marketing results in negative
consequences. Social marketing – using marketing to target the health behaviors of specific populations
– is a well-established, socially-beneficial public health strategy (Grier & Bryant, 2005).
E. Individual Insurers vs. The Collective
Thus far I have discussed health insurance as a system. Even if the risk selection system as a
whole is in balance as shown in Figure 3, a given insurer may be advantaged or disadvantaged via
indirect selection. Insurers use selection prowess to their competitive advantage. An insurer who is
better at direct or indirect selection can tip the selection bar in their favor and drive a profit. One
insurer’s success in doing so is often at the detriment of the other insurers in the system. Classic Adam
Smith economic theory argues that this will result in consumer benefit. To the extent that it lowers
prices and fosters innovation it does, but that benefit to specific individuals may not be sufficient to
29 Kotler and Armstrong (2009) define market segmentation as “dividing a market into distinct groups of buyers who have different needs, characteristics, or behaviors, and who might require separate products or marketing programs. They then define target marketing as the process of evaluating each market segment’s attractiveness and selecting one or more segments to enter.
14
offset the societal and individual cost of excluding people from the insurance market. Economists refer
to such costs as externalities.
If the number and risk characteristics of insureds in a system are fixed at least over the short-
term, then the insurer-specific selection strategies result in insureds being traded from one insurer to
the other. The insurer who can do a better job getting low-risk insureds to apply for coverage, sorting
the low-risk applications from the high risk applications, and retaining low-risk insureds has a better
portfolio of insureds. The other insurance companies in turn get that company’s risk-leftovers. The
companies that select best make money, the other companies lose money.
The other companies respond. They attempt to return to profitability by enhancing their direct
and indirect selection efforts. Enhancing almost always means tightening.30 A selection “arms race”
emerges. As a result, insurance becomes increasingly unavailable to those consumers that insurers
assume have or might have risk impairments.
Essentially the weight on both sides of the balance bar increases as a result of selection-based
competition: insurers select more (left side) and more consumers have no or limited choices (right side
– peach shading). In addition low-risk consumers, because of the increased competition, may have
more choices at a lower price than ever (right side – white shading). An increased range of choices and
lower prices for low-risk consumers is one of the “advantages” of direct selection frequently mentioned
by actuaries (AAA, 2009).31 Actuaries, however, talk much less about the societal implications of
excluding people.
30
Insurers know the risk characteristics of their profitable and unprofitable insureds (consumers who applied for and were accepted for coverage). Insurers will seek to avoid applicants with the unprofitable characteristics in the future. Insurers do not know the risk characteristics of the consumers who they rejected or who otherwise did not accept the offered insurance and who would have been profitable. Insurers therefore (usually) don’t seek and accept such applicants in the future. 31 Baker (2003) discusses how selection operates to the detriment of consumers and society even though insurers have traditionally sold selection as being on net beneficial to consumers.
15
F. Consumers Demand Change
Direct selection and continuously improved risk classification may work well for insurers, but it
does not work well for society. Since insurers can deny coverage, some consumers cannot get insurance
at any price. Since insurers can charge premium surcharges and limit benefits, other consumers cannot
afford insurance or cannot get insurance coverage for precisely the health impairment that does, or is
likely to, make them ill. The U.S. has seen this with respect to individual health insurance. People who
cannot get insurance, who can only get limited benefits, or who must pay a high price are unhappy and
so are the people who care for them.
An increasing portion of Americans feel that access to affordable health insurance, regardless of
one’s risk characteristics, is a right. This opinion is much different than with auto insurance where
people have generally accepted that some people will pay substantially more than others based on their
age, automobile, and driving record and where society expects people to forgo having a car if they
cannot afford insurance. No one expects that those who cannot afford health insurance should forgo
life-saving care.32
After decades of societal discontent with the health insurance system, Congress and the
President listened, and in March 2010 the Patient Protection and Affordable Care Act (PPACA, May
2010)33 became law. PPACA forbids direct selection in the individual health insurance market as of
January 2014. No one will be denied coverage, be offered only restricted benefits, or be charged higher
premiums because of a health impairment (PPACA, Section 2704). PPACA intends to curtails indirect
selection efforts.34 Furthermore the reform will expand consumer choice, or at least perceived choice,
32
Sawhney (2007) compares societal perspectives of auto and health insurance. 33
Known both as the PPACA and ACA. Technically PPACA/ACA refers to the initial PPACA legislation to the amendments that passed days later -- the Health Care and Education Reconciliation Act of 2010 (HCERA). 34 General language about non-discrimination by health status (Section 2704) curtails indirect selection. Section 1302, (b) Essential Health Benefits, (4) (a)-(d) concerning plans sold on exchanges goes a step further and makes it clear that exchange plans must provide service to people with diverse health needs, including people traditionally underserved.
16
with respect to insurers and plans by making information and enrollment available via centralized,
electronic health insurance exchanges (PPACA, Subtitle D).
As favorable as these changes are to consumers, these changes cannot be made without other
offsetting changes as they unbalance the system by removing most of the weight from the left side of
the bar, leaving most of the weight on the right side:
Figure 4
G. Other Changes to Balance the System
Figure 4 shows that insured selection will outweigh insurer selection when insurer direct
selection is removed, swinging the system toward insurer losses. In order to re-balance selection, other
changes must occur. Two such changes are built into the healthcare reform legislation:
1. Requirement that everyone have health insurance – mandatory insurance
(PPACA, Section 1501).
17
2. Risk adjustment (PPACA, Section 1343).35
Mandatory insurance eliminates consumer choice with respect to seeking insurance. Removing
this element of consumer choice considerably decreases insured selection. That is why the health
insurance industry lobbied hard for mandatory insurance (AHIP, 2008).
So called mandatory health insurance under PPACA, however, is not truly mandatory. Certain
individuals are exempt from the insurance requirement (PPACA, Section 1411). Furthermore even the
majority required to have insurance can opt instead to pay a tax penalty. The tax penalty is trivial in
2014 and even at full value in 2016 is a fraction of the cost of purchasing health insurance (PPACA,
Section 1501). Also, tax penalties can be assessed only on those who actually file a tax return. No
insurance will still be a component of the selection balance, just a smaller component.
Something, therefore, is needed on the left side of the bar to offset the continued consumer
choice forces associated with selecting an insurer, a plan, and whether to purchase insurance. That
something is risk adjustment. Risk adjustment refers to a “process of adjusting payments to health plans
or health care providers in order to reflect the health status, or illness burden, of the members” (SOA,
2009).
Under healthcare reform insurers must charge everyone the same premium36 regardless of
health status. There is then a non-consumer facing risk adjustment mechanism (PPACA, Section 1343)
which shifts money between insurers and from the government to insurers depending upon the health
status of the insurer’s insureds. The ideal is that risk adjustment will immunize insurers from the effects
of insured selection. Risk adjustment is not insurer selection, but because it offsets the effect of insured
35
In addition to Section 1343, Sections 1341 and 1342 provide for transition period (3 year) risk mitigation via reinsurance and risk corridor provisions. These provisions are transitional and this portion of the discussion is with respect to long term balance, so I have omitted them here. I will, however, discuss them later in a section relating to the likely evolution of selection efforts ( The Game). 36 Rates must be uniform except with respect to family coverage, rating area, age, and smoking status (PPACA, Section 2701). Age and smoking status rate differentials are capped.
18
selection, it belongs on the same side of the depiction as insurer selection. I will, however, depict it
differently -- as a solid grey, an intentionally neutral color.
The healthcare reform vision is to have a balanced system that looks like this:
Figure 5
In this depiction consumer choice with respect to seeking insurance is considerably less than
before and consumer choice with respect to choice of insurer and plan is about the same.37 Risk
adjustment fully offsets consumer choice. Indirect selection is not depicted because to the extent that it
exists (consumers will always have preferences for specific insurers and plans), insurers no longer
benefit from manipulating it – no amount of indirect selection moves the arrow to green. Insurers will
not intentionally manipulate indirect selection; insurers will simply accept selection “as is” and be fully
compensated for doing so. Reality, however, often falls short of a vision.
Figure 5 assumes risk adjustment will fully offset consumer selection. While risk adjustment will
certainly help offset selection, there are good reasons to believe that risk adjustment will not fully offset
37 Consumer choice may be less if individual insurance can be only bought on an exchange and how many options will be available on and off the exchange.
19
consumer selection. This section and the next will discuss risk adjustment and the reasons why it may
not fully offset consumer selection. The third section will discuss an alternative way the system may
balance if risk adjustment falls short.
H. Risk Adjustment
1. Described
Life is risky. People are continuously subjected to the possibility of loss of health or injury.
Health costs are associated with these risks. Some people are already suffering from the effects of a
chronic disease, condition, or injury. Many chronic conditions are not, strictly speaking, risk –they are
already present, will exist in the future, and are not mere possibilities. But their costs are risky. No
one’s future health costs are certain, even with respect to a single, known condition. A single course of
breast cancer treatment might cost $15,000 or $500,000.38 Some people die before any significant costs
are expended.
Not all health cost risk emanates from an individual’s health status and health events. The
healthcare system itself generates risk. Diagnosis is an art, not a science. Compared to the range of
health situations, there are few standard treatment protocols; even few are faithfully followed by health
care providers. There is no standard pricing. Treatment errors happen. Therefore two people may have
identical objectively defined healthcare “needs” but ultimately have very different health care use and
costs. Some people receive more health care than they need and others less care than they need.
Risk adjustment uses statistical techniques to make a prediction as to the average cost for
people with a similar risk profile and pays the insurer accordingly. Risk prediction is often expressed in
38 Campbell and Ramsey (2009) surveyed the literature with respect to breast cancer costs and found little agreement as to the cost of cancer treatment. Lamerato and coauthors (Lamerato, Havstad, Gandhi, Jones, & Nathanson, 2006) calculated standard deviations for breast treatment costs and found that the standard deviations were nearly as large as the average costs – indicating substantial uncertainty.
20
terms of a risk score. A risk score is the ratio of the predicted cost for an individual (or group of
individuals) to the average cost for the entire population.
A risk score is a prediction, not a certainty. Among the people with a shared risk profile, some
will ultimately have low costs, some will have high costs, but if the risk scores are unbiased, if the insurer
selects a random sample of people from within the risk scores, and if the insurer gets enough people to
“spread the risk”, the insurer will collect sufficient premium to cover the costs. If the insurer can then
figure out how to take care of the people in a manner more cost efficient than the historical average
treatments upon which the risk scores were based, the insurer makes a profit.
Of course, one way to make a profit is to provide less care, irrespective of need. The hope,
however, is that the system will self-correct with respect to the under-provision of care. If an insurer in
an effort to save money skimps on care, the insurer will suffer a reputational loss and lose future
profitable business – especially if there are a variety of public quality of care measures and feedback
forums for consumers to evaluate when selecting an insurer.
There are theorists who have a great deal of faith in the concept of risk-based payments. Regina
Herzlinger of Harvard has been a major proponent of the concept of providing patients risk-based
insurance vouchers. She wrote a mass market book “Who Killed Health Care?: America's $2 Trillion
Medical Problem - and the Consumer-Driven Cure” (2007) that advocated giving every consumer a
voucher with a value based on the consumer’s health status that consumers could take to insurers and
or directly to provider groups in order to contract for care.
Healthcare reform essentially proposes the same, except without a physical voucher. Everyone
will be able to buy insurance at the same price regardless of their health, but risk adjustment will
operate in the background (generally unknown to the consumer) to move money around between
insurers so that in the end each insurer has about the same amount that the insurer would have had if
each consumer had presented a health-status based voucher.
21
Whether the adjustment occurs via risk-adjusted vouchers or inter-insurer risk adjustment,
insurers should then theoretically be indifferent to which risks they assume, have no incentive to either
avoid or work to attract consumers with certain risk profiles, and concentrate instead on taking care of
insureds in a cost efficient manner. That’s the theory, but there are reasons to believe that it will not
be fully actualized. If they believed risk adjustment would work as advertised, McKinsey would not be
talking about selection strategies under healthcare reform, nor would the other consultants and experts
detailed in Chapter III.
An understanding of today’s risk adjustment models39 and the nature of health risk is necessary
to an understanding of where risk adjustment will likely fall short. The models used today within the
insurance industry rely primarily upon a limited number of variables (Winkelman, Mehmud, &
Wachenheim, 2007; AAA, 2010; Fontana & Rong, 2010). They are:
Figure 6
Today's Risk Adjustment Variables
Variable Note
1. Recent Diagnostic History Based on diagnostic codes and/or prescription drug codes
2. Age
3. Sex
4. Area Defined on a county or regional basis
39 PPACA, Section 1343 does not mandate a particular risk model, but it suggests that the model may be like today’s Medicare risk adjustment models, CMS-HCC for medical and RxHCC for prescription drugs (CMS, 2010). The CMS models are respectively described by Pope and coauthors (Pope, et al., 2004) and Robst and coauthors (Robst, Levy, & Ingber, 2007).
22
These are the primary variables. Depending upon the specific use, a handful of other variables
may also be included.40
These variables were chosen over the course of the last approximately 25 years as risk
adjustment slowly emerged within health insurance practice,41 not because they are the only variables
that can be used to predict healthcare costs, but because they were variables that were and are
available within insurer files for most insureds, generally considered reliable, and less susceptible to
gaming than other potential variables (Dunn, et al., 1996).42 These are truly important practical
considerations. The problem, however, is that the resulting risk assessment captures only some of the
variables that affect health risk.
2. Omitted Variables
As discussed above, there are two components to health risk: the risk of new conditions and
injuries and the risk associated with a known condition or injury. Today’s risk adjustment models focus
on known conditions and injuries, specifically the conditions and injuries implied by recent (typically one
year) of health insurance claim diagnoses and/or prescription drug codes. The risk of an entirely new
condition or injury or recurrence of an old condition can, for simplicity, be thought of as “incidence”
40
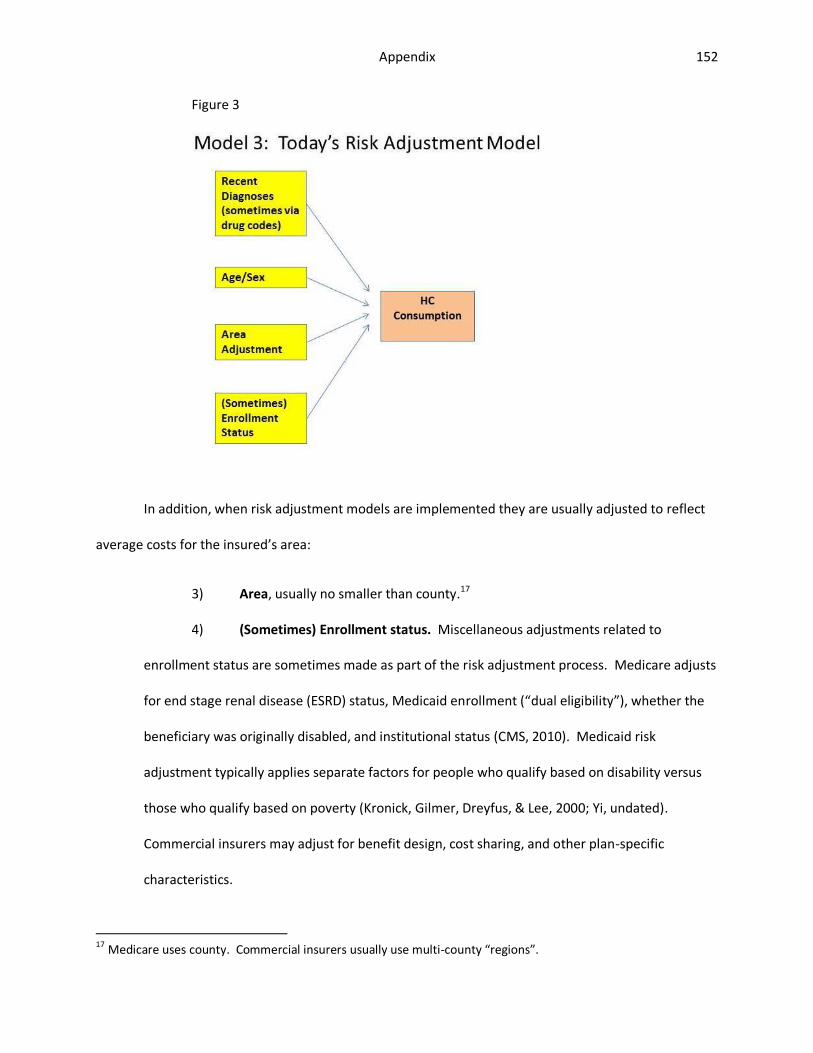
Miscellaneous adjustments related to enrollment status are sometimes made as part of the risk adjustment process. Medicare adjusts for end stage renal disease (ESRD) status, Medicaid enrollment (“dual eligibility”), whether the beneficiary was originally disabled, and institutional status (CMS, 2010). Medicaid risk adjustment typically applies separate factors for people who qualify based on disability versus those who qualify based on poverty (Kronick, Gilmer, Dreyfus, & Lee, 2000; Yi, undated). Commercial insurers may adjust for benefit design, cost sharing, and other plan-specific characteristics. 41
Risk adjustment entered health policy discussions in the mid-1980s with the advent of Medicare risk contracting. It was alleged that the HMO contractors were profiting by collecting an area-average Medicare premium for insuring particularly healthy enrollees and avoiding expensive enrollees (Newhouse, 1986). There was a surge of risk adjustment analysis (Ellis, et al., 1996). It was not, however, until 2000 that Medicare instituted its first attempt at health-based risk adjustment (Pope, et al., 2004). 42 There is no consensus on the criteria for selecting risk adjustment variables. Authors have explored various criteria for variable selection, applied different names to essentially the same criterion, and debated the relative importance of the criterion. The early authors included Anderson et al (1986), Ash et al (1989), Gruenberg et al (1986), and Thomas et al (1983).
23
risk.43 Today’s risk adjustment models capture incidence risk by the age and sex variables. In contrast,
the cost of treatment for recent conditions and the risk of complicating conditions (like renal failure for
diabetes) and high cost events associated with recent conditions (like a heart attack as a result of heart
disease) may be thought of as “prognosis” risk. Today’s models assume that prognosis risk is the same
for everyone given their age, sex, and recent comorbidities.
The nearly exclusive focus on age, sex, and recent diagnostic history, omits a host of other
variables that affect incidence and prognosis risk. The omitted variables are known to anyone familiar
with health literature, especially public health literature.
The core public health variables not included in risk adjustment are:
Figure 7
Other Predictive Variables: Public Health Variable
A. Behavior (a.k.a. Lifestyle)
B.
Environment (a.k.a. Community, Neighborhood, Social Network)
Much of what causes us to be sick or injured is a consequence of our own behavior. As a
society, we smoke, we eat too much, we don’t exercise, we drive while drunk and engage in other risky
behaviors, and we don’t follow medical advice. The World Health Organization, Centers for Disease
Control, and other health authorities agree that behaviors are the primary risk factors for assorted
chronic diseases (WHO, 2005; CDC, 2010).
Our physical (Kawachi & Berkman, 2003) and social environments (Marmot & Wilkonson, 2006)
impact our health. The physical environment may expose us to pollution (Ash & Fetter, 2002), infectious
43 The recurrence of an old condition is not strictly speaking incidence, particularly since the condition may not have actually gone away – the consumer may have simply not sought treatment over the last year.
24
disease (Fullilove, 2003), or inadequate food supply (Beaulec, Kristjansson, & Cummins, 2009). The
social environment associated within our physical environment may include the risk of intimate and
stranger violence (Sampson, Raudenbush, & Earls, 1997) and the stress of enduring discrimination
physical environment to our entire social network. There is a growing body of evidence (Smith &
Christakis, 2010) that our social networks are linked to our health. There is a high degree of overlap and
interaction between physical and social environments and behavior. “Birds of a feather flock together”
(McPherson, Smith-Lovin, & Cook, 2001).
Healthcare providers (or a lack thereof) are an integral part of the interaction between
neighborhood and health, especially for the poor who may not have access to an automobile (Shi &
Starfield, 2000; Prentice, 2006). Even free, quality healthcare within walking distance may not be easily
accessed in a crime-ridden neighborhood. Neighborhood may also influence the practice style of our
physicians. Franks and coauthors (Franks, Fiscella, Beckett, Zwanziger, Mooney, & Gorthy, 2003) found
that the socioeconomic status (SES) characteristics associated with a physician’s address affected
healthcare consumption independently of the SES associated with the patient’s address.
While area is often included in today’s risk adjustment models, it is not included in sufficient
granularity. The typical smallest area of consideration is a county. Neighborhoods are much smaller.
Other healthcare systems take a more granular approach. The British National Health Service has
neighborhood as an integral part of its risk adjustment model (Babad, Bardsley, Childs, Ghiselli, MLure,
& Mateja, 2011).
In addition to behavior and environment, there are other variables omitted from risk
adjustment that affect healthcare cost risk. These include:
25
Figure 8
Other Predictive Variables: More
Variable
A. Behavior
B. Environment
C. Healthcare utility
D. Physical and cognitive limitations
E. Severity
F. Timing
G. Genetics
Healthcare utility is a person’s healthcare utility. There is more to healthcare consumption than
an objective evaluation of a person’s health status. Some people truly value the experience of receiving
healthcare; they actively seek healthcare. They are known as hypochondriacs. They cost a lot,
especially in today’s fragmented health system where determined seekers will eventually find doctors
willing to conduct an expensive test, operate, or admit them to the hospital (Hollifield, Paine, Tuttle, &
Kelner, 1999). There are also people who actively avoid the health system, at least until they are in the
middle of a health crisis. Their avoidance may save a lot of small costs, but it likely makes the big cost
events costlier (Byrne, 2008).
Physical and cognitive limitations are not well captured via current diagnostic coding system and
coding practices and yet have a significant role with respect to health risk. The lack of physical and
cognitive ability to take care of one’s self relates to healthcare utilization in excess of what can be
predicted by diagnostic history (Lewin Group, 2010; Gruenberg, Tompkins, & Porell, 1989). Cognitive
abilities include not only general awareness, self-control, and self-management skills, but tangible skills
such as literacy. Ignorance can kill (Keller, Wright, & Pace, 2008; Weiser & Brugger, 2009; Baker, Wolf,
26
Feinglass, Thompson, Gazmararian, & Huang, 2007). Physical and cognitive limitations may be leading
indicators of undiagnosed conditions or indicators of severity of diagnosed conditions.
Severity is a particular concern. People with more severe conditions have typically had higher
past costs, are more likely to have been hospitalized in the past (hence the high costs), are more likely to
be disabled, are more likely to have comorbid conditions. On average today’s models consistently
under-predict costs for such people (van Kleef & van Vliet, 2010; Winkelman, Mehmud, & Wachenheim,
2007; MedPAC, 2005; Pope, et al., 2004; van de Ven & Ellis, 2000).
Part of the reason why severity is poorly captured is that the US currently uses ICD-9 diagnostic
codes, which are notoriously poor at capturing severity. Absent distinguishable comorbidities, all people
with a given disease are coded the same. Yet someone with coronary artery disease might be
functionally unimpaired or may be bedridden and on the wait list for a heart transplant. ICD-10
diagnostic codes which will be implemented in 2013 will better capture severity (AMA, 2010). Even ICD-
10, however, does not consistently capture severity. For example, Zenner and coauthors (2008) note
that “ICD-10 offers no better help than ICD-9 in identifying or differentiating severity of illnesses within
populations with coronary artery disease.” Furthermore it will take several years for providers to master
the new coding and for statisticians to recalibrate risk adjustment models. Zenner and coauthors
predict that this will be a period of diagnostic “fog”.
Today’s models also have a simplistic approach with respect to time. For most models, a
diagnosis within the typical one year base period has the same impact on the prediction whether it first
appeared on the first or last day of the base period; yet a diagnosis from the day before the beginning of
the base period means nothing. Most of today’s popular risk models consider a woman who had her
last treatment for uncomplicated stage-one breast cancer 11 months ago and a woman diagnosed 1
week ago and yet to start treatment as identical risks (AAA, 2010; Winkelman, Mehmud, &
Wachenheim, 2007).
27
Genetics are also important. A direct relationship between genes and disease is well
established with respect to a few diseases; with other diseases genetics interact with environmental
factors to cause disease (Genome.gov, 2011). People with certain genetic profiles and people from
family groups or communities who disproportionately have certain genetic profiles are unfavorable
healthcare cost risks even if they have yet to be diagnosed with a genetic-related disease. Risk
adjustment takes genetic conditions into account only when they are symptomatic and diagnosed.
Thus far, I have discussed variables omitted from risk adjustment which affect healthcare cost
risk as if they are separate and distinct. In reality they are overlapping and intertwined. It can be
impossible to tease out independent effects and to distinguish between cause and effect. From a purely
statistical perspective it doesn’t matter. Any attribute of a person or population of people can be tested
for statistical significance with respect to healthcare cost risk. From the purely statistical perspective,
the pathway by which the attribute either causes risk or describes risk matters little. Causation may be
ideal, but correlation is sufficient.
This brings us to the last two omitted variables:
Figure 9
Other Predictive Variables: Final List
Variable
A. Behavior
B. Environment
C. Healthcare utility
D. Physical and cognitive limitations
E. Severity
F. Timing
G. Genetics
H Socioeconomic status (SES)
I. Race and ethnicity
28
Researchers typically define SES as some combination of income, education, wealth,
employment, and occupation, measured at the individual, family, or community level. The operational
measurement for a given study may be as little as one parameter, one level (Krieger, Williams, & Moss,
1997). In the U.S. income and education are the most common measurements of SES. Income and
education are related to behavior (Pampel, Krueger, & Denney, 2010), environment (Diez Roux, 2001),
and, to at least some extent, genetics (Johnson & Krueger, 2005). While there is considerable debate
concerning the causal pathways and the relative dominance of income versus education, no one
disputes that income and education are related to nearly every measure of health and health risk.
People with more education and higher incomes are healthier; they have lower incidence of disease and
when they become ill they have a more favorable prognosis. Assorted authors (Cutler, Lleras-Muney, &
Vogl, 2008; Isaacs & Schroeder, 2004; Cutler & Lleras-Muney, 2006)44 have surveyed the literature.
Likewise, while there is no agreement as to whether race is a biological or social construct, let
alone agreement on the causal pathways that relate race and ethnicity to health, no one disputes that
race and ethnicity are related to health and healthcare use (Nickens, 1995). Across a broad spectrum of
measures, black Americans are significantly less healthy than white and Asian Americans. The black
American health disadvantage is greater than what can be predicted based strictly on lower education
and income levels (Geronimus, Hicken, Keene, & Bound, 2006). Understanding why falls within a field of
study known as “health disparities research” and is a public health priority (OMHD, 2011). Paradoxically,
Hispanic Americans, who like black Americans, also have low education and income levels, have
comparatively good health (Gallo, Penedo, Expinosa de los Monteros, & Arguelles, 2009). Many
Hispanic American health measures are comparable to white Americans even though the population is
44 Additionally Sawhney (2010) cites a variety of research to build a conceptual model for the relationship between SES, particularly income, and health and health consumption.
29
generally socially and economically disadvantaged.45 In public health circles this is known as the
“Hispanic paradox”.
Clearly, today’s risk models do not include the full universe of variables that impact health risk.
Some researchers and risk adjustment practitioners would argue that they don’t need to, that they do
an adequate job of differentiating basically healthy people from unhealthy people. They may be good
enough for what risk adjustment models need to do today. But today’s adequacy may not be
tomorrow’s adequacy. As discussed by McKinsey (see Introduction), under PPACA insurers and their
consultants will try to identify “pockets of opportunity” within the risk adjustment system and build
indirect risk selection strategies accordingly.
3. Pockets of Opportunity
What is a pocket of opportunity? A pocket of opportunity is created whenever a
(sub)population of people with the same risk score (whether the score is high, low, or in between) can
be further segmented, using variables outside of the risk score model, between people with lower risk
and people with higher risk. For example, it might be possible for an insurer to identify the heart
disease patients most at risk of an acute heart episode.
While a pocket of opportunity is good find, a pattern of pockets (a “vein” in mining terminology)
is a better find from the perspective of an insurer. If so, an insurer may wish to avoid such patients as
potential insureds or, if the patients are already insured, encourage them to get insurance elsewhere.
As good a risk marker is for a single condition, it would be even better to identify a variable that affects
incidence and prognosis risk across a spectrum of potential conditions.
45 Given their income and education status, Hispanics have particularly good birth outcomes (MMWR, 2011). They also appear to have particularly good longevity (Turra & Elo, 2008).
30
Income may be one such variable. In a working paper Sawhney (2010) built a conceptual model
which supported the argument that income (a component variable of SES) was a variable that could be
used to differentiate risk beyond what is predicted by risk adjustment. She then used a publicly
available database and a publicly available risk adjustment methodology to demonstrate that income
most likely has a financially and statistically significant marginal health risk predictive value after risk
adjustment has been applied to account for the costs associated with age, sex, and prevalent conditions.
McKinsey seems to concur that such broad-based variables can be used to segment risk. In one-
on-one discussions with me over the summer of 2010, McKinsey consultants consistently named SES
and race as variables that they would use for building indirect risk selection strategies.
4. Mechanics
The reader who is somewhat more technical will benefit from a mathematical demonstration of
how risk segmentation will work in a risk-adjusted environment. A reader not much interested in
numbers, should skip to the next section with this thought in mind: risk scores predict the average cost
for a (sub)population of similar people, not any one person. There is still considerable person-to-person
variance within a risk score population – however the population is defined. Additional factors may be
used to identify the people within the population most likely to be low cost from the people most likely
to be high cost – to segment the original population. Although there are usually diminishing returns to
segmentation, the number of potential segmentations is limited only to the available data.46
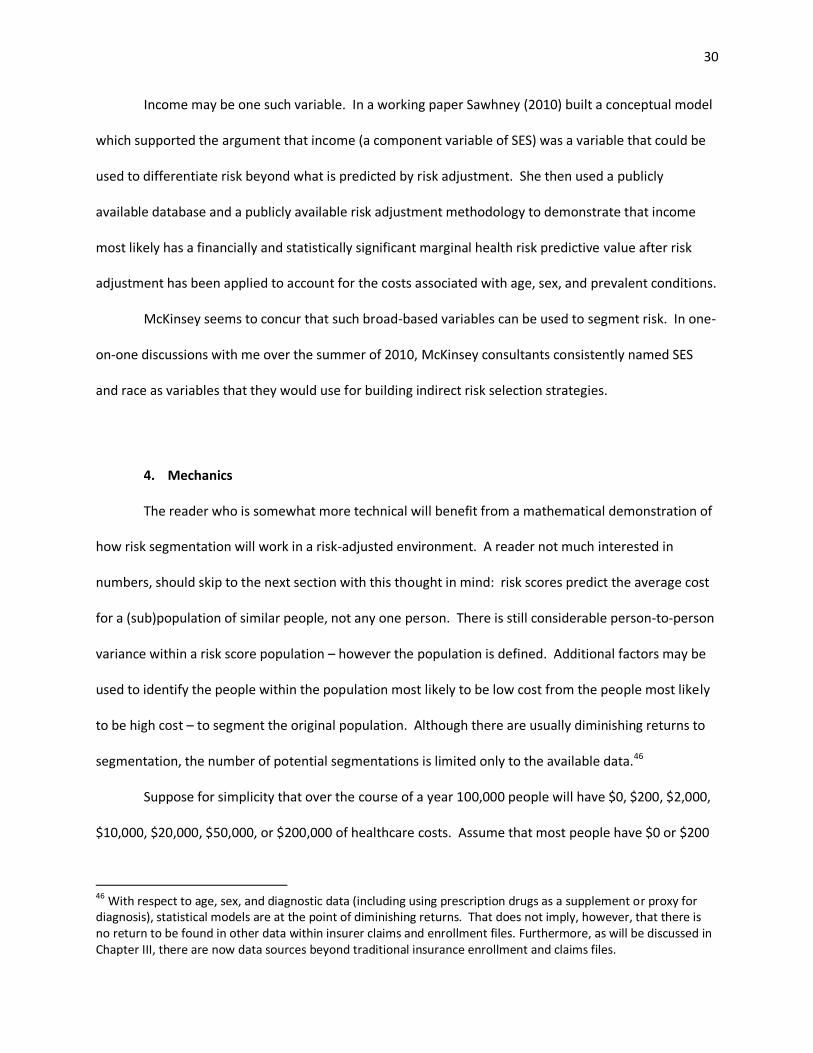
Suppose for simplicity that over the course of a year 100,000 people will have $0, $200, $2,000,
$10,000, $20,000, $50,000, or $200,000 of healthcare costs. Assume that most people have $0 or $200
46 With respect to age, sex, and diagnostic data (including using prescription drugs as a supplement or proxy for diagnosis), statistical models are at the point of diminishing returns. That does not imply, however, that there is no return to be found in other data within insurer claims and enrollment files. Furthermore, as will be discussed in Chapter III, there are now data sources beyond traditional insurance enrollment and claims files.
31
of costs and very few have $50,000 or $200,000 costs. This type of distribution is very typical of
healthcare costs (Stanton, 2006). The average expected healthcare costs for this population is $5,790.
Figure 10
Demonstration: Starting Population
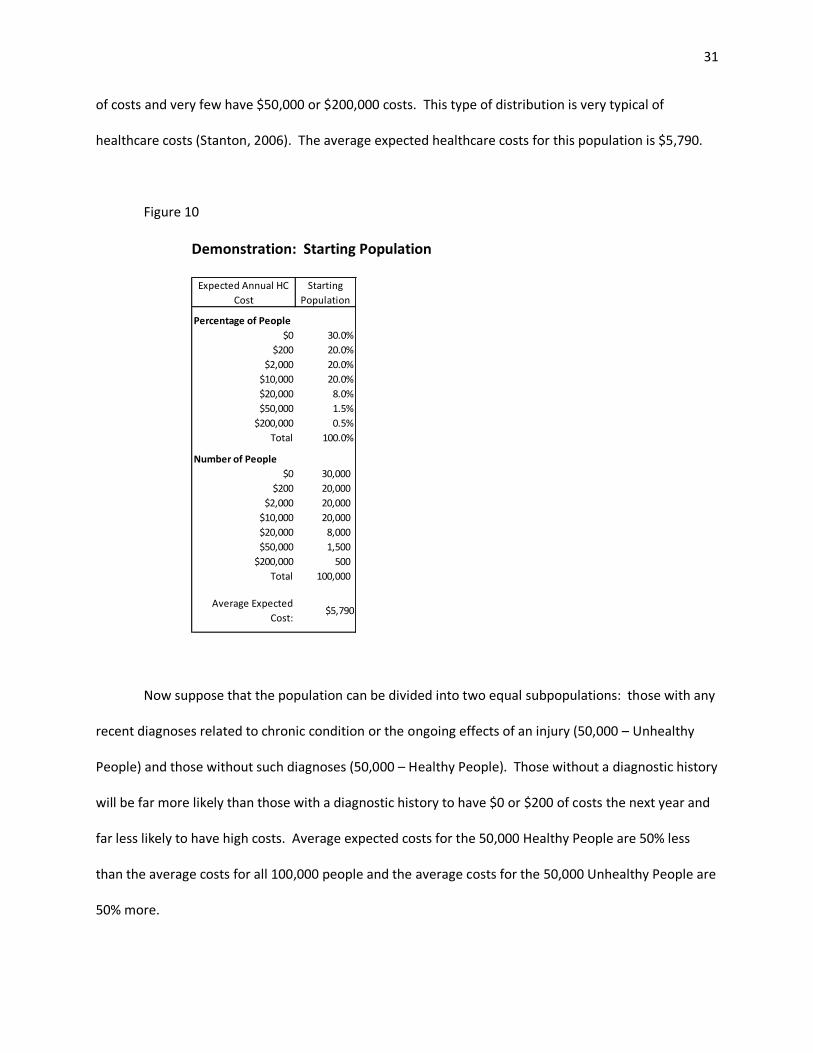
Now suppose that the population can be divided into two equal subpopulations: those with any
recent diagnoses related to chronic condition or the ongoing effects of an injury (50,000 – Unhealthy
People) and those without such diagnoses (50,000 – Healthy People). Those without a diagnostic history
will be far more likely than those with a diagnostic history to have $0 or $200 of costs the next year and
far less likely to have high costs. Average expected costs for the 50,000 Healthy People are 50% less
than the average costs for all 100,000 people and the average costs for the 50,000 Unhealthy People are
50% more.
Percentage of People
$0 30.0%
$200 20.0%
$2,000 20.0%
$10,000 20.0%
$20,000 8.0%
$50,000 1.5%
$200,000 0.5%
Total 100.0%
Number of People
$0 30,000
$200 20,000
$2,000 20,000
$10,000 20,000
$20,000 8,000
$50,000 1,500
$200,000 500
Total 100,000
Average Expected
Cost:$5,790
Expected Annual HC
Cost
Starting
Population
32
Figure 11
Demonstration: Healthy and Unhealthy People
One might be tempted to think that if an insurer, via risk adjustment, gets 50% less for Healthy
People insureds and 50% more for Unhealthy People insureds, the system should work fine. It will, if the
two populations are internally “homogenous”,47 meaning that there are no further ways to differentiate
meaningful segments within the two populations. But the populations are likely not homogenous.
For example, some of the Healthy People may not actually be healthy. They may instead be
people who resist going to the doctor, as the result of denial, philosophy, or general irresponsibility.
Generally irresponsible people may also routinely engage in risky behaviors and activities which
undermine their future health. People who resist going to the doctor may have poor health, but they
47 Homogeneity of risk classes is an important risk adjustment precept articulated by the DxCG researchers who have constructed several generations of Medicare risk models (Pope, et al., 2004). Unfortunately it is very difficult to achieve.
Percentage of People
$0 30.0% 45.0% 15.0%
$200 20.0% 25.0% 15.0%
$2,000 20.0% 15.0% 25.0%
$10,000 20.0% 10.0% 30.0%
$20,000 8.0% 4.5% 11.5%
$50,000 1.5% 0.3% 2.7%
$200,000 0.5% 0.2% 0.8%
Total 100.0% 100.0% 100.0%
Number of People
$0 30,000 22,500 7,500
$200 20,000 12,500 7,500
$2,000 20,000 7,500 12,500
$10,000 20,000 5,000 15,000
$20,000 8,000 2,250 5,750
$50,000 1,500 150 1,350
$200,000 500 100 400
Total 100,000 50,000 50,000
Average Expected
Cost:$5,790 $2,800 $8,780
Differential: -51.6% 51.6%
As Compared To:
Expected Annual HC
Cost
Starting
Population
Healthy
People
Unhealthy
People
Starting Population
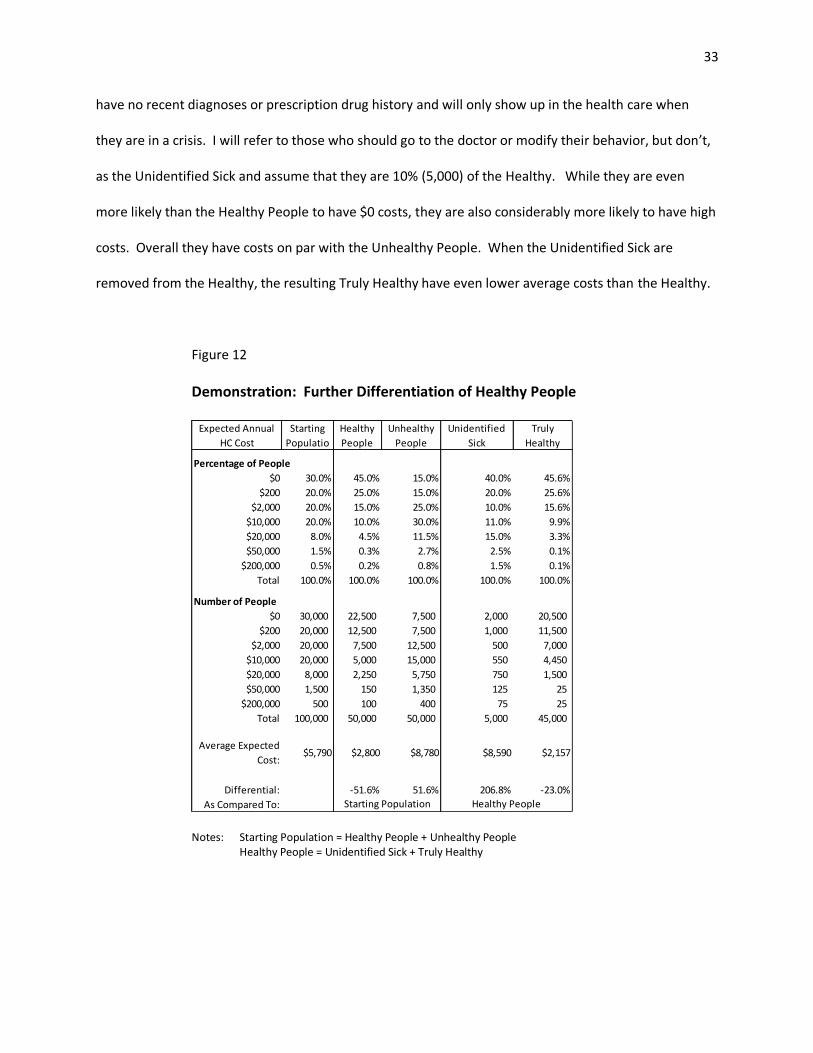
33
have no recent diagnoses or prescription drug history and will only show up in the health care when
they are in a crisis. I will refer to those who should go to the doctor or modify their behavior, but don’t,
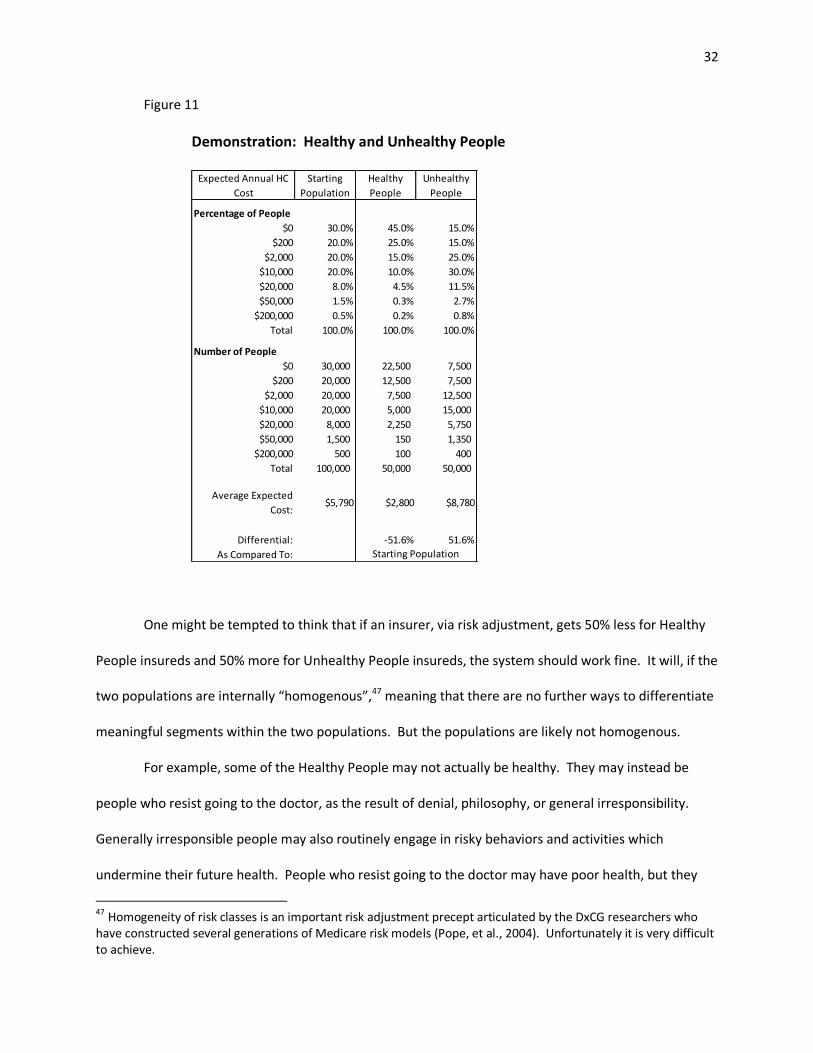
as the Unidentified Sick and assume that they are 10% (5,000) of the Healthy. While they are even
more likely than the Healthy People to have $0 costs, they are also considerably more likely to have high
costs. Overall they have costs on par with the Unhealthy People. When the Unidentified Sick are
removed from the Healthy, the resulting Truly Healthy have even lower average costs than the Healthy.
Figure 12
Demonstration: Further Differentiation of Healthy People
Notes: Starting Population = Healthy People + Unhealthy People Healthy People = Unidentified Sick + Truly Healthy
Percentage of People
$0 30.0% 45.0% 15.0% 40.0% 45.6%
$200 20.0% 25.0% 15.0% 20.0% 25.6%
$2,000 20.0% 15.0% 25.0% 10.0% 15.6%
$10,000 20.0% 10.0% 30.0% 11.0% 9.9%
$20,000 8.0% 4.5% 11.5% 15.0% 3.3%
$50,000 1.5% 0.3% 2.7% 2.5% 0.1%
$200,000 0.5% 0.2% 0.8% 1.5% 0.1%
Total 100.0% 100.0% 100.0% 100.0% 100.0%
Number of People
$0 30,000 22,500 7,500 2,000 20,500
$200 20,000 12,500 7,500 1,000 11,500
$2,000 20,000 7,500 12,500 500 7,000
$10,000 20,000 5,000 15,000 550 4,450
$20,000 8,000 2,250 5,750 750 1,500
$50,000 1,500 150 1,350 125 25
$200,000 500 100 400 75 25
Total 100,000 50,000 50,000 5,000 45,000
Average Expected
Cost:$5,790 $2,800 $8,780 $8,590 $2,157
Differential: -51.6% 51.6% 206.8% -23.0%
As Compared To: Healthy People
Unidentified
Sick
Truly
Healthy
Expected Annual
HC Cost
Starting
Populatio
Healthy
People
Unhealthy
People
Starting Population
34
If risk adjustment does not recognize the difference between the Unidentified Sick and the Truly
Healthy, then the insurer who figures out how to attract and retain more of the Truly Healthy from
within the Healthy People and avoid the Unidentified Sick will come out financially ahead of the insurer
who gets a disproportionate number of Unidentified Sick. In this scenario, the insurer will not care
whether it gets more or less Unhealthy People as the insurer will receive a “fair” premium for the
Unhealthy People.48 But the insurer cares a lot about whether it gets more or less of the Unidentified
Sick within the Healthy. The insurer will lose money with too many Unidentified Sick and make money
by successfully avoiding them. Figure 13 demonstrates that successful selection is predicated on the
percentage of Unidentified Sick, not the percentage of (known) Unhealthy People. A successful strategy,
in fact, can include a disproportionate number of Unhealthy People as the Expected Cost is exactly equal
to the Risk Adjusted Premium for the Unhealthy People.
Figure 13
Demonstration: Financial Impact of Selecting on the Unidentified Sick
The above example is simplistic, but realistic. Today’s risk adjustment systems do not recognize
the difference between the Unidentified Sick and the Truly Healthy. They cannot; after all the
48 In fact the insurer probably does care as there are probably ways to subdivide the Unhealthy People just as there are ways to divide the (seemingly) Healthy People. This will be discussed in subsequent paragraphs.
Unhealthy People 50,000 $8,780 $8,780 50.0% 60.0% 40.0%
Total 100,000 100.0% 100.0% 100.0%
Expected Cost $5,790 $6,259 $5,449
Risk Adjusted Premium $5,790 $6,388 $5,192
Gain/(Loss) $0 $129 -$257
Gain/(Loss) as % of Premium 0.0% 2.0% -5.0%
Distribution of Insureds
Population Number
Expected
Cost
Risk Adjusted
Premium
35
Unidentified Sick are unidentified as per today’s risk adjustment techniques. I will demonstrate in
Chapter III, however, that there is reason to believe that by looking at variables outside of claim files
insurers will be able to identify the people who are most likely to be the Truly Healthy and those most
likely to be the Unidentified Sick and develop indirect risk selection strategies accordingly.
Large claims have a disproportionate effect worthy of specific discussion. Insurers will chose to
select if the selection will likely cause a profitability impact. Simplistically, the profitability impact is the
product of the number of people selected and the profitability differential between those selected and
those that would have been selected by default. More profit therefore can be made by either 1)
selecting more people or 2) selecting people who have the largest profitability differential.
The largest profit differentials are with respect to people who have severe health conditions
that are likely to generate $100,000 more in claims, but for whose risk adjusted premium is much less
than their expected costs. This is quite possible. A typical heart patient might have expected costs
under $20,000 a year. A heart patient who is a candidate for a heart transplant, however, might have
expected costs of well over $100,000, either because the patient will have the transplant or because the
patient will have expensive care while the patient waits for the transplant or possibly dies. As previously
discussed current risk adjustment models do a poor job differentiating by illness severity; none of them
differentiate by intended treatment.49
So far the discussion has focused on rather broad-based selection strategies, such as selecting
between the Truly Healthy and the Unidentified Sick. The other possibility is much more specific:
actively avoid the people who are most likely to produce large losses and if they are already insureds,
“encourage” them to go elsewhere, such as making sure not to have an affiliation with the region’s high
49 No one suggests a model which uses intent to treat. As a matter of social policy, no one wants to pay insurers or providers more for simply providing more care, irrespective of whether care is needed or not. Hence the use of prior healthcare utilization was rejected early on as a risk prediction variable even though prior utilization is statistically valuable (Dunn, et al., 1996; Ellis, et al., 1996).
36
volume transplant surgeons. The example in Figure 14 and Figure 15 shows that gaining or losing just
0.5% of “Very Ill” potential enrollees can have a very significant bottom line profitability impact.50
Figure 14
Demonstration: Differentiation of the Unhealthy by Severity
Notes: Starting Population = Healthy People + Unhealthy People Unhealthy People = Somewhat Unhealthy + Very Ill
50
In health insurance there are always a few very large claims, creating what is known in statistics as a “long-tailed distribution”. Average costs are very sensitive to the number and size of the largest claims; “the tail wags” average costs (Stanton, 2006). Furthermore, it is well acknowledged that risk adjustment models don’t work well in predicting the largest claims. Because the largest claims don’t fit well and will skew the predictions with respect to all other people, risk models are more often than not developed and tested with the largest claims truncated down to a lower value (Schwartz & Ash, 2003; Winkelman, Mehmud, & Wachenheim, 2007).
Percentage of People
$0 30.0% 45.0% 15.0% 15.3% 0.0%
$200 20.0% 25.0% 15.0% 15.2% 5.0%
$2,000 20.0% 15.0% 25.0% 25.4% 7.5%
$10,000 20.0% 10.0% 30.0% 30.4% 10.0%
$20,000 8.0% 4.5% 11.5% 11.2% 25.0%
$50,000 1.5% 0.3% 2.7% 2.1% 32.5%
$200,000 0.5% 0.2% 0.8% 0.4% 20.0%
Total 100.0% 100.0% 100.0% 100.0% 100.0%
Number of People
$0 30,000 22,500 7,500 7,500 -
$200 20,000 12,500 7,500 7,450 50
$2,000 20,000 7,500 12,500 12,425 75
$10,000 20,000 5,000 15,000 14,900 100
$20,000 8,000 2,250 5,750 5,500 250
$50,000 1,500 150 1,350 1,025 325
$200,000 500 100 400 200 200
Total 100,000 50,000 50,000 49,000 1,000
Average Expected
Cost:$5,790 $2,800 $8,780 $7,686 $62,410
Differential: -51.6% 51.6% -12.5% 610.8%
As Compared To: Unhealthy PopulationStarting Population
Expected Annual HC
Cost
Starting
Population
Healthy
People
Unhealthy
People
Somewhat
UnhealthyVery Ill
37
Figure 15
Demonstration: Financial Impact of Selecting on a Few Truly Ill
I. Deciding to Select
If risk adjustment is incomplete, insurers may be able to benefit from indirect selection –
particularly if they can identify variables not in the risk adjustment model which help them to broadly
segment risk or to identify the most unprofitable potential insureds. If so, insurers may then then
deliberately use indirect selection to obtain competitive advantages or to at least guard themselves
from being at a competitive disadvantage. If multiple insurers do so, an arms race could emerge. As
insurers in an arms race increasingly work to attract potentially more profitable insureds to their plans
and to discourage potentially less profitable insureds, de facto insurance choices for categories of
consumers who share one or more risk characteristics will become increasingly limited. The system may
balance at some point, but when it does some categories of insureds may no longer be able to purchase
insurance from a competitive market of insurers and plans. Chapter III will discuss the details of how
indirect selection might be accomplished. This section will concentrate on the decision to engage in
such behavior.
Insurers who have been utilizing direct selection (underwriting) for decades in order to meet
their profit goals and maintain competitiveness now have a strategic void to fill. Their competitive will
"Normal"
Successful
Selection
Unsuccessful
Selection
Healthy People 50,000 $2,800 $2,800 50.0% 50.0% 50.0%
has not been lost, but their primary means for maintaining competitiveness has been curtailed. They
may look to indirect selection to fill the void, particularly if competing on quality and price is proves to
be daunting. Profit maximizing insurers will engage in indirect selection if they see a profitable
opportunity; even less-than-profit-maximizing insurers51 will engage in indirect selection if they see their
profit maximizing competitors doing so and they are concerned with the loss potential caused by
insuring the market “leftovers”.
Insurers will assess potential profitability of indirect selection by examining the associated
benefits and costs. The benefit is an improved risk profile and hence lower expected healthcare costs.
Some portion of the changes in risk profile will flow through into risk adjustment. On the cost side, are
the primary and secondary costs associated with developing and executing an indirect selection
strategy. The insurer’s analysis can be depicted as:
Figure 16
Note that unlike the previous figures, this figure represents one insurer, not an entire system. The outer boundaries of the boxes and the profit/loss arrow are dashed to indicate that sizes are unknown.
51
Not all insurers are for-profit corporations.
39
The benefits of indirect selection must exceed the risk sharing primary and secondary costs in
order for the indirect selection strategy to be profitable. It is useful to examine each of the new blocks.
Primary costs are the immediate monetary costs necessary to develop, deploy, and maintain an
indirect selection strategy. These costs include the cost to acquire outside data and the internal and
consultant time in order to develop and implement the strategy. Primary costs are associated with an
indirect selection strategy.
In contrast secondary costs result from an indirect selection strategy. They may be intangible
and probabilistic, such as the potential loss of a positive consumer image or a regulatory license. These
costs are important considerations. Even though indirect selection may be difficult to regulate, it is
clearly not sanctioned under the healthcare reform legislation. Sections 1302, 1331, 1557, 2704, 2705,
and 2706 variously prohibit “discrimination” with respect to “pre-existing conditions”, “health status”,
“health status related factors”, “expected length of life”, disability, age, race, gender, national origin,
religion, and other factors. Section 2706 says that wellness efforts should not be a “subterfuge for
discrimination”. Section 1311 mandates that qualified health plans “include within health insurance plan
networks those essential community providers, where available, that serve predominately low-income,
medically-underserved individuals”. These passages suggest that purposeful indirect selection is not
acceptable. An insurer who is found or suspected of purposefully benefiting from indirect select may
garner unfavorable press and face potential regulatory sanctions. These potential costs will be factored
into the insurer’s decision to indirectly select or not.
Figure 16 suggests how regulators can minimize indirect selection. One method is to refine risk
adjustment so that an increasing portion of any selection gain (and loss) is shared with other insurers.
Another method is to increase the secondary costs, primarily by actively monitoring for indirect
selection and imposing penalties when indirect selection is detected. The third method, increasing
40
primary costs, can be accomplished by taxing indirect selection efforts or the data required to develop
indirect selection strategies. The third method involves sanctioning indirect selection. Indirect
selection is against the letter and intent of healthcare reform. I therefore will not discuss the third
method any further. Regulators need to concentrate on the first two methods: enhancing risk
adjustment and increasing secondary costs.
J. Social Costs
The societal costs of not minimizing indirect selection must be an integral part of any discussion
as to when, why, and how regulators should take action to minimize indirect selection. The societal
costs may be substantial and multi-faceted. Joseph Newhouse (Newhouse, Risk Adjustment: Where Are
We Now, 1998), a Harvard professor and one of the preeminent authorities on health insurance
systems, writes that absent adequate risk adjustment:
1. Plans have an incentive to configure their product(s) and market their
services so as not to appeal to bad risks. Because all plans have such an incentive, bad
risks could find themselves treated as pariahs.
2. Plans have an incentive to appeal to good risks. In effect, competition
for good risks means some of the potential profit on good risks is likely to be spent
attracting them, but resources so spent may be socially wasteful.
Baker (Baker T. , 2003) points out that both results tend to maintain, rather than eliminate,
social inequalities. The person who most needs insurance to maintain or improve his status does not
41
get insurance or gets it on less favorable terms. The person who least needs insurance has more
insurance options and better insurance benefits.52
Van de Van and van Vliet (1992) pointed out that favorable53 indirect selection is
counterproductive with respect to “the three supposedly positive effects of competition”, “quality and
efficiency of care and becoming more responsive to the consumers’ preferences”. Competition, quality,
efficiency, and responsiveness to consumer preferences are central goals of today’s healthcare reform.
Newhouse’s effects can be placed into the conceptual models. I will start with the second effect
– the social waste of resources in the form of direct and secondary selection costs. If, as before, I
identify socially undesirable model elements of the model via colored shading, the decision to indirectly
select is depicted as:
52
It is interesting to note that the social costs of indirect selection result from insurance being oversold to the privileged and undersold to the vulnerable. This is the opposite direction of the typical discussion of the social costs of target marketing. The typical discussions of the social costs of targeting market concern the overselling of potentially harmful consumer products (such as unhealthy food, alcohol, and cigarettes) to vulnerable populations (Smith & Cooper-Martin, 1997). Health insurance is a beneficial rather than potentially harmful product and therefore the concern is its limited availability to vulnerable populations. The same applies to other financial risk products, including life insurance and mortgages (Holmes & Horvitz, 1994). Regardless of whether a product is over or under sold to a particular population target marketing results in distributional effects which are of concern to society. 53
Profitable.
42
Figure 17
The arrow is pointing to profitability as insurers will only expend selection costs if they believe
selection will be profitable. Van de Van and coauthor’s (van de Ven W. P., van Vliet, van barneveld, &
Lamers, 1994) discussion of risk adjustment within the Dutch health system is entirely consistent with
Figure 17.
An important takeaway from Figure 17 is that risk adjustment does not need to be perfect. It
does not need to absorb the gain from an improved risk profile. It just needs only to absorb the gain net
of costs. The analysis of potential profitability will vary by the circumstance of the particular insurer.
For example, Van de Ven and coauthors (1994) point out that the costs may be different for small
companies and large companies as larger companies may have more to lose reputationally and
therefore assign a higher secondary cost to reputation risk.
43
Assuming that at least some insurers will select, we will now incorporate Newhouse’s first social
waste – limited choice for certain risks into the insurance system model. When risk adjustment is not
sufficient, insurers select, and the market subsequently balances,54 the balance looks like this:
Figure 18
This Figure 18 uses the term “de facto limited choice”. De facto limited choice includes both
limited choice (such as a narrow range of plans in a market) and scenarios where choice appears to be
present, but is not practical from the perspective of some portion of consumers. For example, a
consumer may have the choice of 4 insurers but maybe only 1 insurer will have providers within a
reasonable distance of the consumer’s home. For all effective purposes that consumer does not have a
choice of insurers.
The natural consequence of a market in which insurers compete based on indirect selection is a
limited set of choices for a portion of the consumer population – generally, but not necessarily, high risk
54 It is not a given that the competitive market will balance – reach equilibrium. In 1976, in one of the most cited insurance papers ever, theoretic economists demonstrated that “not only may a competitive equilibrium not exist, but when equilibria do exist, they may have strange properties” (Rothschild & Stiglitz, 1976). Absent a competitive equilibrium a market may collapse or shrink to only one insurer.
44
individuals. Other people, however, will still have a competitive variety of choices. We will discuss
indirect selection actions and consequences in more detail in the next two sections.
Fortunately there are a range of potential regulatory interventions and monitoring strategies
which can be deployed by regulators to limit indirect selection. They will be the topic of the final
chapter of this paper. In the next chapter we will discuss how insurers may construct indirect selection
strategies.
45
III. INDIRECT SELECTION UNDER HEALTHCARE REFORM
A. Intent
The previous chapter was theoretical. Any discussion of post-healthcare reform must be
theoretical as the provisions of healthcare reform which will fundamentally restructure the individual
health insurance market will not go into effect until January 2014. While it is impossible to know what
insurers will actually do, it is possible to assess their intent, the intent of their consultants, and the
availability of necessary data and technical skills.
The Error! Reference source not found. documents McKinsey’s intent to help clients develop
indirect selection strategies and methodologies. McKinsey is not the only consulting firm offering such
advice. Market segmentation is nearly a mantra for the consultants, and even some academics, who
are thinking about how insurers will competitively succeed in the post healthcare reform market.
Some of the thinking is an extension of thinking that started before healthcare reform. Since
2008 Deloitte has been advising insurers to “expand market segmentation analyses beyond
demographics and health status” (Keckley & Eselius). Sometime in 2009 Booz & Company predicted that
in response to reform “insurers will need to deepen their retail capabilities and adopt a more
sophisticated consumer lifetime value business model” and “reevaluate their consumer targeting
marketing strategies” (Knott, Nallicheri, Lall, & Kaura). Based on a survey of healthcare payer experts,
IDC Health Insights researchers in January 2010 predicted that “segmentation will become the new
strategic asset”.
Just as healthcare reform was being passed in February 2010, Ingenix,55 the consulting arm of
the insurance giant United Health Group, advised insurance clients that they should “design pro-active
products and programs that attract, retain, incent and balance a membership... to remain profitable”.
55
Now named Optum.
46
Oliver Wyman, presumably in early 2010,56 advised insurers to post-reform “segment your customers
based on sensitivity to price, brand, and product – but also in terms of their attitudes: how they want to
access product, for example, and their potential for engagement in wellness programs, disease
management, and other ‘pro-health’ activities” (Oliver Wyman). Forte Partners published an article in
March 2010 titled “Healthcare Marketing (The Basics): Market Segmentation”. It specifically advised
segmentation by geography, demography, values, lifestyle, and behavior (Forte Partners).
In June 2010, three months after healthcare reform was passed, an article appeared in Health
Affairs (Brennan & Studdart) that talked of the importance of “strategic market segmentation” under
healthcare reform. Sometime in mid-2010 CloserLook, a boutique firm dedicated to serving health
insurance clients, wrote “A bold new world without medical underwriting doesn't mean you can't do
everything in your power to attract young, healthy customers. It just means you have to find different
ways of doing it. You won't be able to eliminate the unhealthy. You will have to find ways to attract and
close your target customers, and they may not be who you think they are now” (Riley, 2010). In an
earlier essay they seemingly advocated given worse customer service to less desirable existing
customers (Riley, 2009) and in more recent essays Riley talks about specific strategies for identifying and
targeting the “best insurance customer” (Riley, 2011-1; Riley, 2011-2)
In September 2010, the Director of Product development for Emblem Health, gave a
presentation at a health insurance marketing conference where he said that future success will require a
“new understanding and definition of the customer and more sophisticated customer segmentation”,
registrations, store preferred-customer applications and purchase records (Stehno & Johns, 2006).
Public records include motor vehicle, property, and court records. Credit card data can be particularly
robust and may originate from the credit card company or from the store where the purchase is made.
Stores routinely ask credit card purchasers their zip code. Stores use the name from the credit card and
the zip code to link the purchase to a specific person and address (AP, 2011).59 They then use the data
for their own marketing purposes and also resell it to consumer marketing companies. Credit card
companies, of course, already have detailed data on most adults.
Although analysts often work from summarized data, such as the data shown above, the data is
also available in a more granular form. Stehno commonly speaks of up to 3,000 data fields per person
(Stehno, 2009). Consumer data companies will work with clients to build custom summaries different
than those detailed above. For example, Stehno claims that he can assess the quality of a
person’s/family’s diet, including the probability of obesity, based on their fast food, grocery store, and
dining purchase data. Individual/family-level data is available for approximately 95% of the people in
the US (SOA Record, 2005).
The individual-family level data outlined above is considered to be neither protected health
information (PHI) as regulated under the Health Insurance Portability and Accountability Act (HIPAA) nor
credit information as regulated under the Fair Credit Reporting Act (FCRA). As such, insurance
59 Gas stations are the exception. They transmit zip codes to the credit card company for identification purposes and do not store the number for their own use (AP, 2011).
52
companies can access the data without individual consent and use it for insured segmentation, target
marketing, and other strategies (Shreve J. , 2009-2).
Ultimately neighborhood-level and individual-family level datasets converge. The
neighborhood-level data starts with US census data, at the block and census track level and builds from
there. Individual-family level data is rolled up to the neighborhood level. Stehno said at a conference
that neighborhood-level data is nearly as good as individual/family level data for making individual-level
predictions.60 In addition to consumer data, business and other data is collected from a variety of
sources and mapped to neighborhoods. Business data can tell a lot about the characteristics of a
neighborhood, including safety and availability of healthy food choices – characteristics which affect
health risk.
It is important to note that consumer data is never 100% accurate. The data companies start
with bits and pieces of data, some of which is old (up to 10+ years for census data) and much of which is
incomplete (people still anonymously pay cash for some purchases). They then build predictive models
in order to make best guesses regarding the variables in the above lists.61 But even with the resulting
inaccuracies, client companies in a variety of industries have found value in using the data for market
segmentation.
It is also important to note, that unlike epidemiology, with respect to predictive modeling,
correlation is as good as causation. For example, middle-aged people who drive sports cars may be
healthier than their peers. If so, even though owning a sports car clearly doesn’t cause good health,
sports car ownership may legitimately be used in a predictive model to identify healthy people.
Slimmer, more mobile (no bad knees and backs), and more affluent people may own sports cars.
Weight, mobility, and affluence are not captured by today’s risk adjustment systems.
60 Predictive Modeling Symposium, Oct 8-9, 2009, Chicago, IL, a Society of Actuaries sponsored event, as witnessed by Tia Goss Sawhney. Stehno did not provide handouts. 61
Hence why I, a European-American with an Indian surname, has received marketing calls in Hindi and Punjabi.
53
Consumer marketing databases provide information concerning 5 of the 9 categories of
variables not included in today’s health risk adjustment models discussed in Chapter II:
Figure 21
Consumer Marketing Databases Provide Missing Information
Predictive Variable
Consumer Marketing Databases
A. Behavior X B. Environment X C. Healthcare utility X D. Physical and cognitive limitations E. Severity F. Timing G. Genetics H Socioeconomic status (SES) X I. Race and ethnicity X
C. Predictive Model Recipes
Predictive modeling uses the past to predict the future. Consumer marketing data is only a
portion of the data required to build the predictive models that will underlay target marketing
strategies. Predictive models require a historical data set with input (predictive) variables and at least
one outcome variable.
The outcome of most concern for insurers is profit:
54
Figure 22
Profit = Premium
- Administrative Expenses
+/- Risk Adjustment
- Claim Costs
But other outcomes are also valuable, often because they are intermediate variables62 on the
path to profit predictions. For example, an insurer may wish to predict heart disease costs as one of
several chronic disease category predictions necessary to predict the claims costs portion of profit.
No one knows the final details of post healthcare reform premiums, administrative expenses,
and risk adjustment, but informed estimates can be made. Profit predictions don’t need to be precise –
they merely have to distinguish the clearly profitable, the marginally profitable, the not profitable, and
the biggest losers. Insurers and their consultants can use today’s claims files and assumptions about
post-healthcare reform premiums, administrative expenses, and risk adjustment to calculate each
insured’s profitability as if the post healthcare reform market were today.
Insurers can then use names, addresses, and other identifying information to link each of
today’s insureds to consumer marketing data. Once linked, the insurers can then use predictive
modeling techniques to discern which consumer marketing characteristics are most associated with
profitable and unprofitable insureds. A profitability score can be developed via the following recipe
which can then be used to assess the suitability of future insureds based on their consumer marketing
data characteristics. Marketing strategies can be built to disproportionately enroll the most profitable
insureds.
62 An intermediate variable is an outcome variable for an initial predictive model and a predictive variable for a successive predictive model.
55
Figure 23
New Business Predictive Modeling Recipe
Ingredients: Claims data of today’s insureds for one period63 Reasonable approximations of premiums, expenses, and risk adjustment under healthcare reform Consumer marketing data for today’s insureds Consumer marketing data for prospective new insureds post healthcare reform
Steps: 1. Use claims data of today’s insureds 2. Calculate profitability of each insured, assuming post healthcare reform premiums, expenses,
and risk adjustment 3. Link profitability to that insured’s consumer marketing data 4. Use predictive modeling techniques to determine the profiles of the most profitable and least
profitable insureds, perhaps expressed via a profitability score 5. Develop a marketing strategy that post healthcare reform disproportionately enrolls profitable
new insureds based on the prospective insureds’ consumer marketing data profiles 6. Repeat steps 1 through 5 as new claims data emerges, substituting actual post healthcare reform
premiums, expenses, and risk adjustment when they become available
As already discussed, indirect selection is predicated on disproportionately attracting and
retaining the most desirable (profitable) insureds. The above predictive modeling recipe can be used to
build an attraction strategy.
Predictive modeling can also be used to build a retention strategy. Disproportionate retention
can be accomplished by keeping the desirable insureds fully satisfied and/or creating sufficient
dissatisfaction among the undesirable that they disproportionately move to another insurer. Desirability
is forward looking. A profitability loss in the prior period may have significant or no relevance for
desirability. The latter is likely in the case of an expensive but fully resolved accidental injury or an acute
condition for otherwise low accident, healthy person.
Retention involves people who are already insured. Therefore the insurer has claims data for
them. As previously discussed, claims data has predictive value beyond the value already incorporated
into risk adjustment. For example procedure codes and total costs can be used to assess severity. Dates
63 One year is the most common period for risk adjustment modeling. But predictive modeling for insurer profitability does not need to be a year. An insurer might be interested in knowing who the most profitable insureds will be over three years.
56
indicate whether the condition /treatment is current or resolved – highly relevant to future costs. Some
insurers also have clinical data.64 Finally, the insurer still has access to consumer marketing data.
Claims data, clinical data, and consumer marketing data collectively describe all of the variables
described in Chapter II (Omitted Variables) that are omitted from today’s risk adjustment models.
Figure 24
Omitted Information Available for Retention Modeling
Predictive Variable
Consumer Marketing Databases
Insurer Claims Files
Insurer Clinical Files, if
Available A. Behavior X
B. Environment X
C. Healthcare utility X X
D. Physical and cognitive limitations X
E. Severity X X
F. Timing X X
G. Genetics X
H Socioeconomic status (SES) X
I. Race and ethnicity X
Collectively the data provides a nuanced view of the insured. This is where narrowly-defined
pockets of opportunity can be found. For example, the insurer may find that higher income, better
educated insureds with recently diagnosed, mild diabetes are unlikely to have diabetic complications
over the next several years. If the risk adjustment is adequate for the costs associated for the average
“diabetic w/o complications” (an actual diagnostic group description) then insurers may embrace these
64 Insurers with integrated managed care organizations, such as Kaiser Permanente have access to clinical data (Terry, 2011). In recent years other insurers have been adding clinical data to their claims data, mostly in the form of laboratory test result data from preferred laboratories (Grossman, Zayas-Caban, & Kemper, 2009). Emerging health information exchanges may provide a wealth of clinical information.
57
diabetics while finding ways to send the impoverished, alcoholic, non-controlled diabetic, at high risk for
an amputation and kidney failure, elsewhere.
The predictive modeling recipe for retention uses claims data as both a source of predictive
variables and a component of the outcome profitability calculation. The recipe therefore requires two
periods of claims data.
Figure 25
Retention Predictive Modeling Recipe
Ingredients: Claims data of today’s insureds for two periods65 Reasonable approximations of premiums, expenses, and risk adjustment under healthcare reform Clinical data for today’s insureds, if available, for the first of the two periods Consumer marketing data for today’s insureds Claims, clinical information (if available), and consumer marketing data for post healthcare reform insureds
Steps: 1. Use the second period claims data of today’s insureds 2. Calculate profitability of each insured, assuming post healthcare reform premiums, expenses,
and risk adjustment 3. Link profitability to each insured’s first period claims data, any available clinical data, and
consumer marketing data. 4. Use predictive modeling techniques to determine the first period profiles of the insureds who
will be most profitable and least profitable in the second period, perhaps expressed via a profitability score
5. Develop a customer strategy that post healthcare reform disproportionately retains profitable post healthcare reform insureds based on the insureds’ claim histories, available clinical data, and consumer marketing data profiles
6. Repeat steps 1 through 5 as new claims and clinical data emerges, substituting actual post healthcare reform premiums, expenses, and risk adjustment when they become available.
If these recipes sound complicated it is because they are. Making them work is the province of
MS and PhD statisticians working with big datasets on big computers. But they are not novel recipes.
65 Risk adjustment models typically use one year of claims data to predict the next year of claims – two one year periods. But predictive modeling for insurer profitability may be different. The periods may be equal or unequal length. For example, an insurer may be interested in using one year of claims data to predict profitability over the next three years.
58
Very similar recipes have been deployed for years in other industries.66 McKinsey and other consulting
firms have statisticians with the requisite skills.67
D. Selection Touch Points
1. Conceptual Model
In Chapter II discussed indirect selection in broad generalities. So this Chapter has simply
assumed that insurers will be able to use predictive modeling results to implement indirect selection
strategies – strategies that yield a profit net of risk adjustment, primary costs, and secondary costs (see
Figure 17). I will now present a conceptual model to depict the touch points that insurers have available
for implementing an indirect selection strategy. “Selection touch points” refer to the various decisions
and activities by which insurers may influence consumer direct selection – ways by which insurers
potentially indirectly select.
The conceptual model calls upon the literature of van de Ven and Ellis (2000), Newhouse (1994),
van de Ven and van Vliet (1992), and Ellis (1988), who have provided relatively comprehensive reviews
of indirect selection. Unfortunately there is no consistent nomenclature for indirect selection. Van de
Ven (van de Ven & van Vliet, 1992; van de Ven & Ellis, 2000) refers to advantageous indirect selection as
“cream skimming”, as do other authors. Still other authors refer to “preferred risk selection” and
“cherry picking”.68 Ellis (1988) refers to “creaming” with respect to the overprovision of services to low
66
The recipes are exercises in “predictive modeling”. Predictive models are the basis for market segmentation strategies for a broad range of industries. Predictive modeling for market segmentation is sometimes also known as “database marketing”. Google.scholar.com yields 112,000 articles for “marketing” + “predictive”. 67
McKinsey pioneered using non-MBA consultants (McKinsey, 2011). McKinsey employs more than 3,000 masters and higher-level educated consultants who do not have MBA degrees. 1,400 of these consultants have PhDs. 68 Depending on context, preferred risk selection and cherry picking can refer to either indirect or direct (underwriting) selection. The authors cited in this section are referring to preferred risk selection and cherry picking in the context of indirect selection. There are sometimes also definitional differences with respect to indirect selection. For example Zweifel (1997) asserts that target marketing, since it involves identifying specific consumers, is direct selection. Targeting a consumer is, however, is a much less direct selection than having the
59
risk insureds, “skimping” with respect to the under provision of services to high risk insureds, and
“dumping” as the explicit avoidance of high risk insureds. Although it has not yet made it into academic
literature, the popular press sometimes refers to “cherry picking and lemon dropping”. Although more
cumbersome, I prefer “advantageous indirect selection” rather than “cream skimming” and other
potential terms as it offers maximum clarity and allows for an easy transition to discussions of
disadvantageous indirect selection and direct selection.
Turning now to the touch point model, there is general concurrence that selection can occur
pre-enrollment and post-enrollment via differential attraction and retention of insureds. Furthermore,
pre-enrollment insurer activities can be divided into three phases: plan design, marketing, and
enrollment. Therefore the initial indirect selection touch point model is: 69
Figure 26
This model, however, is not sufficient. Health insurers can manipulate post-enrollment insured
satisfaction and hence retention and disenrollment by imposing barriers to care via their care
management processes.70 Furthermore, given that PPACA creates at least 50 state markets and the
possibility of distinct markets within states (Section 2701), an insurer’s initial selection decision is
power to overtly deny a consumer coverage, therefore the authors cited in this section and I feel that target marketing is indirect selection. 69 The elements of this model are frequently discussed in insurance literature. Denoncour (2010) provides an example. 70 Glazer & McGuire (2000), authors of one of the cornerstone papers concerning the use of care management practices as a selection tool, refer to barriers that insurers may impose on services, such as advanced diagnostic tests, which lead to high cost treatments and services, as “shadow prices”.
60
whether to enter a market or not. Therefore a more expanded selection extends the initial model on
both ends:
Figure 27
This model is still incomplete, however, as it omits providers. Insurers seek to attract and retain
both insureds and providers. An insurer decides to enter and to stay in a market based on the market’s
potential insureds and providers.71 An insurer and insurance plan is more or less attractive to insureds
based on the providers who provide services. Care management occurs at the interface of insureds and
providers. Hence providers must be an integral part of the model, inclusive of the compensation offered
the provider, the recruitment of providers, which providers actually enroll with the insurer, whether the
provider stays enrolled, and how the provider manages care.
A complete model therefore is:
71 Preferred provider networks are the norm for today’s health insurance plans. Some insurance plans go a step further and have “closed panels”. PPACA assumes that insurers will have preferred providers (see PPACA, Sections 2719A, 2709, and 1320).
61
Figure 28
The model is consistent with the table of selection techniques (Table 2: Health plan response to
incentives created by the way that health plans are reimbursed) that van de Ven and Ellis (van de Ven &
Ellis, 2000) present and their associated discussion.
In this model, time is loosely represented from left to right. The consumer (green) and provider
(red) boxes are purposefully not vertically aligned with each other in order to make the point that
consumer decisions are often made based upon the availability and quality of providers and that
insurers need to have at least some providers in place before they can attract potential insureds.
2. System Perspective
Figure 28 depicts the touch points by which insurers may be able to affect indirect selection.
When considering touch points, it is important to keep the system perspective presented in Chapter II in
mind. Insurers indirectly select by influencing the consumer’s (or insured’s) selection. There needs to
be something for consumers to select in order for there to be insurer indirect selection. The more
consumers can select, the more insurers will indirectly select (Figure 18). Insurers manipulate the touch
points to influence which consumers buy, what plan, from what insurer, at what price; which consumers
62
continue with their plan at renewal; and which consumers leave. Controlling indirect selection involves
1) improving risk adjustment, 2) limiting consumer choices and/or 3) limiting the ability of insurer’s to
manipulate the touch points.
A system perspective is also essential to understanding the interrelationship between the touch
points. Ultimately these touch points and consumer choice exist in a complex interrelated system,
hence the circular design. Change with respect to one touch point may result in change with respect to
other touch points. For example, a change in a care management policy, such as requiring a
cumbersome pre-approval of certain services, will affect the retention of providers and insureds. The
loss of providers may elicit additional losses of insureds and the loss of insureds may elicit the loss of
additional providers, which may then cause the insurer to pay the remaining providers more.
E. Market Segmentation
There are therefore three necessary components to an indirect selection strategy: consumer
choice, the ability to differentiate between consumers most likely to be profitable and consumers most
likely to be unprofitable – market segmentation, and ability to influence consumer choice via one or
more of the touch points. The touch points may be either consumer-side (top of Figure 28) or provider-
side (bottom of Figure 28) touch points. A full range of touch points is ideal, but either consumer-side or
provider-side touch points may be sufficient to affect indirect selection.
Figure 29
Indirect Selection Strategies Require:
Consumer Choice + Market Segmentation + Available Touch Points
Ideally, but not required (one side may be sufficient):
Available Consumer-Side Touch Points + Available Provider-Side Touch Points
63
Insurers will rely upon predictive models to describe the profitable and unprofitable (post risk
adjustment) market segments. They will then design their touch points accordingly. The segments may
be defined using any available predictive variable that an insurer has available either in-house or from a
consumer marketing databases. As discussed in Chapter II, the variables will most likely be variables not
incorporated in today’s risk models72 and will describe either sizeable populations of people who have at
least modest post-risk adjustment risk differences or smaller groups of people who have substantially
greater cost differences. No academic who has considered health insurance indirect selection would
disagree.
F. Academic Shortcomings
Academic thinking with respect to health insurance indirect selection, however, has not kept up
with professional practice. First, academics have not considered the power of consumer marketing
databases. I have been unable to find a single reference in a the academic literature that discusses the
possibility of incorporating consumer marketing databases into the development of health insurance
(direct or indirect) selection strategies. The closest that I have found is by Duncan (2011), a practicing
actuary with an academic affiliation, who prepared a risk adjustment textbook for actuaries. He devotes
several early pages of his book to the use of consumer databases. Clearly the practitioners are well
ahead of the academics. Seemingly unnoticed by the academics and, most likely, the regulators that the
academics advise, practitioners have tapped into and plan to increasingly tap into this massive and
powerful data source. Even if academics have noticed, there is little that they can do with respect to
empirical analysis. Insurers and their consultants have access to identified claims data, inclusive of
72 Variables included in today’s models may be used if the estimates associated with those variables are biased or the outcomes heterogeneous. But such results are not the “low hanging fruit” and lead to technical discussions beyond the scope of this paper.
64
addresses, that they can link to consumer marketing databases. Because of privacy constraints, the
insurance information that gets passed to academics is de-identified. Academics therefore cannot link
insurance data to consumer databases.
Second, academic thinking with respect to health insurance also falls short with its nearly
exclusive focus on the individual. Academics focus on whether a given person is healthy or not healthy
and whether risk adjustment appropriately adjusts for that person’s risk. Risk adjuster performance is
most commonly reported in terms of R2 (R-squared) – the fit between the risk prediction and the actual
costs at the individual level. Any errors in the prediction are assumed to be randomly distributed. The
purpose of insurance, however, is to spread risk. The profitability or non-profitability of a single insured
does not matter if the total number of insureds is big enough. An insurer with a sufficiently large
number of insureds can “afford” an unprofitable insured; an insurer cannot necessarily afford an
unprofitable block73 of insureds.
Under healthcare reform insurers will not target individuals; they will target “market segments”
of individuals. Market segments are one way to define a block of insureds. Market segments, at least
for other industries, are very often defined by neighborhood, SES, and race and ethnicity. While within
any segment there are healthy and unhealthy people, desirable and undesirable risks post risk-
adjustment, the marketing focus is on the overall potential profitability of the segment not any one
person. The academic literature has not systematically looked at the ability of risk adjusters to correctly
predict risk for market segments as opposed to individuals.74 There are reasons to believe that if
academics examined market segments, they would find that the risk adjustment errors are not random,
73
I use the term “block” to refer to a collection of insureds although “group” is more common. This avoids confusion with the group insurance market. 74 In the only academic papers that I have been able to find concerning selection within risk selection, Shen and Ellis (2002) empirically demonstrated the possibility of using competitive risk adjusters to risk select against a given risk adjuster and Kronick (2000) demonstrated that high and low-risk population subsets may have costs different than the costs predicted by CDPS risk adjustment. These are valuable papers, but they don’t examine neighborhood, SES, or race and ethnicity.
65
that they are related to the characteristics of the individuals’ market segments. If so, some segments
will be consistently profitable while others will be consistently unprofitable.
G. Neighborhoods
Market segments can be defined by neighborhood. Because most people seek primary care
and, to a lesser extent, hospital and specialist care from providers near their homes, it is relatively easy
for an insurer to design both consumer and provider touch points to differentially appeal to potential
insureds in different neighborhoods. In our society people live in neighborhoods75 that are segregated
by socioeconomic, race, and ethnicity. Furthermore there is abundant evidence of health and
healthcare use disparities by socioeconomics, race, and ethnicity. There is therefore reason to believe
that healthcare costs vary by neighborhood characteristics -- even after risk adjustment. The
convergence of cost differences and available touch points creates opportunities for indirect selection.
Examples will help clarify. Imagine two neighborhoods dominated by young adults and their
children. The young adults in one neighborhood are college graduates, living middle class or higher
lives, with at least one member of most households professionally employed. The neighborhood
grocery store is overflowing with vegetables and fruits from around the world. Births are typically
planned in the context of stable relationships. The other neighborhood consists of young adults who
typically did not finish high school, most of whom have no stable employment, with everyone living at or
near poverty. The neighborhood is known for drugs and violence. The men are in and out of jail. The
nearest full-service grocery store is miles away and few households have cars. Nearly all children are
born to unwed mothers. Yet, the neighborhoods have similar age and diagnostic health profiles, in part
75 There is no consistent definition of neighborhood in either the academic or practitioner literature. In this context I mean geographies that incorporate relatively homogenous groups of people based on socioeconomics, race, ethnicity, and community healthcare providers.
66
because although people in the second neighborhood have more chronic health conditions many have
not sought treatment for the conditions in the past year.
People in the second neighborhood are more likely to experience traumatic events (accidental,
inflicted by others, and self-inflicted), have premature and low birth weight births, and have
undiagnosed or non-treated chronic health conditions, including substance addictions and mental health
conditions. These costs account for the majority of child and young adult healthcare (CDC, 2009). Yet,
today’s risk adjustment models do not reflect the added costs associated with these health risk
differentials. Therefore if an insurer will collect the same average premium for insureds from each
neighborhood, insurers will compete for insureds and providers from the first neighborhood and avoid
the second neighborhood.
A similar comparison is possible for two neighborhoods populated by middle aged people of
disparate socioeconomics. Socioeconomic healthcare differentials persist into middle age when
healthcare costs are increasingly related to chronic health conditions rather than traumatic events.
While risk adjustment models adjust for chronic health conditions, they do so only to the extent that the
condition has been recently diagnosed and/or treated. Furthermore, the adjustment then assumes that
everyone with a given condition has the same expected marginal costs on a go forward basis. People
with lower socioeconomic status have more undiagnosed and undertreated conditions and more
complications associated with their conditions (Sawhney, 2010). They have more complications, at least
in part, because they don’t have the education, economic resources, and social support systems that
allow for medical compliance. Consider diabetes. Successful control of diabetes and hence avoidance of
prescription medications and devices, and regular physician visits and tests – a complex and expensive
treatment package – requiring significant education, self-organization, self-control, and expenses not
entirely covered by insurance. Once again, because insurers expect the first neighborhood to be
67
profitable and the second neighborhood not to be profitable, insurers will compete for insureds and
providers from the first neighborhood and avoid the second neighborhood -- even though insurers may
collect more in premium, net of risk adjustment, by insuring the second neighborhood.
H. Income
Because researchers cannot link health insurance data to consumer databases, they need to
work from “second best” data and therefore can only, at best, provide tests of concept with respect to
the potential post-risk adjustment profitability of market segments. I (Sawhney, 2010) (Appendix A)
performed a test of concept with respect to income. I built a conceptual model, supported by a
literature review, to hypothesize that there is a relationship between income and healthcare costs that
persists after risk adjustment using today’s risk adjustment models. I then used the Medical Expenditure
Panel Survey (MEPS) dataset prepared by the U.S. Department of Health and Human Services’ Agency
for Healthcare Research and Quality (AHRQ) that includes healthcare cost data and family income to test
the hypothesis. Finally, I demonstrated that the effect is large enough that indirect selection strategies
based on family income could potentially yield significant insurer profits. While I had to make a number
of analytic compromises due to data limitations of the MEPS dataset, the work provides a positive test
of concept.
I. The Game
The selection game has begun. It may be, however, some time, if at all, before it has much
effect. As documented beginning of this chapter, consultants are already touting their ability to analyze
data, identify target markets, and build insurer indirect selection strategies for the post-underwriting
health insurance era. They have apparently examined the data and concluded that indirect selection
68
should be profitable. Presumably at least some insurers are listening to the consultants. It is less clear,
however, what insurers are doing with the information at this point.
Healthcare reform presents dramatic changes with respect to individual and small group
enrollment, regulation, benefit design, and pricing. Insurers are overwhelmed by the system and
process redesign necessary to support these changes and the associated uncertainties. The uncertainty
is significant. Recent proposed federal rules (DHHS, 2011-1; DHHS, 2011-2) leave significant open
questions which will not be resolved until the late fall of 2012. For example, pricing actuaries rely upon
experience, yet no one has costs for the new populations that will be insured under healthcare reform. I
have been on actuarial committee calls and health actuaries have said clearly and repeatedly that even
when benefit designs are final they don’t know how they will price products for the new populations.
These considerable uncertainties are why the PPACA includes two three-year transitional risk
mitigating programs: reinsurance and risk corridors (PPACA, Sections 1341 and 1342). Reinsurance
provides a temporary subsidy from the group market to partially compensate individual market insurers
for the costs of the costliest insureds. The focus on the costliest insureds, as opposed to a subsidy for all
insureds that would be administratively much simpler, is an implicit acknowledgement that risk
adjustment is inadequate with respect to the costliest insureds. The other mechanism, risk corridors,
provides funds to insurers experiencing excess losses in the first three years and collects funds from
insurers experiencing excess profits. Insurers with profits and losses are taxed and subsidized,
respectively, thereby flattening profits and losses and inter-insurer disparities (DHHS, 2011-2).
Insurers may well have decided that they will consider indirect selection, if at all, as a tuning
mechanism after they have the basic foundation in place to effectively participate and compete in the
post healthcare reform market. This may be particularly true for insurers who currently have a
dominant market share. These insurers will lose their current market share if they do not ‘hit the
ground running’ in the new market – they do not want that to happen. Furthermore, selection is less
69
relevant to insurers with a large portion of the market. A dominant market share cannot be constructed
exclusively from “pockets of opportunity” and the addition of a pocket of opportunity is unlikely to sway
the overall profitability of the insurer’s block of business.
Once the challenges of participation in the new market are conquered and profitability, or lack
thereof, emerges at the end of year one or two, insurers are then likely to give considerable thought as
to how to improve their risk profile and profitability, especially in light of the expiration of the
transitional risk programs at the end of year three. At that point insurers are likely to be most receptive
to the message from consultants that there are opportunities via indirect selection to improve their
profitability or, at the very least, protect them from being at a competitive disadvantage.
The advantage in building an indirect selection strategy at that point is that post-healthcare
reform data will be available. Like pricing, predictive models rely upon data. The past is used to predict
the future. While data exists, even now, to develop indirect selection strategies, post healthcare reform
data will enable a much better analysis.
Even once indirect selection efforts start, it will take time to analyze data and develop, deploy,
and refine indirect selection strategies. Therefore, should an indirect selection arms race emerge, it is
unlikely to commence before years 4 or 5. Depending on how the market evolves, it may be much later
or never. Selection efforts will emerge sooner and accelerate to an arms race faster if insurers
experience post-healthcare reform losses and don’t see other paths to profitability – desperation fosters
creativity.
Should it emerge, the arms race will elicit the social costs already described, namely curtailed
choices for some portions of the population and wasted spending to attract other portions of the
population. Ultimately winners and losers will emerge and the losers will exit the market. Over years as
losers exit the market, it will become difficult for the surviving insurer or couple of insurers to avoid the
least desirable risks. Indirect selection will then likely be less of an issue. But market competitiveness
70
will be an issue as the market will by then be a monopoly or oligopoly. The remaining insurer(s) may the
insurer(s) best at gaming the indirect selection, not the insurer best at providing high quality, cost
efficient care.
Regulation may prevent an arms race or curtail a nascent one. But even without regulation, an
arms race may not develop. It may be that indirect selection is not as profitable or as easy to
operationalize consultants think that it will be. As discussed above, indirect selection may not work well
for market dominant players. Finally, market dominant players may not feel the need to engage in
indirect selection or feel that the secondary costs of engagement are too high.
If market dominance is essential to post healthcare reform success (and it may well be due to
administrative economies and provider pricing clout) then even if smaller insurers successfully deploy
indirect selection, their efforts may not be sufficient to threaten the dominant insurers. Indirect
selection will be confined to the market edges. While indirect selection is less than ideal, indirect
selection efforts on the edges may be tolerable. This is not unlike today’s individual insurance market.
If permitted by state regulation, all insurers underwrite, but dominant Blue Cross Blue Shield
organizations have very often had relatively lax underwriting. In contrast, non-dominant insurers often
have the strictest standards.76
At a minimum, regulators should be prepared to respond to indirect selection efforts. Chapter
IV will examine the public policy challenges associated with regulatory efforts to control anti-selection
under healthcare reform.
76 According to conversations that I have had with several ex-employees, Assurant Health, a national individual health insurer, not dominant in any market, has had a predictive modeling group, working on direct and indirect selection strategies, for at least 10 years. There are not details as current and ex-employees are bound to confidentiality agreements.
71
IV. PUBLIC POLICY CHALLENGES
Indirect selection is contrary to the intent and to some extent the letter of healthcare reform. If
insurers deploy selection strategies some consumers will have more or less access to high quality,
affordable healthcare than others. Some of society’s healthcare resources will be redirected to selection
rather than healthcare. These are not socially desirable outcomes. Yet regulating indirect selection out
of existence in the context of a competitive health insurance market is likely impossible. This section
will examine the conceptual difficulties in using regulation to limit indirect selection. The next chapter
will discuss specific regulatory approaches.
A. Regulating the Invisible
Indirect selection will be covert and subtle. It has to be. An insurer obtains competitive
advantage from indirect selection only to the extent that the insurer selects better than its competitors.
Therefore an insurer will not announce the specifics of its indirect selection strategy; to announce the
strategy would invite replication. Furthermore, insurers will be reluctant to announce even they even
have an indirect selection strategy as indirect selection, at a minimum, conflicts with the non-
discrimination intent of healthcare reform. An insurer who announces a selection strategy will invite
bad press, punitive regulatory action, and changes in regulation. A successful indirect selection strategy
will be a quiet strategy.77 The insurer who successfully deploys an indirect selection strategy will take a
bow for excellent care management practices rather than indirect selection.
Insurer actions to affect indirect selection may be subtle, but the impact on consumers will be
real. Simply put, less desirable people, particularly those living in less desirable geographies, will be less
welcomed and embraced as customers. Their mailboxes will not be filled with glossy solicitation
77 See Introduction. One might surmise that this is why the McKinsey speakers were the only AHIP conference participants to advocate for indirect selection and the only participants who declined to make their presentations available in the after-event presentation packet of the AHIP’s 2010 Health Exchange Conference in Chicago.
72
materials featuring people who look like them and have similar health needs. There will not be a broad
selection of primary care providers in their neighborhoods and specialists will be located well outside
the neighborhood and not be accessible via public transportation. Their Little League teams will not
have insurer or provider sponsorship. Their service calls to their insurer may be answered a bit slower.78
There may be a limited availability of specialists to treat the diseases endemic to their ethnic
community.
The definition of less desirable will be closely related to historical societal discrimination
patterns with respect to minorities, particularly blacks, and people of lower socio-economic status.
Insurers, if confronted by their underservice, may well hide behind these historical patterns. They may
assert that they cannot provide the same number of primary care providers in underserved areas,
simply because there are not enough providers in those areas or that they cannot provide more primary
care providers because there are not enough providers who meet their “quality standards”. They may
assert that they are certainly not responsible for the fact the specialists chose to locate themselves in
upscale neighborhoods off the public transportation routes. There is merit to such assertions. But these
local condition works to their advantage – it allows them to avoid insuring people who are
disproportionately likely to have costs in excess of their risk adjusted premiums. Insurers could invest to
build local community access to primary care and specialists, but they will have no incentive to do so.
“As is” will be fine.
B. Legitimate Ambiguity
In a competitive market, insurers must differentiate themselves and their products. They must
be different. Yet, as discussed above, anything that makes an insurance company or insurance plan
more or less appealing to particular populations is a potential component of a selection strategy. There
78 Or rather conversely the calls of preferred insureds may be responded to faster. This is doable with call center technology and suggested by Riley (2010).
73
will never be a clear line between what should be considered socially-desirable, legitimate competition
and socially-undesirable indirect selection.
C. Asymmetrical Challenge
Under PPACA an unprecedented amount of health insurance data is expected to move into the
public domain, available for a range of interested parties to analyze (PPACA, Sections 3011-3020). The
government hopes that this will promote accountability, transparency, and quality. It will. Regulators,
academics, and public interest groups can use the data to watch for signs of indirect selection. When
they find signs of indirect selection they will publicize the findings. Publicizing the findings will have
several effects. One will be that the insurer may suffer a reputational blow – an indirect cost of indirect
selection. Another will be that the other insurers may be able to copy the strategy, eliminating the first
insurer’s competitive advantage (but unfortunately probably further disadvantaging certain consumers).
Finally, the publication may lead to changes in risk adjustment and/or regulation.
Unfortunately regulators, academics, and public interest groups, will need to watch for selection
based on only part of the data. Many of the indirect selection strategies outlined above are predicated
on the linkage of claims files with consumer marketing databases. The link requires identification of the
insureds. The claims data that will move to the public domain will be de-identified. Therefore, while
insurers will be building indirect selection strategies using “claims + consumer marketing data” the
organizations tasked with watching the insurers will only have claims data. Without access to the linked
data, it may be difficult for outside parties to appropriately risk adjust. As Shen and Ellis, two of the
grandfathers of risk adjustment, point out “Conventional risk adjustment, which sets capitation
payments equal to the average cost of individuals with similar observable characteristics, is not optimal
if health plans can use private information to select low-cost enrollees” (2002). Furthermore, without
74
access to the private information it will also be difficult to discern selection strategies, monitor, and take
non-risk adjustment regulatory action.
D. Moving Target
The US has chosen to rely upon a competitive, largely for-profit insurer market for the provision
of health insurance to the non-poor and non-elderly. Insurers will therefore seek to continuously
outsmart each other in order to make money. If regulation closes off one opportunity, such as direct
selection, insurers will explore other opportunities, such as indirect selection. They may find them.
Further down the road, if too many insurers attempt the same indirect selection activity or if regulators
prohibit an activity, (at least some) insurers may find other selection opportunities. In short, leading
insurers will try to stay “one step ahead” of the masses of insurers who in turn will try to stay one step
ahead of regulators. Regulators will therefore most likely be perpetually behind, attempting to regulate
a moving target.
E. Appropriate Incentives
Risk adjustment involves dividing healthcare cost risk into two categories: the portion of the risk
for which the insurer should not be responsible and the portion for which the insurer should be
responsible. The former is captured by risk adjustment and the insurer is compensated. The insurer is
“at risk” for the latter. The insurer then has incentive to control the costs associated with the at risk
portion, presumably by good healthcare cost management practices.79
The US cannot afford ever spiraling healthcare costs. Society needs insurers (and providers) to
have incentives to control costs. That means leaving a substantial portion of the person-to-person
79 Using the vocabulary of social choice literature Schokkaert explores this “normative” division between “legitimate” and “illegitimate” risk adjusters (Schokkaert, Dhaene, & Van de Voorde, 1998; Schockkaert & Van de Voorde, 2004). Same concept, different terminology.
75
healthcare cost variance outside of risk adjustment and “at risk”. Deciding what should be in and out of
risk adjustment is a value-laden societal challenge – not just a mathematical challenge. Furthermore,
Schokkaert (1998; 2004) points out that the risk factors for healthcare costs are sufficiently intertwined
that once society decides which factors should be in and out of risk adjustment, it may still be
mathematically impossible to cleanly separate the risks.
E. Regulatory Costs
Regulations are expensive: for governments, regulated entities (in this context insurers), and
citizens. The expense is with respect to money, time, constrained and lost opportunities, and
unintended consequences. Excessive regulation can cripple systems.
The best regulation is most often the minimum regulation required to address the problem at
hand without creating bigger problems. The challenge of regulating indirect selection under healthcare
reform is that the post healthcare reform market is still largely undefined. We do not yet know what
problems will emerge, let alone the potential trade-offs between problems. We hope that healthcare
reform will usher in a competitive era of health insurance and healthcare innovation which will improve
societal health and decrease costs. Too much regulation is counter to this goal.
The best regulatory strategy is therefore “just enough, just in time” as the post-healthcare
reform market develops. The challenge, however, is that traditionally regulatory systems, mired in
endless political debate and subject to quick fix approaches, have not been particularly good at
appropriate, dynamic regulation.
F. Political Acceptability
Ultimately regulators are accountable to the public. The public is comprised of both consumers
and the regulated insurers. Regulation is subject to political forces and compromises. Decisions that
76
appear to be normatively correct and provide the proper incentives may be deemed politically
unacceptable.
An example illustrates the complexity of political acceptability. Suppose that higher costs are
associated with being married and being poor. If an insurer could build a strategy to disproportionately
attract single people, it seems likely that married people would notice and insurers would simply be
shamed into doing the right thing. Absent that, there would undoubtedly be political pressure for some
sort of risk adjustment or regulatory correction to alleviate the selection. After all, discrimination
against married people is contrary to the “family values” that our political system holds dear.
Now, suppose that in pursuit of wealthier insureds an insurer markets more heavily in higher
income areas and contracts with relatively few physicians and hospitals in low income
areas. Theoretically anyone, regardless of income, could enroll, but in practicality, the insurer’s plan
would be more appealing to higher income people than lower income people. That insurer would profit
while the competitive insurer actively marketing in the low income market would lose money. Low
income people would then be left with a choice of a financially struggling insurer actively marketing and
offering providers in their area or travelling long distances to get care from the providers of a financially
healthy insurer. This would not be a socially good outcome; yet low income people so impacted by such
indirect selection may not have the political power to demand a system correction. This will not be so
different than a lot of other things our political system: more plentiful, higher quality choices for the
wealthy.
The technically “perfect solution” to the income selection problem is to put an income variable
into the risk adjustment model. If insurers were to receive more money for low income people than
high income people, they would no longer have incentive to indirectly select by income. The solution,
however, might be politically unacceptable. Shifting money around via risk adjustment in order to pay
more for insurers to care for the poor is akin to shifting tax money around in order to pay schools more
77
to educate poor children. Although it is well recognized that it costs more to educate a disadvantaged
child than an affluent child to the same level, our political system has been unable to bring school
funding for poor children to parity, let alone provide schools serving poor children with extra funds.
Continuing with the example, assuming that there was political will for change, it may be more
politically acceptable to prevent indirect selection by income via regulation than by the more technically
correct and efficient risk adjustment.80 The regulations might prohibit blatant discriminatory marketing
and require that all insurers provide a minimum number of providers in low income areas.
Political acceptability also extends to insurers. Insurers want to eliminate indirect selection to
the extent that other insurer’s indirect selection strategies may cause them disadvantage; they don’t
want to eliminate indirect selection strategies that they feel give them advantages over their
competitors. Big insurance companies will have the most advanced analytic and strategic teams; they
will also have the most political clout in protecting their strategies. If insurers, big or otherwise, feel that
they have a winning game, they will fight to maintain the status quo regulations and enforcement.
Health insurers are a powerful lobby (The Hill, 2010; Bloomberg, 2010; Bloomberg, 2011).
Chapter V will discuss how regulators can most effectively manage indirect selection within the
context of the public policy challenges.
G. Regulatory Resources
Effective regulation is a costly exercise involving data collection, data processing, and highly
skilled people – either as employees or consultants. Selection regulation does not produce a revenue
stream or a tangible cost savings. All governmental regulatory budgets are strained.
80 Political acceptability varies between healthcare systems. Other health systems, including the UK (Babad, Bardsley, Childs, Ghiselli, MLure, & Mateja, 2011), risk adjust for socioeconomic characteristics.
78
V. CONTROLLING INDIRECT SELECTION
Indirect selection is a threat to the intentions of healthcare. In a competitive market, insurers
will continuously be looking for ways to improve their profitability and defend their market position
against competitors. They may turn to indirect selection to do so. Consultants, who already have
experience with predictive models and target marketing strategies from both insurance and other
industries, are already pointing insurers to potential opportunities. Although risk adjustment will reduce
indirect selection’s potential, there is reason to believe that risk adjustment will not fully eliminate
opportunities. It seems inevitable that eventually at least some insurers will try to implement indirect
selection strategies. It is less clear whether they will implement successful strategies, whether other
insurers will follow, and whether indirect selection will become a standard part of the competitive
game.
Regulators need to be prepared for whatever may happen. They need a strategy and
mechanisms to effectively control indirect selection so as to minimize its effect on consumers and the
generation of socially wasteful costs. Their ability to develop strategies and implement mechanisms,
however, will be hampered by the limited staff and budgets, invisibility of selection efforts, ambiguity,
asymmetrical data, political acceptability, and the challenges of keeping up with the insurers.
A. Conceptual Model
The following is a conceptual model of a dynamic system for controlling indirect selection:
79
Figure 30
Dynamic System: The key words are “dynamic” and “system”. Controlling
selection will involve a host of moving parts. Insurers are likely to be perpetually one
step ahead of the regulators. A dynamic system of risk adjustment and regulation is
necessary to simply maintain the inevitable gap between insurers and regulators.
Furthermore, Van de Ven and coauthors (1994) point out that regular regulatory
adjustments inherently hamper insurer selection efforts by increasing insurers’
uncertainty as to whether a selection strategy will be profitable over time and hence
worth the associated costs.
Risk Adjustment: Risk adjustment and other regulation are the foundational
blocks for the system. Because it is better to align insurer and societal interests than to
simply forbid insurers to do what’s in their self-interest, risk adjustment should have a
larger role than other regulation -- hence its larger size in the diagram. Risk adjustment
also has the advantage of mitigating unintentional indirect selection. Risk adjustment is
the first way to prevent indirect selection and perhaps even the dominate way, but it is
80
not the only way. “Other Regulation” supplements risk adjustment. It is called “Other”
as risk adjustment is itself a form of regulation.81
Other Regulation: Risk adjustment strives to create a system that removes the
economic incentives from indirect selection. Risk adjustment will be imperfect and
therefore insufficient. Some level of “thou shall not” and “thou shall” regulation will be
required. Furthermore, in some situations, regulation may be more politically
acceptable than risk adjustment. This chapter will explore both enhanced risk
adjustment (as compared to today’s most common models) and a full range of other
regulatory options.
Monitoring: Monitoring will be required to evaluate whether risk adjustment is
working as planned, regulations are being followed, insurers are being advantaged by
selection, and/or consumer are being disadvantaged by indirect selection. The
monitoring should be both quantitative and qualitative and performed by one or more
non-insurer parties. As van de Ven and van Vliet write “because of the large financial
interests involved, one should not set the fox to watch the geese” (1992). This Chapter
will explore several broad types of monitoring.
Enforcement w/ Penalties: Enforcement actions and penalties are essential to
any regulatory system. It is not sufficient to simply tell companies what they may or
may not do. This paper will not explore enforcement actions and penalties other than
to note that the high certainty that there will be enforcement, quick the enforcement
action, and substantial penalties reduce the financial incentive to misbehave.
Feedback Loops: Feedback loops are essential to dynamic systems. There is
every reason to believe that insurance companies will be at least one step ahead of
81 Insurers who benefit from positive selection do not voluntarily send a portion of their premiums to insurers disadvantaged by selection.
81
regulators. If regulators don’t periodically modify the risk adjustment and regulations,
what was yesterday an acceptable level of indirect selection may grow to be an
unacceptable/de-stabilizing level tomorrow. This Chapter will make recommendations
for formalizing portions of the feedback process.
B. Federal or State
The other dynamic with respect to controlling indirect selection is the dynamic between the
federal government and the states. PPACA is explicit with respect to certain healthcare reform
standards. For example it limits the rate ratio to between the oldest adult and the youngest adult to a
factor of 3. In other areas it establishes broad regulatory guidelines and explicitly grants the power for
creating the necessary detailed regulation to the US Department of Health and Human Services (DHHS)
or another federal agency. Other times it explicitly directs the DHHS and states to work together to
create regulation. And other times PPACA is silent as to who is responsible for the necessary regulation,
suggesting only that “DHHS may” issue regulation. Furthermore, even when regulatory power explicitly
lies in federal hands, states are allowed to impose regulations that are stricter than federal regulation.
For example, states can say that every adult must be charged the same premium, irrespective of age.
Finally, the DHHS has the power to grant waivers to the states, excepting them from specific federal
States will have a great deal of regulatory authority with respect to controlling indirect selection
– assuming that they wish to exercise it. Recent DHHS proposed rules reinforce this point (DHHS, 2011-
1; DHHS, 2011-2). While the proposed rules make it clear that states may deviate from the federal
standard, they don’t provide final federal standards. Alternative rules for topics critical to anti-selection
control are simply discussed without settling on a final rule. The reader should consult Copeland
(2011), Oechsner and Schaler-Haynes (2011), Jost (2010) and Lueck (2010) for more information about
82
how regulatory authority may be divided between federal and state entities under PPACA. With the
exception of the next section, this chapter will focus on combined federal and state regulation.
Ultimately it is the system that is created via the convergence of the two regulatory authorities that
matters more than the allocation of the authority.
C. Regulatory Timing
Regulations need to be in place in advance of the behavior that regulators wish to influence or
prohibit. Too few regulations may lead to a chaotic market that does not serve the public interest. Yet,
too many regulations may stifle a market. A nascent market may not get off the ground if over-
regulated. The best strategy therefore is likely a strategy that is initially relatively light on regulation but
reacts quickly to emerging market conditions.
DHHS, the federal agency charged with administrating healthcare reform, is struggling to
prepare comprehensive regulations. Although proposed federal rules have been issued already and will
be issued between now and then, federal rules are not expected to be finalized until January 2013 -- less
than a year before the January 2014 implementation date for healthcare reform. Some rules relevant to
indirect selection control, such as rules defining essential health benefits, actuarial value and other
benefit design standards and standards for exchanges and qualified health plan issuers related to quality
have not been released, even in proposal form.
The January 2013 completion date leaves essentially no time for a state to decide to ‘tweak’
federal regulations.82 The alternative is for states to draft their own regulations and preemptively apply
for waiver (DHHS, 2011-3) from federal regulation or permission to use an alternative risk adjustment
methodology (DHHS, 2011-2). A pre-emptive waiver or alternative risk adjustment methodology
requires states to gather the technical expertise and work even faster than the federal government
82 As noted above, states can adopt regulation that is stricter than Federal regulation. States can also modify certain parameters within Federal regulation, such as risk adjustment parameters (DHHS, 2011-2).
83
regulatory front, while struggling with the logistical challenges of healthcare reform. Very few states are
in position to even consider these options.
Therefore, for most states, the initial regulation therefore is likely to be the federal regulation,
with very little if any state supplementation. There will, however, presumably be wide variation in rule
interpretation and monitoring and enforcement practices.
After the initial federal regulation is in place, states will then have the ongoing opportunity to
modify (within bounds) specific federal regulations to their local market or to apply for a waiver. Their
ability to do so, however, may be constrained in a number of dimensions. First, states will not know
how they should respond to market conditions unless they are actively monitoring the market. This will
require an up-front investment in data collection, data processing, and the technical analysts in an era of
highly constrained resources.
Then, even if it is clear that there is an emergent market problem and a regulatory solution,
getting the necessary regulations in place may be a protracted or even impossible process. State
legislative bodies are overwhelmed by a variety of issues and often quagmired. The solution may be
technically correct but politically unacceptable. The solution may require the expenditure of state
resources – resources which are not available. In the interim period an emergent problem may evolve
to an arms race and, unless the problem affects other state markets, the federal government may not
have intervened.
State regulators would be better equipped to respond to local market conditions if they could
bypass the state legislative bodies. One way to do so would be if the legislative bodies would give the
regulators regulatory authority up-front – authority that regulators can decide to exercise on an as
needed basis. It would be even better if legislative bodies would similarly give regulators taxing
authority that they can call upon if needed to support new regulation.
84
Therefore, even if state regulators decide that federal regulation is a practical place to start via
indirect selection regulations, they should not feel that it will be several years before they need to
concern themselves with indirect selection. Sooner rather than later they should:
1. Create and fund an indirect selection monitoring system.
2. Seek advance regulatory and taxing authority from the state legislative bodies.
D. Tools
There is a range of regulatory tools that can be used to control anti-selection. This section will
describe the tools irrespective of whether the regulation may be federal, state, or a combination of the
two. PPACA already contains provisions which help control selection. Jost (2010) and Oechsner and
Schaler-Haynes (2011) review the selection-control provisions. They are already law. I will not reiterate
them here. I will instead discuss regulatory options that enhance or supplement the PPACA provisions.
Think of the options as tools within a tool box – tools available to manage indirect selection.
Some combination of the tools will likely get the job done. Certain tools may be mutually exclusive or
somewhat redundant. For example a given task requires a Phillip’s head screw driver or a flat screw
driver, but not both. Other times a given tool is a more advanced version of a simpler tool. For example
there are power saws and hand saws, either of which may work for the job at hand. Not every
regulatory tool is listed – just the most obvious ones. Because a dynamic system is required, the
regulatory strategy will need to be adjusted, “re-tooled”, over time.
As shown in the conceptual model, risk adjustment is the cornerstone of the regulatory strategy
for controlling indirect selection. This section will therefore discuss risk adjustment options first. No
one, however, who has seriously considered risk adjustment, has assumed that risk adjustment will
eliminate all opportunities for risk selection. Therefore, after discussing risk adjustment, this section will
discuss an array of regulatory options, loosely aligned with the indirect selection touch points discussed
85
in Chapter 3. The discussion will include the technical and political barriers to the regulatory options.
Sometimes one regulatory option is an alternative to another option. Such relationships will be noted.
It is important to understand that 1) no list can include all regulatory options and that 2) there is
no need to implement all options described. Given the tight timelines and considerable uncertainty
regarding insurer and consumer behavior under healthcare reform, the ideal level of initial regulation
may be a minimum level. Regulation can evolve as the market evolves. Too much initial regulation may
create unnecessary barriers to market entry and innovation.
Furthermore, regulators don’t need to remove all potential opportunity for indirect selection --
just enough that intentional indirect selection becomes “not worth the effort” (as per Figure 16) and
that no insurer is significantly advantaged or disadvantaged by even unintentional selection. Finally, but
by no means least importantly, after discussing the regulatory options, the chapter will conclude by
discuss monitoring, enforcement, and feedback loops. Monitoring, enforcement, and feedback loops
are essential to a sustainable, dynamic system.
Various authors have considered regulatory options. As expected, many of the regulatory
options they have considered are overlapping. This paper will cite a previous author(s) with respect to a
specific option only if the author(s) offers a unique or non-intuitive perspective or empirical support for
the option. For a general review of regulatory options for controlling risk selection, see van de Ven and
Ellis (2000), Newhouse (1994), and van de Ven and van Vliet (1992). For a review of regulatory options,
specifically within the context of PPACA, see Jost (2010), Oechsner and Schaler-Haynes (2011), and
Lueck (2010).
Most of the regulatory options flow intuitively from the selection conceptual models and
discussions in Chapter 1. They can be broadly categorized as:
1. Increase the efficacy of risk adjustment,
2. Reduce (eliminate) consumer choice to seek insurance,
86
3. Reduce consumer choice of insurer and plan, and/or
4. Limit and control on the decisions and activities of insurers,
5. Make indirect selection more costly83
The second and third options are particularly problematic politically. The value of limiting
consumer selection is difficult to explain in a society that fundamentally values consumer choice. The
fourth and fifth are particularly unpopular with the insurance lobby.
1. Improved Risk Adjustment
Risk adjustment, therefore, is the most widely acceptable regulatory option. Risk adjustment
mitigates the effects of both intentional and unintentional selection. If risk adjustment works well,
there are fewer opportunities to benefit from selection and less need for other regulatory options.
There are a number of ways by which today’s risk adjustment models can be improved in order
to be more effective in mitigating the effects selection. The following are the most obvious:
Figure 31
Regulatory Options
Selection Control or Mitigation Option Alterna-tive To
1 Risk Adjustment (RA)
A Include family income in RA --
B Include other variables in RA --
C Accentuate RA factors --
D Partial retrospective RA 1E
E Exempt certain insureds from RA 1D
F Forbid use of consumer marketing data --
83 Indirect selection costs may be the primary costs of implementing an indirect selection strategy or the secondary potential costs of being out of compliance with the letter or spirit of regulation.
87
1A: Include family income in risk adjustment. Sawhney (2010) has
demonstrated that people with lower family incomes cost more to insure after
adjustment with today's risk adjustment models (which do not include income). She
has shown that this offers a potentially significant advantage to insurers who select
based on income. There are no substantial technical barriers to including family
income in risk adjustment. The data will be available; it is just a matter of “doing the
math”.84 The barriers to including income in risk adjustment are political. The
electorate may object to “paying insurers more” for poor people. Furthermore,
insurers, particularly the large for-profit-insurers, are likely already building selection
strategies around income and other socio-demographic variables and will be reluctant
to give up this potential source of advantage.
1B: Include other variables in risk adjustment. Beyond family income,
additional potential variables include functional and cognitive disabilities, education,
race, ethnicity, work status, family status, and neighborhood. Data is a major technical
barrier to including these variables. The many of these variables can be known or
imputed using consumer marketing databases. Yet researchers and regulators who
establish risk adjustment systems don’t have the same access to consumer marketing
databases. This creates an information asymmetry. For example, while insurers know
the precise address of each of their insureds, researchers are “lucky” to know an
insured’s county.85 A necessary precondition to including new variables in risk
84 See Sawhney (2010) for more information. 85 Unless a researcher has a data use agreement with the holder of the data, the Health Insurance Portability and Accountability Act (HIPAA) privacy rule requires that individual-level health insurance data used for research to be
88
adjustment is to require insurers to collect and share data with researchers and
regulators. This requirement will need to be weighed against privacy concerns.
Furthermore, should the necessary data be made available, there are still political
barriers. The political barriers are identical to the barriers discussed with respect to 1A
with added sensitivity with respect to race and ethnicity.
Finally, neither insurers nor regulators have good data for some potentially
very relevant risk factors. For example, there is little doubt that functional status
measures could greatly enhance risk adjustment. Given a disease state, people with
impaired physical and cognitive functional status have higher healthcare costs (see
Omitted Variables discussion). Yet diagnosis codes found in insurance claims provide
little information regarding functional status. Recently van Kleef and van Vliet (2010)
explored including durable medical equipment (DME) claims as a risk adjustment as a
partial proxy for functional status and found that DME claims add predictive value.
1C: Accentuate RA factors. Glazer and Maguire (2000) have demonstrated
that it is often mathematically optimal to accentuate risk factors – that is make high
factors higher and low factors lower. Risk factors should be accentuated whenever 1)
there is a variable(s) relevant to future health, 2) upon which insurers will select upon,
3) that is not included in the risk factor calculation, but 4) is correlated to variables that
are included in the risk factor calculation. Interestingly, the weaker the correlation, the
stronger the required accentuation. Van de Ven and Ellis (2000) go a step further and
suggest that on normative rather than mathematical grounds risk factors should be
accentuated so that insurers have incentive to care for the sick. This may include, for
stripped of any reference to geographical areas smaller than a state. A data use agreement with the holder of the data allows a researcher access to a “limited data set” which can include county and zip code, but still may not include street addresses (Gunn, Fremonth, Bottrell, Shugarman, Galegher, & Bikson, 2004).
89
example, assigning a risk premium to individuals living in medically underserved areas
so that there are incentives to build capacity in those areas.
1D: Partial concurrent risk adjustment. The default assumption in the
actuarial world is that risk adjustment is prospective: that the insured’s current status
and past healthcare history is used to predict future (prospective) costs and the insurer
is compensated accordingly. Prospective risk adjustment is considered the gold
standard for incenting insurer and provider efficiency (van de Ven & Ellis, 2000). It is
the standard for Medicare Advantage risk adjustment (CMS, 2010). Newhouse (1994),
however, argues that because risk adjustment systematically under estimates costs for
people with particularly high costs and/or high healthcare utilization in the in the prior
period that the ideal risk adjustment should be a blend of prospective risk adjustment
and prior period (retrospective) actual costs and/or healthcare utilization. The recently
released proposed federal rules for risk adjustment (DHHS, 2011-2) seemed to indicate
that the final rules would specify a concurrent model whereby diagnostic and drug
history from within a year would be used to risk adjust that year. The rules, however,
were not explicit. The American Academy of Actuaries is requesting clarification (AAA,
Oct 2011) as the choice between prospective and concurrent risk adjustment
methodologies has policy and logistical implications.
1E: Except a certain number or percentage of insureds from risk adjustment.
Van Barneveld and coauthors (van Barneveld, van Vliet, & van de Ven, 1996) first
proposed this idea. It addresses the same problem as partial retrospective risk
adjustment: that risk adjustment is inadequate for a small portion of the population.
The authors proposed prospectively exempting a small percentage or number of
insureds from risk adjustment and instead placing them in a reinsurance pool that
90
could be funded by the government or the insurers. The pool would then reimburse
insurers for the actual costs of these insureds. The reimbursements would not need to
be 100%. Later authors (van de Ven & van Vliet, 1992) carried the idea one step
further and proposed that the insurers could volunteer which insureds they would like
exempted on the condition that they explain “what” about the insured makes them
conclude that risk adjustment is likely to be particularly inadequate. That information
could then be fed back into risk adjustment improvements. The PPACA authors had
similar ideas. PPACA has a 3 year transitional reinsurance provision (Section 1341).
Regulators should consider making the reinsurance provision, perhaps in a modified
form, permanent.
1F: Forbid use of consumer marketing data. Risk adjustment is inadequate if
insurers are using factors for indirect selection that are not included in risk adjustment.
But, as discussed in 1B, consumer marketing database variables cannot currently be
included in risk adjustment as the regulators and academics cannot link the data. One
way to enhance the adequacy of risk adjustment, therefore, is to forbid insurers from
using consumer marketing database data. This is, of course, a difficult rule to enforce
given that insurers in the best of times are not going to advertise the use of consumer
marketing data. But if there were sufficient financial penalties and moral outrage
against insurers who used consumer marketing data, the firms that sold the data to
them, and the consultants who analyzed the data, many if not most insurers would
likely comply.
91
2. Market Entry
Regulators design insurance markets. Insurers then decide whether they want to enter these
markets or not and how to play within them. PPACA legislation defined certain aspects of the new
markets, but left considerable discretion to DHHS and the States with respect to market design. Jost
(2010) is the leading authority on how the markets might be configured under PPACA to best control
selection. Jost emphasizes that “it is absolutely necessary that exchanges be protected against adverse
selection”. Jost also discusses a number of key policy issues not directly related to selection.
Every split in the individual and small group market expands the opportunities for indirect
selection. An insurer can decide (select) whether to be within each split market. An insurer can then
develop a distinct selection strategy for each market, optimizing selection strategies across markets. A
selection strategy that works for a given (sub)market is less likely to work for a combined market. From
the regulatory perspective of controlling selection, splits are not good.
The default assumption under PPACA is that individual and small group market will be distinct
and that within the individual market, individuals who do not qualify for federal subsidy will be able to
buy their insurance off the exchanges (Jost, 2010). It would appear to also be possible for a given
individual to buy a low level of subsidized coverage (bronze plan or catastrophic plan86) from the
exchange and supplement their coverage with insurance bought of the exchange. The supplemental
coverage could presumably be underwritten.87 States, however, have the right to unify exchanges,
require insurance to be bought on the exchange, and to forbid supplemental coverage.
Supplemental coverage is particularly subversive of the intent of healthcare reform. PPACA
requires insurers to offer and insureds to buy health insurance policies which cover a range of “essential
health benefits” (PPACA, Section 1302). Insurers on the exchange must offer plans that are designed to
86 Catastrophic plans are essential health benefit plans with particularly large deductibles. They are available only to insureds under the age of 30 (PPACA, Section 1303). 87
McKinsey (2010) suggested this strategy at the AHIP conference.
92
pay 60%, 70%, 80%, and 90% of the full benefit cost of the insurer’s benefit offering. The levels are
referred to as bronze, silver, gold, and platinum, respectively. Subsidies are based on the market price
of the silver plan, irrespective of which plan the insured enrolls in (PPACA, Section 1331).88
A healthy insured (able to clear underwriting) could take the subsidy, buy the minimum required
bronze plan, and take the premium saved by downgrading his/her insurance from silver to bronze and
use it to buy a supplemental policy which would fill the gap between the bronze and platinum benefits.
Hence the healthy insured would have platinum coverage for the price of silver coverage. This
opportunity would not be available to the unhealthy. The only way an unhealthy insured could get
platinum coverage would be via the exchange at a substantially higher total price. The platinum benefit
level would therefore be subject to adverse consumer selection.
There are a number of ways that the market can be consolidated in order to control selection.
The options include:
Figure 32
Regulatory Options
Selection Control or Mitigation Option Alterna-tive To
2 Market entry
A Individual insurance only from exchange 2B
B Same plans and prices on and off exchange 2A
C Same qualification requirements on and off exchange
--
D Merger of individual and small group exchanges (with same plans and prices)
--
E No essential health benefits supplemental coverage
--
88 PPACA does not require exchange insurers to offer platinum plans (Section 1301). Because of the potential anti-selection against the platinum plan, McKinsey (2010) suggests that insurers not offer platinum plans. If no one offers platinum, however, then much of the problem shifts to the next best plan -- gold.
93
2A: Individual insurance only from exchange. Bi-furcating the individual
market between exchange and non-exchange creates opportunity to select based on
income. Because exchange purchases are subsidized for people with family incomes up
to 400% of the family poverty level, the individuals who would potentially buy insurance
off the exchange have (relatively) high incomes. Sawhney (2010) has demonstrated that
even after risk adjustment, people with higher incomes cost less than low income
people. State regulators are already considering the option of eliminating off exchange
insurance (Oechsner & Schaler-Haynes, 2011). The barriers are political. Insurers want
to preserve selection opportunities and consumers want to preserve maximum “choice”
and avoid “government takeover”.
2B: Same plans and prices on and off exchange. This is a weaker version of 2A.
An insurer could not sell individual insurance only off the exchange and would have
limited opportunity to develop distinct exchange and non-exchange strategies. PPACA
only requires that an insurer who offers an exchange plan off the exchange must offer it
at the same rates. But an insurer is not required to offer the exchange plan off the
exchange; the insurer may offer only novel plans off the exchange. Nor is an insurer
required to offer non-exchange plans on the exchange (Jost, 2010; Oechsner & Schaler-
Haynes, 2011; Lueck, 2010)
2C: Same qualification standards on and off exchange. This is a companion to
option 2B. Irrespective of benefit design and rates, plan sold on Exchanges should meet
qualification standards with respect to provider networks, reporting on health care
quality, grievance procedures, and marketing practices. Jost (2010) asserts that the
qualification standards will add costs to exchange plans making them less appealing to
94
consumers. Regardless of the net effects on cost and (average) appeal, just the fact that
exchange and non-exchange plans are different will cause selection.
2B and 2C are likely to be fiercely opposed by both insurers and consumer
choice advocates.
2D: Merger of individual and small group exchanges (with same plans and
prices). The default PPACA assumption is that there will be separate individual and
small group exchanges. Bi-furcating the individual and small group market allows
insurers to select which exchange they wish to participate and to build a separate
selection strategy for each. While it would control selection, there are substantial
logistical challenges associated with implementing this option. Nearly everything about
the sale and administration of small group insurance is different than the sale and
administration of individual insurance. Individual insurance is direct to the consumer
while small group insurance has the employer as an intermediary for both the sale and
billing process. Jost (2010) discusses this option and the associated challenges in detail.
2E: No essential health benefits supplemental benefits. Allowing the healthy
to supplement their exchange plans by off-exchange purchases creates selection against
the platinum plans. As discussed above, there will be particularly adverse consumer
selection against the platinum benefit plan if healthy people can assemble a platinum-
like plan by purchasing a bronze plan on the exchange and an underwritten
supplemental policy off the exchange. Supplemental plans should be permitted only for
medical services which are outside the scope of essential health benefits.
Other than the merger of the individual and small group exchanges, the barriers to the above
options are political. Consumers are concerned that “government is taking over” their healthcare and
95
“restricting choices”. It is in insurer interest to encourage these consumer views as it allows insurers
maximum opportunities to select their markets and design custom indirect selection strategies.
3. Plan Design
Plan design encompasses both the benefits and rates associated with a plan. Traditionally, plan
design has been one of the primary touch points that insurers manipulate in order to affect indirect
selection. The ultimate solution is one plan for everyone. That, however, is not politically acceptable.
Absent one plan for everyone, there a host of considerations with respect to the indirect selection
potential of plan design worthy of a stand-alone paper. The following is a summary of some high level
considerations.
PPACA (Section 1302) requires insurers to design plans which are “actuarially equivalent” to
60%, 70%, 80%, and 90% of the “full actuarial value of the benefits provided under the plan”. The
actuarial equivalence has to be calculated based on “a standard population and without regard to the
population the plan may actually provide benefits to.” The benefits have to include all of the prescribed
“essential health benefits”. Although this is an important first to standardizing benefits and therefore
limiting selection opportunities, it is not sufficient. There is still significant opportunity for insurers to
design benefits to attract insureds with specific risk profiles.
An example will make this clear. For the standard population, a $500 deductible which applies
to all healthcare services in a year maybe actuarially equivalent to having a $5,000 deductible for
inpatient care and a $0 deductible on other services. Yet these plans appeal to people with very
different risk profiles. The key is remembering that no individual person is “standard”. The person who
has a high likelihood of needing inpatient care will prefer the $500 deductible which caps his or her costs
for the year. The person who has a low likelihood of needing inpatient care is much more likely to
prefer having his or her miscellaneous healthcare costs covered without a deductible in return for
96
risking the $5,000 inpatient deductible. The differences between the two populations attracted to these
plans will not be entirely reflected in risk adjustment as people know more about their upcoming
healthcare and inpatient hospital needs than is reflected in the age, sex, and diagnostic histories used
for risk adjustment. For example, a healthy woman knows if she is planning to have a baby. A person
with arthritis knows that hip replacement is on the horizon or not. An asthmatic knows whether his
asthma is an occasional exercise induced nuisance or a series of life-threatening events. Yet none of this
knowledge is reflected in risk adjustment.
Actuarially equivalent benefits do not attract equivalent risk profiles, even after risk adjustment.
Two plans may be platinum (90% of full benefits) but attract very different risk profiles. Benefit designs
need to be constrained in order to minimize selection between actuarially equivalent plans. But even if
benefit designs are “fully” constrained so that there is only one allowed benefit design for each mineral-
level (platinum, gold, silver, and bronze), there will still be selection between levels. The actuarial
equivalence between the levels is based on a standard population. But no one person is ‘standard’;
people will make choices in their personal circumstance and best interest. For example, a plan with a
$500 deductible for all services may provide 90% of the full actuarial plan value (platinum level
coverage) and a plan with a $5,000 deductible for all services may provide 70% of the full actuarial value
(silver coverage). There will be a price difference between the two plans. Under either plan costs under
$500 are paid for by the insured and costs over $5,000 are paid by the insurer. The $500-$5,000
corridor is essential to the benefit decision. The person who feels that his or her costs will almost
certainly be under $50089 will hesitant to pay the additional premium to cover the $500-$5,000 corridor
and will likely select the $5,000 silver plan. The larger the price differential, the less likely the healthy
person is to select the platinum plan. Yet the person nearly certain to have costs in excess of the
corridor will be willing to pay a significant differential. The platinum plan therefore will experience
89 A significant percentage of people feel this way given that costs for preventive care services, including routine physicals, are not subject to deductibles and will be covered at 100% under all plans (PPACA, Section 2713).
97
adverse consumer selection. While to some of the impact of the selection will be reflected in risk
adjustment, van de Ven and coauthors (van de Ven W. P., van Vliet, Barnevald, & Lamars, 1998)
demonstrated that risk adjustment does not fully account for the risk differential between people in
high and low deductible plans.
PPACA requires plans operating on the exchanges to offer at least one gold and one silver plan
(PPACA, Section 1311). Knowing that platinum plans will be selected against, McKinsey (2010) suggests
that insurers not offer platinum plans. If most but not all insurers take McKinsey’s advice, the one or
two insurers in a market offering a platinum plan will be disadvantaged. If no one offers a platinum
plan, the gold plan will become most attractive to poor risks.
In order to minimize selection against a particular insurer it is important that all insurers offer
the “richest” benefit plan, presumably platinum. It is also important that no insurer be allowed to
charge a disproportionately higher price (as compared to benefit levels) for its platinum plan than for its
other plans as the price will accentuate adverse consumer selection and/or drive enrollment to other
insurers with more proportional prices. Although PPACA clearly states that plan benefits must be
designed to cover 90%, 80%, 70%, or 60% of costs of the full benefit package based on a standard
population “without regard to the population the plan may actually provide benefits to” (Section 1302),
PPACA is silent as to whether plan rates can be adjusted to reflect the health of the population covered
under the plan. Therefore, it is not obvious that insurers must charge 50% more for a platinum plan
(90% plan) than for a bronze plan (60% plan).90 If a differential of more than 50% is charged, fewer
people will enroll in the platinum plan, and they will be more likely to be the people at risk for expensive
healthcare. There will be a selection spiral with respect to platinum plan.
90 90%/60% = 1.50. A 90% plan is therefore worth 50% more than a 60% plan. This is a very complicated aspect of PPACA for which the Federal government has not yet issued proposed rules. See the American Academy of Actuaries Issue Brief (AAA, 2011) for more information concerning actuarial equivalence and pricing.
98
Add-on benefits pose another dilemma. PPACA requires insurers to at a minimum offer the
essential health benefits; it does not prevent them from offering additional benefits. Section 2712 talks
specifically about the possibilities of physical fitness, healthy lifestyle support, weight management, and
stress management benefits. Although theoretically such benefits should benefit the less healthy than
the healthy, they typically have maximum appeal to the healthy and can be used to “steer” healthy
people into specific plans. Vaithianathan (2004) provides a good discussion and examples of how such
benefits can be used to attract the young, healthy, and fit. Such benefits are perceived to be health-
enhancing. But if most of the people who take advantage them are already healthy and would have
stayed healthy on their own, then they are not health enhancing. Instead, the sick people are
subsidizing the healthy habits of the healthy.
Figure 33
Regulatory Options
Selection Control or Mitigation Option Alterna-tive To
3 Plan design
A Constrained benefit designs 3B
B Fixed benefit designs 3A
C All 4 levels required --
D Premiums proportional to actuarial value --
E Add-on benefits optional and fully priced 3F
F Add-on benefits prohibited 3E
3A: Constrained benefit designs. There are various ways that benefit designs
can be constrained to situations like above whereby a $500 all service deductible
competes against a $5,000 hospital only deductible. For example, service specific
deductibles, such as hospital admission deductibles, can be forbidden.
99
3B: Fixed benefit designs. It is entirely possible for a state to “standardize benefits” by
specifying one (or two or three) benefit designs per mineral-level.91 Although this is contra to
the expectation of maximizing consumer choice and the norms in most of today’s individual
health insurance markets, it is not without precedent. Medicare supplemental policies have
been standardized, irrespective of carrier, for more than 20 years (CMS, 2011). Some time ago
New York standardized individual health insurance policies (Oechsner & Schaler-Haynes, 2011).
Policies offered under Massachusetts health reform, the model for PPACA, are standardized
(Oechsner & Schaler-Haynes, 2011; Gordon, 2011)
3C: All 4 levels required. Insurers could be required to offer plans at all four levels.
Currently insurers selling on the exchange are only required to offer Gold and Silver plans.
Insurers off the exchange have no requirements and thus can offer only Bronze plans. This
allows an insurer to bypass the expected adverse consumer selection again platinum plans (Jost,
2010).
3D: Premiums proportional to actuarial value. PPACA is very specific as to the relative
value of the plan designs. Platinum is a 90% actuarial value benefit, gold is an 80% benefit, etc.
based on a standard population. PPACA is not, however, specific about pricing. It would appear
that insurers are not compelled to price according to the benefit value. This, however, opens
the possibility of a platinum plan (or whatever the defacto top plan becomes) getting caught in a
adverse consumer selection death spiral. Regulations can require that prices and benefits be
both calculated from the same standard population.
3E: Add-on benefits optional and fully priced. If add-on benefits are optional and fully
priced then the unhealthy would no longer be subsidizing the pre-existing good health of the
healthy.
91
Mineral-level refers to platinum (90% actuarial value), gold (80%), silver (70%), and bronze (60%) plans.
100
3F: Add-on benefits prohibited. If add-on benefits were to be prohibited, benefits
would be more standardized and insurers would not be able to use add-ons as an indirect
selection tool. There are, however, both political and technical barriers. Consumers,
particularly the healthy, like add-on benefits; it makes them feel like they are “getting
something” from their insurance. There is also the technical problem of deciding where good
health management ends and add-ons begin. Health club membership is likely an add-on, but
what about access to a nurse hotline? Add-on plans (rather than benefits) could still be sold,
but only independently of health insurance.
4. Marketing
Marketing regulations to reduce indirect selection should assure that 1) marketing efforts reach
even the least desirable potential insureds and 2) that insurers have limited opportunity to craft
marketing strategies that disproportionately appeal to the most desirable risks and/or tacitly discourage
the least desirable risks. Unfortunately it is nearly possible to simultaneously achieve these goals. A
single marketing approach cannot reach all people. Yet every custom marketing strategy provides a
unique opportunity to facilitate indirect selection.
Consider the challenge posed by illiterate and marginally literate consumers. Such people are
not desirable health insurance risks. They have poor health status and poor prognosis given their health
status (see previous discussions of education and health literacy in Omitted Variables). Internet and
paper-based marketing strategies will not effectively reach these people. Special outreach will be
required to enroll them. Requiring insurers to make an effort to reach them is good. But even then, no
one should not be surprised if the insurer that does an amazing job soliciting well-educated people
through internet and paper strategies, falls short in communicating its message to the illiterate via
outreach efforts. It is not in insurers’ interest to be effective.
101
There is general consensus in the literature that marketing materials should be more
standardized than today, that insurer marketing efforts should be constrained, and that all things equal
it is better to have a neutral party, such as a community advocate, talk to vulnerable populations about
insurance rather than commissioned sales agents.92 But there is hot debate concerning how
standardized the marketing materials need to be, how constrained insurer marketing efforts should be,
and the appropriate role of sales agents and sales agent compensation.
Agents provide the in-person support to consumers who otherwise may not have the skills or be
willing to invest the time to understand complex written material or who simply prefer human
interaction. That’s a valuable public service. Agents, however, can also be invaluable to insurer indirect
selection efforts. Agents can steer consumers to buy insurance on and off exchanges and particular
products. The steering is often referred to as “street underwriting” or “field underwriting”.
Furthermore, if the agent is being paid a commission, unless the commissions across all products are the
same, it can be difficult to discern whether an agent has worked in his or the consumer’s best interest.
PPACA takes initial steps to standardize marketing materials. PPACA requires the exchanges to
offer an internet portal and telephone assistance (Section 1311). Information on the portal will be
presented in a standardized format that facilitates comparison between plans. All plans, on and off the
exchange, individual and group, will have to summarize their benefits via DHHS standards (Section
2715). This will allow for better comparisons.
Other steps that could be taken by federal and state regulation include:
92
The general approach taken by Massachusetts (Raymond, 2007; Gordon, 2011)
102
Figure 34
Regulatory Options
Selection Control or Mitigation Option Alterna-tive To
4 Marketing
A Multi-channel marketing and sales support --
B Multi-lingual marketing and sales support --
C Proactive outreach --
D Agent restrictions --
E Marketing material review --
F Marketing activity constraints --
4A: Multi-channel marketing and sales support. Not everyone has access to
and is comfortable using the internet, even with telephone assistance. A mechanism for
providing paper and in-person explanations and enrollment support would also be
helpful.
4B: Multi-lingual marketing and sales support. Marketing is a communication
exercise. Many consumers do not comfortably speak and read English. Marketing
efforts will not be effective unless they are in the consumer’s language. It is not feasible
to support all of the world’s languages. But regulators could require that a language be
supported if the number of consumers speaking the language in the region exceeds a
threshold.
4C: Proactive outreach. As will be discussed in the upcoming E.
Monitoring section, a community that is underinsured is most likely, from the
perspective of insurers, an undesirable community. Insurers should not be permitted to
passively accept that they have low penetration in underinsured communities; they
should be required to document what they have done specifically to reach such
communities.
103
4D: Agent restrictions. At a minimum, agents should have to demonstrate
their knowledge of healthcare under PPACA via the state licensing and renewal licensing
processes. Agent commissions could be capped or standardized. The ultimate
restriction would be to forbid health insurance commissions in favor of internet sales
with salaried call center support93 and salaried community outreach educators.
4E: Marketing material review. A picture can be worth a 1,000 words.
Marketing material review should examine words and pictures. A central question
concerning marketing material review is whether the review should be mandatory prior
to the use of the materials, mandatory after the use of the materials (with the power to
require the material to be revised), or only when a complaint is filed after use.
4F: Marketing activity constraints. There should be constraints on when,
where, how, and to whom insurers market their product. For example, should insurers
be allowed to send direct mail exclusively to families living in middle class and upper
class neighborhoods that have a history of buying adult sporting equipment? (The
marketing material could feature obviously healthy people engaging in sports and could
tout the fitness benefit included in the base premium.) Or should mailing only go to all
or none in the entire market? Massachusetts adopted versions of 4D, 4E, and 4F
(Raymond, 2007; Gordon, 2011).
The above options, even if enacted into regulation, take a good deal of commitment to
implement, monitor, and enforce. States may not be willing to take on this challenge for either political
or logistical reasons.
93 With the ability to enroll the caller over the phone using the internet interface rather than simply directing the caller how to use the internet interface.
104
5. Enrollment
Adverse consumer selection (anti-selection) occurs when insureds have selection choices with
respect to buying insurance, renewing insurance, benefit levels, benefit designs, and provider networks.
There cannot be anti-selection without selection. Adverse consumer selection in turn begets insurer
selection. Reducing consumer selection reduces the need for insurer selection. The value of limiting
consumer selection is difficult to explain, however, in a society that fundamentally values consumer
choice. Politicians are reluctant to espouse the virtues of limited choice.
The first consumer choice is the choice to buy (aka “enroll in”) insurance. Although insurance is
supposedly mandatory under PPACA (Section 1501), potential insureds do, in fact, have the choice
whether to buy insurance. Certain individuals are exempt from the insurance requirement (PPACA,
Section 1411). The penalties for not having insurance are nominal in 2014 and even when they max-out
in 2016 they are modest in comparison to the cost of purchasing insurance. The penalty in 2016 is $695
and is indexed for years beyond 2016. The penalty is significantly less in 2014 and 2015 and less for low
income people, children, and families (PPACA, Section 1501). Tax penalties only work to the extent that
the individual is tax compliant.
Furthermore, a person without insurance still has access to costly healthcare. The federal
Emergency Medical and Labor Act (EMTALA) of 1986 requires hospitals to provide emergency care
regardless of ability to pay (CMS, 2011). Some states have similar laws. If non-insurance penalties are
modest and insurance can be purchased on demand, then it will often make financial sense for a healthy
person with few assets to lose to emergency healthcare bills to wait for a significant deterioration in
his/her health before buying insurance.
105
Figure 35
Regulatory Options
Selection Control or Mitigation Option Alterna-tive To
5 Enrollment
A Stiffen non-insurance penalties --
B Eliminate or weaken EMTALA --
C Annual enrollment --
D Penalty for late enrollment --
E Enrollment into lower plans only --
5A: Stiffen non-insurance penalties. The penalty for not having insurance is
low in comparison to the cost of insurance. Selection will occur if the healthiest people
are financially better off without insurance. While the insurance industry would
strongly support increased financial penalties; consumers, already unhappy with
“mandatory” insurance, would not. The penalty change could be either federal or state
as states have the right under PPACA to introduce regulations more strict than federal
regulation. If the state imposes the penalty it would also need a mechanism for
collecting it.
5B: Eliminate or weaken EMTALA. Giving people care regardless of insurance
status decreases the incentive for having insurance. Eliminating EMTALA is, however,
unrealistic with respect to true life-threatening emergencies. Americans simply don’t
have a tradition of standing by and watching someone die. But what constitutes an
emergency and the amount of care a hospital must provide to patients without
insurance could perhaps be narrowed.
5C: Annual enrollment. People should not be able to wait and buy insurance
exactly when they need it. Therefore, except for certain circumstances, such as losing
106
employer insurance, new enrollment should be limited to once a year, ideally with the
enrollment period ending a month or more in advance of the plan year. This regulation
should not be difficult for consumers or insurers to accept. The group health insurance
has long had a tradition of annual open enrollment periods. In the group insurance
market, if an employee or dependent does not enroll when the employee is hired, he
must wait for the annual open enrollment period. The only exceptions are for certain
changes of family and insurance circumstance. Family circumstances include marriage,
divorce, and birth. Insurance circumstances include discontinuation of a spouse’s
insurance plan. Massachusetts health reform did not include an annual enrollment
provision and there is evidence that on-demand enrollment is hurting Massachusetts
reform efforts (Lazar, 2010).
5D: Penalty for late enrollment. There could be a premium penalty for anyone
who enrolls late or after a more than minimal gap in insurance. Medicare and Medicare
Advantage plans have annual enrollment periods which end more than a month before
the beginning of the new plan year and premium penalties for late enrollment (CMS,
2011).
5E: Enrollment into lower plans only. After January 2014 allow new enrollees
to buy insurance only at the silver or bronze level. People who wait to buy insurance
when they need it should not be immediately entitled to a “Cadillac” plan. As a quasi-
penalty for not buying insurance when they did not need it, they should have significant
initial cost sharing. They can then upgrade their plan, perhaps limited to one level at a
time, during the annual open enrollment period. See the next Post-Enrollment
discussion.
107
6. Post-Enrollment
Consumer selection can occur after the consumer enrolls. He or she may choose to change
(select) plans or to drop coverage. Changing plans within the plans offered by one insurer or dropping
coverage altogether is subject to much the same adverse consumer selection as enrolling in insurance in
the first place: the insured may be changing insurance to “get a better deal” specific to his or her
current circumstances. Likewise, changing plans between insurers (disenrollment) may be adverse
consumer selection or it may be the result of the current insurer somehow “encouraging” the insured to
leave – insurer skimping and dumping. Even if an insured enrolls for health insurance in a timely
fashion, he or she should not be able to increase and decrease benefit levels to have high benefit levels
while undergoing care and to save premium when care is not needed.
Insurers will gain less and therefore have less incentive to skimp or dump if they have to pay a
penalty for each insured that disenrolls. The penalties also draw attention to the disenrollment rates. It
is important to note, however, that penalties reduce, but don’t eliminate incentives to skimp and dump.
It is possible that a given insured’s needs may be so expensive (even with the extra money the insurer
gets from risk adjustment), that the savings associated with the insured disenrolling dwarfs any possible
penalty.
The following are regulatory options:
108
Figure 36
Regulatory Options
Selection Control or Mitigation Option Alterna-tive To
6 Post-Enrollment
A Annual plan changes --
B Maximum one tier change --
C Disenrollment rates as a quality measure --
D Disenrollment rate penalties 6EF
E Disenrollment per head penalty 6DF
F Disenrollment reinsurance 6DE
6A: Annual plan changes. Just like an insured should be able to enroll once a
year, he or she should be able to change coverage only one a year, ideally with the
window for making the change ending a couple of months before the new plan year
begins. This is also standard in the group health insurance market.
6B: Maximum one tier change. In order to encourage everyone to buy the
insurance that they need over the long term and not just at the moment, insureds
should not be able to upgrade their coverage more than one mineral-level per
enrollment cycle.
6C: Disenrollment rates as a quality measure. Because insurers may skimp and
dump, it is important to closely watch disenrollment rates, particularly for the most
expensive or other vulnerable insureds.
6D: Disenrollment rate penalties. Simply being watched may not be enough
reason for insurers to avoid skimping and dumping. 6D, 6E, and 6F impose direct
financial costs. One option is that an insurer could be penalized if more than a certain
percentage of insureds, or more than a certain percentage of vulnerable insureds, move
to another insured.
109
6E: Disenrollment per head penalty. Alternatively insurers could have to pay a
flat penalty (tax) to either the government or to the insurer receiving the insured for
every insured that moves.
6F: Disenrollment reinsurance. Another alternative is to have the prior insurer
reinsure the new insurer for insureds who leave. For example, the prior insurers could
have to reimburse the new insurer for 50% of the claim costs for the insured for the first
6 months after the insured moves.
7. Care Management
Care management is a very difficult arena for the government, whether federal or state, to
regulate. Consumers fear government “death panels”. Unnecessary care frequently meets consumer
emotional needs, if not physical ones. Unproven care from the scientific perspective may be a
healthcare consumer’s only hope for quality of life, or even life itself. Yet, healthcare costs will not be
controlled if we don’t, as a society, do a better job of managing and limiting care. PPACA has given
insurers and the providers who work with them the task of figuring out how to do this. The problem is
that they might overstep and perform the task too well, thereby limiting necessary and proven care and
encouraging expensive insureds to go elsewhere. Yet, given the lack of general consensus regarding
necessary and proven care, it will be impossible to “prove” that an insured or provider has overstepped.
The following regulatory options should help:
110
Figure 37
Regulatory Options
Selection Control or Mitigation Option Alterna-tive To
7 Care Management (CM)
A CM principles --
B CM governance --
C CM standardization/safe harbors --
7A: CM principles. Care management policies and rule will and should change
over time. An insurer should, however, be able to articulate care management
principles, which are relatively invariant, under which the policies and rules are
developed, changed, and otherwise governed.
7B: CM governance. Regulators should require insurers to establish and follow
a formal care management governance process, including a mechanism for providing
timely and authoritative appeals of specific decisions.
7C: CM standardization/safe harbors. PPACA encourages the development of
consensus standards regarding necessary and proven care and treatment protocols.
Regulators should provide insurers and providers who follow the standards a safe
harbor from allegations of using care management to affect indirect selection.
8. Providers
Although providers are last on this list, it does not reflect their importance to indirect selection.
As depicted the Chapter 3 conceptual model, providers have a central role in indirect selection.
Because a provider network approach is to healthcare is now the standard in US, PPACA assumes that
insurers will have “panels” of “preferred providers”, often also referred to as “network providers”.
111
While insurers cannot directly select their insureds, they can still directly select their providers and
different providers attract different insureds. Insureds join plans because of providers; insureds leave
plans because of providers. If an insured has a good relationship with his providers, the insured is likely
to stay with his or her plan; if the insured doesn’t he or she is more likely to change plans.
There are several broad areas of concern with respect to providers: 1) primary care and first tier
specialist local area availability, 2) availability of super specialists, 3) compensation, 4) incentives, 5)
inter-plan comparability, and 6) transparency.
The best way to discourage enrollment by people from a specific geographic area is not to have
primary care and first tier specialists in their area. People want to receive most of their healthcare
locally. They also want healthcare providers who provide culturally sensitive care. Buchmeller and
coauthors (Buchmueller, Gilmer, & Harris, 2004) found that certain groups of people are prone to
disenrollment because of lack of cultural fit with their providers.
The best way to discourage enrollment by the people with very specific, very expensive
healthcare needs is not to provide the super specialists that such people need. For example, sickle cell is
an inherited blood disorder fond mostly among people of African descent. Some people with sickle cell
go years without a serious sickle cell episode. Others have regularly recurring episodes that necessitate
hospital care and lead to organ damage. Severe sickle cell is treated via a multi-disciplined team of
physicians and non-physicians. While any hematologist theoretically may treat sickle cell, there are only
a handful of hematologists and associated teams even in a city as big as Chicago that specialize in the
treatment of severe sickle cell. The insurer that does not contract with these physicians and teams will
not likely get insureds with severe sickle cell.
Obviously compensation is an important issue with respect to providers. Providers have to be
paid enough in total to cover their costs and income expectations. Increasingly compensation is being
delivered by incentive systems, often called pay-for-performance, or by capitation. This is a paradigm
112
shift from the traditional, more-care-is-more-profit, fee-for-service approach to physician
compensation. The intent of pay-for-performance is sound, but it could lead to non-intended
consequences with respect to “non-performing” patients. Some patients, for regardless of the quality of
care the provider provides, do not adhere to (comply with) medical advice. This is especially true with
respect to conditions such as diabetes for which proper disease management requires significant
lifestyle changes. A physician looking to meet his or her disease management performance goals, may
find it easier to encourage a non-adherent patient to find care elsewhere than to get the patient to
change his or her lifestyle. Or the physician may decide that it’s much easier to make his or her
performance goals when treating educated, middle-class patients in the suburbs than treating patients
in the inner city who struggle to take care of themselves even when healthy – and select his office
location accordingly. Therefore an insurer with a strong incentive program, even if that program pays
even more in total than a fee-for-service program, may unintentionally encourage dropping of non-
adherent patients and the under-provision of medical care in certain neighborhoods.
It is important to make benefits and rates more standard, on and off the exchange, and between
mineral-levels. Likewise, in order to minimize selection, it is important to standardize the offering of
providers. An insurer may offer the same plan and rates, on an off the exchange, but if the exchange
plan offers a narrow selection of providers and the non-exchange plan a wider selection of providers, or
the non-exchange plan compensates its providers better and therefore make its providers more
welcoming to non-exchange patients, the non-exchange plan will be more attractive.
Plan benefits and rates should be transparent – insureds and potential insureds should be able
to easily make comparison between plans. Likewise there should be transparency with respect to
providers. Unfortunately there is little emphasis on provider transparency, even at the time of care. An
insured may get a diagnostic test from a participating provider only to find out after the fact that the
physician who interpreted the test is not a participating provider. Such unhappy experiences will make
113
the insureds who have a diagnostic test during a year more likely to find another insurer than the
healthy insureds who don’t have such tests. Lack of provider transparency is discussed by Oechsner and
Schaler (2011).
Although most authors feel that providers have a role in indirect selection, few have articulated
regulatory options. The following is an initial a list:
Figure 38
Regulatory Options
Selection Control or Mitigation Option Alterna-tive To
8 Providers
A “Must have” providers --
B One panel for all plans --
C Compensation equity --
D Incentive equity --
E Non-preferred provider transparency --
F Out of network exceptions --
G Geographical dispersion --
H Cultural appropriateness --
8A: “Must have” providers. If a provider is truly the only provider in a
community to offer a type of care or the only one to provide an advanced level of that
care and the care is a medical necessity, that provider must be a network provider.
8B: One panel for all plans. Insurers should be required to have one panel for
all their plans, irrespective of whether the plan is sold on or off the exchange, or the
level of benefits. Ideally the insurer should be required to have one plan for individual,
small group, and large group business, including employer self-insured business.94
94 I heard that insurer was considering setting up a separate company specifically for exchange business. The insurer is dominant in its market with respect to large group and self-insured employer-sponsored insurance.
114
8C: Compensation equity. Insurers should be required to offer the same
capitation and fee-for-service payments across their entire panel.
8D: Incentive compensation equity. Providers who provide high quality care to
more challenging patients should receive additional incentive compensation.
8E: Non-preferred provider transparency. Insurers need easily assessing the
quality, depth, and breadth if provider networks. They also need to know whether
specific providers are preferred providers both at the time of enrollment and prior to a
service. There should be no surprises. Oechsner and Schaler-Hayes, from the New York
State Insurance Department, discuss this further (2011).
8F: Out of network exceptions. There are times when appropriate care cannot
be provided in network. There needs to be a timely and transparent process for
granting permission to use out an out of network provider without additional cost to the
insured.
8G: Geographical dispersion. Providers must be available in all neighborhoods
of the insurance market. Insurers should not be able to avoid high cost areas by not
having providers in those areas.95
8H: Cultural appropriateness. Providers should provide culturally sensitive
care, which among other things means that physicians who live and work in the
community are generally preferred to those who visit for office hours once a week.
The next section will discuss monitoring, enforcement and penalties, and feedback loops.
Employers require a large selection of providers. The supposed intent of a separate company was to allow for a narrower selection of providers for individual insureds than for group insureds. I have been unable to confirm the insurer’s ultimate decision. 95 This expectation conflicts with PPACA goal of promoting health CO-OPs – provider owned, often local insurance plans (PPACA, Section 1322). Co-OPs may by located in low cost areas, which would allow them to skim from the larger market.
115
E. Monitoring
If regulations are ignored, they are worthless. Monitoring and enforcement are necessary for
existing regulations to be effective and to indicate when more or different regulation may be necessary.
Therefore, monitoring should be used to assess adherence to specific regulations and equally, if not
more importantly, monitoring should assess whether the regulation has effectively minimized and
mitigated indirect selection opportunities. As previously discussed, insurers will likely be continuously
modifying their selection strategies. Monitoring a moving target is a difficult, but not impossible task.
Effective monitoring must be comprehensive and dynamic with a particular focus on the most
vulnerable insureds and geographies with the most vulnerable insureds. Monitoring should be both
quantitative and qualitative as perceptions may well precede empirical evidence.
Figure 39
Regulatory Monitoring to Assess Presence and Impact of Indirect Selection
Type of monitoring
1 Broad monitoring
2 Marketing review
3 Research and ad hoc monitoring
4 Vulnerable people
5 Vulnerable areas
6 Stakeholder feedback
1. Broad monitoring. Regulators should broadly monitor the health insurance
market with respect to insurer profitability, enrollment, business mix, and
disenrollment, plans offered and selected, diagnosis, SES, age of insured, and numerous
other variables. Deviations from expected and changes over time should be noted and
explored. This macro-level, quantitative analysis should be ideally be based upon data
116
for the entire US or state population, including those insured under large group
insurance (including self-insured plans), small group, individual, Medicaid, Medicare,
other insurance plans and the non-insured. Only then can key questions concerning the
uninsured and selection between the markets be addressed. While PPACA calls for the
collection and centralization of national health insurance data (PPACA, Sections 3011-
3020); PPACA does not specify who needs to do what with the data. Thought leadership
is very much needed in this domain. States may not have the technical expertise or
resources to develop and implement a monitoring strategy on their own.
2. Marketing review. Regulators and others should routinely review marketing
materials and activities. While it is almost certain that marketing materials will be used
to affect selective marketing, it is impossible to set an unambiguous standard as to what
constitutes selective marketing.
3. Research and ad hoc monitoring. Non-regulatory public health and academic
researchers have resources and a fresh perspective for analyzing data. In order to
eliminate information asymmetry, all data available to insurers should be passed to
regulators, who, in turn, should pass the data to researchers with the requirement that
they must publish their findings in public forums. The challenge lies with finding ways to
pass such data while still preserving individual consumer privacy. Compromises will
undoubtedly need to be made, but, from the perspective of monitoring and ultimately
controlling indirect selection, more data is better.
4. Vulnerable people. Certain people are vulnerable in any health system. They
include the severely ill, the severely mentally ill, and the politically and socially
marginalized. Regulators should identify certain populations of people as vulnerable
and track their specific health insurance and healthcare experience. Watching their
117
enrollment and disenrollment rates compared to the non-vulnerable is good, but not
sufficient. Schlesinger and coauthors (Schlesinger, Druss, & Thomas, 1999) found that
whereas people with serious health problems may be dissatisfied with their care they
don’t necessarily switch plans because they fear the disruption in their provider
relationship. Beyond examining the data regulators should seek feedback from
vulnerable populations and their advocates.
5. Vulnerable areas. Areas may be vulnerable because they contain a
disproportionate number of vulnerable people, with poverty being one form of
vulnerability. At given income level, areas may also be vulnerable because of geography
or the political or social marginalization of its inhabitants. For example, remote rural
areas and blighted inner cities are frequently vulnerable. Vulnerable areas deserve
special attention. Regulators should designate certain geographic areas as underinsured
and pay particular attention to availability of plans, providers, and the experience of
insureds within these areas. If insurance participation is low in a particular area,
whether the area is officially designated as vulnerable or not, regulators should not
assume that the only reason for the underinsurance is lack of compliance on the part of
the consumers with respect to mandatory insurance requirements. People in that area
may not have the same access to the same price and quality insurance as people in
other areas.
6. Stakeholder feedback. Regulators should establish a process for evaluating
consumer, provider, insurer, and other complaints from the perspective of indirect
selection. There will be a fine, even non-existent line, between good insurance and care
management and indirect selection. Sick insureds will be dissatisfied and may change
insurers if an insurer denies certain care. The care requested may be evidence based.
118
In such a case the insurer’s legitimately ‘good’ practices will have resulted in indirect
selection. Alternatively the insurer may be systematically and inappropriately blocking
sick people from accessing expensive treatment. One complaint may not be worthy of
concern, but a consistent stream of complaints should trigger an empirical and
normative evaluation. Besides consumers, complaints should be accepted from
providers and other insurers who are often in the best position to detect patterns.
Newhouse (1994) advocated for local (state as opposed to federal) control of risk
adjustment and other regulations as local regulators can respond best to the feedback
concerning activities in their specific market. The downside of state control is that state
regulators may be inappropriately swayed by one dominant player.
F. Enforcement with Penalties
Enforcement and penalties are essential to effective regulation, but they are well beyond my
expertise. Therefore, as foretold in the initial Conceptual Model portion of this chapter, this paper
will not discuss enforcement and penalties other than to note the obvious: the more certain, quicker,
and bigger the enforcement and penalty actions, the more insurers are likely to adhere to the letter and
spirit of the regulations. Also, as previously noted, public outrage against an insurer and the resulting
loss of reputation is itself a penalty.
G. Feedback Loops
Feedback loops are essential to the operation of a dynamic system. Monitoring identifies and,
at least sometimes, quantifies the effects of indirect selection. But without subsequent action,
monitoring is worthless. If the indirect selection is in violation of current regulations, then penalties
and enforcement are called for. With or without a regulatory violation, the indirect selection should be
119
publicly discussed. Discussing indirect selection may result in moral suasion which causes a specific
insurer or even the insurance industry to modify their ways.
If enforcement and moral suasion are not sufficient, regulators should modify the risk
adjustment or make other regulatory changes – the sooner the better. Van de Ven (1994) points out
that insurers are less likely to select if the selection effort is associated with high potential costs and a
potential short life. Potential costs are high when there is a high likelihood of “getting caught”, public
discussion resulting in reputational loss, and potential penalties. Potential life is short when there is a
high likelihood of getting caught, reputational loss, regulatory enforcement, and corrective changes to
risk adjustment or other regulations.
There will be a need to change risk adjustment over time; yet big changes to risk adjustment are
highly destabilizing. Therefore, there may be merit for pre-emptively declaring that risk adjustment will
be changed on an annual or two year cycle. Then there is no debate about the timing of the change, just
the content of the change. Big changes can be phased in to minimize the destabilizing effects. There is
also merit to having the bulk of regulation in the form of administrative rules, rather than legislation, as
rules are easier to update on a regular and timely basis.
120
VI. CONCLUSION
Healthcare reform emerged, in part, from dissatisfaction with today’s health insurance system
which makes insurance unobtainable or unaffordable for many of the people who need it the most.
People stay in unpleasant jobs and marriages in order to preserve group health insurance. Someone
who becomes ill and can no longer work loses both his/her income and health insurance. Insurance
companies invest substantial resources in deciding whom to insure at what price – direct risk selection.
The healthcare reform strategy with respect to insurance availability and affordability is to
eliminate direct selection by forbidding underwriting and requiring community rating, to subsidize
premiums for those who cannot afford the community rate, and to instruct insurers not to indirectly
select and thereby cause insurers to focus on healthcare quality, price, and efficiency. However, it is
possible that insurers are not going to voluntarily forfeit selection. Insurers must stay competitive and
profitable. If they cannot directly select, they may seek out ways to quietly indirectly select in order to
enhance profitably or, at the very least, not to lose profitability by being the recipient of another
insurer’s less desirable risks.
To reduce the profit impact of intentional and inadvertent indirect selection, the authors of
healthcare reform included risk adjustment as part of the new healthcare system. Via risk adjustment
there will be a behind the scenes (from the perspective of the consumer) flow of money from insurers
who have healthier insureds to insurers who have less healthy insureds. Risk adjustment is an essential
tool for reducing and mitigating indirect selection. It does not, however, offer a complete solution.
The U.S. Patient Protection and Affordable Care Act of 2010, commonly referred to as
“healthcare reform,” partitions the individual health insurance market in 2014 and beyond by income
level. In order to take advantage of healthcare reform’s income-based premium subsidies and out of
pocket limits, people with incomes under 400% of the family poverty level will need to buy their
insurance within a state exchange in order to take advantage of premium subsidies. People with
incomes over 400% of the poverty level will be able to select health insurance from within or outside of
the exchanges.1 Furthermore, even within or outside an exchange, insurers may be able to create and
market health insurance plans that differentially attract and retain people based on their income level,
either intentionally or incidentally to other goals.
Healthcare reform mandates health risk adjustment to equalize risk between insurers within
and outside of the exchanges and within exchanges. The health risk adjustment models most used
today, including those currently used by Medicare and Medicaid, employ age, sex, and recent diagnosis
codes to assess health risk. Recent prescription drug codes may be used to supplement or replace
diagnosis codes. A separate adjustment is then often applied to account for regional cost variations,
typically at a level no smaller than county. Income is not directly included in any of the widely used
models, in part because income information is not routinely available in health insurer databases.
Income will, however, be available in insurance databases post-healthcare reform.
This paper will explore income’s potential value as a predictor variable for health risk
assessment. Then, using a publicly available database and a publicly available risk adjustment
methodology, the paper will demonstrate that income most likely has a financially and statistically
significant marginal health risk predictive value – a value over and above the value provided by today’s
1 States may pre-empt federal law and require all individual insurance to be purchased via an exchange. See Discussion and Recommendations.
Appendix 138
risk adjustment models. Consequently, the paper will endorse the inclusion of income in post-health
care reform risk adjustment in order to mitigate the impact of income-based selection and enhance the
stability of the individual health insurance market.
Appendix 139
BACKGROUND
As expressed in the The U.S. Patient Protection and Affordable Care Act of 2010 and associated
amendments (PPACA, May 2010), the three dominant social policy goals of the effort to reform
individual health insurance market are:
1) Affordability: make health insurance affordable to low and middle income families.
2) Accessibility: assure that everyone, regardless of health status, has access to
comprehensive health insurance.
3) Competition: structure the system so that insurers focus on managing healthcare
quality and cost efficiency,2 rather than selection of insureds.
A fourth goal follows from the second and third:
4) Risk Selection: structure the system so as insurers can no longer compete on or benefit
from risk selection.
The goals were discussed extensively in the academic, trade, and popular literature before the
passage of the reform legislation.3 Since reform was passed, Jost (2010) has written an academic paper
which addresses the varied challenges of limiting selection in the post-reform individual health
insurance market.
In pursuit of these goals, medical underwriting will be no longer allowed. Insurers must cover
everyone who applies without “preexisting condition exclusions or other discrimination based on health
status” (PPACA, Section 1201). Insurers operating within an exchange may not employ marketing
2 The joint goals of quality and cost efficiency appear throughout the Act. Title I of the Act, the Title governing
reforms to the individual and group markets, is titled “Quality, Affordable Health Care For All Americans”. Section 2717 is “Ensuring the quality of care”, followed immediately by Section 2718 which is “Bringing down the cost of health care coverage”. Section 2718 requires insurers to “provide value for premium payments”. 3 Examples include trade/popular literature: Obama (2009), Fronstin and Ross (2009), Reinhardt (2009) and academic literature: Puig-Junoy (1999) and Cogan, Hubbard, and Kessler (Cogan, Hubbard, & Kessler, 2005).
Appendix 140
practices or benefit designs that have the effect of discriminating by health status and must
demonstrate that they have an adequate supply of providers, particularly in underserved and low-
income communities (PPACA, Section 1311).4
Furthermore, premium rates may not be discriminatory (PPACA, Section 1201). Insurers must
rate all of their non-group business, across all plans offered both within and outside of the exchange, as
a single pool.5 Rates can vary only according to actuarial value plan design differences, as calculated
based on a standard population. Rates cannot vary based on the risk profile of the specific plan (PPACA,
Section 1312) or between business sold within or outside of the exchange (PPACA, Sections 1301 &
1312).
As a final guard against insurers, even unintentionally, benefiting or being disadvantaged by
selection, the states will use risk adjustment to balance inter-insurer risk pool differences. Insurers with
pools that overall experience favorable selection will pay insurers with pools that experience
unfavorable selection. Risk adjustment will apply across the exchange and non-exchange market. The
legislation does not specify the risk adjustment methodology other than to suggest that it might
resemble the risk adjustment methodology currently used by Medicare (PPACA, Section 1343).
It is impossible to simultaneously maximize multiple goals within complex systems. Tradeoffs
are inevitable. Healthcare reform is no exception. As part of the effort to curb selection, the legislation
generally prohibits discrimination by insurance companies. Yet, in pursuit of the affordability goal, the
legislation allows unequal access to insurance options with respect to family income.
People with incomes under 400% who don’t qualify for Medicaid, must buy their insurance
within a state exchange in order to take advantage of healthcare reform’s income-based premium
subsidies and out of pocket limits (PPACA, Sections 1401 & 1402). People with incomes over 400% are
4 The law clearly precludes blatant discrimination. But it is not clear how enforceable it will be in terms of more subtle discrimination. Jost (2010) and Kingsdale and Bertko (2010) discuss this concern. 5 States have the option of forcing insurers to rate their individual and small group business as a single pool (PPACA, Section 1312).
Appendix 141
not eligible for subsidies and limits and may buy coverage within or outside the exchange (PPACA,
Section 1312).
Insurers in turn are allowed decide whether they wish to sell individual coverage within the
exchange. If they sell within the exchange, they must sell the same coverage outside the exchange – at
the same premium rate. But an insurer may sell insurance only outside the exchange.6 This allows
insurers to choose whether they want to insure people with a full range of incomes or almost exclusively
those over 400% of poverty. Insurers who choose to sell insurance only off the exchange, have smaller
potential markets, but the markets are wealthier and the insurers are subject to less regulation and
monitoring.7
Furthermore, in spite of an exchange requirements requiring service in low income
neighborhoods and against discrimination, it is not difficult to imagine that insurers could design their
products, marketing materials and practices, and/or provider panels, to differentially attract and retain
insureds with different average family incomes.8 This could even happen unintentionally. Van de Van
and Ellis (2000) provide a well-researched discussion of differential attraction and retention, which they
refer to as “cream skimming.”
Healthcare reform provides funding for the formation of community health “CO-OP” plans
(PPACA, Section 1322). While preference is given to statewide plans, a newly formed community plan is
6 Implied by PPACA, Section 1311 which lies out the criterion for health plans to be certified as exchange-qualified
health plans and affirms the consumer’s right to buy off the exchange and by PPACA, Section 1511 which requires individuals to buy minimum essential coverage, not qualified coverage. Interpretation confirmed by Jost (2010), who in turn points out that individual states have a right to pre-empt the federal legislation and make individual coverage available only through exchanges. See Discussion section of this paper. 7 Exchange qualified plans are subject to more regulation and monitoring (PPACA, Section 1311).
8 Under healthcare reform insurers will have income data with respect to their insureds. Income data will be collected and verified at enrollment for everyone under 400% of poverty who buys insurance via an exchange. Even if the data is not transferred to the insurer, the insurer will be able to impute income based on the magnitude of the subsidy. Most everyone not receiving a subsidy will be above 400% of poverty. Furthermore, insurers can easily obtain income estimates and a host of other types of data on their current and prospective insureds via a variety of demographic (neighborhood-level) and consumer (person-family-level) commercial databases. Vendors include Easy Analytic Software for neighborhood-level data and Experian, Equifax, Axiom, and infoUSA for person-family-level data.
Appendix 142
most likely to start by serving a relatively small geographic area, such as the area around a cluster of
providers. Such an area may have a disproportionate number of high or low income people. CO-OP
plans therefore may be particularly likely to attract customers with particularly high or low incomes.
For example, according to the U.S. Census Bureau estimates (U.S. Census Bureau, 2010),
in 2006-2008 the median household income in Chicago was $38,625 with 19.6% of households
having an income under the federal poverty line. In contrast, the mean household income in
suburban DuPage County was $77,040 and only 5.8% of households were in poverty and the
mean household income for Gary, Indiana, just a few miles from Chicago was $27,526 with
27.9% of households in poverty. Although all three areas are part of the metropolitan Chicago,
they represent three very different markets with respect to population incomes.
Thus, the critical question of this analysis: will the income-based bifurcation of the market
between exchange and non-exchange markets and perhaps differences in income levels within the
exchange and non-exchange markets, create potential income-related selection advantages and
disadvantages for insurers? There will be potential income-related selection advantages and
disadvantages if income is related to health costs and the risk adjustment methodology does not
sufficiently adjust for the income-related cost differentials. Risk adjustment does not need to fully close
any differentials. It just needs to make the remaining differentials small enough that there is little
exploitable benefit to insurers. If the benefit is small enough, insurers will concentrate their efforts on
building competitive strategies based on quality and cost rather than selection – one of the primary
goals of healthcare reform.
Relatively small income differentials in terms of percentage of premium when spread over an
entire block of business may still offer significant advantage or disadvantage. The health insurers among
the Fortune 500 had profits of 2.2% of revenue in 2009 (CNNMoney.com, 2010). Milliman reports that
the median 2009 profit for all health insurers was 1.1% of premiums (Milliman, 2010).
Appendix 143
Starting in 2011 insurers offering individual health insurance must pay at least 80% of individual
health premiums toward health costs (80% “minimum loss ratio”), leaving 20% of premiums for all
administrative costs, commissions, and profits. If insurers do not reach the targeted 80% payout they
will need to rebate premiums at the end of the year in order to reach the 80% target (PPACA, May 2010;
NAIC, October 2010).9 From 2011 onward even a 2% profit may be a “stretch” goal. There is articulated
concern that the 80% minimum loss ratio requirement may eliminate profit margins, causing insurers to
leave some markets, thus destabilizing the state markets (PPACA, May 2010; NAIC, October 2010). This
paper will therefore consider a potential 2% differential in health costs across a block of business10 to be
a significant advantage or disadvantage that has the potential to destabilize the state insurance markets
if not removed via risk adjustment.
The next section of the paper, Conceptual Foundation, will lay the conceptual foundation for
income being related to health costs in ways not fully accounted for by today’s risk adjustment models,
including the model used by Medicare. The Analysis section of the paper will use a publically available
database and one of today’s publically available risk adjustment methodologies to confirm that there
are statistically significant income differentials that persist after risk adjustment and that these
differentials may generate significant business advantage and disadvantage for insurers. The
Recommendations section will endorse the inclusion of income in post-health care reform risk
adjustment in order to remove the potential for significant income-based selection advantage and
disadvantage.
9 The rebate calculation will be for all of an insurer’s individual business within a single state (NAIC, October 2010). 10 Rebates and most of the other legal requirements and calculations associated with healthcare reform are at the state level. “A block” is therefore all of an insurer’s individual business within a state.
Appendix 144
CONCEPTUAL FOUNDATION
Income and HC Consumption
The conceptual foundation starts with Model 1, a basic model for healthcare consumption11 and
costs. Model 1 assumes that everyone is covered under the same insurance plan/program. Otherwise
it would be necessary to model the interactions between benefit and cost sharing structures and
consumption.
Figure 1
Model 1 is best considered from right to left. Healthcare (HC) costs for an individual person are
a function of healthcare consumption and unit costs. Healthcare consumption is, in turn, a function of
an interaction (hence the bidirectional arrows) between the individual’s:
11
Healthcare consumption is also known as healthcare utilization.
Appendix 145
1) Current conditions and condition severity. For example, the individual may or
may not have diabetes and the diabetes may or may not be controlled.
2) Incident conditions and the risk thereof. Incident conditions may be entirely
“out of the blue”, such as a car accident, or they may be an acute manifestation of a current
condition, such as a complication of diabetes. Incident conditions will trigger healthcare
consumption. Furthermore, simply the risk of an incident condition will trigger consumption by
way of prevention and screening.
3) Consumption decisions. While current and incident conditions can be thought
of as the best measure of an individual’s healthcare “need”, individuals with the same need will
not consume the same resources. Consumption decisions are a function of the interaction of
individual’s healthcare need, the individual’s personal health utility (demand), and the
healthcare system (supply) in which the individual is seeking treatment. Demand and supply
can interact via “induced demand” (Leonard, Stordeur, & Roberfroid, 2009).
The healthcare system, in turn can be described at a micro and macro level. The micro
represents the specific providers from whom the individual seeks advice and treatment and
even whether providers are conveniently available. The macro includes regional health practice
patterns.12
So how does income affect this model? In order to reduce the model and also for reasons which
will be explained in the ANALYSIS section, Model 2 drops the Unit Prices and Healthcare Costs from the
right side of Model 1. It depicts Healthcare Consumption as the end point and then depicts the various
ways that income is related to Healthcare Consumption.
12 The Dartmouth Atlas has been exploring this relationship for more than two decades. A list of Dartmouth Atlas publications is available at http://www.dartmouthatlas.org/publications/articles.aspx.
The theories supporting Model 2 are not new. Although the model is organized somewhat
differently and focuses on income, it is consistent with Andersen and Newman’s model of “Societal and
Individual Determinants of Medical Care Consumption in the United States” (1973).
Although cause and effect direction is not entirely clear (Goldman, 2001) (hence the use of lines,
not arrows13), researchers agree that income is clearly related to 1) how we live our individual lives –
“lifestyle” and 2) who we live our lives with – “neighborhood/community”. Neighborhood is the
collection of people who physically reside near us. Community is our combined neighborhood and
social network.
13 The direction of cause and effect is not relevant to income’s potential role in predicting healthcare consumption as long as income is measureable and temporally comes before the consumption.
Appendix 147
First consider the link between income and lifestyle. Numerous lifestyle-related behaviors are
linked to income. These include diet quality, overeating/obesity, smoking, physical activity, risk taking,
and adherence to medical advice. A summary of Behavioral Risk Surveillance System (BRFSS) data, as
shown in Table 3, makes this clear. These behaviors are, in turn, linked to health to such an extent that
they are accepted by the World Health Organization, Centers for Disease Control, and other health
authorities as the primary risk factors for assorted chronic diseases (WHO, 2005; CDC, 2010).
Then neighborhood/community. Housing is the largest single household expense and zoning
essentially segregates people by how much they spend on housing. Money buys housing quality as
defined by a variety of neighborhood-level health determinants (Kawachi & Berkman, 2003; Diez Roux,
2001), including pollution (Ash & Fetter, 2002), exposure to infectious disease (Fullilove, 2003), and
intimate and stranger violence (Sampson, Raudenbush, & Earls, 1997). Flying fists and bullets are
physical and psychological health risks. Most people seek healthcare close to home. Therefore
healthcare providers (or a lack thereof) are an integral part of the interaction between neighborhood
and health, especially for the poor who may not have access to an automobile (Shi & Starfield, 2000;
Prentice, 2006). Even free, quality healthcare within walking distance may not be easily accessed in a
crime-ridden neighborhood.
Physician practice styles vary by local environment. This is supported by Franks and coauthors
(Franks, Fiscella, Beckett, Zwanziger, Mooney, & Gorthy, 2003), who found that the socioeconomic
status (SES)14 characteristics associated with a physician’s address affected healthcare consumption
independently of the SES associated with the patient’s address.
14
Researchers typically consider socioeconomic status (SES) as some combination of income, education, wealth, employment, and occupation, measured at the individual, family, or community level. The operational measurement for a given study may be as little as one parameter, one level (Krieger, Williams, & Moss, 1997). Race and ethnicity are sometimes considered as separate constructs and other times alternative measures of status (Adler & Rehkopf, 2008). Shaver (2007) discusses the strengths and limitations of various SES measurements and methodologies, including the difficulties posed by SES and race and ethnicity interaction.
Appendix 148
Finally, there is a growing body of evidence (Smith & Christakis, 2010) that our social networks,
which are only partially overlapping with our neighborhoods, are also linked to our health. Since SES
“likes attract” socially (McPherson, Smith-Lovin, & Cook, 2001), income and health are linked through
social networks.
As noted above, each of the individual links shown in Model 2 are supported by research. In
addition there is a body of research that 1) directly relates income to health and 2) income to healthcare
consumption. This body of research sometimes considers potential intermediate variables, but does not
necessarily attempt to definitively define, accept, or reject them.
Various researchers have examined the body of research relating income (and other SES factors)
to health and reviewed the proposed intermediate variables. They include Cutler, Lleras-Muney, and
Vogl (2008), Mechanic (2007), Adler and Newman (2002), and Adler and Ostrove (1999).
Much of the research that directly relates income to healthcare consumption focuses on
hospital consumption. Because each day in a hospital is expensive, total healthcare costs are very
sensitive to inpatient hospital consumption. In the 2007 MEPS data (described below) I find that less
than 6% of the population has a hospital discharge, but that inpatient hospital costs are 29% of
expenditures and 43% of charges. Whether they look across all admissions (Billings, Zeital, Lukomnik,
Carey, Blank, & Newman, 1993; Hofer, Wolfe, Tedeschi, McMahon, & Griffith, 1998) or at admissions
related to specific conditions (McConnochie, Russo, McBride, Szilagyi, Brooks, & Roghmann, 1999;
Claudio, Tulton, Doucette, & Landrigan, 1999), at an individual’s income or his community’s income
(Hofer, Wolfe, Tedeschi, McMahon, & Griffith, 1998), researchers find an inverse income gradient for
hospital use.
Some have proposed that higher consumption of costly hospital services among the poor may
result from inadequate primary care, due in part to cost barriers (Billings, Zeital, Lukomnik, Carey, Blank,
& Newman, 1993). But studies from Canada, where everyone is guaranteed access to primary care,
Appendix 149
counter this argument. Researchers have found that a substantial income gradient among Canadian
populations. The Canadian poor use more primary care and more hospital services (Disano, Goulet,
via the physiologic toll exacted on the body by the stress. The cumulative effect of stress is known
allostatic load (McEwen & Stellar, 1993). Furthermore, a part of the relationship between income and
health may be due to common determinants of income and health. Common determinants possibilities
include genetics (Johnson & Krueger, 2005) and prenatal and childhood nutrition (Case, Fertig, &
Paxson, 2004).
Fortunately, for risk adjustment purposes, a direct causal relationship between income and
healthcare consumption is not required. And since this paper considers only one variable, income, it is
not necessary to differentiate between income’s independent contribution and the contribution it
makes as a proxy for other SES and related variables. A statistical relationship between income in one
time period and healthcare consumption in a later period is sufficient. There is clearly such a
relationship and most researchers feel that it is at least partly mediated by lifestyle behaviors and
neighborhood/community.
16 This is an example of “the healthy adherer effect”. The seminal healthy adherer paper is Simpson’s (Simpson, et al., 2006) meta-analysis which found that people who faithfully took placebo drugs as part of blind trials had significantly better mortality than those who took their placebos less regularly.
Appendix 151
Current Risk Adjustment Methods
The most common risk adjustment models for the under age 65 market are described and
evaluated by the Society of Actuaries (SOA) (Winkelman, Mehmud, & Wachenheim, 2007). The models
include the CDPS and ACG models which are most commonly used for Medicaid risk adjustment
(Winkelman & Damler, 2008). Because the SOA paper focuses on the under age 65 market, it does not
describe and evaluate Medicare’s HCC (Pope, et al., 2004) and Rx-HCC (Robst, Levy, & Ingber, 2007) risk
adjustment models. The HCC models were, however, developed by the same team that developed the
DxCG models which the paper does describe and evaluate. In addition, the American Academy of
Actuaries (AAA, 2010) and Milliman (Fontana & Yi, 2010) have recently published high-level issue briefs
describing risk adjustment models.
Although there are a number of models, they are conceptually quite similar to each other. As
depicted in Model 3, they all use essentially the same data to make either a concurrent or prospective
healthcare cost predictions. Specifically they use:
1) Recent diagnosis codes and/or recent prescription drug codes. “Recent” is
typically one year. Drug codes, when used are either a supplement or proxy for diagnosis codes.
2) The insured’s age and sex.
Appendix 152
Figure 3
In addition, when risk adjustment models are implemented they are usually adjusted to reflect
average costs for the insured’s area:
3) Area, usually no smaller than county.17
4) (Sometimes) Enrollment status. Miscellaneous adjustments related to
enrollment status are sometimes made as part of the risk adjustment process. Medicare adjusts
for end stage renal disease (ESRD) status, Medicaid enrollment (“dual eligibility”), whether the
beneficiary was originally disabled, and institutional status (CMS, 2010). Medicaid risk
adjustment typically applies separate factors for people who qualify based on disability versus
those who qualify based on poverty (Kronick, Gilmer, Dreyfus, & Lee, 2000; Yi, undated).
Commercial insurers may adjust for benefit design, cost sharing, and other plan-specific
characteristics.
17
Medicare uses county. Commercial insurers usually use multi-county “regions”.
Appendix 153
Model 4 fits the risk adjustment variables into the healthcare consumption model. It is
important to note that Model 4 shows recent diagnosis and drug codes having a non-identity
relationship with current conditions and condition severity. One obvious point of mismatch is the
possibility of inappropriate diagnoses/drugs. Conditions routinely get misdiagnosed and mistreated.
The other point of mismatch is more subtle, but potentially even more significant: the lack of recent
diagnoses and drugs. Not everyone with a health condition will seek medical treatment for the
condition during a year. Furthermore, even if they do, the physician may not code the diagnosis on the
insurance claim or prescribe a drug clearly related to the condition.
Figure 4
For example, in the MEPS database (described later) I find that fewer than 50% of the people
under age 65 who report ever having heart disease or having had a significant heart event, have sought
care within the last year which led to a cardiac diagnosis or purchase of a cardiac drug (exclusive of
Appendix 154
hypertension and cholesterol drugs). Somewhat more often, about 75% of people ever diagnosed with
hypertension have received a diagnosis or drugs in the past year; the 75% also applies to people ever
diagnosed with high cholesterol.18 By relying on recent diagnosis and drug codes, risk adjusters are not
“picking up” all sick people. Furthermore, the people who are being missed are likely not receiving
treatment and may therefore be most at risk for future complications and/or acute episodes – risk that
the risk adjusters are not assessing.
Today’s risk adjusters do not include income because risk adjustment requires data and
insurance companies, other than Medicaid, where everyone is poor, have never systematically captured
income data. Income data, however, at least up to 400% of poverty, will be systematically collected
under healthcare reform.19 Now that income is systematically available its potential contribution to risk
adjustment should be assessed.
Overlap
Although income is not an explicit part of today’s risk adjustment models, it is possible that the
variables being used by the models are variables on the pathway between income and healthcare
consumption and that therefore income’s effects on healthcare consumption are, in fact, being captured
by today’s risk adjustment models. A comparison of Model 2 and Model 4, however, reveals that only
some of income’s effect is being captured.
The risk adjustment variables and income overlap the most with respect to current conditions.
To the extent that recent diagnoses and drugs capture all current conditions, the addition of lifestyle via
an income model is unnecessary. But, as discussed above, recent diagnoses and drugs do not capture all
current conditions.
18 The data is not all bad. 95% people with a history of diabetes have a recent diagnosis or drug. And some of the remaining 5% may have had gestational diabetes which does not necessarily require ongoing care. 19 Everyone with a family income under 400% of FPL who purchases individual health insurance will need to report their income to qualify for premium subsidies. Anyone who does not report is presumably over 400% or close enough to 400% that they are not interested in the subsidy.
Appendix 155
An examination of the MEPS data reveals that the 50% under-identification of heart disease and
the 25% under-identification of high blood pressure and high cholesterol are relatively invariant by
income. This, however, creates bias. Poor people have higher prevalence of most conditions.20
Therefore, if the same percentage gets identified via recent diagnosis or drug codes, the poor people as
a percentage of the total poor population will have more unidentified conditions. As a result, risk
adjustment models will underestimate the costs of the poor relative to the wealthy.
An example makes this clear. Suppose 10% of the poor population and 5% of the wealthier
population have a diagnosed condition. Furthermore assume that the people with the condition have
had recent, coded care 60%21 of the time, irrespective of income. Then 4% of the poor will be
unidentified and only 2% of wealthy will be unidentified.
Since identified conditions do not entirely supplant the relationship between income and
current conditions, income should be usable in conjunction with identified conditions to better estimate
the risk posed by current conditions.
A continued examination of Model 2 and Model 4, reveals no further significant overlap
between the risk adjustment variables and the pathways by which income affects healthcare
consumption. Age and sex and income affect incident condition and personal health utility, but are
clearly different concepts. Risk adjustment’s area factor represents the macro healthcare system, while
income primarily relates to the insured’s micro healthcare system.
20
The MEPS data shows a strong age-adjusted income gradient for high blood pressure, heart disease, and diabetes. The poorest adults are 38%, 62%, and 112% more likely to report ever having high blood pressure, heart disease, and diabetes, respectively. There is, however, no income gradient with respect to ever having high cholesterol. Is this perhaps because lower income people are less likely to get their cholesterol checked? 21A higher probability of diagnosis and recent, coded care for the wealthy than for the poor would further exacerbate the differential.
Appendix 156
Statistical and Business Significance
The above models suggest that that healthcare consumption is related to income and that the
income effect is not fully eliminated by today’s risk adjustment models. The forthcoming Analysis
Section of this paper will seek to demonstrate:
1) Statistical Significance: that there is a statistically significant income effect and
2) Business Significance: that the income effect is sufficiently large that insurers might
reasonably experience a 2% advantage (or disadvantage) simply based on the income
distribution of their insureds sans inclusion of income in the post-reform risk adjustment model.
The specific hypotheses and parameters for establishing statistical and business significance are
described in the Analysis Section.
Appendix 157
ANALYSIS
Data Description
This analysis uses the Medical Expenditure Panel Survey (MEPS) dataset prepared by the U.S.
Department of Health and Human Services’ Agency for Healthcare Research and Quality (AHRQ).
MEPS is a continuous study that uses an overlapping, two year panel design. A new panel is
initiated each year and tracked for two years. Each panel has approximately 16,000 people. MEPS
therefore tracks approximately 32,000 people per year. About 28,000 of these people are under age
65.22 The data is free and publicly available.
The MEPS dataset includes extensive demographic, socioeconomic, and health status
information for panel participants. The demographic and socioeconomic fields include family income,
race, ethnicity, and family status. The health status fields include information not typically found in
claim files, such as self-assessed health, BMI, and assorted disability indicators. The MEPS dataset also
includes detailed healthcare consumption and cost information. Every encounter with the healthcare
system is captured, including the type of service, the diagnosis, the amount charged, the amount paid
(expended), and the payer(s).
MEPS contains a variable POVCATyy which assigns each participant to an income category based
on the ratio of their family income to the federal poverty level (FPL). Family income and the relationship
of that income to poverty are calculated via the federal government’s Current Population Survey (CPS)
definitions of family income and poverty (AHRQ, 2009). Poverty is function of income and family size.
CPS is a product of the U.S. Census Bureau. There are differences between the Census Bureau’s
definition of poverty and the Department of Health and Human Services definitions (ASPE.HHS.gov).
22
Summarized at http://www.meps.ahrq.gov/mepsweb/survey_comp/hc_sample_size.jsp.
Under healthcare reform citizens and lawful immigrants are eligible for Medicaid and individual
health insurance subsidies based on the ratio of their family income to FPL (PPACA Sections 1401 and
2001). The MEPS categories are closely aligned with the eligibility categories for healthcare reform:
Figure 5
Income Categories
MEPS Family Income Category (POVCATyy)
Ratio of Family Income to FPL
HC Reform Insurance Market Eligibility
1 POOR/NEGATIVE Less than 1.00 Medicaid
2 NEAR POOR 1.00 to 1.24 Medicaid (up to 1.33)
3 LOW INCOME 1.25 to 1.99 Exchange
4 MIDDLE INCOME 2.00 to 3.99 Exchange
5 HIGH INCOME 4.00 or Greater Market
MEPS also provides insurance status for every person for every month during the year. Finally,
MEPS assigns a weight to every participant. The weights sum to the U.S. population. Since MEPS
oversamples poor and minority populations, such populations have lower weights than participants
from more dominant populations.
The MEPS dataset has some significant limitations. It would be ideal to have 10 times the
number of people and it would be good to have more than 2 years of longitudinal data. But both the
number of people and the period of time are adequate for a prospective risk adjustment system.
The two most substantial data field limitations are the result of the de-identification process
which allows the data to be placed in the public domain. There is no zip code information and
diagnostic codes are presented only at the three-digit level. These limitations will be discussed later.
Appendix 159
Specifically, the analysis uses the 2005, 2006, and 2007 “Household” files23 and the 2004, 2005,
2006, and 2007 “Condition” files.24 The extra year of Condition files is required for prospective risk
adjustment.
Expenditures and Charges
MEPS data provides two healthcare cost fields: expenditures and charges. Charges are the
amounts billed by providers for the healthcare services rendered. Expenditures are the amounts
actually paid. Paid amounts for a given service are almost always less than charged. That’s because
most services are paid for via some negotiated contract between the provider and the payer, sometimes
with a network or prescription benefit manager (PBM) as an intermediary. Furthermore, some charges
are never paid at all, particularly when the patient does not have insurance.
Billed charges are largely fictitious amounts – virtually no payer pays the billed amount. The
average ratio between paid and billed in the 2007 MEPS dataset is 50%. One could argue that
expenditures are more “real”. Expenditures, however, are dependent on the payer. Some private
payers pay a higher percentage of billed amounts than do others. Medicaid and its sister program, the
Children’s Health Insurance Program (CHIP),25 typically pay less than private payers; people without
insurance pay the least. Lower income people are the most likely have no insurance or Medicaid.26
Hence there are clear differences in the expenditure to charge ratio by income:
23
“Household” data. Data files, codebooks, and more are available at http://www.meps.ahrq.gov/mepsweb/data_stats/download_data_files_results.jsp?cboDataYear=All&cboDataTypeY=1%2CHousehold+Full+Year+File&buttonYearandDataType=Search&cboPufNumber=All&SearchTitle=Consolidated+Data. 24
“Medical Condition” data. Data files, codebooks, and more are available at http://www.meps.ahrq.gov/mepsweb/data_stats/download_data_files_results.jsp?cboDataYear=All&cboDataTypeY=103%2CMedical+Conditions&buttonYearandDataType=Search. 25 MEPS does not distinguish between Medicaid and CHIP enrollees. 26 Not everyone covered by Medicaid and CHIP is “Poor” or even “Near Poor”. Disabled people living in non-poor families can qualify for Medicaid. CHIP is explicitly for children in lower and middle income families.
Developed from MEPS 2005-2006-2007 cost data for people under age 65.
Expenditures represent the total paid from all sources, including the patient.
Expenditures are clearly not an appropriate outcome measure for predicting healthcare costs by
income for people who will be covered under individual health insurance. Charges are not necessarily
appropriate either. As stated, they are a largely fictitious value and their level may well vary by income.
MEPS provides high-level counts of the healthcare units consumed per participant, per year. For
example, the number of office based encounters with sub-counts for physician visits, physical therapy
visits, etc; the number of hospital admissions and days; and the number of drugs. The mean cost per
unit can be calculated across the entire MEPS dataset, including for inpatient stays. (Inpatient stays
require the use of linear regression to separately calculate a mean cost per admission and per hospital
day.)
This paper develops and uses two new outcome measures: “proxy expenditures” and “proxy
charges” that assign mean costs to each participant’s units of healthcare consumption.27 Mean costs are
calculated for each service category, separately for adults and children, by year.
27 I have been unable to find references to other researchers developing such proxies or otherwise normalizing expenditures for differences in payer mix.
Appendix 161
Equation 1
Proxy Expenditurei,AC,yr = Σk (# of Units Consumedk,i,AC,yr x Mean Unit Expenditurek,AC,yr)
Proxy Chargei,AC,yr = Σk (# of Units Consumedk,i,AC,yr x Mean Unit Chargek,AC,yr)
Where i = MEPS participant in year yr
AC = adult or child
yr = year
k = healthcare service type
An analysis of the proxy expenditures and charges revealed that children have lower unit costs
(expenditures and charges) than adults, hence the above adult/child differentiation. Intuitively it makes
sense that the average child unit of care is less resource intensive than the average adult unit of care.28
Hence the differentiation between children and adults in the above formula.
More problematic is that higher income people have higher unit charges than lower income
people. Based on this data it is impossible to determine the cause of the income-charge differentials
and to speculate whether the differentials would persist if everyone was covered under the same
insurance plan. It could be that higher income people tend to go to providers who charge more for
essentially the same services. Or it could be that higher income people receive more intensive services.
For example, that they are more likely to have a cardiac surgical procedure if admitted to a hospital for
myocardial infarction.
Proxy Expenditures and Proxy Charges represent cost-weighted aggregate consumption
measures. To the extent that the higher unit costs for wealthier people reflect higher quality or
intensity of services, actual charges are also an aggregate consumption measure. To the extent that
they reflect simply higher prices for the same service, actual charges are not a consumption measure.
28 Children might be expected to have proportionately more primary care visits for routine care and minor illnesses and fewer visits for chronic and comorbid condition management, specialist visits, and expensive diagnostic tests.
Appendix 162
Rather than choose one consumption measure this paper will examine three aggregate
consumption measures: Proxy Expenditures, Charges, and Proxy Charges29. Since the consumption
measures are expressed in dollars, I will refer to them generically as “cost measures” and sometimes
simply “costs”.
All cost measures used in this analysis are trended to 2007 at 3.5% per annum, corresponding to
the approximate annual healthcare inflation level in the 2005-2007 period (AHRQ, 2010). Trending is
done after the creation of the proxies and before truncation (discussed below). The following table
Predicted Costsi= (Σj (Flagi,j x Cost Factorj) ) x Mean Population Cost
Where i = MEPS participant
j = an age/sex flag or a condition flag
(each participant will have one and only one age/sex flag and 0 to several
condition flags)
And where all costs are in 2007 dollars and a participant with two years of
data is treated as two participants for purposes of concurrent predictions.
Recognizing that CDPS is an imperfect fit and following the guidance of the Society of Actuaries
(Winkelman, Mehmud, & Wachenheim, 2007) this paper adjusts for risk via two methods. The methods
both rely upon CDPS condition hierarchies, but differ with respect to cost factors.
Method 1: Risk Adjustment Using CDPS Hierarchies and CDPS Cost Factors
The first method uses CDPS condition hierarchies and CDPS factors. Specifically
it uses CDPS’s factors for adult and children “TANF” Medicaid insureds,31 normalized to
1.00. CDPS provides factors for adult and child TANF Medicaid insureds, for prospective
and concurrent predictions. The mean CDPS factor for the MEPS adult and child
participants is less than 1.00. This is because there is less ability to identify high cost
using MEPS data (see forthcoming About Diagnosis Codes section) than with typical
diagnosis codes and that the MEPS population is healthier than the Medicaid population
used to develop the factors. In order to preserve MEPS mean costs, I normalized the
CDPS cost factors to 1.00 as follows:
31 CDPS distinguishes between Temporary Assistance to Needy Family (TANF) insureds who qualify for Medicaid exclusively by virtue of poverty and Disabled insureds who qualify based on their disability status. Medicaid expansion CHIP children are included in the TANF category. State funded CHIP children are excluded. The calibrations use 2001-2002 data from the CMS’s MAX Medicaid data collection system.
Appendix 165
Equation 3
Normalized CDPS Factori,AC,CP = CDPS Factori,AC,CP / Mean CDPS FactorAC,CP
Where i = MEPS participant
AC = adult or child
CP = concurrent or prospective
Method 2: Risk Adjustment Using CDPS Hierarchies and Regression Factors
This method uses CDPS condition hierarchies and multiple regression factor
estimates developed from the MEPS data set. This method develops factor estimates by
regressing the CDPS age/sex and condition flags against a full sample of the MEPS cost
data. The regression is less than ideal. One of the problems is overfit; the other is the
relatively small sample size of the MEPS dataset.32 In a perfect world, a much larger
dataset would be available and it would be possible to split the dataset into
development and test subsets. Another approach to avoid overfit is to assign factors
that are some blend of the CDPS and regression factors -- as Winkelman (2007) did.
Neither of the two methods is ideal and, in fact, a blended method as performed by
Winkelman might be most appropriate. I will employ each method separately and display the
resulting range of income effect estimates.
About Diagnosis Codes
MEPS provides public access to diagnosis codes at the 3-digit ICD9 level rather than the full 5-
digit level. CDPS hierarchy software which assigns condition flags is structured to run using either 5-digit
32 Children are less than 1/3 of the MEPS population and have relatively few chronic conditions. Therefore it was impossible to develop meaningful children-only regression factors from the MEPS dataset. Child and adult factors were developed on a combined basis with the only difference between and adult and child being the age/sex flags.
Appendix 166
or 3-digit diagnostic codes, but it does not run as precisely with 3-digit codes as it does with 5-digit
codes. Since the most costly severity levels are often associated with specific 5-digit codes nested
within moderate cost 3-digit codes, much of the power to differentiate the most costly condition
severity levels is lost. Because high cost conditions are mixed into moderate cost conditions and
assigned costs consistent with the moderate cost level, CDPS factors for seemingly moderate cost
conditions are probably too low. The underestimation theoretically self-corrects when regression
factors are used in place of CDPS factors. In either case, there are less differentiated predictions than
there would be using CDPS using 5-digit codes and therefore less overall predictive power. That is
presumably the reason that the R2 (“R-squared”33) values (see Tables 1 and 2) are not as high as the
CDPS R2 values reported by Winkelman (2007).
Other Risk Adjustment Considerations
Two other considerations are relevant to risk adjustment. The first is to decide between
concurrent and prospective predictions. The other is whether to truncate costs or not. Similar to earlier
decisions, I decided not to decide for purposes of this paper, and to instead show a range of income
effect results for both prediction models.
Prospective predictions use diagnosis codes from a given year to predict the following year’s
costs. Concurrent predictions use diagnosis codes from a given year to predict the same year’s costs.
Medicare (Pope, et al., 2004) and most Medicaid plans use prospective predictions. A minority of
Medicaid plans, however, use concurrent predictions (Winkelman & Damler, 2008). The Academy of
Actuaries recently published an issue brief which discusses the topic of prospective and concurrent
predictions (AAA, 2010). No decision has been made regarding concurrent or prospective risk
adjustment under healthcare reform.
33
R2 values are measurement of predictive power, also known as “coefficients of determination”.
Appendix 167
The technical difficulty with respect to making prospective predictions using MEPS data is that
the predictions require two years of data. Because of the overlapping panel design, only half of the
people captured each year have prior year data. The relatively modest n is cut by half from 87,949 to
44,729.
Finally, healthcare costs have significant outliers. A single $1,000,000 claim is quite disruptive to
a multiple regression process, even when n is large. Therefore nearly every risk adjustment exercise
truncates claims at some level (Iezzoni, 2003). No academic or practitioner claims to have the
theoretically correct answer as to whether costs should be truncated and at what level. I therefore will
perform risk adjustment and calculate residuals using both untruncated and truncated costs. Since
expenditures are approximately 50% of charges, I have truncated proxy expenditures at $125,000 and
proxy and actual charges at $250,000.34 Truncation was applied as a final step after costs were trended
to 2007 levels.
Individual Health Insurance Market
The MEPS data base can be used to estimate the income distribution of the post-healthcare
reform individual insurance market. Estimating the income distribution of the post-healthcare reform
market is necessary for accessing the potential business significance of any income effect.
The following tables assign each MEPS participant in the 2005-2007 to an insurance status based
on their status for the majority of the calendar year (7 months or more) and then tally the MEPS weights
for each income and insurance category. On a weighted basis, about 1.5% of participants did not have a
single status for 7 months or more; their status is labeled “Mixed”.
34
Consistent with the truncation points in Winkelman’s (2007) evaluation.
Appendix 168
Figure 8
U.S. Population Distribution
(Age 65 and Under, Years 2005-2007, Using MEPS Data and Population Weights)
Family Income People by Insurance Status for 7 or More Months
Category Private State Medicare Mixed No Insurance Total
2 NEAR POOR 2,524,552 3,470,003 612,053 314,664 3,642,982 10,564,254
3 LOW INCOME 13,312,424 7,438,835 1,172,480 842,193 10,934,130 33,700,062
4 MIDDLE INCOME 57,418,919 5,692,838 1,783,974 1,285,252 16,460,785 82,641,768
5 HIGH INCOME 89,646,250 1,213,378 1,337,947 719,306 8,596,555 101,513,435
Total 167,654,478 33,103,325 6,773,817 3,885,936 50,677,036 262,094,592
Figure 9
Post-Reform Individual Market
People Likely to be in Post-Reform Individual Market Family Income Subsets of Private Insurance Category Individual Self-Employed No Insurance Total % Total
1 POOR/NEGATIVE Medicaid Eligible*
2 NEAR POOR
3 LOW INCOME 656,825 114,761 10,934,130 11,705,716 28.1% 4 MIDDLE INCOME 1,673,440 311,297 16,460,785 18,445,522 44.3%
5 HIGH INCOME 2,338,484 532,595 8,596,555 11,467,633 27.6% Total 4,668,749 958,653 35,991,470 41,618,872 100.0%
* Except for illegal immigrants and recent legal immigrants. Recent legal immigrants in these income categories
may purchase insurance on the Exchange and receive subsidies. MEPS does not provide immigration status.
The base distribution for the post-healthcare reform individual insurance potential market is therefore
28% low income, 44% middle income, and 28% high income insureds (in bold above).
Income Effect Evaluation
The above covers everything required to generate risk-adjusted cost predictions and to calculate
prediction residuals. The salient question then becomes: how, if at all, does income relate to the
Appendix 169
prediction residuals? As discussed in Conceptual Foundation, evaluating the income effect will be a two-
step process. The first step will be to determine if there a statistically significant income effect and the
second step will be to determine whether the effect has potential business significance.
Step 1: Statistical Significance Criteria
I will examine three specific hypotheses to consider when examining residuals by
income:
Null hypothesis: After adjustment for health risk (as defined by today’s risk
models), there is no income effect on healthcare consumption
1) Across the full range of income categories (poor, near poor, low,
middle, and high),
2) Between low and middle income people who will be on the
Exchange in order to take advantage of subsidies and the high income
people who may be able to seek insurance elsewhere, and
3) Between the low, middle, and high income people who will be
in the individual health insurance market.
Alternative hypothesis: There is an income effect on healthcare consumption.
Since the lowest two income categories, poor and near poor, will be covered by
Medicaid, the first statistical test is included mostly to satisfy curiosity with respect to
the full continuum of income differentials. The last two statistical significance tests
relate directly to the business significance tests.
Appendix 170
Step 2: Business Significance Criteria
As discussed in Background, there are two business concerns. The first is that individual
health insurers who do not sell insurance on the exchange will have a significant
advantage over those who sell on the exchange. Those who sell exclusively off the
exchange will sell to people in families of 400% of the FPL and perhaps to a few families
with incomes somewhat under 400% and who are willing to forgo a small insurance
premium subsidy that they would be entitled to if they purchased a policy from the
exchange. I will therefore calculate the relative advantage of an insurer insuring a
population that is almost entirely people at 400%+ of poverty versus an insurer selling to
typical income distribution of the potential market.
The next business concern is whether, across the entire individual health insurance
market, an insurer can be advantaged or disadvantaged by income selection. I will
therefore calculate the advantage for an insurer with a higher income distribution
relative to the income distribution for the potential market and the disadvantage for an
insurer with a lower income distribution relative to the income distribution for the
potential market.
Figure 10
Income Distributions for Business Significance Tests
Potential Market*
Non- Exchange
Lower Income
Higher Income Family Income
3 LOW INCOME 28% 43% 13%
4 MIDDLE INCOME 44% 10% 44% 44%
5 HIGH INCOME 28% 90% 13% 43%
Total 100% 100% 100% 100%
* Advantage and disadvantage of the other distributions will be relative to this distribution.
Appendix 171
The lower income and higher income distributions used for testing business
significance should be realistic distributions that can be obtained by insurers by virtue of
geography or making their products and services differentially appealing to various
income levels. As discussed in Background, geography is of particular concern as
healthcare reform encourages the development of Consumer Operated and Oriented
Plans (CO-OPs) which very likely will be centered around a cluster of healthcare
providers.
The following table demonstrates that geography, even within one metropolitan
area may significantly impact income distribution. While the following table appears to
resemble the above Business Significance Tests table, it is different as it is a distribution
of households, not people; is based on income as expressed in dollars, not ratios to the
federal poverty level; and is for all ages, not just for people under age 65. In spite of
these limitations, however, the table confirms the general reasonableness of the
Business Significance Test lower and higher income distributions.
Figure 11
Distribution of Households* by Income Only Households with Incomes $25,000+, All Ages
Select Parts of the Chicago Metropolitan Area
City of Chicago
Lake County, IL
City of Gary Household Income
$25,000 to $49,999 33.1% 19.7% 50.3%
$50,000 to $99,999 39.8% 36.7% 38.7%
$99,999+ 27.1% 43.6% 10.9%
* Households includes single person households.
Source: 2006-2008 American Community Survey 3-Year Incomes adjusted to 2008 $'s.
Appendix 172
I will assign potential business significance to income effects if the effects when
combined with the Non-Exchange, Lower Income, and Higher Income distributions
produce advantages or disadvantages of 2% or more as compared to the Potential
Market distribution.
Appendix 173
RESULTS
The results are shown in Table 1 and Table 2. Table 1 shows the income effect after concurrent
risk adjustment. Compared to prospective risk adjustment, concurrent risk adjustment is expected to
explain more variance compared to prospective adjustment; hence the R2 values are relatively high -- up
to nearly 30%. The residual unexplained variance, however, is clearly related to income. Every income
effect estimate on the page shows that poor people cost more than expected on a risk adjusted basis (as
indicated by positive signs on the effect estimates35) and wealthy people cost less (as indicated by
negative signs on the effect estimates). The income effect estimated differentials between the poorest
and wealthiest people are in the 20-40% range with an average of 28%.
Although the greatest effect differentials appear to be associated with the lowest incomes –
people who will be covered by Medicaid and therefore not directly of concern for this paper, an income
effect appears across the entire income spectrum. All of the income effect tests for Table 1, as defined
by the above three hypotheses, are statistically significant. The estimated effect differential between
the low income people and the high income people who will buy insurance in the individual market
averages 13% and ranges up to 20%. The estimated effect differential between the low and middle
income people who must buy insurance on the exchange to get government subsidies and the high
income people who may buy insurance off the exchange averages 8% and ranges up to 11%.
The prospective risk adjustment analysis shown in Table 2 has the disadvantage of being based
on half as many participants. Differences in effect estimates are therefore less likely to reach statistical
significance. That’s what Table 2 shows. Also, as expected, prospective risk adjustment explains less
variance. The maximum R2 value is 21%. All of the income effect tests associated with Hypothesis 1 and
most of the tests associated with Hypothesis 2, however, are significant. The estimated income effect
35 Effect estimate = mean residual for the income level / mean cost. Mean cost = value shown in the top row of Tables 1 and 2. Residual = Actual cost – risk adjusted predicted cost.
Appendix 174
differentials between the poorest and wealthiest people are in the 30-50% range with an average of
40% – about 10% more than the concurrent spreads. This was expected, based on the conceptual
model, as concurrent risk adjustment should account for some of the differential incident condition
costs attributable to income.
With prospective risk adjustment there is an unexpected flattening of the income effects
between middle and high income people – both categories have costs on average 12% less than
expected. (In contrast on concurrent basis middle income people cost 6% less than expected and high
income people cost 11% less than expected.) The conceptual model provides no explanation for this
anomaly.36 As a result of the anomaly, most of the income effect tests associated with Hypothesis 2 are
not significant.
The following table summarizes Table 1 and Table 2:
36 I can hypothesize that while high income people are healthier than middle income people with respect to prevalent and incident conditions, that they are more aggressive consumers of care. Exploring this hypothesis is beyond the scope of the paper.
Appendix 175
Figure 12
Income Effect Summary
Concurrent Risk Prediction
Prospective Risk Prediction
Family Income Category n
Average Income
Effect n
Average Income
Effect
1 POOR/NEGATIVE 18,441 18% 9,326 28% 2 NEAR POOR 5,638 6% 2,939 11% 3 LOW INCOME 14,825 3% 7,472 1% 4 MIDDLE INCOME 24,874 -6% 12,503 -12% 5 HIGH INCOME 24,171 -11% 12,489 -12% Total 87,949 44,729 Mean 0% 0%
Income Effect Differential
Poor vs. High 28% 40%
Low vs. High 13% 14%
Low&Middle Combined vs. High 8% 6%
Although there is some question of whether high income people are different than middle
income people when risk is adjusted on a prospective basis, overall there appears to be statistically
significant income effects. The next question is whether these effects have potential business
significance. The first step is calculating the business effect. This is done by combining the distributions
from Figure 5 with the respective average income effects (in bold) from Figure 7.
The resulting business effect estimates are:
Appendix 176
Figure 13
Business Effect Summary
Risk Adjusted Costs Relative to Mean MEPS Participant*
Potential Market*
Non-Exchange
Lower Income
Higher Income Family Income Category
Prospective
Costs -8.3% -12.3% -6.3% -10.3%
Business Effect 4.1% -2.0% 2.1%
Concurrent
Costs -4.7% -10.1% -2.8% -6.7%
Business Effect 5.3% -1.9% 2.0%
* Potential Market risk adjusted costs are lower than the costs for the mean MEPS
participant. This is because the potential market excludes people eligible
Medicaid and assumes a different distribution for the remaining categories of
family income.
The business effects are near or above 2%. The fact that the lower and higher income effects
are close to 2% is not particularly bothersome given that the combined range is 4%. A insurer with a
lower income distribution has a 4% disadvantage compared to an insurer with a higher income
distribution.
I therefore conclude, based on the MEPS dataset and the above analysis, that
1) Individual health insurers who do not sell insurance on the exchange will have a
potentially significant business advantage over those who sell on the exchange.
2) Across the entire individual health insurance market insurers may be significantly
advantaged or disadvantaged by income selection.
Appendix 177
LIMITATIONS
The analysis tested the marginal statistical “effect” of income, and only income, on healthcare
consumption. A statistical effect is a relationship and should not be confused with “cause and effect”.
Assuming that there is an effect, factors other than income may be causing the effect. But, to
the extent that those factors are correlated with income, an income effect will emerge. A multivariate
analysis with income and other socioeconomic indicators/measures (such as race/ethnicity, education,
wealth, employment, and occupation) and health measures (such as mental health and resiliency, self-
assessed health, and functional limitations) may well find that income no longer dominates as a
predictive variable.37
It is important to understand that this paper focuses solely on income because, among the
above potential variables, only income will be consistently collected and verified as part of health
insurance enrollment and hence readily available for health risk adjustment.38
The analysis is meant to provide a test of concept rather than the definitive analysis of income
effect. Although MEPS provides a combination of data that simply is not readily available elsewhere,39 it
is a less than ideal data source. In the world of risk adjustment, both in theory and in practice, 88,000
participant-years is small and 44,000 years is particularly small. Healthcare costs defy all the assumed
normality and constant variance rules of statistical analysis (Lumley, Diehr, Emerson, & Chen, 2002). It
37
There is extensive literature (Cutler, Lleras-Muney, & Vogl, 2008) available concerning the relationship between the various dimensions of socioeconomic status and health of which income is just one dimension. All the dimensions are, however, correlated. With respect to the effect of income vs. education, some have concluded that education is dominant (Cutler & Lleras-Muney, 2006). 38
Race/ethnicity might at some point be available for risk adjustment. Under healthcare reform race and ethnicity data will be used in the evaluation of hospital quality (PPACA, Section 3001) and public health programs (PPACA, Section 3101). Furthermore all federal health surveys must collect race and ethnicity data (PPACA, Section 3101). But the legislation makes no mention of race and ethnicity in conjunction with insurance data. 39 There are more robust healthcare claims databases, but I don’t know of another database that combines healthcare claims with income for an under age 65, non-Medicaid population. See following Further Research section.
Appendix 178
takes a large amount of data to generate stable estimates, particularly with respect to high cost,
uncommon conditions.
There are other limitations. As discussed above, 3-digit diagnosis codes are less than ideal. 5-
digit codes are the standard for diagnostic reporting and risk adjustment. Furthermore, even though
most risk adjustment incorporates some sort of area adjustment, MEPS does not identify the data by
state, county, or zip code.
The nature of MEPS is problematic. MEPS is an aggregation of data from various payers and, for
the non-insured, non-payers. Although I attempt to adjust for the challenge by using proxy charges and
proxy expenditures, payer status may be effecting consumption and confounding the income effect
analysis. To assess this concern, I calculated Table 1 and Table 2 results for each of the three major
payer statuses: private insurance, state insurance, and no insurance. The results are summarized in
Table 4 and Table 5. In spite of the inherent stability of small samples, there appears to be an income
effect within each major payer category.
Finally, CDPS is not the only risk adjustment methodology commonly in use today. Other
methodologies will produce at least somewhat different results. Income effects should ideally be tested
in conjunction with the risk adjustment model most likely to be adopted. But no one has identified such
a model.
The above are technical limitations with respect to the dataset and methodology. Even if those
limitations were removed, there is, however, a much bigger yet more subtle limitation: MEPS is a
historical database and the future under healthcare reform is going to be different than the past.
This analysis implicitly assumes that when people move from whatever insurance does or does
not cover them today to an individual health insurance policy under healthcare reform that their
healthcare consumption patterns will remain unchanged. This is unlikely to be true.
Appendix 179
Likewise, due to healthcare reform, the entire healthcare system is going to be in a state of flux
for a number of years. Reform will alter the financial relationships between patients, providers, and
payers and hence healthcare decisions and consumption patterns. Additionally, separate from reform,
technology and research will continue to drive changes in healthcare consumption patterns. Finally,
while healthcare reform is underway, another significant change is set to take place: the switchover
from ICD9 diagnostic codes to ICD10 diagnostic codes. Despite the similar names, there is no
unambiguous mapping between the coding schemes (Kasey, Naugle, & Zenner, 2010). This will affect
the stability and reliability of diagnostic code-reliant risk adjustors.
Appendix 180
FURTHER RESEARCH
The challenge in incorporating income into risk adjustment in advance of healthcare reform is in
estimating the initial factors. MEPS has limitations and other sources of combined income and health
claims data are not widely available. There are two additional potential datasets, neither perfect, that
could help.
The first is an expanded version of MEPS. The same MEPS data is available with 5-digit diagnosis
codes. Accessing the 5-digit codes, however, requires special research clearance, procedures, and
cost.40 An analysis using 5-digit codes would be better with respect to condition specificity and R2
values, but would still suffer the other limitations.
Another data source would be large employers and/or unions, particularly those who employ
people at a range of various income levels. Unlike insurance companies, who have access to only health
claims data, employers and unions can access both income and claims data. Income and healthcare
records have not necessarily been merged in the past, but they could be. It is not clear, however, why
employers and/or unions would want to prepare and share this information, even on a de-identified
basis.
The employer data itself, even if it had millions of records, would have limitations. The income
would be employee income, not family income; healthcare consumption of people covered under group
policies may not be representative of the consumption of people who will be covered under individual
policies; and employers and unions usually often have large regional/social concentrations of employees
who may not be representative of broader populations.
40 As described on the “Restricted Data files Available at the Data Centers” page of the MEPS website http://www.meps.ahrq.gov/mepsweb/data_stats/onsite_datacenter.jsp.
Lall, & Kaura, 2009), Ingenix Consulting (the consulting arm of the insurance giant United Health Group)
(Denoncour, 2010), Oliver Wyman (Oliver Wyman, 2010?), and Forte Partners (Forte Partners, 2010).
41 The growth of HMOs and the introduction of DRG payments by Medicare, both in the mid 1980’s, were the first major health insurance initiatives with respect to healthcare quality and cost efficiency.
Appendix 182
Health Affairs has published an article that discusses the importance of “strategic market segmentation”
for insurance company success under healthcare reform (Brennan & Studdart, 2010).
More than 10 years ago Joseph Newhouse (1998), a Harvard professor and one of the
preeminent authorities on health insurance systems, wrote about the consequences of inadequate risk
adjustment:
1. Plans have an incentive configure their product(s) and market their services so as
not to appeal to bad risks. Because all plans have such an incentive, bad risks could
find themselves treated as pariahs.
2. Plans have an incentive to appeal to good risks. In effect, competition for good
risks means some of the potential profit on good risks is likely to be spent attracting
them, but resources so spent may be socially wasteful.
Newhouse’s second, consequence, concerning socially wasteful resources, links directly to the
efforts of the above consulting firms. Hiring these consulting firms to give advice on market
segmentation and target marketing is expensive.
Active efforts to select business are clearly contrary to the healthcare reform goals of
accessibility for all and competition based on healthcare quality and cost efficiency, rather than
selection of insureds. Selection, whether passive or active, is also detrimental to market stability. An
insurer may be doing a fine job managing healthcare quality and cost efficiency, but fail to make a profit
and therefore be forced to exit a market by virtue of a detrimental income mix as compared to his
competitors. Every time an insurer exists there is a scramble of the insurer’s insureds to find new plans
and, often as a consequence, new providers.
Appendix 183
Much of Jost’s timely and quality working paper “Health Insurance Exchanges and the
Affordable Care Act: Key Policy Issues” (2010) concerns controlling “adverse selection”42 when
designing and managing the post-reform health insurance market and exchanges. He considers this to
be one of the paramount reform challenges. Jost’s paper has been widely circulated among state
insurance regulators.43
Jost recommends that in order to minimize adverse selection, states should consider pre-
empting federal legislation (which they are allowed to do if they are making the rules more stringent) to
mandate that individual insurance can be bought only on exchanges. At least some state regulators are
apparently considering the suggestion. This would eliminate the bifurcation of the individual insurance
market by income. But it will not eliminate the possibility that insurers operating on the exchange might
able to create and market health insurance plans that differentially attract and retain people based on
their income level, either intentionally or incidental to other goals.
Regardless as to whether individual insurance is sold off the exchanges, a risk adjustment
methodology that includes income will provide better protection against income-based selection than a
methodology that does not include income. Income should be included health reform’s risk adjustment
model.
Income has not been used in risk adjustment models in the past because income data, linked to
health costs, has not in been available in most circumstances.44 But under healthcare reform, income
42
“Adverse selection” is Jost’s term and an unfortunately common insurance industry term as it assumes a direction (adverse) and is ambiguous with respect to perspective. As described in this paper, selection can be either advantageous or disadvantageous (adverse). One insurer’s advantageous selection, will be its competitors’ and society’s disadvantageous selection. 43 Per my contact with the Illinois Department of Insurance. 44 As noted earlier, Medicare adjusts for Medicaid eligibility. Impoverished people who are eligible for Medicaid cost more (CMS, 2010). This is a de facto income adjustment.
Appendix 184
data, at least up to 400% of poverty, will be not only available, but verified by the IRS.45 Over 400% can
be treated as a single category in a risk adjustment model.
In many ways, income is an ideal risk adjustment factor. Dunn and coauthors (1996) in the first
Society of Actuaries review of risk adjustment proposed that the ideal risk adjustment model/variable
should 1) have predictive power, 2) be administratively feasible, 3) not be open to gaming behavior by
insurers, such as up-coding, and 4) not give insurers or providers incentives to engage in socially
uneconomic behavior, such as unnecessary hospitalizations. Income meets all of these tests.
45 People under 400% of the poverty line qualify for Medicaid, premium subsidies, and/or out of pocket limits. To get these benefits they must purchase insurance through an exchange (or from Medicaid) and document their income. The income will be electronically verified with the IRS.
Appendix 185
RECOMMENDATIONS
Based on the above background, conceptual foundation, analysis and discussion, I specifically make the
following policy suggestions:
1. Require all individual health insurance to be purchased on the exchanges
a. Why: eliminate the bifurcation of the individual health insurance by income
b. Who: state-level departments of insurance
c. When: as soon as possible and well in advance of the Jan 2014 opening of the
exchanges
2. Perform further research to extend the above analysis (as suggested under Further Research)
a. Why: to better estimate income effect
b. Who: researchers
c. When: as soon as possible and in advance of the announcement of the post-healthcare
reform risk adjustment methodology
3. Include income in the post-healthcare reform risk adjustment methodology
a. Why: to assure that potential insureds are equally welcomed by insurers, regardless of
their income, and to promote market stability
b. Who: the U.S. Department of Health and Human Services (DHHS) in consultation with
the States46
c. When: presumably by January 2014
4. Establish a post-healthcare reform monitoring system
a. Why: to assure that income-based risk selection is effectively minimizing income-based
selection efforts and to watch for evidence of other forms of SES selection
46
As required by Section 1343 of the PPACA.
Appendix 186
b. Who: DHHS, state-level Departments of Insurance, and researchers
c. When: from January 2014
5. Consider further Post-healthcare reform risk adjustment methodology changes
a. Why: to incorporate new information (gathered via monitoring) into the risk
adjustment methodology
b. Who: the U.S. Department of Health and Human Services (DHHS) in consultation with
the States
c. When: as needed post January 2014
Appendix 187
TABLES
Appendix 188
Appendix 189
Appendix 190
Appendix 191
Appendix 192
Appendix 193
REFERENCES
AAA. (2010). Issue Brief: Risk Assessment and Risk Adjustment. Washington, DC: American Academy of
Actuaries.
Adler, N. E., & Newman, K. (2002). Socioeconomic Disparities In Health: Pathways And Policies. Health
Affairs, 21(2), 60-76.
Adler, N. E., & Rehkopf, D. H. (2008). U.S. Disparities in Health: Descriptions, Causes, and Mechanisms.
Annual Review of Public Health(29), pp. 235-252.
Adler, N., & Ostrove, J. M. (1999). Socioeconomic Status and Health: What We Know and What We Don't
Know. Annals of the New York Academy of Science, 896, 3-15.
AHRQ. (2009). Documentation for MEPS HC-11: 2007 Full Year Consolidated Data File. Rockville, MD:
Agency for Healthcare Research and Quality.
AHRQ. (2010). Using Appropriate Price Indices for analyses of health Care Expenditures or Income across
Multiple Years. Retrieved Aug 12, 2010, from Medical Expenditure Panel Survey:
Highest honors, 4.0 GPA, “Outstanding Freshman Chemist” award
Statistics tutor
Professional Credentials
Society of Actuaries, Fellow (FSA) ………..……………………………………….………….. 1993
Current Section Memberships: Health, Social Insurance and Pubic Finance American Academy of Actuaries, Member (MAAA)…….…...….………………...………… 1990 Qualified to Issue Statements of Actuarial Opinion concerning Health Insurance
under the American Academy of Actuaries Qualification Standards……..………..Current
Professional Employment State of Illinois, Department of Healthcare and Family Services……...…………2011-Current
Director of Data, Analytics, and Research
Director of Research TS Strategic Consulting, LLC……………………………………………...………….…. 2007-2010
Owner Precedent Insurance Company (“A New Spin on Health Insurance”)……….………. 2006-2007
Chief Strategy Officer and Vice President Milliman…...………………………………………..…………….…….……….…………... 2005-2006
Healthcare Management Consultant Sawhney Enterprises, Inc. ……….………………………………….……….…………... 1999-2005
Owner/Business Manager Blue Cross Blue Shield of Illinois ………………………………….……….………….. 1993-1997
Director and Department Manager, Actuarial Department, Fort Dearborn Life Insurance Company (Owned by BCBS IL)
Group Actuary, Fort Dearborn Life Insurance Company
Commercial Life Insurance Company………….……...………….………….…...……. 1990-1993
Group Actuary Milliman & Robertson (now Milliman), Health Practice…………..….………….……… 1986-1989
Assistant Actuary
Student Actuary
Professional Internship
Cook County Health and Hospital System
Strategic Planning Team Member……………....................……….………..………….…. 2009
Academic Papers and Proposals (unpublished)
“Controlling Indirect Selection Under Healthcare Reform”, Tia Goss Sawhney, June 2011. “Health Insurance Risk Adjustment: The Income Effect”, Tia Goss Sawhney, September 2010. “Health Insurance Risk Adjustment: Looking Beyond R-Squared”, Tia Goss Sawhney, August
2010. “llinois’s Public Health System Response to Injury Mortality: An Initial Analysis and a Proposal
for an Evaluation Case Study”, Tia Goss Sawhney, December 2009. “IPLAN or weDREAM? Translating public health strategic planning into strategic action”, Tia
Goss Sawhney, May 2009. “Compression of Disability: A National Imperative”, Tia Goss Sawhney, May 2009. “The Impact of Low Cost Generics on Prescription Drug Adherence: A Natural Experiment”, Tia
Goss Sawhney, December 2008. Published Trade Articles
“Lives Well-Lived: Socioeconomic Status and Mortality”, Tia Goss Sawhney, Contingencies (American Academy of Actuaries), March/April 2010.
“Improving Prescription Drug Risk Assessment Tools”, Tia Goss Sawhney, Contingencies
(American Academy of Actuaries), March/April 2009. “The Case Against Paper Based Risk Assessment”, Tia Goss Sawhney, Software Supplement,
Contingencies (American Academy of Actuaries), November 2008. “The Post-Millennial Metamorphosis in Life Underwriting”, Hank George and Tia Goss Sawhney,
Contingencies (American Academy of Actuaries), November/December 2008. Republished with permission by Insurance Chronicle (The ICFAI University Press).
“A Holistic Approach to Health Underwriting”, Tia Goss Sawhney, Contingencies (American
Academy of Actuaries), March/April 2008. Republished with permission by Insurance
Chronicle (The ICFAI University Press). “Auto Insurance Principles Should Apply to Health Insurance”, Tia Goss Sawhney,
Contingencies (American Academy of Actuaries), January/February 2007.
TIA GOSS SAWHNEY Vita 202
“Health Insurance and Managed Care: Uses of Information Technology”, Tia Goss Sawhney,
Alam Singh, and Richard Moyer, Journal of Insurance Regulatory and Development Authority (India), June 2006.
“Health Insurance Lessons from the Auto Industry”, Tia Goss Sawhney, Health Insurance
Underwriter, March 2006. “Local Experience for International Healthcare”, Tia Sawhney, Milliman Global Annual Report,
2005. “Predictive Analytics and the New World of Retail Healthcare”, Simmi P. Singh and Tia Goss
Sawhney, Health Management Technology, January 2006.
Published Essays Letter to the editor regarding “Predictive Modeling with Consumer Data” article, Tia Goss
Sawhney, The Actuary (Society of Actuaries), December/January 2011/2012. “Insight: Underwrite Health, But Do It Only Once”, Tia Goss Sawhney, Best’s Review, Life and
Health Edition, June 2009. “Where are the Actuaries?”, Tia Goss Sawhney, CompAct (Technology Section of the Society
of Actuaries), November 2008. Won “Article of the Year”. “Back to the Numbers”, Tia Goss Sawhney, Actuary of the Future (Actuary of the Future Section
of the Society of Actuaries), October 2008. Lead article.
Published Interviews
“Risk Selection: Considering New Mortality Markers”, Transamerica Reinsurance, Forecaster Newsletter, June 2009.
Presentations
“Population Health and Public Health: Why Should We Care”, Society of Actuaries Health
Section Meeting, (scheduled) June 2012.
“Jyoti School: A Jewel of Kanpur, Many Thanks to Rotary”, Skokie Valley Rotary Club, October
2010. “Provider Payment Reform and Risk Adjustment”, co-presenter, Society of Actuaries Annual
Meeting, October 2010. “Jyoti School: A Jewel of 21st Century Kanpur”, Fundraising Event, Kanpur, India, March 2010. “Introduction to Relational Databases”, Master of Healthcare Administration Seminar Series
(University of Illinois at Chicago), February 2010. “Are we asking the right questions?”, 5th Annual Teleunderwriting Conference (Society of
Actuaries), February 2009.
Conference Panels
“Challenges of Provider Payment Risk Adjustment”, Panelist, 2010 Annual Meeting (Society of
Actuaries), October 2010. “The Application and Information Collection”, Panelist, Life Insurance Conference (Life Office
Management Association – LOMA), April 2010.
TIA GOSS SAWHNEY Vita 203
“Business Rules Engines: The Future of Life Underwriting or the Death of Human Existence as We Know It”, Moderator, 5th Annual Teleunderwriting Conference (Society of Actuaries),
February 2009. “Predictive Modeling in Underwriting: Panacea or Sham?”, Moderator, Individual and Small
Group Health Insurance Underwriting Seminar (Society of Actuaries), September 2009.
Webinars / Podcasts
“Tia Goss Sawhney on Post Issue Underwriting", BestDay Audio, Best’s Review, June 26, 2009. “Reaching the ‘Young Invincibles’: Successfully Marketing to the Uninsured”, Panelist,
Corporate Research Group, October, 2007. “Changing the Rules in Insurance”, Panelist, Corticon Online Seminar Series, July 2007. “Impact of Consumer Directed Health Plans on Hospitals: ‘A New Health Plan or A New Era of
Health Insurance?’”, Panelist, Healthcare Web Summit: Consumer Driven Care 2006,
MCOL, March 2006.
Select Press Quotes
“Prescription Data Used To Assess Consumers – Records Aid Insurers but Prompt Privacy Concerns”, The Washington Post, Print Edition, August 4, 2008.
“They Know What’s in Your Medicine Cabinet”, Special Report (Cover), Business Week, July
23, 2008. “New Insurance Plan Has Novel Pitch -- Get Sick, Buy More Coverage”, Wall Street Journal,
Print Edition, September 14, 2007. “Plan Activates Increased Coverage on Demand”, Managed Healthcare Executive, October 1,
2007. “Unique New Health Plan Allows Members to Buy Additional Coverage After an Illness or Injury
Occurs”, AIS's Health Business Daily, Featured Story, September 27, 2007. “Precedent Launches Revolutionary Individual Health Insurance Plans in Texas”, PRNewswire,
September 14, 2007.
Leadership Roles Centers of Actuarial Excellence Evaluation Committee, Member, Society of Actuaries,
2011+.
Illinois Department of Insurance, Advisor for Risk Adjustment and Selection Control under Health Care Reform, 2011+.
Risk Sharing Work Group, Member, American Academy of Actuaries, 2011+.
Contributing writer.
Social Insurance and Public Finance Section Council, Member, Society of Actuaries, 2010+.
Organized webcast: The Public Actuary: Serving the Public in Challenging Times, May
2011
Risk Adjustment Work Group, Member, American Academy of Actuaries, 2010.
Health Section Council Research Committee, Member, Society of Actuaries, 2010+.