1 Subject to change without notice Oscilloscope HM 407 Table of contents E General information regarding the CE marking .......... 2 General Information ........................................................ 4 Symbols ......................................................................... 4 Use of tilt handle ............................................................ 4 Safety ............................................................................. 4 Intended purpose and operating conditions ................. 4 EMC ............................................................................... 5 Warranty ......................................................................... 5 Maintenance .................................................................. 5 Protective Switch-Off .................................................... 5 Power supply ................................................................. 5 Type of signal voltage ..................................................... 6 Amplitude Measurements ............................................. 6 Total value of input voltage ........................................... 7 Time Measurements ..................................................... 7 Connection of Test Signal ............................................. 8 Controls and readout ....................................................... 9 Menu ................................................................................ 22 First Time Operation ..................................................... 23 Trace Rotation TR ........................................................ 23 Probe compensation and use ...................................... 23 Adjustment at 1kHz ..................................................... 23 Adjustment at 1MHz ................................................... 24 Operating modes of the vertical amplifiers in Yt mode ................................................... 24 X-Y Operation ............................................................... 25 Phase comparison with Lissajous figures .................. 25 Phase difference measurement in DUAL mode (Yt) ....................................................... 25 Phase difference measurement in DUAL mode ........ 25 Measurement of an amplitude modulation ................ 26 Triggering and time base ............................................. 26 Automatic Peak (value) -Triggering ............................. 26 Normal Triggering ........................................................ 27 (Slope) .................................................................... 27 Trigger coupling ........................................................... 27 Triggering of video signals ........................................... 28 Line triggering (~) ........................................................ 28 Alternate triggering ...................................................... 28 External triggering ........................................................ 28 Trigger indicator “TR” ................................................. 29 HOLD OFF-time adjustment ....................................... 29 (Only in analog mode) .................................................. 29 Delay / After Delay Triggering ..................................... 29 (Only in analog mode) .................................................. 29 Auto Set ........................................................................... 31 Save/Recall ..................................................................... 31 Component Tester (analog mode) ............................... 31 General ......................................................................... 31 Using the Component Tester ...................................... 32 Test Procedure ............................................................ 32 Test Pattern Displays ................................................... 32 Testing Resistors ......................................................... 32 Testing Capacitors and Inductors ................................ 32 Testing Semiconductors .............................................. 32 Testing Diodes ............................................................. 32 Testing Transistors ...................................................... 32 In-Circuit Tests ............................................................. 33 Storage Mode ................................................................. 33 Signal recording modes ............................................... 34 Vertical resolution ........................................................ 34 Horizontal resolution .................................................... 34 Maximum signal frequency in storage mode ............. 34 Alias signal display ....................................................... 35 Operating modes of the vertical amplifiers ................ 35 Test Instructions ............................................................ 35 General ......................................................................... 35 Cathode-Ray Tube: Brightness and Focus, Linearity, Raster Distortion .......................................... 35 Astigmatism Check ...................................................... 35 Symmetry and Drift of the Vertical Amplifier ............. 35 Calibration of the Vertical Amplifier ............................. 36 Transmission Performance .......................................... 36 of the Vertical Amplifier ............................................... 36 Operating Modes:CH.I/II, DUAL, ADD, CHOP., INVERT and X-Y Operation .......................................... 36 Triggering Checks ........................................................ 36 Time base ..................................................................... 37 Hold Off time (analog mode only) ............................... 37 Component Tester ....................................................... 37 Trace Alignment ........................................................... 37 Service Instructions ....................................................... 37 General ......................................................................... 37 Instrument Case Removal ........................................... 37 Caution ......................................................................... 38 Operating Voltages ...................................................... 38 Maximum and Minimum Brightness .......................... 38 Astigmatism control .................................................... 38 Trigger Threshold ......................................................... 38 Trouble-Shooting the Instrument ................................ 38 Adjustments ................................................................. 39 RS232 Interface - Remote Control ............................... 39 Safety ........................................................................... 39 Operation ..................................................................... 39 RS-232 Cable ............................................................... 39 RS-232 protocol ........................................................... 39 Baud-Rate Setting ........................................................ 39 Data Communication ................................................... 39 Front Panel HM407 ......................................................... 40 St.080598-Hüb/goRR
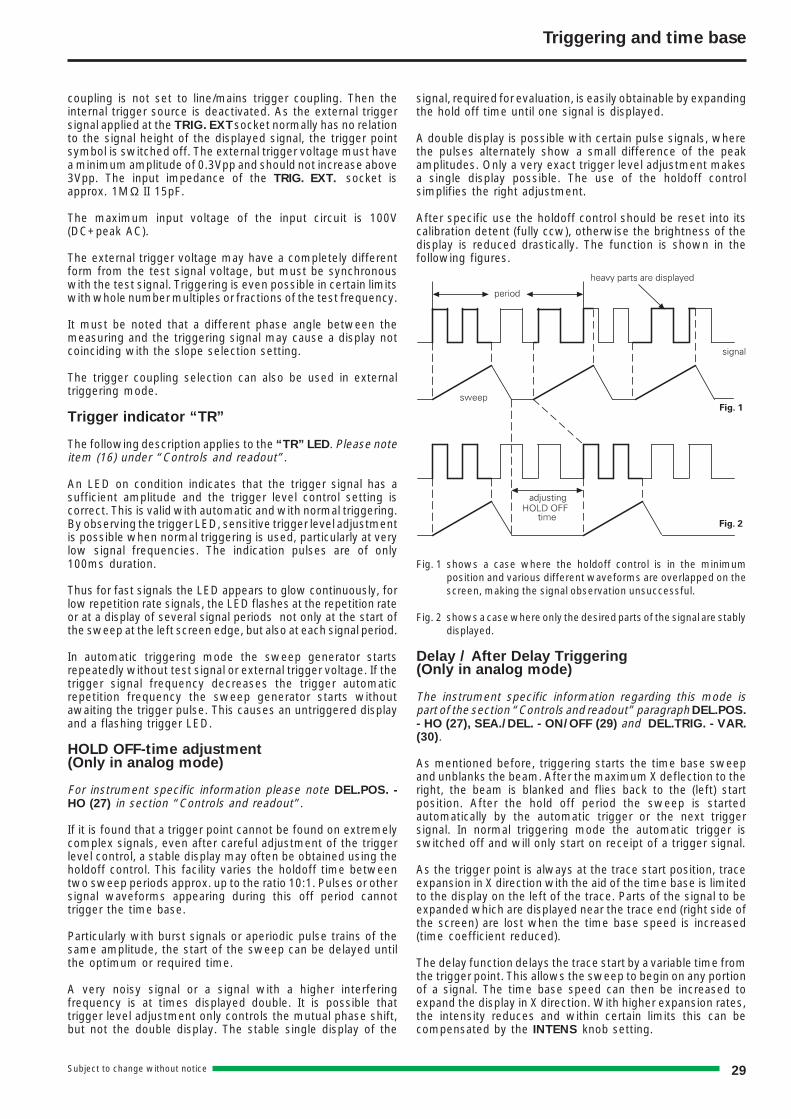
Transcript
1Subject to change without notice
OscilloscopeHM 407
Table of contents
E
General information regarding the CE marking .......... 2
General Information ........................................................ 4Symbols ......................................................................... 4Use of tilt handle............................................................ 4Safety ............................................................................. 4Intended purpose and operating conditions ................. 4EMC ............................................................................... 5Warranty ......................................................................... 5Maintenance .................................................................. 5Protective Switch-Off .................................................... 5Power supply ................................................................. 5
Type of signal voltage ..................................................... 6Amplitude Measurements ............................................. 6Total value of input voltage ........................................... 7Time Measurements ..................................................... 7Connection of Test Signal ............................................. 8
Controls and readout ....................................................... 9
Menu ................................................................................ 22
First Time Operation ..................................................... 23Trace Rotation TR ........................................................ 23Probe compensation and use ...................................... 23Adjustment at 1kHz ..................................................... 23Adjustment at 1MHz ................................................... 24Operating modes of the verticalamplifiers in Yt mode................................................... 24X-Y Operation ............................................................... 25Phase comparison with Lissajous figures .................. 25Phase difference measurementin DUAL mode (Yt) ....................................................... 25Phase difference measurement in DUAL mode ........ 25Measurement of an amplitude modulation ................ 26Triggering and time base ............................................. 26Automatic Peak (value) -Triggering ............................. 26Normal Triggering ........................................................ 27
(Slope) .................................................................... 27Trigger coupling ........................................................... 27Triggering of video signals ........................................... 28Line triggering (~) ........................................................ 28Alternate triggering ...................................................... 28External triggering........................................................ 28Trigger indicator “TR” ................................................. 29HOLD OFF-time adjustment ....................................... 29(Only in analog mode) .................................................. 29Delay / After Delay Triggering ..................................... 29(Only in analog mode) .................................................. 29
Auto Set ........................................................................... 31
Horizontal resolution .................................................... 34Maximum signal frequency in storage mode ............. 34Alias signal display ....................................................... 35Operating modes of the vertical amplifiers ................ 35
Test Instructions ............................................................ 35General ......................................................................... 35Cathode-Ray Tube: Brightness and Focus,Linearity, Raster Distortion .......................................... 35Astigmatism Check ...................................................... 35Symmetry and Drift of the Vertical Amplifier ............. 35Calibration of the Vertical Amplifier ............................. 36Transmission Performance.......................................... 36of the Vertical Amplifier ............................................... 36Operating Modes:CH.I/II, DUAL, ADD, CHOP.,INVERT and X-Y Operation .......................................... 36Triggering Checks ........................................................ 36Time base..................................................................... 37Hold Off time (analog mode only) ............................... 37Component Tester ....................................................... 37Trace Alignment ........................................................... 37
Service Instructions ....................................................... 37General ......................................................................... 37Instrument Case Removal ........................................... 37Caution ......................................................................... 38Operating Voltages ...................................................... 38Maximum and Minimum Brightness .......................... 38Astigmatism control .................................................... 38Trigger Threshold ......................................................... 38Trouble-Shooting the Instrument ................................ 38Adjustments ................................................................. 39
EN 50081-1: 1992 / EN 55011: 1991 / CISPR11: 1991 / VDE0875 T11: 1992
Gruppe / group / groupe = 1, Klasse / Class / Classe = B
Datum /Date /Date Unterschrift / Signature /Signatur
02.03.1998
Dr. J. Herzog
Technical Manager/Directeur Technique
®
General information regarding the CE marking
HAMEG instruments fulfill the regulations of the EMC directive. The conformity test made by HAMEG is basedon the actual generic- and product standards. In cases where different limit values are applicable, HAMEGapplies the severer standard. For emission the limits for residential, commercial and light industry are applied.Regarding the immunity (susceptibility) the limits for industrial environment have been used.
The measuring- and data lines of the instrument have much influence on emmission and immunity and thereforeon meeting the acceptance limits. For different applications the lines and/or cables used may be different. Formeasurement operation the following hints and conditions regarding emission and immunity should be observed:
1. Data cables
For the connection between instruments resp. their interfaces and external devices, (computer, printer etc.)sufficiently screened cables must be used. Without a special instruction in the manual for a reduced cablelength, the maximum cable length of a dataline must be less than 3 meters long. If an interface has severalconnectors only one connector must have a connection to a cable.
Basically interconnections must have a double screening. For IEEE-bus purposes the double screened cablesHZ72S and HZ72L from HAMEG are suitable.
2. Signal cables
Basically test leads for signal interconnection between test point and instrument should be as short as possible.Without instruction in the manual for a shorter length, signal lines must be less than 3 meters long.
Signal lines must screened (coaxial cable - RG58/U). A proper ground connection is required. In combination withsignal generators double screened cables (RG223/U, RG214/U) must be used.
3. Influence on measuring instruments.
Under the presence of strong high frequency electric or magnetic fields, even with careful setup of the measuringequipment an influence of such signals is unavoidable.This will not cause damage or put the instrument out of operation. Small deviations of the measuring value(reading) exceeding the instruments specifications may result from such conditions in individual cases.
HAMEG GmbH
3Subject to change without notice
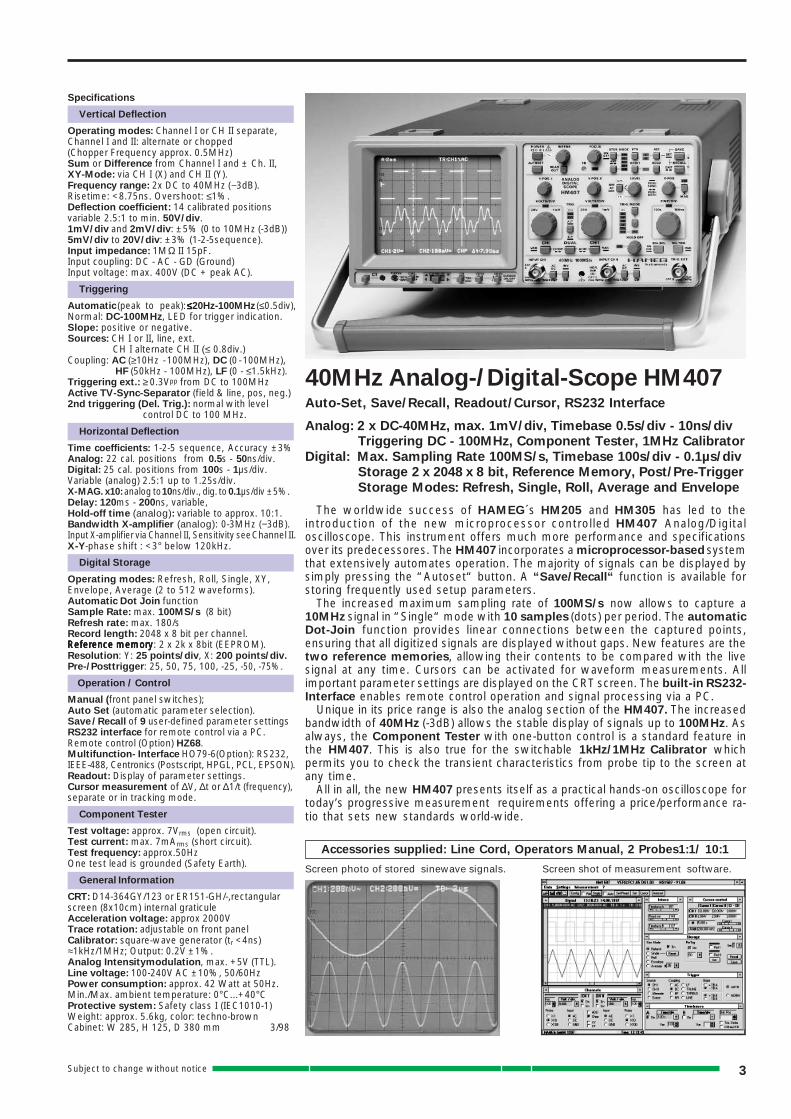
Accessories supplied: Line Cord, Operators Manual, 2 Probes1:1/ 10:1
Screen photo of stored sinewave signals. Screen shot of measurement software.
The worldwide success of HAMEG´s HM205 and HM305 has led to theintroduction of the new microprocessor controlled HM407 Analog/Digitaloscilloscope. This instrument offers much more performance and specificationsover its predecessores. The HM407 incorporates a microprocessor-based systemthat extensively automates operation. The majority of signals can be displayed bysimply pressing the “Autoset“ button. A “Save/Recall“ function is available forstoring frequently used setup parameters.
The increased maximum sampling rate of 100MS/s now allows to capture a10MHz signal in “Single“ mode with 10 samples (dots) per period. The automaticDot-Join function provides linear connections between the captured points,ensuring that all digitized signals are displayed without gaps. New features are thetwo reference memories, allowing their contents to be compared with the livesignal at any time. Cursors can be activated for waveform measurements. Allimportant parameter settings are displayed on the CRT screen. The built-in RS232-Interface enables remote control operation and signal processing via a PC.
Unique in its price range is also the analog section of the HM407. The increasedbandwidth of 40MHz (-3dB) allows the stable display of signals up to 100MHz. Asalways, the Component Tester with one-button control is a standard feature inthe HM407. This is also true for the switchable 1kHz/1MHz Calibrator whichpermits you to check the transient characteristics from probe tip to the screen atany time.
All in all, the new HM407 presents itself as a practical hands-on oscilloscope fortoday’s progressive measurement requirements offering a price/performance ra-tio that sets new standards world-wide.
Specifications
Vertical Deflection
Operating modes: Channel I or CH II separate,Channel I and II: alternate or chopped(Chopper Frequency approx. 0.5MHz)Sum or Difference from Channel I and ± Ch. II,XY-Mode: via CH I (X) and CH II (Y).Frequency range: 2x DC to 40MHz (−3dB).Risetime: <8.75ns. Overshoot: ≤1%.Deflection coefficient: 14 calibrated positionsvariable 2.5:1 to min. 50V/div.1mV/div and 2mV/div: ±5% (0 to 10MHz (-3dB))5mV/div to 20V/div: ±3% (1-2-5sequence).Input impedance: 1MΩ II 15pF.Input coupling: DC - AC - GD (Ground)Input voltage: max. 400V (DC + peak AC).
Triggering
Automatic (peak to peak):≤≤≤≤≤20Hz-100MHz (≤0.5div),Normal: DC-100MHz, LED for trigger indication.Slope: positive or negative.Sources: CH I or II, line, ext.
CH I alternate CH II (≤ 0.8div.)Coupling: AC (≥10Hz -100MHz), DC (0 -100MHz),
HF (50kHz - 100MHz), LF (0 - ≤1.5kHz).Triggering ext.: ≥ 0.3Vpp from DC to 100MHzActive TV-Sync-Separator (field & line, pos, neg.)2nd triggering (Del. Trig.): normal with level
control DC to 100 MHz.
Horizontal Deflection
Time coefficients: 1-2-5 sequence, Accuracy ±3%Analog: 22 cal. positions from 0.5s - 50ns/div.Digital: 25 cal. positions from 100s - 1µs/div.Variable (analog) 2.5:1 up to 1.25s/div.X-MAG. x10: analog to 10ns/div., dig. to 0.1µs/div ±5%.Delay: 120ms - 200ns, variable,Hold-off time (analog): variable to approx. 10:1.Bandwidth X-amplifier (analog): 0-3MHz (−3dB).Input X-amplifier via Channel II, Sensitivity see Channel II.X-Y-phase shift : <3° below 120kHz.
Digital Storage
Operating modes: Refresh, Roll, Single, XY,Envelope, Average (2 to 512 waveforms).Automatic Dot Join functionSample Rate: max. 100MS/s (8 bit)Refresh rate: max. 180/sRecord length: 2048 x 8 bit per channel.Reference memoryReference memoryReference memoryReference memoryReference memory: 2 x 2k x 8bit (EEPROM).Resolution: Y: 25 points/div, X: 200 points/div.Pre-/Posttrigger: 25, 50, 75, 100, -25, -50, -75%.
Operation / Control
Manual (front panel switches);Auto Set (automatic parameter selection).Save/Recall of 9 user-defined parameter settingsRS232 interface for remote control via a PC.Remote control (Option) HZ68.Multifunction- Interface HO79-6(Option): RS232,IEEE-488, Centronics (Postscript, HPGL, PCL, EPSON).Readout: Display of parameter settings.Cursor measurement of ∆V, ∆t or ∆1/t (frequency),separate or in tracking mode.
Component Tester
Test voltage: approx. 7Vrms (open circuit).Test current: max. 7mArms (short circuit).Test frequency: approx.50HzOne test lead is grounded (Safety Earth).
General Information
CRT: D14-364GY/123 or ER151-GH/-,rectangularscreen (8x10cm) internal graticuleAcceleration voltage: approx 2000VTrace rotation: adjustable on front panelCalibrator: square-wave generator (tr <4ns)≈1kHz/1MHz; Output: 0.2V ±1%.Analog Intensitymodulation, max. +5V (TTL).Line voltage: 100-240V AC ±10%, 50/60HzPower consumption: approx. 42 Watt at 50Hz.Min./Max. ambient temperature: 0°C...+40°CProtective system: Safety class I (IEC1010-1)Weight: approx. 5.6kg, color: techno-brownCabinet: W 285, H 125, D 380 mm 3/98
Storage 2 x 2048 x 8 bit, Reference Memory, Post/Pre-Trigger
Storage Modes: Refresh, Single, Roll, Average and Envelope
40MHz Analog-/Digital-Scope HM407
4 Subject to change without notice
General Information
This oscilloscope is easy to operate. The logical arrangementof the controls allows anyone to quickly become familiar withthe operation of the instrument, however, experienced usersare also advised to read through these instructions so that allfunctions are understood.
Immediately after unpacking, the instrument should be checkedfor mechanical damage and loose parts in the interior. If thereis transport damage, the supplier must be informedimmediately. The instrument must then not be put intooperation.
Symbols
ATTENTION - refer to manual
Danger - High voltage
Protective ground (earth) terminal
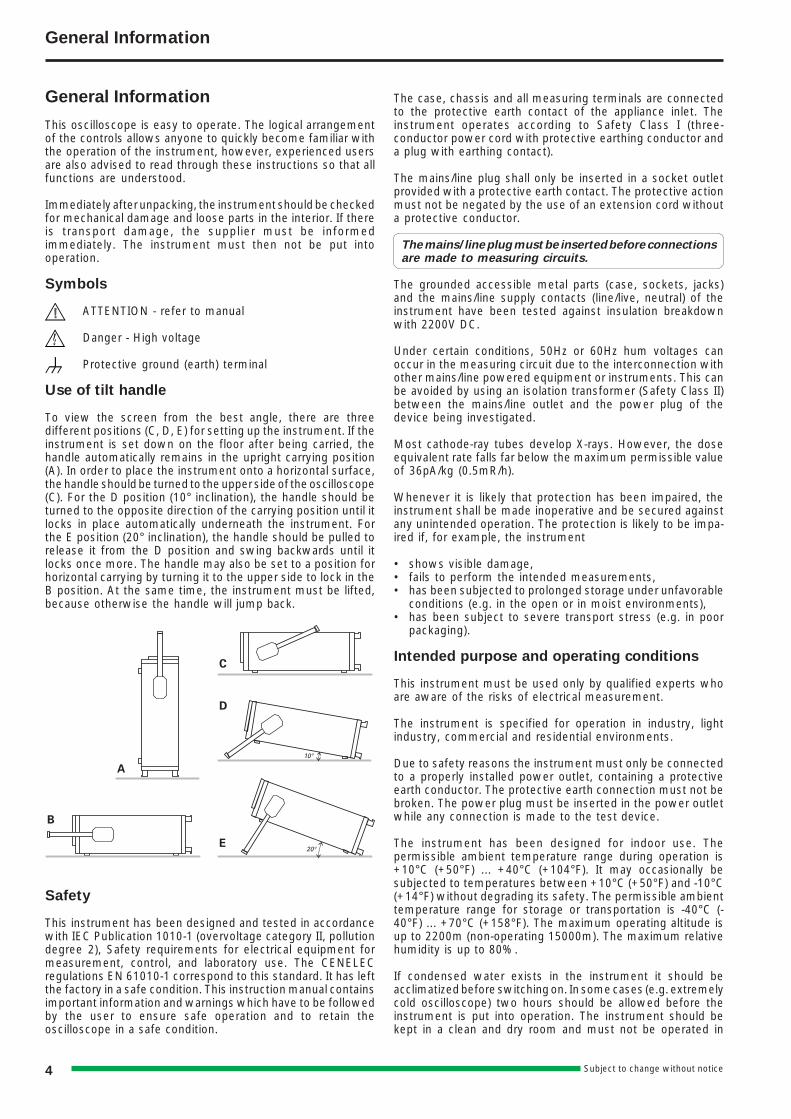
Use of tilt handle
To view the screen from the best angle, there are threedifferent positions (C, D, E) for setting up the instrument. If theinstrument is set down on the floor after being carried, thehandle automatically remains in the upright carrying position(A). In order to place the instrument onto a horizontal surface,the handle should be turned to the upper side of the oscilloscope(C). For the D position (10° inclination), the handle should beturned to the opposite direction of the carrying position until itlocks in place automatically underneath the instrument. Forthe E position (20° inclination), the handle should be pulled torelease it from the D position and swing backwards until itlocks once more. The handle may also be set to a position forhorizontal carrying by turning it to the upper side to lock in theB position. At the same time, the instrument must be lifted,because otherwise the handle will jump back.
Safety
This instrument has been designed and tested in accordancewith IEC Publication 1010-1 (overvoltage category II, pollutiondegree 2), Safety requirements for electrical equipment formeasurement, control, and laboratory use. The CENELECregulations EN 61010-1 correspond to this standard. It has leftthe factory in a safe condition. This instruction manual containsimportant information and warnings which have to be followedby the user to ensure safe operation and to retain theoscilloscope in a safe condition.
The case, chassis and all measuring terminals are connectedto the protective earth contact of the appliance inlet. Theinstrument operates according to Safety Class I (three-conductor power cord with protective earthing conductor anda plug with earthing contact).
The mains/line plug shall only be inserted in a socket outletprovided with a protective earth contact. The protective actionmust not be negated by the use of an extension cord withouta protective conductor.
The mains/line plug must be inserted before connectionsare made to measuring circuits.
The grounded accessible metal parts (case, sockets, jacks)and the mains/line supply contacts (line/live, neutral) of theinstrument have been tested against insulation breakdownwith 2200V DC.
Under certain conditions, 50Hz or 60Hz hum voltages canoccur in the measuring circuit due to the interconnection withother mains/line powered equipment or instruments. This canbe avoided by using an isolation transformer (Safety Class II)between the mains/line outlet and the power plug of thedevice being investigated.
Most cathode-ray tubes develop X-rays. However, the doseequivalent rate falls far below the maximum permissible valueof 36pA/kg (0.5mR/h).
Whenever it is likely that protection has been impaired, theinstrument shall be made inoperative and be secured againstany unintended operation. The protection is likely to be impa-ired if, for example, the instrument
• shows visible damage,• fails to perform the intended measurements,• has been subjected to prolonged storage under unfavorable
conditions (e.g. in the open or in moist environments),• has been subject to severe transport stress (e.g. in poor
packaging).
Intended purpose and operating conditions
This instrument must be used only by qualified experts whoare aware of the risks of electrical measurement.
The instrument is specified for operation in industry, lightindustry, commercial and residential environments.
Due to safety reasons the instrument must only be connectedto a properly installed power outlet, containing a protectiveearth conductor. The protective earth connection must not bebroken. The power plug must be inserted in the power outletwhile any connection is made to the test device.
The instrument has been designed for indoor use. Thepermissible ambient temperature range during operation is+10°C (+50°F) ... +40°C (+104°F). It may occasionally besubjected to temperatures between +10°C (+50°F) and -10°C(+14°F) without degrading its safety. The permissible ambienttemperature range for storage or transportation is -40°C (-40°F) ... +70°C (+158°F). The maximum operating altitude isup to 2200m (non-operating 15000m). The maximum relativehumidity is up to 80%.
If condensed water exists in the instrument it should beacclimatized before switching on. In some cases (e.g. extremelycold oscilloscope) two hours should be allowed before theinstrument is put into operation. The instrument should bekept in a clean and dry room and must not be operated in
General Information
5Subject to change without notice
explosive, corrosive, dusty, or moist environments. Theoscilloscope can be operated in any position, but the convectioncooling must not be impaired. The ventilation holes may not becovered. For continuous operation the instrument should beused in the horizontal position, preferably tilted upwards,resting on the tilt handle.
The specifications stating tolerances are only valid ifthe instrument has warmed up for 30minutes at anambient temperature between +15°C (+59°F) and +30°C(+86°F). Values without tolerances are typical for anaverage instrument.
EMC
This instrument conforms to the European standards regardingthe electromagnetic compatibility. The applied standards are:Generic immunity standard EN50082-2:1995 (for industrialenvironment) Generic emission standard EN50081-1:1992(for residential, commercial and light industry environment).
This means that the instrument has been tested to the higheststandards.
Please note that under the influence of strong electromagneticfields, such signals may be superimposed on the measuredsignals.
Under certain conditions this is unavoidable due to theinstrument’s high input sensitivity, high input impedance andbandwidth. Shielded measuring cables, shielding and earthingof the device under test may reduce or eliminate those effects.
Warranty
HAMEG warrants to its Customers that the products itmanufactures and sells will be free from defects in materialsand workmanship for a period of 2 years. This warranty shallnot apply to any defect, failure or damage caused by improperuse or inadequate maintenance and care. HAMEG shall not beobliged to provide service under this warranty to repair damageresulting from attempts by personnel other than HAMEGrepresentatives to install, repair, service or modify theseproducts.
In order to obtain service under this warranty, Customersmust contact and notify the distributor who has sold theproduct. Each instrument is subjected to a quality test with 10hour burn-in before leaving the production. Practically all earlyfailures are detected by this method. In the case of shipmentsby post, rail or carrier it is recommended that the originalpacking is carefully preserved. Transport damages and damagedue to gross negligence are not covered by the guarantee.
In the case of a complaint, a label should be attached to thehousing of the instrument which describes briefly the faultsobserved. If at the same time the name and telephone number(dialing code and telephone or direct number or departmentdesignation) is stated for possible queries, this helps towardsspeeding up the processing of guarantee claims.
Maintenance
Various important properties of the oscilloscope should becarefully checked at certain intervals. Only in this way is itlargely certain that all signals are displayed with the accuracyon which the technical data are based. The test methodsdescribed in the test plan of this manual can be performedwithout great expenditure on measuring instruments. However,purchase of the HAMEG scope tester HZ 60, which despite itslow price is highly suitable for tasks of this type, is very much
recommended. The exterior of the oscilloscope should becleaned regularly with a dusting brush. Dirt which is difficult toremove on the casing and handle, the plastic and aluminiumparts, can be removed with a moistened cloth (99% water+1% mild detergent). Spirit or washing benzine (petroleumether) can be used to remove greasy dirt. The screen may becleaned with water or washing benzine (but not with spirit(alcohol) or solvents), it must then be wiped with a dry cleanlint-free cloth. Under no circumstances may the cleaning fluidget into the instrument. The use of other cleaning agents canattack the plastic and paint surfaces.
Protective Switch-Off
This instrument is equipped with a switch mode power supply.It has both overvoltage and overload protection, which willcause the switch mode supply to limit power consumption toa minimum. In this case a ticking noise may be heard.
Power supply
The oscilloscope operates on mains/line voltages between100VAC and 240VAC. No means of switching to different inputvoltages has therefore been provided.
The power input fuses are externally accessible. The fuseholderis located above the 3-pole power connector. The power inputfuses are externally accessible, if the rubber connector isremoved. The fuseholder can be released by pressing itsplastic retainers with the aid of a small screwdriver. Theretainers are located on the right and left side of the holder andmust be pressed towards the center. The fuse(s) can then bereplaced and pressed in until locked on both sides.
Use of patched fuses or short-circuiting of the fuseholder isnot permissible; HAMEG assumes no liability whatsoever forany damage caused as a result, and all warranty claimsbecome null and void.
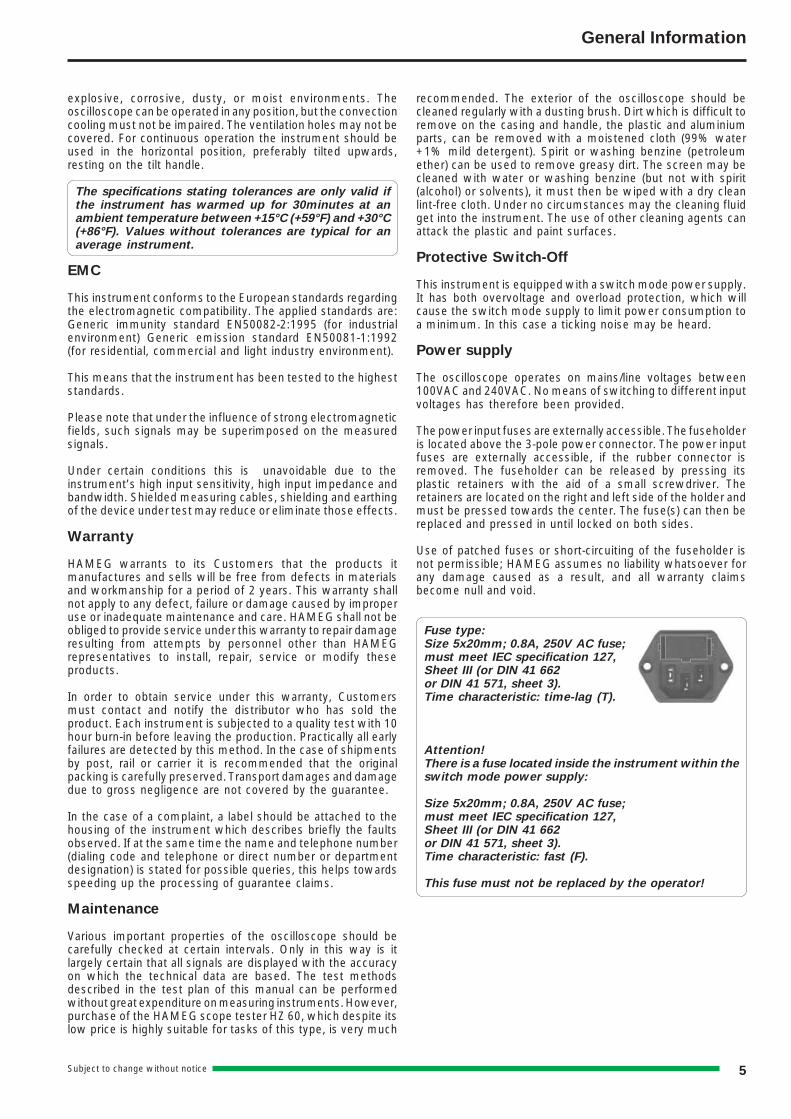
Fuse type:Size 5x20mm; 0.8A, 250V AC fuse;must meet IEC specification 127,Sheet III (or DIN 41 662or DIN 41 571, sheet 3).Time characteristic: time-lag (T).
Attention!There is a fuse located inside the instrument within theswitch mode power supply:
Size 5x20mm; 0.8A, 250V AC fuse;must meet IEC specification 127,Sheet III (or DIN 41 662or DIN 41 571, sheet 3).Time characteristic: fast (F).
This fuse must not be replaced by the operator!
General Information
6 Subject to change without notice
Type of signal voltage
The oscilloscope HM407 allows examination of DC voltagesand most repetitive signals in the frequency range up to atleast 40MHz (-3dB).
The vertical amplifiers have been designed for minimumovershoot and therefore permit a true signal display.
The display of sinusoidal signals within the bandwidth limitscauses no problems, but an increasing error in measurementdue to gain reduction must be taken into account whenmeasuring high frequency signals. This error becomesnoticeable at approx. 14MHz. At approx. 18MHz the reductionis approx. 10% and the real voltage value is 11% higher. Thegain reduction error can not be defined exactly as the -3dBbandwidth of the amplifiers differ between 40MHz and 42MHz.For sinewave signals the -6dB limit is approx. 50MHz.
When examining square or pulse type waveforms, attentionmust be paid to the harmonic content of such signals. Therepetition frequency (fundamental frequency) of the signalmust therefore be significantly smaller than the upper limitfrequency of the vertical amplifier.
Displaying composite signals can be difficult, especially if theycontain no repetitive higher amplitude content which can beused for triggering. This is the case with bursts, for instance.To obtain a well-triggered display in this case, the assistanceof the variable holdoff function or the delayed time base maybe required. Television video signals are relatively easy totrigger using the built-in TV-Sync-Separator (TV).
For optional operation as a DC or AC voltage amplifier, eachvertical amplifier input is provided with a DC/AC switch. DCcoupling should only be used with a series-connected attenuatorprobe or at very low frequencies or if the measurement of theDC voltage content of the signal is absolutely necessary.
When displaying very low frequency pulses, the flat tops maybe sloping with AC coupling of the vertical amplifier (AC limitfrequency approx. 1.6 Hz for 3dB). In this case, DC operationis preferred, provided the signal voltage is not superimposedon a too high DC level. Otherwise a capacitor of adequatecapacitance must be connected to the input of the verticalamplifier with DC coupling. This capacitor must have asufficiently high breakdown voltage rating. DC coupling is alsorecommended for the display of logic and pulse signals,especially if the pulse duty factor changes constantly. Otherwisethe display will move upwards or downwards at each change.Pure direct voltages can only be measured with DC-coupling.
The input coupling is selectable by the AC/DC pushbutton. Theactual setting is displayed in the readout with the ” = ” symbolfor DC- and the ” ~ ” symbol for AC coupling.
Amplitude Measurements
In general electrical engineering, alternating voltage datanormally refers to effective values (rms = root-mean-squarevalue). However, for signal magnitudes and voltage designationsin oscilloscope measurements, the peak-to-peak voltage (Vpp)value is applied. The latter corresponds to the real potentialdifference between the most positive and most negativepoints of a signal waveform.
If a sinusoidal waveform, displayed on the oscilloscope screen,is to be converted into an effective (rms) value, the resultingpeak-to-peak value must be divided by 2x√2 = 2.83. Conversely,it should be observed that sinusoidal voltages indicated inVrms (Veff) have 2.83 times the potential difference in Vpp.
The relationship between the different voltage magnitudescan be seen from the following figure.
Voltage values of a sine curveVrms = effective value; Vp = simple peak or crest value;Vpp = peak-to-peak value; Vmom = momentary value.
The minimum signal voltage which must be applied to the Yinput for a trace of 1div height is 1mVpp (± 5%) when thisdeflection coefficient is displayed on the screen (readout) andthe vernier is switched off (VAR-LED dark). However, smallersignals than this may also be displayed. The deflectioncoefficients are indicated in mV/div or V/div (peak-to-peakvalue).
The magnitude of the applied voltage is ascertained bymultiplying the selected deflection coefficient by the verticaldisplay height in div. If an attenuator probe x10 is used, afurther multiplication by a factor of 10 is required to ascertainthe correct voltage value.
For exact amplitude measurements, the variable control (VAR)must be set to its calibrated detent CAL position.
With the variable control activated the deflection sensitivitycan be reduced up to a ratio of 2.5 to 1 (please note “controlsand readout”). Therefore any intermediate value is possiblewithin the 1-2-5 sequence of the attenuator(s).
With direct connection to the vertical input, signals upto 400Vpp may be displayed (attenuator set to 20V/div,variable control to 2.5:1).
With the designations
H = display height in div,U = signal voltage in Vpp at the vertical input,D = deflection coefficient in V/div at attenuator switch,
the required value can be calculated from the two givenquantities:
However, these three values are not freely selectable. Theyhave to be within the following limits (trigger threshold,accuracy of reading):
H between 0.5 and 8div, if possible 3.2 to 8div,U between 1mVpp and 160Vpp,D between 1mV/div and 20V/div in 1-2-5 sequence.
Examples:Set deflection coefficient D = 50mV/div 0.05V/div,observed display height H = 4.6div,required voltage U = 0.05x4.6 = 0.23Vpp.Input voltage U = 5Vpp,set deflection coefficient D = 1V/div,required display height H = 5:1 = 5div.
Type of signal voltage
7Subject to change without notice
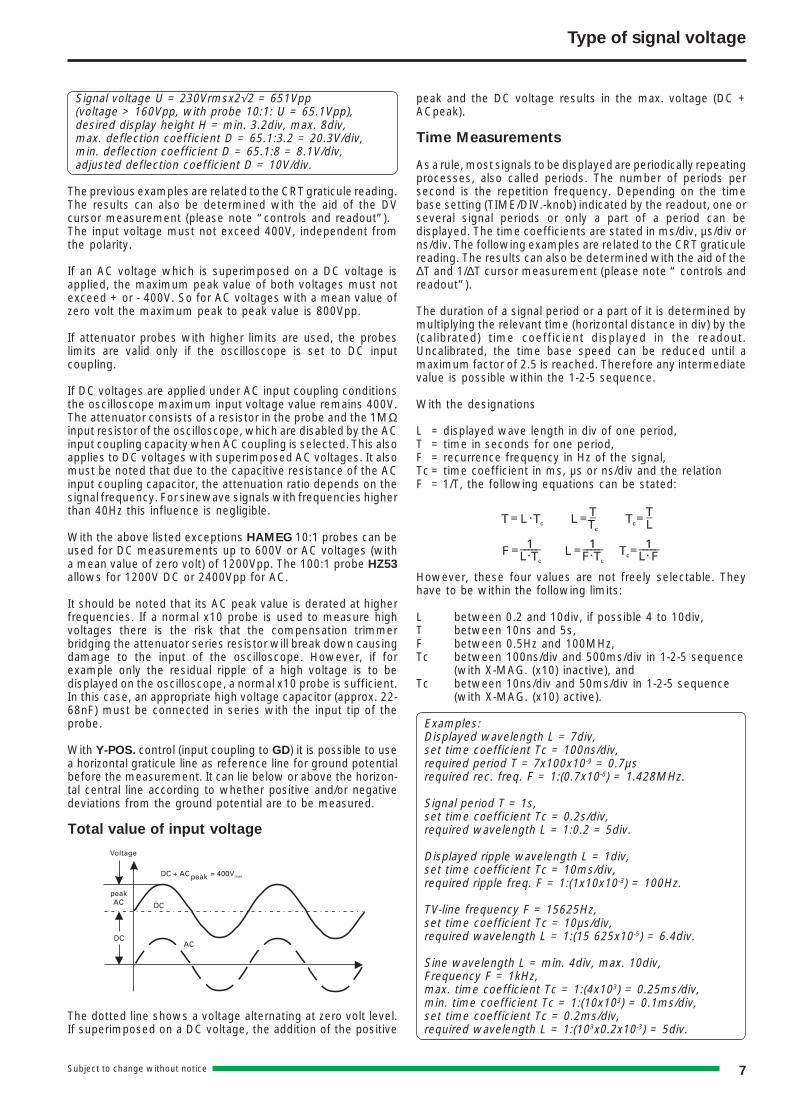
Signal voltage U = 230Vrmsx2√2 = 651Vpp(voltage > 160Vpp, with probe 10:1: U = 65.1Vpp),desired display height H = min. 3.2div, max. 8div,max. deflection coefficient D = 65.1:3.2 = 20.3V/div,min. deflection coefficient D = 65.1:8 = 8.1V/div,adjusted deflection coefficient D = 10V/div.
The previous examples are related to the CRT graticule reading.The results can also be determined with the aid of the DVcursor measurement (please note “controls and readout”).The input voltage must not exceed 400V, independent fromthe polarity.
If an AC voltage which is superimposed on a DC voltage isapplied, the maximum peak value of both voltages must notexceed + or - 400V. So for AC voltages with a mean value ofzero volt the maximum peak to peak value is 800Vpp.
If attenuator probes with higher limits are used, the probeslimits are valid only if the oscilloscope is set to DC inputcoupling.
If DC voltages are applied under AC input coupling conditionsthe oscilloscope maximum input voltage value remains 400V.The attenuator consists of a resistor in the probe and the 1MΩinput resistor of the oscilloscope, which are disabled by the ACinput coupling capacity when AC coupling is selected. This alsoapplies to DC voltages with superimposed AC voltages. It alsomust be noted that due to the capacitive resistance of the ACinput coupling capacitor, the attenuation ratio depends on thesignal frequency. For sinewave signals with frequencies higherthan 40Hz this influence is negligible.
With the above listed exceptions HAMEG 10:1 probes can beused for DC measurements up to 600V or AC voltages (witha mean value of zero volt) of 1200Vpp. The 100:1 probe HZ53allows for 1200V DC or 2400Vpp for AC.
It should be noted that its AC peak value is derated at higherfrequencies. If a normal x10 probe is used to measure highvoltages there is the risk that the compensation trimmerbridging the attenuator series resistor will break down causingdamage to the input of the oscilloscope. However, if forexample only the residual ripple of a high voltage is to bedisplayed on the oscilloscope, a normal x10 probe is sufficient.In this case, an appropriate high voltage capacitor (approx. 22-68nF) must be connected in series with the input tip of theprobe.
With Y-POS. control (input coupling to GD) it is possible to usea horizontal graticule line as reference line for ground potentialbefore the measurement. It can lie below or above the horizon-tal central line according to whether positive and/or negativedeviations from the ground potential are to be measured.
Total value of input voltage
The dotted line shows a voltage alternating at zero volt level.If superimposed on a DC voltage, the addition of the positive
peak and the DC voltage results in the max. voltage (DC +ACpeak).
Time Measurements
As a rule, most signals to be displayed are periodically repeatingprocesses, also called periods. The number of periods persecond is the repetition frequency. Depending on the timebase setting (TIME/DIV.-knob) indicated by the readout, one orseveral signal periods or only a part of a period can bedisplayed. The time coefficients are stated in ms/div, µs/div orns/div. The following examples are related to the CRT graticulereading. The results can also be determined with the aid of the∆T and 1/∆T cursor measurement (please note “ controls andreadout”).
The duration of a signal period or a part of it is determined bymultiplying the relevant time (horizontal distance in div) by the(calibrated) time coefficient displayed in the readout.Uncalibrated, the time base speed can be reduced until amaximum factor of 2.5 is reached. Therefore any intermediatevalue is possible within the 1-2-5 sequence.
With the designations
L = displayed wave length in div of one period,T = time in seconds for one period,F = recurrence frequency in Hz of the signal,Tc = time coefficient in ms, µs or ns/div and the relationF = 1/T, the following equations can be stated:
However, these four values are not freely selectable. Theyhave to be within the following limits:
L between 0.2 and 10div, if possible 4 to 10div,T between 10ns and 5s,F between 0.5Hz and 100MHz,Tc between 100ns/div and 500ms/div in 1-2-5 sequence
(with X-MAG. (x10) inactive), andTc between 10ns/div and 50ms/div in 1-2-5 sequence
(with X-MAG. (x10) active).
Examples:Displayed wavelength L = 7div,set time coefficient Tc = 100ns/div,required period T = 7x100x10-9 = 0.7µsrequired rec. freq. F = 1:(0.7x10⁻⁶) = 1.428MHz.
Signal period T = 1s,set time coefficient Tc = 0.2s/div,required wavelength L = 1:0.2 = 5div.
Displayed ripple wavelength L = 1div,set time coefficient Tc = 10ms/div,required ripple freq. F = 1:(1x10x10-3) = 100Hz.
TV-line frequency F = 15625Hz,set time coefficient Tc = 10µs/div,required wavelength L = 1:(15 625x10-5) = 6.4div.
Sine wavelength L = min. 4div, max. 10div,Frequency F = 1kHz,max. time coefficient Tc = 1:(4x10³) = 0.25ms/div,min. time coefficient Tc = 1:(10x103) = 0.1ms/div,set time coefficient Tc = 0.2ms/div,required wavelength L = 1:(103x0.2x10-3) = 5div.
Type of signal voltage
8 Subject to change without notice
Displayed wavelength L = 0.8div,set time coefficient Tc = 0.5µs/div,pressed X-MAG. (x10) button: Tc = 0.05µs/div,required rec. freq. F = 1:(0.8x0.05x10-6) = 25MHz,required period T = 1:(25x106) = 40ns.
If the time is relatively short as compared with the completesignal period, an expanded time scale should always be applied(X-MAG. (x10) active). In this case, the time interval of interestcan be shifted to the screen center using the X-POS. control.
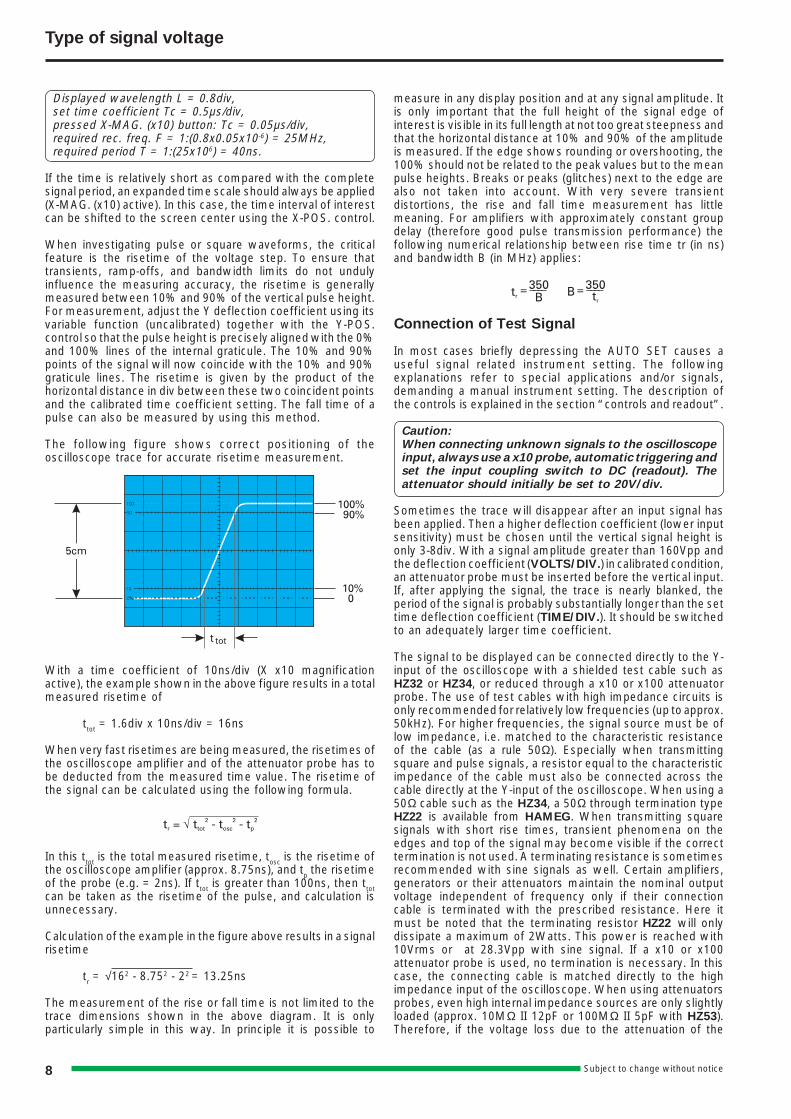
When investigating pulse or square waveforms, the criticalfeature is the risetime of the voltage step. To ensure thattransients, ramp-offs, and bandwidth limits do not undulyinfluence the measuring accuracy, the risetime is generallymeasured between 10% and 90% of the vertical pulse height.For measurement, adjust the Y deflection coefficient using itsvariable function (uncalibrated) together with the Y-POS.control so that the pulse height is precisely aligned with the 0%and 100% lines of the internal graticule. The 10% and 90%points of the signal will now coincide with the 10% and 90%graticule lines. The risetime is given by the product of thehorizontal distance in div between these two coincident pointsand the calibrated time coefficient setting. The fall time of apulse can also be measured by using this method.
The following figure shows correct positioning of theoscilloscope trace for accurate risetime measurement.
With a time coefficient of 10ns/div (X x10 magnificationactive), the example shown in the above figure results in a totalmeasured risetime of
ttot = 1.6div x 10ns/div = 16ns
When very fast risetimes are being measured, the risetimes ofthe oscilloscope amplifier and of the attenuator probe has tobe deducted from the measured time value. The risetime ofthe signal can be calculated using the following formula.
In this ttot is the total measured risetime, tosc is the risetime ofthe oscilloscope amplifier (approx. 8.75ns), and tp the risetimeof the probe (e.g. = 2ns). If ttot is greater than 100ns, then ttotcan be taken as the risetime of the pulse, and calculation isunnecessary.
Calculation of the example in the figure above results in a signalrisetime
tr = √162 - 8.752 - 22 = 13.25ns
The measurement of the rise or fall time is not limited to thetrace dimensions shown in the above diagram. It is onlyparticularly simple in this way. In principle it is possible to
measure in any display position and at any signal amplitude. Itis only important that the full height of the signal edge ofinterest is visible in its full length at not too great steepness andthat the horizontal distance at 10% and 90% of the amplitudeis measured. If the edge shows rounding or overshooting, the100% should not be related to the peak values but to the meanpulse heights. Breaks or peaks (glitches) next to the edge arealso not taken into account. With very severe transientdistortions, the rise and fall time measurement has littlemeaning. For amplifiers with approximately constant groupdelay (therefore good pulse transmission performance) thefollowing numerical relationship between rise time tr (in ns)and bandwidth B (in MHz) applies:
Connection of Test Signal
In most cases briefly depressing the AUTO SET causes auseful signal related instrument setting. The followingexplanations refer to special applications and/or signals,demanding a manual instrument setting. The description ofthe controls is explained in the section “controls and readout”.
Caution:When connecting unknown signals to the oscilloscopeinput, always use a x10 probe, automatic triggering andset the input coupling switch to DC (readout). Theattenuator should initially be set to 20V/div.
Sometimes the trace will disappear after an input signal hasbeen applied. Then a higher deflection coefficient (lower inputsensitivity) must be chosen until the vertical signal height isonly 3-8div. With a signal amplitude greater than 160Vpp andthe deflection coefficient (VOLTS/DIV.) in calibrated condition,an attenuator probe must be inserted before the vertical input.If, after applying the signal, the trace is nearly blanked, theperiod of the signal is probably substantially longer than the settime deflection coefficient (TIME/DIV.). It should be switchedto an adequately larger time coefficient.
The signal to be displayed can be connected directly to the Y-input of the oscilloscope with a shielded test cable such asHZ32 or HZ34, or reduced through a x10 or x100 attenuatorprobe. The use of test cables with high impedance circuits isonly recommended for relatively low frequencies (up to approx.50kHz). For higher frequencies, the signal source must be oflow impedance, i.e. matched to the characteristic resistanceof the cable (as a rule 50Ω). Especially when transmittingsquare and pulse signals, a resistor equal to the characteristicimpedance of the cable must also be connected across thecable directly at the Y-input of the oscilloscope. When using a50Ω cable such as the HZ34, a 50Ω through termination typeHZ22 is available from HAMEG. When transmitting squaresignals with short rise times, transient phenomena on theedges and top of the signal may become visible if the correcttermination is not used. A terminating resistance is sometimesrecommended with sine signals as well. Certain amplifiers,generators or their attenuators maintain the nominal outputvoltage independent of frequency only if their connectioncable is terminated with the prescribed resistance. Here itmust be noted that the terminating resistor HZ22 will onlydissipate a maximum of 2Watts. This power is reached with10Vrms or at 28.3Vpp with sine signal. If a x10 or x100attenuator probe is used, no termination is necessary. In thiscase, the connecting cable is matched directly to the highimpedance input of the oscilloscope. When using attenuatorsprobes, even high internal impedance sources are only slightlyloaded (approx. 10MΩ II 12pF or 100MΩ II 5pF with HZ53).Therefore, if the voltage loss due to the attenuation of the
Type of signal voltage
9Subject to change without notice
probe can be compensated by a higher amplitude setting, theprobe should always be used. The series impedance of theprobe provides a certain amount of protection for the input ofthe vertical amplifier. Because of their separate manufacture,all attenuator probes are only partially compensated, thereforeaccurate compensation must be performed on the oscilloscope(see Probe compensation ).
Standard attenuator probes on the oscilloscope normally reduceits bandwidth and increase the rise time. In all cases where theoscilloscope bandwidth must be fully utilized (e.g. for pulseswith steep edges) we strongly advise using the probes HZ51(x10) HZ52 (x10 HF) and HZ54 (x1 and x10). This can save thepurchase of an oscilloscope with larger bandwidth.
The probes mentioned have a HF-calibration in addition to lowfrequency calibration adjustment. Thus a group delay correctionto the upper limit frequency of the oscilloscope is possible withthe aid of an 1MHz calibrator, e.g. HZ60.
In fact the bandwidth and rise time of the oscilloscope are notnoticeably changed with these probe types and the waveformreproduction fidelity can even be improved because the probecan be matched to the oscilloscopes individual pulse response.
If a x10 or x100 attenuator probe is used, DC inputcoupling must always be used at voltages above 400V.With AC coupling of low frequency signals, theattenuation is no longer independent of frequency,pulses can show pulse tilts. Direct voltages aresuppressed but load the oscilloscope input couplingcapacitor concerned. Its voltage rating is max. 400 V(DC + peak AC). DC input coupling is therefore of quitespecial importance with a x100 attenuation probe whichusually has a voltage rating of max. 1200 V (DC + peakAC). A capacitor of corresponding capacitance andvoltage rating may be connected in series with theattenuator probe input for blocking DC voltage (e.g. forhum voltage measurement).
With all attenuator probes, the maximum AC input voltagemust be derated with frequency usually above 20kHz. Thereforethe derating curve of the attenuator probe type concernedmust be taken into account. The selection of the ground pointon the test object is important when displaying small signalvoltages. It should always be as close as possible to themeasuring point. If this is not done, serious signal distortionmay result from spurious currents through the ground leads orchassis parts. The ground leads on attenuator probes are alsoparticularly critical. They should be as short and thick aspossible. When the attenuator probe is connected to a BNC-socket, a BNC-adapter, should be used. In this way ground andmatching problems are eliminated. Hum or interferenceappearing in the measuring circuit (especially when a smalldeflection coefficient is used) is possibly caused by multiplegrounding because equalizing currents can flow in the shieldingof the test cables (voltage drop between the protectiveconductor connections, caused by external equipmentconnected to the mains/line, e.g. signal generators withinterference protection capacitors).
Controls and readout
The following description assumes that the operating mode“COMPONENT TEST” is switched off. All important measuringparameter settings are displayed in the screen readout whenthe oscilloscope is on.
The LED indicators on the large front panel facilitate operationand provide additional information. Electrical end positions ofcontrols are indicated by acoustic signal (beep).
All controls, except the power switch (POWER), the calibrationfrequency pushbutton (CAL. 1kHz/1MHz), the FOCUS controland the trace rotation control, are electronically set andinterrogated. Thus, all electronically set functions and theircurrent settings can be stored and also remotely controlled.Some controls are only operative in the digital mode or have adifferent function. Explanations pertaining to them are indicatedwith the hint “storage mode only”.
The large front panel is, as is usual with Hameg oscilloscopes,is marked with several fields.
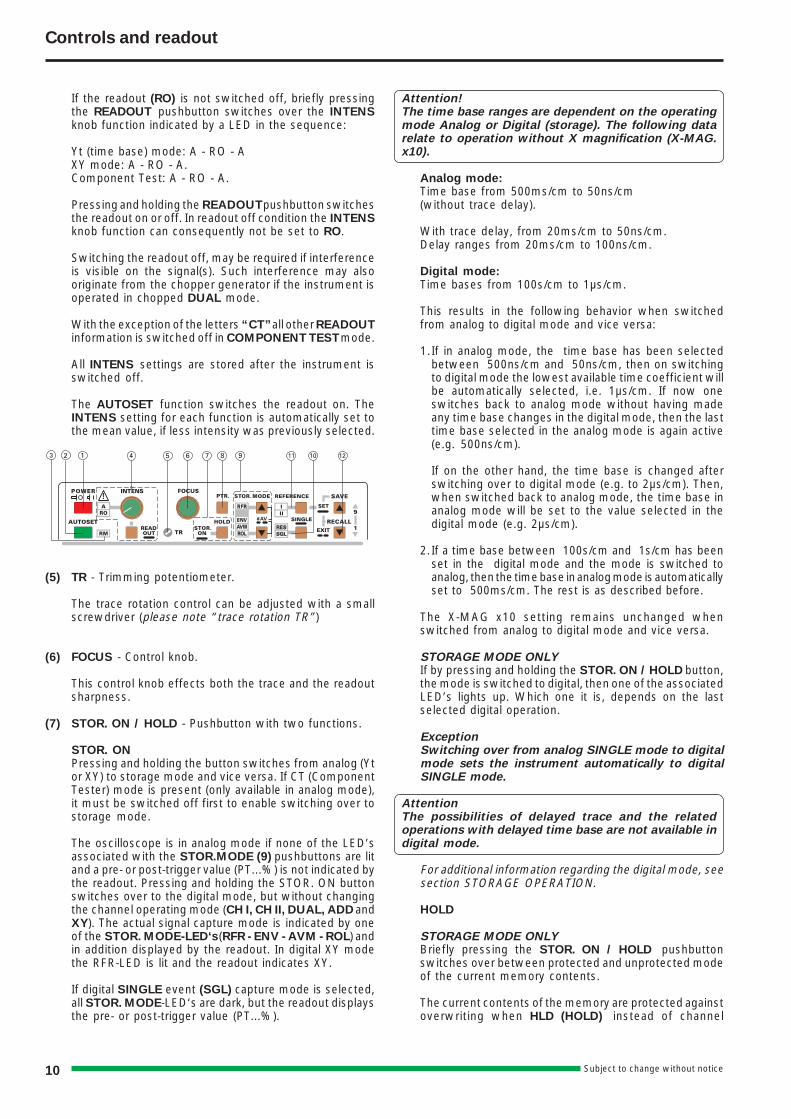
The following controls and LED indicators are located on thetop, to the right of the screen, above the horizontal line:
(1) POWER - Pushbutton and symbols for ON (I) and OFF (O).After the oscilloscope is switched on, all LEDs are lit andan automated instrument test is performed. During thistime the HAMEG logo and the software version aredisplayed on the screen. After the internal test is completedsuccessfully, the overlay is switched off and the normaloperation mode is present. Then the last used settingsbecome activated and one LED indicates the ON condition.
It is possible to modify certain functions (SETUP) or to callautomatic calibration procedures (CALIBRATE). For detailsrelating to this see section “MENU”.
(2) AUTOSET - PushbuttonBriefly depressing this pushbutton results in an automaticinstrument setting automatically selecting Yt mode. Theinstrument is set to the last used Yt mode setting (CH I,CH II or DUAL).
SEARCH (SEA) and DELAY (DEL and DTR) mode isautomatically switched off. Please note “AUTO SET”.
STORAGE MODE ONLYAdditionally, AUTOSET automatically selects refreshmode (RFR) when SINGLE (SGL) or ROLL (ROL) functionis in operation.
(3) RM - LEDThe remote control mode can be switched on or off(”RM” LED dark) via the RS232 interface. On conditionthat the “RM” LED is lit, all electronically selectablecontrols on front panel are inactive. This state can be leftby depressing the AUTOSET pushbutton provided it wasnot deactivated via the interface.
STORAGE MODE ONLYThe RM-LED is lit during data transfer via the built inRS232 interface. At this time the controls are inactive.
(4) INTENS - READOUT - Control knob with associatedpushbutton and LEDs.
This control knob is for adjusting the trace (A) and readoutintensity (RO). Turning this knob clockwise increases andturning it counterclockwise decreases the intensity.
The READOUT pushbutton below is for selecting thefunction in two ways.
Controls and readout
10 Subject to change without notice
If the readout (RO) is not switched off, briefly pressingthe READOUT pushbutton switches over the INTENSknob function indicated by a LED in the sequence:
Yt (time base) mode: A - RO - AXY mode: A - RO - A.Component Test: A - RO - A.
Pressing and holding the READOUT pushbutton switchesthe readout on or off. In readout off condition the INTENSknob function can consequently not be set to RO.
Switching the readout off, may be required if interferenceis visible on the signal(s). Such interference may alsooriginate from the chopper generator if the instrument isoperated in chopped DUAL mode.
With the exception of the letters “CT” all other READOUTinformation is switched off in COMPONENT TEST mode.
All INTENS settings are stored after the instrument isswitched off.
The AUTOSET function switches the readout on. TheINTENS setting for each function is automatically set tothe mean value, if less intensity was previously selected.
(5) TR - Trimming potentiometer.
The trace rotation control can be adjusted with a smallscrewdriver (please note “trace rotation TR”)
(6) FOCUS - Control knob.
This control knob effects both the trace and the readoutsharpness.
(7) STOR. ON / HOLD - Pushbutton with two functions.
STOR. ONPressing and holding the button switches from analog (Ytor XY) to storage mode and vice versa. If CT (ComponentTester) mode is present (only available in analog mode),it must be switched off first to enable switching over tostorage mode.
The oscilloscope is in analog mode if none of the LED’sassociated with the STOR.MODE (9) pushbuttons are litand a pre- or post-trigger value (PT...%) is not indicated bythe readout. Pressing and holding the STOR. ON buttonswitches over to the digital mode, but without changingthe channel operating mode (CH I, CH II, DUAL, ADD andXY). The actual signal capture mode is indicated by oneof the STOR. MODE-LED‘s (RFR - ENV - AVM - ROL) andin addition displayed by the readout. In digital XY modethe RFR-LED is lit and the readout indicates XY.
If digital SINGLE event (SGL) capture mode is selected,all STOR. MODE-LED‘s are dark, but the readout displaysthe pre- or post-trigger value (PT...%).
Attention!The time base ranges are dependent on the operatingmode Analog or Digital (storage). The following datarelate to operation without X magnification (X-MAG.x10).
Analog mode:Time base from 500ms/cm to 50ns/cm(without trace delay).
With trace delay, from 20ms/cm to 50ns/cm.Delay ranges from 20ms/cm to 100ns/cm.
Digital mode:Time bases from 100s/cm to 1µs/cm.
This results in the following behavior when switchedfrom analog to digital mode and vice versa:
1.If in analog mode, the time base has been selectedbetween 500ns/cm and 50ns/cm, then on switchingto digital mode the lowest available time coefficient willbe automatically selected, i.e. 1µs/cm. If now oneswitches back to analog mode without having madeany time base changes in the digital mode, then the lasttime base selected in the analog mode is again active(e.g. 500ns/cm).
If on the other hand, the time base is changed afterswitching over to digital mode (e.g. to 2µs/cm). Then,when switched back to analog mode, the time base inanalog mode will be set to the value selected in thedigital mode (e.g. 2µs/cm).
2.If a time base between 100s/cm and 1s/cm has beenset in the digital mode and the mode is switched toanalog, then the time base in analog mode is automaticallyset to 500ms/cm. The rest is as described before.
The X-MAG x10 setting remains unchanged whenswitched from analog to digital mode and vice versa.
STORAGE MODE ONLYIf by pressing and holding the STOR. ON / HOLD button,the mode is switched to digital, then one of the associatedLED’s lights up. Which one it is, depends on the lastselected digital operation.
ExceptionSwitching over from analog SINGLE mode to digitalmode sets the instrument automatically to digitalSINGLE mode.
AttentionThe possibilities of delayed trace and the relatedoperations with delayed time base are not available indigital mode.
For additional information regarding the digital mode, seesection STORAGE OPERATION.
HOLD
STORAGE MODE ONLYBriefly pressing the STOR. ON / HOLD pushbuttonswitches over between protected and unprotected modeof the current memory contents.
The current contents of the memory are protected againstoverwriting when HLD (HOLD) instead of channel
Controls and readout
11Subject to change without notice
information (e.g. Y1... ) is displayed in the readout. Thisprevents a change in the Yt mode setting, but it is possibleto select between DUAL (Yt) and XY display by pressingthe DUAL (22) pushbutton if one of these modes wasselected before activating HOLD.
If HOLD is switched off, one can observe how theexisting memory contents are successively overwrittenby new data especially with slow time base settings andrefresh mode. Protecting the memory contents in themiddle of a data acquisition process can result in anirregularity at the junction of old (right) and new data (left).This can be avoided by recording in single shot mode(SGL), even though the input signal is repetitive. At theend of a sweep, one can use HOLD to protect thecontents against being overwritten by an unintentionalactuation of RESET (RES).
The signal in each of the current memory can be shiftedin the vertical direction (+/- 4cm) with the correspondingY-POS rotary knob when HOLD is operative.
The original trace position will be lost when shiftedvertically, but this can be found again. To this end the Y-POS knob in question must be rotated quickly. Once theoriginal position is reached, the trace does not shiftanymore although the knob is rotated further.Simultaneously a signal tone sounds. To shift the tracevertically again it will be required to stop rotating the knobfor at least about 2 seconds.
Attention!The dynamic range limits of the A/D converter maybecome visible if a Y-position shift is performed afterstorage. This can affect those signal parts which wereoriginally above or below the screen.
(8) PTR - Pushbutton for PRE and POST Trigger selection.
This function is not available in analog mode.
The PRETRIGGER function is used to capture signals thatoccur prior to a trigger event, making the pre-history visible.In contrast to this function, the POSTTRIGGER is used tocapture signals occurring after the trigger event, whichcould not be captured in 0% Pretrigger condition. Due to thedependence on trigger events, neither function is availablein the trigger independent modes XY and ROLL.
The actual PRE or POSTTRIGGER value is displayed bythe readout and changes, each time the PTR button ispressed, in the following sequence: PT0%, PT25%,PT50%, PT75%, PT100%, PT-75%, PT-50%, PT-25%and back to PT0%. The values refer to the X-axis (graticule)of the screen display (10% = 1div).
The following description assumes that the X magnifier(x10) is inactive and the signal display starts on theleftmost vertical graticule line. It is also assumed that atrigger mode (source, coupling) is chosen, in which thetrigger point symbol is displayed. In contrast to analogmode, using pre-trigger the trigger point symbol can beshifted in X-direction.
PRETRIGGER
0% PRETRIGGER (readout “PT0%”) means that thesignal display starts with the trigger event. The triggerpoint symbol indicates this position. If the X-POS. controlis not in center position, an arrow pointing to the left maybe displayed. Then the X-POS. control must be turnedclockwise until the arrow is no longer visible.
25% PRETRIGGER (readout “PT25%”) is achieved afterpressing the PTR button once. The signal display startswith 25% pre-history and the trigger point symbol isshifted 2.5 divisions to the right.
Each time the PTR button is pressed the PRETRIGGERvalue increases by 25% until 100% is reached. If in 100%condition an arrow symbol is displayed in addition to thetrigger point symbol, the X-POS. control should be turnedccw. to make the trigger point visible on the screen.
The duration of the prehistory is determined by multiplyingthe time coefficient by the pretrigger value (in divisions).E.g. 20ms/div x 7,5 div (= 75% pretrigger) = 150ms.
POSTTRIGGER
In POSTTRIGGER condition the trigger point is always tothe left of the screen and therefore not visible. The triggerpoint symbol then only indicates the LEVEL setting. Anadditional arrow symbol which points to the left is displayedto indicate post trigger operation. In POSTTRIGGERcondition the arrow symbol does not indicate a wrong X-POS. setting. A minus sign (-) placed in front of thepercentage value, is displayed by the readout forPOSTTRIGGER mode indication.
Proceeding from 100% pre-trigger, the instrument swit-ches over to 75% POSTTRIGGER (“PT-75%”) after thePTR button is pressed. Then the trigger point is 7.5 div tothe left of the trace start on the screen. This means thatthe signal capture starts 7.5 x time deflection coefficientafter the trigger event occurred.
Every time the PTR button is pressed the POSTTRIGGERvalue changes in 25% steps until PTR-25% is active.When the PTR button is pressed again, both post and pre-trigger are switched off and the readout indicates “PT0%”.
Attention!In time base settings from 100s/div to 50ms/div the pre-or post-trigger is automatically switched off (“PT0%) ifrefresh (RFR), envelope (ENV) or average (AVM) mode isactive. This is to avoid excessive waiting times.
If the pre- or post-trigger function is required in combinationwith those time coefficients, SINGLE (SGL) mode opera-tion must be used.
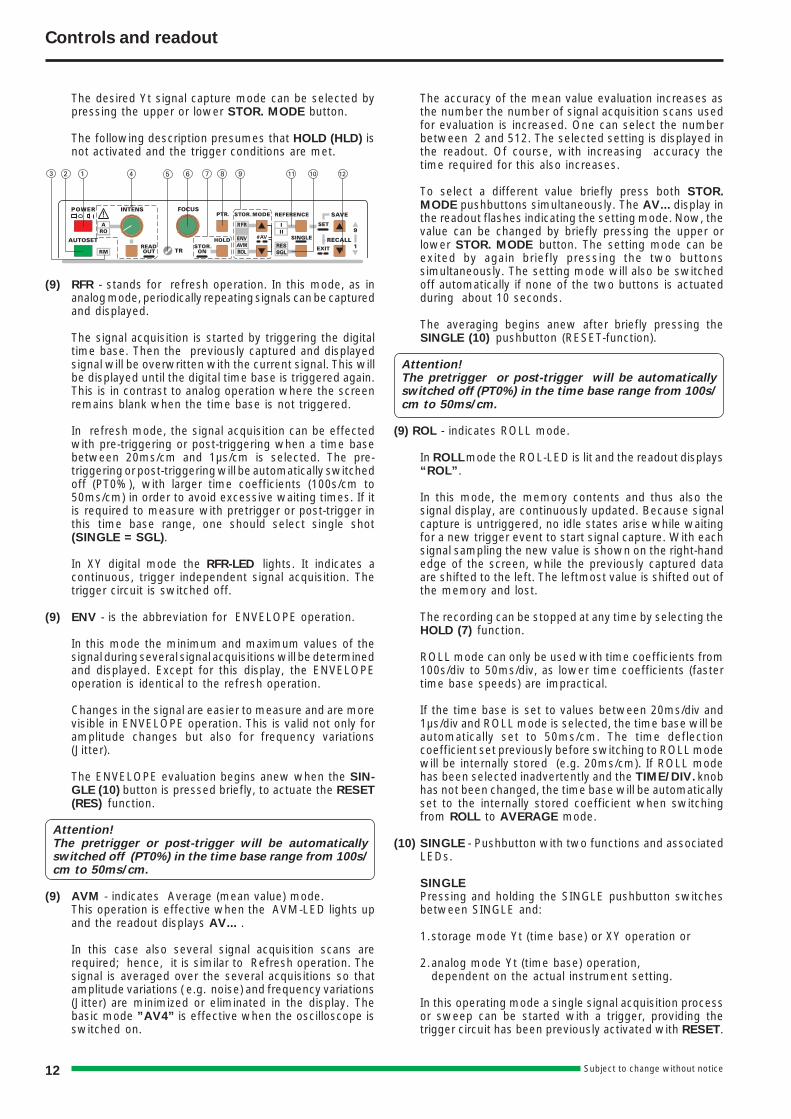
(9) STOR. MODE - Pushbuttons with associated LEDs.
These functions are not available in analog mode.
If digital SINGLE (SGL) mode has not been chosen, oneof the associated LEDs is lit. The signal capture anddisplay mode can be selected by pressing one of thebuttons. The mode setting is indicated by one of the LEDs(RFR, ENV, AVM and ROL) and also displayed by thereadout. The only exception is in XY storage mode. Thenthe RFR-LED is lit and the readout displays XY. No othersignal capture and display mode can be chosen in XYmode.
Controls and readout
12 Subject to change without notice
The desired Yt signal capture mode can be selected bypressing the upper or lower STOR. MODE button.
The following description presumes that HOLD (HLD) isnot activated and the trigger conditions are met.
(9) RFR - stands for refresh operation. In this mode, as inanalog mode, periodically repeating signals can be capturedand displayed.
The signal acquisition is started by triggering the digitaltime base. Then the previously captured and displayedsignal will be overwritten with the current signal. This willbe displayed until the digital time base is triggered again.This is in contrast to analog operation where the screenremains blank when the time base is not triggered.
In refresh mode, the signal acquisition can be effectedwith pre-triggering or post-triggering when a time basebetween 20ms/cm and 1µs/cm is selected. The pre-triggering or post-triggering will be automatically switchedoff (PT0%), with larger time coefficients (100s/cm to50ms/cm) in order to avoid excessive waiting times. If itis required to measure with pretrigger or post-trigger inthis time base range, one should select single shot(SINGLE = SGL).
In XY digital mode the RFR-LED lights. It indicates acontinuous, trigger independent signal acquisition. Thetrigger circuit is switched off.
(9) ENV - is the abbreviation for ENVELOPE operation.
In this mode the minimum and maximum values of thesignal during several signal acquisitions will be determinedand displayed. Except for this display, the ENVELOPEoperation is identical to the refresh operation.
Changes in the signal are easier to measure and are morevisible in ENVELOPE operation. This is valid not only foramplitude changes but also for frequency variations(Jitter).
The ENVELOPE evaluation begins anew when the SIN-GLE (10) button is pressed briefly, to actuate the RESET(RES) function.
Attention!The pretrigger or post-trigger will be automaticallyswitched off (PT0%) in the time base range from 100s/cm to 50ms/cm.
(9) AVM - indicates Average (mean value) mode.This operation is effective when the AVM-LED lights upand the readout displays AV... .
In this case also several signal acquisition scans arerequired; hence, it is similar to Refresh operation. Thesignal is averaged over the several acquisitions so thatamplitude variations ( e.g. noise) and frequency variations(Jitter) are minimized or eliminated in the display. Thebasic mode ”AV4” is effective when the oscilloscope isswitched on.
The accuracy of the mean value evaluation increases asthe number the number of signal acquisition scans usedfor evaluation is increased. One can select the numberbetween 2 and 512. The selected setting is displayed inthe readout. Of course, with increasing accuracy thetime required for this also increases.
To select a different value briefly press both STOR.MODE pushbuttons simultaneously. The AV... display inthe readout flashes indicating the setting mode. Now, thevalue can be changed by briefly pressing the upper orlower STOR. MODE button. The setting mode can beexited by again briefly pressing the two buttonssimultaneously. The setting mode will also be switchedoff automatically if none of the two buttons is actuatedduring about 10 seconds.
The averaging begins anew after briefly pressing theSINGLE (10) pushbutton (RESET-function).
Attention!The pretrigger or post-trigger will be automaticallyswitched off (PT0%) in the time base range from 100s/cm to 50ms/cm.
(9) ROL - indicates ROLL mode.
In ROLL mode the ROL-LED is lit and the readout displays“ROL”.
In this mode, the memory contents and thus also thesignal display, are continuously updated. Because signalcapture is untriggered, no idle states arise while waitingfor a new trigger event to start signal capture. With eachsignal sampling the new value is shown on the right-handedge of the screen, while the previously captured dataare shifted to the left. The leftmost value is shifted out ofthe memory and lost.
The recording can be stopped at any time by selecting theHOLD (7) function.
ROLL mode can only be used with time coefficients from100s/div to 50ms/div, as lower time coefficients (fastertime base speeds) are impractical.
If the time base is set to values between 20ms/div and1µs/div and ROLL mode is selected, the time base will beautomatically set to 50ms/cm. The time deflectioncoefficient set previously before switching to ROLL modewill be internally stored (e.g. 20ms/cm). If ROLL modehas been selected inadvertently and the TIME/DIV. knobhas not been changed, the time base will be automaticallyset to the internally stored coefficient when switchingfrom ROLL to AVERAGE mode.
(10) SINGLE - Pushbutton with two functions and associatedLEDs.
SINGLEPressing and holding the SINGLE pushbutton switchesbetween SINGLE and:
1.storage mode Yt (time base) or XY operation or
2.analog mode Yt (time base) operation,dependent on the actual instrument setting.
In this operating mode a single signal acquisition processor sweep can be started with a trigger, providing thetrigger circuit has been previously activated with RESET.
Controls and readout
13Subject to change without notice
SINGLE automatically switches to normal triggering (NMLED lights up). Otherwise the trigger automatic wouldstart the signal acquisition processes without an input(trigger) signal.
STORAGE MODE ONLYSINGLE mode is indicated by the SGL-LED (lit).If the readout displays additionally the pre- or post-triggervalue (PT...), SINGLE mode in combination with Yt (timebase) storage mode is selected. In connection with XYstorage mode the readout displays the sampling rate (e.g.40MS/s) and replaces the pre- or post-trigger value (PT...)by SGL.
When switched over to SGL, single signal acquisition isin operation. The signal capture currently in progress andnot yet finished will not be terminated but continued tothe end.
Attention!If SINGLE mode is present in combination with DUALmode, the minimum time coefficient is 5µs/div insteadof 1µs/div. Similarly if X-MAG. x10 is operative, then500ns/div replaces 100ns/div.
ANALOG MODE ONLYSelecting SINGLE mode switches the current sweep offand blanks the screen.
SINGLE mode is indicated by the lighting SGL-LED andthe readout displaying SGL next to the / (SLOPE) symbol.
Two signals can be displayed during a single sweep onlywhen it is continuously switched between channel I andchannel II (chopper operation). See DUAL (22).
RESET (RES)Briefly pressing the SINGLE pushbutton causes a RESET.The result depends on the current signal capture mode.
STORAGE MODE ONLY
A:In combination with SINGLE, briefly pressing the SIN-GLE pushbutton activates the RESET function. Then bothLEDs (SGL and RES) are lit. Whether the RES-LEDflashes once or is lit constantly, depends on:
1. the presence or absence of a trigger signal,2. the selected time coefficient (time base) and3. the pre- or post-trigger setting.
After the RESET function is switched on, the signalacquisition will be effective at once if the HOLD functionis not active. If the pretrigger function is active, theprehistory must elapse before the trigger event becomeseffective. The signal capture terminates with the triggerevent only with 100% pretrigger setting.
With all other pretrigger and post-trigger settings, thesignal acquisition is not complete when the trigger occursand will only be terminated later. After termination theRES-LED extinguishes but the signal display remains.Briefly pressing the SINGLE pushbutton (RESET function)again restarts a new single event capture which thenoverwrites the previously recorded display.
Single events recorded in DUAL mode can also bedisplayed in the XY mode when switched over to XYoperation.
Attention!If time coefficients between 100s/div and 50ms/div arepresent the signal acquisition becomes visible at onceas a ROLL display, but the signal acquisition has not-hing to do with ROLL mode.
B:Briefly pressing the SINGLE pushbutton (RESET function)is also effective if (instead of SINGLE) ENVELOPE orAVERAGE mode is selected.
In both modes the evaluation / averaging begins anew.
ANALOG MODE ONLYCapturing single events can also be carried out in analogmode (e.g. photographing).
Briefly pressing the SINGLE pushbutton activates theRES-LED in SINGLE mode. The next trigger event thenunblanks the beam and causes one time base sweep.
(11) REFERENCE - Pushbutton with 2 functions, associatedwith 2 LED’s (only in Yt (time base) storage mode).
The oscilloscope contains 2 non volatile reference memories.One reference signal can be displayed together with theactual signal. The contents of the reference memories arenot erased when the instrument is switched off.
The LEDs associated with the REFERENCE pushbuttonindicate the display of a reference signal and from itsorigin. The reference signal is displayed in addition to theactual signal. With the exception of DUAL mode, there isno direct relationship between the reference memories (I or II) and the channels (I or II).
DisplayBriefly pressing the REFERENCE pushbutton switchesthe reference indicator LEDs and consequently the signaldisplay in the following sequence:
reference memory off -reference memory I -reference memory II -reference memory off.
OverwriteAfter the reference memory has been selected (brieflypressing) press and hold the REFERENCE pushbuttonuntil an acoustical signal indicates that the previouslystored reference signal has been overwritten by theactual signal. During this procedure the instrument canbut must not be set to HOLD (HLD).
In DUAL mode only, REFERENCE memory I relates tochannel I and consequently REFERENCE memory IIrelates to channel II. In this case the overwriting proceduremust be performed twice. At first REFRENCE memory Imust be displayed and then overwritten.Then REFERENCE memory II must be chosen andoverwrittten.
Controls and readout
14 Subject to change without notice
Attention!As the reference signal is stored and displayed in thesame position as the current signal, it is not immediatelynoticeable in most cases.
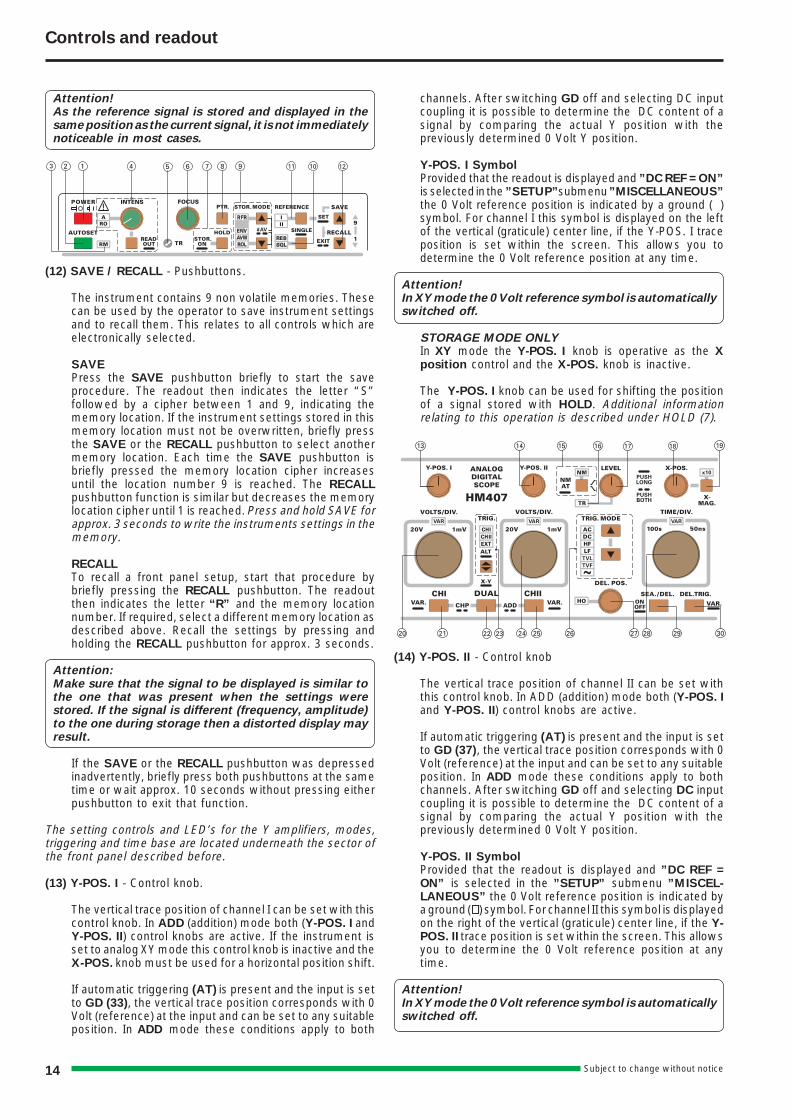
(12) SAVE / RECALL - Pushbuttons.
The instrument contains 9 non volatile memories. Thesecan be used by the operator to save instrument settingsand to recall them. This relates to all controls which areelectronically selected.
SAVEPress the SAVE pushbutton briefly to start the saveprocedure. The readout then indicates the letter “S”followed by a cipher between 1 and 9, indicating thememory location. If the instrument settings stored in thismemory location must not be overwritten, briefly pressthe SAVE or the RECALL pushbutton to select anothermemory location. Each time the SAVE pushbutton isbriefly pressed the memory location cipher increasesuntil the location number 9 is reached. The RECALLpushbutton function is similar but decreases the memorylocation cipher until 1 is reached. Press and hold SAVE forapprox. 3 seconds to write the instruments settings in thememory.
RECALLTo recall a front panel setup, start that procedure bybriefly pressing the RECALL pushbutton. The readoutthen indicates the letter “R” and the memory locationnumber. If required, select a different memory location asdescribed above. Recall the settings by pressing andholding the RECALL pushbutton for approx. 3 seconds.
Attention:Make sure that the signal to be displayed is similar tothe one that was present when the settings werestored. If the signal is different (frequency, amplitude)to the one during storage then a distorted display mayresult.
If the SAVE or the RECALL pushbutton was depressedinadvertently, briefly press both pushbuttons at the sametime or wait approx. 10 seconds without pressing eitherpushbutton to exit that function.
The setting controls and LED’s for the Y amplifiers, modes,triggering and time base are located underneath the sector ofthe front panel described before.
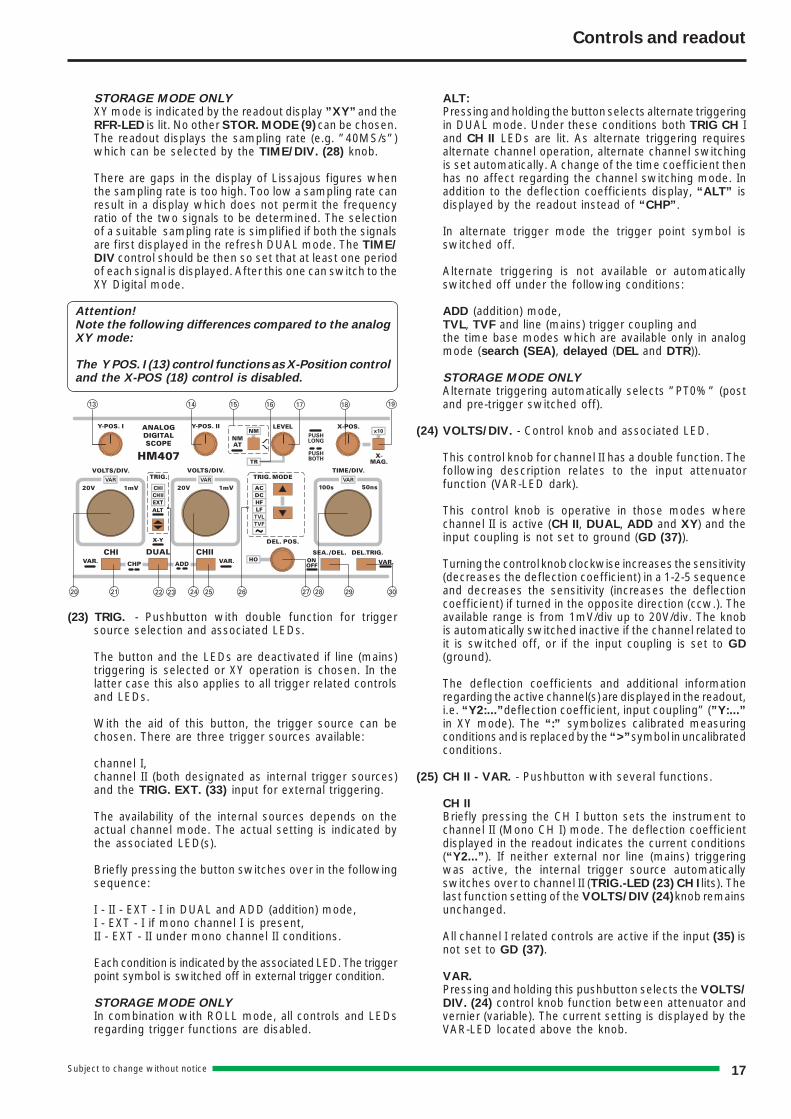
(13) Y-POS. I - Control knob.
The vertical trace position of channel I can be set with thiscontrol knob. In ADD (addition) mode both (Y-POS. I andY-POS. II) control knobs are active. If the instrument isset to analog XY mode this control knob is inactive and theX-POS. knob must be used for a horizontal position shift.
If automatic triggering (AT) is present and the input is setto GD (33), the vertical trace position corresponds with 0Volt (reference) at the input and can be set to any suitableposition. In ADD mode these conditions apply to both
channels. After switching GD off and selecting DC inputcoupling it is possible to determine the DC content of asignal by comparing the actual Y position with thepreviously determined 0 Volt Y position.
Y-POS. I SymbolProvided that the readout is displayed and ”DC REF = ON”is selected in the ”SETUP” submenu ”MISCELLANEOUS”the 0 Volt reference position is indicated by a ground ( )symbol. For channel I this symbol is displayed on the leftof the vertical (graticule) center line, if the Y-POS. I traceposition is set within the screen. This allows you todetermine the 0 Volt reference position at any time.
Attention!In XY mode the 0 Volt reference symbol is automaticallyswitched off.
STORAGE MODE ONLYIn XY mode the Y-POS. I knob is operative as the Xposition control and the X-POS. knob is inactive.
The Y-POS. I knob can be used for shifting the positionof a signal stored with HOLD. Additional informationrelating to this operation is described under HOLD (7).
(14) Y-POS. II - Control knob
The vertical trace position of channel II can be set withthis control knob. In ADD (addition) mode both (Y-POS. Iand Y-POS. II) control knobs are active.
If automatic triggering (AT) is present and the input is setto GD (37), the vertical trace position corresponds with 0Volt (reference) at the input and can be set to any suitableposition. In ADD mode these conditions apply to bothchannels. After switching GD off and selecting DC inputcoupling it is possible to determine the DC content of asignal by comparing the actual Y position with thepreviously determined 0 Volt Y position.
Y-POS. II SymbolProvided that the readout is displayed and ”DC REF =ON” is selected in the ”SETUP” submenu ”MISCEL-LANEOUS” the 0 Volt reference position is indicated bya ground (⊥⊥⊥⊥⊥) symbol. For channel II this symbol is displayedon the right of the vertical (graticule) center line, if the Y-POS. II trace position is set within the screen. This allowsyou to determine the 0 Volt reference position at anytime.
Attention!In XY mode the 0 Volt reference symbol is automaticallyswitched off.
Controls and readout
15Subject to change without notice
STORAGE MODE ONLYThe Y-POS. II knob can be used for shifting the positionof a signal stored with HOLD. Additional informationrelating to this operation are described under HOLD (7).
(15) NM - AT - - Pushbutton with a double function andassociated NM-LED.
The following description assumes that Yt (time base)mode has been chosen.
NM - AT selectionPress and hold the pushbutton to switch over fromautomatic (peak value) to normal triggering (NM-LEDabove the pushbutton lit) and vice versa. If the LED isdark, automatic (peak value) triggering is selected.Whether the peak value detection in automatic triggermode is automatically activated or not, depends on thetrigger coupling setting (TRIG.MODE (26)). The way thetrigger point symbol in the readout responds on differentLEVEL control knob settings indicates the situation:
1.If the trigger symbol can not be shifted in the verticaldirection when a signal is not applied or the signal heightis not sufficient, the peak value detection is active.
2.Under the condition that the trigger point symbol cannotbe shifted in such a way that it leaves the signal displayon the screen, the peak value detection is active.
3.The peak value detection is switched off if the triggerpoint can be set outside the maximum peak values ofthe signal, thus causing an untriggered signal display.
Slope selectionBriefly pressing this pushbutton selects which slope ofthe signal is used for triggering the time base generator.
Each time this pushbutton is briefly pressed, the slopedirection switches from falling edge to rising edge andvice versa. The current setting is displayed in the readoutby a slope symbol.
ANALOG MODE ONLYThe last setting in undelayed time base mode is storedand still active if triggered DELAY (DTR) time base modeis selected. This allows for a different slope setting for thetriggered DELAY (DTR) time base mode.
(16) TR - Trigger indicator LED.
The TR LED is lit in Yt (time base) mode if the triggeringconditions are met. Whether the LED flashes or is litconstantly depends on the frequency of the trigger signal.
(17) LEVEL - Control knob.
Turning the LEVEL knob causes a different trigger pointsetting (voltage). The trigger unit starts the time basewhen the edge of a trigger signal crosses the triggerpoint. In most Yt modes the trigger point is displayed inthe readout by the symbol on the left vertical graticuleline. If the trigger point symbol would overwrite otherreadout information or would be invisible when being setabove or below the screen, the symbol changes and anarrow indicates in which vertical direction the triggerpoint has left the screen.
The trigger point symbol is automatically switched off inthose modes where there is no direct relation betweenthe trigger signal and the displayed signal.
ANALOG MODE ONLYThe last setting in undelayed time base mode is storedand still active if triggered DELAY (DTR) time base modeis selected. This allows for a different level setting for thetriggered DELAY (DTR) time base mode.
STORAGE MODE ONLYIn storage mode the trigger point symbol also indicatesthe post or pre-trigger condition by a horizontal positionshift. Please note PTR (8).
(18) X-POS. - Control knob.
This control knob enables an X position shift of thesignal(s) in Yt (time base) and analog XY mode. Incombination with X magnification x10 (Yt mode) thisfunction makes it possible to shift any part of the signalon the screen.
STORAGE MODE ONLYIn XY mode the X-POS. knob is inoperative. The Y-POS.I (13) must be used for X-position shift.
(19) X-MAG. x10 - Pushbutton and LED.
Each time this pushbutton is pressed the x10 LED locatedabove is switched on or off. If the x10 LED is lit, the signaldisplay in all Yt (time base) modes is expanded 10 fold andconsequently only a tenth part of the signal curve isvisible. The interesting part of the signal can be madevisible with aid of the X-POS. (18) control. As the Xexpansion results in a higher time base speed (lower timedeflection coefficient), all time and frequency relevantinformation in the readout is switched over.
This pushbutton is not operative in XY mode.
ANALOG MODE ONLYThe expansion is 5 fold if the time base is set to 50ns/div.Consequently the lowest time deflection coefficient is10ns/div.
(20) VOLTS/DIV. - Control knob and associated LED.
This control knob for channel I has a double function. Thefollowing description relates to the input attenuatorfunction (VAR-LED dark).
This control knob is operative in those modes wherechannel I is active (CH I, DUAL, ADD and XY) and theinput coupling is not set to ground (GD (33)).
Turning the control knob clockwise increases the sensitivity(decreases the deflection coefficient) in a 1-2-5 sequenceand decreases the sensitivity (increases the deflection
Controls and readout
16 Subject to change without notice
coefficient) if turned in the opposite direction (ccw.). Theavailable range is from 1mV/div up to 20V/div. The knobis automatically switched inactive if the channel related toit is switched off, or if the input coupling is set to GD(ground).
The deflection coefficients and additional informationregarding the active channel(s) are displayed in the readout,i.e. “Y1:...”deflection coefficient, input coupling” (”X:...”in XY mode). The “:” symbolizes calibrated measuringconditions and is replaced by the “>” symbol in uncalibratedconditions.
(21) CH I - VAR. - Pushbutton with several functions.
CH IBriefly pressing the CH I button sets the instrument tochannel I (Mono CH I) mode. The deflection coefficientdisplayed in the readout indicates the current conditions(“Y1...”). If neither external nor line (mains) triggeringwas active, the internal trigger source automaticallyswitches over to channel I (TRIG.-LED (23) CH I lits). Thelast function setting of the VOLTS/DIV (20) knob remainsunchanged.
All channel I related controls are active if the input (31) isnot set to GD (33).
VAR.Pressing and holding this pushbutton selects the VOLTS/DIV. (20) control knob function between attenuator andvernier (variable). The current setting is displayed by theVAR-LED located above the knob.
After switching the VAR-LED (20) on, the deflectioncoefficient is still calibrated. Turning the VOLTS/DIV.(20) control knob counter clockwise reduces the signalheight and the deflection coefficient becomesuncalibrated.
The readout then displays i.e. “Y1>...” indicating theuncalibrated condition instead of “Y1:...”. Pressing andholding the CH I pushbutton again switches the LED off,sets the deflection coefficient into calibrated conditionand activates the attenuator function. The previous verniersetting will not be stored.
The CH I pushbutton can also be pressed simultaneouslywith the DUAL (22) button. Please note item (22).
(22) DUAL - XY - Pushbutton with multiple functions.
DUAL modeBriefly pressing this button switches over to DUALmode. Both deflection coefficients are then displayed.
The previous trigger setting stays as it was, but can bechanged.
All controls related to both channels are active, if theinputs (31) and (35) are not set to GD (33) (37).
Whether alternated or chopped channel switching ispresent depends on the actual time base setting, and isdisplayed in the readout.
ALTdisplayed in the readout, indicates alternate channelswitching. After each time base sweep the instrumentinternally switches over from channel I to channel II andvice versa. This channel switching mode is automaticallyselected if any time coefficient from 200µs/div to 50ns/div is active.
CHPindicates chopper mode, whereby the channel switchingoccurs constantly between channel I and II during eachsweep. This channel switching mode occurs when anytime base setting between 500ms/div and 500µs/div hasbeen chosen. The actual channel switching can be changedto the opposite mode by briefly pressing both CH I (21)and DUAL (22) simultaneously. If afterwards the timecoefficient is changed, the channel switching isautomatically set to the time coefficient related mode.
STORAGE MODE ONLYThe signal acquisition is carried out with both A/Dconverters in the two channel (DUAL) digital mode. Sincethere is no need to switch channels as in analog mode,the readout display shows the signal acquisition modeinstead of ALT or CHP.
ADD modeAddition mode can be selected by briefly pressing theDUAL (22) and CH II (25) pushbuttons simultaneously.Whether the algebraic sum (addition) or the difference(subtraction) of both input signals is displayed, dependson the phase relationship and the INV (37) setting. As aresult both signals are displayed as one signal. For correctmeasurements the deflection coefficients for bothchannels must be equal. Please note “Operating modesof the vertical amplifiers in Yt mode”.
The readout indicates this mode by a “+” sign locatedbetween both channel deflection coefficients. While thetrigger mode is not affected, the trigger point symbol isswitched off.
The Y-position of the signal can be influenced by both Y-POS controls (13) and (14).
XY modeThis mode can be switched on or off by pressing andholding the DUAL button (22).
In XY mode the deflection coefficients are displayed as“X...” for channel I and “Y...” for channel II, followed by“XY”. Consequently INPUT CH I (31) serves as an X-input and INPUT CH II (35) is used for Y-deflection. TheX-MAG x10 (19) function is automatically switched off.The cursor lines may be active, but the trigger point andthe 0 Volt reference symbols are switched off.
ANALOG MODE ONLYAll trigger and time base related controls as well as the Y-POS. I (13) knob are deactivated. For X position alteration,the X-POS. (18) knob can be used.
Controls and readout
17Subject to change without notice
STORAGE MODE ONLYXY mode is indicated by the readout display ”XY” and theRFR-LED is lit. No other STOR. MODE (9) can be chosen.The readout displays the sampling rate (e.g. ”40MS/s”)which can be selected by the TIME/DIV. (28) knob.
There are gaps in the display of Lissajous figures whenthe sampling rate is too high. Too low a sampling rate canresult in a display which does not permit the frequencyratio of the two signals to be determined. The selectionof a suitable sampling rate is simplified if both the signalsare first displayed in the refresh DUAL mode. The TIME/DIV control should be then so set that at least one periodof each signal is displayed. After this one can switch to theXY Digital mode.
Attention!Note the following differences compared to the analogXY mode:
The Y POS. I (13) control functions as X-Position controland the X-POS (18) control is disabled.
(23) TRIG. - Pushbutton with double function for triggersource selection and associated LEDs.
The button and the LEDs are deactivated if line (mains)triggering is selected or XY operation is chosen. In thelatter case this also applies to all trigger related controlsand LEDs.
With the aid of this button, the trigger source can bechosen. There are three trigger sources available:
channel I,channel II (both designated as internal trigger sources)and the TRIG. EXT. (33) input for external triggering.
The availability of the internal sources depends on theactual channel mode. The actual setting is indicated bythe associated LED(s).
Briefly pressing the button switches over in the followingsequence:
I - II - EXT - I in DUAL and ADD (addition) mode,I - EXT - I if mono channel I is present,II - EXT - II under mono channel II conditions.
Each condition is indicated by the associated LED. The triggerpoint symbol is switched off in external trigger condition.
STORAGE MODE ONLYIn combination with ROLL mode, all controls and LEDsregarding trigger functions are disabled.
ALT:Pressing and holding the button selects alternate triggeringin DUAL mode. Under these conditions both TRIG CH Iand CH II LEDs are lit. As alternate triggering requiresalternate channel operation, alternate channel switchingis set automatically. A change of the time coefficient thenhas no affect regarding the channel switching mode. Inaddition to the deflection coefficients display, “ALT” isdisplayed by the readout instead of “CHP”.
In alternate trigger mode the trigger point symbol isswitched off.
Alternate triggering is not available or automaticallyswitched off under the following conditions:
ADD (addition) mode,TVL, TVF and line (mains) trigger coupling andthe time base modes which are available only in analogmode (search (SEA), delayed (DEL and DTR)).
(24) VOLTS/DIV. - Control knob and associated LED.
This control knob for channel II has a double function. Thefollowing description relates to the input attenuatorfunction (VAR-LED dark).
This control knob is operative in those modes wherechannel II is active (CH II, DUAL, ADD and XY) and theinput coupling is not set to ground (GD (37)).
Turning the control knob clockwise increases the sensitivity(decreases the deflection coefficient) in a 1-2-5 sequenceand decreases the sensitivity (increases the deflectioncoefficient) if turned in the opposite direction (ccw.). Theavailable range is from 1mV/div up to 20V/div. The knobis automatically switched inactive if the channel related toit is switched off, or if the input coupling is set to GD(ground).
The deflection coefficients and additional informationregarding the active channel(s) are displayed in the readout,i.e. “Y2:...”deflection coefficient, input coupling” (”Y:...”in XY mode). The “:” symbolizes calibrated measuringconditions and is replaced by the “>” symbol in uncalibratedconditions.
(25) CH II - VAR. - Pushbutton with several functions.
CH IIBriefly pressing the CH I button sets the instrument tochannel II (Mono CH I) mode. The deflection coefficientdisplayed in the readout indicates the current conditions(“Y2...”). If neither external nor line (mains) triggeringwas active, the internal trigger source automaticallyswitches over to channel II (TRIG.-LED (23) CH I lits). Thelast function setting of the VOLTS/DIV (24) knob remainsunchanged.
All channel I related controls are active if the input (35) isnot set to GD (37).
VAR.Pressing and holding this pushbutton selects the VOLTS/DIV. (24) control knob function between attenuator andvernier (variable). The current setting is displayed by theVAR-LED located above the knob.
Controls and readout
18 Subject to change without notice
After switching the VAR-LED (24) on, the deflectioncoefficient is still calibrated. Turning the VOLTS/DIV.(24) control knob counter clockwise reduces the signalheight and the deflection coefficient becomesuncalibrated.
The readout then displays i.e. “Y2>...” indicating theuncalibrated condition instead of “Y2:...”. Pressing andholding the CH II pushbutton again switches the LED off,sets the deflection coefficient into calibrated conditionand activates the attenuator function. The previous verniersetting will not be stored.
The CH II pushbutton can also be pressed simultaneouslywith the DUAL(22) button. Please note item (22).
(26) TRIG. MODEPushbuttons and associated indicator LEDs.
Pressing the upper or lower button selects the triggercoupling. The actual setting is indicated by a TRIG.MODE-LED (26).
Each time the lower TRIG. MODE pushbutton is pressedthe trigger coupling changes in the sequence:
AC DC content suppressed,DC DC content effective (peak value detection inactive),HF high-pass filter cuts off frequencies below
approx. 50kHz (trigger point symbol switched off),LF low-pass filter cuts off frequencies above
approx. 1.5kHz, in combination with automatictriggering AC or normal triggering DC coupled,
TVL TV signal, line pulse triggering,trigger point symbol switched off,
TVF TV signal, frame pulse triggering,trigger point symbol switched off.
~ line/mains triggering, trigger point symboland TRIG. LED (23) are switched off.
In some trigger modes such as alternate triggering, sometrigger coupling modes are automatically disabled andcan not be selected.
(27) DEL.POS.Rotary knob with two functions and related HO-LED.
The DEL.POS. knob functions as a hold off time control,when the time base is not working in the SEA. (SEARCH)or in DEL. (DELAY) mode. The HO-LED is not lit when thehold off time is set to minimum. The HO-LED lights up andthe hold off time increases as the knob is rotated clockwise.A signal sounds on reaching the maximum hold off time.Similarly in the opposite direction until minimum hold offtime is reached (HO-LED extinguishes). The hold off time
is automatically set to minimum when the time base ischanged. (For the application of hold off time setting seethe paragraph with the same heading).
The start of the trace can be set with the DEL.POS.control in the time base modes SEA. (SEARCH) or DEL.(DELAY). See SEA. / DEL. - ON / OFF (29).
STORAGE MODE ONLYThe DEL.POS. control and the HO-LED are disabled,since in this mode the hold off time is set to minimum.The hold off time last used in the analog mode is notsaved. Consequently, the hold off time is set to minimumwhen it is switched back to analog mode.
The DEL.POS. control cannot be used for delay settingsince neither SEA. (SEARCH) nor DEL. (DELAY) timebase operation is available.
(28) TIME/DIV. - Control knob.
The time base is set with this knob in the TIME/DIV. field,and the setting is displayed at the top left in the readout(e.g. ”T:10µs”). This knob acts as the time base stepswitch when the VAR-LED above it is not lit. Then, thetime deflection coefficient can be set in a 1-2-5 sequenceand the time base is calibrated. Rotating anticlockwiseincreases the deflection coefficient and rotating clockwisedecreases the deflection. The control acts as a vernier(fine adjustment) when the VAR-LED is lit.
The following description refers to the function as a timebase switch.
AttentionThe different deflection coefficient ranges between theanalog and digital time bases require special conside-ration when switching between analog and digitalmodes. These are described in section (7).
ANALOG MODE ONLYTime deflection coefficients between 500ms/div. and50ns/div. in a 1-2-5 sequence can be selected without X-MAG. x10 magnification. Time delay between 120ms and200ns can be selected in the ”SEA” (SEARCH) mode.Time deflection coefficient range in the ”DEL” (DELAY)mode extends from 20ms/div. to 50ns/div.
STORAGE MODE ONLYThe time base can be set to deflection coefficientsbetween 100s/div. and 1µs/div in storage mode, if X-MAG x10 is inactive.
(29) SEA./DEL. - ON/OFF pushbuttonThe pushbutton is operative only in analog mode.
This button is used to switch between delayed and undelayedtime base. The delayed time base operation enables amagnified display in X-direction which is otherwise onlypossible with a second time base. Pressing and holding thebutton switches from normal time base mode to SEA.(SEARCH), when currently neither ”SEA” (SEARCH) nor”DEL” (DELAY) operation or ”DTR” (triggered DELAY) iseffective. Afterwards, it can be switched between SEA. andDEL. by briefly pressing the button.
These operating modes are indicated in the readout to theright of the trigger slope indication thus:In case of SEARCH , ”SEA” will be displayed;In untriggered DELAY mode, ”DEL” (DEL.) andin triggered DELAY mode, ”DTR” (DEL.TRIG.).
Controls and readout
19Subject to change without notice
None of these will appear in the readout in undelayed timebase operation.
When ”SEA”, ”DEL” or ”DTR” mode is effective, pressingand holding the button switches over to undelayed timebase.
Provided that neither ”SEA” nor ”DEL” resp. ”DTR” areactive, the following description assumes that:
1.X-MAG. x10 is switched off,2.the trace starts on the left vertical graticule line and3.the part of signal to be expanded must be displayed
within the (horizontal) range 2 up to 6 divisions aftertrace start position.
SEAIn SEA. (SEARCH) mode, the hold off time is automaticallyset to minimum and for the first few divisions the traceis blanked. The trace will then be unblanked. The point atwhich the trace starts can be varied with DEL.POS (fineadjustment) from about 2 to 6 divisions. The blankedsection serves as a guide to the delay time. The delay timeis based on the current time deflection coefficient settingand can also be coarsely set with the TIME/DIV control(range: 20ms to 100ns).
DELPressing the button briefly switches over from ”SEA” to”DEL” (DELAY) mode. Now the trace starts at the leftvertical graticule line, beginning with that part of thesignal that was previously unblanked first when ”SEA”was active. From that position, the signal display can beexpanded in the X-direction by rotating the TIME/DIVcontrol clockwise and thus decreasing the time deflectioncoefficient. If a part of the signal of interest goes beyondthe right edge, it can be brought within the screen andmade visible by DEL.POS knob. Increasing the timedeflection coefficient beyond that used in the ”SEA”(SEARCH) mode is not possible.
In the untriggered ”DEL” (DELAY) mode, a trigger eventdoes not start the trace at once but only starts the delaytime. After the delay time has elapsed the trace is started.
DTRIn triggered DELAY mode (DTR), to start the sweep, asignal suitable for triggering must appear after the delaytime. The trace will be started if the instrument settings(e.g. LEVEL setting) enable a triggering. See DEL.TRIG.- VAR. (30).
(30) DEL.TRIG. - VAR. - Pushbutton with two functionsThe pushbutton is operative only in analog mode.
In the case of untriggered ”DEL” (DELAY) mode (29),briefly pressing the button switches over to ”DTR”(triggered DELAY mode). Thereby, the previously activesettings, Automatic/normal triggering (15), triggerLEVEL (17), trigger slope (15) and trigger coupling(26) will be stored.
The instrument will be automatically switched to normaltriggering (NM) and DC trigger coupling in ”DTR” mode.Subsequently the trigger LEVEL setting and the triggerslope should be so adjusted that the signal for delayedtrigger can trigger the time base. Without triggering thescreen will remain blank.
Briefly pressing the button again switches back to(untriggered) DEL. operation.
VAR.Pressing and holding the pushbutton changes the functionof the TIME/DIV. knob.
The TIME/DIV. knob (28) can function as a time deflectioncoefficient switch (1-2-5 sequence) or as a time vernier(fine adjustment). The current function is indicated by theVAR-LED. The TIME/DIV. knob functions as a vernierwhen the VAR-LED is switched on, but the time basesetting remains calibrated until the (vernier) knob isoperated. The readout now indicates ”T>...” instead of”T:...”. Rotating further anticlockwise increases the timedeflection coefficient (uncalibrated) until the maximum isreached indicated by a beep. Rotating the knob clockwisehas the opposite effect. Now, the vernier is again in thecalibrated position and the symbol ” >” will be replacedby symbol ” :”.
The function of the knob can be switched back to normal(calibrated) time base, pressing and holding the button.
Underneath the front panel sector described above, the BNCsockets and four pushbuttons are located.
(31) INPUT CH I - (HOR. INP. (X)) - BNC socket.
This BNC socket is the signal input for channel I (INPUTCH I). In XY mode, signals at this input are used for the X-deflection. The outer (ground) connection is galvanicallyconnected to the instrument ground and consequently tothe safety earth contact of the line/mains plug.
(32) AC / DC - Pushbutton with two functions.
Input coupling:Briefly pressing this pushbutton switches over from AC(~ symbol) to DC (= symbol) input coupling and vice versa,if the input is not switched to GD (33). The AC/DC settingis displayed in the readout with the deflection coefficient.
Probe factor:Pressing and holding the pushbutton selects the indicateddeflection coefficient of channel I displayed in the readout,between 1:1 and 10:1. In condition 10:1 the probe factoris thus indicated by a probe symbol displayed by thereadout in front the channel information (e.g. “probesymbol”, Y1...). In the case of cursor voltage measu-rement, the probe factor is automatically included.
Controls and readout
20 Subject to change without notice
Please note:The probe symbol should not be activated unless a x10(10:1) attenuator probe is used.
(33) GD - Pushbutton
Each time this pushbutton is pressed briefly, the input isswitched from active to inactive and vice versa. It isdisplayed in the readout as an earth (ground) symbolinstead of the deflection coefficient and the ~ (AC) or =(DC) symbol.
The GD setting disables the input signal, the AC/DC (32)pushbutton and the VOLTS/DIV (20) knob. In automatictrigger mode the undeflected trace is visible representingthe 0 Volt trace position. See Y-POS. I (13).
(34) Ground socket4mm banana socket galvanically connected to safetyearth.
This socket can be used as reference potential connectionfor DC and low frequency signal measurement purposesand in COMPONENT TEST mode.
(35) INPUT CH II - BNC socket.This BNC socket is the signal input for channel II (INPUTCH II). In XY mode, signals at this input are used for theY-deflection. The outer (ground) connection is galvanicallyconnected to the instrument ground and consequently tothe safety earth contact of the line/mains plug.
(36) AC / DC - Pushbutton with two functions.
Input coupling:Briefly pressing this pushbutton switches over from AC(~ symbol) to DC (= symbol) input coupling and vice versa,if the input is not switched to GD (37). The AC/DC settingis displayed in the readout with the deflection coefficient.
Probe factor:Pressing and holding the pushbutton selects the indicateddeflection coefficient of channel II displayed in the readout,between 1:1 and 10:1. In condition 10:1 the probe factoris thus indicated by a probe symbol displayed by thereadout in front the channel information (e.g. “probesymbol”, Y2...). In the case of cursor voltage measu-rement, the probe factor is automatically included.
Please note:The probe symbol should not be activated unless a x10(10:1) attenuator probe is used.
(37) GD - INV. - Pushbutton with two functions.
GDEach time this pushbutton is pressed briefly, the input isswitched from active to inactive and vice versa. It isdisplayed in the readout as an earth (ground) symbolinstead of the deflection coefficient and the ~ (AC) or =(DC) symbol.
The GD setting disables the input signal, the AC/DC (36)pushbutton and the VOLTS/DIV (24) knob. In automatic
trigger mode the undeflected trace is visible representingthe 0 Volt trace position. See Y-POS. II (14).
INV.Pressing and holding this pushbutton switches the channelII invert (INV.) function on or off. The invert “on” conditionis indicated by the readout with a horizontal bar above“Y2” (Yt mode) or ”Y” (XY mode). The invert functioncauses the signal display of channel II to be inverted by180°.
(38) TRIG. EXT. / INPUT (Z) - BNC socket with two functions.
The outer (ground) connection is galvanically connectedto the instrument ground and consequently to the safetyearth contact of the line/mains plug. The input impedanceis approx. 1MΩ II 20pF.
TRIG. EXT.This BNC socket is the external trigger signal input, ifexternal triggering is selected. Briefly pressing the TRIG.(23) pushbutton, until the TRIG. “EXT” -LED (23) is lit,switches the external trigger input active.
The trigger coupling depends on the TRIG. MODE (26)setting.
ANALOG MODE ONLY
Z- InputIf neither COMPONENT TEST nor external trigger coupling(TRIG. EXT.) is chosen, the socket is operative as a Z(trace intensity modulation) input.
High TTL level (positive logic) effects blanking, low levelgives unblanking. No higher voltages than +5 Volt arepermitted.
Below the CRT there are the controls for the readout, thecomponent tester and the squarewave calibrator with theiroutputs.
Please note:The following description of the cursor related controlsassumes that the readout is visible and the componenttester is switched off.
(39) PRINT / MENU - Pushbutton with 2 functions.
STORAGE MODE ONLY
PRINTBriefly pressing the pushbutton starts a documentation(hardcopy) if the following preconditions are met:
1.The oscilloscope must be connected to the externalHAMEG interface HO79-6.
2.The software version installed in HO79-6 should not be< V2.00.
The device used for documentation (e.g. printer, plotter)must be connected with one of the HO79-6 ports. Thedocumentation includes the signal display, the graticule,the measurement parameters and additional informationsuch as oscilloscope type and HO79-6 software version.
Controls and readout
21Subject to change without notice
The PRINT function replaces the actuation of the HO79-6 ”START” pushbutton, which may not be accessible(e.g. rack mount).
For further information please note the HO79-6 manual.ANALOG and DIGITAL MODE
MENUPressing and holding the pushbutton activates the displayof the MAIN MENU. It contains the submenus SETUP,CALBRATE and HO79 if connected.
Once a menu is displayed, the following pushbuttons areof importance:
1.SAVE and RECALL (12) pushbutton.Briefly pressing selects the submenu or an item withinthe submenu.
2.SAVE (12) pushbutton SET function.Pressing and holding the SAVE (12) pushbutton calls(set‘s) the menu or the previously selected item. Inthose cases where the item is marked with ON / OFFthe setting changes from ON to OFF or vice versa.
In some cases the called function is not performed atonce and a warning is displayed to protect from callingthe function inadvertently. Then the function can becalled by pressing and holding the SAVE pushbutton(SET function) again, otherwise if the function wascalled inadvertently the proceeding can be cancelled bypressing the AUTOSET (3) pushbutton.
3.AUTOSET (3) pushbutton.Each time the AUTOSET pushbutton is pressed themenu is switched back one step until MAIN MENU isdisplayed. Then pressing the AUTOSET pushbuttonagain switches the menu operation off and the AUTO-SET is automatically set to the normal function.
(40) ON/OFF - CH I/II - 1/∆∆∆∆∆tPushbutton with several functions.
ON/OFF:Pressing and holding the pushbutton switches both cursorlines on or off. As the cursor lines are part of the readout,they are visible only if the readout is switched on.
CH I/IIThis function is required and available only in DUAL andXY mode in combination with ∆∆∆∆∆V (42) measurement, asit is only in these modes that different deflectioncoefficients (VOLTS/DIV.) may be selected. The probefactor setting (32) (36) is automatically taken into account.
Briefly pressing the button selects between the deflectioncoefficients of channel I and channel II. The measuredresult is displayed by the readout with “∆∆∆∆∆V1...” or “∆∆∆∆∆V2...”.The cursor settings relate to the signal of the selectedchannel.
The position of the active CURSOR line(s), adjustable bythe CURSOR lever (43), can be determined by activatingthe I/II- (42) resp. TRK (41) function.
In XY mode the instrument is automatically set to ∆∆∆∆∆Vmeasurement. In this mode two signals are normally
applied causing an X and a Y deflection. The deflectioncoefficient selected for each channel may be different,thus as in DUAL mode the ∆∆∆∆∆V cursor measurementrequires a channel selection. Under channel I (X signal)measuring condition the cursor lines are displayed asvertical lines and the readout displays “∆∆∆∆∆VX...”. Brieflypressing the pushbutton changes to channel II (Y signal)voltage measurement. Then the cursor lines are displayedas horizontal lines and the readout indicates “∆∆∆∆∆VY...”.
In CH I or CH II mono mode, only one deflection coefficientis present and there is no requirement to select betweendifferent deflection coefficients. Consequently thisfunction is disabled in combination with ∆∆∆∆∆V measurements.
1/∆∆∆∆∆t:Briefly pressing the button selects between time andfrequency measurement, if the ∆∆∆∆∆V function is not present.
In calibrated time base condition the readout displays“∆∆∆∆∆t:...” if time measurement is chosen. After brieflypressing the pushbutton “f:...” (frequency) is displayed.If the time base is uncalibrated the readout displays“∆∆∆∆∆t>...” or “f<...”.
Attention!Time and frequency measurements are not possible inXY operation, since in this mode the time base isswitched off.
(41) TRK - CURSOR - Track function.
Briefly pressing simultaneously both buttons ON/OFF -CH I/II - 1/∆∆∆∆∆t (40) and I/II - ∆∆∆∆∆V/∆∆∆∆∆t (42) switches overfrom single cursor line operation to track mode and viceversa.
In TRK (track) mode both cursor lines are indicated asactive (both dotted lines uninterrupted).
(42) I/II - ∆∆∆∆∆V / ∆∆∆∆∆t - Pushbutton with two functions.
I/II:Briefly pressing this button changes the active (control-lable) cursor in the sequence I - II - I, if TRK (track) modeis not active. The active cursor is indicated by a continuouslydotted line. An interrupted dotted line indicates theinactive cursor.
∆∆∆∆∆V / ∆∆∆∆∆t:Pressing and holding this pushbutton changes from voltageto time (or frequency) measurement and vice versa. In XYmode the instrument is automatically set to ∆∆∆∆∆V, as thetime base is disabled and consequently time or frequencymeasurements can not be performed.
∆∆∆∆∆V:
Please note!In all ∆∆∆∆∆V (voltage) measurement conditions, the divisionratio of the probe(s) must be taken into account. Thevoltage value displayed in the readout must bemultiplied by 100 if e.g. a x100 (100:1) probe is used. Incase of x10 (10:1) probes, the probe factor can beautomatically included (see item (32) and (36)).
item 1:Time base mode (CH I or CH II single channel mode,DUAL and ADD). In the voltage measurement condition,the cursors are displayed as horizontal lines and the resultis displayed in the readout.
Controls and readout
22 Subject to change without notice
Single channel mode (channel I or channel II)The ∆∆∆∆∆V measuring result is automatically related to thedeflection coefficient of the active channel. The readoutdisplays “∆∆∆∆∆V1...” or “∆∆∆∆∆V2...”.
Dual modeThe CURSOR lines must be set on the channel I orchannel II signal. As the deflection coefficients may bedifferent, it will be required to select between the deflectioncoefficients of channel I and II. Please note item CH I/II(40).
Addition (ADD) modeIn ADD (addition) mode normally two input signals aredisplayed as one signal (sum or difference). As the resultcan only be determined if both (calibrated) deflectioncoefficients are equal, the CH I/II (40) selection functionis deactivated. In that case the readout indicates “∆∆∆∆∆V...”without any additional channel information. Differentdeflection coefficient settings or uncalibrated deflectioncoefficient(s) are indicated in the readout as “Y1<>Y2”.
item 2: XY modeIn XY mode the instrument is automatically set to ∆∆∆∆∆Vmeasurement. The deflection coefficient selected foreach channel may be different, thus as in DUAL mode the∆∆∆∆∆V cursor measurement requires a channel selection.Under channel I (X signal) measuring condition the cursorlines are displayed as horizontal lines and the readoutdisplays “∆∆∆∆∆VX...”. Briefly pressing the CH I/II (40)pushbutton selects channel II (Y signal) measuring. Thenthe cursor lines are displayed as vertical lines and thereadout indicates “∆∆∆∆∆VY...”.
∆∆∆∆∆t:In time or frequency measurement condition two verticalcursor lines are displayed. The measurement result isindicated as “∆∆∆∆∆t...” (time measurement) or “f...”(frequency measurement). Please note item (40) 1/∆t.
NOTE:For frequency measurement, the distance between thecursors must equal exactly one signal period.
In XY mode the time base is switched off. Consequentlytime or frequency measurement is disabled.
(43) CURSOR - Center biased lever
The active cursor line (in track mode: both lines) can beshifted in the required direction, until the graticule limitsare reached. The directions are marked on the front paneland depend on the selected measurement (∆∆∆∆∆V, ∆∆∆∆∆t or 1/∆∆∆∆∆t = f).
Which of two shift speeds is used, depends on how farthe CURSOR knob is pressed. With slight knob pressurethe cursor line(s) moves slowly. If the knob is pressed tothe full extent the cursor moves fast.
(44) CAL. - Pushbutton and concentric socket.
A squarewave signal of 0.2Vpp ±1% is available from thesocket for probe adjustment purposes.
The signal frequency depends on the pushbutton setting.
If the pushbutton is released it is approx. 1kHz and can beswitched over (depressed) to approx. 1MHz. The pulseduty factor may deviate from 1:1 and the frequency is notcalibrated.
(45) CT - Pushbutton and banana jack.Pressing the pushbutton switches the instrument overfrom oscilloscope to component test mode and viceversa.
In component test mode, all controls are deactivated withthe exception of the CT button, AUTOSET (2) andINTENS (4). All LEDs except “A” or “RO” (associatedwith the INTENS knob) are dark. The readout displaysonly “CT” in this condition.
One test lead is connected to the CT socket. The secondtest lead uses the ground socket (34). Please note“Component Tester”.
The maximum test voltage is approx. 20Vpp under opencircuit conditions, while the max. test current under shortcircuit condition is approx. 20mApp.
Menu
The instrument software contains several menus. The controlsregarding the menus are described under item (39) PRINT /MENU in section “Controls and Readout”.
The following menus, submenus and items within thesubmenus are available:
1. MAIN MENU
1.1 CALIBRATEInformation regarding this can be found in the section ”ServiceInstructions” item ”Adjustments”.
1.2 SETUPThis menu allows changes to the default settings regarding theinstrument behavior during operation. The SETUP menu containsthe submenus ”MISCELLANEOUS” and ”FACTORY”.
1.2.1 MISCELLANEOUS contains:
1.2.1.1 CONTROL BEEP ON/OFF.In OFF condition the acoustic signals actuated by the controllimits are switched off.
Note:The default setting is ON. If different conditions arerequired the setting must be performed each time afterswitching the oscilloscope on.
1.2.1.2 ERROR BEEP ON/OFF.Acoustic signals indicating faulty control operation aresuppressed in OFF condition.
Note:The default is ON. If different conditions are requiredthe setting must be performed each time after switchingthe oscilloscope on.
1.2.1.3 QUICK START ON/OFF.In condition ON the HAMEG logo and the menus will not bedisplayed after switching the instrument on. Then theinstrument is quickly ready for operation. To change fromQUICK START OFF to ON, press and hold the AUTOSETbutton when switching the instrument on until the menusbecome visible and change the setting from ON to OFF.
Menu
23Subject to change without notice
1.2.1.4 DC REF ON/OFF.If ON is selected and Yt (time base) mode is present, thereadout displays a ground symbol (⊥⊥⊥⊥⊥). This symbol eases theevaluation and determination of DC contents by indicating the0 Volt reference position.
1.2.1.5 TRIG SYMBOL ON/OFF.In most of the Yt (time base) modes the readout displays a triggerpoint symbol which will not be displayed in condition OFF.
1.2.2 FACTORY contains
1.2.2.1 LOAD S/R DEFAULT (S/R = SAVE/RECALL).This overwrites all SAVE/RECALL memories with the followinginstrument setting: Single channel operation (“Y1:500mV~”),time base (“T:100µs”), automatic peak value triggering andAC trigger coupling.
1.2.2.2 RESTORE FACTORY DEFAULT.If inadvertently an adjustment was performed in CALIBRATEMENU condition, which was not stored by OVERWRITEFACTORY DEFAULT, the factory adjustments can be recalledby this function.
1.2.2.3 OVERWRITE FACTORY DEFAULT.
Attention!Calling this function causes the factory adjustments tobe overwritten by new data. The factory adjustmentthen is lost and can not be recalled by RESTOREFACTORY DEFAULT.
This function is only intended for those cases in whichan adjustment can be performed with very expensive”0% error” calibrators, to adjust the instrument foroptimum tolerance when operated under extreme en-vironmental conditions.
1.3 HO79This information will only be displayed if the interface HO79-6 is connected to the oscilloscope. For further informationplease note the HO79-6 manual which is supplied with theinterface.
First Time Operation
The following text assumes that the “SAFETY” section of thismanual has been read carefully and understood.
Each time before the instrument is put into operation check thatthe oscilloscope is connected to protective earth. For that reasonthe power cable must be connected to the oscilloscope and thepower outlet. Then the test lead(s) must be connected to theoscilloscope input(s). Check that the device under test is switchedoff and connect the test lead(s) to the test point(s). Then switchon the instrument and afterwards the device under test.
The oscilloscope is switched on by depressing the red POWERpushbutton. After a few seconds the HAMEG logo and theinstrument software release is displayed on the screen. Aslong as the HAMEG logo is visible different internal checks aremade. Thereafter the instrument will revert to its last usedoperating mode.
If after approx. 20 seconds no trace is visible, the AUTO SETpushbutton should be pressed briefly. This selects the Ytmode and medium trace and readout intensity (please note“AUTO SET”). Adjust Y-POS.I and X-POS. controls to centerthe baseline. Adjust INTENS. (intensity) and FOCUS controlsfor medium brightness and optimum sharpness (input(s)grounded) of the trace. The oscilloscope is now ready for use.
If the AUTO SET function was not used and only a spotappears (CAUTION! CRT phosphor can be damaged), reducethe intensity immediately and check that the XY mode is notselected (XY not displayed in the readout).
To obtain the maximum life from the cathode-ray tube, theminimum intensity setting necessary for the measurement inhand and the ambient light conditions should be used.
Particular care is required when a single spot is displayed, asa very high intensity setting may cause damage to thefluorescent screen of the CRT. Switching the oscilloscope offand on at short intervals stresses the cathode of the CRT andshould therefore be avoided.
The instrument is so designed that even incorrect operationwill not cause serious damage.
Trace Rotation TR
In spite of Mumetal-shielding of the CRT, effects of the earth’smagnetic field on the horizontal trace position cannot becompletely avoided. This is dependent upon the orientation ofthe oscilloscope on the place of work. A centered trace maynot align exactly with the horizontal center line of the graticule.A few degrees of misalignment can be corrected by apotentiometer accessible through an opening on the frontpanel marked TR.
Probe compensation and use
To display an undistorted waveform on an oscilloscope, theprobe must be matched to the individual input impedance ofthe vertical amplifier.
For this purpose a square wave signal with a very fast rise timeand minimum overshoot should be used, as the sinusoidalcontents cover a wide frequency range.
The built-in calibration generator provides a square wave signalwith a very fast risetime (<4ns), and switch-selectablefrequencies of approx. 1kHz and 1MHz from the output socketbelow the CRT screen.
As the squarewave signals are used for probe compensationadjustments, neither the frequency accuracy nor the pulseduty factor are of importance and therefore not specified.
The output provides 0.2Vpp ±1% (tr <4ns) for 10:1 probes.When the Y deflection coefficient is set to 5mV/div, thecalibration voltage corresponds to a vertical display of 4divisions (10:1 probe).
The output socket has an internal diameter of 4.9mm toaccommodate the internationally accepted shielding tubediameter of modern Probes and F-series slimline probes. Onlythis type of construction ensures the extremely short groundconnections which are essential for an undistorted waveformreproduction of non-sinusoidal high frequency signals.
Adjustment at 1kHz
The C-trimmer adjustment (low frequency) compensates thecapacitive loading on the oscilloscope input. By this adjustment,the capacitive division assumes the same ratio as the ohmicvoltage divider to ensure the same division ratio for high andlow frequencies, as for DC. (For 1:1 probes or switchableprobes set to 1:1, this adjustment is neither required norpossible). A baseline parallel to the horizontal graticule lines isessential for accurate probe adjustments. (See also “Tracerotation TR”).
First Time Operation
24 Subject to change without notice
Connect the probes (Types HZ51, 52, 54, or HZ36) to the CHI input. Set the deflection coefficient to 5mV/div and the inputcoupling to DC. The time deflection coefficient should be setto 0.2ms/div. All deflection coefficients should be calibrated.Plug the probe tip into the calibrator output socket.
Approximately 2 complete waveform periods are displayed onthe CRT screen. The compensation trimmer should be adjusted.The location of the low frequency compensation trimmer canbe found in the probe information sheet. Adjust the trimmerwith the insulated screw driver provided, until the tops of thesquare wave signal are exactly parallel to the horizontal graticulelines (see 1kHz diagram). The signal height should then be 4div± 0.16div (= 4% (oscilloscope 3% and probe 1%). During thisadjustment, the signal edges will remain invisible.
Adjustment at 1MHz
Probes HZ51, 52 and 54 can also be HF-compensated. Theyincorporate resonance de-emphasing networks (R-trimmer inconjunction with inductances and capacitors) which permitprobe compensation in the range of the upper frequency limitof the vertical oscilloscope amplifier. Only this compensativeadjustment ensures optimum utilization of the full bandwidth,together with constant group delay at the high frequency end,thereby reducing characteristic transient distortion near theleading edge (e.g. overshoot, rounding, ringing, holes orbumps) to an absolute minimum.
Using the probes HZ51, 52 and 54, the full bandwidth of theoscilloscope can be utilized without risk of unwanted waveformdistortion.
Prerequisite for this HF compensation is a square wavegenerator with fast risetime (typically 4ns), and low outputimpedance (approx. 50Ω), providing 0.2V at a frequency ofapprox. 1MHz. The calibrator output of this instrument meetsthese requirements when the CAL. pushbutton is depressed.
Connect the probe to CH.I input. Depress the CAL. pushbuttonfor 1MHz. Operate the oscilloscope as described under 1kHzbut select for 0.2µs/div time deflection coefficient setting.
Insert the probe tip into the output socket. A waveform will bedisplayed on the CRT screen, with leading and trailing edgesclearly visible. For the HF-adjustment now to be performed, itwill be necessary to observe the rising edge as well as theupper left corner of the pulse top. The location of the highfrequency compensation trimmer(s) can also be found in theprobe information sheet. These R-trimmer(s) have to beadjusted such that the beginning of the pulse is as straight aspossible. Overshoot or excessive rounding are unacceptable.The adjustment is relatively easy if only one adjusting point ispresent. In case of several adjusting points the adjustment isslightly more difficult, but causes a better result. The risingedge should be as steep as possible, with a pulse top remainingas straight and horizontal as possible.
After completion of the HF-adjustment, the signal amplitudedisplayed on the CRT screen should have the same value asduring the 1kHz adjustment.
Probes other than those mentioned above, normally have alarger tip diameter and may not fit into the calibrator output.Whilst it is not difficult for an experienced operator to build asuitable adapter, it should be pointed out that most of theseprobes have a slower risetime with the effect that the totalbandwidth of scope together with probe may fall far below thatof the oscilloscope. Furthermore, the HF-adjustment featureis nearly always missing so that waveform distortion can notbe entirely excluded. The adjustment sequence must befollowed in the order described, i.e. first at 1kHz, then at1MHz. The calibrator frequencies should not be used for timebase calibration. The pulse duty cycle deviates from 1:1 ratio.Prerequisites for precise and easy probe adjustments, as wellas checks of deflection coefficients, are straight horizontalpulse tops, calibrated pulse amplitude, and zero-potential atthe pulse base. Frequency and duty cycle are relatively uncritical.For interpretation of transient response, fast pulse risetimesand low-impedance generator outputs are of particularimportance.
Providing these essential features, as well as switch-selectableoutput-frequencies, the calibrator of the instrument can, undercertain conditions, replace expensive squarewave generatorswhen testing or compensating wideband-attenuators or -amplifiers. In such a case, the input of an appropriate circuit willbe connected to the CAL.-output via a suitable probe.
The voltage provided at a high-impedance input (1MΩ II 15-30pF) will correspond to the division ratio of the probe used(10:1 = 20mVpp output). Suitable probes are HZ51, 52, and 54.
Operating modes of the verticalamplifiers in Yt mode
The most important controls regarding the operation modes ofthe vertical amplifiers are the pushbuttons: CH I (21), DUAL(22) and CH II (25). Their functions are described in the section“ Controls and readout”.
In most cases oscilloscopes are used to display signals in Ytmode. Then the signal amplitude deflects the beam in verticaldirection while the time base causes an X deflection (from leftto right) at the same time. Thereafter the beam becomesblanked and fly back occurs.
The following Yt operation modes are available:Single channel operation of channel I (Mono CH I).Single channel operation of channel II (Mono CH II).Two channel operation of channel I and channel II (DUAL).Two channel operation of channel I and channel II -displayingthe algebraic result as the sum or difference - (ADD).
The way the channel switching is determined in DUAL modedepends on the time base setting and is described in thesection “Controls and readout”.
In ADD mode the signals of both channels are algebraicallyadded and displayed as one signal. Whether the resultingdisplay shows the sum or difference is dependent on thephase relationship or the polarity of the signals and on theinvert function.
In ADD mode the following combinations are possible for
In-phase input voltages: No invert function active = sum. Channel II invert function active = difference.
First Time Operation
25Subject to change without notice
Antiphase input voltages: No invert function active = difference. Channel II invert function active = sum.
In the ADD mode the vertical display position is dependentupon the Y-POS. setting of both channels. The same Ydeflection coefficient is normally used for both channels withalgebraic addition.
Please note that the Y-POS. settings are also added but are notaffected by the INV setting.
Differential measurement techniques allow direct measure-ment of the voltage drop across floating components (bothends above ground). Two identical probes should be used forboth vertical inputs. In order to avoid ground loops, use aseparate ground connection and do not use the probe groundleads or cable shields.
X-Y Operation
The important control for this mode is the pushbutton labeledDUAL and XY (22). The following description refers to the XYanalog mode.
In XY mode the time base is deactivated. The signal applied tothe input of channel I - front panel marking HOR. INP. (X) -causes the X deflection. The input related controls (AC/DC,GD pushbutton and the VOLTS/DIV knob) consequentlyaffect the X deflection. For X position alteration, the X-POS.control knob must be used, as the Y-POS. I control isautomatically inactivated. The input deflection coefficient rangesare the same for both channels, because the X-MAG x10function is inactive in XY mode.
The bandwidth of the X amplifier, is lower than the Y amplifierand the phase angle which increases with higher frequencies,must be taken into account (please note data sheet).
The inversion of the X-input signal is not possible.
Lissajous figures can be displayed in the X-Y mode for certainmeasuring tasks:
• Comparing two signals of different frequency or bringingone frequency up to the frequency of the other signal. Thisalso applies for whole number multiples or fractions of theone signal frequency.
• Phase comparison between two signals of the samefrequency.
Phase comparison with Lissajous figures
The following diagrams show two sine signals of the samefrequency and amplitude with different phase angles.
Calculation of the phase angle or the phase shift between theX and Y input voltages (after measuring the distances a and bon the screen) is quite simple with the following formula, anda pocket calculator with trigonometric functions. Apart fromthe reading accuracy, the signal height has no influence on theresult.
The following must be noted here:• Because of the periodic nature of the trigonometric functions,
the calculation should be limited to angles ≤90°. Howeverhere is the advantage of the method.
• Due to phase shift, do not use a too high test frequency.• It cannot be seen as a matter of course from the screen
display if the test voltage leads or lags the referencevoltage. A CR network before the test voltage input of theoscilloscope can help here. The 1 MΩ input resistance canequally serve as R here, so that only a suitable capacitor Cneeds to be connected in series. If the aperture width of theellipse is increased (compared with C short-circuited), thenthe test voltage leads the reference voltage and vice versa.This applies only in the region up to 90° phase shift.Therefore C should be sufficiently large and produce only arelatively small just observable phase shift.
Should both input voltages be missing or fail in the X-Ymode, a very bright light dot is displayed on the screen.This dot can burn into the phosphor at a too highbrightness setting (INTENS. knob) which causes eithera lasting loss of brightness, or in the extreme case,complete destruction of the phosphor at this point.
Phase difference measurementin DUAL mode (Yt)
Phase differences between two input signals of the samefrequency and shape can be measured very simply on thescreen in Dual mode. The time base should be triggered by thereference signal (phase position 0). The other signal can thenhave a leading or lagging phase angle. In alternate triggeringcondition, phase difference measurement is not possible. Forgreatest accuracy adjust the time base for slightly over oneperiod and approximately the same height of both signals onthe screen. The Y deflection coefficients, the time basecoefficients and the trigger level setting can be used for thisadjustment, without influence on the result. Both base linesare set onto the horizontal graticule center line using the Y-POS. knobs before the measurement. With sinusoidal signals,observe the zero (crossover point) transitions; the sine peaksare less accurate. If a sine signal is noticeably distorted by evenharmonics, or if a DC voltage is present, AC coupling isrecommended for both channels. If it is a question of pulsesof the same shape, read off at steep edges.
It must be noted that the phase difference cannot be determinedif alternate triggering is selected.
Phase difference measurement in DUAL mode
t = horizontal spacing of the zero transitions in divT = horizontal spacing for one period in div
Operating modes of the vertical amplifiers in Yt mode
26 Subject to change without notice
In the example illustrated, t = 3div and T = 10div The phasedifference in degrees is calculated from
or expressed in radians
Relatively small phase angles at not too high frequencies canbe measured more accurately in the X-Y mode with Lissajousfigures.
Measurement of an amplitude modulation
The momentary amplitude u at time t of a HF-carrier voltage,which is amplitude modulated without distortion by a sinusoidalAF voltage, is in accordance with the equation
The lower side frequency F-f and the upper side frequency F+farise because of the modulation apart from the carrier frequency F.
Figure 1Amplitude and frequency spectrum for AM display (m = 50%)
The display of an amplitude-modulated HF oscillation can beevaluated with the oscilloscope provided the frequencyspectrum is inside the oscilloscope bandwidth. The time baseis set so that several cycles of the modulation frequency arevisible. Strictly speaking, triggering should be external withmodulation frequency (from the AF generator or a demodulator).However, internal triggering is frequently possible with normaltriggering using a suitable trigger level setting and possibly alsousing the time vernier (variable) adjustment.
Figure 2Amplitude modulated oscillation: F = 1MHz; f = 1kHz;m = 50%; UT = 28.3 mVrms
Oscilloscope setting for a signal according to figure 2:
• Y: CH. I; 20mV/div; AC.• TIME/DIV.: 0.2ms/div.
• Triggering: Normal; with LEVEL-setting; internal(or external) triggering.
If the two values a and b are read from the screen, themodulation factor is calculated from
where a = UT (1+m) and b = UT (1-m).
The variable controls for amplitude and time can be setarbitrarily in the modulation factor measurement. Their positiondoes not influence the result.
Triggering and time base
All controls regarding trigger and time base are located on theright of the VOLTS/DIV. knobs. They are described in thesection “Controls and readout”.
Time related amplitude changes on a measuring signal (ACvoltage) are displayable in Yt-mode. In this mode the signalvoltage deflects the beam in vertical direction (Y) while thetime base generator moves the beam from the left to the rightof the screen (time deflection = t).
Normally there are periodically repeating waveforms to bedisplayed. Therefore the time base must repeat the timedeflection periodically too. To produce a stationary display, thetime base must only be triggered if the signal height and slopecondition coincide with the former time base start conditions.A DC voltage signal can not be triggered as it is a constantsignal with no slope.
Triggering can be performed by the measuring signal itself(internal triggering) or by an external supplied but synchronousvoltage (external triggering).
The trigger voltage should have a certain minimum amplitude.This value is called the trigger threshold. It is measured witha sine signal. Except when external trigger is used the triggerthreshold can be stated as vertical display height in div, atwhich the time base generator starts, the display is stable, andthe trigger indicator LED lights or flashes.
The internal trigger threshold of the oscilloscope is given as £5div. When the trigger voltage is externally supplied, it can bemeasured in Vpp at that input. Normally, the trigger thresholdmay be exceeded up to a maximum factor of 20.
The instrument has two trigger modes, which are characterizedas Automatic Peak and Normal triggering.
Automatic Peak (value) -Triggering
Instrument specific information’s can be drawn from theitems NM - AT - (15) and LEVEL (17) in the section“Controls and readout”.
This trigger mode is automatically selected after the AUTO-SET pushbutton was pressed. As the peak value detectionmakes no sense in combination with DC and TV (television)signals, it is switched off automatically in DC, TVL and TVFtrigger coupling conditions as well as in alternate trigger mode.In this case the automatic is still present, but a wrong triggerlevel setting causes an untriggered display.
In automatic trigger mode the sweep generator can runwithout test signal or external trigger voltage. A base line willalways be displayed even with no signal. With an applied ACsignal the peak value triggering enables the user to select the
Triggering and time base
27Subject to change without notice
voltage point on the trigger signal (trigger point), by theadjustment of the trigger level control. The control rangedepends on the peak to peak value of the signal. This triggermode is therefore called Automatic Peak (Value)- Triggering.Operation of the scope needs only correct amplitude and timebase settings, for a constantly visible trace. Automatic modeis recommended for all uncomplicated measuring tasks.However, automatic triggering is also the appropriate operationmode for the “entry” into difficult measuring problems, e.g.when the test signal is unknown relating to amplitude, frequencyor shape. Presetting of all parameters is now possible withautomatic triggering; the change to normal triggering canfollow thereafter.
The automatic triggering works above 20Hz. The failure ofautomatic triggering at frequencies below 20Hz is abrupt.However, it is not signified by the trigger indicator LED this is stillblinking. Break down of triggering is best recognizable at the leftscreen edge (the start of the trace in differing display height).
The automatic peak (value) triggering operates over all variationsor fluctuations of the test signal above 20Hz. However, if thepulse duty factor of a square-wave signal exceeds a ratio of100:1, switching over to normal triggering will be necessary.Automatic triggering is practicable with internal and externaltrigger voltage.
Normal Triggering
Information specific to the instrument are given in the articlesNM - AT (15), LEVEL (17) and TRIG. MODE (26) in the section”Controls and readout”. The time fine adjustment (VAR.) andthe hold off time setting assist in triggering under speciallydifficult signal conditions. The following description refers tothe Yt (time base) analog mode.
With normal triggering, the sweep can be started by AC signalswithin the frequency range defined by the trigger couplingsetting.
In the absence of an adequate trigger signal or when the triggercontrols (particularly the trigger LEVEL control) are misadjusted,no trace is visible, i.e. the screen completely blanked.
When using the internal normal triggering mode, it is possibleto trigger at any amplitude point of a signal edge, even withvery complex signal shapes, by adjusting the trigger LEVELcontrol. If the signal applied at the Y input is used for triggering(internal trigger source), its adjusting range is directly dependenton the display height, which should be at least 0.5div. If it issmaller than 1div, the trigger LEVEL adjustment needs to beoperated with a sensitive touch. In the external normal triggeringmode, the same applies to approx. 0.3Vpp external triggervoltage amplitude.
Other measures for triggering of very complex signals are theuse of the time base variable control and HOLD OFF timecontrol, hereinafter mentioned.
(Slope)
Please note item (15) in section “Controls and readout” forinstrument specific information.
The actual slope setting is displayed in the readout. The settingis not changed by the AUTOSET function. The slope settingcan be changed in delay mode for the delay time base triggerunit if the delay trigger function is active. The previous slopesetting for the undelayed time base trigger is stored and stillactive. For further information please note “Controls andreadout”.
The time base generator can be triggered by a rising or fallingedge of the test signal. Whether the rising or the falling edgeis used for triggering, depends on the slope direction setting.This is valid with automatic and normal triggering. The positiveslope direction means an edge going from a negative potentialand rising to a positive potential. This has nothing to do withzero or ground potential and absolute voltage values. Thepositive slope may also lie in a negative part of a signal.However the trigger point may be varied within certain limitson the chosen edge using the LEVEL control. The slopedirection is always related to the input signal and the noninverted display.
Trigger coupling
Instrument specific information regarding this item can benoted in the “Data Sheet”. The coupling setting ( TRIG. MODE(26)) and indication are described under “Controls and readout”.
As the automatic triggering does not work below 20Hz, normaltriggering should be used in DC and LF trigger coupling mode.The coupling mode and accordingly the frequency range of thetrigger signal should meet the signal requirements.
AC: This is the most frequently used trigger mode. Thetrigger threshold increases below and above thefrequency limits mentioned in the data sheet. This filtercuts off both the DC content of the trigger signal and thelowest frequency range.
DC: In this coupling mode the trigger signal is coupledgalvanically to the trigger unit. Therefore there is no lowfrequency limit.
DC triggering is recommended if the signal is to betriggered with quite slow processes or if pulse signalswith constantly changing pulse duty factors have to bedisplayed.
HF: In this coupling mode the transmission range equals ahigh pass filter. It cuts off the DC content of the triggersignal and the lower frequency range.
LF: LF trigger coupling has a low pass filter characteristic. Asin DC trigger coupling, there is no low limit for the passfrequency range (galvanic coupling) in connection withnormal triggering. The trigger signal is coupled througha capacitor in the automatic (peak value) triggering andLF trigger coupling. This results in a low frequency limitwhich , however, does not disturb as the limit is belowthe repetition frequency of the trigger automatic.
The LF trigger coupling is often more suitable for lowfrequency signals than DC trigger coupling because thenoise components of the trigger signals are stronglysuppressed. This avoids or reduces , under borderlineconditions, jitter or double traces especially with verylow signal voltages. The trigger threshold raisescontinuously above the pass band.
TV-L: The built-in active TV-Sync-Separator provides theseparation of line sync pulses from the video signal. Evendistorted video signals are triggered and displayed in astable manner. This mode is described under paragraph“Triggering of video signals”.
TV-F: The built-in active TV-Sync-Separator also provides theseparation of frame sync pulses from the video signal.Even distorted video signals are triggered and displayedin a stable manner. This mode is described underparagraph “Triggering of video signals”.
Triggering and time base
28 Subject to change without notice
Triggering of video signals
In TV-L and TV-F trigger coupling mode the instrument isautomatically set to automatic triggering and the trigger pointindicator is switched off. As only the separated synchronizationpulses are used for triggering the relationship between thedisplayed signal and the trigger signal is lost. In TV-F modeinterference may occur if chopped DUAL mode is chosen orthe readout is active.
Video signals are triggered in the automatic mode. The internaltriggering is virtually independent of the display height, but thesync pulse must exceed 0.5div height.
The polarity of the synchronization pulse is critical for the slopeselection. If the displayed sync pulses are above the picture(field) contents (leading edge positive going), then the slopesetting for positive going edges must be chosen. In the caseof sync pulses below the field/line, the leading edge is negativeand consequently the slope selection must be set for fallingedges. Since the invert function may cause a misleadingdisplay, it must not be activated.
On the 2ms/div setting and field TV triggering selected, 1 fieldis visible if a 50 fields/s signal is applied. If the hold off controlis in fully ccw position, it triggers without line interlacingaffects caused by the consecutive field.
The display can be expanded by switching on the X-MAG. x10function so that individual lines are recognizable. Commencingwith a frame synchronizing pulse, the display can also beexpanded with the knob TIME/DIV. But note that this canresult in an apparently unsynchronized display as each frame(half picture) triggers. This is due to the offset of half a linebetween frames.
The influence of the integrating network which forms a triggerpulse from the vertical sync pulses may become visible undercertain conditions. Due to the integrating network time constantnot all vertical sync pulses starting the trace are visible.
On the 10µs/div setting and line TV triggering selected, approx.1½ lines are visible. Those lines originate from the odd andeven fields at random.
The sync-separator-circuit also operates with external triggering.It is important that the voltage range (0.3Vpp to 3Vpp) forexternal triggering should be noted. Again the correct slopesetting is critical, because the external trigger signal may nothave the same polarity or pulse edge as the test signaldisplayed on the CRT. This can be checked, if the externaltrigger voltage itself is displayed first (with internal triggering).In most cases, the composite video signal has a high DCcontent. With constant video information (e.g. test pattern orcolor bar generator), the DC content can be suppressed easilyby AC input coupling of the oscilloscope amplifier. With achanging picture content (e.g. normal program), DC inputcoupling is recommended, because the display varies itsvertical position on screen with AC input coupling at eachchange of the picture content.
The DC content can be compensated using the Y-POS. controlso that the signal display lies in the graticule area. Then thecomposite video signal should not exceed a vertical height of6div.
Line triggering (~)
The instrument specific information regarding this mode ispart of the section “Controls and readout” paragraph TRIG.MODE (26).
This trigger mode is present if the ~ LED is lit (26). The triggerpoint symbol is inactive in line/mains trigger mode as there isno direct amplitude relationship between the trigger voltageand the signal voltage.
A voltage originating from mains/line (50 to 60Hz) is used fortriggering purposes if the trigger coupling is set to ~. Thistrigger mode is independent of amplitude and frequency of theY signal and is recommended for all mains/line synchronoussignals. This also applies within certain limits, to wholenumber multiples or fractions of the line frequency. Linetriggering can also be useful to display signals below thetrigger threshold (less than 0.5div). It is therefore particularlysuitable for measuring small ripple voltages of mains/linerectifiers or stray magnetic field in a circuit. In this trigger modethe slope direction pushbutton selects the positive or negativeportion of the line/mains sinewave. The trigger level controlcan be used for trigger point adjustment.
Magnetic leakage (e.g. from a power transformer) can beinvestigated for direction and amplitude using a search or pick-up coil. The coil should be wound on a small former with amaximum of turns of a thin lacquered wire and connected toa BNC connector (for scope input) via a shielded cable.Between cable and BNC center conductor a resistor of at least100Ω should be series-connected (RF decoupling). Often it isadvisable to shield statically the surface of the coil. However,no shorted turns are permissible. Maximum, minimum, anddirection to the magnetic source are detectable at the measuringpoint by turning and shifting the coil.
Alternate triggering
This trigger mode can be selected in DUAL mode by pressingand holding the TRIG. pushbutton (23) if the preconditions aremet (please note “Controls and readout”). In the case ofchopped DUAL mode, selecting alternate trigger modeautomatically sets the instrument to alternate DUAL mode. Ifthe trigger coupling is set to TV-L or TV-F, selecting alternatetriggering automatically results in AC coupling conditions.Under line/mains triggering condition alternate triggering cannot be chosen. Thus only the following trigger coupling modesare available in alternate trigger mode: AC, DC, HF and LF. Thetrigger point symbol is internally inactivated.
With alternate triggering it is possible to trigger two signalswhich are different in frequency (asynchronous). In this casethe oscilloscope must be operated in DUAL alternate modeand internal triggering each input signal must be of sufficientheight to enable trigger. To avoid trigger problems due todifferent DC voltage components, AC input coupling for bothchannels is recommended. The internal trigger source isswitched in alternate trigger mode in the same way as thechannel switching system in DUAL alternate mode, i.e. aftereach time base sweep. Phase difference measurement is notpossible in this trigger mode as the trigger level and slopesetting are equal for both signals. Even with 180° phasedifference between both signals, they appear with the sameslope direction.
If signals are applied with a high frequency ratio (difference),the trace intensity then becomes reduced if the time base isset to smaller time coefficients (faster sweep). This happensas the number of sweeps does not increase because itdepends on the lower frequency signal, but with a fastersweep the phosphor becomes less activated.
External triggering
The external trigger input is activated with the aid of the TRIG.(23) pushbutton (see “Controls and readout”), if the trigger
Triggering and time base
29Subject to change without notice
coupling is not set to line/mains trigger coupling. Then theinternal trigger source is deactivated. As the external triggersignal applied at the TRIG. EXT socket normally has no relationto the signal height of the displayed signal, the trigger pointsymbol is switched off. The external trigger voltage must havea minimum amplitude of 0.3Vpp and should not increase above3Vpp. The input impedance of the TRIG. EXT. socket isapprox. 1MΩ II 15pF.
The maximum input voltage of the input circuit is 100V(DC+peak AC).
The external trigger voltage may have a completely differentform from the test signal voltage, but must be synchronouswith the test signal. Triggering is even possible in certain limitswith whole number multiples or fractions of the test frequency.
It must be noted that a different phase angle between themeasuring and the triggering signal may cause a display notcoinciding with the slope selection setting.
The trigger coupling selection can also be used in externaltriggering mode.
Trigger indicator “TR”
The following description applies to the “TR” LED. Please noteitem (16) under “Controls and readout”.
An LED on condition indicates that the trigger signal has asufficient amplitude and the trigger level control setting iscorrect. This is valid with automatic and with normal triggering.By observing the trigger LED, sensitive trigger level adjustmentis possible when normal triggering is used, particularly at verylow signal frequencies. The indication pulses are of only100ms duration.
Thus for fast signals the LED appears to glow continuously, forlow repetition rate signals, the LED flashes at the repetition rateor at a display of several signal periods not only at the start ofthe sweep at the left screen edge, but also at each signal period.
In automatic triggering mode the sweep generator startsrepeatedly without test signal or external trigger voltage. If thetrigger signal frequency decreases the trigger automaticrepetition frequency the sweep generator starts withoutawaiting the trigger pulse. This causes an untriggered displayand a flashing trigger LED.
HOLD OFF-time adjustment(Only in analog mode)
For instrument specific information please note DEL.POS. -HO (27) in section “Controls and readout”.
If it is found that a trigger point cannot be found on extremelycomplex signals, even after careful adjustment of the triggerlevel control, a stable display may often be obtained using theholdoff control. This facility varies the holdoff time betweentwo sweep periods approx. up to the ratio 10:1. Pulses or othersignal waveforms appearing during this off period cannottrigger the time base.
Particularly with burst signals or aperiodic pulse trains of thesame amplitude, the start of the sweep can be delayed untilthe optimum or required time.
A very noisy signal or a signal with a higher interferingfrequency is at times displayed double. It is possible thattrigger level adjustment only controls the mutual phase shift,but not the double display. The stable single display of the
signal, required for evaluation, is easily obtainable by expandingthe hold off time until one signal is displayed.
A double display is possible with certain pulse signals, wherethe pulses alternately show a small difference of the peakamplitudes. Only a very exact trigger level adjustment makesa single display possible. The use of the holdoff controlsimplifies the right adjustment.
After specific use the holdoff control should be reset into itscalibration detent (fully ccw), otherwise the brightness of thedisplay is reduced drastically. The function is shown in thefollowing figures.
Fig. 1 shows a case where the holdoff control is in the minimumposition and various different waveforms are overlapped on thescreen, making the signal observation unsuccessful.
Fig. 2 shows a case where only the desired parts of the signal are stablydisplayed.
Delay / After Delay Triggering(Only in analog mode)
The instrument specific information regarding this mode ispart of the section “Controls and readout” paragraph DEL.POS.- HO (27), SEA./DEL. - ON/OFF (29) and DEL.TRIG. - VAR.(30).
As mentioned before, triggering starts the time base sweepand unblanks the beam. After the maximum X deflection to theright, the beam is blanked and flies back to the (left) startposition. After the hold off period the sweep is startedautomatically by the automatic trigger or the next triggersignal. In normal triggering mode the automatic trigger isswitched off and will only start on receipt of a trigger signal.
As the trigger point is always at the trace start position, traceexpansion in X direction with the aid of the time base is limitedto the display on the left of the trace. Parts of the signal to beexpanded which are displayed near the trace end (right side ofthe screen) are lost when the time base speed is increased(time coefficient reduced).
The delay function delays the trace start by a variable time fromthe trigger point. This allows the sweep to begin on any portionof a signal. The time base speed can then be increased toexpand the display in X direction. With higher expansion rates,the intensity reduces and within certain limits this can becompensated by the INTENS knob setting.
Triggering and time base
30 Subject to change without notice
If the display shows jitter, it is possible to select for (second)triggering after the elapsed delay time (DELay TRIGger =DTR). As mentioned before, it is possible to display videosignals using the frame sync pulses for triggering (TV-F). Afterthe delay time set by the operator, the next line sync pulse orthe line content may be used for triggering. So data lines andtest lines can be displayed separately.
Operation of the delay function is relatively simple. Withoutdelay function set the time coefficient setting (TIME/DIV) until1 to 3 signal periods are displayed. Display of less the oneperiod should be avoided as it limits the selection of the signalsection to be expanded, and may cause trigger problems.
The X-MAG. x10 function should be switched off and the timevariable control should be CAL position. The signal must betriggered and stable. The following explanation assumes thatthe trace starts on the left vertical graticule line.
Pressing and holding the SEA./DEL. - ON/OFF button switchesover to SEARCH mode (SEA displayed by the readout).
In all delay modes, the DEL. POS. knob assumes the functionof DEL. POS. (delay position), and the hold off time defaults tominimum. Now the function of this knob (DEL. POS.) is toadjust the delay time, indicated as a blanked part of the screen.The length of the blanked sector depends on the DEL. POS.setting and can be set between approx. one and six divisionafter the normal trace start position. As the trace right end isnot effected, the visible trace length is reduced. In delay (DEL)mode, the trace will start from the normal left end where theblanking starts. If the maximum delay is not sufficient, the timecoefficient must be increased (TIME/DIV knob) and the DEL.POS. knob set to the later starting point. To return to normal(undelayed) time base operation, press and hold the SEA./DEL pushbutton again.
Photo 2 shows that the delay time can be measured. It isidentical with the displacement of the start of the trace. Onecan calculate this by multiplying the blanked out section(horizontal) by the time deflection coefficient setting.
The total trace starting with the previously selected section willbe visible when switched from SEARCH to DELAY, providingthe (stored) current time deflection coefficient is not too small.
If the trace is invisible or hardly visible because of too highexpansion (too small deflection coefficient), the time deflectioncoefficient must be increased with TIME / DIV. knob. A largerdeflection coefficient than in the SEARCH mode cannot be set.
Example:The SEARCH setting selected in figure 2 is 5ms/cm. Thedisplay in DELAY mode, also with 5ms/cm is delayed butunexpanded (1:1). A further increase in the deflectioncoefficient, e.g. 10ms/cm would be meaningless andtherefore automatically blocked.
Please note that the previous time coefficient chosen in DELand DTR mode is stored and automatically set after activatingone of those modes. If the stored time coefficient in DEL orDTR mode was higher than the actual value in SEA (search)mode, the time coefficient in DEL or DTR mode is automaticallyset to the value used during SEA (search) operation.
Reducing the time coefficient (increasing the time base speed)now expands the signal. If the signal start position is not setto the optimum, it can still be shifted in the X direction byturning the DEL. POS. knob. Photo 4 shows a 50 fold Xmagnification caused by setting the time coefficient to 0.1ms/div (5ms/div : 0.1ms/div = 50). The reading accuracy alsoincreases with higher X magnification. As already mentioned,the time variable control must be in CAL position whenmeasurements are taken.
The delayed and expanded signal display can be triggeredagain if a signal slope suitable for triggering appears after thedelay time. For this, one must switch to DEL.TRIG. (2ndtriggering after the expiry of the delay time - after DelayTriggering). The settings selected before switching, automaticPeak value triggering / Normal triggering, trigger coupling, thetrigger LEVEL setting and slope setting, remain valid andtrigger the start of the delay time.
The ”After Delay” Triggering automatically switches to nor-mal triggering (indicated by the NM-LED) and DC triggercoupling. These default conditions cannot be changed. But thetrigger level (LEVEL) and the trigger slope direction can bealtered in order to enable the triggering at the desired signalsection. The trace does not start and the screen remains blankif the signal amplitude is not sufficient for triggering or if thesetting of the trigger LEVEL is unsuitable.
The expanded display can also be displaced in the X directionwith DELAY position control (DEL.POS.) under suitablesettings. However, the displacement is not continuous as inthe untriggered DELAY operation but jumps from one triggerslope to another - with most signals this is not evident. Thismeans, in the case of TV Triggering, that it is possible to triggernot only with line synchronizing pulses but also on suitableslopes occurring within the line.
Triggering and time base
31Subject to change without notice
Of course, the magnification is not restricted to a factor 50 asmentioned in the example. The limit is given by the increasingloss of trace intensity as the magnification is increased.
The manipulation of time delay requires a certain experience,especially with complicated signal combinations which aredifficult to display. The recording of signal sections of simplesignals is, in contrast, from the beginning fairly easy. The timedelayed display is also possible in the dual channel, additionand difference modes.
Attention:The display may be in chopped DUAL mode withDELAY operation in dual channel mode (DUAL). This isthe case when in SEARCH, a time base between 500ms/div and 500µs/div is set, which automatically switchesin chopped DUAL mode.
The chopped DUAL mode is effective even ifsubsequently the time base is switched to between0,2ms/cm and 50ns in triggered or untriggered DELAYoperation. With highly expanded displays the channelswitching will be visible during a sweep (alternatelyswitching between channels I and II). One can thenswitch to alternate DUAL mode. A renewed change inthe time base setting will again result in choppeddisplay but this can be overcome again.
Auto Set
The instrument specific information regarding this function ispart of the section “Controls and readout” paragraph AUTOSET (2). As also mentioned in that section all controls areelectronically selected with the exception of the POWER andcalibrator frequency (CAL 1kHz/1MHz) pushbuttons as well asthe FOCUS and TR (trace rotation) control.
Thus automatic signal related instrument set up in Yt (timebase) mode is possible. In most cases no additional manualinstrument setting is required.
Briefly pressing the AUTO SET pushbutton causes theinstrument to switch over to the last Yt mode settingsregarding CH I, CH II and DUAL. If the instrument wasoperated in Yt mode, the actual setting will not be affectedwith the exception of ADD mode which will be switched off.At the same time the attenuator(s) (VOLTS/DIV) areautomatically set for a signal display height of approx. 6 div inmono channel mode or if in DUAL mode for approx. 4 divheight for each channel. This and the following explanationregarding the automatic time coefficient setting assumes thatthe pulse duty factor of the input signal is approx. 1:1.
The time deflection coefficient is also set automatically for adisplay of approx. 2 signal periods. The time base settingoccurs randomly if complex signals consisting severalfrequencies e.g. video signals are present.
AUTO SET sets the instrument automatically to the followingoperating conditions:
• The input coupling is not effected while AC or DC is used,but if GD was selected the last used input coupling (ACor DC) will be chosen.
• Internal triggering (channel I or channel II)• Automatic peak (value) triggering• Trigger level in electrical midrange position• Y deflection coefficient(s) calibrated• Time base deflection coefficient calibrated• AC trigger coupling (except DC trigger coupling)• SEARCH and DELAY time base mode switched off
• X x10 magnifier switched off• Automatic X and Y position settings• Trace and readout visible.
If DC trigger coupling had been selected, AC trigger couplingwill not be chosen and the automatic trigger is operativewithout the peak value detection.
The X position is set to the CRT center as well as the Y positionin CH I or CH II mode. In DUAL mode the channel I trace is setto the upper half and the channel II trace to the lower half ofthe CRT.
The 1mV/div and 2mV/div deflection coefficient will not beselected by AUTO SET as the bandwidth is reduced on thesesettings.
Attention!If a signal is applied with a pulse duty factor of approx.400:1 or larger, an automatic signal display can not beperformed. The pulse duty factor causes too low a Ydeflection coefficient (sensitivity too high) and too high atime deflection coefficient (time base speed to slow) andresults in a display in which only the baseline is visible.
In such cases it is recommended to select normal triggeringand to set the trigger point approx. 0.5div above or below thetrace. If under one of these conditions the trigger indicator LEDis lit, this indicates the presence of a signal. Then both the timecoefficient and Y deflection coefficient should be reduced.Please note that a reduction in intensity may occur, whichcould result in a blank screen when the physical limits arereached.
STORAGE MODE ONLYIn contrast to analog mode, intensity reduction does not occur.But it must be noted that pulses of less than 20ns width aredisplayed with too small amplitude. This is because of too fewsamples per pulse, as in 100MS/s condition (10ns samplinginterval) only 4 samples are taken.
If SINGLE (SGL) or ROLL (ROL) mode are active, AUTO SETsets the instrument automatically to REFRESH (RFR) mode.
Save/Recall
The instrument specific information regarding the controls andtheir use are part of item (12) in section “Controls andreadout”.
The instrument contains a non volatile memory which can beused by the operator to save 9 different instrument settingsand to recall them. This relates to all settings with theexception of FOCUS, TR (trace rotation) and the calibratorfrequency pushbutton.
Component Tester (analog mode)
General
The instrument specific information regarding the control andterminals are part of item (45) in section “Controls andreadout”.
The instrument has a built-in electronic Component Tester,which is used for instant display of a test pattern to indicatewhether or not components are faulty. It can be used for quickchecks of semiconductors (e.g. diodes and transistors),resistors, capacitors, and inductors. Certain tests can also bemade to integrated circuits. All these components can betested individually, or in circuit provided that it is unpowered.
Auto Set • Save/Recall Component Tester (analog mode)
32 Subject to change without notice
The test principle is fascinatingly simple. A built-in generatordelivers a sine voltage, which is applied across the componentunder test and a built-in fixed resistor. The sine voltage acrossthe test object is used for the horizontal deflection, and thevoltage drop across the resistor (i.e. current through testobject) is used for vertical deflection of the oscilloscope. Thetest pattern shows a current-voltage characteristic of the testobject.
The measurement range of the component tester is limitedand depends on the maximum test voltage and current (pleasenote data sheet). The impedance of the component under testis limited to a range from approx. 20 Ohm to 4.7k Ohm. Belowand above these values, the test pattern shows only short-circuit or open-circuit. For the interpretation of the displayedtest pattern, these limits should always be born in mind.However, most electronic components can normally be testedwithout any restriction.
Using the Component Tester
After the component tester is switched on, the verticalpreamplifier and the time base generator are inoperative. Ashortened horizontal trace will be observed. It is not necessaryto disconnect scope input cables unless in-circuit measure-ments are to be carried out.
For the component connection, two simple test leads with4mm Ø banana plugs, and with test prod, alligator clip orsprung hook, are required. The test leads are connected asdescribed in section “Controls and readout”.
Test Procedure
Caution! Do not test any component in live circuitry - removeall grounds, power and signals connected to the componentunder test. Set up Component Tester as stated. Connect testleads across component to be tested. Observe oscilloscopedisplay.
Only discharged capacitors should be tested!
Test Pattern Displays
This section contains some typical patterns displayed by thevarious components under test.
- Open circuit is indicated by a straight horizontal line.- Short circuit is shown by a straight vertical line.
Testing Resistors
If the test object has a linear ohmic resistance, both deflectingvoltages are in the same phase. The test pattern expectedfrom a resistor is therefore a sloping straight line. The angle ofslope is determined by the resistance of the resistor undertest. With high values of resistance, the slope will tendtowards the horizontal axis, and with low values, the slope willmove towards the vertical axis. Values of resistance from 20Ωto 4.7kΩ can be approximately evaluated. The determinationof actual values will come with experience, or by directcomparison with a component of a known value.
Testing Capacitors and Inductors
Capacitors and inductors cause a phase difference betweencurrent and voltage, and therefore between the X and Ydeflection, giving an ellipse-shaped display. The position andopening width of the ellipse will vary according to the impedancevalue (at 50Hz) of the component under test.
A horizontal ellipse indicates a high impedance or a relativelysmall capacitance or a relatively high inductance.
A vertical ellipse indicates a small impedance or a relativelylarge capacitance or a relatively small inductance.
A sloping ellipse means that the component has a considerableohmic resistance in addition to its reactance.
The values of capacitance of normal or electrolytic capacitorsfrom 0.1µF to 1000µF can be displayed and approximatevalues obtained. More precise measurement can be obtainedin a smaller range by comparing the capacitor under test witha capacitor of known value. Inductive components (coils,transformers) can also be tested. The determination of thevalue of inductance needs some experience, because inductorshave usually a higher ohmic series resistance. However, theimpedance value (at 50Hz) of an inductor in the range from 20Ωto 4.7kΩ can easily be obtained or compared.
Testing Semiconductors
Most semiconductor devices, such as diodes, Z-diodes,transistors, FETs can be tested. The test pattern displays varyaccording to the component type as shown in the figuresbelow.
The main characteristic displayed during semiconductor testingis the voltage dependent knee caused by the junction changingfrom the conducting state to the non conducting state. Itshould be noted that both the forward and the reversecharacteristic are displayed simultaneously. This is a two-terminal test, therefore testing of transistor amplification isnot possible, but testing of a single junction is easily and quicklypossible. Since the test voltage applied is only very low, allsections of most semi-conductors can be tested withoutdamage. However, checking the breakdown or reverse voltageof high voltage semiconductors is not possible. More importantis testing components for open or short-circuit, which fromexperience is most frequently needed.
Testing Diodes
Diodes normally show at least their knee in the forwardcharacteristic. This is not valid for some high voltage diodetypes, because they contain a series connection of severaldiodes. Possibly only a small portion of the knee is visible.Zener diodes always show their forward knee and, dependingon the test voltage, their zener breakdown forms a secondknee in the opposite direction. If the breakdown voltage ishigher than the positive or negative voltage peak of the testvoltage, it can not be displayed.
The polarity of an unknown diode can be identified bycomparison with a known diode.
Testing Transistors
Three different tests can be made to transistors: base-emitter,base-collector and emitter-collector. The resulting test patternsare shown below.
Component Tester (analog mode)
33Subject to change without notice
The basic equivalent circuit of a transistor is a Z-diode betweenbase and emitter and a normal diode with reverse polaritybetween base and collector in series connection. There arethree different test patterns:
For a transistor the figures b-e and b-c are important. Thefigure e-c can vary; but a vertical line only shows short circuitcondition.
These transistor test patterns are valid in most cases, butthere are exceptions to the rule (e.g. Darlington, FETs). Withthe COMPONENT TESTER, the distinction between a P-N-Pto an N-P-N transistor is discernible. In case of doubt,comparison with a known type is helpful. It should be notedthat the same socket connection (COMP. TESTER or ground)for the same terminal is then absolutely necessary. A connectioninversion effects a rotation of the test pattern by 180 degreesround about the center point of the scope graticule.
In-Circuit Tests
Caution!During in-circuit tests make sure the circuit is dead. Nopower from mains/line or battery and no signal inputsare permitted. Remove all ground connections includingSafety Earth (pull out power plug from outlet). Removeall measuring cables including probes betweenoscilloscope and circuit under test. Otherwise bothCOMPONENT TESTER leads are not isolated againstthe circuit under test.
In-circuit tests are possible in many cases. However, they arenot well defined. This is caused by a shunt connection of realor complex impedances - especially if they are of relatively lowimpedance at 50Hz - to the component under test, oftenresults differ greatly when compared with single components.In case of doubt, one component terminal may be unsoldered.This terminal should then not be connected to the groundsocket avoiding hum distortion of the test pattern.
Another way is a test pattern comparison to an identical circuitwhich is known to be operational (likewise without power andany external connections). Using the test prods, identical testpoints in each circuit can be checked, and a defect can bedetermined quickly and easily. Possibly the device itself undertest contains a reference circuit (e.g. a second stereo channel,push-pull amplifier, symmetrical bridge circuit), which is notdefective.
Storage Mode
In contrast to analog mode, the storage mode offers thefollowing advantages:
One time events can be captured easily. Even very lowfrequency signals can be displayed as a complete curve.Narrow pulses with low repetition rates do not cause intensityreduction. Documentation and processing of captured signalsis easily possible.
In comparison with analog mode, the disadvantages ofstorage mode are:
The reduced X and Y resolution and a lower update rate.Danger of alias signal display, caused by a sampling rate (timebase setting) which is relatively too low with respect to thecurrent signal.
The analog mode offers an unsurpassed faithful signal display.With the combination of analog and digital oscilloscope, HAMEGenables the user to select the most suitable mode for thespecific measurement.The HM407 contains two 8 bit flash A/D converters with amaximum sampling rate of 50MS/s each. Except in thecombination of DUAL mode and SINGLE event recording witha maximum of 40MS/s (time coefficient 5µs/div) for eachchannel, in all other modes 100MS/s is available if the lowesttime coefficient is chosen.
Component Tester (analog mode) Storage Mode
34 Subject to change without notice
Apart from the factors above, there is no principle differencebetween capturing repetitive signals and one-time events. Thesignal is always displayed with a linear connection betweenthe dots (Dot Join function).
Signals captured and stored in storage mode can be called viathe built-in RS232 interface for documentation purposes. Forfurther information please note section “RS232 Interface -Remote Control”.
Signal recording modes
Signals can be recorded and displayed in six different modes:REFRESH mode (RFR LED lit, readout indicates RFR)ENVELOPE mode (ENV LED lit, readout indicates ENV)AVERAGE mode (AVM LED lit, readout indicates AV...)SINGLE mode (SGL LED lit, readout indicates SGL)ROLL mode (ROL LED lit, readout indicates ROL)XY mode (RFR LED lit, readout indicates XY and the sampling rate)
Except ROLL and XY mode, a signal recording in all othermodes requires a trigger signal.
In REFRESH, ENVELOPE and AVERAGE modes theinstruments behaves like an analog oscilloscope. The triggercircuit starts a recording, overwriting the previous recordingfrom the left to the right side of the screen. After the recordinghas been finished, the next trigger event starts the sameprocedure. This can also be caused in automatic trigger modewithout an applied signal by the automatic circuitry. Then onlythe trace (Y-POS. setting) is recorded.
In contrast to automatic trigger mode, in normal trigger modethe automatic system is switched off and consequently onlya trigger signal can start a recording. Unlike analog modewhere the screen is dark until a trigger signal starts the timebase, in store mode the last recorded signal remains visible aslong as no new recording is triggered by an input signal.
AVERAGE and ENVELOPE are REFRESH sub-modes anddescribed in section “Controls and readout” under item (9).
SINGLE mode (SGL) enables the capture of one-time events,started by a suitable trigger signal. It is recommended, toselect input ground (GD) condition and set the trace on agraticule line which is then used as the 0 Volt position(reference) line. In SINGLE mode the instrument isautomatically set to normal trigger mode. After SINGLE (SGL)mode has been selected, the trigger point symbol should beset above or below the 0 Volt position line, according to theexpected voltage of the event to be captured. Whether theslope selection is set for a rising or falling slope depends on themeasurement task. After this procedure AC or DC inputcoupling must be selected and the signal capture is startedafter activating the RESET function. The following example isfor additional explanation.
If a voltage drop on a +5 Volt line is expected, the 0 Volt linemay be set to the horizontal center graticule line by using theY-POS. control. Then the trigger point symbol may be set 2division above the 0 Volt position using the LEVEL control.
If the deflection coefficient is set to 200mV and DC inputcoupling selected, using a x10 probe, the trigger point is at +4Volts. A voltage drop from +5 Volts below +4 Volts then is usedfor triggering, if negative slope setting is selected. If the slopeselection is positive the end of the event (voltage drop ended)is used for triggering.
For explanations regarding ROLL mode, please note this item(9) in section “Readout and Controls”.
Vertical resolution
The dot density in each operation mode is 8 bits = 28 = 256 dotsdisplayed over a height of roughly 10 divisions. The instrumentis adjusted for 25 dots per division. This eases processing andcursor measurement.
Insignificant differences between the (analog) screen displayand the (digital) data are unavoidable.
This concerns signal height as well as the position. The traceposition is defined in respect to the following horizontalgraticule lines:
Center line = 10000000 (binary) = 80 (hex) = 128 (dec).Top line = 11100100 (binary) = E4 (hex) = 228 (dec).Bottom line = 00011100 (binary) = 1C (hex) = 28 (dec).
In contrast to analog mode with its theoretically unlimitedresolution, the vertical resolution has 25 possible trace positionsper division.
If the signal is superimposed by noise or a critical Y-POS.setting is used, the least significant bit (LSB) may changecontinuously. This additionally reduces the vertical resolutionin storage mode, but is unavoidable. In contrast to the expen-sive flash A/D converters used in this instrument, otherconverters such as CCD cause more noise.
Horizontal resolution
The maximum number of signals to be displayed simultaneouslyis three. Each signal consists of 2048 (211) byte (samples).Referred to the horizontal raster, the resolution is 200 samplesper division.
Pure (only) digital oscilloscope with VGA monitor type CRTsoffer only 50 samples per division. If LCD displays are used thecurrent resolution is 25 samples per division. For a given timebase setting the HAMEG instrument samples at a 4 (comparedto VGA) or 8 ( referred to LCD) times higher sampling rate. Thehigher number of samples/div results in a shorter samplinginterval. For the following example it must be kept in mind, thatthe time base setting is related to the signal period duration andconsequently should enable the display of one complete signalperiod. If e.g. a 50Hz signal has to be displayed the time baseshould be set to 2ms/div. The maximum signal frequency of asuperimposed sinewave signal, which must be sampled with atleast 10 samples per period, depends on the horizontal resolution:
During X magnifier mode the record length is still 2048 byte.The CRT displays a tenth of the recording (20 byte/division)plus 180 byte/div calculated in linear interpolation operation bya RISC processor. The smallest available time coefficient thenis 50ns/div instead of 500ns/div without the X magnifier.
Maximum signal frequency in storage mode
The highest capturable signal frequency cannot be exactlydefined, since it depends to a large extent on the waveform.
With the start of each recording, the signal voltage at theinput(s) of the analog-to-digital converters is briefly measured(sampled), converted to an 8-bit value and written to anaddress in RAM. The next sampled value is converted in thesame way, but stored at the next RAM address.
Storage Mode
35Subject to change without notice
The maximum sampling rate is 100MS/s. This yields a samplinginterval of 10ns. Assuming that 10 measurements (samples)per signal period are sufficient for a sinewave signal, themaximum frequency to be captured is 10MHz (100ns perperiod).
Alias signal display
If, due to the time base setting, the sampling rate is too low,the display of an alias signal may occur.
For example:A sinewave signal may be sampled only once per period. Ifthe sinewave signal frequency is accidentally in phase withthe sampling frequency and each sample is taken at thepositive peak value, a straight line is displayed in thisposition.
Alias signal display may also occur in the form of an apparentuntriggered waveform display of different frequency from thetrue signal. Another aliasing condition is the display of signalsseeming to be amplitude modulated.
The easiest way to recognize alias signals is to switch to analogmode, where the true waveform is displayed. Transfer fromanalog to store mode without changing time base range mustproduce the same frequency display.
Operating modes of the vertical amplifiers
In principle, the instrument can operate in digital storage modewith the same operating modes as in analog mode. Thus, thefollowing can be displayed:
- Channel I by itself- Channel II by itself- Channel I and II simultaneously- The sum or difference of both channels- XY mode
Storage mode differs from analog operation of the scope in thefollowing respects:
- In DUAL mode (for simultaneous display of both channels),both input signals are also simultaneously captured, sinceeach channel has its own A/D converter. In contrast toanalog mode therefore, it is not necessary to switch betweenchopped and alternating mode.
- Because of the high display rate (approx. 80Hz) of the screen,no flicker can occur.
- The storage time base is also active in XY storage mode.
Test Instructions
General
These Test Instructions are intended as an aid for checking themost important characteristics of the instrument at regularintervals without the need for expensive test equipment.Resulting corrections and readjustments inside the instrument,indicated by the following tests, are described in the “ServiceManual”. They should only be undertaken by qualifiedpersonnel.
A chargeable “Service Manual” is available from HAMEG. The“Service Manual” describes the complete adjustment of theinstrument in English language and contains the circuit diagramsas well as the component locations.
As with the First Time Operation instructions, care should betaken that all variable functions are set to their calibrated
positions. This is the case if AUTO SET had been pressed. Itis recommended to switch on the instrument for about 20minutes prior to the commencement of any check.
Cathode-Ray Tube:Brightness and Focus,Linearity, Raster Distortion
Normally, the CRT of the instrument has very good brightness.Any reduction of this brightness can only be judged visually.Decreased brightness may be the result of reduced highvoltage. In this case the sensitivity of the vertical amplifiers issignificantly increased .
The control range for maximum and minimum brightness(intensity) must be such that the beam just disappears beforereaching the left hand stop of the INTENS. control (particularlywhen in XY mode), while with the control at the right hand stopthe focus and the line width are just acceptable.
With maximum intensity the time base fly-back must on noaccount be visible. Visible trace fault without input signal:bright dot on the left side or decreasing brightness from left toright or shortening of the baseline. (Cause: Incorrect UnblankingPulse.) It should be noted that with wide variations in brightness,refocusing is always necessary. Moreover, with maximumbrightness, no “pumping” of the display must occur. If pumpingdoes occur, it is normally due to a fault in the regulationcircuitry for the high voltage supply. The presetting pots for thehigh voltage circuit, minimum and maximum intensity, are onlyaccessible inside the instrument.
A certain out-of-focus condition in the edge zone of the screenmust be accepted. It is limited by standards of the CRTmanufacturer. The same is valid for tolerances of theorthogonality, the undeflected spot position, the non-linearityand the raster distortion in the marginal zone of the screen inaccordance with international standards (see CRT data book).These limit values are strictly supervised by HAMEG. Theselection of a cathode-ray tube without any tolerances ispractically impossible.
Astigmatism Check
Check whether the horizontal and vertical sharpness of thedisplay are equal. This is best seen by displaying a square-wavesignal with the repetition rate of approximately 1MHz. Focusthe horizontal tops of the square-wave signal at normal intensity,then check the sharpness of the vertical edges. If it is possibleto improve this vertical sharpness by turning the FOCUScontrol, then an adjustment of the astigmatism control isnecessary. A potentiometer of 47k Ohm is provided inside theinstrument for the correction of astigmatism. A certain loss ofmarginal sharpness of the CRT is unavoidable; this is due to themanufacturing process of the CRT.
Symmetry and Drift of the Vertical Amplifier
Both of these characteristics are substantially determined bythe input stages of the amplifiers.
The symmetry of both channels and the vertical final amplifiercan be checked by inverting Channel I and II (depress thecorresponding INV pushbutton). The vertical position of thetrace should not change by more than 0.5div. However, achange of 1div is just permissible. Larger deviations indicatethat changes have occurred inthe amplifier.
A further check of the vertical amplifier symmetry is possibleby checking the control range of the Y-POS. controls. A sine-
Test Instructions
36 Subject to change without notice
wave signal of 10-100kHz is applied to the amplifier input.When the Y-POS. control is then turned fully in both directionsfrom stop to stop with a display height of approximately 8div,the upper and lower positions of the trace that are visibleshould be approximately of the same height. Differences of upto 1div are permissible (input coupling should be set to AC).
Checking the drift is relatively simple. 20minutes after switchingon the instrument, set the baseline exactly on the horizontalcenter line of the graticule. The beam position must notchange by more than 0.5div during the following hour.
Calibration of the Vertical Amplifier
A square-wave voltage of 0.2Vpp ±1% is present at the outputsocket of the calibrator (CAL.) If a direct connection is madebetween the 0.2V output and the input of the vertical amplifier(e.g. using a x1 probe), the displayed signal in the 50mV/divposition (variable control to CAL.) should be 4div high (DC inputcoupling).
Maximum deviations of 0.12div (3%) are permissible. If a x10probe (1%) is connected between the 0.2V output and Y input,the deflection coefficient should be set to 5mV/div. Then themaximum deviation is 0.16div.
With higher tolerances it should first be investigated whetherthe cause lies, within the amplifier or in the amplitude of thesquare-wave signal. On occasions it is possible that the probeis faulty or incorrectly compensated. If necessary the measuringamplifier can be calibrated with an accurately known DCvoltage (DC input coupling). The trace position should thenvary in accordance with the deflection coefficient set.
With variable control in the attenuator sector fully counter-clockwise, the input sensitivity is decreased at least by thefactor 2.5 in each position. In the 50mV/div position, thedisplayed calibrator signal height should vary from 4div to atleast 1.6div.
Transmission Performanceof the Vertical Amplifier
The transient response and the delay distortion correction canonly be checked with the aid of a square-wave generator witha fast risetime (max. 5ns). The signal coaxial cable (e.g. HZ34)must be terminated at the vertical input of the oscilloscopewith a resistor equal to the characteristic impedance of thecable (e.g. with HZ22). Checks should be made at 100Hz,1kHz, 10kHz, 100kHz and 1MHz, the deflection coefficientshould be set at 5mV/div with DC input coupling. In so doing,the square pulses must have a flat top without ramp-off,spikes and glitches; no overshoot is permitted, especially at1MHz and a display height of 4-5div. At the same time, theleading top corner of the pulse must not be rounded. Ingeneral, no great changes occur after the instrument has leftthe factory, and it is left to the operators discretion whetherthis test is undertaken or not. A suited generator for this testis HZ60 from HAMEG.
Of course, the quality of the transmission performance is notonly dependent on the vertical amplifier. The input attenuators,located in the front of the amplifier, are frequency-compensatedin each position. Even small capacitive changes can reduce thetransmission performance. Faults of this kind are as a rule mosteasily detected with a square-wave signal with a low repetitionrate (e.g. 1kHz). If a suitable generator with max. output of40Vpp is available, it is advisable to check at regular intervals thedeflection coefficients on all positions of the input attenuatorsand readjust them as necessary. A compensated 2:1 seriesattenuator is also necessary, and this must be matched to the
input impedance of the oscilloscope. This attenuator can bemade up locally. It is important that this attenuator is shielded.For local manufacture, the electrical components required area 1MΩ ±1% resistor and, in parallel with it, a trimmer 3-15pF inparallel with approx. 10pF. One side of this parallel circuit isconnected directly to the input connector of CH I or CH II andthe other side is connected to the generator, if possible via alow-capacitance coaxial cable. The series attenuator must bematched to the input impedance of the oscilloscope in the 5mV/div position (variable control to CAL., DC input coupling; squaretops exactly horizontal; no ramp-off is permitted). This is achievedby adjusting the trimmer located in the 2:1 attenuator. Theshape of the square-wave should then be the same in each inputattenuator position.
Operating Modes:CH.I/II, DUAL, ADD, CHOP.,INVERT and X-Y Operation
In DUAL mode two traces must appear immediately. Onactuation of the Y-POS. controls, the trace positions shouldhave minimal effect on each other. Nevertheless, this cannotbe entirely avoided, even in fully serviceable instruments.When one trace is shifted vertically across the entire screen,the position of the other trace must not vary by more than0.5mm.
A criterion in chopped operation is trace widening andshadowing around and within the two traces in the upper orlower region of the screen. Set time coefficient to 0.5ms/div,set input coupling of both channels to GD and advance theINTENS. control fully clockwise. Adjust FOCUS for a sharpdisplay. With the Y-POS. controls shift one of the traces to a+2div, the other to a -2div vertical position from the horizontalcenter line of the graticule.
Do not try to synchronize (with the time variablecontrol) the chop frequency (0.5MHz)! Check for negli-gible trace widening and periodic shadowing whenswitching between 0.5ms/div and 0.2ms/div.
It is important to note that in the I+II add mode or the I-IIdifference mode the vertical position of the trace can be adjustedby using both the Channel I and Channel II Y-POS. controls.
In X-Y Operation, the sensitivity in both deflection directionswill be the same. When the signal from the built-in square-wave generator is applied to the input of Channel II, then, aswith Channel I in the vertical direction, there must be ahorizontal deflection of 4div when the deflection coefficient isset to 50mV/div position. The check of the mono channeldisplay is unnecessary; it is contained indirectly in the testsabove stated.
Triggering Checks
The internal trigger threshold is important as it determines thedisplay height from which a signal will be stably displayed. Itshould be approx. 0.3-0.5div for the instrument. An increasedtrigger sensitivity creates the risk of response to the noiselevel in the trigger circuit. This can produce double-triggeringwith two out-of-phase traces.
Alteration of the trigger threshold is not required. Checks canbe made with any sine-wave voltage between 50Hz and1MHz. The instrument should be in automatic peak (value)triggering (NM LED dark) and the LEVEL knob in electricalmidrange position. It should be ascertained whether the sametrigger sensitivity is also present with Normal Triggering (NMLED lights). In this trigger mode, LEVEL adjustment is absolutelynecessary.
Test Instructions
37Subject to change without notice
The checks should show the same trigger threshold with thesame frequency. On changing the trigger slope, the start ofthe sweep changes from the positive-going to the negative-going edge of the trigger signal.
As described in the Operating Instructions, the trigger frequencyrange is dependent on the trigger coupling selected. For lowerfrequencies the LF coupling mode can be selected. In thismode, triggering up to at least 1.5kHz (sine-wave) is possible.Internally the instrument should trigger perfectly at a displayheight of approx. 0.5div, when the appropriate trigger couplingmode is set.
For external triggering, the external trigger input connectorrequires a signal voltage of at least 0.3Vpp, which is insynchronism with the Y input signal. The voltage value isdependent on the frequency and the trigger coupling mode(AC-DC-HF-LF).
Checking of the TV triggering is possible with a video signal ofany given polarity.
Use the TV-L or TV-F setting for video sync pulse separation.The correct slope of the sync pulse (front edge) must beselected and a suitable time coefficient setting must bechosen. The slope is then valid for both sync frequencies.
Perfect TV triggering is achieved, when in both display modesthe amplitude of the complete TV signal (from white level tothe top of the line sync pulse) is limited between 0.8 and 6divand sync pulses of more then 0.5 div height. The display shouldnot shift horizontally during a change of the trigger couplingfrom AC to DC when displaying a sine-wave signal without DCoffset.
If both vertical inputs are AC coupled to the same signal andboth traces are brought to coincide exactly on the screen,when working in the alternate dual channel mode, then nochange in display should be noticeable, when switching fromTRIG CH I to TRIG CH II or when the trigger coupling ischanged from AC to DC.
Checking of the line/mains frequency triggering (50 - 60Hz) ispossible, when the input signal is time-related (multiple orsubmultiple) to the power line frequency ( ~ LED lights). Thereis no trigger threshold visible in this trigger mode. Even verysmall input signals are triggered stably (e.g. ripple voltage). Forthis check, use an input of approx. 1V. The displayed signalheight can then be varied by turning the respective inputattenuator switch and its variable control.
Time base
Before checking the time base it should be ascertained thatthe trace length is approx. 10div in all time ranges. The X-MAG. x10 LED should not light. This condition should bemaintained until the variation ranges of these controls arechecked. Check that the sweep runs from the left to the rightside of the screen (TIME/DIV. setting to 100ms/div). Thischeck is only necessary after changing the cathode-ray tube.
If a precise marker signal is not available for checking the Timebase time coefficients, then an accurate sine-wave generatormay be used. Its frequency tolerance should not be greaterthan ±0.1%. The time base accuracy of the instrument is givenas ±3%, but it is considerably better than this. For thesimultaneous checking of time base linearity and accuracy atleast 10 oscillations, i.e. 1 cycle every div, should always bedisplayed. For precise determination, set the peak of the firstmarker or cycle peak exactly behind the first vertical graticuleline using the X-POS. control. Deviation tendencies can be
noted after some of the marker or cycle peaks. If a preciseTime Mark Generator is used for checking, Normal Triggeringand LEVEL control adjustment is recommended.
The signal frequency required for each time coefficient settingcan be determined easily by the aid of the readout. In timemeasurement condition the distance of the vertical cursorlines must be set to exactly 1 div. Then both readout informationregarding the time deflection coefficient and the time differenceshow exactly the same value. After switching over from timeto frequency measurement, the readout displays the requiredsignal frequency in each time base setting.
Hold Off time (analog mode only)
The variation of the hold off time setting can not be measuredwithout opening the instrument. However, a visual check canbe made if the instrument is operated in undelayed time basemode. Without an input signal, set time base to 50ns/div, useautomatic peak (value) triggering. With minimum hold off timethe trace should be bright. It should noticeably darken if thehold off time is increased to the maximum.
Component Tester
After selecting component tester mode, a horizontal straightline should appear immediately, when the test leads are notconnected (open circuit). The length of this trace should beapprox. 8div. With the test leads shorted together, a verticalstraight line with approx. 6div height should be displayed. Theabove stated measurements have some tolerances.
Trace Alignment
The CRT has an admissible angular deviation ±5° between theX deflection plane D1-D2 and the horizontal center line of theinternal graticule. This deviation, due to tube productiontolerances (and only important after changing the CRT), andalso the influence of the earth’s magnetic field, which isdependent on the instruments North orientation, are correctedby means of the TR potentiometer. In general, the tracerotation range is asymmetric. It should be checked, whetherthe baseline can be adjusted somewhat sloping to both sidesround about the horizontal center line of the graticule. With theinstrument in its closed case, an angle of rotation ±0.57°(0.1div difference in elevation per 10div graticule length) issufficient for the compensation of the earth’s magnetic field.
Service Instructions
General
The following instructions are intended as an aid for theelectronic technician, who is carrying out readjustments onthe instrument, if the nominal values do not meet thespecifications. These instructions primarily refer to thosefaults, which were found after using the Test Instructions.However, this work should only be carried out by properlyqualified personnel. For any further technical informationcall or write to HAMEG. Addresses are provided at the backof the manual. It is recommended to use only the originalpacking material, should the instrument be shipped to forservice or repair (see also Warranty).
Instrument Case Removal
The rear cover can be taken off after unplugging the powercords triple-contact connector and after two nuts have beenremoved. If a cross recessed pan head screw is present on thebottom of the instrument, it must be removed too. While theinstrument case is firmly held, the entire chassis with its front
Service Instructions
38 Subject to change without notice
panel can withdrawn forward. When the chassis is insertedinto the case later on, it should be noticed that the case has tofit under the flange of the front panel. The same applies for therear of the case, on which the rear cover is put.
Caution !During opening or closing of the case, the instrumentmust be disconnected from all power sources formaintenance work or a change of parts or components.If a measurement, trouble-shooting, or an adjustmentis unavoidable, this work must be done by a specialist,who is familiar with the risk involved.
When the instrument is set into operation after the case has beenremoved, attention must be paid to the acceleration voltage forthe CRT approx. -2025V and to the operating voltages for bothfinal amplifier stages 175V and 146V. Potentials of these voltagesare on the PS-Board, the CRT-PCB and on the main PCB. They arehighly dangerous and therefore precautions must be taken. Itshould be noted furthermore that shorts occurring on differentpoints of the CRT high voltage and unblanking circuitry willdefinitely damage some semiconductors. For the same reason itis very risky to connect capacitors to these points while theinstrument is on.
Capacitors in the instrument may still be charged, even when theinstrument is disconnected from all voltage sources. Normally,the capacitors are discharged approx. 6 seconds after switchingoff. However, with a defective instrument an interruption of theload is not impossible. Therefore, after switching off, it isrecommended to connect one by one all terminals across 1kΩ toground (chassis) for a period of 1 second.
Caution
Handling of the CRT needs utmost caution. The glass bulbmust not be allowed under any circumstances to come intocontact with hardened tools, nor should it undergo localsuperheating (e.g. by soldering iron) or local undercooling (e.g.by cryogenic-spray). We recommend the wearing of safetygoggles (implosion danger). If any work has been carried out,the complete instrument (with case closed and POWERbutton depressed) must undergo a safety test, including avoltage test with 2200V DC, between accessible parts to bothmains/line supply terminals. This test is dangerous and requiresan adequately trained specialist. The maximum impedancebetween each accessible metallic part and the safety earthconnector at the 3-pole power connector must be less than0.1Ω.
Operating Voltages
The operating voltages ( +12V, -6V, -2025V) are stabilized bythe switch mode power supply. The +12V supply is furtherstabilized and used as a reference voltage for -6V stabilization.These different operating voltages are fixed voltages, exceptthe +12V, which can be adjusted. The variation of the fixedvoltages greater than 5% from the nominal value indicates afault. Measurements of the high voltage may only beaccomplished by the use of a sufficient highly resistive voltmeter(>10MΩ). You must make absolutely sure that the electricstrength of the voltmeter is sufficiently high. It is recommendedto check the ripple and also the interaction from other possiblesources. Excessive values might be very often the reason forincomprehensible faults.
Maximum and Minimum Brightness
A variable resistor (100kΩ), located on the CRT PCB, is usedfor this adjustment procedure. It may only be touched by aproperly insulating screwdriver (Caution! High voltage!). Correct
adjustment is achieved, when the trace can be blanked in XYanalog mode and, in addition, when the requirement describedin the Test Instructions are met.
Astigmatism control
The ratio of vertical and horizontal sharpness can be adjustedby the variable resistor of 47kΩ, located on the CRT PCB. Asa precaution however, the voltage for the vertical deflectingplates (approx. +71V when the trace is in center position)should firstly be checked, because this voltage will affect theastigmatism correction. While the adjustment is being carriedout (with medium brightness and a 1MHz square-wave signal),the upper horizontal square-wave tops are firstly focussedwith the FOCUS control. Then the sharpness of the verticallines are corrected with the 47kΩ Astigm. pot. The correctionshould be repeated several times in this sequence. Theadjustment is optimized, when the FOCUS knob exclusivelybrings no improvement of the sharpness in both directions.
Trigger Threshold
The internal trigger threshold should be in the range 0.3 to0.5div display height.
Trouble-Shooting the Instrument
For this job, at least an isolating variable mains/line transformer(protection class II), a signal generator, an adequate precisemultimeter, and, if possible, an oscilloscope are needed. Thislast item is required for complex faults, which can be traced bythe display of signal or ripple voltages. As noted before, theregulated high voltage and the supply voltages for the finalstages are highly dangerous. Therefore it is recommended touse totally insulated extended probe tips, when trouble-shooting the instrument. Accidental contact with dangerousvoltage potentials is then unlikely. Of course, these instructionscannot thoroughly cover all kinds of faults. Some common-sense will certainly be required, when a complex fault has tobe investigated.
If trouble is suspected, visually inspect the instrumentthoroughly after removal of the case. Look for loose or badlycontacted or discolored components (caused by overheating).Check to see that all circuit board connections are making goodcontact and are not shorting to an adjacent circuit. Especiallyinspect the connections between the PCBs. This visualinspection can lead to success much more quickly than asystematic fault location using measuring instruments. Priorto any extensive trouble-shooting, also check the externalpower source.
If the instrument fails completely, the first and important step- after checking the power fuses - will be to measure thedeflecting plate voltages of the CRT. In almost any case, thefaulty section can be located. The sections represent:
1. Vertical deflection.2. Horizontal deflection.3. CRT circuit.4. Power supply.
While the measurement takes place, the position controls ofboth deflection devices must be in mid-position. When thedeflection devices are operating properly, the separate voltagesof each plate pair are almost equal then (Y approx. 71V and Xapprox 90V). If the separate voltages of a plate pair are verydifferent, the associated circuit must be faulty. An absenttrace in spite of correct plate voltages means a fault in the CRTcircuit. Missing deflection plate voltages is probably caused bya defect in the power supply.
Service Instructions
39Subject to change without notice
Adjustments
As advised in the Operating, Test and Service Instructions,small corrections and adjustments are easily carried out withthe aid of the “Service Manual”. However, a completerecalibration of the scope should not be attempted by aninexperienced operator, but only someone with sufficientexpertise. Several precision measuring instruments with cablesand adapters are required, and only then should the pots andtrimmers be readjusted, provided that the result of eachadjustment can be exactly determined. Thus for each operatingmode and switch position, a signal with the appropriate sine orsquare waveform, frequency, amplitude, risetime and dutycycle is required.
As described in the “Menu” section, the instrument`s softwarecontains the submenu “CALIBRATE”. The following items canbe used by operators not equipped with precision instruments.
After the required warm-up time of 20 minutes, press and holdthe MENU pushbutton until the MAIN MENU becomesvisible. Then the submenu ”CALIBRATE” must be called.
In the “CALIBRATE” submenu three items can be chosen:
1: Y AMP (amplifier channel I and II)2: TRIGGER AMP (trigger amplifier channel I and II)3: STORE AMP (digital section)
Attention!During the automatic adjustment procedure no signalmay be applied on any input.
Each item is called by pressing and holding the SAVE pushbutton.Then the instrument automatically adjusts and stores theadjustment values. In case of the Y amplifiers these are the fieldeffect transistor‘s operating points, the invert and the variablegain balance. For the trigger amplifier it is regarding the DCoperating points and the trigger threshold. In storage mode theadaptation of the storage display to the analog display.
The new adjustment values are always present after theinstrument is switched on. Therefore it is not required tooverwrite the factory adjustments by calling the OVERWRITEFACTORY DEFAULT function in the FACTORY submenu.Note! The automatic adjustment should only be made if theinstrument‘s warm up time has passed and no faults such asincorrect operating voltages are present. During some automaticadjustment procedures the readout indicates “Working”.
RS232 Interface - Remote Control
Safety
Caution:All terminals of the RS232 interface are galvanicallyconnected with the oscilloscope and subsequently withprotective (safety) earth potential.
Measurement on a high level reference potential is notpermitted and endangers operator, oscilloscope, interface andperipheral devices.
In case of disregard of the safety warnings contained in thismanual, HAMEG refuses any liability regarding personal injuryand/or damage of equipment.
Operation
The oscilloscope is supplied with a serial interface for controlpurposes. The interface connector (9 pole D- SUB female) is
located on the rear of the instrument. Via this bi-directionalport, the instrument parameter settings and (in storage mode)signal data, can be transmitted to, or received from a PC.
RS-232 Cable
The maximum connecting cable length must not exceed 3meters and must contain 9 lines connected 1:1. The oscilloscopeRS232 connection (9 pole D-SUB female) is determined asfollows:
Pin
2 Tx data (data from oscilloscope to external device)3 Rx data (data from external device to oscilloscope)7 CTS (clear to send)8 RTS (request to send)5 Ground (reference potential - connected via the
oscilloscope’s power cord with protective earth)9 +5V supply voltage for external devices (max. 400mA)
The maximum voltage swing at pin 2, 3, 7 and 8 is ± 12Volt.
RS-232 protocol
N-8-2 (no parity bit, 8 data bits, 2 stop bits, RTS/CTS hardwareprotocol).
Baud-Rate Setting
After the first POWER UP (switching on of the oscilloscope )and the first command SPACE CR (20hex, 0Dhex) sent fromthe PC, the baud rate is recognized and set automaticallybetween 110 baud and 19200 baud. The oscilloscope is thenswitched over to REMOTE control mode. The oscilloscopethen transmits the RETURNCODE: 0 CR LF to the PC. In thisstatus all settings (with the exception of those functionsmentioned under “Controls and readout”) can be controlledvia the interface only.
The only ways to quit this status are:
• Switching the oscilloscope off, transmitting the command• RM= 0 from the PC to the oscilloscope, or• depressing the AUTO SET ( LOCAL ) pushbutton,
if in unlocked condition (command LK=1... was not sent)
After the remote state has been switched off the RM -LED (3)is dark.
Please note:
A minimum time must elapse between the commandsRM=1... (remote on) and RM=0... (remote off) and viceversa. The time can be calculated with the formula:
tmin
= 2/baud rate + 60µs.
If at the beginning no SPACE CR command is recog-nizable, the oscilloscope pulls the TxD line low for approx.0.2ms and causes a break on the PC.
Data Communication
After successfully being set to remote control mode, theoscilloscope is prepared for command reception.
A disk with programming examples and a list of the instrumentcommands is supplied with the oscilloscope.