Page 1
This is a repository copy of Controls of soil pipe frequency in upland blanket peat .
White Rose Research Online URL for this paper:http://eprints.whiterose.ac.uk/488/
Article:
Holden, J. (2005) Controls of soil pipe frequency in upland blanket peat. Journal of Geophysical Research: Earth Surface, 110 ((F1): ). ISSN 0148-0227
https://doi.org/10.1029/2004JF000143
[email protected] ://eprints.whiterose.ac.uk/
Reuse
See Attached
Takedown
If you consider content in White Rose Research Online to be in breach of UK law, please notify us by emailing [email protected] including the URL of the record and the reason for the withdrawal request.
Page 2
White Rose Consortium ePrints Repository http://eprints.whiterose.ac.uk/
This is an author produced version of an article published in Journal of Geophysical Research: Earth Surface: Holden, J. (2005) Controls of soil pipe frequency in upland blanket peat. Journal of Geophysical Research: Earth Surface, 110 ((F1): art. no. F01002). http://eprints.whiterose.ac.uk/archive/00000488/
Page 3
CONTROLS OF SOIL PIPE FREQUENCY IN UPLAND BLANKET
PEAT
Joseph Holden
Earth and Biosphere Institute,
School of Geography,
University of Leeds,
Leeds,
LS2 9JT,
UK.
+44 (0) 113 343 3317 (direct)
+44 (0) 113 343 3300 (secretary)
+44 (0) 113 343 3308 (fax)
[email protected]
1
Page 4
Abstract
Soil pipes were surveyed in 160 British blanket peat catchments using consistent
application of ground penetrating radar. Soil pipes were found in all catchments. The
mean frequency of piping was 69 per kilometer of surveyed transect. Land
management (moorland gripping) appears to exert the most important control on
hillslope pipe frequency in blanket peats. Management practice in peatlands may
therefore induce more rapid subsurface erosion, carbon loss and landform denudation
via enhanced preferential flow. Topographic position is also important, with topslopes
having greater pipe frequencies than footslopes, followed by midslopes with lowest
frequencies. Slope gradient, however, is not a significant factor in controlling blanket
peat pipe frequency. I propose that peat structural properties inherited from the way a
blanket peat develops on a hillslope strongly control pipe network development. This
is manifested in the way slope position appears to control pipe frequency. Aspect
appears not to influence frequency in blanket peats except that it does play a weak
role in catchments with annual precipitation less than 1500 mm. Here southwesterly-
facing slopes tend to have more frequent piping.
Keywords
Soil pipes, peatlands, wetlands, topography, moorland gripping, geomorphology,
runoff
2
Page 5
1. Introduction
Soil pipes are important hillslope hydrological and geomorphological agents in many
parts of the world [e.g. Zhu et al., 2002; Elsenbeer, 2001; Carey and Woo, 2000;
Gutierrez et al., 1997; Crouch et al., 1986; Drew, 1982; Harvey, 1982; Jones, 1981;
Baillie, 1975] and particularly in humid temperate regions [Holden and Burt, 2002a;
Uchida et al., 1999; Jones, 1997a; Jones, 1990; Jones, 1981]. In the shallow peaty
podzol soils at Maesnant, mid-Wales, for example, pipes contributed 49 % to stream
stormflow and 46 % to baseflow [Jones and Crane, 1984]. Holden and Burt [2002a]
found that 10 % of stream discharge was produced by pipes in a deep peat catchment
in northern England. Jones [1994b; 2004] showed that piping can play an important
role in landscape development in some regions. Zhu et al. [2002] found that pipes
delivered 57 % of basin sediment production in a catchment of the hilly loess region
of North China. Piping is involved in channel extension through roof collapse, gully
development, and mass movements [Higgins, 1990; Jones, 1994a; 1994b; 2004].
Jones et al. [1997] suggested that 30 % of Britain was susceptible to piping, with
pipes more likely in upland peats and podzols. Bower [1961)], Radley [1962],
Anderson and Burt [1990], Jones et al. [1997] and Holden and Burt [2003b] noted
that blanket peats commonly have soil pipes. Peat is the accumulation of partially
decomposed remains of dead plants that forms in a waterlogged environment. Blanket
peats develop on gentle slopes of upland plateaux, ridges and benches and are
primarily ombrogenous. That is, they are believed to be hydrologically disconnected
from the underlying mineral layer such that they receive almost all of their water and
nutrients in the form of precipitation. These peats often extend upwards from initial
development on hill toes due to increased upslope waterlogging caused by the peat
3
Page 6
[Hobbs, 1986]. Blanket peats also tend to develop on hilltops and then extend
downslope due to the waterlogging caused by their effluent waters. This water also
causes further waterlogging at the base of the slope, encouraging further peat
development and allowing a blanket of peat to cover the slope. On very gentle slopes
the lack of drainage encourages micropools to develop and a patchy and mosaic-like
vegetation community colonizes [Ingram, 1983] with specialist plants adopting
different positions within the local microtopography. This then enhances the
microtopography, often manifest in larger features such as hummock-pool topography
[Hobbs, 1986; Holden and Burt, 2003b; 2003c]. Since the peat itself therefore
consists of plant remains, different phases of surface colonization or local pool
development result in a peat of variable properties throughout its profile [Beckwith et
al., 2003]. Thus, some parts of peat hillslopes may be more likely to inherit a
heterogeneous peat structure than others depending on local plant or pool occurrences
and local drainage.
Piping can transcend the traditional two-layered hydrological model for peats which
suggests that almost all of the water, nutrient and sediment movements are at, or very
close to the surface [Holden and Burt, 2003b]. Saturation-excess overland flow and
near surface throughflow dominate runoff in blanket peats [Evans et al., 1999; Holden
and Burt, 2003b]. The lower peat layers are generally considered to be hydrologically
inactive in that, despite being saturated, the hydraulic conductivity is so small that
they transmit very little water to the stream. Pipes, however, may couple
(hydrochemically and sedimentologically) deep and shallow layers of the soil profile.
Given that 15 % of Britain is covered with blanket peat [Tallis et al., 1998], and this
peat cover is mainly in upland headwaters, it is likely that pipes play an important role
4
Page 7
in many British catchments. Blanket peats are important stores of terrestrial carbon
[Turetsky et al., 2002] and Britain holds around 15 % of the global blanket peat
resource [Tallis et al., 1998]. However, soil pipes have not been considered in carbon
budgets for blanket peat catchments [e.g. Worrall et al., 2003] and they may be an
important subsurface agent of carbon removal from peatlands. Pipes may therefore
result in losses of carbon through increased dissolved and particulate organic carbon
loss. Few studies of pipe sediment yields in peats or peaty soils exist. However,
weekly sampling on the peaty podzols of the Maesnant catchment suggested 15 % of
annual stream sediment yield came from the pipes [Jones and Crane, 1984], and
Jones [1990] speculated that this value was more likely to be 25 % when the
unmonitored pipes are taken into account. Jones [2004] showed that for Maesnant the
areas of piping yielded more sediment to the stream than the areas without piping.
Therefore, because research has demonstrated that pipes are important hydrological
and geomorphological agents in peat catchments, and that they could be important in
carbon budgets, it is important to examine the frequency of soil piping in blanket peat
catchments and to examine the controls on pipe frequency and distribution.
Relatively little is known about the number and extent of soil pipes in most peatland
(or any other) environments. Often pipes are only reported where they issue onto
streambanks or where their roofs have collapsed. Jones et al. [1997] reported the
frequency of pipe outlets and the mean cross-sectional area of soil pipe outlets per km
of streambank. However, as Jones et al. [1997] noted, many hillslope pipes are not
directly connected to streambanks. Furthermore, Holden et al. [2002] and Holden and
Burt [2002a] and Terajima et al. [2000] showed that soil pipe dimensions and depths
could be very different just a few meters upslope. Soil pipes are often not just formed
5
Page 8
as a single conduit but can form complex drainage networks with branching
tributaries [Holden et al., 2002]. The main difficulty with collecting data in order to
examine pipe distribution has been the lack of appropriate techniques for detecting
and mapping subsurface soil pipes. Bryan and Jones [1997] noted that new techniques
were urgently needed for surveying pipe networks and measuring subsurface
catchments. Recently, Holden et al. [2002] reported on the successful application of
ground penetrating radar (GPR) for identifying soil pipes and their hydrological
connectivity [Holden, 2004]. This technique allows soil pipes to be identified from the
ground surface without disturbance. These earlier two papers reported solely on
technical developments. However, these technical developments now provide an
opportunity for a more adequate assessment of soil pipe occurrence and the potential
controls on soil piping in blanket peat catchments. This provides the focus of this
paper.
Several factors that might control pipe distribution in blanket peatlands have been
suggested. These include topographic position, slope gradient, aspect and land
management. Many authors, such as Jones [1981] and Gutierrez et al. [1997], have
suggested that piping is more common on steeper slopes and that flatter slopes (such
as hilltops) with limited drainage area per unit contour length are less susceptible to
soil piping [Jones et al., 1997]. This is because steeper hydraulic gradients and greater
volumes of water flow are more likely to result in pipe formation (with greater shear
stresses on macropore and pipe walls). Based on an initial field survey, however,
Holden et al. (2002) suggested that, in blanket peat catchments, soil pipe densities
may be much greater on more gentle slopes (such as valley floors and hill tops) but
they had very limited data with which to back up this hypothesis. Indeed, in Conacher
6
Page 9
and Dalrymple�s [1977] nine unit landsurface classification they indicate that piping
is likely on unit 2 which is the area downslope from the interfluve area (unit 1). In
unit 2 they suggest that mechanical and chemical eluviation by lateral subsurface
water movement dominates. In addition, Jones [1990] used a survey of worldwide
literature and suggested that piping was generally common on unit 2 but the highest
frequency of piping was found on toeslopes (units 6 and 7). Of course, it is therefore
important to distinguish between slope gradient in general and slopes in their
topographic context. For example we need to distinguish between steep slopes (based
on gradient) and midslopes which are slopes on the hillside between more gently
sloping topslopes and footslopes. Surface erosion features in blanket peats tend to
have a hillslope topographic context. For example, gully networks are branching and
dense on flatter hilltops but they feed into straighter, unbranching gullies on steeper
midslopes [Bower, 1960; 1961]. However, the effect of slope position, and slope
gradient on soil pipe density has never been fully tested in peat catchments.
In the overview of British soil piping presented by Jones et al. [1997] they examined
data for 74 catchments that contained active soil pipes (mainly peats and peaty
podzols). They found that 19 of these catchments faced south. This was a significant
number since aspect was split into 8 categories in their analysis. Upland peats are
often subject to shrinkage cracking during dry summer periods [e.g. Holden and Burt,
2002b; Holden and Burt, 2002c], higher annual precipitation totals than the national
average, and suffer from impeded drainage with large changes in hydraulic
conductivity over very short vertical and lateral distances [Holden and Burt, 2003a].
Thus, Jones et al. [1997] suggested that while high rainfall areas are associated with
piping, there was also an important role for desiccation cracking in initiating pipes in
7
Page 10
Britain. There is therefore a proposed two-way control here; sufficient water surplus
is required to form the pipe networks and for them to remain open, and sufficient
warm dry periods are required in which cracking can be induced. However, the aspect
control assessment performed by Jones et al. [1997] is based on a limited number of
reported catchments which contain soil piping. A systematic survey of catchments,
using a consistent pipe detection method, has never been performed to test whether
there is a genuine aspect control on soil piping occurrence. In particular there have
been no large-scale intensive surveys to examine intra-basin pipe intensity variations
and the role of aspect in controlling such variation.
Many blanket peats in Britain have been artificially drained by moorland gripping.
This consists of open ditches approximately 50 cm wide by 50 cm deep cut into the
peat during the mid 20th
century [Holden et al., 2004]. The aim of gripping was to
drain the peat in order to �improve� the land for pasture and bird shooting. However,
Holden et al. [2004] suggested that this practice may promote the shrinkage and
cracking of the peat [Egglesmann et al., 1993; Holden and Burt, 2002b], resulting in
enhanced macropore and pipe development. However, there have been no surveys to
compare piping in drained peats versus intact peats making it difficult to establish
whether this is the case.
This paper reports on a survey of 160 British catchments dominated by blanket peat.
The sample survey was carried out using the same GPR technique throughout, in
order to provide a standard to allow fair comparison between catchments and in order
to assess, for the first time, the relative roles of aspect, slope, topographic position and
moorland gripping. The paper aims to:
8
Page 11
i) Determine the extent to which piping is found in blanket peats (is it ubiquitous,
what is its mean frequency, and how variable is it?)
ii) Examine the relative roles of topographic position, slope, aspect (and precipitation)
and moorland gripping on pipe frequency.
iii) Suggest process-mechanisms associated with controls on pipe frequency that can
be examined by further research.
2. Methods
i) Fieldwork
A total of 160 upland blanket peat catchments between 0.8 km2 and 4.2 km
2 across
Britain were surveyed (Figure 1). The small range in catchment size was used in order
to minimize any potential scaling errors. The catchments were chosen systematically
so that areas of British blanket peat were representatively sampled. Hence the greatest
number of survey catchments occurred in northern Scotland which represents the
largest blanket peat deposit in Britain. However, catchments in Exmoor, Dartmoor,
Wales, North York Moors, South Pennines, North Pennines, Grampian and
Cairngorms, Caithness and Sutherland, Dumfries and Galloway and the Isle of Skye
formed part of the survey. Afforested catchments were not part of this survey. Figure
1b highlights those survey catchments with mean annual precipitation greater and less
than 1500 mm. Figure 2 shows the distribution of catchment altitude (mean of the
maximum and minimum altitude), mean stream slope and mean annual precipitation
among the sampled catchments. Blanket peat catchments tend to be relatively shallow
sloping in nature with high annual precipitation totals.
9
Page 12
Hillslope piping was surveyed using GPR. In each catchment two hillslopes were
surveyed with three plots on each hillslope. Typically the two survey hillslopes in
each catchment were facing each other so that they had opposite aspects. In order to
minimize scaling errors each hillslope was chosen so that its total length from the
divide to streambank was between 200 and 500 m. On each hillslope one plot was
located on the flatter topslope near the summit, one on the hillslope toe and one on the
steeper midslope section midway between the top and footslope plots. There were
therefore 960 hillslope pipe density surveys, each performed using the same technique
and thus allowing comparison between catchments. Each plot consisted of six 20 m
transects running transverse across the slope with each transect 10 m apart upslope.
Thus, each plot was 50 m x 20 m and a total of 115.2 km of GPR survey took place.
The GPR was traversed across each transect using 100 and 200 MHz antennae
(depending on peat depth) with standard separation distances of 1 m and 0.5 m
respectively. As Holden et al. [2002] provide details of the technique, only a summary
is provided here. Signals were emitted at 10 cm intervals along the transect. Because
GPR transmits energy through the ground in wide beam, the antennae are therefore
not detecting reflections from directly vertically below, but also to the front, back and
sides. The GPR should therefore be able to detect features (such as soil pipe cavities)
that are between the 10 cm sampling interval. The number of pipes identified on the
radargrams was then counted and the density of piping was calculated as the number
of pipes per km of survey transect for each plot. Unfortunately as GPR cannot provide
information on pipe diameters, no information about the relative size of pipes on
different parts of the hillslope could be obtained.
10
Page 13
Aspect, slope, and the presence (or lack) of moorland gripping was noted at each site.
The topographic (a/s) index was calculated for the midpoint of each plot (the ratio of
the area drained per unit contour length, a, and the slope, s, [Carson and Kirkby,
1972] as an indicator of the topographic concentration of drainage. This index was
calculated from ground survey which is known to be a more reliable method than
using maps which suffer from scale problems [Jones, 1986; Jones, 1997b]. Data on
peat depth were also collected for each plot using coring rods. In addition, for eight
hillslopes (hence 24 plots), values of saturated hydraulic conductivity (k) and dry bulk
density (DBD) were measured at 10 cm vertical intervals down through the peat
profile using the technique described in Holden and Burt [2003a] and Warburton et
al. [2004]. This allowed some indication as to whether differences in pipe intensity
were related to local peat properties.
In addition to hillslope piping, the intensity of streambank piping was also surveyed.
This was done by walking up the main channel of each catchment and measuring the
depth and diameter of each pipe. In one catchment (in the Dee headwaters around Mar
Lodge, in the Grampians) this was not possible as the main channel had a wide
alluvial floodplain consisting of coarse gravels so that hillslope pipes were not
directly coupled to the stream channel.
ii) Analytical techniques
It is hillslope piping which forms the focus of this paper and as such the unit of
replication is the hillslope plot (n=960). Individual transects within plots are not
considered separately. Data were tested for normality and square root transformations
were found to improve distributions, making them less skewed and more importantly
11
Page 14
providing more constant variability within topographic position, aspect and gripping
presence categories. Despite ANOVA (single one-way and general linear model
(GLM)) being quite robust to non-normal data it is more reliable when data are
normally distributed or are close to normal and hence it was felt that data
transformations were justified. Both categorical data (e.g. presence of gripping,
aspect, topographic position) and continuous data (e.g. precipitation) were used in the
GLMs. Aspect was categorized into eight groups (N, NE, E, SE, S, SW, W, NW).
3. Results
Soil pipes were detected in all 160 catchments with a mean of 69.2 per km of GPR
transect (standard error = 2.1) and a maximum of 466.7 km-1
. No pipes were found
below fifty of the plots. Table 1 provides results of a single one-way ANOVA based
on square root transformed data for the number of pipes per km of GPR survey.
Topographic position (topslope, midslope, footslope) appears to be an important
control on soil pipe intensity. The differences between the slope positions are shown
on Figure 3. Footslopes and topslopes have significantly greater pipe intensities than
midslopes. Indeed topslopes have significantly more soil pipes than both footslopes
and midslopes (p <0.001).
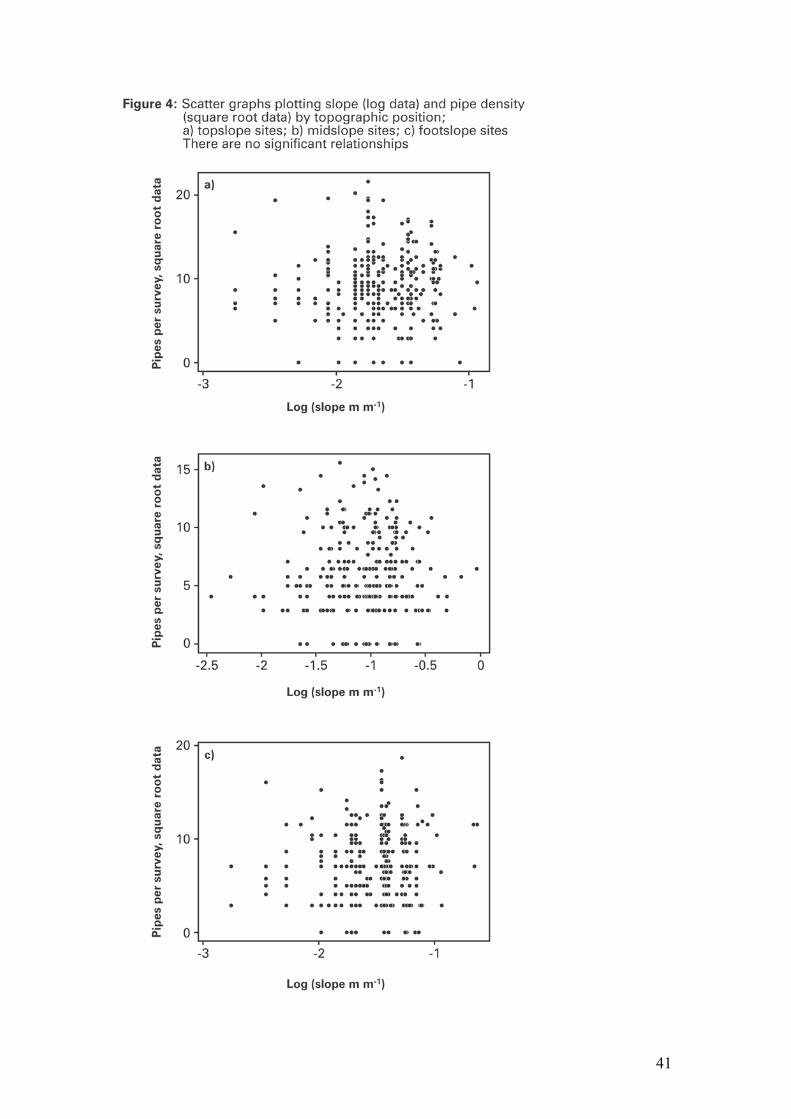
Given that there is a need to distinguish between topographic context and slope angle
I decided to examine the role of slope both overall and for each topographic position
separately. Figure 4 shows that there was no significant relationship between pipe
intensity and slope angle. Hence slope is not considered any further in the following
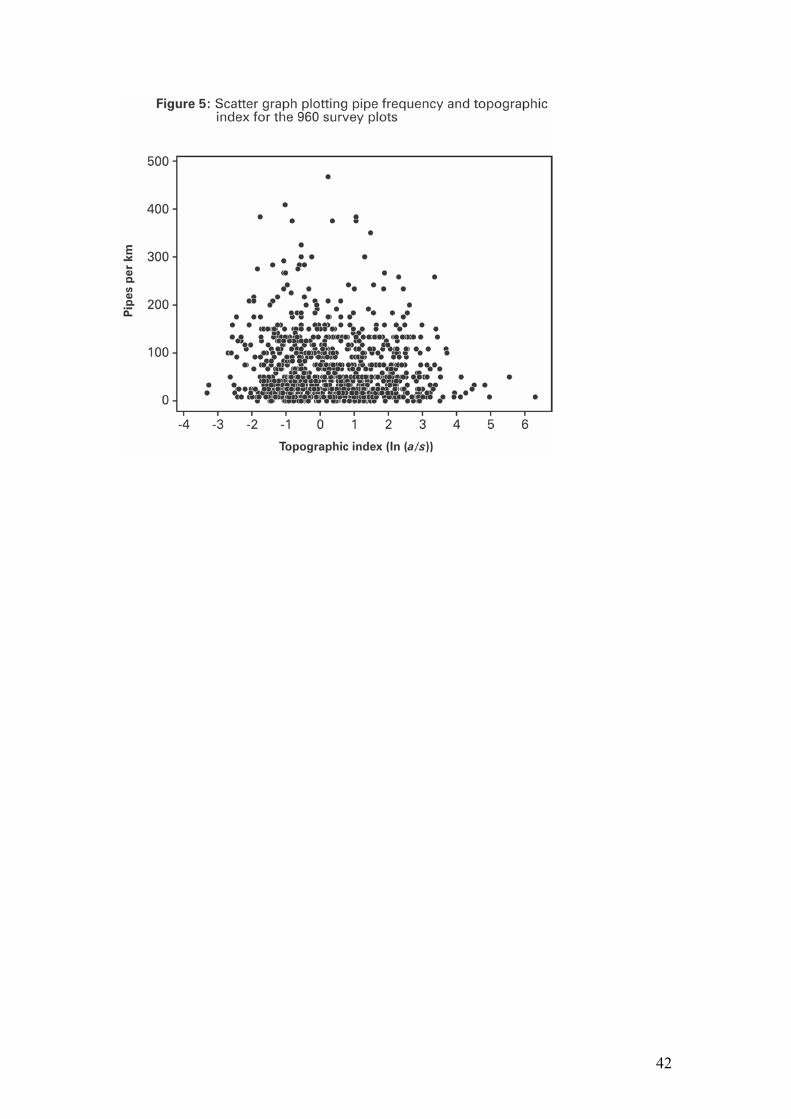
analysis. Similarly there were no significant relationships between the topographic
index (ln a/s) and pipe intensity, although Figure 5 shows that there is a tendency for
12
Page 15
the greatest pipe intensities to be found where the topographic index is between -2 and
2.
Table 2 provides results of a GLM in which I investigated what variables control the
variation in soil pipe intensity. Interactions among variables are also considered.
Slope position and the presence or absence of gripping exerts the strongest control
while mean annual precipitation had a minor effect (significant at p = 0.059). Aspect
does not significantly control pipe frequency. Of the interactions between variables,
only aspect x gripping was significant.
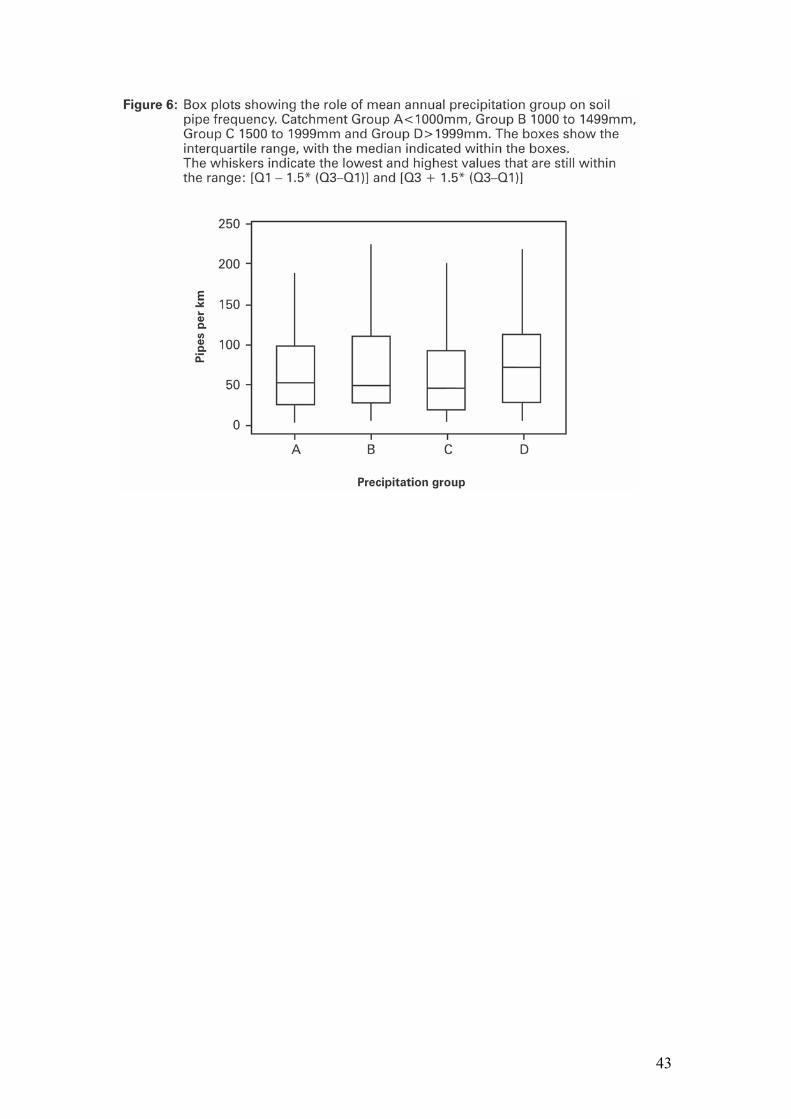
The GLM used continuous data for precipitation but there is considerable scatter and
when these data are unpacked by grouping precipitation into four classes a clearer
picture of the response emerges (Figure 6). It is the wettest catchments (with mean
annual precipitation greater than 2000 mm) that have significantly more hillslope soil
pipes per survey length than catchments with precipitation below 2000 mm per year.
Noteably, no significant differences in pipe frequency exist between the three classes
below 2000 mm. When the catchments with precipitation greater than 2000 mm are
taken out of the GLM presented in Table 2, precipitation was not found to be a
significant factor controlling piping at the 90 % confidence level. Thus, precipitation
appears to be a dominant control in the very wettest peat catchments. However, when
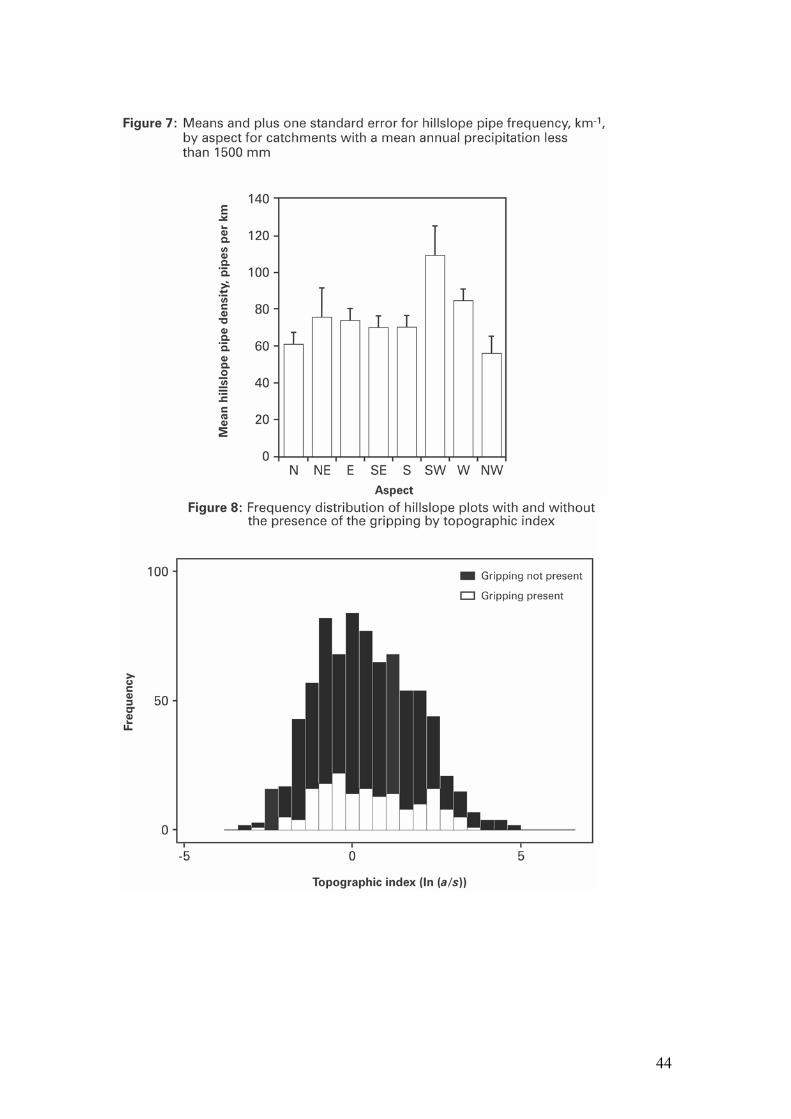
the wettest catchments were removed from the analysis, aspect became a significant
factor (p = 0.003). This being the case, I decided to examine the roles of aspect in
drier and wetter catchments. Aspect exerts a significant control on pipe density where
mean annual precipitation is less than 1500 mm (Figure 7; see also Figure 1). In
Figure 7 I plot mean soil pipe frequency with standard errors for �dry� catchments by
13
Page 16
aspect showing that there is a tendency for greater pipe densities on hillslopes facing
southwest and west.
Gripped hillslope plots (n = 171) had significantly more soil pipes than non-gripped
plots (n = 789) at p<0.001, with a mean of 127.4 pipes km-1
(standard error = 6.2) for
gripped sites and 56.6 pipes km-1
(standard error = 2.0) for non-gripped sites. It is
often assumed that moorland gripping in peats took place on wetter sites (although
there is no evidence to support this and most UK gripping was ad hoc due to readily
available grant aids during the 1970s; Holden et al., 2004). However, in order to test
whether the result obtained above was not simply a function of gripping taking place
where piping was already very intense (i.e. in wet areas), further analyses were
performed. Two cases were explored. I compared apparent gripping effects in very
wet catchments (mean annual precipitation greater than 2000 mm) and in the drier
catchments. Gripping was found in catchments throughout the full precipitation range.
In all cases (four precipitation groups as above) gripped plots had significantly more
pipes than non-gripped plots (p<0.001). In a second approach I used the topographic
index as an indicator of �wetter� areas. It would be expected that sites with a low
topographic index would be subject to more prolonged saturation than those areas
with a higher topographic index. Gripping was found across almost the full range of
topographic index values surveyed (Figure 8). When sites were grouped into
topographic index classes (n = 240 in each class; classes equivalent to <0.49 km, 0.49
to 1.35, 1.36 to 4.49 and > 4.50 km), gripped plots had significantly higher soil pipe
intensities than non-gripped plots in all cases. The impact of gripping is therefore
independent of wetness.
14
Page 17
I also tested for the impact of peat depth on pipe frequency. Deeper peats may be
liable to have more pipes (and larger pipes) per GPR transect than shallow peats
because there is a greater volume of peat within which pipes can develop. Peat depth
was weakly positively correlated with pipe frequency (p = 0.035; c = 0.16); deeper
peats tended to have slightly greater densities of soil pipes. In addition, topslopes and
footslopes tended to have deeper peat than midslopes providing one reason why
topographic position may exert significant control on pipe frequency. I note that the
influence is weak and not enough to explain the magnitude of the differences
observed.
Unfortunately, GPR does not provide information on pipe dimensions. However, data
from streambanks on peat depth and pipe diameter was available. The mean number
of pipes per km of streambank was 19.7 (geometric mean 13.9) with a standard error
of 1.29, a minimum of 0.5 and maximum of 95.6. The mean cross-sectional area of
pipes per km of streambank was 0.556 m2 km
-1 (geometric mean, 0.088) with a
standard error of 0.136 m2 km
-1. Mean pipe diameter and peat depth at the streambank
were positively correlated (c = 0.41, p < 0.001). Based on data for each pipe there
were too many data points to allow clear plotting of this relationship; for clarity I plot
in Figure 9 the mean streambank peat depth and mean pipe diameter for each
catchment.
As in other reports [e.g. Holden and Burt, 2002a; 2003b], soil pipes were found not
just within the peat itself but also at the interface between the peat and the underlying
substrate and within the substrate itself. Of the soil pipe outlets at streambanks, 36 %
15
Page 18
had their floors entirely within peat, 56 % at the interface between the peat and
underlying substrate, and 8 % were entirely within the underlying substrate.
The analysis above has demonstrated that land management (gripping) and
topographic position are dominating controls on hillslope pipe frequency in blanket
peats. Gripping results in increased drying of the peat and enhanced crack
development [Holden et al., 2004] and thus promotes conditions conducive to pipe
development. However, it is less obvious why the topographic position is so
important. A minor influence from peat depth has already been mentioned. Data
presented in Figure 10 illustrates the variability of k and dry bulk density (DBD) on
one of the survey hillslopes. There is a much greater variability in k and DBD on the
topslope and footslope parts of this hillslope than in the midslope section. Table 3
shows that this trend is consistent across the eight survey hillslopes on which k and
DBD where measured. The standard deviation of k for midslope plots is only 6.5 x 10-
6 cm s
-1, compared to 20.4 and 16.2 x 10
-6 cm s
-1 for top and footslope plots. In
addition, the average of k is slightly higher on the midslopes. This is indicative of
better and more uniform drainage through the midslope parts of the hillslope. DBD
varies less in the midslope regions. Peatland piping may therefore be a function of
inherent soil properties on different parts of the hillslope. Topslope peats appear to be
more susceptible to piping because the structure of the peat itself is more variable and
is thus more conducive to wandering pipe development. Midslope peats tend to have a
more uniform peat structure which is reflected in k being much less variable.
4. Discussion
16
Page 19
Piping appears to be ubiquitous in blanket peats. The results above have demonstrated
some important controls on pipe frequency within blanket peat catchments.
Topographic position is important whereas slope gradient and topographic index are
not significant. One of the reasons that slope may not be an important factor here is
that blanket peats do not readily form on slopes greater than 15o, due to the need for
waterlogged conditions. Unlike the sites reported by Jones [1981] and Gutierrez et al.
[1997] the full range of slope gradients was not covered by this blanket peat survey.
In Gutierrez et al. (1997), for example, steep arid zone piping occurred on slopes of
typically 18-60o.
The dominance of the topographic control suggests that piping and landform
development are intimately related. Some models simply propose that pipes result in
landform change (e.g., topographic depressions or gullying) [e.g., Pearsall, 1950;
Jones, 1990; 1994a; 1994b; 1997b] or that existing topography promotes enhanced
flow in concentrated areas of hillslopes which promotes piping [Anderson and Burt,
1982]. However, I propose that the nature of the underlying topography (and its
associated drainage conditions) promotes differential build up of the peat deposits.
This occurs because of the development of micro pools and larger bog pool systems
on hilltops and toes which are colonized by a mosaic of plants with specialist
positions within the microtopography. The remains of these plants are then
incorporated into the peat as it thickens, resulting in a peat of variable properties
throughout its profile. In addition, bog pool development tends to be a cyclic process;
pools disappear from one spot in a peatland while new ones form elsewhere as
differential plant growth in pools and hummocks interacts with an ever-changing local
topography while the peat deposit thickens [e.g. Weber, 1902; Clymo, 1991; Glaser,
17
Page 20
1998; Belyea and Clymo, 1998]. This means that the peat in certain parts of hillslopes
(tops and toes) is inherently more susceptible to preferential flow and piping. In
essence this has many similarities to the general Conacher and Dalrymple [1977] nine
unit landsurface classification, which in the case of piping, has until now been very
difficult to test [Jones, 1990]. On hilltops and hill toes, results above suggest that the
peat is more heterogeneous (e.g., highly variable DBD and k). Holden and Burt
[2003a] showed that shallow throughflow dominated as the runoff process on blanket
peat midslopes. This compares to footslopes and topslopes where saturation-excess
overland flow dominated and there was more switching between overland flow and
throughflow dependent on antecedent conditions. Better drained midslopes therefore
have a more uniform structure, less variable k, and more uniform (spatially and
temporally) runoff production. The associated midslope plant formations tend to be
more homogeneous. Midslopes are therefore less susceptible to wandering and
branching pipe networks. This homogeneity combined with gradient will allow pipe
branching to be at a minimum on midslopes.
Jones [1981] noted that pipes are common where hydraulic conductivity changes
abruptly. Results in this paper and in Holden and Burt [2003a] suggest that there can
be up to two orders of magnitude variation in k, vertically and laterally, over just 10
cm of peat. This is particularly prominent on top and footslopes. Noteably, these are
also sites where the change in hydraulic gradient is greatest. On convexo-concave
hillslopes the hydraulic gradient increases towards the midslope from the topslope,
and then decreases from the midslope to the footslope. Thus greater changes in
hydraulic gradients and peat heterogeneity combine on hillslope toes and tops to
increase the propensity for wandering preferential flow and pipe formation. In
18
Page 21
addition as peat depths are often greater on hilltops and toes, more (and larger) pipes
can form. Holden [2004], for example, showed that pipe networks could overlap each
other vertically in the soil profile and yet not be hydrologically connected. This is less
likely in a shallower peat because the pipes are more likely to connect to form one
pipe.
The slope position control outlined above for piping is strikingly similar to many
surface erosion features seen in blanket peatlands and suggests that both processes are
linked. Bower [1960] described two types of gully erosion in blanket peats. Type 1,
consisting of a close network of freely and intricately branching gullies, occurred on
hill tops of deep peat (>1.5 m). In contrast more open, linear gully systems with less
branching (Type 2) were more common on midslopes where gullies form sub-parallel
trenches running downslope.
The influence of precipitation in controlling soil pipe frequency in blanket peat is
minor (although there is a requirement for a water surplus to maintain the presence of
blanket peat). Only the very wettest peat catchments, with mean annual precipitation
greater than 2000 mm, had higher pipe frequencies than other peats. However, it was
only in the drier peatlands that aspect became a significant control. Blanket peats
typically have water tables that are within a few centimeters of the surface [Evans et
al., 1999; Holden and Burt 2003b]. Drier peatlands will more frequently experience
water table lowering during dry summer periods. This promotes shrinkage and
cracking [Gilman and Newson, 1980] and thus the more frequent initiation of
macropore networks that may then enlarge to form pipe networks [Crouch et al.,
1986; Jones, 1990]. Southwesterly facing slopes, which ought to receive the most
19
Page 22
summer insolation in the UK, tended to have more intense soil piping than slopes with
other aspects in catchments where mean annual precipitation was less than 1500 mm.
The land management practice of moorland gripping was found to have the most
influence on pipe frequency. Grips expose a bare peat surface to summer sunshine,
resulting in increased desiccation cracking [Holden et al., 2004], and to enhanced
winter needle ice formation, which also disturbs the peat structure [Francis, 1990]. In
addition the grips reduce the downslope saturation of the hillslope (by redirecting
flow along the contour to the stream and preventing water from following its natural
course downslope), thereby inducing cracking further away from the grip walls and
floors. Holden et al. [2001] showed that macropore flow was an important feature of
blanket peat hydrology and Holden and Burt [2002b] showed that drought on peats
could permanently increase macroporosity, the amount of infiltration, the amount of
throughflow and the amount of macropore flow. One would expect that gripping
would have the same effect, although this has never been properly tested. Once cracks
open up and a peat surface dries, it often fails to fully resaturate (it can become partly
hydrophobic). In other words, the peat can no longer hold as much water as its
structure is permanently altered [Hobbs, 1986; Egglesmann et al., 1993]. This
promotes conditions conducive to pipe network development across gripped
hillslopes. While it is not possible to verify that pipe densities were not already high
on plots before they were gripped, data presented here strongly suggests that this was
not the case. Gripped plots were compared to hydrologically similar ungripped plots
(same topographic index and same precipitation groups).
20
Page 23
Many wetland restoration schemes attempt to place small dams into ditch (grip)
networks in order to block them. This study suggests that those interested in wetland
restoration may need to consider the changes to peatland structure and hydrological
routing since the grips were installed. This re-routing of water through subsurface
pipe networks may be fundamental to future peatland and landscape development.
Most undisturbed blanket peats are dominated by overland flow and shallow
throughflow within the top few centimeters of the peat mass [Holden and Burt,
2003b; 2003c] while typically only 10-30 % of the runoff may move through a
subsurface pipe network to the stream channel [Holden and Burt, 2002a]. Following
gripping, far more water may move through subsurface bypassing routes.
5. Conclusions
This paper has served to provide, for the first time, a comparative survey of hillslope
soil pipe frequency in a range of blanket peat catchments. Soil pipes were found in all
160 survey catchments. Piping appears to be ubiquitous in British blanket peats. The
analysis has shown that i) land management (gripping) is the most important control
on hillslope pipe frequency in blanket peats; there are more pipes where land drainage
has occurred; ii) topographic position is also an important factor with topslopes
having greater pipe frequencies than footslopes which have greater pipe frequencies
than midslopes; iii) slope gradient is not a significant factor in blanket peat piping; iv)
while aspect is not a significant factor in general but there is an important interaction
with precipitation such that the very wettest catchments have more pipes; aspect is
only a control in the drier catchments where southwesterly facing slopes tend to have
more piping. The result is that while there is less water available to develop and keep
open pipe networks (and hence there is less piping than in the very wettest
21
Page 24
catchments) there are probably more pipes in the drier catchments than would
otherwise be the case. Nevertheless, aspect is a minor secondary control.
I propose that inherent peat structural properties associated with peatland
development exert important controls on pipe network development. Further work is
required to test this hypothesis. Hill tops and toes with more heterogeneous peats are
also sites where hydraulic gradients change significantly. These two factors combined
result in a more wandering and branching pipe network on hill tops and toes, and
more linear simple pipe systems on midslopes. Similar surface gully landforms have
been observed in blanket peats. While this would suggest that midslope pipes are
likely to be larger than those elsewhere, unfortunately GPR does not provide
information on pipe geometry. Further work is required to contest this. It should also
be noted that as GPR run at these frequencies does not tend to detect pipes that are
smaller than 10 cm in diameter, there could be many smaller but important pipes that
have not been detected by this survey.
It is important that land management has been shown to exert the largest influence (of
all the factors investigated) on soil pipe frequency. It is well known that land
management can inadvertently change the dominant runoff production processes
within a catchment. Moorland gripping appears to promote the role of subsurface
preferential flow through piping, resulting in accelerated subsurface erosion. Given
that peatlands are a fundamental terrestrial carbon store, land management practices
that can promote carbon loss should be avoided. While grip blocking practices in the
UK and in many other countries with artificial peatland drainage are already
underway [Holden et al., 2004], further research is required to examine whether these
22
Page 25
wetland restoration strategies are able to cope with enhanced piping and to ensure that
piping is adequately taken into account when developing blanket peat management
plans.
23
Page 26
Acknowledgements
This research was supported by a small HSBC Holdings research grant from the
Royal Geographical Society (with the Institute of British Geographers). The work was
carried out while the author was in receipt of a UK Natural Environment Research
Council Fellowship NER/I/S/2001/00712. The author would also like to thank the
three referees for comments that have improved this paper.
24
Page 27
References
Anderson, M.G., and T.P. Burt (1982), Throughflow and pipe monitoring in the
humid temperate environment, in Badland geomorphology and piping edited by R.
Bryan and A. Yair, pp337-354, Geobooks, Norwich.
Anderson, M.G., and T.P. Burt (1990), Subsurface runoff, in Process studies in
hillslope hydrology, edited by M.G. Anderson and T.P. Burt, pp365-400, John Wiley,
Chichester.
Beckwith, C.W., A.J. Baird, and A.L. Heathwaite, (2003), Anisotrophy and depth-
related heterogeneity of conductivity in a bog peat. I: laboratory measurements,
Hydrol. Proc., 17, 89-101.
Bower, M.M. (1960), Peat erosion in the Pennines, Advancement of Science, 64, 323-
331.
Bower, M.M. (1961), Distribution of erosion in blanket peat bogs in the Pennines,
Trans. Inst. British Geographers 29, 17-30.
Byran, R.B. and J.A.A. Jones (1997), The significance of soil piping processes:
inventory and prospect, Geomorphology, 20, 209-218.
Carey, S.K, and M-K. Woo (2000), The role of soil pipes as a slope runoff
mechanism, Subarctic Yukon, Canada, J. Hydrol., 233, 206-222.
25
Page 28
Carson, M.A. and M.J. Kirkby (1972), Hillslope form and process. Cambridge
University Press, Cambridge.
Clymo, R.S. (1991), Peat growth, in E.J. Cushing and L.C. Shane (editors)
Quaternary landscapes, pp 76-112, University of Minnesota Press, Minneapolis,
Minnesota.
Conacher, A.J. and J.B. Dalrymple (1977), The nine-unit landsurface model: an
approach to pedogeomorphic research. Geoderma, 18, 1-154.
Crouch, R.J., J.W. McGarity and R.R. Storrier (1986), Tunnel formation processes in
the riverina area of N.S.W., Australia, Earth Surface Processes and Landforms, 11,
157-168.
Drew, D.P. (1982), Piping in the Big Muddy badlands, southern Saskatchewan,
Canada, in Badland geomorphology and piping, edited by R. Bryan and A. Yair,
pp293-304, Geobooks, Norwich.
Egglesmann, R., A.L. Heathwaite, G. Gross-Braukmann, E. Kuster, W. Naucke, M.
Schich, and V. Schweikle, (1993), Physical processes and properties of mires. In
Mires, process, exploration and conservation, edited by A.L. Heathwaite and Kh.
Gottlich (editors), pp171-262, Wiley, Chichester.
Elsenbeer, H. (2001), Hydrologic flowpaths in tropical rainforest soilscapes � a
review, Hydrol. Proc., 15, 1751-1759.
26
Page 29
Evans, M.G., T.P. Burt, J. Holden and J.K. Adamson, (1999), Runoff generation and
water table fluctuations in blanket peat: evidence from UK data spanning the dry
summer of 1995, J. Hydrol., 221, 141-160.
Francis, I.S., (1990), Blanket peat erosion in a mid-Wales catchment during two
drought years, Earth Surface Processes and Landforms, 15, 445-456.
Gilman, K. and M.D. Newson (1980), Soil pipes and pipeflow; a hydrological study
in upland Wales. British Geomorphological Research Group Research Monograph
No. 1, Geobooks, Norwich.
Glaser, P. (1998), The distribution and origin of mire pools. In Patterned mires and
mire pools: origin and development; flora and fauna, Proceedings, University of
Durham, 6-7 April, 1998, edited by V. Standen, J.H. Tallis, and R. Meade, pp 4-25,
British Ecological Society, London.
Gutierrez, M., C. Sancho, G. Benito, J. Sirvent, and G. Desir, (1997), Quantitative
study of piping processes in badland areas of the ebro Basin, NE Spain,
Geomorphology, 20, 237-253.
Harvey, A. (1982), The role of piping in the development of badlands and gully
systems in south-east Spain, in Badland geomorphology and piping, edited by R.
Bryan and Y. Aaron, pp317-336, Geobooks, Norwich,
27
Page 30
Higgins, C.G. (1990), Gully development, in C.G. Higgins and D.R. Coates (editors)
Groundwater Geomorphology; the role of subsurface water in Earth-Surface
Processes and Landforms. Geol. Soc. of Am. Spec. Pap., 252, 139-155.
Hobbs, N.B. (1986), Mire morphology and the properties and behaviour of some
British and foreign peats. Quart. J. Engin. Geol., 19, 7-80.
Holden, J. (2004), Hydrological connectivity of soil pipes determined by ground
penetrating radar tracer detection, Earth Surface Processes and Landforms, 29, 437-
442.
Holden, J, and T.P. Burt (2002a), Piping and pipeflow in a deep peat catchment,
Catena 48, 163-199.
Holden, J. and T.P. Burt (2002b), Laboratory experiments on drought and runoff in
blanket peat, Euro. J. Soil Sci., 53, 675-689.
Holden, J. and T.P. Burt (2002c), Infiltration, runoff and sediment production in
blanket peat catchments: implications of field rainfall simulation experiments, Hydrol.
Proc., 16, 2537-2557.
Holden, J. and T.P. Burt (2003a), Hydraulic conductivity in upland blanket peat;
measurement and variability, Hydrol. Proc., 17, 1227-1237.
28
Page 31
Holden, J. and T.P. Burt (2003b), Hydrological studies on blanket peat: The
significance of the acrotelm-catotelm model, J. Ecol., 91, 86-102.
Holden, J. and T.P. Burt (2003c), Runoff production in blanket peat covered
catchments. Water Resour. Res., 39, 1191, doi: 10.1029/2003WR002067.
Holden, J., T.P. Burt, and N.J. Cox (2001), Macroporosity and infiltration in blanket
peat: the implications of tension disc infiltrometer measurements, Hydrol. Proc., 15,
289-303.
Holden, J., T.P. Burt, and M. Vilas (2002), Application of ground-penetrating radar to
the identification of subsurface piping in blanket peat, Earth Surface Processes and
Landforms, 27, 235-249.
Holden, J., P.J. Chapman, and J.C. Labadz (2004), Artificial drainage of peatlands:
Hydrological process and wetland restoration, Prog. Phys. Geog., 28, 95-123.
Ingram, H.A.P. (1990), Hydrology. In Ecosystems of the World 4A, Mires: swamp,
bog, fen and moor edited by A.J.P. Gore, pp67-158, Elsevier, Oxford.
Jones J.A.A. (1981), The nature of soil piping: a review of research, British
Geomorphological Research Group Monograph Series 3, Geobooks, Norwich, 1981.
29
Page 32
Jones J.A.A. (1986), Some limitations to the a/s index for predicting basin-wide
patterns of soil water drainage. Zeitschift fur geomorphologie supplementband, 60, 7-
20.
Jones, J.A.A. (1990), Piping effects in humid lands. In C.G. Higgins and D.R. Coates
(editors) Groundwater Geomorphology; the role of subsurface water in Earth-Surface
Processes and Landforms. Geology Society of America Special Paper, 252, 111-137.
Jones, J.A.A. (1994a), Soil piping and its hydrogeomorphic function. Cuaternario y
Geomorfologia, 8, 77-102.
Jones, J.A.A. (1994b) Subsurface flow and subsurface erosion. In Process and form in
geomorphology edited by D.R. Stoddart, pp74-120, Routledge, London.
Jones, J.A.A. (1997a), Pipeflow contribution areas and runoff response. Hydrol.
Proc., 11, 35-41.
Jones, J.A.A. (1997b), The role of natural pipeflow in hillslope drainage and erosion:
extrapolating from the Maesnant data, Physics and Chemistry of the Earth, 22, 303-
308.
Jones, J.A.A. (2004), Implications of natural soil piping for basin management in
upland Britain, Land Degradation and Development, 15, 325-349.
30
Page 33
Jones, J.A.A. and F.G Crane (1984), Pipeflow and pipe erosion in the Maesnant
experimental catchment. In Catchment Experiments in Fluvial Geomorphology edited
by T.P. Burt, and D.E. Walling, pp55-72, Geobooks, Norwich.
Jones J.A.A, J.M., Richardson, and H.J. Jacob (1997), Factors controlling the
distribution of piping in Britain: a reconnaissance, Geomorphology, 20, 289-306.
Pearsall, W.H. (1950), Mountains and Moorlands. Collins, London.
Rawes, M. and D. Welch (1969), Further studies on sheep grazing in the northern
Pennines, Journal of the British Grassland Society, 19, 56-61.
Radley, J. (1962), Peat erosion on the high moors of Derbyshire and West Yorkshire,
East Midland Geographer, 3, 40-50.
Tallis, J.H., R. Meade, and P.D. Hulme, (1998), Introduction, in Blanket Mire
Degradation, Proceedings edited by J.H. Tallis, R. Meade, and P.D. Hulme, pp1-2,
Mires Research Group, British Ecological Society, Aberdeen.
Terajima, T., T. Sakamoto, and T, Shirai (2000), Morphology, structure and flow
phases in soil pipes developing in forested hillslopes underlain by a Quaternary sand-
gravel formation, Hokkaido, northern main island in Japan, Hydrol. Proc., 14, 713-
726, 2000.
31
Page 34
Turetsky, M.R., R.K. Wieder, L.A. Halsey, and D.H. Vitt (2002), Current disturbance
and the diminishing peatland carbon sink, Geophys. Res. Letters, 29, doi:
10.1029/2001GL014000.
Uchida T., K. Kosugi, T. Mizuyama (1999), Runoff characteristics of pipeflow and
effects of pipeflow on rainfall-runoff phenomena in a mountainous watershed, J.
Hydrol, 222, 18-36.
Warburton, J., J. Holden, and A.J. Mills, (2004) Hydrological controls of surficial
mass movements in peat. Earth-Science Reviews, 67, 139-156.
Weber, C.A. (1902), Uber die vegetation und Entstehung des Hochmoors von
Augstumal im Memeldelta mit vergleichenden Aus blacken aut andere Hochmoore der
erde. Paul Parey, Berlin.
Worrall, F., M Reed, J. Warburton and T.P. Burt (2003), Carbon budget for a British
upland peat catchment, Sci. Tot. Env., 312, 133-146, 2003.
Zhu, T.X., S.H. Luk, and Q.G Cai (2002), Tunnel erosion and sediment production in
the hilly loess region, north China, J. Hydrol., 257, 78-90.
32
Page 35
Figure captions
Figure 1. Location of survey catchments; a) areas of blanket peat in Britain; b) study
catchments grouped by those with mean annual precipitation greater or less than 1500
mm.
Figure 2. Frequency distributions showing the characteristics of the 160 survey
catchments; a) catchment altitude, m above mean sea level (mean of the maximum
and minimum altitude of the surveyed catchment); b) mean stream slope, m m-1
; c)
mean annual precipitation, mm.
Figure 3. Box plots showing the effects of topographic position on soil pipe
frequency, units of pipes km-1
. The boxes show the interquartile range (quartile 1 (Q1)
and Q3), with the median indicated within the boxes. The whiskers indicate the lowest
and highest values that are still within the range: [Q1 � 1.5*(Q3-Q1)] and [Q3 +
1.5*(Q3-Q1)]
Figure 4. Scatter graphs plotting slope and pipe frequency (square root data) by
topographic position; a) topslope sites; b) midslope sites; c) footslope sites.
Figure 5. Scatter graph plotting pipe frequency and topographic index for the 960
survey plots.
Figure 6. Box plots showing the role of mean annual precipitation group on soil pipe
frequency. Catchment Group A < 1000 mm; Group B 1000 to 1499 mm, Group C
1500 to 1999 mm; Group D > 1999 mm. The boxes show the interquartile range, with
33
Page 36
the median indicated within the boxes. The whiskers indicate the lowest and highest
values that are still within the range: [Q1 � 1.5*(Q3-Q1)] and [Q3 + 1.5*(Q3-Q1)]
Figure 7. Means and plus one standard error for hillslope pipe frequency, km-1
, by
aspect for catchments with a mean annual precipitation less than 1500 mm.
Figure 8. Frequency distribution of hillslope plots with and without the presence of
gripping by topographic index.
Figure 9. Mean streambank pipe diameter and streambank peat depth for each of the
survey catchments.
Figure 10. Saturated hydraulic conductivity and dry bulk density profiles for a
peatland hillslope by slope position; a) topslope; b) midslope; c) footslope
34
Page 37
Tables.
Table 1. Single one-way analysis of variance of the role of topographic position on
pipe frequency per km of survey transect, square root transformed data.
Source of
variation
Degrees of
freedom
Mean square F ratio Probability
Topographic
position
2 777.0 55.6 <0.001
Residual 957 13.6
Total 959
35
Page 38
Table 2. ANOVA GLM of pipe intensity
Source of
variation
Degrees of
freedom
Mean square F ratio Probability
Slope position 2 63.8 5.8 0.003
Aspect 7 16.9 1.5 0.156
Gripping 1 211.9 19.1 <0.001
Precipitation 1 39.6 3.6 0.059
Slope position
x aspect
14 2.6 0.2 0.998
Slope position
x gripping
2 22.1 2.0 0.136
Slope position
x precipitation
2 1.2 0.1 0.895
Aspect x
gripping
7 48.4 4.4 <0.001
Aspect x
precipitation
7 7.1 0.6 0.725
Gripping x
precipitation
1 8.1 0.7 0.392
Slope position
x aspect x
gripping
14 4.4 0.4 0.977
Residual 901 11.1
Total 959
36
Page 39
Table 3. Mean and standard deviation of peat depth, k (x 10-6
cm s-1
) and dry bulk
density (g cm-3
) by slope position based on vertical sampling at 10 cm soil depth
intervals.
Slope
position
Mean peat
depth, cm
Mean k Standard
deviation k
Mean dry
bulk density
Standard
deviation k
topslope 164 10.9 20.4 0.16 0.08
midslope 158 14.3 6.5 0.15 0.03
footslope 171 9.4 16.2 0.17 0.06
37