Page 1
1
Convenience store location planning and forecasting – a
practical research agenda
Abstract
Purpose: To compare the accepted techniques of location analysis in the food sector
with the realities of “real world” forecasting in convenience store (c-store) retailing. To
offer a conceptual framework for c-store operators intending to become more strategic in
their small store location planning but currently lacking established expertise or
extensive research budgets.
Approach/Methodology: Outlines potential best practice based on industry experience,
and contact and discussion with location analysts and retail consultants, as well as a
wide ranging examination of the academic literature in this area.
Research/practical implications: First, to briefly detail the strategic regulatory
motivations and location planning implications of the major UK food retailers entering
this market. Second, to summarise the established sales forecasting techniques in food
retailing. Third, to review why these established approaches are difficult to apply to
convenience stores in neighbourhood markets. Fourth, to detail basic approaches that
should be further developed by small store operators lacking budgets to develop
specialist location planning departments.
Originality/value: Academic conceptualisations of location planning in the convenience
store sector are largely absent from the literature. This paper adopts a practical
perspective.
Conceptual Paper
Keywords: store location, geographical information systems (GIS), gravity modelling,
convenience stores, food retailing
Steve Wood
School of Management, University of Surrey, Guildford, Surrey GU2 7XH
Tel: +44 (0)1483 686344
Fax: +44 (0)1483 686346
E-mail: [email protected] (Corresponding Author)
Sue Browne
The ORC Partnership, Goldings, Michael's Court, Hanney Road, Southmoor, Oxon,
OX13 5HR
Tel: +44 (0)1865 821112
Fax: +44 (0)1865 821567
E-mail: [email protected]
Revised manuscript following referees comments submitted to the International
Journal of Retail and Distribution Management, June 2006
Page 2
2
INTRODUCTION
The science of site selection and sales forecasting of retail stores has been a topic that has
received huge attention within both retail management and retail geography research since the
1960s (see the landmark texts: Davies and Rogers, 1984; Guy, 1980; Jones and Simmons, 1987;
Birkin et al., 2002). Primarily this has focused on the conceptualisation of techniques for
determining the optimal location and sales of the food supermarket (e.g. Clarkson et al., 1996;
Smith and Sanchez, 2003). There are clear and obvious reasons why this has been the case: first,
superstores are the principal format through which food is sold, accounting for 74% of total
grocery retail expenditure in the UK (IGD, 2005). Second, given the size of such stores, there is
a clear sunk cost related to each development and therefore accuracy in location planning is
essential (Wrigley, 1996). Third, such stores are dependent on the regular weekly expenditure
levels of consumers’, involve repeated car journeys from consumers’ homes that are habitual,
and therefore lend themselves to statistical geo-demographic modelling.
Unsurprisingly a dialectical relationship has built up between the academy and retailers with
considerable location decision-making expertise established at the leading supermarket retailers’
in-house site research departments (Rogers, 2005). This has been associated with the emergence
of thriving business opportunities for support companies such as Map Info, The ORC
Partnership, GMAP, CACI and Experian that provide assistance in decision-making or
alternatively provide geo-demographic data to support retailer’s own forecasting and model
development (González-Benito and González-Benito, 2005).
However, this academic focus on supermarket location has not been mirrored in research on
sales forecasting and location management in small store convenience retail markets; albeit with
a few exceptions arguably of limited practical value (e.g. Houston and Stanton, 1984; Lee and
Koutsopoulos, 1976; Sakashita, 2000). Partly this is due to the low relative investment levels
per unit (and therefore lower sunk cost and capital liability), as well as the less habitual nature of
convenience retail sales which complicate forecasting. Furthermore, convenience store
Page 3
3
operators have not historically enjoyed the scale and therefore the capital to invest in specialist
location planning departments and thus ‘location planning is often undertaken on the basis of
subjective rules of thumb and a degree of opportunism relating to the availability of individual
sites’ (Pioch and Byrom, 2004, 223), ‘intuition’ (Rogers, 1987) or ‘common sense’ (Hernandez
and Bennison, 2000).
More recently, however, major structural changes have occurred in the neighbourhood market
with aggressive expansion by Tesco, Sainsbury’s and the Co-op (Wood et al., 2006). This
exposes small neighbourhood retailers to competition with dominant operators, often with
international experience, that benefit from complex, efficient supply chains and buying
infrastructures with a strong tradition in location management. Tesco, for example, is widely
recognised to be at the forefront of location research and data analysis in food retail (Humby et
al., 2003; Rogers, 2005), while Sainsbury’s makes good use of its customer data and also
operates a specialised location research department (Miller et al., 2003). Characteristically it is
likely that these leading retailers will seek to leverage their greater degree of sophistication in
location planning into this sub-market - essentially “raising the bar” in small store sales
forecasting meaning competing neighbourhood retailers will themselves have to become more
sophisticated in their techniques.
The aims of this paper are fourfold: First, to briefly detail the strategic regulatory motivations
and location planning implications of the major UK food retailers entering this market. Second,
to summarise the traditional sales forecasting techniques used in food retailing that have been
well analysed within the academic literature. Third, to review why these established approaches
are difficult to apply to convenience stores in neighbourhood markets. Finally, the article
concludes by exploring how neighbourhood retailers can become more sophisticated in their
store location planning and forecasting even without sizeable budgets for high-tech location
planning solutions. This article is conceptual in nature, based on industry experience and
discussions with analysts who have experience of these issues. It also will act as a useful update
Page 4
4
to a series of easily accessible publications on practical location decision-making in this journal
from the mid 1980s (see Bowlby et al., 1984a; 1984b; 1985a; 1985b).
MARKET REGULATION AND THE SEARCH FOR NEW GROWTH VEHICLES IN
UK FOOD RETAILING
It has been argued elsewhere (Wood et al., 2006) that the foremost motivation for the entry of
the leading food retailers into the convenience market has been the degree of planning regulation
preventing the construction of the preferred large, and by definition, out of town centre formats.
The primary way that this has been in evidence is via the introduction of Planning Policy
Guidance Note 6 (PPG6) in 1993 – more significantly its revision in 1996, and its eventual
replacement in 2005 with Planning Policy Statement 6 (PPS6)i. This makes the development of
larger out-of-centre stores problematic through the introduction of the so-called “sequential test”
which essentially prioritises town centre sites by requiring developers to consider these first (CB
Hillier Parker, 2000), as well as placing the onus on the developer to prove quantitative “need”
for retail space (Adlard, 2001).
Unsurprisingly the leading UK food retailers have employed some innovative approaches to
achieve robust levels of growth. Most commonly this has been seen with store extensions
(Wrigley, 1998) that increasingly utilise mezzanine floors and, at the time of writing, do not
always require planning permission (Warren, 2004). More innovatively, we have seen
previously marginal locations for superstore development becoming acceptable to retailers and
given planning permission by local authorities due to retailer participation in socially inclusive
regeneration schemes (see Wrigley et al, 2002), as well as the entry into new retail markets
within the UK in the construction of standalone non food stores (Wood et al., 2006).
Internationalisation strategies have seen mixed success (Alexander et al., 2005) though, in the
case of Tesco, they have absorbed £5.5 billion of capital investment, leading to 50% of its
operating space being located outside the UK by the end of 2004 (e.g. Palmer, 2005; Rogers et
al., 2005).
Page 5
5
Neighbourhood market structural change 1997-2005
In addition to the wide range of innovative approaches described in the previous section, the
aggressive entry of Tesco and Sainsbury’s into the neighbourhood market is another reactive
strategy that has resulted in strong performance (Verdict Research, 2006). The ability of such
dominant operators to enter this market is largely the result of the Competition Commission’s
consistent stance that there are two separate markets in the wider UK grocery sector – the ‘one
stop’ shopping sector, which following the Commission’s Inquiry of 2000 and its rulings in the
case of the proposed acquisition of Safeway (Competition Commission, 2000, 2003), is now
extremely tightly regulated; and the convenience store sector, historically highly fragmented,
neglected by the leading firms and distinct in regulatory terms. This has meant that the leading
food retailers, traditionally operating in the one-stop market, have been able to acquisitively
enter the convenience sector regardless of their shares of the superstore and hypermarket
markets. Despite these changes of ownership, the UK neighbourhood retail market remains
relatively fragmented for the time being (see Table 1).
XX TABLE 1 ABOUT HERE XX
The major players were not the first to aggressively increase their scale in the convenience
market: instead, it was the Co-op that, following a strategic review in 1997, concluded there
should be a re-emphasis on small stores due to the dominance of the grocery majors’ large
formats. An acquisitive strategy then followed with the purchase of the 600 unit Alldays chain
in October 2002, followed by the acquisition of Balfour, a chain of 121 stores in July 2003.
However, the balance of power in the competitive landscape was transformed with the
acquisition of 862 unit T&S convenience stores by Tesco in January 2003 (Mintel, 2004). This
built on Tesco’s growing interest in the market, evident in the joint venture with Esso to offer
small format c-stores on the oil company’s forecourt locations. The initial success of that
concept suggested potential to roll out a standalone convenience store concept under the Tesco
‘Express’ banner.
Page 6
6
The T&S acquisition was followed with an announcement, at the end of January 2004, that
Tesco had made an agreed offer to buy 45 convenience stores from Adminstore, located
primarily within the M25; and in September 2005, that the grocer was purchasing 21 petrol
filling stations and convenience stores from rival Wm Morrison. By the end of the 2004/2005
financial year, Tesco had c.550 Express stores (with a significant programme of conversions still
to follow from the remaining unconverted One Stop stores) - considerable growth given that at
the time of the T&S acquisition the company only had around 130 Express stores mainly on
petrol forecourts with Esso.
Largely in response to Tesco’s initial forecourt stores, Sainsbury’s had similarly entered the
convenience store market in 1998 with the opening of its first ‘Local’ store. However, in
February 2004, Sainsbury’s responded to Tesco’s acquisition with the purchase of Bells Stores, a
54 unit chain located in the North-East of England, followed by the acquisition of the 114 strong
Jacksons chain in August 2004 with a portfolio focused in the North Midlands and Yorkshire.
Six more c-stores were added with the acquisition of East Midlands chain JB Beaumont in
November 2004, and finally Sainsburys acquired SL Shaw Ltd, a convenience store operator
with five stores in the South East of England in April 2005.
CONVENTIONAL SUPERSTORE SITE LOCATION ANALYSIS
The following section reviews the site assessment techniques that have been developed by
supermarket operators before examining how these become problematic to apply when the
spatial scale of analysis is narrowed to focus on convenience store catchments.
The task for the major food retailers’ location planning analysts is to provide expertise to
determine which sites should be developed and furnish decision-makers with reliable sales
forecasts: quantitative data that ultimately determines the affordability of a site purchase or lease
agreement. A ‘retailer lacking this information goes blind into the land-sale auction’
(Hallsworth, 1992, 177) so even in scenarios where sites are clearly appropriate for acquisition
and development, there is a need to quantify expectations. Indeed:
Page 7
7
seniority may legitimize the use of intuitive approaches by groups such as managers and
executives while employees lower down the hierarchy, even though they may be subject to
their own intuitions, may…need to legitimize their decisions by rationalizing through
collecting ‘hard data’ and analyzing it (Sadler-Smith and Shefy, 2004, 80).
Over time, the leading food retailers have developed highly data rich-methods of store
forecasting that have been widely reviewed in the business and retail geography literature (e.g.
Birkin et al., 2002). Typically such approaches are focused on large stores, over 10,000 sq ft in
size, with correspondingly extensive catchments that can be modelled using detailed geo-
demographic data. Hence, larger operators have been able ‘to tackle the uncertainties by
developing more sophisticated models in which they seek to incorporate all variables and
interactions’ (Dijst et al., 2005, 1333).
In doing so, the leading food retailers have built international reputations for accurate and canny
site purchase decision-making. For example, following high initial levels of investment in the
mid 1980s, Tesco has reduced average forecast store turnover error; with the company recently
claiming that 80% of new units are within 15% of forecast (Hyman and Ainsworth, 2005). The
sheer number of sites examined by the UK site research team is considerable with over 1,000
assessed throughout the UK annually (Rogers, 2005).
Gravity/Spatial interaction modelling and Geographical Information Systems (GIS)
A core technique used in sales forecasting at large supermarket operators is the gravity
modelling of food retail expenditure alongside the analogue store method (Benoit and Clarke,
1997). Gravitational models are derived from applying the Newtonian laws of physics to the
modelling of shopper behaviour based on the countervailing influences of the attractiveness of
the store and the distance between the shopper’s home and the store (Rogers, 1984). In short,
the probability of a consumer using a given store diminishes at an exponential rate as travel time
increases. While this modelling technique was theoretically useable, numerous studies during
the pre-computer age found it less than successful (Openshaw, 1973).
Over the past decade this form of market analysis has become considerably more effective
through the advancement of Geographical Information Systems (GIS) – labelled in the early
Page 8
8
1990s as a ‘paradigm shift in cartography’ (Morrison, 1994). This spatial representation of geo-
demographic and retail data is particularly powerful and based ‘on a crossing of digitalized
cartography in addition to relational databases’ (Mendes and Themido, 2004, 14) which
ultimately allows non-GIS specialists to quickly interpret and understand complex geo-
demographic patterns and trends. The introduction of GIS software has, for example, allowed
site analysis to be based on modelled “drivetimes” rather than simply straight line distance.
Clearly, a GIS and gravity model is only as good as the data that feeds it: hence retailers must
‘make full use of the datasets which exist internally’ and ‘proactively seek strategies which
allow the generation of additional datasets which support effective monitoring of customer
activity’ (Clarke and Rowley, 1995, 5). There are numerous external data supplying agencies
providing geodemographic data including CACI (ACORN), Acxiom (Personcix) and Experian
(MOSAIC) (González-Benito and González-Benito, 2005). This data typically segments
population in terms of variables such as lifestyle, family structure and income level and can be
utilised in combination with data from the Expenditure & Food Survey (EFS) from National
Statistics, the National Census (for population) and from loyalty card data. Ultimately data rich
catchment maps can be constructed to ‘analyse sites based on drivetime, demographic as well as
psychodemogaphic variables, competitive information, and customer information’ (Mendes and
Themido, 2004, 14). In doing so, the use of GIS and gravity models allows more precise and
accurate decisions to be made which becomes more important as the number of available sites
reduces and those remaining are all the more marginal and complex (Byrom et al., 2001).
Analogue Stores Approach
The analogue approach is ‘directly associated with the historical sales performances of existing
stores’ (Drummey, 1984, 281) and employed to forecast as well as “fine-tune” the results of
spatial interaction models (see Clarke et al., 2003). The technique has a long history (see
Applebaum, 1965) and is based on the measurement of market penetration (market share) by
distance from the store, usually on a concentric distance or “drivetime” ring, underpinned by
data from food spend levels, loyalty cards or customer surveys (Rogers and Green, 1979). These
data are collated for all stores in the portfolio to allow analysis ‘by drawing comparisons (or
Page 9
9
analogies) with other stores in the corporate chain that are alike in physical, locational and trade
area circumstances’ (Birkin et al., 2002, 137).
The technique is dependent on the analyst’s business experience and judgment as well as the
extent and variability of the store network at the time. On the one hand, a retailer with few
examples of a particular format in its portfolio will suffer from a paucity of analogous stores
from which to choose. On the other, a retailer with an extensive store base such as Tesco or
Sainsbury’s offer a huge number of potential analogues which may make the task of finding
appropriate stores all the more onerous due to an extensive data set (Clarke et al., 2003; Clarke
and Mackaness, 2001).
The strategic use of loyalty card data
The use of a customer loyalty card is widely known to have an array of customer loyalty
inducing benefits (Humby et al., 2003; Rowley, 2005); but it also presents opportunities for
understanding customer behaviour - data especially beneficial to location decision-making
(Ziliani and Bellini, 2004). The challenge with loyalty card information is to realise ‘data with
meaning’ (Byrom et al., 2001, 221) and develop a more precise understanding of how current
stores trade spatially, temporally and also in terms of “classifications” of population.
In essence loyalty card data allows retailers to gain benefits in addition to those associated with
‘customer spotting surveys’ (cf. Drummey, 1984), i.e. larger sample sizes and associated
statistical reliability. First, when loyalty card data is presented via a GIS they have the potential
to allow a comprehensive understanding of “gaps” in its store estate and, therefore, where there
is scope to supplement with additional units. Second, they allow a precise understanding of
customer lifestyles and their requirements which further aids in the product ranging decisions of
its stores. Third, in the event of competitor, or its own, store openings, loyalty card data permits
a more comprehensive analysis of the degree of impact or sales cannibalisation that it can expect
which can feed into the store location decision-making process.
Page 10
10
LOCATION PLANNING CHALLENGES OF C-STORES
In contrast to superstores, academic conceptualisations of approaches to neighbourhood location
planning are few and far between. Two notable exceptions include Sakashita’article in Urban
Studies (2000) and Houston and Stanton’s paper in the Journal of Retailing (1984) that both
offer a highly quantitative analysis of optimal convenience store location. However, the very
problem with forecasting c-stores is brought out with this work: it is almost purely theoretical
and therefore offers no practical concession to real world conditions.
There are a number of reasons why academics have not extensively engaged in debates and
research regarding location planning for neighbourhood stores. First, from the 1970s until very
recently, food retail growth has been focused on larger decentralised food stores, predominantly
situated out of residential areas. It is natural that academic research has tended to mirror
predominate growth and ultimately neglect convenience store locations. Second, given the size
of such superstores, there are extensive sunk costs related to each development and therefore the
accuracy in decision-making is arguably more important in superstore, rather than
neighbourhood, retailing (cf. Wrigley, 1996). Third, superstores serve large catchments, are
dependent on regular weekly expenditure levels, involve repeated car journeys from consumers’
homes, so are typically habitual and lend themselves to statistical geo-demographic modelling.
This final reason reveals the principal factor that largely serves to stifle academic debate on
small store location planning: many of the norms of site analysis that are associated with large
scale retail units become largely redundant when dealing with neighbourhood locations where
micro-scale scheme-related issues and secondary shopping decisions come to the fore:
Despite the latter-day advances in location modelling and geographical information
systems, the outcome of locational decisions ultimately rests on micro-scale
considerations; that is, the appropriateness or otherwise of the precise location within the
chosen city centre, regional shopping centre, inner city arterial, secondary shopping
district, retail park or whatever. Indeed, it has often been said – though perhaps not enough
– that a few yards make all the difference between success and failure in retailing (Brown,
1994, 543, emphasis in original).
Page 11
11
Hence, it is no surprise that the superstore retailers attempting to aggressively expand their
portfolios in the c-store market have not found it straight forward. In 2004, Sainsbury’s had to
close 12 of its Local stores, forcing Justin King, Chief Executive, to concede: ‘We got some of
our early locations wrong’ (IGD, 2004, 161). This has the effect of heightening the importance
of the site visit rather than desk-based analysis to understand the unquantifiable micro-scale
aspects of such small catchments. Indeed, one prominent location analyst commented that while
superstore forecasting is determined by 80% in-office analysis to 20% site visit; convenience
store forecasting is more 80% site visit to 20% in-office study (Tasker, 2005). The difficulties
with forecasting convenience stores relative to superstores are detailed in Table 2 and discussed
below.
XX TABLE 2 ABOUT HERE XX
1. Small scale issues become “big” considerations
a) A concern with “small”, unstandardised competition
As the focus of analysis centres on stores < 3,000 sq ft, similar sized units provide strong
competition. However, commercial databases of such units are less available and, given the
“churn” in this sector, less accurate. In addition, the quality of c-stores varies considerably - an
independent store will not necessarily have a poor quality product offer or store environment.
This places a huge importance on the site visit to understand the nature of the development
scheme and catchment.
In addition, an adjacency of associated services along a shopping parade can have
disproportionate effects on a store’s performance. For example, the proximity of a store to a
Post Office or a parking area can radically increase footfall; essentially underlining the
importance of Hotelling’s famous ‘principle of minimum of differentiation’ in gaining sales
(Brown, 1989).
b) Micro-scheme quality - footfall, car parking, visibility, store design
There are four factors that are especially important in making convenience store sites viable:
footfall; the degree of available car parking; store visibility; and its design. First, a field visit is
Page 12
12
essential to determine the pitch and quality of the site in terms of pedestrian footfall. While
there are data providers of pedestrian traffic rates in established centres (e.g. CACI), this must be
reviewed “in the field”. “Dead” areas and secondary parades must be treated with caution and
footfall measured independently; particularly for sites of marginal viability.
Second, the degree of car parking can have a disproportionate effect on c-store performance.
Essentially the imposition of finding a parking space can, in economic terms, be considered a
fixed cost to the shopper that cannot be reconciled with such a low transaction shopping mission
(cf. Bell et al., 1998, p 365). This is less important in central locations where there is a higher
degree of pedestrian footfall upon which the store can depend.
Third, while a store’s visibility is central to all forms of retail success, the difference with
neighbourhood stores is that they are not always a customer’s pre-determined shopping mission
and thus clear identification is essential. Furthermore, given the small size of the units,
seemingly insignificant obstructions can obscure visibility - leaves on trees located outside a
store may obscure visibility in summer though this may not be a problem in winter when a site is
visited and a decision made.
Fourth, the quality of the store design requires consideration even at this early stage. Thought
must be given to the ability of customers to circulate throughout the store, with space to queue at
peak times. This is especially important when the store is already constructed and the retailer is
faced with making it “workable” in the event of progression.
c) Customer perceptions
With superstore developments there is customer expectancy that there will be an extensive car
park, the store will be well-stocked, and store standards will be reasonable. Partly this is due to
the size of the stores, but equally, due to the strong brand equity that such operators generate
with the public (cf. Burt, 2000). In the neighbourhood market, retailer brands are weaker
(though this is changing with the entry of Tesco and Sainsbury’s) and, therefore, customers are
more easily dissuaded if it is not immediately evident that the store will satisfactorily service
Page 13
13
them. This makes the appearance and design of the development scheme essential with car
parking spaces (if possible) situated at the front of the store. At worst, ‘an otherwise good
location may be spoiled by poor store design’ (Hutchinson, 1940, 137).
d) The study of drivetimes less significant
A cornerstone of gravity modelling on GIS systems over the past decade and a half has been the
utilisation of computer-generated drivetimes to aid the forecasting of supermarkets. However,
when attention shifts to neighbourhood stores, the use of drivetime analysis becomes less useful
given the lower level of car borne trade and the reduced propensity to undertake an extensive
and single purpose journey to the store. This is widely recognised – as seen in the size of
catchments considered by the Competition Commission in store divestiture assessment (see
Table 3). While it is possible to gravity model using “walktimes” with a detailed enough road
network (e.g. 100m grids), this necessitates a more detailed level of geography (e.g. footpaths).
Spend allocation techniques also become increasingly complicated as one is not modelling total
food spend but a form of secondary spend – an unknown proportion of the total. Clearly, spatial
interaction models that are so popular in 21st Century superstore forecasting become increasingly
challenging when dealing with convenience stores.
2. Not the “one-stop shop” and understanding customer shopping missions
Recent research suggests that the frequency of shopping missions is becoming increasingly
confused and difficult to model as consumers are experiencing longer drivetimes to stores, more
frequent top up shopping and hence less one-stop traditional shopping trips compared to twenty
years ago (Clarke et al., 2006; Jackson et al., 2006; Popkowski Leszczyc et al., 2004). While
this presents competitive opportunities for neighbourhood retailers, it equally makes it difficult
for small stores that are rarely sure of the customer, or ultimately the shopping mission, they are
attempting to satisfy.
There is a sheer diversity of the customer shopping mission with the emergence of a “cash-
rich/time-poor consumer (Popkowski Leszczyc et al., 2004), as “top-up”, “impulse”, “distress”,
“treat” and “main shop” all have slightly different requirements. Research by The ORC
Page 14
14
Partnership has shown that spend of £0-£5 accounts for 37% of transactions; while £5-£10
basket sizes claims 36% of transactions. However, the same customer may undertake different
missions on the same day – something inadequately accounted for within complex spatial
interaction models that typically:
…contain unrealistic assumptions about consumer behaviour. All the store location
methods are highly aggregative and assume that differences between consumers, such as
the number of stops made on shopping trips, are unimportant or else negate each other.
Such differences are usually overcome by assuming that all consumers make single-stop
shopping trips (MacKay, 1972, 134).
The locally sensitive nature of the convenience store market necessitates a return to less
technical techniques of site evaluation. Hence, we argue later that in the absence of one model
for all neighbourhood markets, analysts must pursue multiple approaches including the
segmentation and study of analogues, regression modelling and basic catchment analysis to
determine a forecast sales level.
3. Small scale data availability
As with all store location analysis, there is a high level of importance attached to the quality of
data that are manipulated and applied to individual sites. However, given the localised nature of
investigation, there is often an importance on data quality at a spatial scale at which the data are
not designed for. While the most important data are derived from the Census, this survey has
broader goals; of use to ‘government departments, local authorities, businesses and to the general
public’ (Brito and Malerba, 2003, 497). Hence, the data are not always presented in a
particularly user-friendly fashion, though this is improving.
Pre-2001, the smallest areal unit area collected for analysis in the UK Census was an
enumeration district (ED) that consisted of nearly 200 households which made practical use of
the data difficult (Leventhal, 2003). However, the Census of 2001 developed Output Areas
(OAs), which, while largely similar to EDs, consisted of only c.100-125 households. In
addition, the 2001 Census data is freely available and contains useful geodemographic
information such as representations of social grades: the National Statistics Socioeconomic
Classification (NS-SeC) (Sleight, 2004).
Page 15
15
For retailers seeking to forecast small neighbourhood stores there are a range of Census data that
can be extremely useful. There is scope for catchment analysis with the use of Census Area
Statistics (CAS) – a collection of approximately 7,000 counts for each Output Area which are
the data that inform commercial geodemographic classifications such as ACORN and MOSAIC
(Leventhal, 2003). For the ambitious, statistically competent analyst, this provides the
opportunity to create one’s own complex picture of store catchments (as detailed in Sleight,
2004).
The Census is not the only data upon which forecasting and neighbourhood retail decision-
making can be based – other potentially useful sources of information include:
• Local workforce information (e.g. Blue Sheep)
• Footfall data in town/city centres (e.g. CACI)
• Population (e.g. Census data)
• Population classifications (e.g. MOSAIC; Personcix and ACORN)
• Where people live in relation to where they work (Census Travel to Work Area data)
• Food expenditure (e.g. Expenditure & Food Survey [EFS])
• Traffic flow data (e.g. Capita Symonds; Morgan Tucker Associates)
• Datasets on the location of schools, Post Offices etc (e.g. Landmark Information Group)
The importance of these data in forecasting will often be specific to the site in question. Clearly
sites in city centres will require good quality data on workers and footfall data but these may be
redundant when forecasting potential units in small district centres in residential developments,
where the proximity of other amenities becomes more important.
A PRACTICAL FRAMEWORK FOR NEIGHBOURHOOD STORE FORECASTING
If, as Clarke and Bennison (1997, 62) suggest, we examine the ‘environment of locational
decision-making’ it quickly becomes clear that the budgets of neighbourhood retailers do not
typically facilitate high levels of investment in store location research. Hence, in this section, we
suggest a broad framework formalising convenience store location planning for a smaller retailer
lacking established in-house expertise – to move beyond the use of experience and intuition as
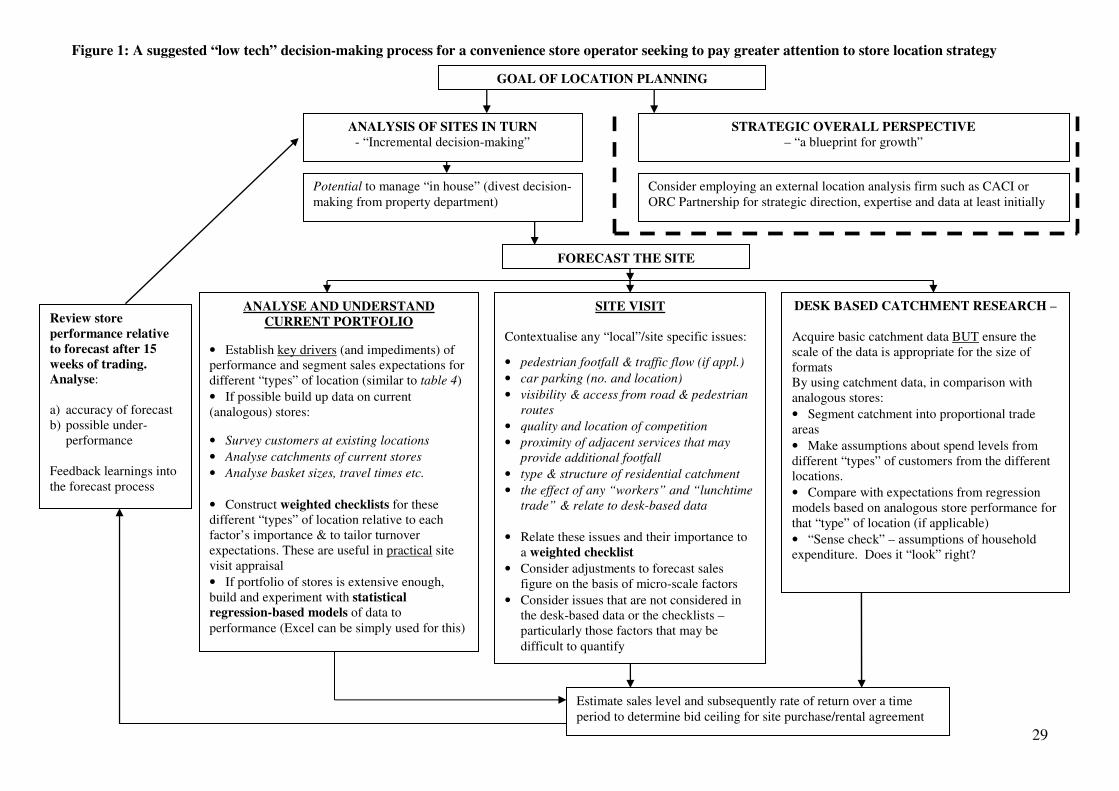
the only decision-making tools (cf. Hernandez and Bennison, 2000). This model (figure 1) is
targeted at a retailer that is likely to have a limited portfolio of stores at present but has not
historically appraised store sites in any depth; instead adopting what Tesco founder, Jack Cohen
Page 16
16
always considered ‘gut instinct’ (Bevan, 2005, p 56). It is not so much the size of the portfolio
that is important (though smaller networks will limit the degree of statistical analysis that can be
conducted on analogous stores) as the degree of expertise (or lack of it) that is currently
employed. Larger operators, particularly the established food multiples that have recently
entered the sector, will have more sophisticated methods and tailored data sets that can be
utilised but are beyond the remit of this paper.
We start with the decision as to whether location planning is to be focused on incremental site-
by-site assessment or alternatively a holistic strategic review of store expansion. If the latter
approach is required, it is likely that building in-house expertise will be difficult, lengthy and
prohibitively expensive. This is not the focus of this paper. Given the scale and complexity of
such a task, it is logical to outsource to location agencies that are well versed in the basic
approaches and the use of appropriate data. However, over this period, it is essential that the
consultant regards the boundaries of the firm as permeable - they must not operate as an
‘outsider’ but more as an ‘insider’ whereby the transfer of knowledge is encouraged and internal
expertise fostered with the ultimate goal of the retailer taking site appraisal “in-house” (cf. Kitay
and Wright, 2004). If, on the other hand, the c-store retailer wishes to improve its site selection
on an incremental, site-by-site basis then there are some low-tech approaches that the retailer can
trial without outside consultancy assistance. It is these that make up the focus of the rest of the
paper.
XX FIGURE 1 ABOUT HERE XX
In forecasting and advising on new site development it is crucial that the location analyst is
situated outside of the property department in order to gain an independent perspective rather
than from within an environment where bonuses are related to store development.
The data purchase decision
While this analysis has underlined that the key to success in c-store site evaluation is the site
visit and understanding the nuances of the local catchment essentially “on the ground”, it has
also repeatedly underlined that data are also key to decision making. The evaluation of whether
Page 17
17
and which geodemographic data to purchase is largely determined by the in-house statistical
ability to manipulate the Census data; the budget of the retailer; the “type” of catchments in
which it is locating; and the scale of the plans for store development. If the choice is made to
acquire external data such as ACORN, MOSAIC, traffic flow or footfall, it is essential that the
retailer is clear what it is going to get and how this will benefit forecasting in excess of Census
data. Since this is potentially expensive, it is essential that the researcher gains a good
understanding both of the potential benefits and the costs via a dialogue with the supplying
agency.
Basic site evaluation techniques on the site visit
Over and above all factors, it is essential that the proposed model of forecasting and decision
making is straightforward to implement – not least given the likely lack of operational research
knowledge within the retailers for which it is designed to appeal. Indeed, simplicity is often key
as ‘(e)xperience has certainly shown that the simpler the model, its development, working and
output, the greater the comprehension by retail managers and the easier the acceptance of the
model’ (Simkin, 1996, p 237).
Furthermore, a key message throughout this paper has been that while statistical models can
significantly ‘reduce the degree of subjectivity’ (Rogers, 2005, 206), the very nature of micro-
scale locations means that immediate site quality remains extremely locally variable. As
Moutinho et al. (1993) remind us; ‘Sophisticated models are not always possible’ (p 202), and
therefore we need to rely on less quantitative approaches as a thorough site visit becomes
essential. This serves to confirm (or dispute) the limited statistical data gathered and interpreted
in the office, but far more importantly: the site visit can expose issues that cannot be expressed
quantitatively (e.g. access; visibility) and is where intuition and experience becomes important.
a) Checklists and the basic use of analogous stores
An elementary approach to site forecasting that is employed by two thirds of retailers is the so-
called “checklist”, which is an attempt to systematically assess the relative value of a site
Page 18
18
compared to other potential sites in the area (Hernández and Bennison, 2000). In essence it
involves the analyst judging the factors that are critical to site success and ‘provides a systematic
procedure for evaluating information on a potential site’ (Craig and Ghosh, 1984, p 20) that can
go beyond general, aggregate information about the socioeconomic, competitive and
demographic composition of the area to very site specific factors ‘such as traffic count, parking
facilities, ease of access and aggress, and visibility’ (ibid, p 20) to name only a few.
In its simplest form the checklist can act as a good screening tool but is less able to predict
turnover (Clarkson et al., 1996). However, the basic checklist can be further developed to
emphasise or attach ‘some variable points rating’ to factors specific to success in convenience
store retailing (Hernández and Bennison, 2000, p 360). For example, the use of a weighted
checklist on a site visit, coupled with a review of available data, may reveal a need to adjust the
forecast sales owing to localised issues such as a high degree of “workers” in the immediate
catchment or the proximity of small but convenient car park. Indeed, when approaching
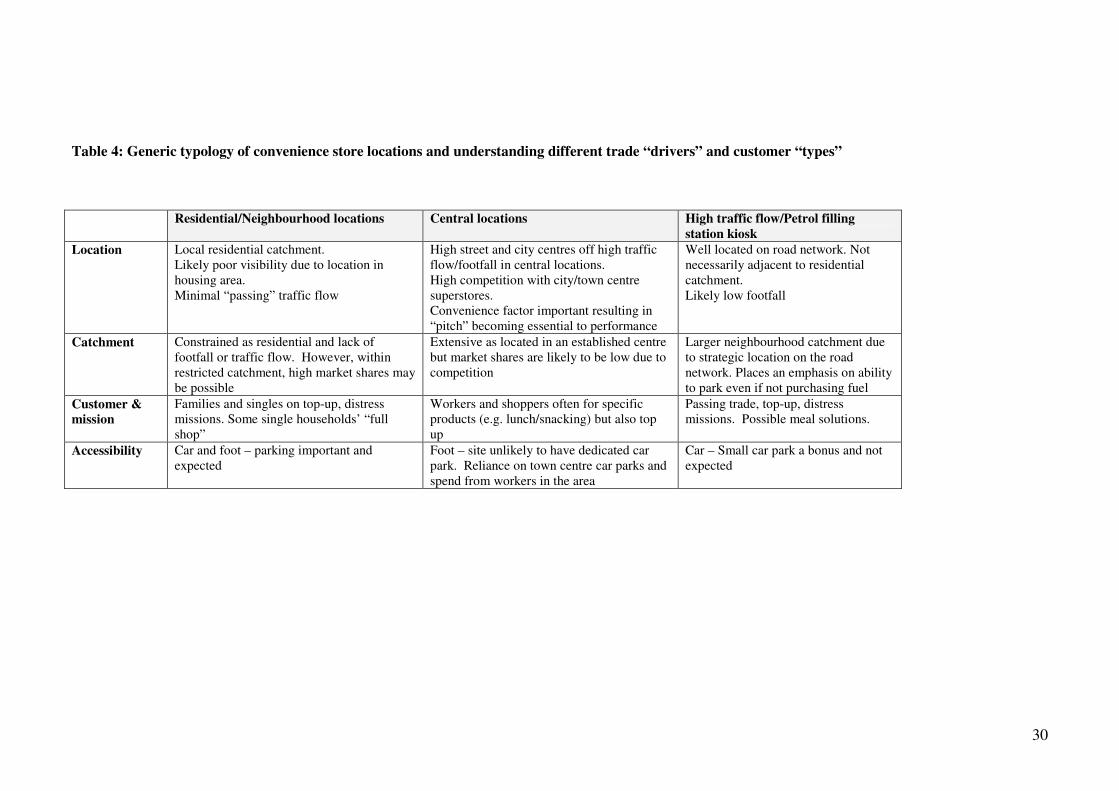
neighbourhood store forecasting, it is essential to recognise the wide variety of formats and
locations for stores within the sector (see Table 4). While this variability in “type” of store may
make forecasting more difficult, it also provides an opportunity for operators to more accurately
understand what drives success in different locations and with different customers. This requires
a thorough analysis of the current portfolio to ‘identify those variables that best explain the
differences between pre-selected groups of stores’ allowing new sites to be ‘allocated to the
appropriate store turnover group, and the sales range’ (Mendes and Themido, 2004, 8). Clearly
this is dependent on a wide ranging portfolio, but potentially different degrees of importance can
be attached to different factors and therefore weighted differently in the checklists.
XX TABLE 4 ABOUT HERE XX
b) Basic catchment analysis and the “sense check”
Page 19
19
While data generated based on analogous stores provide a framework for tailoring turnover
estimates, or may ultimately provide the basis for a simple statistical forecasting model, it is
advisable to interrogate the Census, geodemographic, site and competition data in the catchment
independently. This will indicate the approximate available expenditure within the catchment
upon which assumptions can be made about market penetrations – much as detailed in
Applebaum (1966). This is essentially a “sense check” or, what Moutinho et al. (1993) regard as
a ‘rule of thumb procedure’ (p 202). Analysts should question: What is the average assumed
expenditure per household? How is this compared to other analogue stores with similar
competition? This can serve to provide confidence in the analysis or alternatively ring alarm
bells and warrant further analysis.
More advanced site evaluation techniques: The value of regression modelling
As more information is collected either from customer spotting surveys, EPOS data, or
catchment data, statistical relationships to sales levels can be explored. Even if the retailer is
particularly “data poor” then simple customer surveys can be an insightful starting point
(Bowlby et al., 1985b) – even experienced superstore operators struggle to make their loyalty
card data usable at small stores with low usage penetrations for small basket sizes. With
analysis, different drivers and brakes on performance will be found for different classifications
of location. For example, when looking at a site likely to be classified as a “strategic high traffic
flow” store, it is essential that the analyst has data on traffic through the day that s/he can
compare to similar analogous stores to better calibrate regression models for this particular
“type” of location.
Such an approach of dividing the store estate into analogous groups and determining like trends
and drivers has a long standing academic background that can be further developed to identify
quantitative relationships and ultimately basic forecasting models. Ross Davies, in a classic
series of papers (notably 1973; 1977), makes a convincing case for the use of factor analysis and
principal component analysis in the generation of store typologies upon which further statistical
Page 20
20
relationships can be based. Similarly Rogers and Green (1979) make the argument for ‘analog
groupings’ - by identifying and measuring the variables that distinguish groups, analysts can
identify relationships and ultimately develop multiple regression models to better inform the
forecasting process (see also Bowlby et al., 1985a; 1985b). However, again, this is dependent on
individual analyst’s quantitative ability and its’ impact is likely to be ultimately limited by the
idiosyncratic nature of the unquantifiable micro-scale factors that were extensively discussed
earlier.
Using such approaches is dependent on a wide ranging portfolio of stores at present – if this is
not the case, such techniques should not be employed. Neither should the amount of work
involved in this should not be under-estimated. Small retailers are not always aware of all of
their sales areas; let alone the sales densities, and as such, it is essential that store location
decision-makers ‘make managers aware of data requirements; detail the burden and necessity of
data collection; [and] emphasize continually the importance of the “right” information’ (Simkin,
1993, p 237).
Determining affordability
The forecast sales figure should be used to determine a “bid ceiling” in the event of a site or
rental auction against competing retailers. This involves the estimation of the value of the site to
the retailer if developed over a long period, when the store has matured, and hence the return on
investment that can be realised with different degrees of site cost/rental. Greater confidence
regarding affordability becomes more important with increased competition for good sites.
Post opening accuracy assessments
This paper has repeatedly underlined the limitations of modelling of small scale retail
phenomena and therefore the learning process that is necessary in store forecasting.
Correspondingly, it is therefore essential that the forecasting process does not end with the issue
of a sales estimate but the performance is tracked through opening and reassessed after
approximately 10-15 weeks - essentially ‘follow-up research to check the degree of accuracy of
the original sales estimates against actual realized sales’ (Applebaum, 1965, p 236). Such work
Page 21
21
is crucial in generating future learnings within the forecast process but also essential for
understanding the store’s over or under-performance which can inform any further marketing
activity.
CONCLUSIONS
This study of the changing nature of neighbourhood retailing and its’ implications for the science
of location management leads to a number of conclusions: First, forecasting convenience stores
sees the traditional techniques of market analysis for large scale food stores become largely
redundant – an issue currently under-emphasised in the retail site selection literature. However,
as organic growth in the superstore sector slows and major retailers continue to turn their
attention to developing small stores less constrained by retail regulation, it is likely that
neighbourhood store location techniques will become more sophisticated. This places an onus
on smaller convenience operators to improve their approaches: it will no longer be sufficient to
rely on experience and intuition. Meanwhile, the de facto challenge for academics is to become
involved in generating innovative solutions to location problems –as occurred with the
emergence of the food superstore decades ago.
Second, this study underlines that there is no single approach or technique that is likely to
provide a universal solution to forecasting convenience stores. Instead, neighbourhood retailers
are likely to manage their location decision-making by incremental steps – using ‘experience as
a way to discover good solutions to complex problems’ (Lounamaa and March, 1987, 121). As
Ireland and Miller (2004, 8) suggest, ‘decision-making requires constant refinement of
knowledge gained from executing decision-making processes’ as experience informs
understanding and gradually the competency of small store forecasting develops.
Third, for those who study location management c-store forecasting represents a move into
uncharted waters; beyond the “comfort zone” of superstore retailing within which analysts can
rely on ‘a number of structured frameworks and tools’ to ‘reduce the uncertainty and ambiguity
surrounding strategic decisions’ (Ireland and Miller, 2004, 9). In contrast, forecasting small
stores is not as data intensive as local factors have to be increasingly considered – trends that are
Page 22
22
challenging to extract from current commercially available data. More broadly, it is appropriate
to recount Rogers’ (2005, 205) statement that; ‘Despite attractive coloured maps and apparently
seamless data integration, retailers need to constantly question and probe underlying data’. The
requirements of convenience store forecasting inevitably leads to a “back to basics” approach to
market analysis, meaning that the “classic factors” of location analysis are again emphasised
largely due to a lack of core modelling support.
Fourth, given the paucity of appropriate micro scale data or established competence in
neighbourhood forecasting, it is inevitable that the application of part-intuitive forecast
experience to new sites will continue to be necessary. However, we are conscious not to over-
develop this non quantifiable aspect. It is not, what Sadler-Smith and Shefty (2004) may regard
as ‘gut feel’; but instead where site location analysts seek to combine available data and their
intuitive view based in large part on knowledge of comparable stores. We agree that ‘retailers’
judgment is still underplayed in existing normative models’ (Clarke, 2003, 177) and adopting
decision-making in the absence of high levels of quantitative data is challenging; but it is the use
of site visits in combination with more quantitative techniques that will provide the most
effective solutions.
Finally, as Lounamaa and March (1987, 121) commented nearly twenty years ago: a ‘central
dilemma in modern organization theory and operations research is the mismatch between the
analytical capabilities of human institutions and the complexity of the environment in which they
function’. It is the reconciliation between these two processes that is the key to effective site
research decision-making: it is hoped that this article represents a starting point for increasing
sophistication in neighbourhood store retail forecasting which remains vastly under-developed.
NOTES
i Scotland, Wales and Northern Ireland have slightly different planning legislation but the effect has
largely been consistent in stunting large out-of-centre store development.
ACKNOWLEDGEMENTS
We would like to gratefully acknowledge the benefit of discussions with Alan Hallsworth, Andrew
Alexander, Andrew Tasker, Director of Optimum Locations (previously Head of Location Planning at
Page 23
23
Sainsbury’s), Steve Gotham of Allegra Strategies, Simon Bills of McKinsey & Co as well as anonymous
referees for insightful comments on earlier drafts. Any errors and omissions remain our own.
References
Adlard, H (2001) ‘The need for retail development’, Journal of Planning and Environmental Law, May,
522-534
Alexander, N, Quinn, B and Cairns, P (2005) ‘International retail divestment activity’, International
Journal of Retail and Distribution Management, 33 (1), 5-22
Applebaum, W (1965) ‘Can store location research be a science’, Economic Geography, 41 3, 234-237
Applebaum, W (1966) ‘Methods for determining store trade areas, market penetration, and potential
sales’, Journal of Marketing Research, 3, 127-141
Bell, D, Ho, T and Tang, C (1998) ‘Determining where to shop: fixed and variable costs of shopping’,
Journal of Marketing Research, 35, 352-369
Benoit, D and Clarke G P (1997) ‘Assessing GIS for retail location analysis’, Journal of Retailing and
Consumer Services, 4 4, 239-258
Bevan, J (2005) Trolley Wars: The Battle of the Supermarkets, (Profile Books, London)
Birkin, M, Clarke, G and Clarke, M (2002) Retail Geography and Intelligent Network Planning, John
Wiley, Chichester
Bowlby, S; Breheny, M and Foot, D (1984a) ‘Store location: problems and methods 1: Is locating a
viable store becoming more difficult?’, Retail and Distribution Management, September/October, 31-33
Bowlby, S; Breheny, M and Foot, D (1984b) ‘Store location: problems and methods 2: Expanding into
new geographical areas’, Retail and Distribution Management, November/December, 41-46
Bowlby, S; Breheny, M and Foot, D (1985a) ‘Store location: problems and methods 3: Choosing the
right site’, Retail and Distribution Management, January/February, 44-48
Bowlby, S; Breheny, M and Foot, D (1985b) ‘Store location: problems and methods 4: Local site and
store evaluation issues’, Retail and Distribution Management, March/April, 40-44
Brito, P and Malerba, D (2003) ‘Mining official data’, Intelligent Data Analysis, 7 6, 497-500
Brown, S (1989) ‘Retail location theory: the legacy of Harold Hotelling’, Journal of Retailing, 65 4,
450-470
Brown, S (1994) ‘Retail location at the micro-scale: Inventory and prospect’, Service Industries Journal,
14 4, 542-576
Burt, S L (2000) ‘The strategic role of retail brands in British grocery retailing’, European Journal of
Marketing, 34 8, 875-890
Byrom, J, Bennison, D, Hernandez, T and Hooper, P (2001) ‘The use of geographical data and
information in retail locational planning’, Journal of Targeting, Measurement and Analysis for
Marketing, 9 3, 219-229
Clarke, I., Bennison, D and Pal, J (1997) ‘Towards a contemporary perspective on retail location’,
International Journal of Retail and Distribution Management, 25 2/3, 59-70
Page 24
24
Clarke, I and Rowley, J (1995) ‘A case for spatial decision-support systems in retail location planning’,
International Journal of Retail and Distribution Management, 23 3, 4-10
Clarke, I and Mackaness, W (2001) ‘Management “intuition”: An interpretative account of structure and
content of decision schemas using cognitive maps’, Journal of Management Studies, 38 2, 147-172
Clarke, I, Mackaness, W and Ball, B (2003) ‘Modelling intuition in Retail Site Assessment MIRSA:
making sense of retail location using retailer’s intuitive judgments as support for decision-making’,
International Review of Retail, Distribution and Consumer Research, 13 2, 175-193
Clarke, I, Jackson, P, Hallsworth, A, de Kervenoal, R, Perez del Aguila, R, & Kirkup, M (2006) ‘Retail
restructuring and consumer choice 1: Long-term local changes in consumer behaviour: Portsmouth
1980-2002’ Environment and Planning A, 38 1, 25 – 46
Clarkson, R, Clarke-Hill, C and Robinson, T (1996) ‘UK supermarket location assessment’,
International Journal of Retail & Distribution Management, 24 6, 22-33
Competition Commission (2000) Supermarkets: A report on the supply of groceries from multiple stores
in the United Kingdom, Presented to Parliament by the Secretary of State for Trade and Industry by
Command of Her Majesty October 2000 Available at http://wwwcompetition-
commissionorguk/rep_pub/reports/2000/
Competition Commission (2003) Safeway plc and Asda Group Limited owned by Wal-Mart Stores Inc;
Wm Morrison Supermarkets PLC; J Sainsbury plc; and Tesco plc: A report on the mergers in
contemplation, Presented to Parliament by the Secretary of State for Trade and Industry by Command of
Her Majesty September 2003, Available at http://wwwcompetition-
commissionorguk/rep_pub/reports/2003/481safewayhtm#full
Craig, C and Ghosh, A (1984) ‘Models of the retail location process: a review’, Journal of Retailing, 60
1, 5-36
Davies, R (1973) ‘Evaluation of retail store attributes and sales performances’, European Journal of
Marketing, 7, 89-102
Davies, R (1977) ‘Store location and store assessment research: the integration of some new and
traditional techniques’, Transactions of the Institute of British Geographers, New Series, 2 2, 141-157
Davies, R and Rogers, D eds (1984) Store Location and Store Assessment Research (John Wiley,
Chichester)
Dijst, M, Burrough, P and Schot, P (2005) ‘Coping with uncertainties in integrative spatial planning’,
Environment and Planning A, 37, 1331-1334
Drummey, G (1984) ‘Traditional methods of sales forecasting’, In R L Davies and D S Rogers eds
Store Location and Store Assessment Research (John Wiley, Chichester), 279-299
Geobusiness Solutions (2005) Competition Commission Somerfield/Morrisons Inquiry: Verification and
Independent Analysis Summary of Results V21 26th June 2005, GeoBusiness Solutions Ltd 1 Holly
Court, Tring Road, Wendover, Bucks, HP22 6PE
González-Benito, J and González-Benito, O (2005) ‘The role of geodemographic segmentation in retail
location strategy’, International Journal of Market Research, 47 3, 295-316
Guy, C (1980) Retail Location and Retail Planning (Gower, Farnborough)
Hallsworth, A G (1992) The New Geography of Consumer Spending (Belhaven Press, London)
Page 25
25
Hernandez, T and Bennison, D (2000) ‘The art and science of retail location decisions’, International
Journal of Retail and Distribution Management, 28 8, 357-367
CB Hillier Parker (2000) The Sequential Approach to Retail Development, Report on a National
Research Project for The National Retail Planning Forum; British Council of Shopping Centres;
Department of the Environment, Transport & The Regions, January, London
Houston, F and Stanton, J (1984) ‘Evaluating retail trade areas for convenience stores’, Journal of
Retailing 60 1, 124-136
Humby C Hunt T and Phillips T (2003) Scoring Points: How Tesco is Winning Customer Loyalty
(Kogan Page, London)
Hutchinson, K (1940) ‘Traffic and trade correlations: A technique in store location’, Journal of
Marketing, 5 2, 137-142
Hyman, A and Ainsworth, M (2005) Store Forecasting – The Challenge of Building Accurate Models,
7th Annual Geobusiness Conference, 2
nd November, Heritage Motor Centre, Warwickshire
IGD (2004) Consolidation in Convenience Retailing: Examining the Implications, Letchmore Heath,
Watford, September 2004
IGD (2005) UK Grocery Retailing Factsheet Published 26th May 2005. Available at wwwigdcouk
Ireland, R and Miller, C (2004) ‘Decision-making and firm success’, Academy of Management
Executive, 18 4, 8-12
Jackson, P, Perez del Aguila, R, Clarke, I, Hallsworth, A, de Kervenoael, R, & Kirkup, M (2006) Retail
competition and consumer choice 2: Understanding consumer choice at the household level
Environment and Planning A, 38 1, 47-67
Jones, K and Simmons, J (1987) Location, Location, Location (Methuen, London)
Kitay, J and Wright, C (2004) ‘Take the money and run? Organisational boundaries and consultants'
roles’, Service Industries Journal, 24 3, 1-18
Lee, Y; Koutsopoulos, K (1976) 'A locational analysis of convenience stores in Metropolitan Denver',
Annals of Regional Science, 10 1, 104-128
Leventhal, B (2003) ‘Leveraging the census for customer analysis’, Journal of Targeting, Measurement
and Analysis for Marketing, 12 1, 11-19
Lounamaa, P and March, J (1987) ‘Adaptive co-ordination of a learning team’, Management Science, 33
1, 107-123
McGrath, RG (2001) ‘Exploratory learning, innovative capacity, and managerial oversight’ Academy of
Management Journal, 441, 118–131
MacKay D, B (1972) ‘A microanalytic approach to store location analysis’, Journal of Management
Research, 9, 134-140
March, JG (1991) ‘Exploration and exploitation in organizational learning’ Organization Science,
21,71–87
Mendes, A and Themido, I (2004) ‘Multi-outlet retail site location assessment’, International
Transactions in Operational Research, 11, 1-18
Page 26
26
Miller, M, Mallors, R, Chapple, A, and Ives, W (2003) ‘Building a foundation for innovation at
Sainsbury’s, KM Review, 6 3, 12-16
Mintel (2004) Convenience Retailing, January 2004, London
Morrison, J L, (1994) ‘The paradigm shift in cartography: The use of electronic technology, digital
spatial data, and future needs’, in Waugh, T and Healey, R Eds, Advances in GIS Research, Taylor and
Francis, London, 1-15
Moutinho, L, Curry, B, and Davies, F (1993) ‘Comparative computer approaches to multi-outlet retail
site location decisions’, Service Industries Journal, 13 4, 201-220
Openshaw, S (1973) ‘Insoluble problems in shopping model calibration when the trip pattern is not
known’, Regional Studies, 7, 367-371
Palmer, M (2005) ‘Retail multinational learning: a case study of Tesco’, International Journal of Retail
and Distribution Management, 33 1, 23-49
Pioch, E and Byrom, J (2004) ‘Small independent retail firms and locational decision-making: outdoor
leisure retailing by the crags’, Journal of Small Business and Enterprise Development, 11 2, 222-232
Popkowski Leszczyc, P, Sinha, A and Sahgal, A (2004) ‘The effect of multi-purpose shopping on
pricing and location strategy for grocery stores’, Journal of Retailing, 80, 85-99
Rogers, D S (1984) ‘Modern methods of sales forecasting’ In R L Davies and D S Rogers eds Store
Location and Store Assessment Research (John Wiley, Chichester), 319-331
Rogers, D S (1987) ‘Shop location analysis’ In McFadyen, E ed The Changing Face of British Retailing
(Newman, London), 74–83
Rogers, D S (2005) ‘Developing a location research methodology’, Journal of Targeting and Analysis
for Marketing, 13 3, 201-208
Rogers, D and Green, H (1979) ‘A new perspective on forecasting store sales: applying statistical
models and techniques in the analog approach’, Geographical Review, 69 4, 449-458
Rogers, H, Ghauri, P and George, K (2005) ‘The impact of market orientation on the internationalization
of retailing firms: Tesco in Eastern Europe’, The International Review of Retail, Distribution and
Consumer Research, 15 1, 53-74
Rowley, J (2005) ‘Building brand webs: Customer relationship management through the Tesco Clubcard
loyalty scheme’, International Journal of Retail & Distribution Management; 33 3, 194-207
Sadler-Smith, E and Shefty, E (2004) ‘The intuitive executive: Understanding and applying “gut feel” in
decision-making’, Academy of Management Executive, 18 4, 76-91
Sakashita, N (2000) ‘An economic analysis of a convenience store location’, Urban Studies, 37 3, 471-
479
Schildt, H, Maula, M and Keil, T (2005) ‘Explorative and exploitative learning from external corporate
ventures’, Entrepreneurship Theory and Practice, 29 4, 493-515
Simpkin, L (1996) ‘Tackling barriers to effective implementation of modelling in retail marketing
applications’, The International Review of Retail, Distribution and Consumer Research, 6 3, 225-241
Sleight, P (2004) ‘An introductory review of geodemographic information systems’, Journal of
Targeting, Measurement and Analysis for Marketing, 12 4, 379-388
Page 27
27
Smith, L D and Sanchez, S (2003) ‘Assessment of business potential at retail sites: empirical findings
from a US supermarket chain’, International Review of Retail, Distribution and Consumer Research, 13
1, 37-58
Tasker, A (2005) Personal communication to lead author, 9th November
Verdict Research (2006) ‘Neighbourhood shops: the new retail winners’, International Journal of Retail
& Distribution Management, 34 3, 229-230
Warren, R (2004) ‘Mezzanine floor outbreak - a practical reality, Journal of Planning and
Environmental Law, February, 156-158
Wood, S, Lowe, M and Wrigley, N (2006) ‘Life after PPG6 - Recent UK food retailer responses to
planning regulation tightening’, The International Review of Retail, Distribution and Consumer
Research, 16 1, 23-41
Wrigley, N (1996) ‘Sunk costs and corporate restructuring: British food retailing and the property crisis’
In Wrigley, N and Lowe, M eds, Retailing Consumption and Capital: Towards the New Retail
Geography (Longman, London), 116-136
Wrigley, N (1998) ‘PPG6 and the contemporary UK food store development dynamic’, British Food
Journal, 100, 154-61
Wrigley, N, Guy, CM and Lowe, MS (2002) ‘Urban regeneration, social inclusion and large store
development: the Seacroft development in context’, Urban Studies, 39, 2101-114
Ziliani, C and Bellini, S (2004) ‘From loyalty cards to micro-marketing strategies: Where is Europe’s
retail industry heading?’, Journal of Targeting, Measuring and Analysis for Marketing, 12 3, 281-289
Page 28
28
Figures and tables
Table 1: Convenience Retail Sector Sales 2001-2004 (Actual Change)
Segment Sales
£m
Share Sales
£m
Share Sales
£m
Share Sales
£m
Share Change
2001 2001 2002 2002 2003 2003 2004 2004 2003-4
Not affiliated independents 8,771 44.8% 8,748 42.5% 8,696 40.5% 7,644 33.2% -12.1%
Total symbols 4,234 21.6% 4,628 22.5% 5,223 24.3% 7,221 31.4% +38.3%
Total forecourts 3,267 16.7% 3,611 17.5% 3,618 16.9% 3,630 15.8% +0.3%
Convenience multiples 2,271 11.6% 2,458 11.9% 1,992 9.3% 2,255 9.8% +13.2%
Co-operatives 1,031 5.3% 1,162 5.6% 1,928 9.0% 2,273 9.9% +17.9%
Total Convenience 19,574 100.0% 20,606 100.0% 21,456 100.0% 23,023 100.0% +7.3%
NB Fascia stores are included in “symbols”
NB: Stores under fascias ie. Best-In, Day Today, Lifestyle/Scandia and Premier, account for approx £1.6bn sales per year.
Source: IGD (2004, p 33)
Table 2: The difference between forecasting neighbourhood and superstores
Superstores/Hypermarkets Neighbourhood
Likely a large retailer – large budget for store
location decision.
Likely a small retailer – minimal budget for store
location decision.
Data rich. Data poor.
Poor micro-scale accuracy to data.
Use of geo-demographic and customer
behavioural surveys aids understanding of
current shopping patterns.
Data on primary shopping missions largely redundant.
Care required using neighbourhood data as often
aggregated over 100-200 households.
Detailed understanding of customer preferences,
motivations and shopping patterns.
Very limited understanding of customer preferences,
motivations and shopping patterns.
Loyalty card data aids in understanding
customers.
Unlikely to have the scale or technology for loyalty card
introduction.
If using loyalty cards; penetration levels may not be high
enough to extract meaningful patterns.
Customer surveys necessary.
Gravity model. Regression model at best.
Overwhelming emphasis on site visits.
Decision-making complemented by market
penetration analysis based on food spend
statistics.
Market penetration analysis less appropriate for c-stores
as commonly only the “secondary shop”.
Overwhelming reliance on car borne trade. Reliance on local residential catchment.
Catchment analysis to 15-30 minute “drivetime”. Drivetime catchment analysis largely redundant.
Possibly resort to “walk times” depending on size of unit
& data availability.
Table 3: Analysis levels in submissions to the Competition Commission, 2005
Store type Location Drive time limit
Convenience Less than ~ 3000 sqft Urban 1 mile radius
Convenience Less than ~ 3000 sqft Rural 1 mile radius
Mid-range ~ 3000 sqft to ~ 15000 sq ft Urban 5 minutes
Mid-range ~ 3000 sqft to ~ 15000 sq ft Rural 10 minutes
One-stop ~ 15000 sq ft or larger Urban 10 minutes
One-stop ~ 15000 sq ft or larger Rural 15 minutes
Source: Geobusiness Solutions (2005), 2
Page 29
29
Figure 1: A suggested “low tech” decision-making process for a convenience store operator seeking to pay greater attention to store location strategy
ANALYSIS OF SITES IN TURN
- “Incremental decision-making”
Potential to manage “in house” (divest decision-
making from property department)
Consider employing an external location analysis firm such as CACI or
ORC Partnership for strategic direction, expertise and data at least initially
DESK BASED CATCHMENT RESEARCH –
Acquire basic catchment data BUT ensure the
scale of the data is appropriate for the size of
formats
By using catchment data, in comparison with
analogous stores:
• Segment catchment into proportional trade
areas
• Make assumptions about spend levels from
different “types” of customers from the different
locations.
• Compare with expectations from regression
models based on analogous store performance for
that “type” of location (if applicable)
• “Sense check” – assumptions of household
expenditure. Does it “look” right?
GOAL OF LOCATION PLANNING
Estimate sales level and subsequently rate of return over a time
period to determine bid ceiling for site purchase/rental agreement
STRATEGIC OVERALL PERSPECTIVE
– “a blueprint for growth”
FORECAST THE SITE
Review store
performance relative
to forecast after 15
weeks of trading.
Analyse:
a) accuracy of forecast
b) possible under-
performance
Feedback learnings into
the forecast process
SITE VISIT
Contextualise any “local”/site specific issues:
• pedestrian footfall & traffic flow (if appl.)
• car parking (no. and location)
• visibility & access from road & pedestrian
routes
• quality and location of competition
• proximity of adjacent services that may
provide additional footfall
• type & structure of residential catchment
• the effect of any “workers” and “lunchtime
trade” & relate to desk-based data
• Relate these issues and their importance to
a weighted checklist
• Consider adjustments to forecast sales
figure on the basis of micro-scale factors
• Consider issues that are not considered in
the desk-based data or the checklists –
particularly those factors that may be
difficult to quantify
ANALYSE AND UNDERSTAND
CURRENT PORTFOLIO
• Establish key drivers (and impediments) of
performance and segment sales expectations for
different “types” of location (similar to table 4)
• If possible build up data on current
(analogous) stores:
• Survey customers at existing locations
• Analyse catchments of current stores
• Analyse basket sizes, travel times etc.
• Construct weighted checklists for these
different “types” of location relative to each
factor’s importance & to tailor turnover
expectations. These are useful in practical site
visit appraisal
• If portfolio of stores is extensive enough,
build and experiment with statistical
regression-based models of data to
performance (Excel can be simply used for this)
Page 30
30
Table 4: Generic typology of convenience store locations and understanding different trade “drivers” and customer “types”
Residential/Neighbourhood locations Central locations High traffic flow/Petrol filling
station kiosk
Location Local residential catchment.
Likely poor visibility due to location in
housing area.
Minimal “passing” traffic flow
High street and city centres off high traffic
flow/footfall in central locations.
High competition with city/town centre
superstores.
Convenience factor important resulting in
“pitch” becoming essential to performance
Well located on road network. Not
necessarily adjacent to residential
catchment.
Likely low footfall
Catchment Constrained as residential and lack of
footfall or traffic flow. However, within
restricted catchment, high market shares may
be possible
Extensive as located in an established centre
but market shares are likely to be low due to
competition
Larger neighbourhood catchment due
to strategic location on the road
network. Places an emphasis on ability
to park even if not purchasing fuel
Customer &
mission
Families and singles on top-up, distress
missions. Some single households’ “full
shop”
Workers and shoppers often for specific
products (e.g. lunch/snacking) but also top
up
Passing trade, top-up, distress
missions. Possible meal solutions.
Accessibility Car and foot – parking important and
expected
Foot – site unlikely to have dedicated car
park. Reliance on town centre car parks and
spend from workers in the area
Car – Small car park a bonus and not
expected