Convention on Biological Diversity Fourth National Report of the Netherlands April 2010 Ministry of Agriculture, Nature and Food Quality Department of Nature, Landscape and Rural Affairs The Hague, the Netherlands
Transcript
Convention on Biological Diversity
Fourth National Report of the Netherlands
April 2010
Ministry of Agriculture, Nature and Food Quality
Department of Nature, Landscape and Rural Affairs
The Hague, the Netherlands
2
3
Convention on Biological Diversity
Fourth National Report of the Netherlands
April 2010
Ministry of Agriculture, Nature and Food Quality
Department of Nature, Landscape and Rural Affairs
The Hague, the Netherlands
4
5
Contents
Chapter Page
Executive summary
7
Chapter I Overview of biodiversity: status, trends and threats 11
Chapter II Current status of national biodiversity strategies and
action plans
23
Chapter III Sectoral and cross-sectoral integration or mainstreaming
of biodiversity considerations
39
Chapter IV Conclusions: progress towards the 2010 target and
implementation of the Strategic Plan
43
References 63
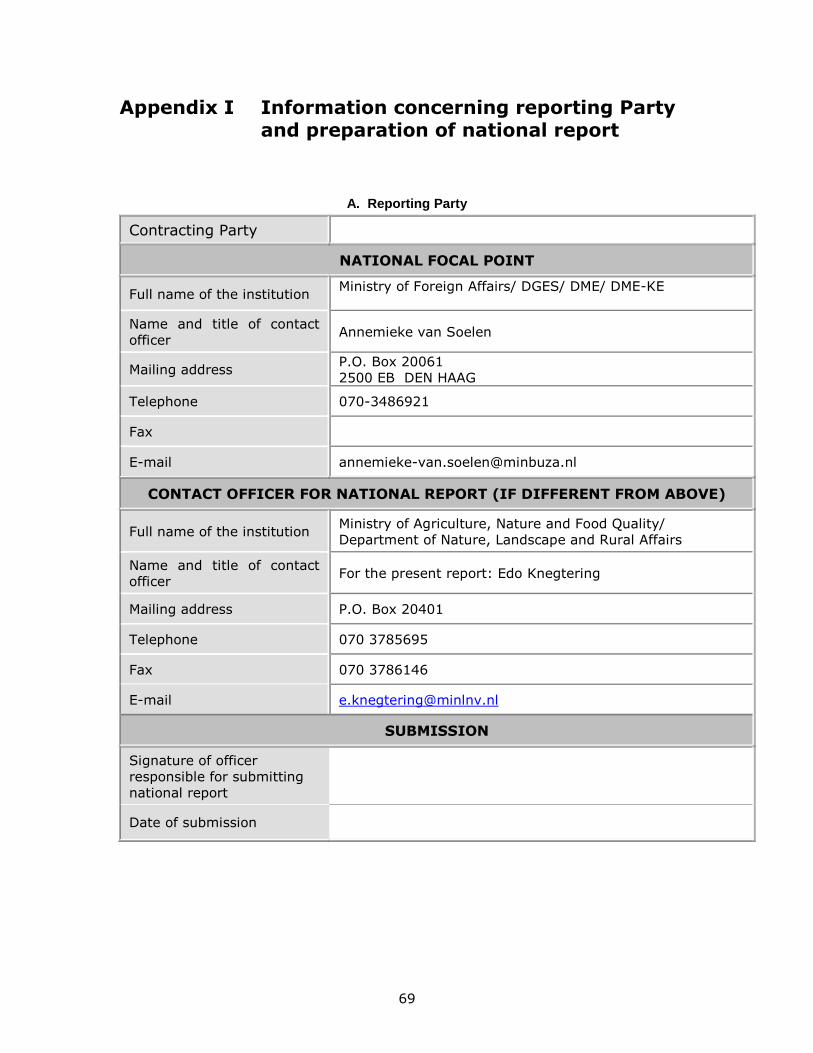
Appendix I Information concerning reporting Party and preparation of
national report
69
Appendix II Further sources of information 71
Appendix III Progress towards targets of the Global Strategy for Plant
Conservation and the Programme of Work on Protected
Areas
73
6
7
Executive summary General developments in the Netherlands regarding biodiversity and policy
The Netherlands is among the most densely populated countries. In addition, the
majority of its terrestrial area is covered by highly productive agricultural lands and
pristine ecosystems are currently virtually absent in the Netherlands. Consequently,
when taking the early 20th century as a reference for the state of current biodiversity in
this country, as is the case in some indicators in external evaluations of Dutch domestic
nature policy, a relative unfavourable picture might emerge.
Nonetheless, ecological processes inevitably still do occur in the Netherlands, and, for
example, animal species composition has not changed dramatically over the 20th century
(Koomen et al. 1995). Furthermore, the Netherlands has spent much effort in
safeguarding and restoring existing nature as well as in creating “new” nature. This has
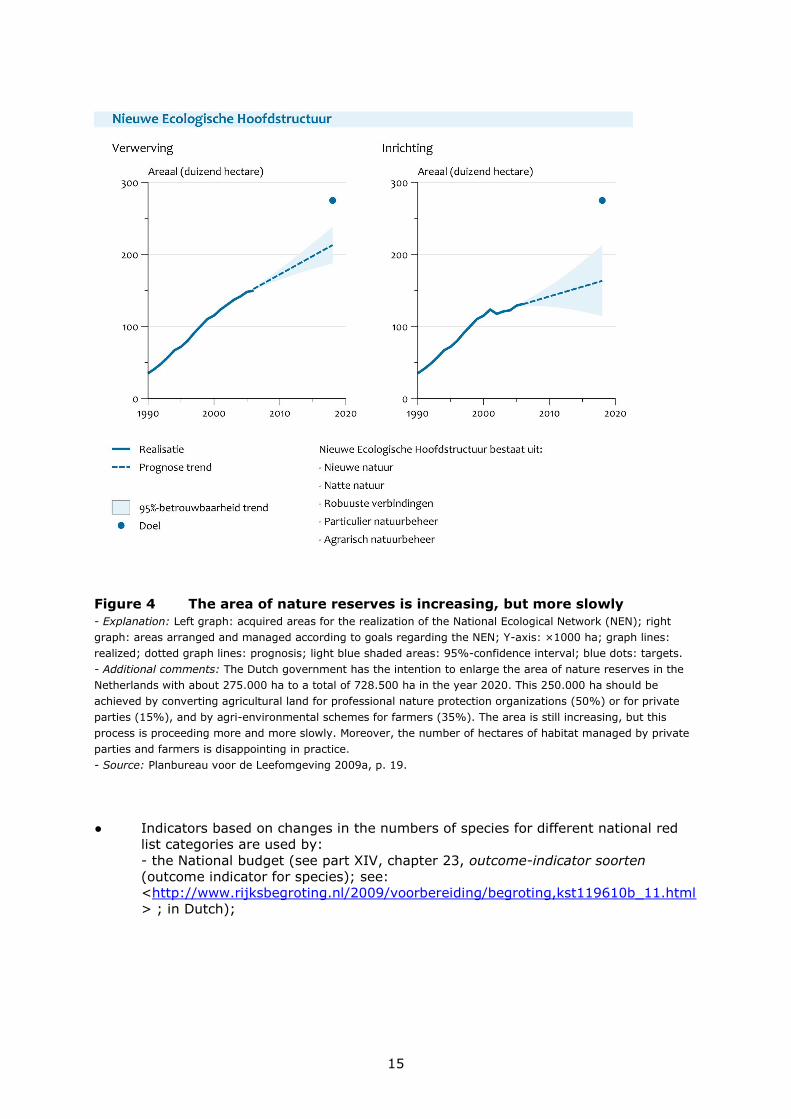
to result in the realization of a sound National Ecological Network (NEN) by around 2018.
The NEN will also include many areas of particular importance that have been designated
under the EU Birds Directive and Habitats Directive. Since 1990, realization of the NEN is
the backbone of Dutch domestic nature policy and it provides new ecological
opportunities for “old” species resulting in areas with high nature values. As such, the
corresponding targets are in line with several CBD targets on protected areas. The NEN
areas also increasingly represent a variety of economic values, for example, when taking
important ecosystem services, including recreational opportunities into account. Further,
current biodiversity policy also addresses an advise of the so-called Deltacommissie to
combine nature and water management efforts for the sake of climate adaptation.
The Netherlands has also a sophisticated level of collecting and processing biodiversity
data. Due to this, the Netherlands is amongst the nations with the first and most
comprehensive online national species catalogues. In 2010, the Netherlands Centre for
Biodiversity Naturalis has also been launched. This centre combines the efforts of several
Dutch taxonomic institutes. Further, the Netherlands has also published a relative large
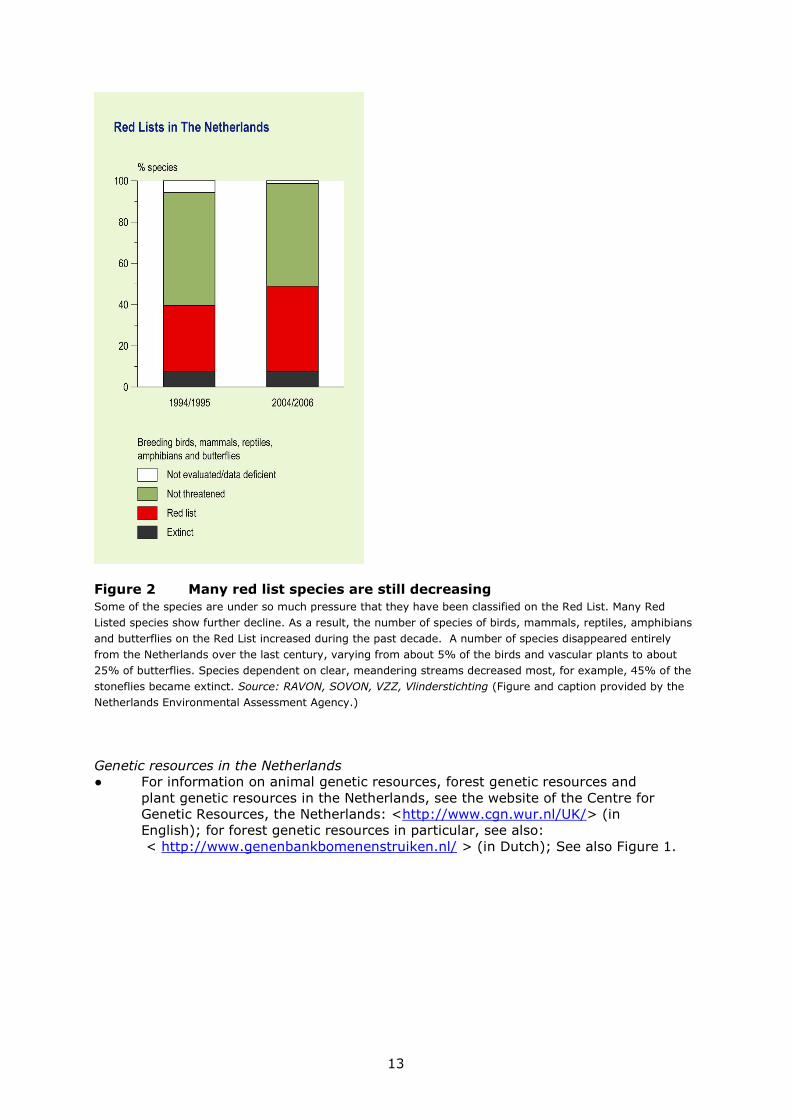
number of national red lists. Although the lists do reflect unfavourable trends regarding
species, they also show a high level of knowledge about the national biodiversity,
particularly among thousands of volunteers participating in nature survey NGOs
(Particuliere Gegevensbeherende Organisaties).
Further, regarding biodiversity outside the Netherlands, the Dutch government
also spends substantial amounts of development assistance on initiatives contributing to
the sustainable use of biodiversity.
Nonetheless, even compared to more recent references (e.g., 1950 or 1982), many
species populations in the Netherlands have declined or are further declining. Factors
considered to have contributed to the long-term decline (i.e., over the 20th century) of
populations of animal species include large-scale hydraulic works, organic pollution and
salinization, the disappearance of eelgrass beds in the Wadden Sea, straightening of
water coarses, reclaiming of heathlands and grasslands as well as the subsequent
acidification, eutrophication and desiccation of these lands, and the disappearance of
flowery areas (Koomen et al. 1995). Factors considered to have been involved in the
long-term decline (i.e., over the 20th century) of plant species (including lichens, algae
and macrofungi) include air pollution, nitrogen deposition, habitat destruction (including
of heathlands, grasslands, moors and dunes), the disappearance of eelgrass beds in the
Wadden Sea, increased water temperatures, acidification and eutrophication of waters,
and decreased vitality of forests (Van der Meijden et al. 1995).
Particularly during the late sixties and seventies, societal and political concern
with environmental issues has grown and the Netherlands has developed a considerable
body of spatial, environmental and nature legislation and policy since then. Part of the
legislation and policy aims at implementing international treaties, such as the CBD, and
EU regulations. In short, the variety of measures has had inhibiting effects on
8
biodiversity decline, although several targets, notably regarding the realization of the
NEN and the reduction of nitrogen emissions and depositions, still remain challenging,
including with reference to CBD targets.
In addition, concern with biodiversity outside the Netherlands has increased and
corresponding policy focuses on realizing more sustainable international trade and
production chains to facilitate the integration of social and ecological conditions and
promote the production and trade of sustainable products. The Netherlands also
stimulates the development of financial mechanisms that assign economic values to
ecosystem services, which also contributes to ecosystem preservation.
Another challenge is enhancing public awareness and concern regarding
biodiversity. To meet this challenge, current biodiversity policy increasingly emphasizes
functional values of biodiversity rather than expressing the more traditional concern
about the conservation status of individual species.
Although not for all CBD targets and issues information could be provided in the
present report, including on policy efforts and progress, our overall impression is that at
least the various policy efforts in the Netherlands may be regarded as being to a large
extent in line with the various actions of the CBD and COP decisions. The remainder of
this summary provides an overview of the content of the present report for each chapter
separately.
Chapter I: Overview of biodiversity: status, trends and threats
Section 1.1 and 1.2 in this chapter present several key data and data sources regarding
the status and trends of Dutch biodiversity. The sources include the Dutch Species
Catalogue, a comprehensive online species list of all recorded multi-cellular species in the
Netherlands. The database also provides information on the legal and red list status and
on recent population trend data for the species concerned. In addition, the chapter
presents various sources for spatial data including on nature areas. Further, several trend
data provided by the Netherlands Environmental Assessment Agency are presented.
Finally, section 1.3 provides a concise overview of factors involved in the long-
term decline in populations of animal and plant species during the 20th century (see also
above).
Chapter II: Current status of national biodiversity strategies and action plans
Section 2.1 in this chapter lists relevant policy plans on biodiversity since 1995 and
various corresponding internet links, preferably to English versions. The plans referred to
include the most recent document “Biodiversity works: for nature, for people, for ever:
the biodiversity policy programme of the Netherlands 2008-2011” and an additional
policy note on invasive alien species. Section 2.2 indicates where targets and indicators
adopted under the CBD have been incorporated into national policy or legislation. To this
end, various articles, thematic programmes and cross-cutting issues of the CBD are
listed. For each article, thematic programme and cross-cutting issue, a brief reference is
given to where principles according to CBD targets have been addressed and, where
appropriate, some corresponding indicators. Section 2.4 refers to a number of sources in
which progress in Dutch biodiversity has been evaluated, such as the yearly reports
“Nature balance” of the Netherlands Environmental Assessment Agency. Section 2.5
refers to sources indicating public spending of the Netherlands on biodiversity policy.
Section 2.6 and 2.7 address obstacles encountered in and effectiveness of Dutch
biodiversity policy and again refers to various sources including the “Nature balance”. In
section 2.8 specific information requested in COP 8 decisions is provided.
Chapter III: Sectoral and cross-sectoral integration or mainstreaming of
biodiversity considerations
Section 3.1 of this chapter indicates for the policy domains agriculture, education, health,
rural development, forestry, fishery, mining, tourism, finance, trade, and industry,
whether and where the Netherlands has addressed biodiversity issues in corresponding
policy regarding.these domains. The section also provides various internet links to
9
relevant policy documents, preferably to English versions. The sections 3.2 to 3.4
subsequently briefly indicate by what processes biodiversity was integrated in such plans,
how the ecosystem approach has been adopted, and to which extent biodiversity is
included in environmental assessments. For outcomes of the several measures, in
particular in terms of observed changes in the status and trends of important biodiversity
components, and the extent to which these measures contribute to the implementation
of biodiversity policy, section 3.5 refers to evaluations by the Netherlands Environmental
Assessment Agency. Finally, section 3.6 provides information on how biodiversity has
been taken into account in overseas development assistance.
Chapter IV: Conclusions: progress towards the 2010 target and implementation
of the Strategic Plan
On the basis of the provisional framework of goals, targets and indicators, section 4.1
reports on progress toward the 2010 target by means of remarks in table 1. As far as
appropriate and as far as information was available, for each target and indicator
provided by the CBD manual for the present report, information is given on policy efforts
in the Netherlands in the context of the targets and indicators. The information includes:
national policy targets, incorporation in other sectors, progress made, indicators used
and obstacles encountered. Section 4.2 reports on the progress towards the goals and
objectives of the Strategic Plan of the CBD. Finally, on basis of the various sources and
information referred to in the remainder of the present report, section 4.3 provides brief
overall conclusions, as are also incorporated above.
10
11
Chapter I Overview of biodiversity status, trends and threats
1.1 Status of biodiversity in the Netherlands
A comprehensive overview of the species recorded in the Netherlands
● The Nederlands Soortenregister <http://www.nederlandsesoorten.nl>
(in Dutch; however, includes Latin taxon names) contains the names of all multi-
cellular species recorded in the Netherlands (approximately 36.000 species,
including over 900 exotic species). For a general summary in English, see:
<http://www.nederlandsesoorten.nl/nlsr/nlsr/english.html>. For pie charts
summarizing the species numbers of different groups, see:
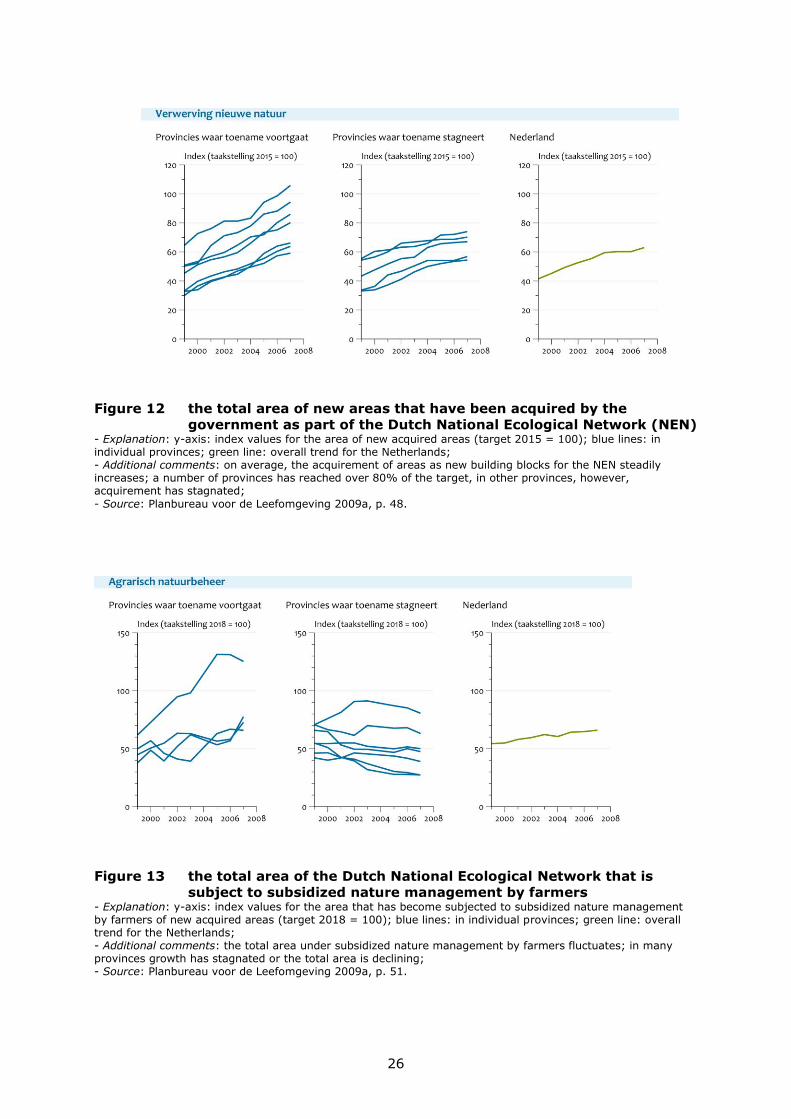
Figure 12 the total area of new areas that have been acquired by the
government as part of the Dutch National Ecological Network (NEN) - Explanation: y-axis: index values for the area of new acquired areas (target 2015 = 100); blue lines: in individual provinces; green line: overall trend for the Netherlands; - Additional comments: on average, the acquirement of areas as new building blocks for the NEN steadily increases; a number of provinces has reached over 80% of the target, in other provinces, however, acquirement has stagnated;
- Source: Planbureau voor de Leefomgeving 2009a, p. 48.
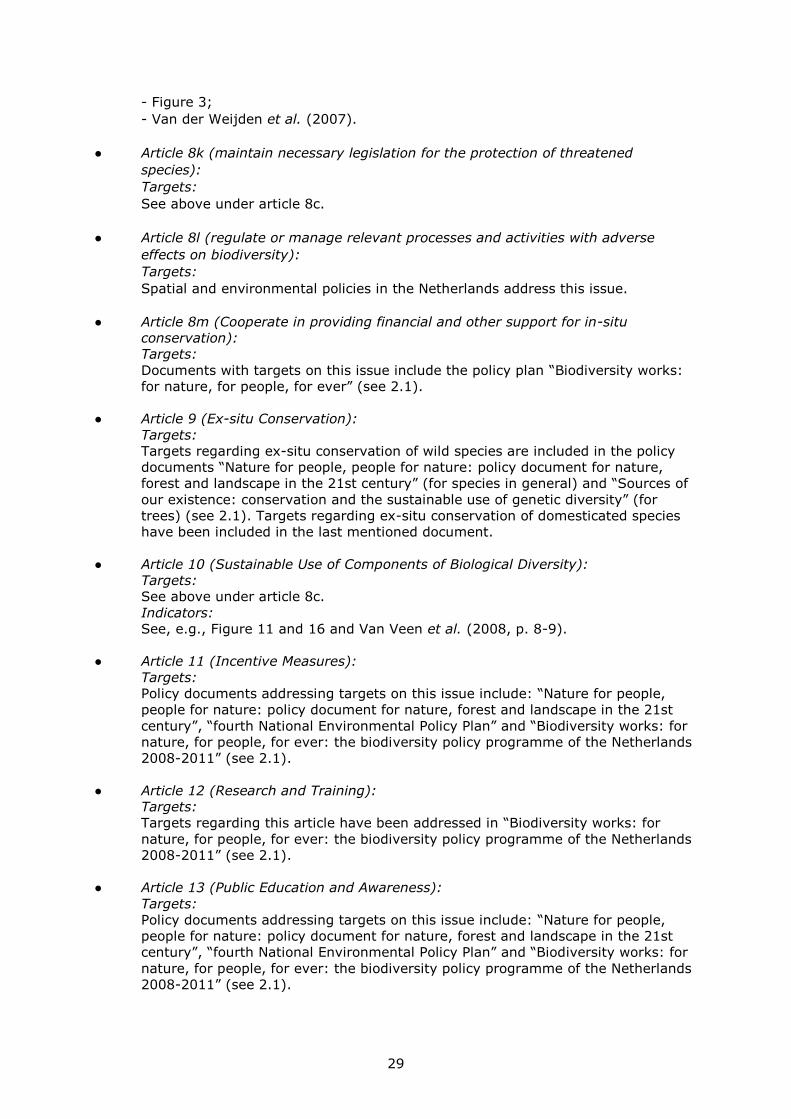
Figure 13 the total area of the Dutch National Ecological Network that is
subject to subsidized nature management by farmers - Explanation: y-axis: index values for the area that has become subjected to subsidized nature management by farmers of new acquired areas (target 2018 = 100); blue lines: in individual provinces; green line: overall trend for the Netherlands; - Additional comments: the total area under subsidized nature management by farmers fluctuates; in many provinces growth has stagnated or the total area is declining; - Source: Planbureau voor de Leefomgeving 2009a, p. 51.
27
Figure 14 local quality of nature by province in the Netherlands (2000-2005)
- Explanation: horizontal bars: scores of the quality of local nature areas in 12 different provinces in the
Netherlands as compared to policy targets set; green: good, dark blue: almost good, intermediate blue:
modest, light blue: insufficient, very light blue: bad;
- Additional comments: nature areas of low quality are present in all provinces; particularly large nature areas
represent biodiversity hotspots;
- Source: Planbureau voor de Leefomgeving 2009a, p. 55.
Figure 15 Trends in national nature quality for heath lands, forests, and
moors
- Explanation: y-axis index values for quality; blue lines: population sizes; green lines: diversity; left graph
heath lands, middle graph: forest, right graph: moors;
- Additional comments: since the early nineties average nature quality of all nature types distinguished has
declined, but in forests and moors, the decline has decreased;
- Source: Planbureau voor de Leefomgeving 2009a, p. 57.
28
Indicators:
- For the realization of ‘nature quality’ in protected areas, see Figure 5, 14 and 15.
- See also the indicators referred to under the previous article (8a).
● Article 8c (regulation or management of biological resources):
Targets:
The Flora and Fauna Act 1998, Nature Conservation Act 1998 and Fisheries Act
1963 are main instruments for regulating biological resources in the Netherlands
and also contain some general targets.
● Article 8d (Promote the protection of ecosystems, natural habitats and the
maintenance of viable populations of species in natural surroundings):
A variety of instruments and targets deals with this issue. See e.g. the policy
document “Nature for people, people for nature: policy document for nature,
forest and landscape in the 21st century” (see 2.1).
● Article 8e (Promote environmentally sound and sustainable development in areas
adjacent to protected areas):
Targets:
The Nature Conservation Act 1998 provides for preventing negative effects from
areas adjacent on those protected under the EU Birds Directive and Habitats
Directive. Further, the “Policy letter on soil management” (see 2.1) promotes the
sustainable use of soil in the countryside, particularly in agricultural and natural
areas.
● Article 8f (rehabilitation and restoration of degraded ecosystems and promoting
the recovery of threatened species):
Targets:
Similar targets are addressed by the policy document “Nature for people, people
for nature: policy document for nature, forest and landscape in the 21st century”
(see 2.1).
● Article 8g (means to regulate, manage or control the risks of living modified
organisms):
Targets:
Similar targets are addressed by the following act: Besluit genetisch
gemodificeerde organismen milieubeheer. The act implements the EU directives
2001/18/eg and 90/219/eg which in turn represent much of the implementation of
the Biosafety Protocol. Other acts relevant for the implementation of the Biosafety
Protocol include EU regulations EC/1946/2003, EC/1829/2003 and EC/1830/2003.
For further details, see the first national report on the implementation of the
Biosafety Protocol, provided by the Netherlands and the EC.
● Article 8h (prevention of the introduction of, control or eradication of alien
species):
Targets:
Corresponding targets are addressed in a policy document on invasive alien
species (see 2.1).
Indicators:
See for indicators for numbers of alien animal and plant species: 1.2., under
‘Trends in species numbers and species’ populations in the Netherlands’; for
various other indicators regarding alien species in the Netherlands, see:
● Article 8k (maintain necessary legislation for the protection of threatened
species):
Targets:
See above under article 8c.
● Article 8l (regulate or manage relevant processes and activities with adverse
effects on biodiversity):
Targets:
Spatial and environmental policies in the Netherlands address this issue.
● Article 8m (Cooperate in providing financial and other support for in-situ
conservation):
Targets:
Documents with targets on this issue include the policy plan “Biodiversity works:
for nature, for people, for ever” (see 2.1).
● Article 9 (Ex-situ Conservation):
Targets:
Targets regarding ex-situ conservation of wild species are included in the policy
documents “Nature for people, people for nature: policy document for nature,
forest and landscape in the 21st century” (for species in general) and “Sources of
our existence: conservation and the sustainable use of genetic diversity” (for
trees) (see 2.1). Targets regarding ex-situ conservation of domesticated species
have been included in the last mentioned document.
● Article 10 (Sustainable Use of Components of Biological Diversity):
Targets:
See above under article 8c.
Indicators:
See, e.g., Figure 11 and 16 and Van Veen et al. (2008, p. 8-9).
● Article 11 (Incentive Measures):
Targets:
Policy documents addressing targets on this issue include: “Nature for people,
people for nature: policy document for nature, forest and landscape in the 21st
century”, “fourth National Environmental Policy Plan” and “Biodiversity works: for
nature, for people, for ever: the biodiversity policy programme of the Netherlands
2008-2011” (see 2.1).
● Article 12 (Research and Training):
Targets:
Targets regarding this article have been addressed in “Biodiversity works: for
nature, for people, for ever: the biodiversity policy programme of the Netherlands
2008-2011” (see 2.1).
● Article 13 (Public Education and Awareness):
Targets:
Policy documents addressing targets on this issue include: “Nature for people,
people for nature: policy document for nature, forest and landscape in the 21st
century”, “fourth National Environmental Policy Plan” and “Biodiversity works: for
nature, for people, for ever: the biodiversity policy programme of the Netherlands
2008-2011” (see 2.1).
30
Figure 16 Biodiversity loss due to Netherlands consumption and export The total Dutch biodiversity footprint on land outside the Netherlands corresponds with an area of about 3 times the size of the Netherlands that has lost its entire biodiversity. Outlooks predict that this area will further increase, showing a continuing impact of Dutch consumption on global biodiversity. In the Netherlands itself, biodiversity is lost because land is used for Dutch consumption and for export products. SEBI indicator 23. Source: Netherlands Environmental Assessment Agency.
Figure 17 Membership nature conservation organisations in the Netherlands The awareness of the need for nature protection is reflected in the number of people who financially support non-governmental nature conservation organisations, such as Natuurmonumenten and the World Wildlife Fund. Most Dutch citizens show a high to medium awareness of the importance of nature protection. Only a limited group (around 10%) rejects the need for nature protection. However, the group most aware of the need for nature protection has decreased from 42% in 2001 to 30% in 2006. SEBI indicator 26. Source: Netherlands Environmental Assessment Agency.
31
Indicators:
- See Figure 17 and Van Veen et al. (2008, p. 11);
- See also the scores regarding the Netherlands in the report by The Gallop
Organization (2007).
● Article 14 (Impact Assessment and Minimizing Adverse Impacts):
Targets:
Except for biodiversity components addressed by the EU Birds Directive and
Habitats Directive, Dutch EIA legislation does currently not explicitly include
targets regarding the consideration of biodiversity.
Indicators:
For information on EIAs in the Netherlands, contact the Netherlands Commission
for Environmental Assessment; see: <http://www.eia.nl/default.asp>.
● Article 15 (Access to Genetic Resources):
Targets:
Targets have been formulated in the document “Sources of our existence:
conservation and the sustainable use of genetic diversity” (see 2.1).
● Article 16 (Access to and Transfer of technology):
Targets:
The Netherlands contributes actively to the development of international
agreements on the access to genetic resources and an equal sharing of benefits
(ABS = Access and Benefit Sharing). In 2010, an international agreement has to
be reached that arranges the rights and obligations of producers and users of
genetic knowledge and sources.
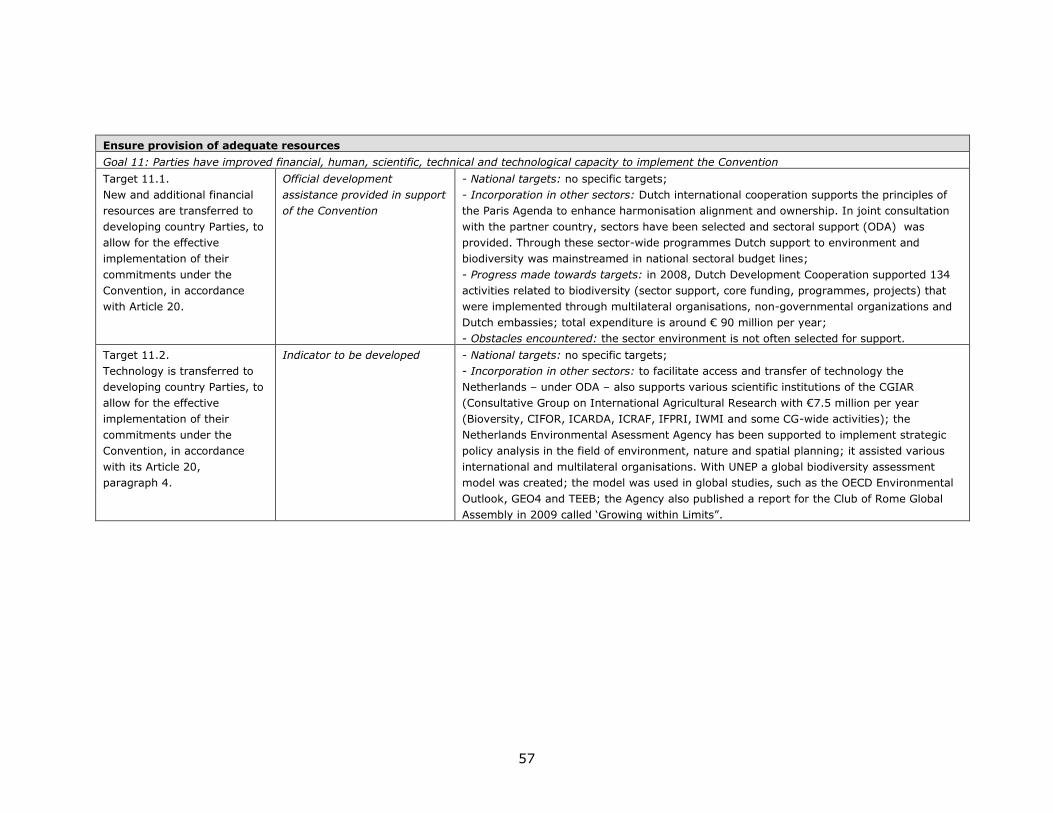
To facilitate access and transfer of technology the Netherlands – under ODA – also
supports various scientific institutions of the CGIAR (Consultative Group on
International Agricultural Research with €7.5 million per year (Bioversity, CIFOR,
ICARDA, ICRAF, IFPRI, IWMI and some CG-wide activities).
The Netherlands Environmental Asessment Agency has been supported to
implement strategic policy analysis in the field of environment, nature and spatial
planning. It assisted various international and multilateral organisations. With
UNEP a global biodiversity assessment model was created. The model was used in
global studies, such as the OECD Environmental Outlook, GEO4 and TEEB. The
Agency also published a report for the Club of Rome Global Assembly in 2009
called “Growing within Limits”.
● Article 17 (Exchange of Information):
Targets:
Targets regarding this issue are addressed in “Biodiversity works: for nature, for
people, for ever: the biodiversity policy programme of the Netherlands 2008-
2011” (see 2.1).
● Article 18 (Technical and Scientific Cooperation):
Targets:
Targets regarding this issue are addressed in “Biodiversity works: for nature, for
people, for ever: the biodiversity policy programme of the Netherlands 2008-
2011” (see 2.1).
● Article 19 (Handling of Biotechnology and Distribution of its Benefits):
Targets:
Targets have been included in the national budget; see also “Biodiversity works:
for nature, for people, for ever: the biodiversity policy programme of the
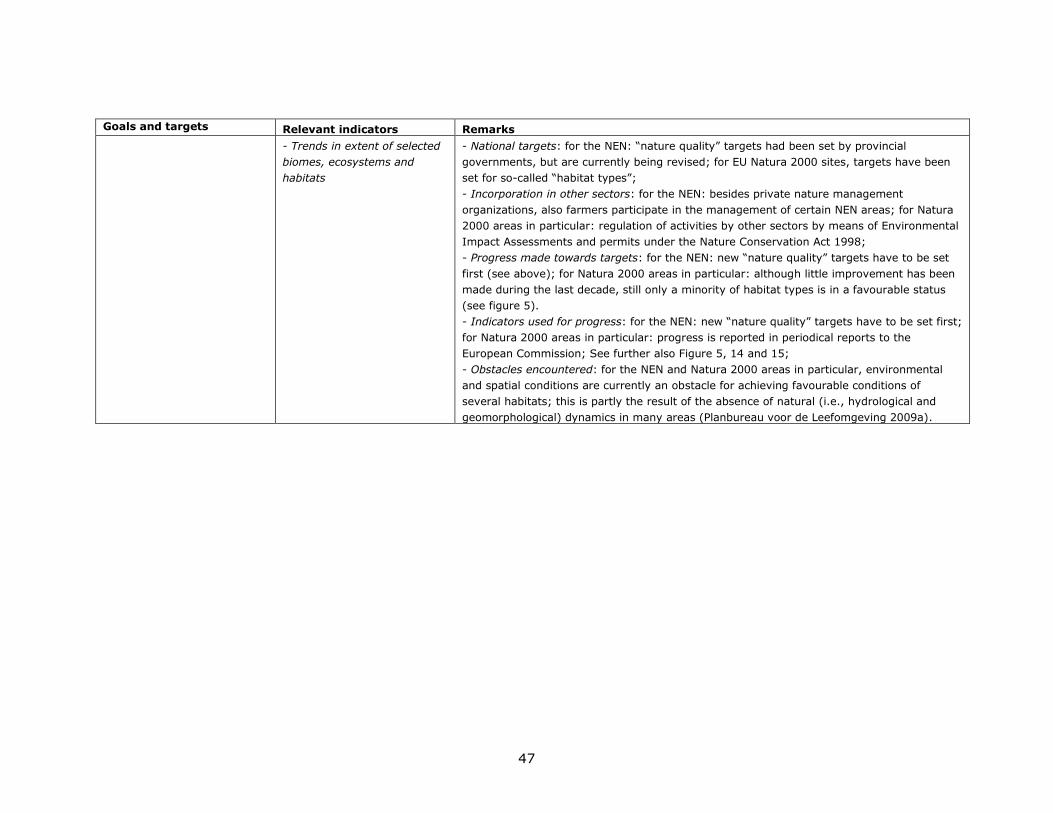
- National targets: for the NEN: “nature quality” targets had been set by provincial
governments, but are currently being revised; for EU Natura 2000 sites, targets have been
set for so-called “habitat types”;
- Incorporation in other sectors: for the NEN: besides private nature management
organizations, also farmers participate in the management of certain NEN areas; for Natura
2000 areas in particular: regulation of activities by other sectors by means of Environmental
Impact Assessments and permits under the Nature Conservation Act 1998;
- Progress made towards targets: for the NEN: new “nature quality” targets have to be set
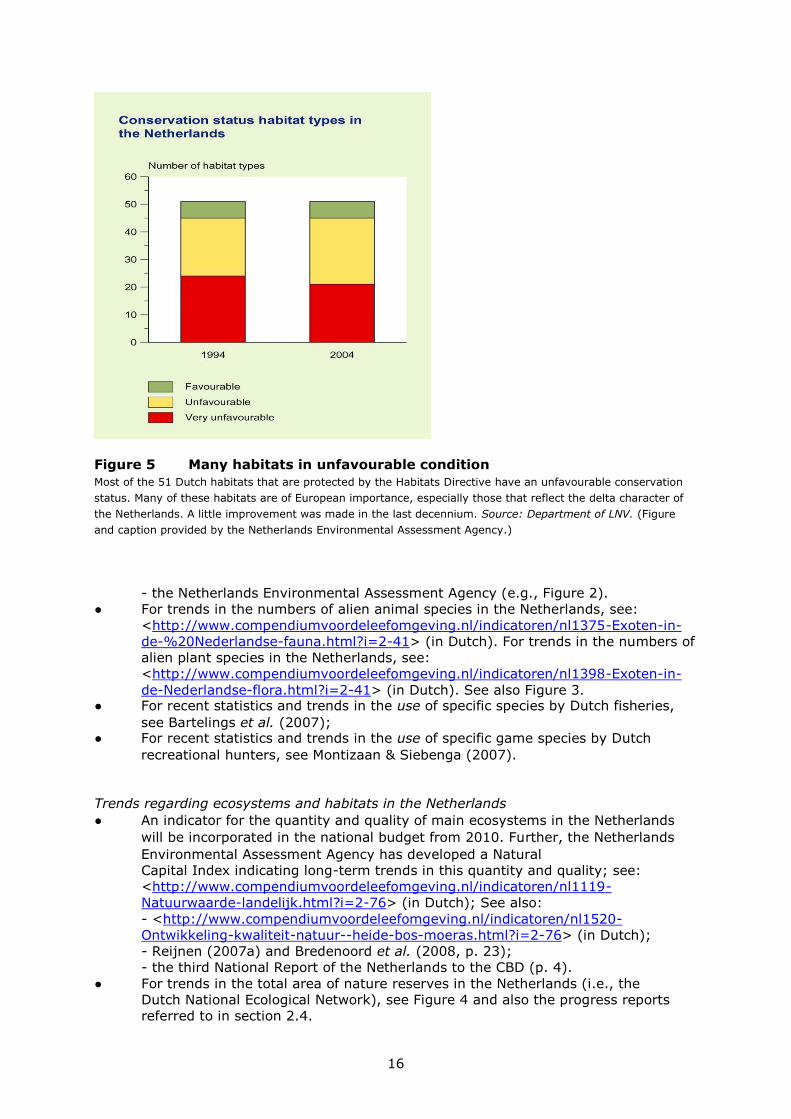
first (see above); for Natura 2000 areas in particular: although little improvement has been
made during the last decade, still only a minority of habitat types is in a favourable status
(see figure 5).
- Indicators used for progress: for the NEN: new “nature quality” targets have to be set first;
for Natura 2000 areas in particular: progress is reported in periodical reports to the
European Commission; See further also Figure 5, 14 and 15;
- Obstacles encountered: for the NEN and Natura 2000 areas in particular, environmental
and spatial conditions are currently an obstacle for achieving favourable conditions of
several habitats; this is partly the result of the absence of natural (i.e., hydrological and
geomorphological) dynamics in many areas (Planbureau voor de Leefomgeving 2009a).
48
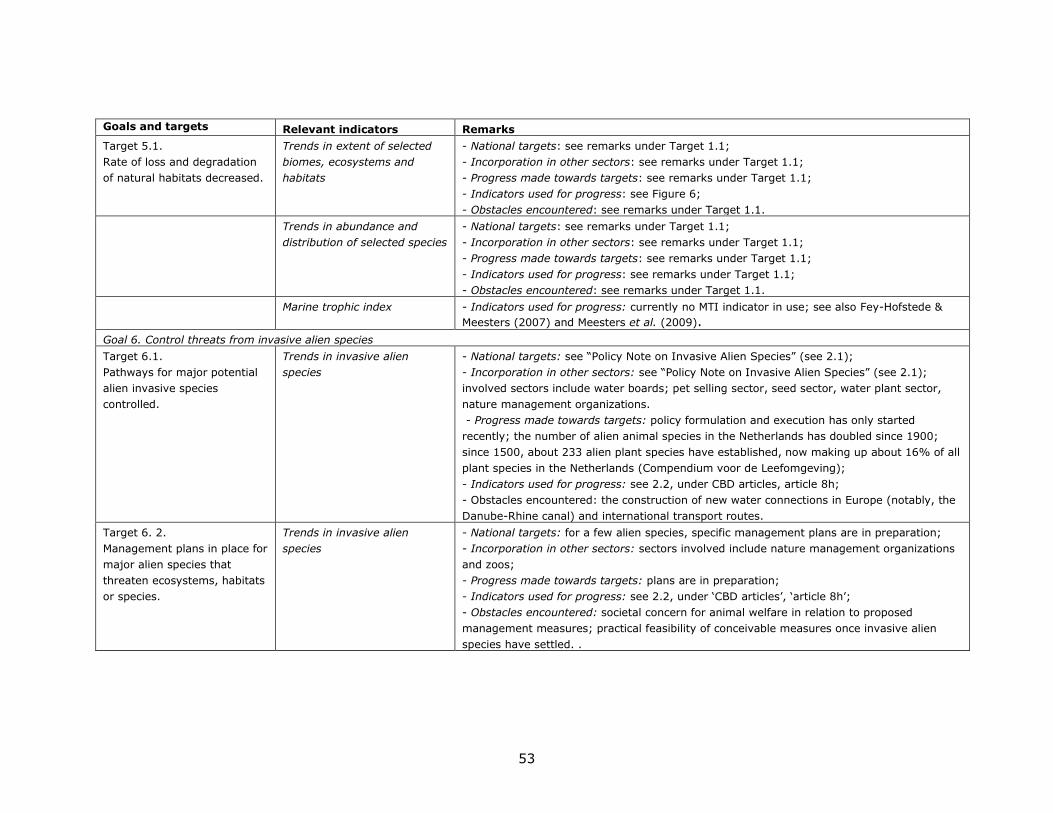
Goals and targets Relevant indicators Remarks
- Trends in abundance and
distribution of selected species
- National targets: according to the document “Nature for people, people for nature” (see
2.1) and subsequent documents, the main target regarding species in the Netherlands is the
following: ‘By 2020 conditions will be in place for the long-term conservation of all species
and populations native to the Netherlands occurring in 1982’; within the EU Natura 2000
framework, targets have also been set for the preservation of specific species or species
groups.
- Incorporation in other sectors: several sectors have made codes of conduct to regulate
activities which may harm species which are protected under the Flora and Fauna Act 1998;
for the role of sectors in area-based conservation (which should substantially contribute to
reaching the target), see above; further, sectors including water boards, farmers and nature
management organizations participate in the “The habitat-based approach” for species (see
2.1). In addition, environmental and spatial policy, defragmentation policy, fisheries policy,
etc. should also contribute to reaching the target and affects many different sectors.
- Progress made towards targets: although the total area of protected areas is increasing,
national red lists of threatened species have increased in length and many species have
become more endangered;
- Indicators used for progress: both the National Budget and the NEAA use indicators based
on changes in the red list status of species (see 1.2, under ‘Trends in species numbers and
species’ populations in the Netherlands’).
- Obstacles encountered: these include unfavourable spatial and environmental conditions,
including hydrological and nitrogen conditions, particularly in species’ habitats and
suboptimal designation of NEN areas; unfavourable conditions are often the result of
intensive use of agricultural land surrounding nature areas due to which biodiversity is
increasingly withdrawn into reserves; other underlying obstacles include the absence of
natural (hydrological and geomorphological) dynamics in several areas, the homogenization
of ecosystems (i.e., soil, water and management variation and decrease of gradients) and
climate change (Planbureau voor de Leefomgeving 2009a).
Target 1.2:
Areas of particular importance
to biodiversity protected
Trends in extent of selected
biomes, ecosystems and
habitats
At least EU Natura 2000 sites are of particular importance both at the national and the EU
level. See further the remarks under Target 1.1.
Trends in abundance and
distribution of selected species
At least EU Natura 2000 sites are of particular importance both at the national and the EU
level. See further the remarks under Target 1.1.
Coverage of protected areas At least EU Natura 2000 sites are of particular importance both at the national and the EU
level. See further the remarks under Target 1.1.
49
Goals and targets Relevant indicators Remarks
Goal 2. Promote the conservation of species diversity
Target 2.1:
Restore, maintain, or reduce
the decline of populations of
species of selected taxonomic
groups.
Trends in abundance and
distribution of selected species
See remarks under Target 1.1.
Change in status of
threatened species
See remarks under Target 1.1.
Target 2.2:
Status of threatened species
improved.
Change in status of
threatened species
See remarks under Target 1.1.
Trends in abundance and
distribution of selected species
See remarks under Target 1.1.
Coverage of protected areas See remarks under Target 1.1.
Goal 3. Promote the conservation of genetic diversity
Target 3.1:
Genetic diversity of crops,
livestock, and of harvested
species of trees, fish and
wildlife and other valuable
species conserved, and
associated indigenous and
local knowledge maintained.
Trends in genetic diversity of
domesticated animals,
cultivated plants, and fish
species of major socio-
economic importance
- National targets: according to the document “Sources of our existence” (see 2.1): conservation and the sustainable use of genetic diversity implementing the main objectives stated in the CBD: (a) Conservation and sustainable use of genetic resources; (b) Fair distribution of the benefits resulting from their use.
- Incorporation in other sectors: efforts of 4 major research institutes and the participation
in a platform by the agro-food and biotechnology sector;
- Progress made towards targets: significant progress has been made in the establishment
of assessable gene banks for plants, animals and shrubs and trees as well as in the
development of genetic knowledge;
- Indicators used for progress: see Figure 1 and Van Veen et al. (2008, p. 4); See also
Windig et al. (2007).
- Obstacles encountered: no major obstacles in the execution of the document; however,
productivity is seen as a driving force in the decrease of genetic diversity in domesticated
breeds; for example, in artificial insemination, selection is often based on productivity
characteristics.
Biodiversity used in food and
medicine (indicator under
development)
-
Trends in abundance and
distribution of selected species
-
50
Goals and targets Relevant indicators Remarks
Promote sustainable use
Goal 4. Promote sustainable use and consumption.
Target 4.1:
Biodiversity-based products
derived from sources that are
sustainably managed, and
production areas managed
consistent with the
conservation of biodiversity.
Area of forest, agricultural and
aquaculture ecosystems under
sustainable management
- National targets: for forestry and agriculture: see 2.2. under ‘Thematic Programmes of the
CBD’ and 3.1;
- Progress made towards targets: -;
forestry: the area of forests has expanded and management is often based on
multifunctional targets;
agriculture: the useful application of biodiversity in agriculture has been promoted
by means of the EU-learning network FAB (functional agrobiodiversity (see:
<http://www.eln-fab.eu/>) and national programmes FAB en Spade (national
programme for knowledge transfer (see: <http://www.spade.nl/>));
aquaculture: -;
- Indicators used for progress: see Van Veen et al. (2008, p. 8-9); for indicators regarding
forestry and agriculture, see also 2.2. under ‘Thematic Programmes of the CBD’;
- Obstacles encountered:
forestry: the natural character of Dutch forests is limited, because the greatest part (80 %) of Dutch
forests consists of standing forest of which 82 % is even-aged (Dirkse et al. 2006); in addition: high costs
of labour are an obstacle in forest management;
agriculture: environmental pressure of agriculture on natural biodiversity by unfavourable hydrological
management (desiccation) and high nitrogen levels;
aquaculture: -.
Proportion of products derived
from sustainable sources
(indicator under development)
- Incorporation in other sectors: ‘biodiversity’ is an explicit theme in the initiative Corporate
Social Responsibility (Maatschappelijk Verantwoord Ondernemen) (see:
On the basis of input obtained from policy makers from several ministries as well as
from the Netherlands Environmental Assessment Agency (NEAA), a draft report was
prepared. Comments on the draft version were subsequently provided by ministerial
policy makers, NEAA employees, Dutch CBD focal points and member organizations
of the National Committee of the Netherlands of the IUCN. Finally, a second draft has
been evaluated and approved by the inter-ministerial Coordination Commission on
Environmental Policy (CIM-Bio) under the supervision of the ministry of Foreign
Affairs.
71
Appendix II Further sources of information
See the various sources referred to in the previous text as well as in the references
section above.
72
73
Appendix III Progress towards Targets of the Global Strategy for Plant Conservation and the Programme of Work on Protected Areas
A. Progress towards Targets of the Global Strategy for Plant Conservation
See 2.2., under Cross-cutting Issues of the CBD.
B. Progress towards Targets of the Programme of Work on Protected Areas
See the table below.
74
75
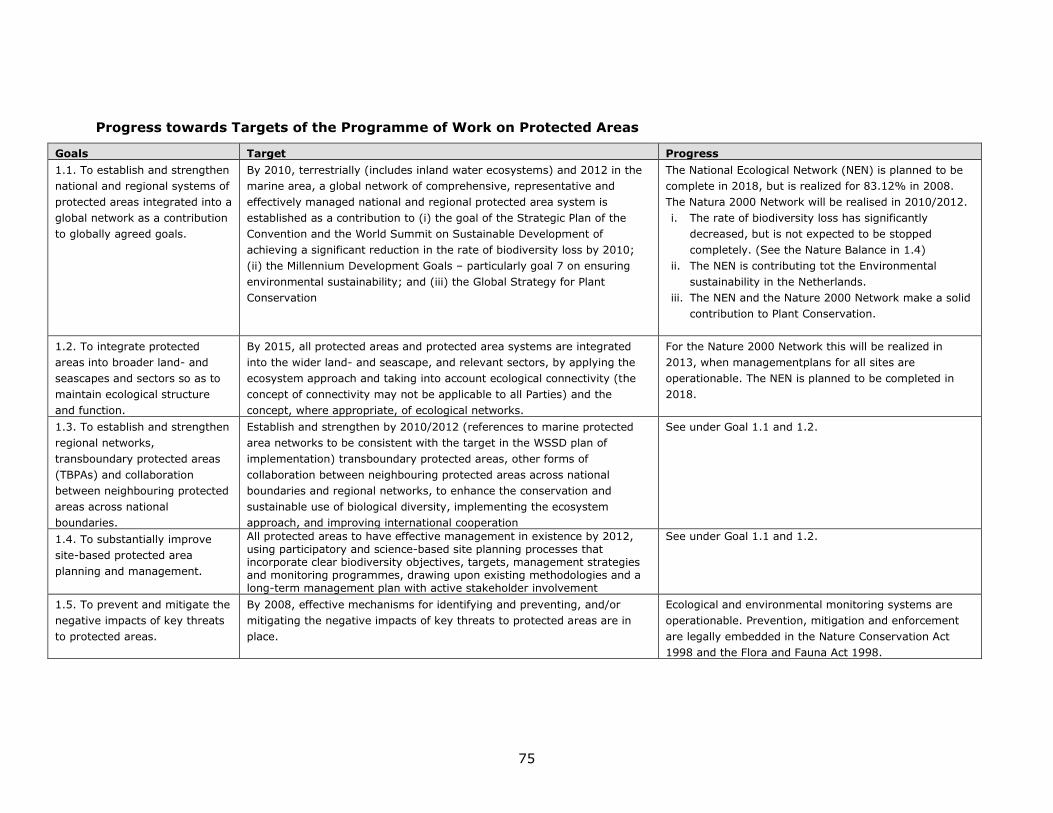
Progress towards Targets of the Programme of Work on Protected Areas
Goals Target Progress
1.1. To establish and strengthen
national and regional systems of
protected areas integrated into a
global network as a contribution
to globally agreed goals.
By 2010, terrestrially (includes inland water ecosystems) and 2012 in the
marine area, a global network of comprehensive, representative and
effectively managed national and regional protected area system is
established as a contribution to (i) the goal of the Strategic Plan of the
Convention and the World Summit on Sustainable Development of
achieving a significant reduction in the rate of biodiversity loss by 2010;
(ii) the Millennium Development Goals – particularly goal 7 on ensuring
environmental sustainability; and (iii) the Global Strategy for Plant
Conservation
The National Ecological Network (NEN) is planned to be
complete in 2018, but is realized for 83.12% in 2008.
The Natura 2000 Network will be realised in 2010/2012.
i. The rate of biodiversity loss has significantly
decreased, but is not expected to be stopped
completely. (See the Nature Balance in 1.4)
ii. The NEN is contributing tot the Environmental
sustainability in the Netherlands.
iii. The NEN and the Nature 2000 Network make a solid
contribution to Plant Conservation.
1.2. To integrate protected
areas into broader land- and
seascapes and sectors so as to
maintain ecological structure
and function.
By 2015, all protected areas and protected area systems are integrated
into the wider land- and seascape, and relevant sectors, by applying the
ecosystem approach and taking into account ecological connectivity (the
concept of connectivity may not be applicable to all Parties) and the
concept, where appropriate, of ecological networks.
For the Nature 2000 Network this will be realized in
2013, when managementplans for all sites are
operationable. The NEN is planned to be completed in
2018.
1.3. To establish and strengthen
regional networks,
transboundary protected areas
(TBPAs) and collaboration
between neighbouring protected
areas across national
boundaries.
Establish and strengthen by 2010/2012 (references to marine protected
area networks to be consistent with the target in the WSSD plan of
implementation) transboundary protected areas, other forms of
collaboration between neighbouring protected areas across national
boundaries and regional networks, to enhance the conservation and
sustainable use of biological diversity, implementing the ecosystem
approach, and improving international cooperation
See under Goal 1.1 and 1.2.
1.4. To substantially improve
site-based protected area
planning and management.
All protected areas to have effective management in existence by 2012, using participatory and science-based site planning processes that incorporate clear biodiversity objectives, targets, management strategies and monitoring programmes, drawing upon existing methodologies and a long-term management plan with active stakeholder involvement
See under Goal 1.1 and 1.2.
1.5. To prevent and mitigate the
negative impacts of key threats
to protected areas.
By 2008, effective mechanisms for identifying and preventing, and/or
mitigating the negative impacts of key threats to protected areas are in
place.
Ecological and environmental monitoring systems are
operationable. Prevention, mitigation and enforcement
are legally embedded in the Nature Conservation Act
1998 and the Flora and Fauna Act 1998.
76
Goals Target Progress
2.1. To promote equity and
benefit-sharing.
Establish by 2008 mechanisms for the equitable sharing of both costs and
benefits arising from the establishment and management of protected
areas
2.2. To enhance and secure
involvement of indigenous and
local communities and relevant
stakeholders.
Full and effective participation by 2008, of indigenous and local
communities, in full respect of their rights and recognition of their
responsibilities, consistent with national law and applicable international
obligations, and the participation of relevant stakeholders, in the
management of existing, and the establishment and management of new,
protected areas
For the Natura 2000 Network this will be realized in
2013. For the NEN in 2018.
3.1. To provide an enabling
policy, institutional and socio-
economic environment for
protected areas.
By 2008 review and revise policies as appropriate, including use of social
and economic valuation and incentives, to provide a supportive enabling
environment for more effective establishment and management of
protected areas and protected areas systems.
This will be realized by operationable policies and
legislation and the Natura 2000 management plans.
3.2. To build capacity for the
planning, establishment and
management of protected areas
.
By 2010, comprehensive capacity-building programmes and initiatives are
implemented to develop knowledge and skills at individual, community and
institutional levels, and raise professional standards
Realized.
3.3. To develop, apply and
transfer appropriate
technologies for protected areas.
By 2010 the development, validation, and transfer of appropriate
technologies and innovative approaches for the effective management of
protected areas is substantially improved, taking into account decisions of
the Conference of the Parties on technology transfer and cooperation.
Realized. Further development and innovation is
pursued.
3.4. To ensure financial
sustainability of protected areas
and national and regional
systems of protected areas.
By 2008, sufficient financial, technical and other resources to meet the
costs to effectively implement and manage national and regional systems
of protected areas are secured, including both from national and
international sources, particularly to support the needs of developing
countries and countries with economies in transition and small island
developing States.
For the Natura 2000 Network this is expected to be
realized in 2013.
3.5. To strengthen
communication, education and
public awareness.
By 2008 public awareness, understanding and appreciation of the
importance and benefits of protected areas is significantly increased
77
Goals Target Progress
4.1. To develop and adopt
minimum standards and best
practices for national and
regional protected area systems.
By 2008, standards, criteria, and best practices for planning, selecting,
establishing, managing and governance of national and regional systems
of protected areas are developed and adopted.
Standards and criteria are developed and adopted.
4.2. To evaluate and improve
the effectiveness of protected
areas management.
By 2010, frameworks for monitoring, evaluating and reporting protected
areas management effectiveness at sites, national and regional systems,
and transboundary protected area levels adopted and implemented by
Parties
Monitoring systems, as basis for evaluation and
reporting, on national level are realized. Monitoring of
the effectiveness of site management is in development
and expected to be operational in 2013.
4.3. To assess and monitor
protected area status and
trends.
By 2010, national and regional systems are established to enable effective
monitoring of protected-area coverage, status and trends at national,
regional and global scales, and to assist in evaluating progress in meeting
global biodiversity targets
Monitoring systems on national level are realized.
Monitoring of the effectiveness of site management is in
development and expected to be operational in 2013.
4.4 To ensure that scientific
knowledge contributes to the
establishment and effectiveness
of protected areas and protected
area systems.
Scientific knowledge relevant to protected areas is further developed as a
contribution to their establishment, effectiveness, and management