76

EDITORIAL
Dear Readers,The good news is over. Coal India Ltd (CIL), the world’s biggest coal mining company, has successfully listed its shares, amid much frenzy. Now it’s time to look at the issues at hand, again.
The Indian coal sector is facing multiple challenges, all related to one another. Increasing production is the overall objective, but how to achieve the same throws up a number of issues starting from environmental hurdles to inadequate logistics and transport facility to illegal mining. One related shortcoming is technological inadequacy. Conveyor belts industry comes within the ambit of technology and logistics and represents the relative shortcomings in both these segments.
Although the conveyor belts industry is here for quite some time now, there was hardly any development till a few years back. Even today the industry is largely scattered. Most of the players are in the unorganised sector with small capacities and production volumes. The cost competitiveness of these small players is on the lower side. Little wonder then, the Chinese threat is looming large, just like in other mining equipment manufacturing segments.
Along with this, domestic prices of rubber, a major raw material, continue to be highly volatile. From around `95 per kg in April 2009, prices have surged to the level of `200 per kg in late 2010. This is largely due to the high concentration of rubber cultivation in Kerala. The industry needs to hedge against such prevailing risks. A major positive however is the escalating growth in the power and mining sectors, especially coal production. The domestic conveyor belt manufacturers must ride on this wave, organically and through acquisitions.
Meanwhile, the shortcomings in logistics and transport prove to be the major constraints for increasing coal production in the country. Coal India is simply too worried to produce more in the absence of adequate number of rakes. It is high time an alternate route, say waterways, was developed, or arrangements were made to sort it out. India cannot afford to sacrifice growth for mismanagement, not any more.
Among the latest developments is a rise in higher-grade coal prices announced by CIL. For now, the rise will be restricted to higher grades to be charged from select users. A combination of factors has made the rise unavoidable. In fact, this could be followed by a subsequent general price rise in 2011 also.
With demand from Asian countries on the rise, prices of international coal have also surged. Just to give an indication, for the 10 months ended October 2010, total imports by Asian countries from South Africa exceeded 36.04 mt, about a 13 percent increase over 31.79 mt posted till September. No wonder then that international prices have soared.
In this issue of Coal Insights, we have once again tried to give you a holistic overview of the global as well as the domestic coal markets. The times are exciting as well as tough, and there is a lot of action in the market as all players are on their toes.
Happy reading.
Warm RegardsRakesh DubeyChief Editor
Chief EditorRakesh Dubey, Tel: +91 91633 48159, Email: [email protected]
Editorial BoardAlok Srivastava, General Manager, MMTC LtdAmitabh Panda, Group Director (Shipping & Logistics Operations), Tata Steel GroupAnirudha Gupta, Director, P&H JoyMining Equipment India LtdAshok Jain, Managing Director, Saumya Mining LtdDeepak Bhattacharyya, Head – coaljunction, mjunction services ltdGanesan Natarajan, WT Director, President & CEO, Ennore Coke LtdLawrence Metzroth, Vice President – Analysis & Strategy, Arch Coal IncM K Palanivel, President – All India Bulk, Samsara GroupS N Choubey, Asst. Vice President – CPC, UltraTech Cement LtdSandeep Kumar, Managing Director, S & T Mining Co Pvt LtdShyam Sundar Beriwala, Chairman, Shyam Steel Industries LtdSuresh Thawani, Managing Director, Tata Sponge Iron Ltd
AdvertisingSoumitra Bose, Tel: +91 92310 00232, Email: [email protected] Saigal, Tel: +91 91633 48078, Email: [email protected] Jalan, Tel: +91 92310 65739, Email: [email protected]
SubscriptionAnustup Lahiri, Tel: +91 91633 48013, Email: [email protected]
DesignDebal Ray, Ishawer Kumar Sriwastva, Sobhan Jas
For suggestions, feedback and queries, please write [email protected]
Copyright: All rights reserved. No part of Coal Insights can be reproduced or copied in any form or by any means without the prior permission of mjunction services limited. Please inform us if any copyright has been inadvertently infringed.
Disclaimer: This document is for information purpose only. Certain information herein has been acquired from various external sources believed to be reliable. While we have taken reasonable care to compile this report, we in no way assume any responsibility for any error or discrepancy in regards to information contained herein. Readers are requested to make appropriate judgment without any prejudice or compulsion.
Registered Officemjunction services limited, Tata Centre, 43 J L Nehru Rd, Kolkata 700 071
Website: www.mjunction.in
Corporate Head Quarters: Godrej Waterside, 3rd Floor, Tower 1, Plot V, Block DP, Sector V, Salt Lake, Kolkata 700091, Tel: +91 33 6610 6100, Fax: +91 33 6610 6187 Bokaro: Room 19, Old Admin Bldg., Bokaro Steel Plant, Bokaro 827001, Tel/Fax: +91 654 2226132 Jamshedpur: Armoury Rd, Bistupur, Jamshedpur 831001, Tel: +91 6576519985/86/90/91, Tele/Fax: +91 657 2424432 Durgapur: Room 618, Ispat Bhavan, Durgapur Steel Plant, Durgapur 713203, Tel: +91 343 6510185, Tele/Fax: +91 343 2586946 Rourkela: Administrative Bldg., Room 624, 6th Floor, Rourkela Steel Plant, Rourkela 769011, Tel: +91 661 6514142, Fax: +91 661 2513072 Mumbai: Jolly Bhavan II, 403, 4th Floor, 7 New Marine Lines, opp. Nirmala Niketan Home Science College, Mumbai 400002, Tel: +91 22 66510662 Delhi: C127, 2nd Floor, Rex House, Naraina Industrial Area, Phase I, New Delhi 110028, Tel: +91 11 25896900/25897000/65661774, Tele/Fax: +91 11 25896100 Bhilai: Room 321, 3rd Floor, Ispat Bhavan, Bhilai Steel Plant, Bhilai 490001, Tel: +91 788 6451066, Tele/Fax: +91 7882227 136 Chennai: 2nd Floor, Begum Ishpani Complex, Old 44 (New 91) Armenian St, Chennai 600 001, Tel: +91 44 42167417, Tele/Fax: +91 44 42051417
mjunction believes that all junctionites, customers, suppliers, partners, etc should practice the highest ethical standards in their daily operations.
Report a concern to [email protected]
COAL INSIGHTS 4 NOvember 2010
CORPORATE UPDATE 47 Monnet Ispat posts 2% rise in net
profit in Q2 47 Power Grid shares to start trading
from Nov 26 48 CIL third most powerful company in
India 49 Adani bags coal block development
rights in Orissa 50 High voltage transformer from
Crompton Greaves 51 ONGC ranked world’s top oil
company
LOGISTICS
52 Freight rates tend to fluctuate 54 Iron ore traffic declines 14.49%
POWER SECTOR UPDATE 55 Power cuts in industries in Oct 2010
E-AUCTION DATA 66 CIL’s e-auction m-o-m coal sales
rise marginally
PORT DATA 74 Coal import data
COnTEnTs
29 IWAI aims to win away coal cargo from Railways
31 MoEF seeks coal quality data 32 IMME brings global mining industry
to Indian shores 33 Coal miners saved during gas leak
at SCCL 33 India to face manpower crunch in
mining sector 35 Afghanistan to open up its mining sector 36 NTPC ranked no. 1 Asian power
producer 37 India misses Oct power generation
target
GOvERNmENT 39 Draft Regulatory Bill to be finalised
soon: Coal Secy 40 OTC power prices higher in October 40 States seek to keep coal out of GST
net
INTERNATIONAL 41 Australia may extend mineral tax net 42 EIA 2010 US coal consumption and
production outlook falls 43 India, US to set up joint green
research centre 44 German mining tools import to be up
15%
EXPERT SPEAK 45 Large diameter boring machines:
Need of the hour?
6 Conveyor belt industry poised to grow 15%
8 Conveyor belts: An essential logistics device
12 Indian conveyor belt makers on expansion binge
16 Oriental Rubber firmly on expansion track
COAL mARKET FUNDAmENTALS 20 Global thermal coal prices shoot up 22 Coking coal prices on the decline
FEATURE 24 CIL may hike prices in 2011 26 CIL bids for Colombian coal asset 27 PCI coal imports from SA likely to
rise 28 Focus on Orissa as India’s power hub
COvER STORY
COAL INSIGHTS 5 NOvember 2010
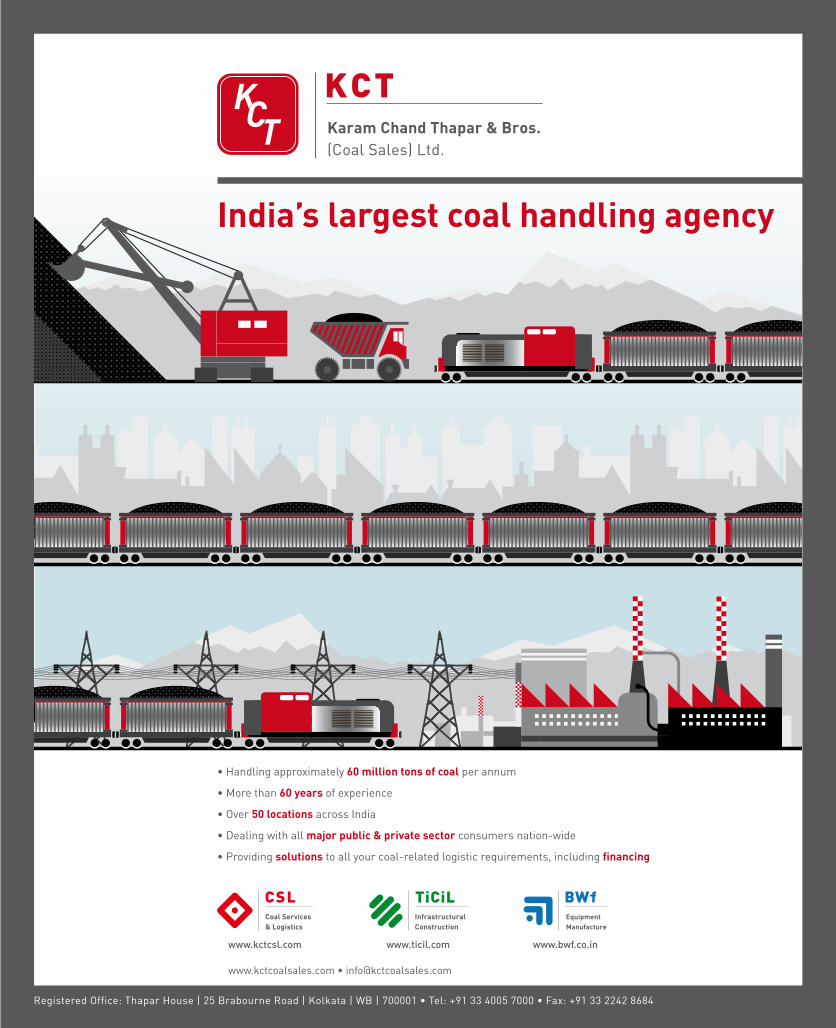
India’s largest coal handling agency
• Handling approximately 60 million tons of coal per annum
• More than 60 years of experience
• Over 50 locations across India
• Dealing with all major public & private sector consumers nation-wide
• Providing solutions to all your coal-related logistic requirements, including financing
www.kctcoalsales.com • [email protected]
Registered Office: Thapar House | 25 Brabourne Road | Kolkata | WB | 700001 • Tel: +91 33 4005 7000 • Fax: +91 33 2242 8684

COAL INSIGHTS 6 NOvember 2010
COvER sTORy
The Indian conveyor belt industry is poised to achieve a high annual growth of 15 percent over the next few years, thanks to the increased mechanisation in the Indian
coal and mineral mining sectors. The `1000-crore industry is largely fragmented, with only six to seven organised players ruling the roost.
However, as the industry grows in size and volume, it may witness some structural changes going forward, as per industry experts.
In the past couple of years, the need for faster movement
of mining output along with increased production has necessitated the adoption of advanced logistics solutions. As the stress on faster transportation has gained more importance, the conveyor belt industry in India has continued to grow from its low base. In the past few years, almost every other conveyor belt manufacturer has doubled capacity.
In fact, some of the conveyor belts manufacturers have taken a step further from just manufacturing conveyor belts to becoming a complete solutions provider. Oriental Rubber,
Conveyor belt industry poised to grow by 15%
Coal Insights Bureau
Conveyor belt industry poised to grow by15%

COAL INSIGHTS 8 NOvember 2010
COvER sTORy
A conveyor belt is a mechanical apparatus consisting of a continuous moving belt that transports materials from one place to another. The device,
which has become essential equipment for the global mining industry, was first conceived in the 19th century. In 1901, Sandvik invented and started production of steel conveyor belts. Four years later, Richard Sutcliffe produced the first conveyor belts for use in coal mines. Over the years, rapid technological advancement has resulted in extensive specialisation and customisation of this important logistics device.
The belt forms a continuous loop which is supported either on rollers (for heavy loads) or on a metal slider pan (if loads are light enough to prevent frictional drag on the belt). Motors operating through constant or variable-speed reduction gears usually provide the power. A conveyor belt consists of two or more pulleys, with a continuous loop of material that rotates about them. This loop is actually the conveyor belt. Belt conveyors can be of various sorts namely fabric, rubber, plastic, leather or metal, and are driven by a power-operated roll mounted underneath or at one end of the conveyor.
As per the varied industrial requirements, there are broadly three different types of conveyor belts:
♦ Basic belt ♦ Snake sandwich belt ♦ Long belt
A basic belt conveyor consists of two or more pulleys which hold one continuous length of material. These types of belts can be motorised or require manual effort. As the belt moves forward, all the items on the belt are carried forward. This type of device is
commonly used in packaging or parcel delivery services, which require quick relocation of materials from one place to another with minimal human intervention. The belt is typically installed at waist height to improve the ergonomics for the staff that are interacting with the materials.
The structure generally consists of a metal frame with rollers installed at various intervals along the length of the belt. The belt is typically a smooth, rubber material that covers the rollers. As the belt moves over the rollers, the items placed on the belt are transferred with low friction due to the use of multiple rollers.
The snake sandwich conveyor consists of two separate conveyor belts, set up parallel to each other holding the product in place while moving along the belt. This type of belt is used for moving items up steep inclines, up to 90 degrees. It was first introduced in 1979 and was mainly designed for moving rocks and other materials out of a mine. The system was designed to make use of widely
available hardware and used simple principles to ensure that it was easy to repair. The system is able to move a high volume of materials at a consistent rate. Smooth surfaced belts allow the conveyor belts to be cleaned automatically with the use of belt scrapers and plows. The design is flexible enough to allow the materials redirected off the conveyor belt at any point through simple redirection.
The last and final one, the long belt conveyor is a system of three drive units used to move materials over a long distance. The most important feature
of this system is the ability of the rollers to handle both horizontal and vertical curves. The long belt conveyor system can reach up to 13.8 km (8.57 miles) in length. This type of conveyor belt is often used in mining operations to transport materials to remote construction or building site locations, such as the bottom of a mining pit.
Conveyor belts: An essential logistics device Coal Insights Bureau
a leading manufacturer, has launched a strong conveyor maintenance product programme along with offering a wide array of products. The company, a top official said, aims to provide a “one stop shop” for rubber related mining products. According to industry sources, this trend could become more
prominent in the coming years due to increased competition from domestic as well as overseas vendors, especially from China.
Another significant change this industry is undergoing is the change in customer focus to cost competitiveness. According

COAL INSIGHTS 10 NOvember 2010
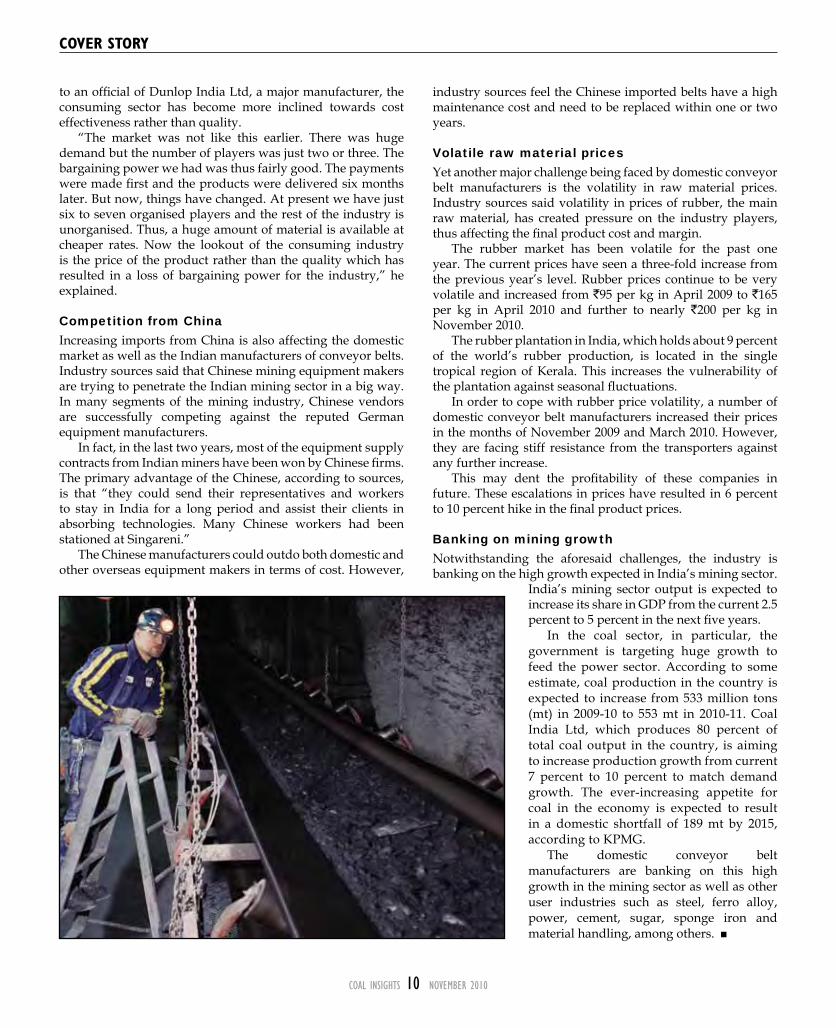
to an official of Dunlop India Ltd, a major manufacturer, the consuming sector has become more inclined towards cost effectiveness rather than quality.
“The market was not like this earlier. There was huge demand but the number of players was just two or three. The bargaining power we had was thus fairly good. The payments were made first and the products were delivered six months later. But now, things have changed. At present we have just six to seven organised players and the rest of the industry is unorganised. Thus, a huge amount of material is available at cheaper rates. Now the lookout of the consuming industry is the price of the product rather than the quality which has resulted in a loss of bargaining power for the industry,” he explained.
Competition from ChinaIncreasing imports from China is also affecting the domestic market as well as the Indian manufacturers of conveyor belts. Industry sources said that Chinese mining equipment makers are trying to penetrate the Indian mining sector in a big way. In many segments of the mining industry, Chinese vendors are successfully competing against the reputed German equipment manufacturers.
In fact, in the last two years, most of the equipment supply contracts from Indian miners have been won by Chinese firms. The primary advantage of the Chinese, according to sources, is that “they could send their representatives and workers to stay in India for a long period and assist their clients in absorbing technologies. Many Chinese workers had been stationed at Singareni.”
The Chinese manufacturers could outdo both domestic and other overseas equipment makers in terms of cost. However,
industry sources feel the Chinese imported belts have a high maintenance cost and need to be replaced within one or two years.
Volatile raw material pricesYet another major challenge being faced by domestic conveyor belt manufacturers is the volatility in raw material prices. Industry sources said volatility in prices of rubber, the main raw material, has created pressure on the industry players, thus affecting the final product cost and margin.
The rubber market has been volatile for the past one year. The current prices have seen a three-fold increase from the previous year’s level. Rubber prices continue to be very volatile and increased from `95 per kg in April 2009 to `165 per kg in April 2010 and further to nearly `200 per kg in November 2010.
The rubber plantation in India, which holds about 9 percent of the world’s rubber production, is located in the single tropical region of Kerala. This increases the vulnerability of the plantation against seasonal fluctuations.
In order to cope with rubber price volatility, a number of domestic conveyor belt manufacturers increased their prices in the months of November 2009 and March 2010. However, they are facing stiff resistance from the transporters against any further increase.
This may dent the profitability of these companies in future. These escalations in prices have resulted in 6 percent to 10 percent hike in the final product prices.
Banking on mining growthNotwithstanding the aforesaid challenges, the industry is banking on the high growth expected in India’s mining sector.
India’s mining sector output is expected to increase its share in GDP from the current 2.5 percent to 5 percent in the next five years.
In the coal sector, in particular, the government is targeting huge growth to feed the power sector. According to some estimate, coal production in the country is expected to increase from 533 million tons (mt) in 2009-10 to 553 mt in 2010-11. Coal India Ltd, which produces 80 percent of total coal output in the country, is aiming to increase production growth from current 7 percent to 10 percent to match demand growth. The ever-increasing appetite for coal in the economy is expected to result in a domestic shortfall of 189 mt by 2015, according to KPMG.
The domestic conveyor belt manufacturers are banking on this high growth in the mining sector as well as other user industries such as steel, ferro alloy, power, cement, sugar, sponge iron and material handling, among others.
COvER sTORy

www.minepro.com
Customer-Inspired ValueIn 80-Cubic-Meter Class
Valuable inputs from world-class dragline operations provided the
foundation for the innovative, productive and reliable
P&H® 9020 walking dragline.
From tub to boom point, you will find breakthrough solutions
applied to help make this overburden prime mover one of the world’s outstanding machines for high performance coal mining operations – along with valuable service support provided by our
P&H MinePro Services India team. P&H and P&H MinePro Services are trademarks of Joy Global Inc. or one of its affiliates. ©2009 P&H Mining Equipment Inc. All rights reserved.
P&H MinePro Services - IndiaMining Centre85/1, Topsia Road (South)Kolkata, India 700046Phone: (91) 33 23022300 Fax: (91) 33 23022333
Coal Insights_May09.indd 1 05/19/2009 7:36:30 AM

COAL INSIGHTS 12 NOvember 2010
COvER sTORy
Buoyed by the dramatic growth in user segments, especially power, steel and mining, the Indian conveyor belt manufacturers are planning to go on an expansion
binge to meet the growing demand. The high rate of growth can be gauged from the fact that the size of the industry has grown multifold in the last five years. Almost all the manufacturers, both major players and small scale manufacturers in the unorganised sector, are mulling to expand capacity.
Some of the companies embarking on expansion plans include Dunlop India Ltd, Oriental Rubber, International Conveyors Ltd and others. While some of them are planning to add capacity, other are looking to foray into new geographies.
Dunlop India, one of the major players in Indian conveyor belt industry, is struggling to meet the growing demand with
its limited capacity. The company has a unit at Sahaganj, West Bengal. The company has an installed capacity of 2,44,000 metres of textile and steel cord belting, 14,32,000 metres of transmission belting and 1,42,000 metres of PVC belting.
The unit has a capacity which is much lower than the requirement, and therefore outsources some of its manufacturing. According to a company official, the requirement is manufactured by other smaller manufacturers under the name of Dunlop. “As there is good demand in the market and our current capacity is less, we outsource a part of our production. Thus we also have some expansion plans,” he explained.
Currently, the company is catering to the requirements of industries like cement, steel and power plants and SMEs, among others. The company has a wide range of product including rubber belts, temperature belts and fireproof belts, among others.
Although the company is optimistic of a positive growth, it is witnessing some major hurdles at present.
The company at present buys rubber from the open market. “Of the total cost of production, rubber accounts for 90 percent while the rest is fabric. The availability is not a problem, but the price volatility causes an issue in the current market situation,” he noted.
Dunlop is doing some in-house research to optimise rubber
consumption with other products. Another raw material is fabric which at present is imported by the company.
Another domestic firm having major expansion plans is Devcon Systems & Projects Pvt. Ltd. Devcon is one of the leading manufacturers and exporters of bulk material handling equipment and other conveying systems. The company is almost tripling its production capacity to meet increased demand.
The company is setting up a new unit, which is almost three times the capacity of the existing unit. The land has been acquired and the company is optimistic about wrapping up the project in the next 18 months, a company official said. Once the unit is in place, the company will manufacture spares in the older unit while the new unit will manufacture the conveyor equipment, he added. The project is at its initial stage.
The company intends to shape up as a complete solutions provider. The company’s range of conveyors belts and other products are widely used in various industrial applications in sectors such as the steel, ferro alloy, sugar and mining industries, thermal power plants, sponge iron, iron ore, material handling and coal handling plants.
According to an estimate, the power sector accounts for 30 percent of the total production, while the ferro alloys industry accounts for 40 percent and rest of the industries 30 percent. The company generally meets the requirement of 2000 metres (22x50 metres) per year.
The company manufactured the coal handling plant for conventional and FBC boiler on turnkey basis with civil design. In addition to this, the company is also involved in
projects like iron ore crushing, screening and conveying plant, ash handling plant with storage bunker, stone crushing, screening and conveying plant, all on a turnkey basis.
For the sugarcane, molasses and sugar handling plant, the company manufactures on a customised basis and it is the same for the paper and pulp handling plant as well as cement handling plants. For coke briquetting plants, the company works on a turnkey basis. The company also works for ferro alloys plants for its raw material storage, weighing, batching and handling system, for feeding system of sponge iron plants and any type of bulk raw material handling and storage plants.
Indian conveyor belt makers on expansion binge
Arusha Das

COAL INSIGHTS 14 NOvember 2010
COvER sTORy
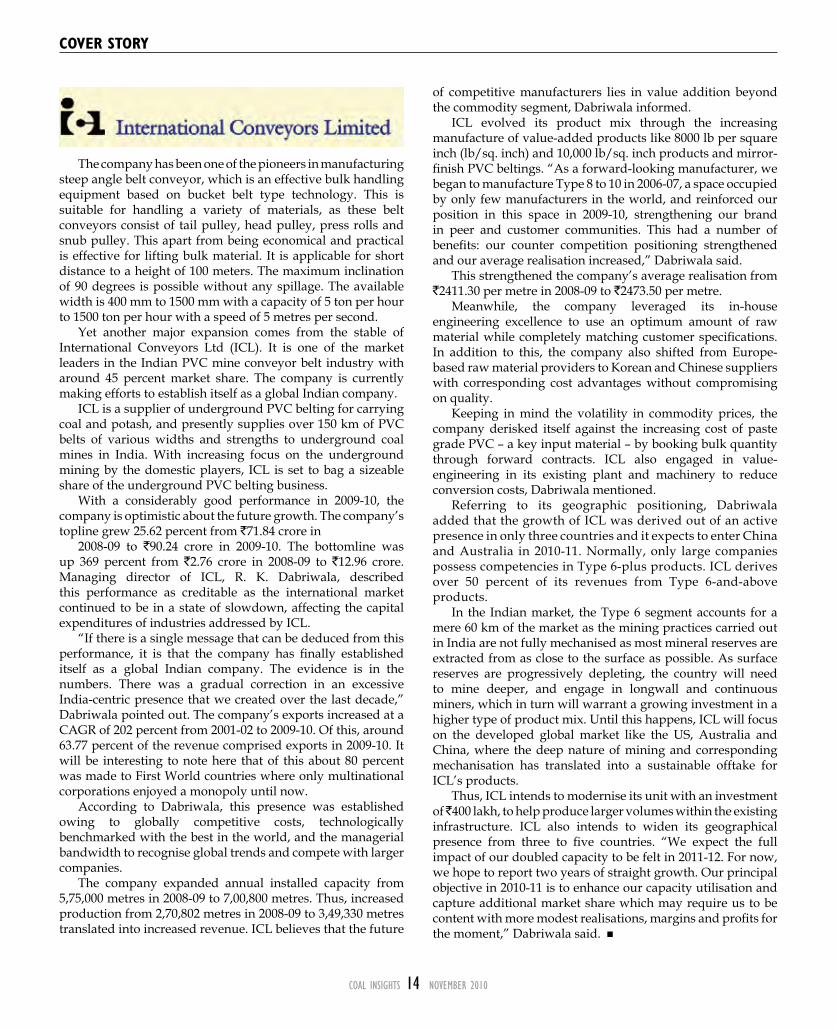
The company has been one of the pioneers in manufacturing steep angle belt conveyor, which is an effective bulk handling equipment based on bucket belt type technology. This is suitable for handling a variety of materials, as these belt conveyors consist of tail pulley, head pulley, press rolls and snub pulley. This apart from being economical and practical is effective for lifting bulk material. It is applicable for short distance to a height of 100 meters. The maximum inclination of 90 degrees is possible without any spillage. The available width is 400 mm to 1500 mm with a capacity of 5 ton per hour to 1500 ton per hour with a speed of 5 metres per second.
Yet another major expansion comes from the stable of International Conveyors Ltd (ICL). It is one of the market leaders in the Indian PVC mine conveyor belt industry with around 45 percent market share. The company is currently making efforts to establish itself as a global Indian company.
ICL is a supplier of underground PVC belting for carrying coal and potash, and presently supplies over 150 km of PVC belts of various widths and strengths to underground coal mines in India. With increasing focus on the underground mining by the domestic players, ICL is set to bag a sizeable share of the underground PVC belting business.
With a considerably good performance in 2009-10, the company is optimistic about the future growth. The company’s topline grew 25.62 percent from `71.84 crore in
2008-09 to `90.24 crore in 2009-10. The bottomline was up 369 percent from `2.76 crore in 2008-09 to `12.96 crore. Managing director of ICL, R. K. Dabriwala, described this performance as creditable as the international market continued to be in a state of slowdown, affecting the capital expenditures of industries addressed by ICL.
“If there is a single message that can be deduced from this performance, it is that the company has finally established itself as a global Indian company. The evidence is in the numbers. There was a gradual correction in an excessive India-centric presence that we created over the last decade,” Dabriwala pointed out. The company’s exports increased at a CAGR of 202 percent from 2001-02 to 2009-10. Of this, around 63.77 percent of the revenue comprised exports in 2009-10. It will be interesting to note here that of this about 80 percent was made to First World countries where only multinational corporations enjoyed a monopoly until now.
According to Dabriwala, this presence was established owing to globally competitive costs, technologically benchmarked with the best in the world, and the managerial bandwidth to recognise global trends and compete with larger companies.
The company expanded annual installed capacity from 5,75,000 metres in 2008-09 to 7,00,800 metres. Thus, increased production from 2,70,802 metres in 2008-09 to 3,49,330 metres translated into increased revenue. ICL believes that the future
of competitive manufacturers lies in value addition beyond the commodity segment, Dabriwala informed.
ICL evolved its product mix through the increasing manufacture of value-added products like 8000 lb per square inch (lb/sq. inch) and 10,000 lb/sq. inch products and mirror-finish PVC beltings. “As a forward-looking manufacturer, we began to manufacture Type 8 to 10 in 2006-07, a space occupied by only few manufacturers in the world, and reinforced our position in this space in 2009-10, strengthening our brand in peer and customer communities. This had a number of benefits: our counter competition positioning strengthened and our average realisation increased,” Dabriwala said.
This strengthened the company’s average realisation from `2411.30 per metre in 2008-09 to `2473.50 per metre.
Meanwhile, the company leveraged its in-house engineering excellence to use an optimum amount of raw material while completely matching customer specifications. In addition to this, the company also shifted from Europe-based raw material providers to Korean and Chinese suppliers with corresponding cost advantages without compromising on quality.
Keeping in mind the volatility in commodity prices, the company derisked itself against the increasing cost of paste grade PVC – a key input material – by booking bulk quantity through forward contracts. ICL also engaged in value-engineering in its existing plant and machinery to reduce conversion costs, Dabriwala mentioned.
Referring to its geographic positioning, Dabriwala added that the growth of ICL was derived out of an active presence in only three countries and it expects to enter China and Australia in 2010-11. Normally, only large companies possess competencies in Type 6-plus products. ICL derives over 50 percent of its revenues from Type 6-and-above products.
In the Indian market, the Type 6 segment accounts for a mere 60 km of the market as the mining practices carried out in India are not fully mechanised as most mineral reserves are extracted from as close to the surface as possible. As surface reserves are progressively depleting, the country will need to mine deeper, and engage in longwall and continuous miners, which in turn will warrant a growing investment in a higher type of product mix. Until this happens, ICL will focus on the developed global market like the US, Australia and China, where the deep nature of mining and corresponding mechanisation has translated into a sustainable offtake for ICL’s products.
Thus, ICL intends to modernise its unit with an investment of ̀ 400 lakh, to help produce larger volumes within the existing infrastructure. ICL also intends to widen its geographical presence from three to five countries. “We expect the full impact of our doubled capacity to be felt in 2011-12. For now, we hope to report two years of straight growth. Our principal objective in 2010-11 is to enhance our capacity utilisation and capture additional market share which may require us to be content with more modest realisations, margins and profits for the moment,” Dabriwala said.
COAL INSIGHTS 16 NOvember 2010
COvER sTORy
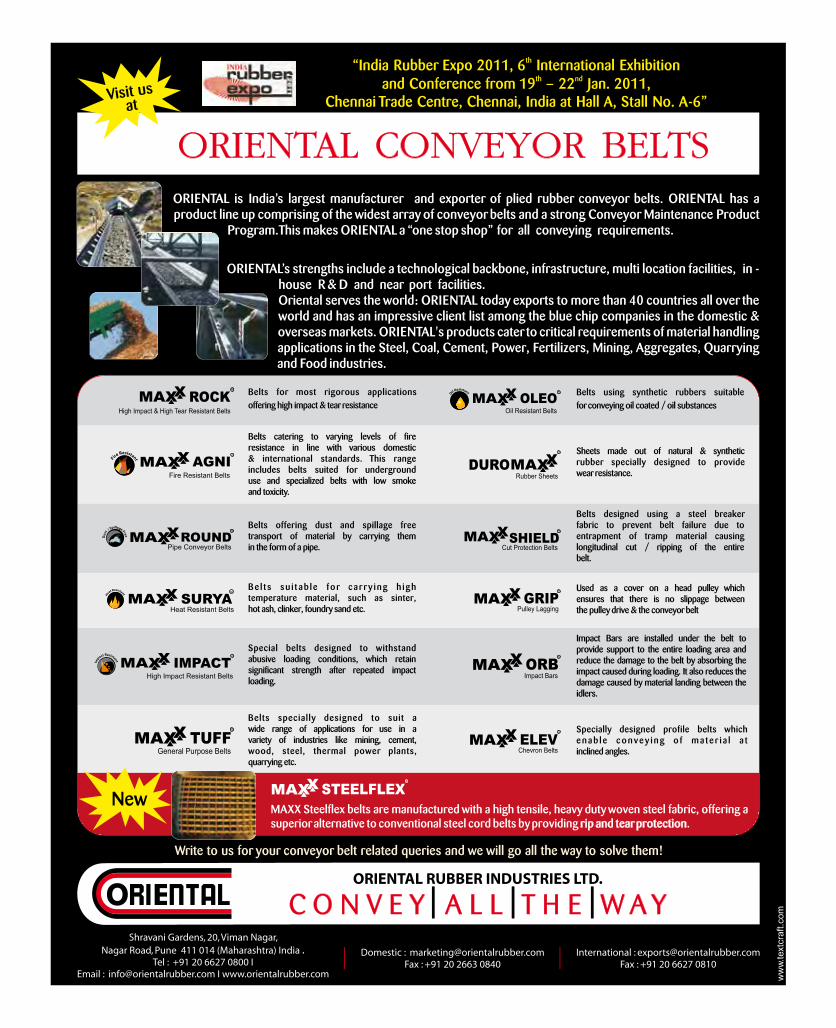
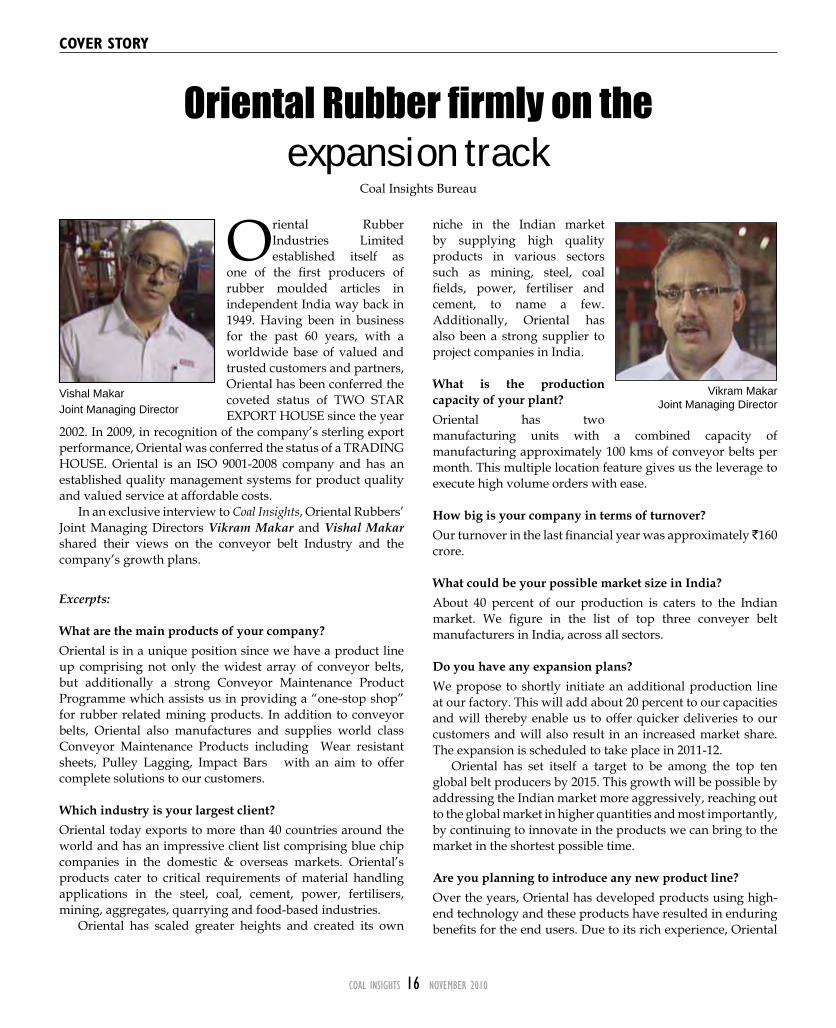
Oriental Rubber Industries Limited established itself as
one of the first producers of rubber moulded articles in independent India way back in 1949. Having been in business for the past 60 years, with a worldwide base of valued and trusted customers and partners, Oriental has been conferred the coveted status of TWO STAR EXPORT HOUSE since the year
2002. In 2009, in recognition of the company’s sterling export performance, Oriental was conferred the status of a TRADING HOUSE. Oriental is an ISO 9001-2008 company and has an established quality management systems for product quality and valued service at affordable costs.
In an exclusive interview to Coal Insights, Oriental Rubbers’ Joint Managing Directors Vikram Makar and Vishal Makar shared their views on the conveyor belt Industry and the company’s growth plans.
Excerpts:
What are the main products of your company? Oriental is in a unique position since we have a product line up comprising not only the widest array of conveyor belts, but additionally a strong Conveyor Maintenance Product Programme which assists us in providing a “one-stop shop” for rubber related mining products. In addition to conveyor belts, Oriental also manufactures and supplies world class Conveyor Maintenance Products including Wear resistant sheets, Pulley Lagging, Impact Bars with an aim to offer complete solutions to our customers.
Which industry is your largest client? Oriental today exports to more than 40 countries around the world and has an impressive client list comprising blue chip companies in the domestic & overseas markets. Oriental’s products cater to critical requirements of material handling applications in the steel, coal, cement, power, fertilisers, mining, aggregates, quarrying and food-based industries.
Oriental has scaled greater heights and created its own
niche in the Indian market by supplying high quality products in various sectors such as mining, steel, coal fields, power, fertiliser and cement, to name a few. Additionally, Oriental has also been a strong supplier to project companies in India.
What is the production capacity of your plant? Oriental has two manufacturing units with a combined capacity of manufacturing approximately 100 kms of conveyor belts per month. This multiple location feature gives us the leverage to execute high volume orders with ease.
How big is your company in terms of turnover? Our turnover in the last financial year was approximately ̀ 160 crore.
What could be your possible market size in India? About 40 percent of our production is caters to the Indian market. We figure in the list of top three conveyer belt manufacturers in India, across all sectors.
Do you have any expansion plans?We propose to shortly initiate an additional production line at our factory. This will add about 20 percent to our capacities and will thereby enable us to offer quicker deliveries to our customers and will also result in an increased market share. The expansion is scheduled to take place in 2011-12.
Oriental has set itself a target to be among the top ten global belt producers by 2015. This growth will be possible by addressing the Indian market more aggressively, reaching out to the global market in higher quantities and most importantly, by continuing to innovate in the products we can bring to the market in the shortest possible time.
Are you planning to introduce any new product line? Over the years, Oriental has developed products using high-end technology and these products have resulted in enduring benefits for the end users. Due to its rich experience, Oriental
Oriental Rubber firmly on theexpansion track
Coal Insights Bureau
Vikram MakarJoint Managing Director
Vishal MakarJoint Managing Director


COAL INSIGHTS 18 NOvember 2010
COvER sTORy
has established several landmarks in product development to provide enhanced productivity, longer belt life and to minimise downtime in specific applications. Oriental has a
full fledged R&D Laboratory where new products are developed and stringent tests & checks are carried out as per international standards. Oriental believes in constant innovation and was the first Indian company to manufacture Synthetic Fibre Reinforced Conveyor belts in India in the year 1978. This has been consistently topped up by several other achievements, since then. Just recently, Oriental introduced its MAXX STEELFLEX Belt, which offers not only greater impact resistance but also offers rip protection, in steel cord belt applications.
Do you have interest in any other areas? Oriental is responsible for offering world class fasteners, belt cleaners and other allied belt maintenance products from
Flexco, USA, to customers in India, through its subsidiary, Quadrant Trades Pvt. Ltd.

COAL INSIGHTS 20 NOvember 2010
COAL mARkET funDAmEnTALs
Global thermal coal prices are on fire once again. Strong demand from the Asian markets, primarily China, along with growing supply side concerns in the two
major thermal coal producing countries, namely Indonesia and Australia, has pulled up global thermal coal prices to near year-high levels over the last one month.
Chinese demand for thermal coal has been very high as the country, which incidentally is the world’s largest consumer of coal, is stocking up ahead of an expected chilly winter in January, when demand for electricity is expected to climb. Besides, the demand for coal from the country also shot up with China hosting the Asian Games.
The demand is likely to be further bolstered ahead of the winter months with utilities planning to increase stocks for winter. But traders informed that so far, not many deals have been concluded due to constrained supply, as the Chinese stay wary of paying high prices.
There were rumours that Chinese buyers were buying in the spot market. This helped global thermal coal prices, including South African thermal coal, gain some significant support.
Price of thermal coal has been affected due to supply side constraints as well. On the supply side, there have been production losses due to rains in Indonesia which have led to tightening of supplies in the region.
As per reports, many producers have informed that they have fallen back by as much as 5 to 10 percent short of their production targets. In addition to this, rains in Queensland
have also hit Australian coal production in the past few months, although this has not significantly affected the thermal coal market.
However, market insiders are of the opinion that an intense cyclonic season this year is likely to hit thermal coal mining as well and tighten supply significantly.
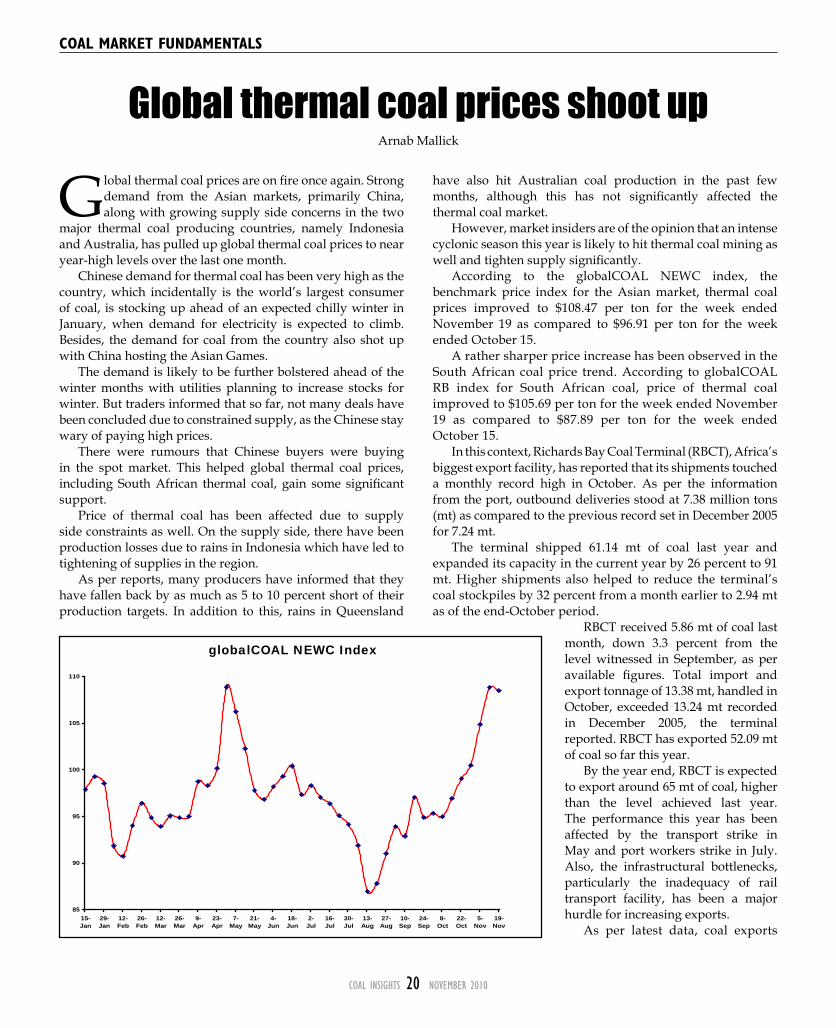
According to the globalCOAL NEWC index, the benchmark price index for the Asian market, thermal coal prices improved to $108.47 per ton for the week ended November 19 as compared to $96.91 per ton for the week ended October 15.
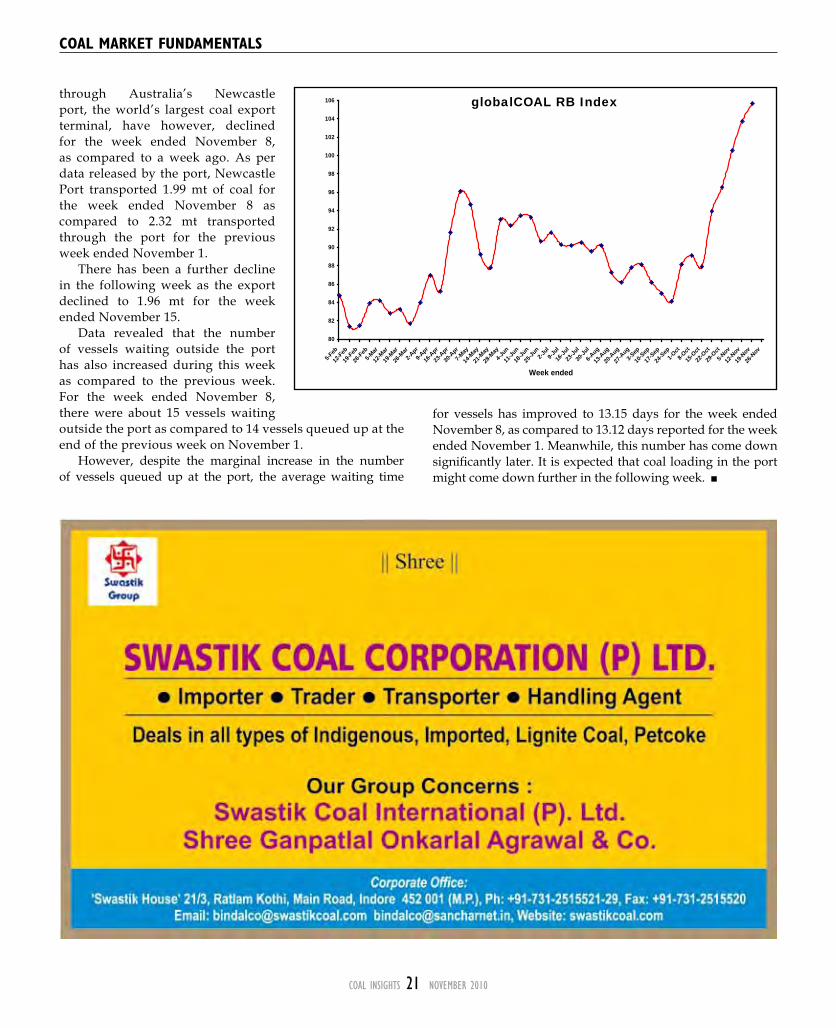
A rather sharper price increase has been observed in the South African coal price trend. According to globalCOAL RB index for South African coal, price of thermal coal improved to $105.69 per ton for the week ended November 19 as compared to $87.89 per ton for the week ended October 15.
In this context, Richards Bay Coal Terminal (RBCT), Africa’s biggest export facility, has reported that its shipments touched a monthly record high in October. As per the information from the port, outbound deliveries stood at 7.38 million tons (mt) as compared to the previous record set in December 2005 for 7.24 mt.
The terminal shipped 61.14 mt of coal last year and expanded its capacity in the current year by 26 percent to 91 mt. Higher shipments also helped to reduce the terminal’s coal stockpiles by 32 percent from a month earlier to 2.94 mt as of the end-October period.
RBCT received 5.86 mt of coal last month, down 3.3 percent from the level witnessed in September, as per available figures. Total import and export tonnage of 13.38 mt, handled in October, exceeded 13.24 mt recorded in December 2005, the terminal reported. RBCT has exported 52.09 mt of coal so far this year.
By the year end, RBCT is expected to export around 65 mt of coal, higher than the level achieved last year. The performance this year has been affected by the transport strike in May and port workers strike in July. Also, the infrastructural bottlenecks, particularly the inadequacy of rail transport facility, has been a major hurdle for increasing exports.
As per latest data, coal exports
Global thermal coal prices shoot upArnab Mallick
85
90
95
100
105
110
15-Jan
29-Jan
12-Feb
26-Feb
12-Mar
26-Mar
9-Apr
23-Apr
7-May
21-May
4-Jun
18-Jun
2-Jul
16-Jul
30-Jul
13-Aug
27-Aug
10-Sep
24-Sep
8-Oct
22-Oct
5-Nov
19-Nov
globalCOAL NEWC Index
COAL INSIGHTS 21 NOvember 2010
through Australia’s Newcastle port, the world’s largest coal export terminal, have however, declined for the week ended November 8, as compared to a week ago. As per data released by the port, Newcastle Port transported 1.99 mt of coal for the week ended November 8 as compared to 2.32 mt transported through the port for the previous week ended November 1.
There has been a further decline in the following week as the export declined to 1.96 mt for the week ended November 15.
Data revealed that the number of vessels waiting outside the port has also increased during this week as compared to the previous week. For the week ended November 8, there were about 15 vessels waiting outside the port as compared to 14 vessels queued up at the end of the previous week on November 1.
However, despite the marginal increase in the number of vessels queued up at the port, the average waiting time
for vessels has improved to 13.15 days for the week ended November 8, as compared to 13.12 days reported for the week ended November 1. Meanwhile, this number has come down significantly later. It is expected that coal loading in the port might come down further in the following week.
COAL mARkET funDAmEnTALs
80
82
84
86
88
90
92
94
96
98
100
102
104
106
5-Feb
12-Feb
19-Feb
26-Feb
5-Mar
12-M
ar
19-M
ar
26-M
ar2-A
pr9-A
pr
16-A
pr
23-A
pr
30-A
pr
7-May
14-M
ay
21-M
ay
28-M
ay4-J
un
11-Ju
n
18-Ju
n
25-Ju
n2-J
ul9-J
ul
16-Ju
l
23-Ju
l
30-Ju
l
6-Aug
13-A
ug
20-A
ug
27-A
ug3-S
ep
10-S
ep
17-S
ep
24-S
ep1-O
ct8-O
ct
15-O
ct
22-O
ct
29-O
ct
5-Nov
12-N
ov
19-N
ov
26-N
ov
Week ended
globalCOAL RB Index

COAL INSIGHTS 22 NOvember 2010
Metallurgical coal prices with the blast furnace (BF) steel producers for the third quarter of the fiscal year 2010 (October-December) have been
finalised for all types, reflecting worldwide loose supply position. It has been for the first time since the turn of the fiscal year 2010 that prices for metallurgical coal have been reduced.
As mentioned earlier in Coal Insights, out of these, for hard coking coal, the negotiations between the BF steel producers and BHP Billiton Mitsubishi Alliance (BMA) ended in agreement on August 30.
The prices of main brands of hard coking coal exported by BMA in the third quarter became $209 per ton fob each for Peak Downs and Saraji coal, $205 per ton fob each for Goonyella coal and Riverside coal, $195 per ton fob for Norwich Park coal and $190 per ton fob for Gregory coal with price reduction of $16 to $20 per ton for every brand from the second quarter (July-September).
At the same time at the end of August, low volatile (LV) PCI coal of Russian origin was set at $130 per ton fob with the reduction of $40 per ton (22.5 percent) from the previous quarter.
Furthermore, from end August through early September, the prices of LV PCI coal produced in Queensland Australia, have been settled one after another.
The market sources said that LV PCI coal for the third quarter became $147 to $150 per ton fob, down $30 to $33 per ton (16.7-18.3 percent) from the level witnessed in the previous quarter.
On the other hand, for semi-soft coking coal, negotiations with several independent suppliers ended in agreement and with these suppliers, the prices for semi-soft coking coal loaded at Newcastle were settled at $138 to $140 per ton fob, down $32-$34 per ton (18.6-19.8 percent) from the previous quarter.
In contrast, the negotiations with the two largest suppliers of semi-soft coking coal, Xstrata and Rio Tinto, took longer time and the agreement on semi-soft coking coal exported by these suppliers could not be reached within September.
In mid-October, however, at long last, the price of semi-soft coking coal loaded at Newcastle by Rio Tinto was fixed. The price of semi-soft coking coal for the third quarter became $143 per ton fob. This represented a decrease of $29 per ton (around 16.9 percent) from the level reported in the previous quarter.
As a result, semi-soft coking coal price of Rio Tinto became higher by $3-$5 per ton as compared with those of the
independent suppliers. The price negotiations with the blast furnace steel producers on Hongay anthracite of Vietnamese origin for the third quarter of the fiscal year 2010 (October-December) was heard of having been completed during the last week of October.
The contract price for the third quarter of Hongay no.6
Coke under pressureThings have been getting a bit tough for coke makers across the world and surely India as, on one hand, prices of steel are failing to cheer up the market whereas on the other, relatively higher coking coal prices are putting tremendous pressure on margins.
Meanwhile, it has been learnt from media sources that Eastern China’s Shandong Coking & Chemical Industry Association (SCCIA) lifted its coke reference price and was calling on coke producers to keep their output at 30 percent of capacity. According to available reports, the SCCIA issued a notice on October 31 and raised its reference price for first grade coke to RMB 1950 per ton ($293 per ton) from September’s reference price of RMB 1850 per ton. The reference price for second grade coke also increased by RMB 100 per ton to RMB 1850 per ton.
Experts are, however, of the opinion that coke exports from China are likely to remain low in the foreseeable future and with 40 percent export tax, prices are likely to remain comparatively high.
At the same time, supply reduction in China will hopefully keep prices firm. According to market sources, Chinese coal coke market has been remaining firm as coal coke production has been continuously reducing and the upward movement of the coal coke market is due to the increase of metallurgical coal price with the commencement of the winter season, resulting in soaring demand for heating. Demand in metallurgical coke in the Chinese market did not turn upward.
Influenced by this movement, export price has been increasing. The offer price for export of metallurgical coal coke (with ash content of 12.5 percent) seems to increase to around $450 per ton fob with export tax of 40 percent included during the beginning of the month.
COAL mARkET funDAmEnTALs
Coking coal prices on the declineArnab Mallick

COAL INSIGHTS 23 NOvember 2010
COAL mARkET funDAmEnTALs
coal for PCI operation was set at $150 per ton or so, while that of the Hongay no.8 coal for sintering was set at $143 per ton fob or so, with price reductions of $30 per ton (plus about 17 percent) for no.6 coal and $27 per ton plus (about 16 percent) from the first six months of the fiscal year 2010 (April-September).
In the meantime, spot price of hard coking coal has been trading in line with Q3 contracted price. As per available information, spot price of prime hard coking coal has been hovering at around $205-$210 per ton fob Australia around November 8 on back of weak demand from the steel makers.
Things have been slightly better and the prices gained around $5 per ton fob Australia in the following week.
This was significantly lower than the recent high level of
$222-$225 per ton fob during the last trading days of October, as per data available with Coal Insights.
Similar movement was seen in semi-soft coking coal price which has been quoting at around $180-$190 per ton fob around November 8 as compared to $192-$205 per ton fob during October end.
A section of analysts are of the opinion that steel prices in China, which have been largely influenced by its monetary policy, will significantly impact the price trend of crucial steelmaking raw materials. These include coking coal and coke.
In the meantime, moving in line with its typical seasonal trend, domestic coking coal prices
in China’s Shanxi province are expected to get steady support as mill and coke plants have slowly started re-stocking ahead of the winter holidays.
COAL INSIGHTS 24 NOvember 2010
fEATuRE
After a year-long gap, coal prices in India are on the rise. Days after the successful float of its initial public offering, Coal India Ltd (CIL) announced a rise in the
prices of higher grade coal to be charged from select users. This increase would bring parity with import prices of Indonesian coal, and perhaps help restrict the demand for those grades in the domestic market. For other grades too, the tremendous appetite for coal in the economy is sure to lead to an increase in prices, sometime next year.
Along with demand growth, the revision of wages and CIL’s plan to increase the share of washery grade coal in total despatch would put pressure on its margins, thus necessitating an increase in prices.
Yet another major factor would be the introduction of the provision for profit sharing by coal companies with project-affected communities. The distribution of 26 percent of profits earned from new projects to the local populace will be compelling enough for CIL to seek a price revision.
Coal minister Sriprakash Jaiswal has hinted just as much, and CIL sources indicated that a price increase could precede or follow the retirement of chairman, P.S. Bhattacharyya, scheduled for early 2011. In such a scenario, the recent surge in international coal prices might look tempting enough to force an early decision.
Import parity price In late October, CIL decided to charge import parity price for supplying higher grade (Grade A and B) coal from specific consumers with immediate effect.
Industry sources said they have received a communication in this respect from Western Coalfields Ltd (WCL). The communication from WCL stated that the board of its parent company, CIL, has directed all the subsidiaries to supply Grade A and B coal to specified consumers under the MoU at a special price.
This special price would be determined on import parity basis in respect of coal imported from Indonesia as per the methodology suggested by the coal ministry. The special price will be reset and re-fixed every six months based on the latest price of imported coal from Indonesia.
The coal ministry has further directed to sell high quality non-coking coal at export parity price as determined by import price at the nearest port minus 15 percent.
To start with, the revised price will be in effect for some cement sector consumers of Western Coalfields Ltd (WCL), a subsidiary of CIL. These cement companies have been
directed to execute MoU with WCL for supply of Grade B coal at this special rate. These consumers have further been directed to send their responses to the proposal within a fortnight.
However, if these companies decline the offer, this coal will be offered to other consumers having requirement for the same. The revision in prices is likely to impact sponge iron and cement manufacturers in particular, the sources said.
A price revision in 2011?CIL is also likely to increase the prices of various grades of coal from April-May of 2011, Coal Secretary C. Balakrishnan said. “CIL may have to increase prices after revision of wages of its workers sometime in February-March 2011. Once that (wage revision) is done, it may pitch for upward revision in coal prices in April-May. The chairman has already given indications about this,” he said.
Balakrishnan, however, did not elaborate on the likely range of the increase. CIL had last revised prices by around 10 percent on an average in October 2009, after a two-year gap.
Meanwhile, Jaiswal has cited the profit-sharing proposal under the Mines and Mineral (Development and Regulation) Amendment Bill as a trigger for a possible price increase.
“There may be a price rise,” he said, but insisted that the ministry will go ahead with the proposal anyway. The draft bill, which proposes that mining companies must share 26 percent of profit or 10 percent of royalty, whichever is higher, with the displaced people, is likely to come into force soon.
The CIL chairman, however, has cited yet another ground – increased share of washed coal - for an increase in coal prices in India, though on a longer term.
“We have already started work on setting up 20 washeries with a combined capacity to wash 111.3 million tons of coal and all these washeries will be in place by 2017. In addition, we are setting up linked washeries for all the existing and upcoming projects with annually capacity of 2 mtpa,” Bhattacharyya said.
He further said the increased supply of washed coal will enable the company to charge a premium over and above the notified price of ROM coal and that will immensely benefit the company’s bottomline.
“If quality coal is offered to consumers, we have to sell it at a premium, but certainly at a discount over imported coal
CIL may hike prices in 2011Coal Insights Bureau
COAL INSIGHTS 25 NOvember 2010
fEATuRE
price so that the cost of generation of power remains low,” he said.
Surge in international pricesMeanwhile, coal prices across South Africa, Australia and other places continued to surge in November on the back of higher demand from Asian countries, traders said.
The price of AP1 grade South African coal was quoted at about $102.50 per ton on November 11, up $1.65 compared with $100.85 quoted on November 10. In Australia, the prices surged by around $1.75 per ton to $108.00 from $106.25 per ton on November 10.
Firmness was also seen in Indonesian and Columbian markets, traders said, but exact details were not available.
Though details of thermal coal export from Australia to Asian countries is not available, the data available with ICMW suggests that South Africa’s coal export to Asian countries surged 28 percent month-on-month in October.
The total export to Asian countries form RBCT in October rose to 4.25 million tons (mt) from 3.32 mt in September. For the 10 months ended October 2010, total imports by Asian countries exceeded 36.04 mt, about a 13 percent increase over 31.79 mt posted till September.
The spurt in international coal prices, particularly of South African origin, has forced a large number of Indian consumers, especially those in the cement sector, to go slow on finalising deals for imported thermal coal, an industry source said.
“Not only have prices become slightly unattractive at over $100 per ton fob for South African coal, for a majority of Indian consumers, higher stocks with stock-in-trade dealers is also leading to lower enquiries from Indian suppliers,” the source said.
“There had been a moderate increase in import of thermal coal by a number of traders in the last two months. They had stocked the material and are now looking at opportunities to sell at higher price after the recent jump in international prices. However, most of the consumers have not yet made up their minds to make purchases at over $100 per ton fob and they are awaiting prices to soften before making any commitment,” said a consumer.
“Very few deals have been struck by Indian buyers for South African coal in recent times,” he added.
Coal prices started rising sharply from middle of October backed by huge demand from China and according to forecast by leading brokerage/analyst firms, are likely to go up further by 15 percent in 2011.

COAL INSIGHTS 26 NOvember 2010
fEATuRE
Coal India Limited (CIL) has bid for participatory stake in a thermal coal producing asset in Colombia. CIL is learnt to have placed a bid for Colombian assets of
US based Drummond Co. as the PSU looks to buyout mines overseas as part of its `6000 crore global acquisition plans.
CIL chairman, P.S. Bhattacharyya, commented on the event, saying that, “We have bid for participatory stake in an asset in Colombia. In our estimation, the price is on the higher side. CIL would be interested in picking up stake in the asset to gain access to high calorific value equity coal to be sold in India. We are not interested in mere trading of coal abroad. We are interested to market this coal at a competitive price in India to meet the country's energy needs.”
He added that “accordingly, we have to strike an equilibrium between the price of the asset versus the heat value of the coal so as to justify the high freight cost. In the final analysis, the landed cost of the equity coat should be cheaper than the existing import options, to justify acquisition of interest abroad.”
According to the company, if the heat value of the coal exceeds 6500 kcal, it would compensate the high freight cost from Colombia against the 5000 kcal thermal coal imported from Indonesia.
With recoverable coal reserves of about 7.4 billion short tons, Colombia accounts for about 1.1 percent of the world’s total annual coal production. The country is the largest producer in Latin America and accounted for around 76 million tons (mt) of coal in 2009.
Among the coal exporting countries, Colombia ranks fifth, after Indonesia, Australia, South Africa and Russia. According to official data, the country exported 72 mt of coal last year.
The production and export of coal in Colombia is estimated to touch 83 mt and 80 mt, respectively, this year, as per reports. Unlike some of the largest coal exporters, the Colombian coalfields are yet to reach the maturity stage.
The financial crisis in North America and Europe, the conventional buyers of Colombian thermal coal, led to a quest for untapped markets and a concurrent growth in coal demand from China and India made the search easy.
In case of Asia, the transportation time and high freight costs of carrying coal from Colombia were thought to be outweighing the advantages of quality or low production costs. This outlook, however, underwent a change under economic compulsions last year.
Colombia, which did not export coal to Asia till 2009, started tapping the growing demand from Asian markets from the start of the current year. In the first half of 2010, Colombia’s coal exports to Asia touched 5.8 million tons (mt). Total exports this year is expected to reach 9 mt to 10 mt. Of the total exports in the first half, 2 mt was exported to China, 1.8 mt to Korea and the remaining part to Japan, Thailand, Taiwan and India.
The first ever shipment of Colombian coal (about 1,40,000 tons) to India occurred in the second quarter of 2010. The consignment was brought by Adani Enterprises and was supplied by Coal Marketing Company (CMC) Ltd.
CIL has also received offers from one private and another public sector entity respectively, to join them in developing coal assets in Australia. P.S. Bhattacharyya confirmed that one of these offers came from Adani group which had recently struck a AUS$2.9 billion (approximately ` 13,000 crore) deal with Australia’s Link Energy to acquire coal assets.
“Recently, we have received another offer from an Indian public sector undertaking to participate with them in developing coal assets in Australia,” Bhattacharyya said.
Given India’s bulging import requirements and price variations in global coal market, Indian consumers will have to increasingly look at other destinations like Australia, Russia, Colombia and as far as the US, to meet their requirements of imported thermal coal.
CIL bids for Colombian coal assetCoal Insights Bureau

COAL INSIGHTS 27 NOvember 2010
fEATuRE
PCI coal imports from SA likely to riseCoal Insights Bureau
Indian steel makers may procure larger amounts of South African Pulverised Coal Injection (PCI) coal because of a freight advantage compared to Australia, as per an official
of a leading steel making company. That Indian companies are importing limited quantity of PCI coal from South Africa could be ascertained from the fact that out of the total of around 11 million tons (mt) of coking coal imported by Steel Authority of India Ltd (SAIL), only around 0.5 mt was from South Africa.
After a 13.72 percent increase in September, India’s coal imports from Richards Bay Coal Terminal (RBCT) of South Africa was up once again by 15.57 percent to 2.165 mt in October, compared to 1.873 mt recorded a month ago. India’s share in South Africa’s total coal exports was 29 percent for the month of October 2010. India’s total coal imports from South Africa between January and October 2010 stood at 17.325 mt, which was 14 percent higher than 15.160 mt posted till September 2010. Imports during April-October of financial year 2010-11 stood at 12.649 mt, which was 10.14 percent higher than 11.485 mt imported during the same period of 2009-10.
This year, Asia is expected to become South Africa’s primary
coal export destination, with some analysts estimating that up to 75 percent of the country’s product will go east with enquiries from India far more than the first quarter. Almost all steel makers in India are now setting up Cold Dust Induction (CDI) plants to reduce consumption of coke and keep production cost of steel low. PCI coal import by Indian companies is thus likely to see a sharp increase. Only 1 ton of PCI coal is required in place of 1 ton of coke in the blast furnace and that significantly reduces the cost of production of steel and is prompting more and more steel plants to set up CDI plants.
Again, India is a price rather than quality-driven market. End-users are likely to switch to South African from Australian PCI coal also largely because the delivered cost of South African coal might offer a saving of several dollars per ton. South African exports have been affected in 2009 due to rail transport limitations, but are likely to rise this year. With the improvement in performance of rail firm, Transnet, at least one South African coal mining major expects that coal exports through Richards Bay Coal Terminal (RBCT) will exceed 65 mt in 2011.
The Indian companies who had recently picked up stakes or signed coal lifting agreements with South African coal miners are facing difficulties in bringing the material to India because of problems associated with transportation of coal from mines to RBCT. A lack of infrastructure and capacity at India’s ports could also hamper the delivery of imported coal, with an estimated 55 percent of coal imports to be handled by minor ports with low draft and poor cargo offloading facilities.

COAL INSIGHTS 28 NOvember 2010
fEATuRE
Orissa, a state which has 70 billion tons of coal reserves, as much as 26 percent of India’s total
reserves of 270 billion tons, can be India’s upcoming power hub if it follows a multi-pronged strategy. The mineable reserves out of this 70 billion tons may be 50 billion tons due to availability at shallow depth, and the reserves are slated to last for more
than 100 years. Faster forest and environment clearances, faster land
acquisition with good compensation package, faster infrastructure development, faster training and skill development for employability and a sound corporate social responsibility (CSR) package are some of the strategies that would be crucial to turning Orissa into the country’s power hub.
According to the vice-president of Aryan Ispat and Power Pvt Ltd and former executive director of Coal India, J.P. Panda, Orissa’s coal reserves can be mined at a cost of only `200 per ton against Coal India’s notified price of nearly `500 per ton. Coal is the country’s main source of energy, constituting nearly 53 percent of the present generation, and will continue to be so for at least another 30 years, Panda said.
He informed that the present power requirement of the country is 900 billion units and the country is producing only 770 billion units, leading to a shortage of approximately 120 billion units. As projected by the Integrated Energy policy of the government of India, the country’s requirement of power by 2012 will be 220 GW, which will go up to 425 GW by 2022 and 778 GW by 2032.
The National Electricity Policy aims for a per capita availability of 1000 units, installed capacity of 2,00,000 MW, minimum lifeline consumption of 1 unit per household per day and inter regional transmission capacity of 37,000 MW
The aim notwithstanding, Panda feels India is headed for an impending power famine. With 9 percent GDP growth, the power requirement will grow exponentially and India will face power famine in a few years from now unless it takes multiple measures to produce the required quantity of coal and power, Panda feels. The impending disaster is acute shortage of coal and hence power in this country.
A KPMG report said that: “India may face a coal shortfall of 189 mt a year by 2015, about 50 percent of the power sector’s expected demand, leading to a two to three-fold increase in imports.” Thus, in spite of such huge reserves, India will be forced to import coal at abnormally high costs.
Panda said that reports put Orissa’s investment in the
power sector at ̀ 74,000 crore, which is the highest in India and he feels the state is well placed to meet the demand provided a well thought out policy is in place.
The bottlenecksAccording to Panda, nearly 210 blocks worth 50 billion tons have been allotted for captive mining so far, out of which only 26 have started production and have produced only 30 million tons (mt) against a target of 100 mt. Unfortunately, however, not a single private sector mine has started production in Orissa and the primary reasons for this delay is inordinate delay in land acquisition as well as environment and forestry clearances. The time taken for such clearances in Orissa is more than double compared to other states, Panda feels.
This is in spite of the fact that Orissa is privileged to have all the reserves within quarriable limit. The reserves also have a favourable coal and overburden ratio of 1:1 up to a depth of 200 metres.
If land acquisition in Chhattisgarh takes less than two years and less than one year in Gujarat, probably it is possible to do the same in Orissa also, only if the government wants to do it, Panda opined. He said just a simple cutting down on the red tape should make the process faster, and all officials concerned must be made accountable as it is a question of massive losses for the nation. If the demand for coal can be met from domestic supplies, the country can avoid importing it.
According to Coal India’s director technical N.C. Jha’s paper at Coal Summit 2010, the country proposes to import nearly 200 mt of coal by 2015-16 at `1,30,000 crore, Panda rued. The present import figure is 67 mt, and that costs the country nearly `43,000 crore. Coal India produces 432 mt at
Focus on Orissa as India’s power hub Coal Insights Bureau
Delays in land acquisition in Orissa
Time taken for the various activities in the state :
♦ Application to IPICOL 6 weeks ♦ Scrutiny of documents at IDCO 10 weeks ♦ Administrative approval by mininstry 36 weeks ♦ Scrutiny of documents by collector 10 weeks ♦ Collector to RDC 10 weeks ♦ Section 4(1) notification 18 weeks ♦ Section 5,6,7,8,9,10,11,12 & 13 60 weeks ♦ Physical possession 24 weeks ♦ Total 174 weeks
J P Panda

COAL INSIGHTS 29 NOvember 2010
fEATuRE
an expenditure of `53,000 crore. This means that if the country had invested about `43,000 crore on indigenous coal mining, the production could have been nearly 400 mt, which would be more than double the present production.
The way outPanda feels it is unfortunate that while we are willing to spend so much on imports, we are not willing to pay the land losers even a fraction of that money. In fact, we can even spend a fraction of that money to develop coal mines. He suggests that a massive afforestation drive can also be an answer to concerns regarding ecological imbalances caused due to mining. If mining destroys, say, 100 sq km of forest, we can create new forests of 200 sq km. He said that some coal companies like NCL, SECL, MCL, SCCL and Neyveli Lignite have done an admirable job in afforestation. In NCL, not only has the environment improved, rainfall has increased from 32 inches per year to nearly 50 inches.
Panda feels that economic activity should not be stalled in the name of environment protection and if needed, investments should be made on clean coal technologies.
He also feels that forest clearances should not be delayed. Rather, forests should be created from part of the same money collected from the project proponents. A large amount of money deposited by project proponents for compensatory afforestation is lying unused by the Ministry of Environment and Forests (MoEF) and that should be used to create more forest cover.
The role of the state govt According to Panda, it is almost impossible to procure land without the state government’s cooperation. It is essential to fix responsibility for the delays – the state government and central government officers, bureaucrats and even the project proponents must be held responsible for the long delays in clearances.
In view of the impending disaster due to power shortage, the government must act fast, or it will be too late, Panda feels. Environment clearances must be granted fast with strict riders. Monitoring of environment parameters needs to be done and strict action needs to be taken against offenders. New forests must be added to the country’s green cover as a replacement for the forests that will be lost to mining. Infrastructure of rail and roads must be fast tracked, and otherwise the coal produced will not move. Non-clearance of projects because it is falling in the forest area should be discarded as a policy and the dynamic policy of fast compensatory afforestation must be taken up.
Panda suggests that land losers must be provided employment, and they must be trained on the required skills in advance. Self-employment must be encouraged, and they must be trained in entrepreneurship. A robust CSR policy, in a nutshell, should be the key to the problem.
IWAI aims to win away coal cargo from RailwaysArindam Bandyopadhyay
The acute shortage of rail wagons for carrying coal in India suddenly seems to bring hope for the perennially sick inland waterways sector. Inland Waterways Authority
of India (IWAI), the nodal agency for the development of the National Waterways (NW), is well aware of the increased stockpile at various coal mines and is planning big to attract this cargo. Given the huge potential of NWs as an alternate route, even a modest success in IWAI’s endeavour could lead to a win-win situation for Coal India Ltd (CIL), IAWI and the power utilities, which are the biggest consumers of coal in the country.
“We are aware of this opportunity, Indian Railway’s (IR) wagon shortage and the unmet requirements of power utilities. We are seriously looking at developing NWs as an alternate route for coal cargo,” a top official of IWAI told Coal Insights.
To start with, IWAI is targeting to develop NW1 – the Garga-Bhagirathi-Hoogly river system between Haldia (Sagar) and Allahabad. This 1620-km route, once complete with loading and unloading terminals and barge facilities, will ease the logistics problem faced by power utilities for transporting coal imported through Haldia port, the official said.
IWAI is holding talks with a number of power utilities, including NTPC, as well as port facility developers to kick-start a pilot project.
The only question mark over the success of this project is the how cost competitive the new route will be vis-à-vis railways and, more importantly, how soon the central agency can take those baby steps.
Haldia-Farakka route for NTPC plantsNTPC has been one of the first few companies to explore the alternate route via NW1 for carrying coal from Haldia to its power plants at Farakka, Kahalgaon and Barh in West Bengal. IWAI in discussion with the state-owned power generator has appointed IL&FS as consultant to study the viability of carrying coal via NW1.
According to sources, IL&FS is expected to float a final tender by March 2011 for developing coal berthing, loading and terminal facilities at Haldia and Farakka. This tender could be limited for 12 companies who had given Expressions of Interest (EoI) two months ago.
As per the arrangement, NTPC would take a call on whether to shift the entire coal requirements of Farakka unit to NW1 only after comparing the cost of transport via rail and waterways. The major constraint for carrying coal
COAL INSIGHTS 30 NOvember 2010
fEATuRE
from Haldia to Farakka is the shortage of rakes and port congestion.
Although intended for the 1600 MW Farakka unit of NTPC, these facilities, once set up, could also be used by other power plants for carrying coal via waterways, the sources said.
“This would help power plants procuring coal through Haldia to avoid the delay in transportation due to shortage of railway rakes,” a spokesman of Kolkata port said.
WBPDCL explores water routeAfter NTPC, West Bengal Power Development Corporation Ltd (WBPDCL) is also exploring the possibility of carrying coal for its Sagardighi power plant in Murshidabad from Haldia via the river Hooghly (NW1), sources said.
“One barge full of cargo will be sent from Haldia in November on a trial basis to see if carrying coal via NW1 will be cost competitive and less time consuming,” they said.
The 2 x 300 MW Sagardighi Super Thermal Power Plant had started commercial production in 2008. Currently, two more coal based units (2 x 250 MW) are being added by the company. According to IWAI officials, more and more number of power utilities would look for shifting their coal cargo from railways to waterways in future. If the cost factor is proved favourable, NWs may attract the raw material traffic for a number of power generators having units along the banks of the Hoogly.
The cost of transporting cargo via waterways will depend on the charges levied by berth developers and private agencies erecting the loading/unloading facilities. “These charges will be decided by the developers and be charged to the users of these facilities,” IWAI officials said, adding that IWAI will restrict its role to maintaining the navigability of the river.
CIL’s benefit from NWsAlthough CIL will not be a party to it, the state-owned coal
miner will greatly benefit from such projects. CIL is overtly concerned with the shortage of railway wagons and increasing stockpile at its mines. According to some estimates, pithead vendible closing stock at various mines of CIL may cross a staggering 70 million tons (mt) as on March 31, 2011.
“In comparison to last year, the stockpile at various mines is at a substantially higher level. At this rate, the closing stock may cross 70 mt by March 2011, compared to 63.3 mt in March 2010,” industry sources said.
As on the last day of September 2010, closing stock at various mines of CIL stood at 49.230 mt, against 37.90 mt reported for the last day of the same month last year. The primary reason for this increase in stock this year was the shortage of railway rakes, the sources said, adding: “This is further accentuating the problem of supply of coal in the country. If the problem persists, even increased imports
won’t help meet the growing demand.” Among the subsidiaries, Mahanadi Coalfields Ltd (MCL) had the highest closing stock of 16.988 mt as on September 30 (18.498 mt as on August 31) compared with 14.193 mt in the corresponding month of 2009.
However, over the last six months, the closing stock at various CIL mines has dropped steadily from 60.29 mt as on April 30 to 49.230 mt on September 30. This drop was caused mainly by increased availability of wagons during off season (for most other sectors, including agriculture) and lower production by the company.
Fuel supply agreementsConcerned with the increasing stockpile of coal at various mines, CIL is looking forward to signing fuel supply and transport agreement (FSTA) with its coal consumers, but is constrained by the lack of response from the Railways, CIL sources said.
“We are ready to sign FSTA with consumers having a minimum annual requirement, but cannot go forward in the absence of any response from the Railways. Signing FSTA will ensure faster dispatch and reduce inventory at mines,” the sources said.
The FSTA is a tripartite agreement between the coal supplier, transporter and consumer whereby any party failing to honour its commitment will have to pay compensation.
However, the proposal, which was in line with the new coal distribution policy (NCDP), has evinced little interest from the Railways as there is perennial shortage of rakes for transporting coal from pithead to the plants.
Earlier, the Railway’s ‘own your wagon’ scheme had also failed due to the Railway’s inability to ensure availability of rakes to the rake owners during requirement, industry sources said.
Major hurdles for NWsThe development of NWs, however worthwhile it may sound, is not without its share of hitches. The biggest hurdle is perhaps the slow execution of projects by IWAI. The agency had signed a MoU with NTPC on September 24, 2008 for transport of imported coal from Haldia to its thermal power plants. NTPC had assured of a cargo throughput of 2 to 3 mtpa of coal on sustained/regular basis and IWAI had to ensure availability of sufficient number of barges for transporting the same. Two years later, IWAI is still struggling with the planning and execution.
Another major hurdle may be a lack of significant cost savings for potential users. Also, the problem of stockpile at CIL mines could be mitigated by increasing the supply of washed coal, something that the company is seriously looking at. Once the proposed new washeries of CIL come up, “with same number of wagons, around 20 percent more coal can be supplied,” CIL sources said.
COAL INSIGHTS 31 NOvember 2010
fEATuRE
In yet another jolt to coal-based core sector projects, the Ministry of Environment and Forests (MoEF) has announced that it will hold up thermal power, steel and
sponge iron projects seeking environment and forest clearance till such time as they furnish coal quality data. In a recent notification, the ministry declared that such projects will be deferred until information about the source and quality of coal is provided.
“In order to assess the likely adverse environmental impacts of such projects, it is desirable to have information about quality of coal to be used. In the absence of correct data on the quality of coal, the quarrying capacity may be computed wrongly, which may have adverse impact on environment,” a statement issued by MoEF said. The ministry further said that it has come across a number of instances where substantial investments has been made even before the requisite environmental and forestry clearance about the coal blocks is obtained. This in turn leads to avoidable delay in completion of such projects and results in blockage of financial resources.
Therefore, “it has been decided that all such proposals relating to thermal power, steel, sponge iron which are pending with the ministry or state for consideration of environmental clearance shall be deferred and delisted till the status of environment and forestry clearance of the coal supply source for Indian coal or the memorandum of understanding for imported coal is furnished,” it said.
Henceforth, the ministry said, all infrastructure projects using coal as a raw material shall be considered only after the firm coal linkage is available and the status of environment and forestry clearance of the coal source is known.
Projects awaiting clearanceMeanwhile, there is a huge backlog of projects waiting for environmental and forest clearances from MoEF. As of November 16, 2010, 77 thermal power projects, 212 mining projects and 738 industrial projects were awaiting finalisation of the terms of reference (TOR), an essential step towards getting environmental approval. All of these project proposals were received after April 4, 2009, ministry data shows.
Among the thermal power projects (pending TOR), the maximum number of projects (13) are proposed to come up in Maharashtra. This number is followed by 10 projects each in Andhra Pradesh and Madhya Pradesh, six projects in Tamil Nadu, six projects in Jharkhand, five projects each in Rajasthan and Gujarat, four projects each in Bihar, Orissa and Chhattisgarh, two projects each in Assam, Punjab, Haryana and Uttar Pradesh, and one project each in West Bengal and Dadra & Nagar Haveli. Along with this, one thermal project, namely the 1980-MW coal based thermal power plant of Adani Power at Gondia, was awaiting forest clearance.
In the mining sector, 212 projects are awaiting TOR for environmental clearance. These include coal, lignite, iron ore, limestone, manganese ore, bauxite and minor minerals sand quarries, among others. Of these, 33 projects will be undertaken in Jharkhand, 15 in Orissa, 12 in Madhya Pradesh, 11 in Gujarat and eight in Chhattisgarh.
Additionally, 177 mining projects are in the pipeline for forest clearance. Of these, 32 are slated to come up in Jharkhand, 30 in Madhya Pradesh, 25 in Andhra Pradesh, 18 in Chhattisgarh, 15 in Orissa, 13 in Karnataka, and nine each in Rajasthan and Himachal Pradesh. One of the projects – a stone quarry at Hut Bay – will be undertaken in Andaman & Nicobar and will require diversion of 3.13 hectares of forest land.
For some of the projects, the ministry has either sought essential details from concerned state governments or is examining details furnished by them.
The industrial projects awaiting TOR include integrated steel plants, ferro alloy plants, clinker grinding units, induction furnace units, sponge iron units, POL terminals, ferro manganese and silico manganese projects, coal washeries and captive power units.
Coal linkage backlog Environment and forest clearance proves a major blockade for coal-based projects, but the slow pace of granting linkage by the coal ministry is no less a hurdle. As of September 2010, 1,267 applications were pending before the coal ministry, of which 774 are thermal power projects, 355 sponge iron units and 114 cement projects.
Among the 774 power projects, 92 applications are from State Electricity Boards (SEBs) and private generators, aggregating new capacity addition of over 132,000 MW. Given the sluggish pace of growth in captive mining and no-go norms imposed by MOEF, it is only natural that the long waiting period would lead to substantial time and cost overrun for these vital core sector projects. MoEF’s latest diktat will aggravate the situation further.
MoC’s stanceAccording to an estimate, a stage-I forest clearance for a coal mining project takes about four to four and half years at the state level and 1.9 years at the Central level – high by any standards.
This prolonged delay in getting forest clearances has put 154 projects of CIL at a standstill. Coal India Ltd (CIL) chairman P.S. Bhattacharyya, has recently urged the MoEF to consider issuing environmental clearance for projects coming up in “open forest” areas within a period of 300 days.
MoEF seeks coal quality dataArindam Bandyopadhyay

COAL INSIGHTS 32 NOvember 2010
fEATuRE
Altogether 230 companies from 22 countries took part in IMME 2010, the International Mining and Machinery Exhibition held in Kolkata during November 10 to 13,
making it the largest ever mining congress in Asia. The biennial event, which started off in 1984, held special significance this year in view of the sudden spurt in coal and minerals demand in the country and the environmental and logistics challenges facing domestic supplies.
Organised by the Confederation of Indian Industry (CII) in association with the ministry of mines, coal and steel and Coal India Ltd (CIL), the event saw the participation of 450 delegates from the mining, minerals and processing industries who came under one roof to share knowledge and forge business ties. IMME 2010 comprised a four-day exhibition at the Salt Lake stadium, a buyer-seller meet and a two-day global mining summit on November 10-11.
Partner country: AustraliaAustralia, the world’s largest coal exporter and a regular participant at the IMME since the beginning, was the partner country at IMME 2010, for the third time. Australia brought the largest ever mining delegation of government and industry to India at IMME 2010. Around 50 Australian companies put up the most modern technologies for the mining sector on display.
Speaking at a seminar organised on the occasion of IMME 2010, Peter Linford, senior trade and investment commissioner (south Asia) of Australian Trade Commission (Austrade) said Australian mineral industry’s export to India had crossed A$115 billion in 2009-10. Given the huge appetite of Indian industries for coal and other minerals and the expansion projects undertaken by Australian government to increase production, the export of minerals was likely to see substantial growth in coming years. Besides, the country could provide
sophisticated technology to the Indian mining sector, he said. With 11 offices across India, Austrade had the most
extensive network of any trade mission in India and better placed to help Indian companies invest in overseas mining blocks or increasing production from domestic reserves, Linford said.
Focus country: GermanyGermany, a major player in the field of mining equipment and technologies, was accorded the status of focus country at IMME 2010. Germany brought the largest ever delegation of 40 companies this year. Earlier, it had participated as partner country three times in the previous editions. German companies displayed a range of mining equipment and products at the exhibition.
Representatives of German mining machinery federation VDMA, present on the occasion, stressed on increasing the relationship with Indian mining companies to thwart the fierce competition from Chinese mining machinery manufacturers.
International presenceIMME 2010 attracted the largest ever overseas participation from 22 countries including Australia, South Africa, Canada, China, Czech Republic, Finland, France, Germany, Japan, Afghanistan, Ireland, Russia, UK and the US.
Products on display included large tippers (up to 50 ton capacity), alternators, automotive belts, backhoe loaders, blower motors, clamshells, compactors, crushers, conveyors, dragline, drilling machines, feeders, full range of mining construction equipment, heavy commercial vehicles, hydraulic components, industrial belts, instrumentation and analytical equipment, excavators and dumpers, among others.
Along with the exhibition, the two-day global mining summit saw the participation of around 300 delegates from India and abroad. Prominent international speakers from government and industry addressed the gathering, covering subjects ranging from India’s mining sector policy and regulatory imperatives for accelerating investments, environment and safety issues in mining and CSR, making Indian mining industry globally competitive, financing options and strategies for supporting large investments in India’s mining sector and business opportunities in India.
The four-day exhibition and conference was attended by around 25,000 visitors including architects, cement manufacturers, chamber of commerce representatives, construction material suppliers, consultants, contractors and builders, among others.
IMME 2010 brings global mining industryto Indian shores
Coal Insights Bureau
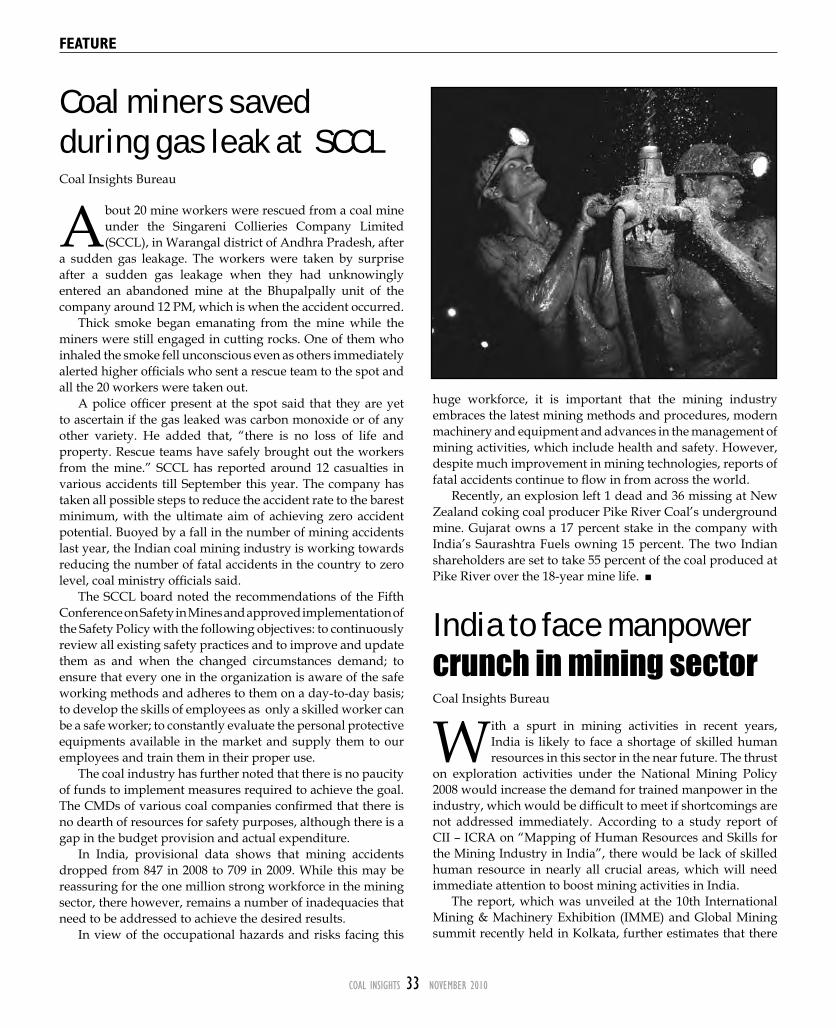
COAL INSIGHTS 33 NOvember 2010
fEATuRE
Coal miners saved during gas leak at SCCLCoal Insights Bureau
About 20 mine workers were rescued from a coal mine under the Singareni Collieries Company Limited (SCCL), in Warangal district of Andhra Pradesh, after
a sudden gas leakage. The workers were taken by surprise after a sudden gas leakage when they had unknowingly entered an abandoned mine at the Bhupalpally unit of the company around 12 PM, which is when the accident occurred.
Thick smoke began emanating from the mine while the miners were still engaged in cutting rocks. One of them who inhaled the smoke fell unconscious even as others immediately alerted higher officials who sent a rescue team to the spot and all the 20 workers were taken out.
A police officer present at the spot said that they are yet to ascertain if the gas leaked was carbon monoxide or of any other variety. He added that, “there is no loss of life and property. Rescue teams have safely brought out the workers from the mine.” SCCL has reported around 12 casualties in various accidents till September this year. The company has taken all possible steps to reduce the accident rate to the barest minimum, with the ultimate aim of achieving zero accident potential. Buoyed by a fall in the number of mining accidents last year, the Indian coal mining industry is working towards reducing the number of fatal accidents in the country to zero level, coal ministry officials said.
The SCCL board noted the recommendations of the Fifth Conference on Safety in Mines and approved implementation of the Safety Policy with the following objectives: to continuously review all existing safety practices and to improve and update them as and when the changed circumstances demand; to ensure that every one in the organization is aware of the safe working methods and adheres to them on a day-to-day basis; to develop the skills of employees as only a skilled worker can be a safe worker; to constantly evaluate the personal protective equipments available in the market and supply them to our employees and train them in their proper use.
The coal industry has further noted that there is no paucity of funds to implement measures required to achieve the goal. The CMDs of various coal companies confirmed that there is no dearth of resources for safety purposes, although there is a gap in the budget provision and actual expenditure.
In India, provisional data shows that mining accidents dropped from 847 in 2008 to 709 in 2009. While this may be reassuring for the one million strong workforce in the mining sector, there however, remains a number of inadequacies that need to be addressed to achieve the desired results.
In view of the occupational hazards and risks facing this
huge workforce, it is important that the mining industry embraces the latest mining methods and procedures, modern machinery and equipment and advances in the management of mining activities, which include health and safety. However, despite much improvement in mining technologies, reports of fatal accidents continue to flow in from across the world.
Recently, an explosion left 1 dead and 36 missing at New Zealand coking coal producer Pike River Coal’s underground mine. Gujarat owns a 17 percent stake in the company with India’s Saurashtra Fuels owning 15 percent. The two Indian shareholders are set to take 55 percent of the coal produced at Pike River over the 18-year mine life.
India to face manpower crunch in mining sector Coal Insights Bureau
With a spurt in mining activities in recent years, India is likely to face a shortage of skilled human resources in this sector in the near future. The thrust
on exploration activities under the National Mining Policy 2008 would increase the demand for trained manpower in the industry, which would be difficult to meet if shortcomings are not addressed immediately. According to a study report of CII – ICRA on “Mapping of Human Resources and Skills for the Mining Industry in India”, there would be lack of skilled human resource in nearly all crucial areas, which will need immediate attention to boost mining activities in India.
The report, which was unveiled at the 10th International Mining & Machinery Exhibition (IMME) and Global Mining summit recently held in Kolkata, further estimates that there
COAL INSIGHTS 34 NOvember 2010
fEATuRE
would be a supply gap of about 1500-2200 geoscientific personnel during the period 2009-17 and 2009-2025, respectively. In mining engineering category, the demand supply gap is likely to be around 3000 during 2009-17 and 8500 during the period 2009-25. Also, the present course curriculum is not appropriate for the industry and needs revision with focus on mine safety, environment and rock mechanics to address the requirements of the industry.
The major area of concern for the industry is lack of mineral specific professionals like lawyers, financial analysts, economists and so on. In such a situation, there is the immediate need to start courses in these areas to support the mining sector. The number of seats also need to be enhanced in the mining engineering and geosciences fields. To meet this shortage, courses related to areas such as geoinformatics, climate change and advance courses in remote sensing are required to cater the growing needs of the industry, the report says. It also projects the human resource requirements of the mining industry, maps the human resource skills available currently in the industry and identifies skill gaps along with suggesting measures to bridge the same.
According to the report, the current situation of the mining industry is not conducive for its growth because there is huge shortage of trained operators, such as blasters, short firers, drillers, heavy machine operators, surveyors and the like. Also, there is lack of infrastructure to train people at this level.
The study suggests that due to changes in technology and growing environmental concerns, the personnel already employed in the industry need to be trained in the areas such as safety, environment, health, and surveying, through short term refresher courses. There is also shortage of formal training system for candidates at the operator level. This could be addressed by introducing relevant courses in the existing ITI/ITC located close to mining centres.
The study proposes to synchronise the efforts of industry, government and educational institutions by setting up of industry skills centres on the line of “Mining Industry Skills Centres (MISC)” in Australia. Keeping in mind the structure of the Indian mining sector, where people move up the ranks from the lower level to the managerial level, it is important to optimise the existing talent pool within the organisation by providing them with training and various career development programmes.
The education system needs to be strengthened to meet these objectives. Regulatory processes need to be developed through DGBM/IBM to ensure that requisite quality is ensured and only persons with requisite diploma are employed with them. For the familiarisation of current practices and technological advancement in the industry, the trainer initiatives should be formalised.
If the recommendations of the study implemented by various stakeholders are implemented, the human resource needs will be met over the time horizon till 2025. CII believes the measures would contribute significantly in attaining the economic and growth potential of the Indian mining industry.
Since mining industry has contributed approximately 2.5 to 3 percent to the GDP over the last few years which is expected to increase by about 5 percent over the next few years, the recommendations are very crucial for the overall development of the country.
The mining industry in India is the largest employer and the sector is poised for rapid expansion. India produces as many as 86 minerals. The mineral production (excluding petroleum and natural gas) has increased from ̀ 53,713 crore in 2004-05 to `86,780 crore in 2008-09 at a CAGR of 12.7 percent.
Globally, India is the fifth largest player in terms of mineral production and has abundant reserves. The report indicates that at present around 9,00,000 persons (direct and outsourced) are employed only in the mining and exploration of coal alone.
COAL INSIGHTS 35 NOvember 2010
fEATuRE
With Afghanistan opening up its mining sector, the country is all set to float tenders to give exploitation licences of mineral resources worth $10 billion, a
major initiative to allow private sector companies to enter into the state-controlled mining sector.
The tenders for exploitation licences will be floated next year and that the last date of responding to the expression of interest already floated is January 13, 2011, informed the country’s minister of mines, Wahidullah Shahrani, who was in Kolkata recently to attend the International Mining & Machinery Exhibition (IMME) 2010, In fact, four leading Indian conglomerates – Essar, Ispat, Tatas and Vedanta – have also showed interest in participating in the country’s upcoming mineral mining projects in Afghanistan, Shahrani said.
Recent discoveries show that Afghanistan has huge reserves of minerals, estimated at about $3 trillion, within its geographic territory. He said: “This (estimate) is only for 30 percent of the territory. For the remaining 70 percent, we do not know what reserves are there.”
After inviting bids for the Hajigak iron ore project, the Afghan government is going to float global tenders for Aynak copper mine and Badakhshan gold mine in the coming months. Shahrani said bids will be invited for the northern part of the Aynak copper mine later this year. The remaining part of this mine had already been given to a Chinese company on contract three years ago.
Besides, the government will also float tenders for the Badakhshan gold mine, bordering Tajikistan, sometime next year, he said. The government is expecting around $2-4 billion investment in each of these two projects. Meanwhile, the submission of bids against the tender for Hajigak iron ore deposit, which was floated in late September, would be closed in January.
“We expect good response for this tender, given the huge deposit of iron ore the mine has. In fact, we have already been approached by a number of major mining companies from all over the world who showed their keen interest in participating in the development of our mines,” the minister said.
In fact, the huge mining reserves in Afghanistan could contribute as much as 50 percent of Afghanistan’s GDP by 2025, Shahrani has said. “We expect the share of the mining sector to go up to 25-30 percent of GDP by the next five to seven years. By the next 15 years, this share may go up to 50 percent,” Shahrani said. The government, in order to exploit the huge mineral reserves, has undertaken the Extraction Industries Excellence Programme and National & Regional Resources Corridors Programme, he added.
The Afghanistan government has decided to train 7000
troops to be deployed for security at mining projects, Shahrani said. “The government takes full responsibility for providing security at mines. We will train 7000 troops and also involve the local community,” he said. Citing the instance of Aynak copper mine, awarded to Chinese company MCC three years ago, he claimed: “There has not been a single security incident there.” The Afghanistan government has decided not to involve any state owned companies in new mining projects.
“The government is going to liquidate some state-owned companies. There will be no government companies involved in the mining projects,” Shahrani said. He said the government would not make any distinction between domestic and foreign companies showing interest in Afghan mining projects.
Asked about security concerns, he said, “Don’t look into the negative issues of political uncertainty and instability. Look into the positive aspects of exploiting the mining potential.” Afghanistan has $3 trillion worth of reserves under proven category and the reserves under inferred category are yet to be valued. “We actually intend that the companies, which get exploitation licences, also conduct exploration through procuring licences via the bidding route and help Afghanistan, still a virgin area for mining companies, unleash its mining potential,” said Shahrani.
Afghanistan has reserves of metals like gold, copper, chromite, iron ore, borates and rare minerals like lithium and cobalt. In fact, Afghanistan has so far got government aids like India’s $1.2 billion to reconstruct the country after the war. It is now looking for private sector investment and will immediately require $5-6 billion worth of investment to develop Hajigak, an iron ore rich area north-west of Kabul, Indian ambassador to Afghanistan, Gautam Mukhopadhyay, said.
“We want investment to develop transportation, power and other infrastructural facilities at Hajigak so that exploiting iron ore there becomes feasible. Indian companies can form consortiums to bring in investment at Hajigak,” Shahrani said, adding that his government could consider allowing Indian consortiums invest in the region escaping the tender route and making it a government to government affair. Even a partial exploration of this huge natural treasure hidden under the country’s soil, would help generate an immense amount of foreign investment, apart from creating thousands of jobs in the country.
It has been known for a long time that Afghanistan harbours huge deposits of iron and copper. In fact, the Soviets had mapped the country’s vast mineral wealth way back in the 1980’s, but after that, it remained largely unexplored.
Afghanistan to open up its mining sector Coal Insights Bureau
COAL INSIGHTS 36 NOvember 2010
fEATuRE
NTPC ranked no. 1 Asian power producerLokenath Tiwary
NTPC Ltd, the first PSU in the country’s power sector to be bestowed the coveted ‘Maharatna’ status, has been ranked the no.1 Independent Power Producer (IPP) in
Asia at the prestigious Platts Global 250 Energy Awards.
The largest power generating company of the country has also been ranked no. 10 in overall performance among the energy companies in Asia and no. 52 in overall performance among energy companies across the globe, thus improving upon its last year’s ranking of 73.
These awards were received at Platts Top 250 Global Company Rankings Award ceremony this month by the executive director (corporate planning), N.K. Sharma and the general manager (business development), A.K. Gupta. These rankings are based on four key metrics - asset worth, revenues, profits and return on investment.
In an attempt to boost renewable energy production in the country, India has recently launched the Renewable Energy Certificate (REC) mechanism. REC is a market-
based instrument which enables the obligated entities to meet their Renewable Purchase Obligation (RPO).
Launching the REC mechanism on November 18, Union minister of power, Sushil Kumar Shinde, said, “Pertinently, the Renewable Purchase Obligation is the obligation mandated by the State Electricity Regulatory Commission (SERC) under the Electricity Act, to purchase a minimum level of renewable energy out of the total consumption in the area of a distribution licensee.”
The REC mechanism, he said, also aims at encouraging competition and eventually mainstreaming renewable energy sources. Renewable energy resources in India are widely dispersed and are concentrated mostly in states which have already achieved high level of RPO. These states are generally reluctant to buy energy from such sources beyond their obligation mandated by SERC. Under this mechanism, a RE generator can sell the electricity component locally at the price of conventional electricity and trade the environmental attribute in the form of REC separately.
The other constraint facing the renewable segment is the inability of RE resource-deficient states to fulfill their RPO. With the implementation of the REC scheme, such states will not be constrained to look at only the locally available RE sources for fulfilling their RPO. As per the vision of the Electricity Act and the policy, the RPO can now be fixed keeping in view availability of RE sources in the country as a whole. They will be able to meet their RPO by purchasing the RECs in the Power Exchanges approved by Central Electricity Regulatory Commission (CERC).
The REC mechanism is being seen as one of the pioneering efforts in any developing country for mainstreaming the renewable generation through market mechanism. Over the period, RE generator would learn to find Market Avenues for sale of electricity component through DISCOMs, traders, power exchanges and open
access consumers. Eventually, this will reduce their dependence on government support and they will learn to live on their own.
Salient features of the REC mechanism are as follows:
♦ The RE generators will have two options - either to sell the renewable energy at preferential tariff fixed by the concerned Electricity Regulatory Commission or to sell the electricity component and environmental attributes separately.
♦ On choosing the second option, the generator can sell the 'electricity component' to either the local distribution company at its average power purchase cost, the traders and open consumers or to the power exchanges at a mutually agreed/market determined price. In addition, the 'environmental attributes' can be exchanged in the form of the REC.
♦ The Central Agency (the National Load Despatch Centre has been designated as the Central Agency) will issue the REC to RE generators.
♦ One REC will be equivalent to 1 MWh of electricity injected into the grid.
♦ The REC will be exchanged only in the Power Exchanges approved by CERC within the band of a minimum and a maximum price to be determined by CERC. CERC has already notified the price band.
♦ The distribution companies, Open Access consumer, Captive Power Plants (CPPs) will have the option of purchasing the REC to meet their Renewable Purchase Obligations (RPO).
♦ There will also be compliance auditors to ensure compliance of the requirements of REC by the participants of the scheme.
♦ Voluntary purchasers like NGOs, the corporate sector, individual purchasers and so on may also purchase REC in order to meet their Corporate Social Responsibility (CSR) or to support the environment.
REC mechanism launched in India

COAL INSIGHTS 37 NOvember 2010
fEATuRE
NTPC’s current installed capacity of 32,694 megawatt (MW) is nearly 20 percent of the total installed capacity in the country. Currently, about 17,000 MW of capacity is under construction, about 7000 MW is under bidding while for another 13,000 MW, feasibility reports have been finalised. Thus, NTPC is on course to becoming a 75,000 MW company by 2017 and 128 GW company by the year 2032 with well diversified fuel mix. The company presently operates 28 power stations across the country.
“By the Eleventh Plan period, the company aims to put about 13,000 MW capacity on stream contributing to the government’s plans of adding 68,000 MW by that time,” said the chairman and managing director, NTPC, Arup Roy Choudhury.
Choudhury further said that NTPC will take tariff-based bidding with a competitive spirit and assured timely implementation of all its construction projects.
The first 500 MW unit of Indira Gandhi Super Thermal Power Project at Jhajjar has been commissioned after achieving full load on October 31, 2010. The unit has achieved full load in 39 months from the date of investment approval, a new record for greenfield projects.
The 1500 MW (3 x 500 MW) project is being set up by Aravali Power Company Private Limited (APCPL), a joint venture of NTPC Ltd, government of Haryana and government of Delhi. The power from this project will be supplied to Haryana and Delhi on 50:50 ratio.
To increase the power production capacity, NTPC Ltd has also cleared a `3193 crore investment on its Pakri Barwadih Coal Mining Project in Jharkhand recently.
The mining project, located in Hazaribagh district of Jharkhand, is estimated to produce 15 million tons per annum (mtpa) of coal. The sanctioned investment of `3193.86 crore includes interest costs during construction, financing charges and working capital margins, the public sector undertaking said.
The company is scheduled to start production from the coal block, which was allotted to NTPC on October 11, 2004, in the year 2012. The public sector enterprise has already completed all formalities for implementation of the mining plan, including an action plan for rehabilitation of project-affected persons, it said.
Arrangements for power supply and notifications for land acquisitions under the CBA (Coal Bearing Areas) Act have been completed.
However, some activities such as payment disbursement for land and award of contract for setting up a power plant, are still in progress, the company added.
The company has been granted Maharatna status this month. Being a Maharatna company, the Board of Directors of NTPC are empowered to make equity investments to establish financial joint ventures and wholly-owned subsidiaries and undertake mergers & acquisitions, in India or abroad, subject to a ceiling of 15 percent of the net worth, limited to `5000 crore in one project as against the earlier limit of `1000 crore.
India misses Oct power generation targetGargi Sahai
India’s power generation in October 2010 stood at 70558.88 GWH, lower by a marginal 0.90 percent from the target set for the month, as per a recent Central Electricity Authority
(CEA) report. The target set for the month was 71202.96 GWH. The energy generation for the same month last year was
65101.09 GWH, which means India has been able to generate 8.38 percent energy more than last year in the period.
Thermal power generation was the highest in the month. It stood at 56778.39 GWH, which was 97.12 percent of the planned 58463.92 GWH, thermal power generation was followed by hydro, nuclear and Bhutan IMP at 10753.52 GWH, 2287.98 GWH and 738.99 GWH respectively.
Region wise maximum power generation, 22682.19 GWH was done by the Western region during the month followed by the northern region and southern region with generation of 20445.74 GWH and 15333.83 GWH respectively.
The all India energy generation for the period April to October 2010 is 468321.24 GWH.
Capacity additionIndia added a total of 2085 MW of new power generation capacity during the month of October, which was more than the double of 742 MW added in September. The addition was also substantially higher than the target of 1473.50 MW for the month, according to data of Central Electricity Authority (CEA).
The capacity addition during the same month last year was 1334 MW, against a target of 1019 MW.
The total capacity added during the month was in Thermal category. 600 MW was added at the Rajiv Gandhi TPS of Haryana Power Generating Company Ltd (HPGCL) in Haryana, another 600 MW was added to the Sterlite TPP of Sterlite Energy ltd in Orissa, 135 MW was added to the Wardha Warora unit of Wardha Power Co Ltd in Maharashtra, 500
Source: Central Electricity Authority
All India PLF For October’10(In Percentage)
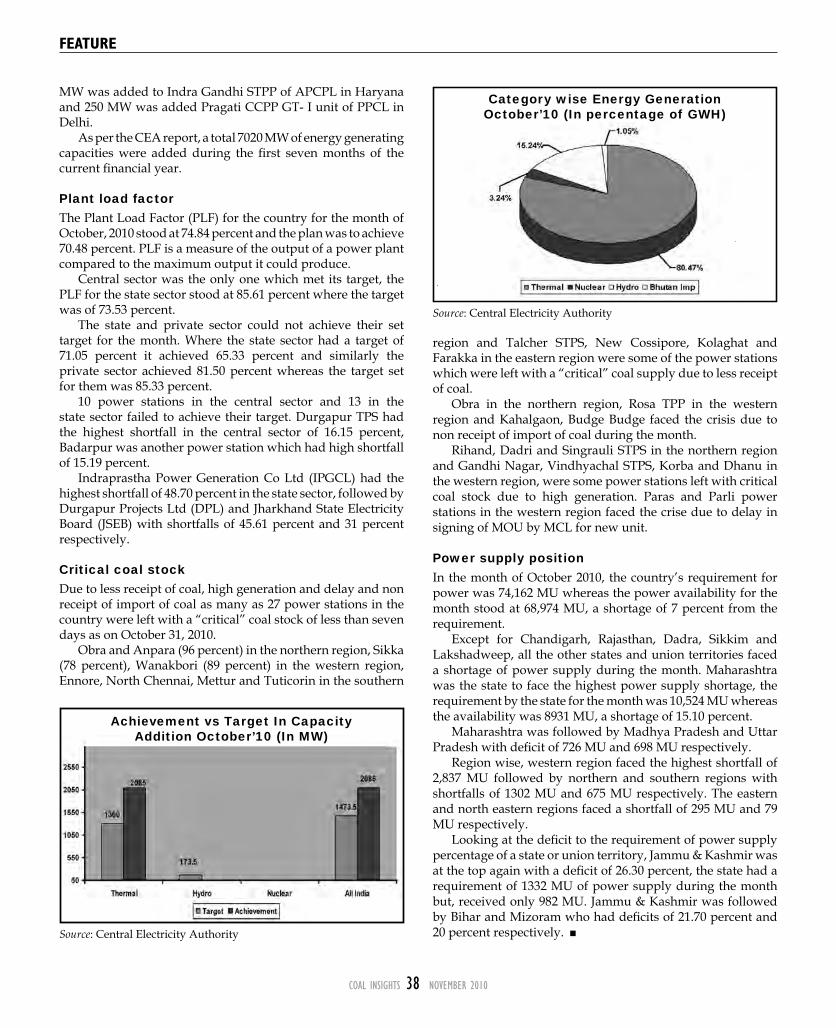
COAL INSIGHTS 38 NOvember 2010
fEATuRE
MW was added to Indra Gandhi STPP of APCPL in Haryana and 250 MW was added Pragati CCPP GT- I unit of PPCL in Delhi.
As per the CEA report, a total 7020 MW of energy generating capacities were added during the first seven months of the current financial year.
Plant load factorThe Plant Load Factor (PLF) for the country for the month of October, 2010 stood at 74.84 percent and the plan was to achieve 70.48 percent. PLF is a measure of the output of a power plant compared to the maximum output it could produce.
Central sector was the only one which met its target, the PLF for the state sector stood at 85.61 percent where the target was of 73.53 percent.
The state and private sector could not achieve their set target for the month. Where the state sector had a target of 71.05 percent it achieved 65.33 percent and similarly the private sector achieved 81.50 percent whereas the target set for them was 85.33 percent.
10 power stations in the central sector and 13 in the state sector failed to achieve their target. Durgapur TPS had the highest shortfall in the central sector of 16.15 percent, Badarpur was another power station which had high shortfall of 15.19 percent.
Indraprastha Power Generation Co Ltd (IPGCL) had the highest shortfall of 48.70 percent in the state sector, followed by Durgapur Projects Ltd (DPL) and Jharkhand State Electricity Board (JSEB) with shortfalls of 45.61 percent and 31 percent respectively.
Critical coal stockDue to less receipt of coal, high generation and delay and non receipt of import of coal as many as 27 power stations in the country were left with a “critical” coal stock of less than seven days as on October 31, 2010.
Obra and Anpara (96 percent) in the northern region, Sikka (78 percent), Wanakbori (89 percent) in the western region, Ennore, North Chennai, Mettur and Tuticorin in the southern
region and Talcher STPS, New Cossipore, Kolaghat and Farakka in the eastern region were some of the power stations which were left with a “critical” coal supply due to less receipt of coal.
Obra in the northern region, Rosa TPP in the western region and Kahalgaon, Budge Budge faced the crisis due to non receipt of import of coal during the month.
Rihand, Dadri and Singrauli STPS in the northern region and Gandhi Nagar, Vindhyachal STPS, Korba and Dhanu in the western region, were some power stations left with critical coal stock due to high generation. Paras and Parli power stations in the western region faced the crise due to delay in signing of MOU by MCL for new unit.
Power supply positionIn the month of October 2010, the country’s requirement for power was 74,162 MU whereas the power availability for the month stood at 68,974 MU, a shortage of 7 percent from the requirement.
Except for Chandigarh, Rajasthan, Dadra, Sikkim and Lakshadweep, all the other states and union territories faced a shortage of power supply during the month. Maharashtra was the state to face the highest power supply shortage, the requirement by the state for the month was 10,524 MU whereas the availability was 8931 MU, a shortage of 15.10 percent.
Maharashtra was followed by Madhya Pradesh and Uttar Pradesh with deficit of 726 MU and 698 MU respectively.
Region wise, western region faced the highest shortfall of 2,837 MU followed by northern and southern regions with shortfalls of 1302 MU and 675 MU respectively. The eastern and north eastern regions faced a shortfall of 295 MU and 79 MU respectively.
Looking at the deficit to the requirement of power supply percentage of a state or union territory, Jammu & Kashmir was at the top again with a deficit of 26.30 percent, the state had a requirement of 1332 MU of power supply during the month but, received only 982 MU. Jammu & Kashmir was followed by Bihar and Mizoram who had deficits of 21.70 percent and 20 percent respectively. Source: Central Electricity Authority
Achievement vs Target In Capacity Addition October’10 (In MW)
Source: Central Electricity Authority
Category wise Energy Generation October’10 (In percentage of GWH)
COAL INSIGHTS 39 NOvember 2010
gOvERnmEnT
The Ministry of Coal is likely to
finalise the draft Coal Regulatory Bill as proposed in the New Coal Distribution Policy 2007, within the next three to four months, Secretary (Coal) C. Balakrishnan, told Coal Insights.
“We have received comments from concerned ministries like steel and power, and will re-draft the Bill. As soon as re-drafting is done, we will place the bill before the Cabinet for approval,” Balakrishnan said.
“I assume it will take another three to four months to re-draft the Bill as certain suggestions made by various ministries need to be incorporated in the final draft,” he added.
Incidentally, the New Coal Distribution Policy 2007, adopted by the government as per recommendation of the Shankar Committee report, had in October 2007 suggested setting up of a Coal Regulator in the country.
The idea had been discussed time and again among the coal producers, consumers and owners of captive coal blocks. It was felt that the country needs a Coal Regulator in order to keep the mining activities within a specific system since a large number of private companies are expected to start coal mining in a big way in the near future.
Guidelines for competitive bidding In addition to the Coal Regulatory Bill, the Ministry of Coal is likely to come out with guidelines for allotment of captive coal blocks through the competitive bidding route, very soon.
“We are in the process of preparing guidelines for allotment of captive coal blocks through competitive bidding route. We are trying to complete the process at the earliest. It is likely to be ready in the next three to four months,” Balakrishnan said.
Incidentally, Rajya Sabha, the Upper House of Parliament in India, on August 17 had cleared the Bill seeking amendment in Mines and Minerals (Development and Regulation)
(MMDR) that paved the way for introduction of allotment of captive coal block through competitive bidding route. The bill was subsequently cleared by Lok Sabha on August 22. “The passage of the Bill will ensure allocation of coal/lignite blocks in a more transparent manner,” the official said. Till now, captive coal/lignite blocks were being allotted by a Screening Committee headed by Secretary (Coal). “The additional revenue earned through competitive bidding route will go to the state where blocks are located,” the official added.
Coal Minister, Sriprakash Jaiswal has already made it clear that the competitive bidding route will be applicable only for private sector companies.
C Balakrishnan, Coal Secretary
Draft Regulatory Bill to be finalised soon: Coal Secy
Coal Insights Bureau
BCCL raises coking coal price for SAIL
Coal Insights Bureau
Bharat Coking Coal Ltd (BCCL), India’s largest coking coal producer, has finalized a deal to supply coking coal to the Steel Authority of
India Ltd (SAIL), India’s largest producer of steel, at a slightly higher rate in 2010-11 as compared with the 2009-10 price.
“We have agreed to supply coking coal to SAIL at a price of `7500 per ton in 2010-11 compared with `6400 per ton in 2009-10,” BCCL’s chairman-cum-managing director T.K. Lahiry, told Coal Insights.
“The final agreement is yet to be signed, but both the parties have recently agreed at Rs 7500 per ton for 2010-11. We will try to supply around 2 million tons (mt) of coking coal to SAIL in 2010-11,” Lahiry said.
He said the company is planning to set up five washeries and if all of them are ready, BCCL’s coking coal supplies to SAIL will increase gradually.
Lahiry said that the letter of intent (LoI) has been recently issued to HEC Ltd for setting up the Madhuban washery. “We are supposed to provide environment clearance in the next 18 months to HEC, which in turn will set up the washery during the same period,” he added.

COAL INSIGHTS 40 NOvember 2010
gOvERnmEnT
OTC power prices higher in OctoberLokenath Tiwary
Over-the-counter (OTC) market prices of electricity during October were at a higher level as compared to the prices of power exchanges. According to an
analysis of all weekly reports received from licensee-traders for the month of October, the reason for higher OTC prices could be attributed to the inherent nature of the contracts.
The report is prepared by the Centre for Monitoring Indian Economy & Market Monitoring Cell, CERC. OTC contracts are for monthly, customised contracts whereas power exchange prices are for spot standardised contracts.
During September 27 to October 31, most of the contracts in OTC market were at higher prices than prices prevailing in exchanges. The minimum price in the exchange was `2.06/kWh (IEX, October 26) while that in the OTC market was ̀ 2.39/kWh. Maximum price at the exchange reached `4.01/kWh (IEX, October 1) and in the OTC market it was `6.50/kWh. In October, OTC contracts mostly were for a month or more and the scheduling of contracts was generally happening from one or two days to one month after contract date. According to the report, two contracts have been done by a trader for eight months from October 1, 2010 to May 31, 2011 and six months from October 1, 2010 to March 31, 2011 of power supply. In October, the cumulative volume traded above `4/kwh was 1179.24 MUs which is 49.20 percent of the total OTC.
As per the report, the number of contacts for November to December is higher (32) than the number of contracts reported for January 2011 to the first week of February 2011 (13). During November, OTC sale price was `4.22/kwh which dipped marginally to `4.21/kwh on November 16 and remained at the same level till November 30. From December 1, 2010, it increases to 4.40/kwh and remains at this level till December end. The future price starts dropping in January 2011 to ̀ 4.38/kwh and remains at this level through the month and further decreases to `4.37/kwh on February 1, 2011.
The price for November-December period is different. This is so because contract prices for November-December executed in September (`4.73/kwh) have been higher than the contract for the same period executed in October (`4.23/kwh).
Price and Volume of OTC Contracts
WeeksRange of Sale Price(`/kWh)
maximumminimum
Weighted Averageof Sale Price (`/kWh)
Total volume
(mU)27th September-3rd October 4.50 3.19 3.63 1156.944th-10th October 5.04 2.39 3.98 152.8811th -17th October 4.50 2.39 4.13 67.4818th-24th October 4.80 4.35 4.38 165.0025th-31st October 6.50 2.39 2.22 854.52Total 2396.83
States seek to keep coal out of GST netCoal Insights Bureau
Concerned over a possible increase in tax on coal, the state finance ministers have urged the Centre not to include the fuel in the list of Goods and Services
Tax (GST). In a recent letter to union finance ministry, the empowered committee of state finance ministers has sought exemption for coal and a few other items from the purview of this new tax regime. The Orissa government has taken a lead role in this regard. The state government was building up a case to exclude coal from the GST list and is talking to coal-bearing states like Jharkhand, Chhattisgarh and Madhya Pradesh for this purpose.
The Orissa government has recently said that GST on coal would have a direct effect on power cost as the effective rate of tax would go up to 12 percent from the 4 percent VAT (value-added tax) that is levied on coal currently. If coal was to be included in the GST list both state GST and central GST would levy 6 percent tax each on coal.
The roll-out of GST, which will subsume excise duty and service tax at the central level and VAT on the state front, besides local levies, has been hanging fire, ever since it missed an initial deadline of April 1, 2010. The new deadline for implementation of GST, fixed on April 1, 2011 is also likely to be missed. At a meeting of the Empowered Committee of State Finance Ministers in Panjim recently, panel chairman Asim Dasgupta floated a proposal that the current committee be enlarged with union finance minister as its chairman and one of the state finance ministers as vice-chairman for making changes in the indirect tax system. This contradicted the Centre’s earlier proposal.
The Centre had earlier proposed that the council be set up, chaired by the finance minister, with state finance ministers as members and any change in GST be effected only through complete consensus. Some states in contrast to the Centre's proposal had suggested a new model for the council which will be empowered to make changes in the fresh regime on a consensus on the new indirect tax system-GST. This has eluded delaying the GST rollout further, and the Centre now says that GST may be rolled out sometime in the next financial year. This new deadline was suggested by the Centre after its earlier proposal that the council be empowered to make changes in GST with the approval of Union finance minister and two-third of the council members was rejected by states. They were skeptical of a veto power to the Centre over their fiscal autonomy.
Meanwhile, India has also levied a tax on coal producers to charge companies for fossil fuel pollution. Coal, used to fire more than half of India’s electricity generation, is taxed at `50 per ton to help fund clean-energy projects. This is a major step in India’s endeavour to promote renewable energy infrastructure. The clean-energy levy will also apply to imported coal, Finance Minister Pranab Mukherjee had said in his budget speech.
COAL INSIGHTS 41 NOvember 2010
InTERnATIOnAL
The new Minerals Resource Rent Tax (MRRT) of the Australian government on coal and iron ore mining projects may be imposed on other mineral projects in
future as well, official sources said. “As of now, the MRRT will be applicable only for coal and iron ore projects. All other commodities are excluded from that list. But you cannot rule out inclusion of other minerals under this tax net in future,” the sources said.
MRRT, which imposes a hefty 30 percent headline tax on companies earning more than $50 million in profits, is slated to come into effect from July 1, 2012. However, an extraction allowance equal to 25 percent of the otherwise taxable profit will be deductible to recognise the profit attributable to the extraction process.
The new tax will replace the Resources Super Profits Tax (RSPT), which was initially proposed on May 2, 2010. The design of MRRT is significantly different compared to RSPT; in some respect MRRT will be more burdensome than RSPT, but it also has greater concessional arrangements for pre-existing projects. Global mining giants such as BHP Billiton, Rio Tinto and Xstrata, which had opposed RSPT, welcomed the announcement of it being replaced by MRRT.
While announcing the finalisation of MRRT, the Australian government had said “The government will focus the resource tax reforms on our biggest and most profitable commodities, namely iron ore, coal, oil and gas. These represent three-quarters of the value of our exports and resource operating profits and account for an even greater share of resource rents
in the mining industry. They also represent the vast bulk of growth in the sector over the coming decades.”
The factors considered for choosing these sectors included the hike in coal and iron ore prices in the recent past. “Since the beginning of the mining boom, prices for iron ore have increased by over 400 percent and prices for black coal have increased over 200 percent.”
The exclusion of other commodities, the government had said, would reduce the number of affected companies from 2500 to around 320. These commodities were not expected to pay significant amounts of resource rent tax, and “excluding them will allow many companies to remain in their existing taxation regimes.” However, if all other minerals are brought under MRRT in future, the government may have to bring suitable changes to accommodate small companies.
MRRT not to affect investment, export Notwithstanding the concerns expressed by many mining stake-holders, experts said the new tax regime would not materially impact the investment flows into Australia’s mining sector or the country’s position as one of the largest exporters of minerals in the world.
Peter Linford, senior trade and investment commissioner, Austrade (South Asia) said the new tax system would not affect investment flows into mining sector. “Australia presents a world class mining sector. The strength of Australia’s mining industry is reflective of the depth and diversity of the sector and its abundance of natural resources,” he said.
Australia may extend mineral tax purviewCoal Insights Bureau
♦ Iron ore and coal will be subject to a new profits-based Minerals Resource Rent Tax (MRRT) at a rate of 30 percent. MRRT assessable profits are calculated on the value of the commodity, determined at its first saleable form (at mine gate), less all costs to that point.
♦ Projects will be entitled to a 25 percent extraction allowance that reduces taxable profits subject to the MRRT.
♦ Small miners with resource profits below $50 million per annum will not have an MRRT liability.
♦ Miners may elect to use the book or market value as the starting base for project assets, with depreciation accelerated over 5 years when book value, excluding mining rights, is used; or effective life (up to 25 years) when market value at May 1, 2010, including mining rights, is used. All post May 1, 2010 capital expenditure will be added to the starting base.
♦ A book value starting base will be uplifted with the long term bond rate plus 7 percent. However, a market value starting base will not be uplifted.
♦ Investment post July 1, 2012 will be able to be written off immediately, rather than depreciated over a number of years. This allows mining projects to access the deductions immediately, and means a project will not pay any MRRT until it has made enough profit to pay off its up front investment.
♦ The deductibility of expenditure under MRRT will be broadly based on the categories used in the Petroleum Resource Rent Tax (PRRT) regime.
♦ MRRT losses will be transferable to other iron ore & coal projects in Australia. This supports mine development.
♦ Unutilised MRRT losses will be carried forward at the government long term bond rate plus 7 percent.
MRRT – Bulk commodity resource tax arrangements

COAL INSIGHTS 42 NOvember 2010
InTERnATIOnAL
The Energy Information Administration (EIA) of the US has decreased its estimate of coal consumption as well as that of production for the country in 2010. The agency,
which is an independent statistical organisation within the US Department of Energy, said in its November report that US coal consumption in 2010 is likely to decrease to 1062.9 million short tons (million s.t) compared with its October forecast of 1068.8 million s.t.. The country’s coal production, it said, is likely to stand at 1081.8 million s.t., which is lower than the October projection of 1083.0 million s.t. Coal production for the first 6 months in 2010 fell by 3 percent despite a 5 percent increase in US coal consumption because of draw downs in stocks held by the electric power sector. Projected coal production increases in the second half of 2010 as the drawdown in stocks slows, contributing to 2010 annual growth of 1 percent.
Projected 2011 coal production has also gone down to 1091.1 million s.t in November against 1094.4 million s.t forecasted in October. Again, coal consumption for 2011 has been revised downward to 1058.3 million s.t from 1061.8 million s.t projected a month ago. The November report projects that coal consumption in the electric power sector in 2010 is estimated to be 992.5 million s.t, which is lower than the level projected in the previous month at 998.8 million s.t.. For 2011, coal consumption in this sector has been revised to 990.4 million s.t from 992.3 million s.t.. EIA forecasts that coal consumption in the electric power sector will grow by 6 percent in 2010, primarily as a result of higher electricity consumption. According to the November report, coal consumption by other sectors such as retail and industrial areas would be 49.3 million s.t. and 46.3 million s.t., respectively. These were similar to the October projections for the same.
Consumption by coke plants as well as for the residential and commercial sectors in this month’s report, was forecasted at 20.5 million s.t and 3.0 million s.t respectively, similar to projections in October.
Forecast increases in nuclear and renewable based generation combined with a 0.1 percent drop in electricity consumption in 2011 contribute to a decline in coal-fired electricity generation and related coal consumption.
Electricity demandEIA now estimates that total consumption of electricity across all sectors during 2010 is likely to be 10.73 billion kWh per day. This is slightly less than last month’s projection of 10.76 billion kWh per day for the current year. Again, projections for total consumption of electricity across all sectors in 2011 in the November report was 10.72 billion kWh per day, similar to that reported in October.
The latest report forecasted the total retail sector sale of electricity to 10.24 billion kWh per day while forecasted sale in its last month’s report stood at 10.27 billion kWh per day. The November report forecasted sale of electricity for residential sector to 3.96 billion kWh per day in 2010, which is slightly lower than 3.99 billion kWh per day projected in its October report. Retail sale of electricity to the industrial sector is forecasted to be 2.57 million kWh per day in 2010, similar to that projected in the October report.
Warmer temperatures contribute to a projected 3 percent decline in US retail sales of electricity to the residential sector over the winter months.
In contrast, improvements in manufacturing output should lead to a 4.6 percent increase in US retail sales of electricity to the industrial sector during the same time period. On the
EIA 2010 US coal consumption and production outlook falls
Chandrika Bose
Source: Short-Term Energy Outlook, November 2010
US Coal Consumption Growth(change from previous year)
Source: Short-Term Energy Outlook, November 2010
US Annual Coal Production

COAL INSIGHTS 43 NOvember 2010
InTERnATIOnAL
whole, EIA expects a 4.7 percent increase in total annual consumption of electricity across all sectors during 2010.
Oil consumptionThe latest report of the agency said that oil consumption globally is likely to grow by 2 million barrels per day (bbl/d) to 86.33 million bbl/d, which is higher than the forecast made in its previous report of 86.06 million bbl/d.
EIA has revised world oil consumption growth in 2010 upward in response to stronger-than-expected growth in European oil demand during the second and third quarters of 2010, as well as continued strong growth in China. The non-OECD regions, especially China, the Middle East and Brazil, are the areas where most of the expected growth in world oil consumption in 2011 is slated to take place.
Among the OECD regions, EIA expects North America to record almost all the oil consumption growth in 2011, with a gain of nearly 0.4 million bbl/d. In 2011, EIA expects global oil consumption growth to the tune of 1.4 million bbl/d. The agency has made slight changes in projections on increase in oil consumption for 2011, which is expected to grow to 87.77
million bbl/d from 87.44 million bbl/d projected last month.
TradeEIA’s November estimate suggests that US coal exports will be around 76.5 million s.t in 2010 and 74 million s.t in 2011, similar to that estimated in their October report. EIA expects total coal exports to increase by 30 percent in 2010, but decline in 2011 as other major coal-exporting countries increase their supply to the global coal market. Strong global demand for coal, particularly metallurgical coal used to produce steel, has resulted in sharp increases in the US coal exports in 2010. Metallurgical coal exports have nearly doubled in the first half of this year compared with the first half of 2009, and metallurgical coal’s share in total coal exports has grown from 52 percent in 2008 to a projected 73 percent in 2010.
The latest report projected that 2010 coal imports by the US will come down to 18.9 million s.t, as compared to the previous year’s imports of 22.6 million s.t. This month’s projection of imports is similar to that forecasted in October. Also, the 2011 imports are similar to the levels forecasted in the previous month’s report at 25.9 million s.t.
India and the US have agreed to set up a green energy research and development centre in India, with each country funding $5 million for the next five years. This
deal was inked during the recent visit of US President Barack Obama, to India. The focus of the centre is likely to revolve around solar energy, energy efficiency, biofuels, clean coal technology and an integrated gasification combined cycle project that turns coal into synthesis gas.
It was in November 2009 that the concept of such a centre was first agreed upon during the Indian Prime Minister Manmohan Singh’s state visit to Washington. Obama has been quoted as saying that: “We can pursue joint research and development to create green jobs; give India more access to cleaner, affordable energy; meet the commitments we made at Copenhagen and show the possibilities of low-carbon growth.”
He also mentioned that with his visit, the country is now ready to begin implementing their civil nuclear agreement which will help India to meet its growing energy needs. The agreement between the two countries for cooperation on peaceful uses of nuclear energy was signed in October 2008.
During Obama’s visit both the countries also signed an agreement on shale gas cooperation. The agreement includes a resource assessment in India conducted by the US Geological Survey, technical studies on shale gas
exploration in India and training of Indian personnel in shale gas exploration and development.
Recently the minister for petroleum and natural gas Murli Deora mentioned about huge tract of Indian sedimentary areas, yet unexplored which would create opportunities for global players to venture into the shale sector. Moreover, as 75 percent of its crude oil needs are catered by imports in India, it is important to explore the Indian Sedimentary Basin to bridge the gap.
According to recent market reports, India aims to launch the first round of auction of shale gas-bearing areas by the end of 2011.
This is the second joint green energy research and development agreement by the US government. Last year in November a similar agreement was made by Obama with China during his visit to Beijing. This US-China Clean Energy Research Centre will facilitate joint research and development of clean energy technologies by teams of scientists and engineers from the US and China with a budget of $150 million over five years.
This was also inclusive of carbon capture and storage and some deals with US firms such as General Electric and Peabody Energy.
The former would help promote IGCC technology in China; and the latter will invest in GreenGen, the Chinese equivalent of the FutureGen clean coal project in the US.
India, US to set up joint green research centreCoal Insights Bureau

COAL INSIGHTS 44 NOvember 2010
InTERnATIOnAL
Germany’s export of mining machinery to India is pegged at €70 million for 2010, about a 15 percent increase over €60.3 million achieved in 2009. This, after a year
of decline, might seem to be a satisfactory performance. But the closure of mines back home and competition from Chinese firms are compelling the Germans to pull up their socks.
“Germany’s export of mining machinery to India shows some fluctuations over the last few years,” said Peter Jochums, past president of VDMA Mining Equipment Association. It ranged from €13 million in 2001 to €1.36 million in 2003 and €60.3 million in 2009. “In 2010, we expect exports to remain more or less at the same level as in 2009. German manufacturers could stabilise the export of mining machinery after a drop last year,” Jochums said. VDMA India managing director Rajesh Nath, however, said total exports are likely to reach €70 million, thereby showing a 15 percent growth over last year. Total exports of engineering equipment, which also includes construction machineries, would reach €2.9 billion, about 26 percent growth over €2.3 billion posted a year ago.
During the first seven months of 2010, Germany has delivered mining machinery worth €34 mn to the Indian customers. These machines mostly comprise longwall shearers, heading and tunnelling machines, and machinery for crushing and grinding. Among the Indian coal miners, Singareni Coalfields Company Ltd (SCCL) has the most number of longwall projects, Jochums said.
Chinese threatWhile exuding confidence in the international reputation and quality of German mining equipment, Jochums said: “The German machinery makers are recently facing a tough competition from their Chinese counterparts in the Indian coal mining projects. The Chinese companies have bagged most of the orders in the last two years….It is high time the German companies braced up to face up this competition.”
The primary advantage of the Chinese firms, he said was that they could send their representatives and workers to stay in India for a long period and assist their clients in absorbing technologies. Many Chinese workers had been stationed at Singareni. This is something very few German or European companies would possibly do. Noting that German firms could neither outdo the Chinese in cost competitiveness nor in personalised service, he said: “We must hold on to our reliability and superior technology. Germans are still ahead of the Chinese, but the gap is closing. They are learning real fast…this is a situation similar to the one we saw 25 years ago when the Japanese overtook Germans in camera business.”
Closure of coal mines Another major factor that may drive the sales of German
mining machinery to India is the closure of coal mines back home. Currently, there are six operating mines in the EU country, producing around 14 million tons (mt) of coal a year. All these mines have become uneconomical and are expected to be closed by 2018. Although there are significant volumes of copper and lignite mining going on, closure of coal mines may drive German equipment makers to focus more on exports.
Jochums, however, said that reopening of some copper mines following an increase in international copper prices may mitigate the impact of closure of coal mines. Germany’s black coal production has shrunk from 150 million tons (mt) in 1957 to 25.6 mt in 2005 and further to 14 mt in 2009. In 2010, production is likely to dip to 10 mt. The government gives substantial amount of subsidy as mining of coal has become uneconomical over the years. The decision to phase out the coal mines is likely to be reviewed by Parliament in 2012.
Focus on IndiaIn order to tap the huge opportunity in the Indian mining sector, three major German mining equipment makers have planned to set up manufacturing facilities in the country so as to cater to the local miners. “Leading German machine manufacturers Wirtgen, Hazemag and Allmineral are setting up their manufacturing units in India either through their own units or through joint ventures,” Nath said.
While Wirtgen is setting up a manufacturing facility in Pune, Allmineral has entered into a joint venture agreement with Kolkata-based Jyotirmoyee International Pvt Ltd (JIPL) for setting up a plant in Orissa. Hazemag is also coming up with a unit in eastern India, he said. VDMA, which has been present in Kolkata for about 14 years now, is acting as a bridgehead among the German and Indian industries and fostering closer business cooperation between the two countries, he added.
Bidding for CIL projectsBesides setting up manufacturing units, German mining equipment makers are keen to participate in the tenders to be floated by Coal India Limited (CIL) for opencast mining projects and washeries. CIL has decided to come up with in-built washeries in all new mining projects with annual production of more than 2 mt. It has also embarked upon an ambitious `3000-crore plan to wash almost half of its output to improve the quality of coal and garner prices at par with international rates.
“The German companies are in continuous dialogue with CIL. Many of these companies will take part in CIL tenders for some washeries and opencast mining projects, which are expected to be floated shortly,” a German trade official said. Meanwhile, Germany brought the largest ever delegation of 40 companies for the International Mining Machinery Exhibition (IMME) 2010 held in Kolkata between November 10-13.
German mining tools import to be up 15%Coal Insights Bureau
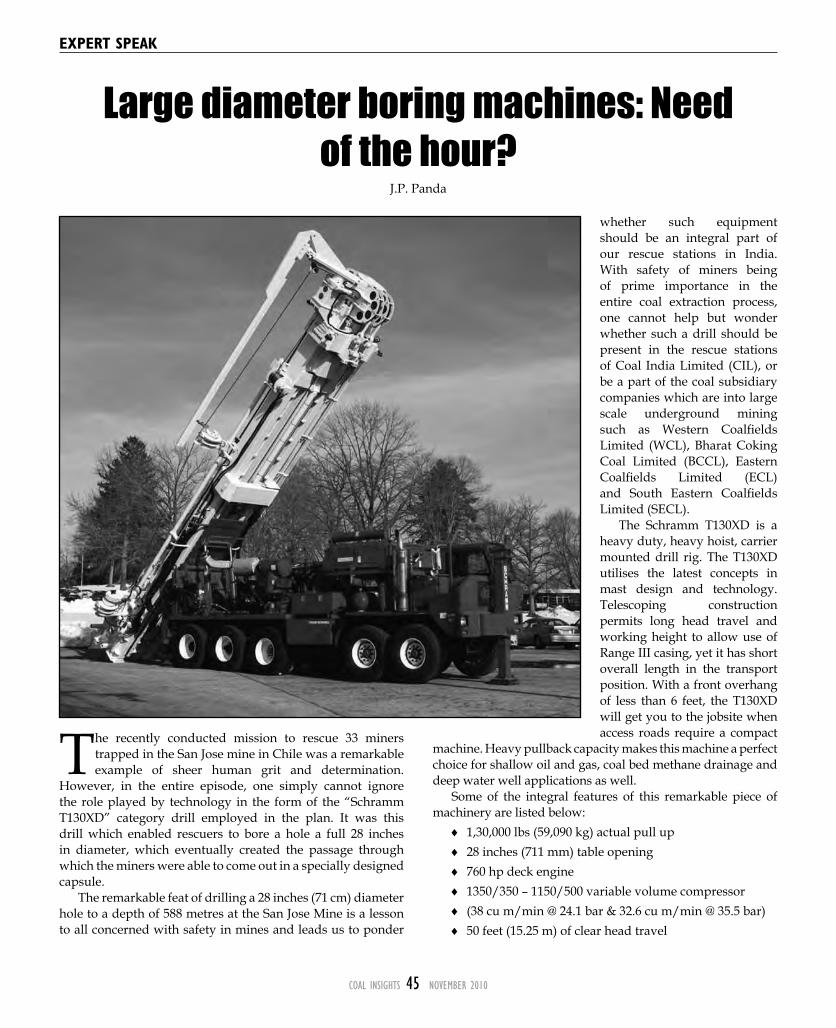
COAL INSIGHTS 45 NOvember 2010
The recently conducted mission to rescue 33 miners trapped in the San Jose mine in Chile was a remarkable example of sheer human grit and determination.
However, in the entire episode, one simply cannot ignore the role played by technology in the form of the “Schramm T130XD” category drill employed in the plan. It was this drill which enabled rescuers to bore a hole a full 28 inches in diameter, which eventually created the passage through which the miners were able to come out in a specially designed capsule.
The remarkable feat of drilling a 28 inches (71 cm) diameter hole to a depth of 588 metres at the San Jose Mine is a lesson to all concerned with safety in mines and leads us to ponder
whether such equipment should be an integral part of our rescue stations in India. With safety of miners being of prime importance in the entire coal extraction process, one cannot help but wonder whether such a drill should be present in the rescue stations of Coal India Limited (CIL), or be a part of the coal subsidiary companies which are into large scale underground mining such as Western Coalfields Limited (WCL), Bharat Coking Coal Limited (BCCL), Eastern Coalfields Limited (ECL) and South Eastern Coalfields Limited (SECL).
The Schramm T130XD is a heavy duty, heavy hoist, carrier mounted drill rig. The T130XD utilises the latest concepts in mast design and technology. Telescoping construction permits long head travel and working height to allow use of Range III casing, yet it has short overall length in the transport position. With a front overhang of less than 6 feet, the T130XD will get you to the jobsite when access roads require a compact
machine. Heavy pullback capacity makes this machine a perfect choice for shallow oil and gas, coal bed methane drainage and deep water well applications as well.
Some of the integral features of this remarkable piece of machinery are listed below:
♦ 1,30,000 lbs (59,090 kg) actual pull up ♦ 28 inches (711 mm) table opening ♦ 760 hp deck engine ♦ 1350/350 – 1150/500 variable volume compressor ♦ (38 cu m/min @ 24.1 bar & 32.6 cu m/min @ 35.5 bar) ♦ 50 feet (15.25 m) of clear head travel
ExpERT spEAk
Large diameter boring machines: Need of the hour?
J.P. Panda

COAL INSIGHTS 46 NOvember 2010
ExpERT spEAk
♦ Hydraulic feed system ♦ Drill rods 4.5 inches O.D and 2.5 inches I.D and 30 ft long
♦ Tri-cone roller bit 28 inches diametre ♦ Tool lubricator-positive displacement air pump operated piston type with variable delivery of 5 gallons per hour to 18.9 gallons per hour
♦ Water Injection System 25 gpm (95 lpm) water pump electric foam pump.
Use in ventilation shaftsRescue of trapped miners is not the only area where the T130XD proves its mettle. This drill can also be used for drilling ventilation shafts in large underground mines. Many large mines have severe ventilation problems and multiple ventilation shafts will reduce the cost of ventilation in a mine, which by the way is considerable. Indeed, modern thinking prescribes that multiple shaft ventilation is a very cost effective process and also probably the only one to solve the issue of ventilation in large mines.
Use as pilot shaftUse of such large diameter boreholes has the potential to be used as a pilot shaft for very fast sinking. Indeed, pulls up to 3 to 4 metres can be obtained for high speed shaft sinking and the cost of explosives will also come down sharply due to the free face available by the pilot hole.
It may be noted in this context that Coal India, which is proposing nearly 150 million tons (mt) of coal production from underground mines by 2020 from its present level of 40 to 50 mt, will require sinking of new shafts urgently for highly mechanised underground mines. The ambitious programme of increasing underground coal production to such high levels without sinking modern shafts is just not possible unless immediate steps are taken to sink a few dozen shafts and fit them with high capacity skips.
Use of machines such as the Schramm T130XD is also necessary for deepening present shafts. One needs to install this drill machine over a shaft by removing the headgear temporarily and covering the shaft by heavy duty girder platform. The drill can be mounted on the platform to drill the pilot shaft from the pit bottom to the desired level. The rock cuttings from the bore hole can be packed in an underground gallery.
The other uses of this wonderful equipment lies in dewatering of old workings by boring such holes at the dip most points of the old workings and installing large diameter and high capacity submersible pumps in these bore holes.
The writer is former CGM of Coal India Ltd, former COO of Aditya Birla Group and is present Managing Director of Priya Mining Consultancy and Services Pvt Ltd
COAL INSIGHTS 47 NOvember 2010
CORpORATE
Monnet Ispat posts 2% rise in net profit in Q2Coal Insights Bureau
Domestic steel maker Monnet Ispat has reported 2 percent rise in net profit for the second quarter ending September 30 to `65.60 crore, as against the
year-ago period, even as high input costs took a toll on its bottom line.
The net profit declined due to maintenance shutdowns and an increase in iron ore prices, according to company officials.
The company had posted a net profit of `64.21 crore for the second quarter of the previous fiscal. Lower production of sponge iron and power also hit the company bottom line. The company registered net sales of `360.65 crore in the reporting quarter as against ̀ 313.98 crore in the corresponding period of the previous year.
Monnet Ispat is in the process of establishing facilities to produce 1.8 million tons per annum (mtpa) of steel. At present, it has a sponge iron manufacturing capacity of 1 mtpa.
In terms of production numbers,the sponge iron production is 1,62,000 tons against 1,75,000 tons in the previous quarter.
In terms of realisations, realisation of sponge iron is up `16,000 per ton compared to `14,500 per ton in the previous quarter.
The prices have already started to look up since last month and we hope that sponge iron prices will do better from now on till the year end.
The company will also commission a 80 MW capacity captive power plant by the end of FY11. Separately, its subsidiary, Monnet Power, is working to set up a 1050 MW merchant power plant in Orissa.
The company is planning to ramp up capacity for Monnet Power. But the plans are still at the drawing board level and formal declarations are expected in due course of time.
The company’s power unit, Monnet Power, may look towards tapping the capital market next year to part fund the construction of its upcoming power projects in Orissa and Andhra Pradesh. The power plants are expected to go onstream by 2015.
The company may opt for a gas-fired power plant instead of a coal-based thermal power plant, even though it has an annual production capacity of 1 mtpa.
The company also plans to invest $100 million for purchase of coal mines in Indonesia and South Africa. It has shortlisted two mines in South Africa and three in Indonesia.
Coal extracted from these overseas mines could either be used for the company’s power plants or utilised for trading
purposes. Monnet is also looking to acquire iron ore, limestone, manganese and chromite mines in Africa.
The company plans to augment its present steel production capacity with a 1.5 mtpa capacity plant at Raigarh in Chhattisgarh district, which is expected to become operational by December 2011. It is also planning to set up a steel plant at Bokaro, for which it is in the process of acquiring land.
According to senior company officials, the company expects sponge iron prices to rise in the coming months, due to demand for long steel from infrastructure companies.
PowerGrid shares to start trading from Nov 26Coal Insights Bureau
State-owned PowerGrid Corporation’s new shares allotted to the public under its recent 20 percent follow-on public offer will start trading on the bourses from
November 26. The government divested 10 percent of its 86.36 percent
stake in PowerGrid Corporation through the follow-on public offer, while the company offered an equal percentage of fresh equity.
The government raked in about `7575 crore from PowerGrid’s share sale programme.
The funds raised from the FPO will be used for part-funding the PSU’s `55,000-crore capex plan, which envisages investments worth `30,900 crore over the next two years.
The company had fixed the issue price of shares under the offer at `90 per share, at the higher end of the IPO price band of `85 to `90 per share. However, retail investors and employees will be given equity stocks at a 5 percent discount on the issue price.
The FPO received a huge response from investors and was oversubscribed 14.83 times, garnering total demand for 1248.48 crore shares, as against 84.17 crore shares on offer, according to data available from the National Stock Exchange.
SBI Capital Markets Ltd, Goldman Sachs (India) Securities Pvt Ltd, ICICI Securities and JP Morgan India Pvt Ltd are the book running lead managers to the issue.
The mega offer has given a boost to the government’s disinvestment programme, which aims to garner ̀ 40,000 crore this fiscal.
PowerGrid’s public offer will be followed by stake sales by Hindustan Copper, Manganese Ore India Ltd and SAIL, among other PSUs, this fiscal.
COAL INSIGHTS 48 NOvember 2010
CORpORATE
State-run Coal India Ltd has become the third most powerful Indian company with a total market capitalisation (m-cap) of `2,09,671 crore and is only
lagging behind Reliance Industries Ltd and ONGC. The coal behemoth added another feather to its cap last week ended November 19 when it replaced IT giant Tata Consultancy Services (TCS) to become the country's third most coveted firm. CIL added `7611 crore to its valuation, which on November 19 stood at `2,09,671 crore. According to market analysts, investors are optimistic about the stock and looking at the cash balance of the company it is likely that it may go for acquisitions either in the domestic space or overseas.
The coal behemoth is in talks with US miners Peabody Energy Corp. and Massey Energy Co. to buy stakes in coal mines with long-term offtake agreements.
The state-run Indian company is the world's largest coal miner by production and has been seeking to secure coal assets overseas to meet growing demand from local utilities, which aim to add 113 gigawatts of power generation capacity over the next seven years. India currently has a power generation capacity of 164 gigawatts. The overseas plans are important for Coal India to meet local demand because its efforts to increase domestic output have been stymied as various projects are stuck due to delays in receiving environmental and forest clearances. Coal India, which listed its shares on local stock exchanges on November 4, currently does not have any producing assets overseas.
The company has invited initial bids from investment and merchant bankers by November 15 to assist it in its venture to acquire coal resources abroad, its website showed. Coal India had in August 2009 acquired prospecting licenses for two coal blocks in Mozambique. The miner has set aside $1.2 billion to buy overseas assets in the financial year through March 2011.
On April 12, Peabody and Coal India said in a joint statement they are in a broad range of preliminary talks to explore long-term coal supplies and other possible ventures.
In June, officials had said that the company is doing due diligence on five proposals worth $1.7 billion for partnerships with global miners in producing mines in Australia, Indonesia and the U.S. In August, Coal India invited bids from overseas miners to enter into contracts for long-term offtake of coal. Currently, the company is studying responses from miners for these long-term contracts. The company, the world's largest coal producer, made a strong debut on the bourses on November 4, aided by institutional demand and robust prospects for coal demand in the country. Coal India opened trade at `287.75 on the Bombay Stock Exchange, 17.4 percent higher than its initial public offering price of `245.
The debut of the $3.43 billion initial public offering is likely to be a shot in the arm for the federal government's ambitious programme to raise $9.02 billion this fiscal year through
March 2011 by selling stakes in state-owned companies. The success of the Coal India share sale came after investors cold-shouldered earlier follow-on issues by state-run iron ore miner NMDC Ltd and thermal power generator NTPC Ltd due to steep pricing. State-run insurance companies and banks had to step in to buy the shares.
Aiding Coal India's opening is the fact that it controls 82 percent of India's coal production. Coal, in turn, powers three-quarters of India's electricity output and demand is expected to grow at 10 percent a year for the next six years, while domestic supply will lag at 7 percent.
India faces a peak-hour power deficit of nearly 14 percent and plans to triple its generation capacity over the next decade.
Global brokerages have given thumbs up to the stock. Brokerages said Coal India deserved a premium to its global peers due to higher EBITDA growth until the fiscal year ended March 31, 2013, higher reserves in active mines, greater predictability in earnings, superior returns and chronic coal shortages in India – with imports constrained by infrastructure – and the average multiples of Indian companies being higher than global ones.
The issue of nearly 631.64 million shares had bids for almost 9.65 billion shares, or 15.28 times the shares on offer, drawing demand to the tune of $52.48 billion. The institutional part of the issue was covered 24.7 times, while the section reserved for the wealthy individuals was covered 25.40 times and the retail tranche 2.31 times. The entire proceeds of the issue will go into the government's coffers to help reduce the widening fiscal deficit and fund social projects.
Coal India's IPO will surpass Reliance Power's $3 billion listing in 2008 as India's largest new issue, and comes to market amid a flurry of big deals in Asia.
Coal India expects profits to rise by 25 percent this fiscal year, helped by rising demand, and has set aside $1.2 billion for overseas acquisitions in the year to March 2011. It is currently evaluating proposals to buy stakes in coal firms in the US, Australia and Indonesia. Morgan Stanley, Citigroup, Kotak Mahindra Capital, Enam Securities, Deutsche Bank and Bank of America-Merrill Lynch were managers on the offer.
The government has sold 10 percent of its stake in the world's largest coal producer through the public offer. Prior to the IPO, CIL was a fully government-owned entity. Post issue the government’s stake will come down to 89.99 percent.
As of March 31, 2010, CIL operated 471 mines in 21 major coalfields across eight states in India, including 163 opencast mines, 273 underground mines and 35 mixed mines (which include both opencast and underground mines). It produces non-coking coal and coking coal of various grades for diverse applications. For the year ended March 31, 2010, CIL has reported a net profit of `9622.45 crore on a total income of `52,592.29 crore.
CIL 3rd most powerful company in IndiaTamajit Pain
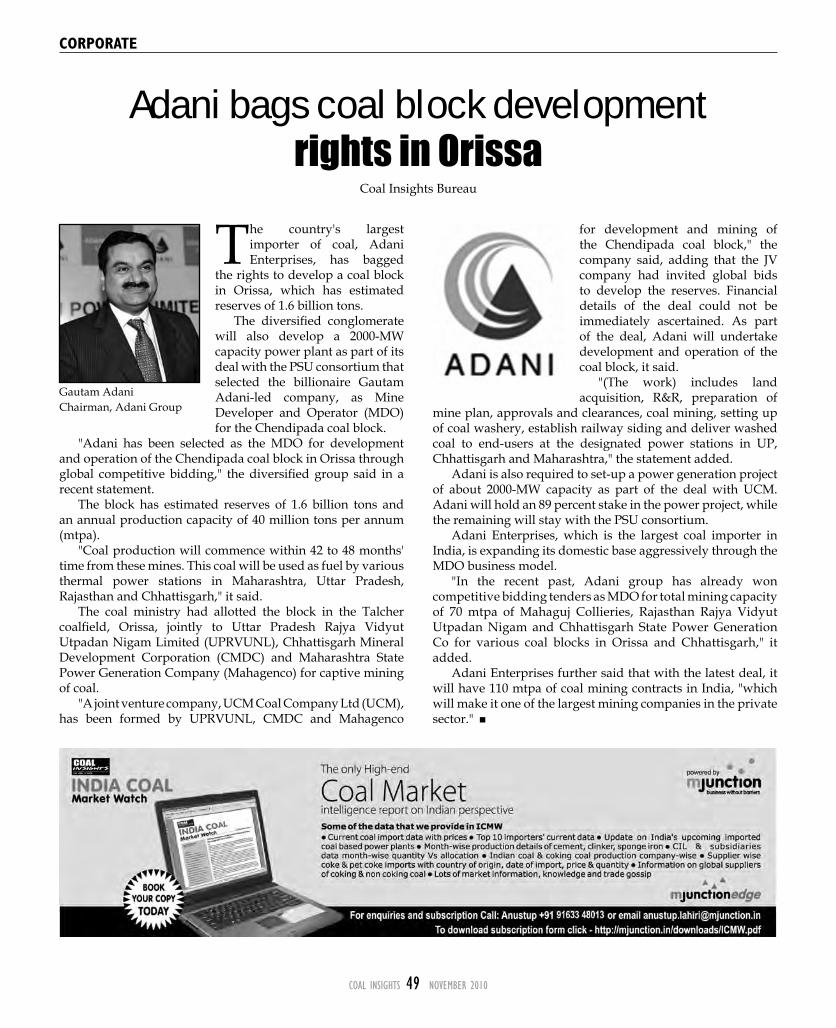
COAL INSIGHTS 49 NOvember 2010
CORpORATE
The country's largest importer of coal, Adani Enterprises, has bagged
the rights to develop a coal block in Orissa, which has estimated reserves of 1.6 billion tons.
The diversified conglomerate will also develop a 2000-MW capacity power plant as part of its deal with the PSU consortium that selected the billionaire Gautam Adani-led company, as Mine Developer and Operator (MDO) for the Chendipada coal block.
"Adani has been selected as the MDO for development and operation of the Chendipada coal block in Orissa through global competitive bidding," the diversified group said in a recent statement.
The block has estimated reserves of 1.6 billion tons and an annual production capacity of 40 million tons per annum (mtpa).
"Coal production will commence within 42 to 48 months' time from these mines. This coal will be used as fuel by various thermal power stations in Maharashtra, Uttar Pradesh, Rajasthan and Chhattisgarh," it said.
The coal ministry had allotted the block in the Talcher coalfield, Orissa, jointly to Uttar Pradesh Rajya Vidyut Utpadan Nigam Limited (UPRVUNL), Chhattisgarh Mineral Development Corporation (CMDC) and Maharashtra State Power Generation Company (Mahagenco) for captive mining of coal.
"A joint venture company, UCM Coal Company Ltd (UCM), has been formed by UPRVUNL, CMDC and Mahagenco
for development and mining of the Chendipada coal block," the company said, adding that the JV company had invited global bids to develop the reserves. Financial details of the deal could not be immediately ascertained. As part of the deal, Adani will undertake development and operation of the coal block, it said.
"(The work) includes land acquisition, R&R, preparation of
mine plan, approvals and clearances, coal mining, setting up of coal washery, establish railway siding and deliver washed coal to end-users at the designated power stations in UP, Chhattisgarh and Maharashtra," the statement added.
Adani is also required to set-up a power generation project of about 2000-MW capacity as part of the deal with UCM. Adani will hold an 89 percent stake in the power project, while the remaining will stay with the PSU consortium.
Adani Enterprises, which is the largest coal importer in India, is expanding its domestic base aggressively through the MDO business model.
"In the recent past, Adani group has already won competitive bidding tenders as MDO for total mining capacity of 70 mtpa of Mahaguj Collieries, Rajasthan Rajya Vidyut Utpadan Nigam and Chhattisgarh State Power Generation Co for various coal blocks in Orissa and Chhattisgarh," it added.
Adani Enterprises further said that with the latest deal, it will have 110 mtpa of coal mining contracts in India, "which will make it one of the largest mining companies in the private sector."
Adani bags coal block developmentrights in Orissa
Coal Insights Bureau
Gautam AdaniChairman, Adani Group
COAL INSIGHTS 50 NOvember 2010
CORpORATE
High voltage transformer from Crompton GreavesCoal Insights Bureau
Crompton Greaves Limited, part of the $4-billion Avantha Group, has despatched their first 1200 kV Capacitive Voltage Transformer (CVT) to the UHV
research station of Power Grid at Bina, Madhya Pradesh, from its Nasik switchgear plant.
This is the first Indian product, conceived, designed and successfully developed indigenously, as per a company statement.
Development of this system is expected to go a long way in tackling the ever growing power demand, which is expected to be over 400 GW by 2020.
Although many countries like USSR, Japan, America and Italy have made great progress in the research of 1200 kV ultra high voltage AC transmission system, only China has recently established the commercial 1100 kV system successfully.
The need for bulk transfer at ultra high voltage levels
in India in the coming years is beyond doubt. The task, spearheaded by Power Grid Corporation of India Ltd (PGCIL), involves establishing a research station with an experimental 1200 kV transmission line (1 km line at Bina in Madhya Pradesh) to study the performance of the various equipment, environmental effects and operational difficulties and develop the commercial lines in due course.
However the real challenge was to develop the first of its kind UHV products indigenously. Crompton Greaves will also develop a 1200 kV, 333 MVA power transformer and a 1200 kV surge arrester.
The company manufactured the 1200 kV system at S1 division, Nasik and tested for its performance characteristics at the copany’s EHV laboratory at Nasik and also at Central Power Research Institute, Hyderabad.
The managing director of the company, S.M. Trehan, has said: “Leading edge technology and World class manufacturing are the two driving forces with which CGL is forging ahead to be a world leader in the global T&D arena.
This successful development of 1200 kV CVT is a milestone in our endeavour”. The company will also soon deliver the other two products which are at an advanced stage of development.
COAL INSIGHTS 51 NOvember 2010
CORpORATE
State-owned Oil and Natural Gas Corporation (ONGC) Limited has been ranked the world's top oil and gas exploration and production (E&P) firm by global energy
research agency Platts. ONGC was last year placed at the third position in the pure
E&P category, behind Encana of Canada and China National Offshore Oil Corporation (CNOOC) of China. CNOOC was ranked second in the list for 2010.
"In the pure E&P category, ONGC has achieved the distinction of numero uno ranking not only in Asia, but even on a global scale," Platts said in a statement.
In the overall Platts Top 250 Global Energy Company Rankings that rated world's leading oil and gas, power and coal firms, ONGC climbed to the 18th slot from 26th position in 2009 rankings.
"This is the highest ever ranking of ONGC in the list of Platts Top 250, ahead of global leaders like Cooco Phillips, Statoil, CNOOC, BG and others," ONGC said. Under the stewardship of R.S. Sharma, ONGC has steadily improved its fortunes during the past four years.
With revenues of $22 billion, ONGC reported a profit of $4.24 billion in 2009-10, which forms the basis for the Platts rankings. It had assets worth $33.37 billion.
Under Sharma, ONGC has been able to arrest decline in output from its ageing fields through innovative use of technology and has set the floor for reversing the declining trend of the past by fast-track development of new and marginal fields.
Sharma will retire from the positions of chairman and managing director of ONGC on January 31, 2011, but the initiatives taken under him will see the company's oil production rise to 28 million tons (mt) in 2013-14, from the current llevel of over 25 mt.
Natural gas production is slated to rise to over 100 million standard cubic meters per day (mmscmd) by 2014-15, from the current 58.86 mmscmd. Platts also ranked ONGC as the fastest growing company in Asia in the E&P sector.
The global list headed by ExxonMobil Corp of the US, had billionaire Mukesh Ambani-run Reliance Industries at the 13th position, Platts said. Reliance had assets worth $55.94 billion and revenues of $43.63 billion. It had a profit of $5.24 billion.
Embattled British energy giant BP Plc was placed second, ahead of Gazprom OAO of Russia, Petrobras Brasileiro of Brazil, Total SA of France, E.On AG of Germany, Petrochina Co, China Petroleum, Chevron Corp of US and Royal Dutch Shell.
Meanwhile, the government formally conferred the
'Maharatna' status to flagship explorer ONGC on November 16. The move will substantially enhance their autonomy and operational flexibility as well as act as a booster when the company shortly approaches the market for a further stake sale.
Conferring the Maharatna certificates, heavy industry minister, Vilasrao Deshmukh, stressed the need for a robust public sector and specially mentioned ONGC as an example for others to emulate. "Best practices of ONGC and ONGC Videsh are worth emulating by others," he remarked, while handing over the certificates to company chiefs.
The Maharatna status will allow these entities to decide on investments up to `5000 crore in one project. The Maharatna status is granted to listed Navaratna companies with an average annual turnover of more than `25,000 crore, net profit of `5000 crore and net worth of `15,000 crore during the past three years.
Analysts said the enhanced autonomy would boost investor sentiment. The analysts also said greater operational flexibility will allow these companies to become world-class and compete in the international arena.
The state-run oil major is likely to divest 5 percent of its equity stake by March 2011 through a follow-on public offer (FPO), according to top officials.
The company is doing a valuation of underlying reserves. Post-disinvestment, the government's holding in the country's first 'Maharatna' company will be 69.14 percent from the present 74.14 percent.
The company would not raise fresh equity, officials said, as its joint venture partners were raising debt from the market, so that there is no need for the company to go to the market.
The company offered bonus issue in the ratio of 1:2, that is, one share for every two shares, in 2006 and gave 5 percent discount when it went public in 2004 to retail investors and employees.
ONGC ranked world’s top oil companyCoal Insights Bureau

COAL INSIGHTS 52 NOvember 2010
LOgIsTICs
Dry bulk freight rates which had witnessed a lot of fluctuations throughout October, continued to display a similar trend in the initial week of November as well.
Although demand for iron ore and coal did pull up rates to a great extent in the end of October, yet a few days later, fall in Chinese demand for ore and dearth of cargoes to be shipped pulled down the rates.
Rates for shipping iron ore in the major routes continued to decline even in the middle of the month, as demand from China weakened and excess supply of vessels weighed down on the market. While rates in the Capesize segment felt most of the impact, the Panamax segment was slightly better off due to improving thermal coal movement ahead of the winter.
The occasional improvement in rates on some days has largely been due to China’s restocking of resources while on the other hand, the approaching winter would mean more demand for thermal coal from this country. Vale had booked a number of vessels during the end of October when rates for shipping iron ore in the Tubarão to Qingdao route softened to $30.35 per ton, while in the Western Australia to Qingdao route, the rates were around $12 per ton. However, activity in the Pacific basin has continued at a good pace, riding on the back of activity from the major mining companies.
Nevertheless, Indian iron ore exports recovered and a surprising number of vessels were chartered. A total of 16 vessels were chartered to haul Indian iron ore around the middle of November. However, there was a build-up in Capesize availability and less chartering activity due to slower Chinese ore imports, which were negatively affecting Capesize rates.
Another factor which could seriously affect the dry bulk market in the coming weeks and months is the looming Chinese coal shortage. China is expecting a moderate shortage
of thermal coal in the upcoming months, with coal supplies likely to be extremely tight in January 2011. Chinese coal demand normally peaks in January due to cold temperatures and a seasonal low in hydropower output. Chinese electricity consumption has declined as the government intended - but going forward, consumption is likely to increase again as the nation prepares for the winter season.
Chinese coal imports will set new records in the upcoming months. Leading market insiders’ conservative estimates anticipate that Chinese coal imports will total about 16.75 million tons (mt) in November and 17.25 mt in December.
Around mid-October, demand for iron ore and thermal coal improved with China resuming its restocking activities after the end of the National Day Holidays. However, the occasional weakness in rates during some weeks of the month has been due to varying chartering activities by the major iron ore producers. At the end of the month, freight rates in the Capesize segment improved as compared to the beginning of the month.
Tex report data has revealed that spot freight rates for Capesize vessels in the Brazil to China route have weakened, although the change has been very volatile. For transporting 1,60,000 tons of iron ore from Tubarão, Brazil to Qingdao, China, the freight rate is $30 per ton for a laycan scheduled for November 20 to 30. Last month, however, for transporting the same quantity of material from Tubarao, Brazil to Qingdao, China, the freight rate was fixed at more than $31 per ton for a laycan scheduled for late Novemebr.
Rates in the Western Australia to China route have also behaved in a similar fashion. According to the Tex Report, BHP Billiton has chartered a vessel to ship 1,70,000 tons of iron ore from Port Hedland, Western Australia to Qingdao, China at $11.50 per ton for a laycan scheduled for November 28 to December 7. Earlier, for transporting 1,70,000 tons of iron ore from Port Hedland, Western Australia to Qingdao, China, the freight rate had been fixed at $12.25 per ton for a laycan scheduled for November 11 to 20.
The improvement in rates in the Capesize segment towards the end of October was due to China restocking its resources of both iron ore and coal before the approaching winter, which would mean more demand for thermal coal from this country. Besides, iron ore inventory in the country is presently low and this would result in China importing a lot of iron ore for the fourth quarter.
As per market sources, rates in the South America to China route climbed steadily. Around the end of October, Vale booked a number of vessels which saw rates in the Tubarão to Qingdao route touch $30.35 per ton, while in the Western Australia to Qingdao route, the rates were around $12 per ton. Another factor which would impact rates would be domestic
Freight rates tend to fluctuateSarbani Haldar
Baltic Exchange Index
Source: Insights Research
COAL INSIGHTS 53 NOvember 2010
LOgIsTICs
rates of iron ore which are presently high, thereby making imports favourable. Riding on the robust improvement in demand from China around the middle of the month, the average Capesize rates nearly touched the $45,000 per day level
Demand for both iron ore and thermal coal is likely to witness robust growth in the coming months as China starts restocking. While in India, with Karnataka banning iron ore exports, the supply for high grade ore is tight at the moment which would pull up rates, the forecast of a cold winter in China would see more demand for thermal coal, specially keeping in mind the recent electricity crunch that the country has witnessed.
However, the new building vessels which are coming on stream in the coming months would continue to be a pain point for this segment in the coming days.
Baltic Dry IndexThe volatility in freight rates also reflected in the way the major indices moved throughout October. The initial improvement in freight rates gradually peaked around the middle of the month with the strongest gains coming in from the Capesize segment. Although at the end of the month, the sudden disappearance of major iron ore producers from the chartering scene brought about some weakness in the market, yet this segment managed to end the month on a higher note since the beginning.
The Baltic Dry Index (BDI) which began the month on 2452 points on October 1 improved to 2769 points on October 14. However, around the end of the month, with rates cooling down, it ended the month on 2648 points on November 1, thereby displaying a 7.9 percent improvement month-on-month. However, it later recorded 2313 points on November 12.
The Baltic Capesize Index (BCI) which began the month on 3419 points on October 1 peaked to 4461 points in October 27. However, it declined later to 4231 points on November 1 displaying more than 30 percent month-on-month improvement. The BCI later recorded 3612 points on November 12.
However, the Baltic Supramax Index (BSI) registered a 6 percent month-on-month decline. Beginning the month on 1843 points on October 1, it improved to 1905 points on October 12 but declined later on to end the month on 1730 points on November 1. The BSI declined further to 1516 points on November 12.
In comparison to this, the Baltic Panamax Index (BPI) went through the strongest fluctuations. After beginning on 2412 points on October 1, it fluctuated strongly and touched 2461 points on October 27. It later ended the month on 2371 points on November 1, thereby declining by more than 1 percent month-on-month. However, it later touched 2365 points on November 12.

COAL INSIGHTS 54 NOvember 2010
LOgIsTICs
Iron ore volumes handled by the 12 major ports of the country continued to dip in line with the previous month. Together, the ports recorded a 14.49 percent decline in
cargo handled, as they moved 42.83 mt of cargo as compared to 50.09 mt moved in the first seven months of the previous year.
During October alone, the ports moved 6.81 mt of iron ore. Earlier, for April to September 2010, the major ports of the country moved 36.02 mt of iron ore traffic. It is to be noted here that over the past few months, the iron ore traffic through the major ports has been on a declining mode and this month was no exception. In the month of September, the iron ore traffic volumes declined by more than 14 percent to 4.52 mt. In April to August 2010, the total iron ore volume moved by the ports amounted to 31.05 mt as compared to the corresponding period of the previous year.
The country’s 12 major ports registered a robust growth in coking coal movement in the first seven months of the present year. Going by the latest data published by the Indian Ports Association (IPA), the 12 major ports of the country witnessed a 10.44 percent improvement in coking coal traffic for the period April to October 2010 as compared to the corresponding period a year ago.
Together, the 12 major ports moved 17.27 million tons (mt) of coking coal during the first seven months of 2010. In terms of volumes, too, the coking coal movement recorded a month-on-month improvement of 2.39 mt during April to September 2010.
Interestingly the Kolkata port which has seen a significant drop in its cargo volumes for more than a year now, recorded growth in its cocking coal volumes for the said period. The Haldia Dock Complex recorded more than 5 percent improvement in its coking coal volumes during the first seven months of the present year, as it handled 3.7 mt of coking coal
as compared to 3.5 mt handled during the same time a year ago. The Kolkata Port, too, has handled 0.7 mt of coking coal during the period.
The Paradip Port witnessed more than 38 percent growth in its coking coal volumes as it handled 3.48 mt of cargo during April to October 2010 as compared to 2.51 mt handled during the first seven months of the previous year.
The Vizag Port too has seen 10 percent improvement in its coking coal volumes during April to October 2010 as it handled 5.01 mt of coking coal as compared to 4.55 mt handled by it during the same period a year ago. During the same period, the New Mangalore port regsitered a 33 percent improvement in its coking coal volumes during the first seven months of 2010 as compared to the same period a year ago.
The data revealed that thermal coal movement through the ports declined by 2.94 percent to 24.56 mt during April to October 2010 as compared to the same period a year ago. However, the extent of decline has been arrested to a great extent and in terms of total volume, there has been a growth of 3.9 mt of thermal coal during the April to September 2010 period.
On the whole, total traffic movement through the 12 major ports improved by 0.47 percent during April to October 2010 as compared to the same period a year ago. The 12 major ports handled 316.10 mt of cargo during this period as compared to 314.63 mt handled by it during the same period a year ago. During October alone, the ports handled 44.80 mt of traffic. Earlier, the IPA data showed that the major ports of the country moved 271.295 mt of traffic as compared to 267.986 mt moved by them during the same period a year ago. Traffic volumes through the ports, too, marginally improved during September 2010, when the 12 major ports moved 44.383 mt of cargo. In August 2010, the 12 major ports had handled 42.827 mt of cargo.
Container volumes during the first seven months of 2010 improved 12.62 percent to 64.06 mt as compared to 56.88 mt moved during April to October 2009. However, the other cargo movement through the major ports declined to 53.4 mt as compared to 55.50 mt handled during the same period a year ago.
In terms of volumes moved by the port, the Cochin port recorded the strongest improvement of 14.27 percent to 103.80 mt of cargo while the New Mangalore port recorded a 13.42 percent dip in its cargo volumes in the first seven months of 2010, as it moved 18.0 mt of cargo as compared to 20.79 mt moved during the same period a year ago. Interestingly, the Kolkata port, which has been in the red for some time, has just managed to overcome its decline in cargo movement as it moved nearly the same volumes during the first seven months of this year as compared to the first seven months of the previous year.
Iron ore traffic declines 14.49%Sarbani Haldar
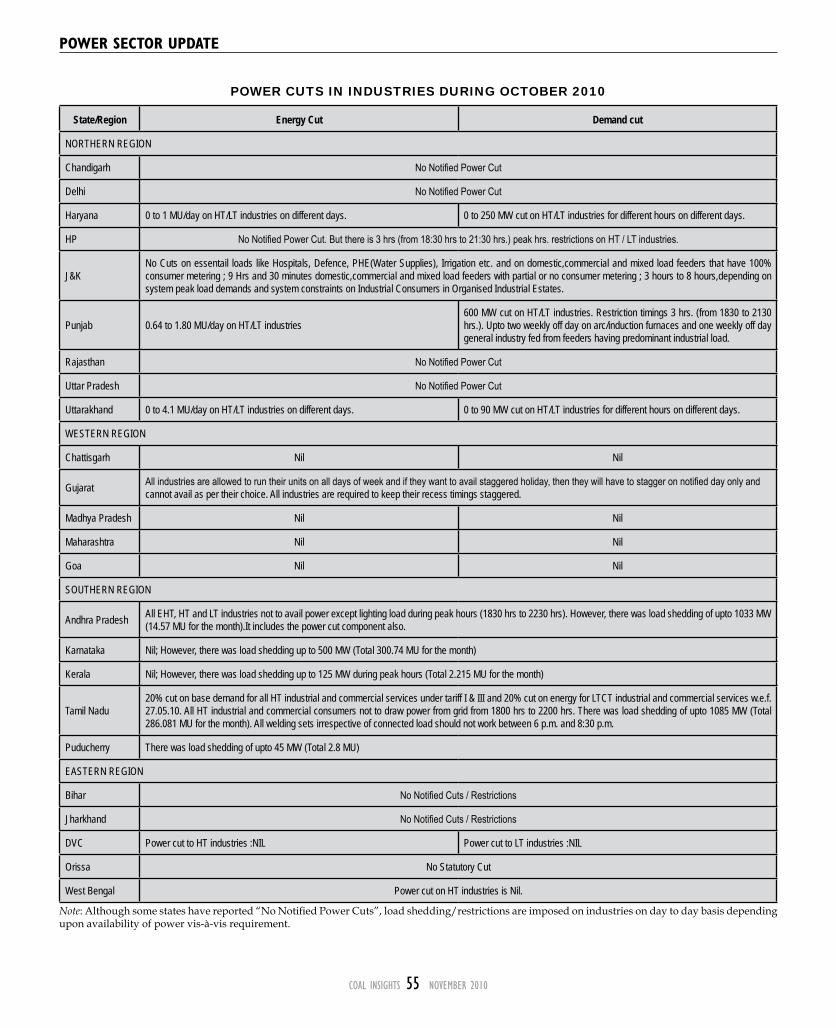
COAL INSIGHTS 55 NOvember 2010
POWER CUTS IN INDUSTRIES DURING OCTOBER 2010
State/Region Energy Cut Demand cut
NORTHERN REGION
Chandigarh No Notified Power Cut
Delhi No Notified Power Cut
Haryana 0 to 1 MU/day on HT/LT industries on different days. 0 to 250 MW cut on HT/LT industries for different hours on different days.
HP No Notified Power Cut. But there is 3 hrs (from 18:30 hrs to 21:30 hrs.) peak hrs. restrictions on HT / LT industries.
J&KNo Cuts on essentail loads like Hospitals, Defence, PHE(Water Supplies), Irrigation etc. and on domestic,commercial and mixed load feeders that have 100% consumer metering ; 9 Hrs and 30 minutes domestic,commercial and mixed load feeders with partial or no consumer metering ; 3 hours to 8 hours,depending on system peak load demands and system constraints on Industrial Consumers in Organised Industrial Estates.
Punjab 0.64 to 1.80 MU/day on HT/LT industries600 MW cut on HT/LT industries. Restriction timings 3 hrs. (from 1830 to 2130 hrs.). Upto two weekly off day on arc/induction furnaces and one weekly off day general industry fed from feeders having predominant industrial load.
Rajasthan No Notified Power Cut
Uttar Pradesh No Notified Power Cut
Uttarakhand 0 to 4.1 MU/day on HT/LT industries on different days. 0 to 90 MW cut on HT/LT industries for different hours on different days.
WESTERN REGION
Chattisgarh Nil Nil
Gujarat All industries are allowed to run their units on all days of week and if they want to avail staggered holiday, then they will have to stagger on notified day only and cannot avail as per their choice. All industries are required to keep their recess timings staggered.
Madhya Pradesh Nil Nil
Maharashtra Nil Nil
Goa Nil Nil
SOUTHERN REGION
Andhra Pradesh All EHT, HT and LT industries not to avail power except lighting load during peak hours (1830 hrs to 2230 hrs). However, there was load shedding of upto 1033 MW (14.57 MU for the month).It includes the power cut component also.
Karnataka Nil; However, there was load shedding up to 500 MW (Total 300.74 MU for the month)
Kerala Nil; However, there was load shedding up to 125 MW during peak hours (Total 2.215 MU for the month)
Tamil Nadu20% cut on base demand for all HT industrial and commercial services under tariff I & III and 20% cut on energy for LTCT industrial and commercial services w.e.f. 27.05.10. All HT industrial and commercial consumers not to draw power from grid from 1800 hrs to 2200 hrs. There was load shedding of upto 1085 MW (Total 286.081 MU for the month). All welding sets irrespective of connected load should not work between 6 p.m. and 8:30 p.m.
Puducherry There was load shedding of upto 45 MW (Total 2.8 MU)
EASTERN REGION
Bihar No Notified Cuts / Restrictions
Jharkhand No Notified Cuts / Restrictions
DVC Power cut to HT industries :NIL Power cut to LT industries :NIL
Orissa No Statutory Cut
West Bengal Power cut on HT industries is Nil.
Note: Although some states have reported “No Notified Power Cuts”, load shedding/restrictions are imposed on industries on day to day basis depending upon availability of power vis-à-vis requirement.
pOwER sECTOR upDATE
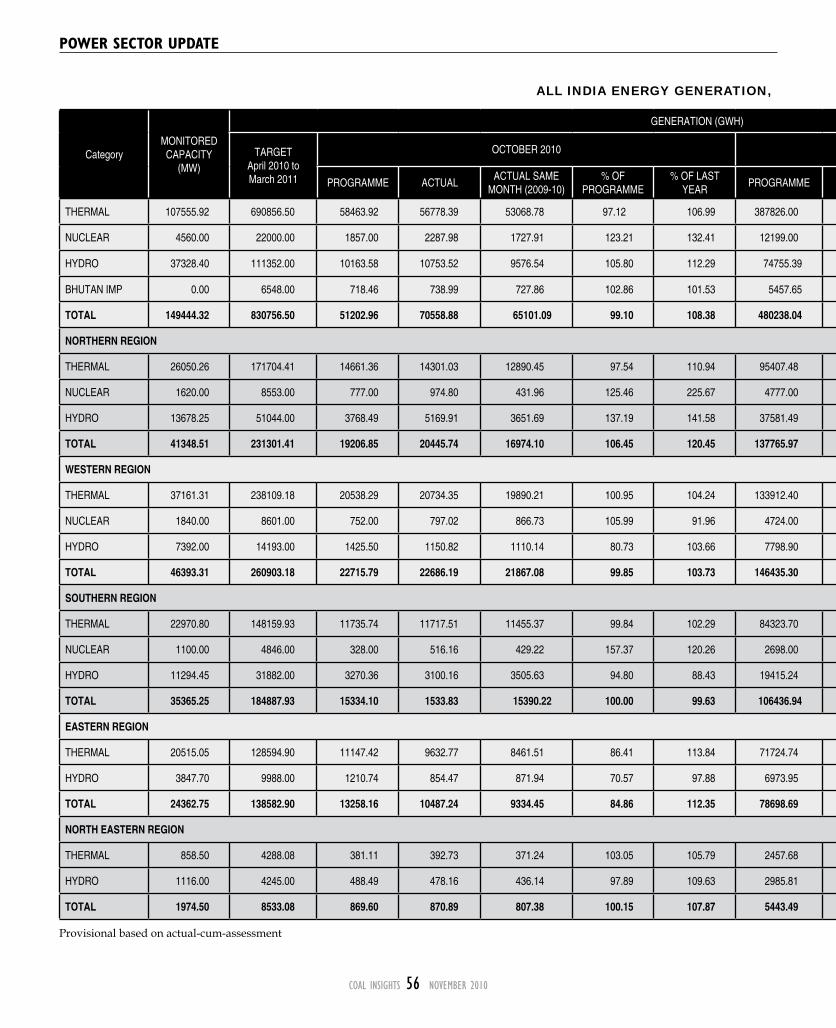
COAL INSIGHTS 56 NOvember 2010
Provisional based on actual-cum-assessment
ALL INDIA ENERGY GENERATION,
THERMAL 107555.92 690856.50 58463.92 56778.39 53068.78 97.12 106.99 387826.00 374229.03 361997.76 96.49 103.38 70.48 74.84 75.23 71.43 72.49 75.67
NUCLEAR 4560.00 22000.00 1857.00 2287.98 1727.91 123.21 132.41 12199.00 13167.17 10544.09 107.94 124.88 55.96 67.44 56.37 53.26 56.22 49.83
HYDRO 37328.40 111352.00 10163.58 10753.52 9576.54 105.80 112.29 74755.39 76077.43 70175.56 101.77 108.41
BHUTAN IMP 0.00 6548.00 718.46 738.99 727.86 102.86 101.53 5457.65 4847.61 4617.75 88.82 104.98
TOTAL 149444.32 830756.50 51202.96 70558.88 65101.09 99.10 108.38 480238.04 468321.24 447335.16 97.52 104.69
NORTHERN REGION
THERMAL 26050.26 171704.41 14661.36 14301.03 12890.45 97.54 110.94 95407.48 92500.56 91933.49 96.95 100.62 71.46 79.17 77.70 70.75 76.14 81.69
NUCLEAR 1620.00 8553.00 777.00 974.80 431.96 125.46 225.67 4777.00 4685.23 2013.70 98.08 232.67 68.71 80.88 49.20 61.19 56.31 33.23
HYDRO 13678.25 51044.00 3768.49 5169.91 3651.69 137.19 141.58 37581.49 40717.85 36485.03 108.35 111.60
TOTAL 41348.51 231301.41 19206.85 20445.74 16974.10 106.45 120.45 137765.97 137903.64 130432.22 100.10 105.73
WESTERN REGION
THERMAL 37161.31 238109.18 20538.29 20734.35 19890.21 100.95 104.24 133912.40 132739.02 126430.37 99.12 104.99 74.02 76.69 80.38 71.73 71.78 76.54
NUCLEAR 1840.00 8601.00 752.00 797.02 866.73 105.99 91.96 4724.00 5329.79 5262.43 112.82 101.28 54.93 58.22 63.31 49.99 56.40 55.69
HYDRO 7392.00 14193.00 1425.50 1150.82 1110.14 80.73 103.66 7798.90 8793.13 8036.49 112.75 109.42
TOTAL 46393.31 260903.18 22715.79 22686.19 21867.08 99.85 103.73 146435.30 146861.94 139729.29 100.29 105.10
SOUTHERN REGION
THERMAL 22970.80 148159.93 11735.74 11717.51 11455.37 99.84 102.29 84323.70 82670.89 81754.14 98.04 101.12 80.50 73.97 79.97 77.48 78.06 82.88
NUCLEAR 1100.00 4846.00 328.00 516.16 429.22 157.37 120.26 2698.00 3152.15 3267.96 116.83 96.46 40.08 63.07 52.45 47.76 55.79 57.84
HYDRO 11294.45 31882.00 3270.36 3100.16 3505.63 94.80 88.43 19415.24 17505.42 16960.28 90.16 103.21
TOTAL 35365.25 184887.93 15334.10 1533.83 15390.22 100.00 99.63 106436.94 103328.46 101982.38 97.08 101.32
EASTERN REGION
THERMAL 20515.05 128594.90 11147.42 9632.77 8461.51 86.41 113.84 71724.74 63872.81 59390.97 89.05 107.55 64.98 68.38 61.60 67.10 65.17 62.58
HYDRO 3847.70 9988.00 1210.74 854.47 871.94 70.57 97.88 6973.95 6129.52 6175.97 87.89 99.25
TOTAL 24362.75 138582.90 13258.16 10487.24 9334.45 84.86 112.35 78698.69 70002.33 65566.94 88.95 106.76
NORTH EASTERN REGION
THERMAL 858.50 4288.08 381.11 392.73 371.24 103.05 105.79 2457.68 2445.75 2488.79 99.51 98.27 0.00 0.00 0.00 0.00 0.00 0.00
HYDRO 1116.00 4245.00 488.49 478.16 436.14 97.89 109.63 2985.81 2931.51 2517.79 98.18 116.43
TOTAL 1974.50 8533.08 869.60 870.89 807.38 100.15 107.87 5443.49 5377.26 5006.58 98.78 107.40
pOwER sECTOR upDATE
CategoryMONITORED CAPACITY
(MW)
GENERATION (GWH) PLANT LOAD FACTOR %
TARGETApril 2010 to March 2011
OCTOBER 2010 APRIL 2010 – OCTOBER 2010 OCTOBER 2010 APRIL 2010 - OCTOBER 2010
PROGRAMME ACTUALACTUAL SAME
MONTH (2009-10) % OF
PROGRAMME% OF LAST
YEARPROGRAMME ACTUAL
ACTUAL SAME PERIOD (2009-10)
% OF PROGRAMME
% OF LAST YEAR
PROGRAMME ACTUALACTUAL SAME
MONTH (2009-10) PROGRAMME ACTUAL
ACTUAL SAME PERIOD (2009-10)
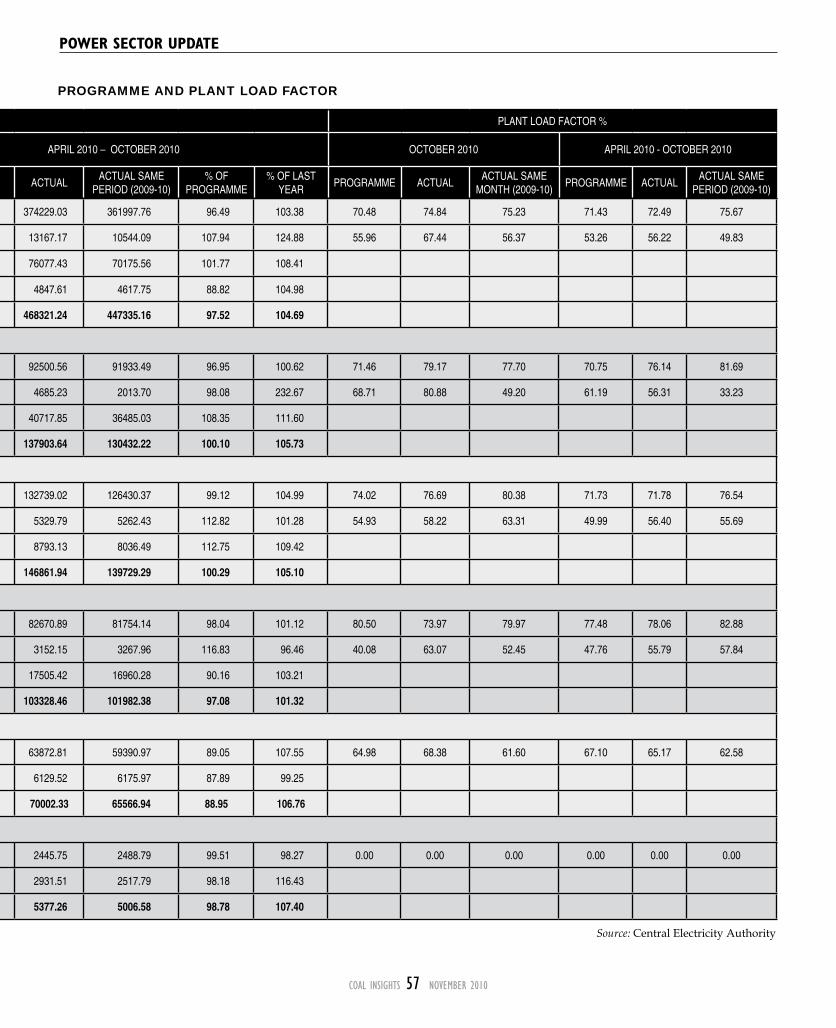
COAL INSIGHTS 57 NOvember 2010
THERMAL 107555.92 690856.50 58463.92 56778.39 53068.78 97.12 106.99 387826.00 374229.03 361997.76 96.49 103.38 70.48 74.84 75.23 71.43 72.49 75.67
NUCLEAR 4560.00 22000.00 1857.00 2287.98 1727.91 123.21 132.41 12199.00 13167.17 10544.09 107.94 124.88 55.96 67.44 56.37 53.26 56.22 49.83
HYDRO 37328.40 111352.00 10163.58 10753.52 9576.54 105.80 112.29 74755.39 76077.43 70175.56 101.77 108.41
BHUTAN IMP 0.00 6548.00 718.46 738.99 727.86 102.86 101.53 5457.65 4847.61 4617.75 88.82 104.98
TOTAL 149444.32 830756.50 51202.96 70558.88 65101.09 99.10 108.38 480238.04 468321.24 447335.16 97.52 104.69
NORTHERN REGION
THERMAL 26050.26 171704.41 14661.36 14301.03 12890.45 97.54 110.94 95407.48 92500.56 91933.49 96.95 100.62 71.46 79.17 77.70 70.75 76.14 81.69
NUCLEAR 1620.00 8553.00 777.00 974.80 431.96 125.46 225.67 4777.00 4685.23 2013.70 98.08 232.67 68.71 80.88 49.20 61.19 56.31 33.23
HYDRO 13678.25 51044.00 3768.49 5169.91 3651.69 137.19 141.58 37581.49 40717.85 36485.03 108.35 111.60
TOTAL 41348.51 231301.41 19206.85 20445.74 16974.10 106.45 120.45 137765.97 137903.64 130432.22 100.10 105.73
WESTERN REGION
THERMAL 37161.31 238109.18 20538.29 20734.35 19890.21 100.95 104.24 133912.40 132739.02 126430.37 99.12 104.99 74.02 76.69 80.38 71.73 71.78 76.54
NUCLEAR 1840.00 8601.00 752.00 797.02 866.73 105.99 91.96 4724.00 5329.79 5262.43 112.82 101.28 54.93 58.22 63.31 49.99 56.40 55.69
HYDRO 7392.00 14193.00 1425.50 1150.82 1110.14 80.73 103.66 7798.90 8793.13 8036.49 112.75 109.42
TOTAL 46393.31 260903.18 22715.79 22686.19 21867.08 99.85 103.73 146435.30 146861.94 139729.29 100.29 105.10
SOUTHERN REGION
THERMAL 22970.80 148159.93 11735.74 11717.51 11455.37 99.84 102.29 84323.70 82670.89 81754.14 98.04 101.12 80.50 73.97 79.97 77.48 78.06 82.88
NUCLEAR 1100.00 4846.00 328.00 516.16 429.22 157.37 120.26 2698.00 3152.15 3267.96 116.83 96.46 40.08 63.07 52.45 47.76 55.79 57.84
HYDRO 11294.45 31882.00 3270.36 3100.16 3505.63 94.80 88.43 19415.24 17505.42 16960.28 90.16 103.21
TOTAL 35365.25 184887.93 15334.10 1533.83 15390.22 100.00 99.63 106436.94 103328.46 101982.38 97.08 101.32
EASTERN REGION
THERMAL 20515.05 128594.90 11147.42 9632.77 8461.51 86.41 113.84 71724.74 63872.81 59390.97 89.05 107.55 64.98 68.38 61.60 67.10 65.17 62.58
HYDRO 3847.70 9988.00 1210.74 854.47 871.94 70.57 97.88 6973.95 6129.52 6175.97 87.89 99.25
TOTAL 24362.75 138582.90 13258.16 10487.24 9334.45 84.86 112.35 78698.69 70002.33 65566.94 88.95 106.76
NORTH EASTERN REGION
THERMAL 858.50 4288.08 381.11 392.73 371.24 103.05 105.79 2457.68 2445.75 2488.79 99.51 98.27 0.00 0.00 0.00 0.00 0.00 0.00
HYDRO 1116.00 4245.00 488.49 478.16 436.14 97.89 109.63 2985.81 2931.51 2517.79 98.18 116.43
TOTAL 1974.50 8533.08 869.60 870.89 807.38 100.15 107.87 5443.49 5377.26 5006.58 98.78 107.40
CategoryMONITORED CAPACITY
(MW)
GENERATION (GWH) PLANT LOAD FACTOR %
TARGETApril 2010 to March 2011
OCTOBER 2010 APRIL 2010 – OCTOBER 2010 OCTOBER 2010 APRIL 2010 - OCTOBER 2010
PROGRAMME ACTUALACTUAL SAME
MONTH (2009-10) % OF
PROGRAMME% OF LAST
YEARPROGRAMME ACTUAL
ACTUAL SAME PERIOD (2009-10)
% OF PROGRAMME
% OF LAST YEAR
PROGRAMME ACTUALACTUAL SAME
MONTH (2009-10) PROGRAMME ACTUAL
ACTUAL SAME PERIOD (2009-10)
Source: Central Electricity Authority
PROGRAMME AND PLANT LOAD FACTOR
pOwER sECTOR upDATE
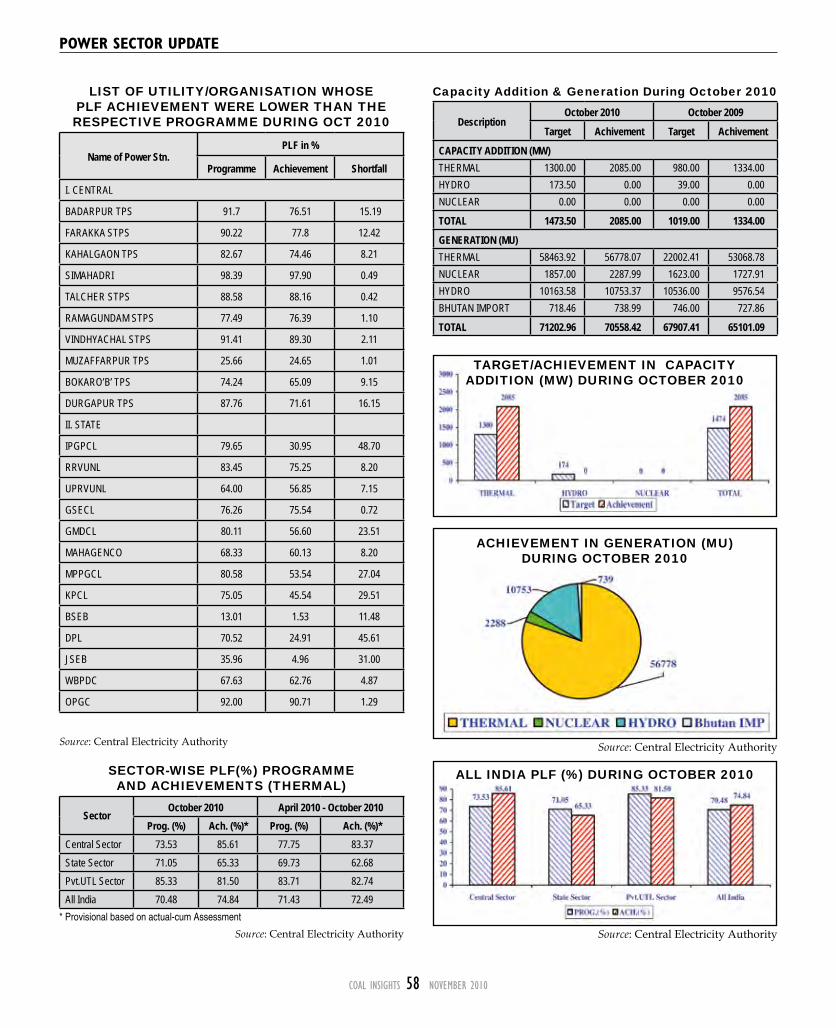
COAL INSIGHTS 58 NOvember 2010
pOwER sECTOR upDATE
SECTOR-WISE PLF(%) PROGRAMMEAND ACHIEVEMENTS (THERMAL)
Sector October 2010 April 2010 - October 2010
Prog. (%) Ach. (%)* Prog. (%) Ach. (%)* Central Sector 73.53 85.61 77.75 83.37State Sector 71.05 65.33 69.73 62.68Pvt.UTL Sector 85.33 81.50 83.71 82.74All India 70.48 74.84 71.43 72.49
* Provisional based on actual-cum Assessment
LIST OF UTILITY/ORGANISATION WHOSE PLF ACHIEVEMENT WERE LOWER THAN THE RESPECTIVE PROGRAMME DURING OCT 2010
Name of Power Stn. PLF in %
Programme Achievement Shortfall
I. CENTRAL
BADARPUR TPS 91.7 76.51 15.19
FARAKKA STPS 90.22 77.8 12.42
KAHALGAON TPS 82.67 74.46 8.21
SIMAHADRI 98.39 97.90 0.49
TALCHER STPS 88.58 88.16 0.42
RAMAGUNDAM STPS 77.49 76.39 1.10
VINDHYACHAL STPS 91.41 89.30 2.11
MUZAFFARPUR TPS 25.66 24.65 1.01
BOKARO’B’ TPS 74.24 65.09 9.15
DURGAPUR TPS 87.76 71.61 16.15
II. STATE
IPGPCL 79.65 30.95 48.70
RRVUNL 83.45 75.25 8.20
UPRVUNL 64.00 56.85 7.15
GSECL 76.26 75.54 0.72
GMDCL 80.11 56.60 23.51
MAHAGENCO 68.33 60.13 8.20
MPPGCL 80.58 53.54 27.04
KPCL 75.05 45.54 29.51
BSEB 13.01 1.53 11.48
DPL 70.52 24.91 45.61
JSEB 35.96 4.96 31.00
WBPDC 67.63 62.76 4.87
OPGC 92.00 90.71 1.29
Source: Central Electricity Authority
Source: Central Electricity Authority
ALL INDIA PLF (%) DURING OCTOBER 2010
Source: Central Electricity Authority
Capacity Addition & Generation During October 2010
Description October 2010 October 2009
Target Achivement Target Achivement
CAPACITY ADDITION (mW) THERMAL 1300.00 2085.00 980.00 1334.00HYDRO 173.50 0.00 39.00 0.00NUCLEAR 0.00 0.00 0.00 0.00
TOTAL 1473.50 2085.00 1019.00 1334.00
GENERATION (mU) THERMAL 58463.92 56778.07 22002.41 53068.78NUCLEAR 1857.00 2287.99 1623.00 1727.91HYDRO 10163.58 10753.37 10536.00 9576.54BHUTAN IMPORT 718.46 738.99 746.00 727.86
TOTAL 71202.96 70558.42 67907.41 65101.09
TARGET/ACHIEVEMENT IN CAPACITY ADDITION (MW) DURING OCTOBER 2010
Source: Central Electricity Authority
ACHIEVEMENT IN GENERATION (MU) DURING OCTOBER 2010

COAL INSIGHTS 59 NOvember 2010
pOwER sECTOR upDATE
CAPACITY ADDITION FOR OCTOBER 2010 AND APRIL 2010 - OCTOBER 2010 (MW)
Schemes Status of Schemes Target 2010-11October 2010 April 2010 - October 2010 Deviation
Target Achievement Target Achievement (+) / (-)
Thermal
Central 6015.00 500.00 500.00 2740.00 1615.00 -1125.00State 6549.20 500.00 850.00 3637.20 2121.00 -1516.20Pvt. 6191.00 300.00 735.00 4378.50 2833.00 -1545.50Total 18755.20 1300.00 2085.00 10755.70 6569.00 -4186.70
Hydro
Central 649.00 0.00 0.00 120.00 120.00 0.00State 356.00 39.00 0.00 262.00 139.00 -123.00Pvt. 461.00 134.50 0.00 376.00 192.00 -184.00Total 1466.00 173.50 0.00 758.00 451.00 -307.00
NuclearCentral 1220.00 0.00 0.00 0.00 0.00 0.00Total 1220.00 0.00 0.00 0.00 0.00 0.00
All India
Central 7884.00 500.00 500.00 2860.00 1735.00 -1125.00State 6905.20 539.00 850.00 3899.20 2260.00 -1639.20Pvt. 6652.00 434.50 735.00 4754.50 3025.00 -1729.50Total 21441.20 1473.50 2085.00 11513.70 7020.00 -4493.70
Source: Central Electricity Authority
CAPACITY ADDITION TARGET & ACHIEVEMENT (MW) APR 2010 - OCT 2010
Source: Central Electricity Authority Source: Central Electricity Authority
ALL INDIA ENERGY GENERATION DURINGAPR 2010 - OCT 2010
PROGRAMME AND ACHIEVEMEMT OF ENERGY GENERATION (MU)Gen. Sch. Target
(2010-11)October 2010 April 2010 - October 2010
Sector-Wise Programme Achievement* % Achieved Programme Achievement* % AchievedThermalCentral Sector 269999.11 22355.74 23502.31 105.13 153123.20 157479.70 102.85State Sector 317092.64 26926.88 23607.63 87.67 178055.96 153963.40 86.47Pvt.IPP Sector 76520.57 6707.63 7294.70 108.75 39896.36 46177.53 115.74Pvt.UTL Sector 27244.18 2473.67 2373.43 95.95 16750.48 16608.08 99.15Total 690856.50 58463.92 56778.07 97.12 387826.00 374228.71 96.49HydroCentral Sector 41642.00 3266.68 4196.38 128.46 30107.28 33579.21 111.53State Sector 63990.00 6455.52 6065.77 93.96 40466.76 38337.97 94.74Pvt.IPP Sector 4092.00 305.88 417.91 136.63 3243.45 3357.02 103.50Pvt.UTL Sector 1628.00 135.50 73.31 54.10 937.90 803.08 85.63Total 111352.00 10163.58 10753.37 105.80 74755.39 76077.28 101.77NuclearCentral Sector 22000.00 1857.00 2287.99 123.21 12199.00 13167.18 107.94Total 22000.00 1857.00 2287.99 123.21 12199.00 13167.18 107.94Bhutan Import 6548.00 718.46 738.99 102.86 5457.65 4847.61 88.82All IndiaCentral Sector 333641.11 27479.42 29986.68 109.12 195429.48 204226.09 104.50State Sector 381082.64 33382.40 29673.40 88.89 218522.72 192301.37 88.00Pvt. Sector 109484.75 9622.68 10159.35 105.58 60828.19 66945.71 110.06Total 830756.50 71202.96 70558.42 99.09 480238.04 468320.78 97.52
* Provisional based on actual-cum-Assesment Source: Central Electricity Authority
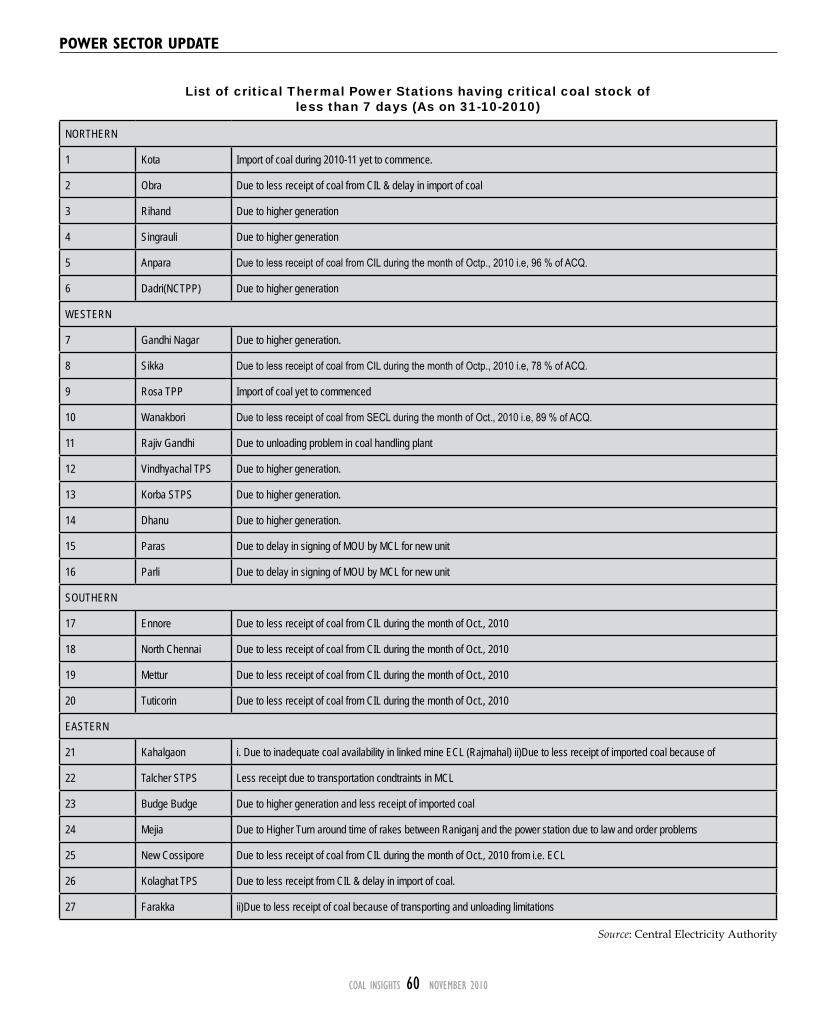
COAL INSIGHTS 60 NOvember 2010
Source: Central Electricity Authority
List of critical Thermal Power Stations having critical coal stock ofless than 7 days (As on 31-10-2010)
NORTHERN
1 Kota Import of coal during 2010-11 yet to commence.
2 Obra Due to less receipt of coal from CIL & delay in import of coal
3 Rihand Due to higher generation
4 Singrauli Due to higher generation
5 Anpara Due to less receipt of coal from CIL during the month of Octp., 2010 i.e, 96 % of ACQ.
6 Dadri(NCTPP) Due to higher generation
WESTERN
7 Gandhi Nagar Due to higher generation.
8 Sikka Due to less receipt of coal from CIL during the month of Octp., 2010 i.e, 78 % of ACQ.
9 Rosa TPP Import of coal yet to commenced
10 Wanakbori Due to less receipt of coal from SECL during the month of Oct., 2010 i.e, 89 % of ACQ.
11 Rajiv Gandhi Due to unloading problem in coal handling plant
12 Vindhyachal TPS Due to higher generation.
13 Korba STPS Due to higher generation.
14 Dhanu Due to higher generation.
15 Paras Due to delay in signing of MOU by MCL for new unit
16 Parli Due to delay in signing of MOU by MCL for new unit
SOUTHERN
17 Ennore Due to less receipt of coal from CIL during the month of Oct., 2010
18 North Chennai Due to less receipt of coal from CIL during the month of Oct., 2010
19 Mettur Due to less receipt of coal from CIL during the month of Oct., 2010
20 Tuticorin Due to less receipt of coal from CIL during the month of Oct., 2010
EASTERN
21 Kahalgaon i. Due to inadequate coal availability in linked mine ECL (Rajmahal) ii)Due to less receipt of imported coal because of
22 Talcher STPS Less receipt due to transportation condtraints in MCL
23 Budge Budge Due to higher generation and less receipt of imported coal
24 Mejia Due to Higher Turn around time of rakes between Raniganj and the power station due to law and order problems
25 New Cossipore Due to less receipt of coal from CIL during the month of Oct., 2010 from i.e. ECL
26 Kolaghat TPS Due to less receipt from CIL & delay in import of coal.
27 Farakka ii)Due to less receipt of coal because of transporting and unloading limitations
pOwER sECTOR upDATE

COAL INSIGHTS 61 NOvember 2010
pOwER sECTOR upDATE
POWER SUPPLY POSITION (Provisional)(Figures in net MW)
State / System / Region
OCTOBER 2010 APRIL 2010 - OCTOBER 2010
Requirement Availability Surplus / Deficit (-) Requirement Availability Surplus / Deficit (-)
( mU ) ( mU ) ( mU ) ( % ) ( mU ) ( mU ) ( mU ) ( % )Chandigarh 120 120 0 0.0 981 981 0 0.0Delhi 2,101 2,099 -2 -0.1 17,163 17,107 -56 -0.3Haryana 3,194 3,076 -118 -3.7 21,211 19,803 -1,408 -6.6Himachal Pradesh 675 672 -3 -0.4 4,362 4,276 -86 -2.0Jammu & Kashmir 1,332 982 -350 -26.3 7,918 5,820 -2,098 -26.5Punjab 3,769 3,644 -125 -3.3 29,925 27,824 -2,101 -7.0Rajasthan 4,035 4,035 0 0.0 24,641 24,320 -321 -1.3Uttar Pradesh 6,524 5,826 -698 -10.7 45,190 37,846 -7,344 -16.3Uttarakhand 825 819 -6 -0.7 5,722 5,297 -425 -7.4Northern Region 22,575 21,273 -1,302 -5.8 157,113 143,274 -13,839 -8.8Chattisgarh 908 902 -6 -0.7 6,102 5,981 -121 -2.0Gujarat 7,163 6,674 -489 -6.8 41,368 38,927 -2,441 -5.9Madhya Pradesh 4,012 3,286 -726 -18.1 24,122 19,663 -4,459 -18.5Maharashtra 10,524 8,931 -1,593 -15.1 73,513 60,006 -13,507 -18.4Daman & Diu 190 172 -18 -9.5 1,246 1,155 -91 -7.3Dadar Nagar Haveli 360 358 -2 -0.6 2,543 2,539 -4 -0.2Goa 264 261 -3 -1.1 1,837 1,797 -40 -2.2Western Region 23,421 20,584 -2,837 -12.1 150,731 130,068 -20,663 -13.7Andhra Pradesh 6,690 6,651 -39 -0.6 45,926 43,792 -2,134 -4.6Karnataka 3,889 3,574 -315 -8.1 27,604 24,725 -2,879 -10.4Kerala 1,477 1,469 -8 -0.5 10,276 10,121 -155 -1.5Tamil Nadu 6,727 6,418 -309 -4.6 47,634 44,528 -3,106 -6.5Puducherry 189 185 -4 -2.1 1,287 1,208 -79 -6.1Lakshadweep # 2 2 0 0 14 14 0 0Southern Region 18,972 18,297 -675 -3.6 132,727 124,374 -8,353 -6.3Bihar 1,307 1,023 -284 -21.7 7,583 6,474 -1,109 -14.6DVC 1,295 1,294 -1 -0.1 9,631 8,705 -926 -9.6Jharkhand 516 515 -1 -0.2 3,508 3,413 -95 -2.7Orissa 1,883 1,881 -2 -0.1 13,200 13,136 -64 -0.5West Bengal 3,240 3,233 -7 -0.2 22,900 22,314 -586 -2.6Sikkim 32 32 0 0.0 193 193 0 0.0Andaman- Nicobar# 20 15 -5 -25 140 105 -35 -25.0Eastern Region 8,273 7,978 -295 -3.6 57,015 54,235 -2,780 -4.9Arunachal Pradesh 44 37 -7 -15.9 286 239 -47 -16.4Assam 506 473 -33 -6.5 3,329 3,064 -265 -8.0Manipur 49 44 -5 -10.2 324 285 -39 -12.0Meghalaya 156 141 -15 -9.6 887 749 -138 -15.6Mizoram 30 24 -6 -20.0 200 165 -35 -17.5Nagaland 52 45 -7 -13.5 349 306 -43 -12.3Tripura 84 78 -6 -7.1 549 480 -69 -12.6N. Eastern Region 921 842 -79 -8.6 5,924 5,288 -636 -10.7All India 74,162 68,974 -5,188 -7.0 503,510 457,239 -46,271 -9.2
# Lakshadweep and A & N Islands stand-alone systems, power supply position of these, does not form part of regional requiremene and availabilityNote: Both peak met and energy availability represent the net consumption (including the transmission losses) in the various States. Net export has been accounted for in the consumption of importing States. Source: Central Electricity Authority
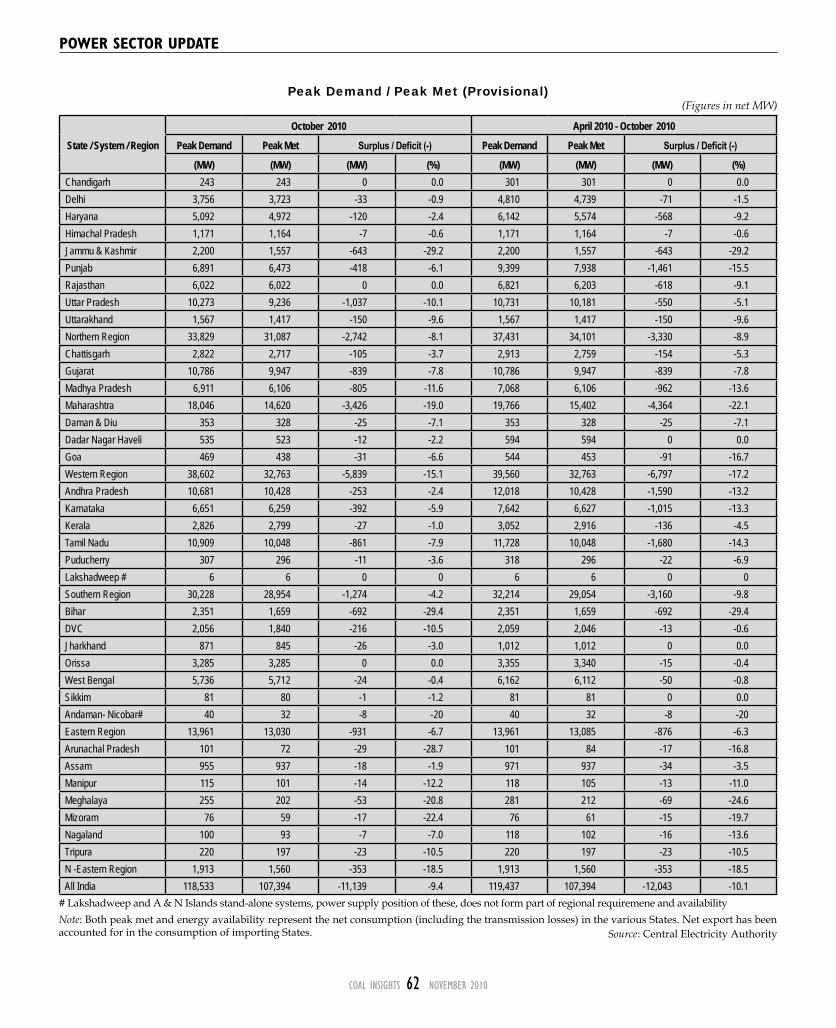
COAL INSIGHTS 62 NOvember 2010
pOwER sECTOR upDATE
Peak Demand / Peak Met (Provisional)(Figures in net MW)
State / System / Region
October 2010 April 2010 - October 2010
Peak Demand Peak met Surplus / Deficit (-) Peak Demand Peak met Surplus / Deficit (-)
(mW) (mW) (mW) (%) (mW) (mW) (mW) (%)Chandigarh 243 243 0 0.0 301 301 0 0.0Delhi 3,756 3,723 -33 -0.9 4,810 4,739 -71 -1.5Haryana 5,092 4,972 -120 -2.4 6,142 5,574 -568 -9.2Himachal Pradesh 1,171 1,164 -7 -0.6 1,171 1,164 -7 -0.6Jammu & Kashmir 2,200 1,557 -643 -29.2 2,200 1,557 -643 -29.2Punjab 6,891 6,473 -418 -6.1 9,399 7,938 -1,461 -15.5Rajasthan 6,022 6,022 0 0.0 6,821 6,203 -618 -9.1Uttar Pradesh 10,273 9,236 -1,037 -10.1 10,731 10,181 -550 -5.1Uttarakhand 1,567 1,417 -150 -9.6 1,567 1,417 -150 -9.6Northern Region 33,829 31,087 -2,742 -8.1 37,431 34,101 -3,330 -8.9Chattisgarh 2,822 2,717 -105 -3.7 2,913 2,759 -154 -5.3Gujarat 10,786 9,947 -839 -7.8 10,786 9,947 -839 -7.8Madhya Pradesh 6,911 6,106 -805 -11.6 7,068 6,106 -962 -13.6Maharashtra 18,046 14,620 -3,426 -19.0 19,766 15,402 -4,364 -22.1Daman & Diu 353 328 -25 -7.1 353 328 -25 -7.1Dadar Nagar Haveli 535 523 -12 -2.2 594 594 0 0.0Goa 469 438 -31 -6.6 544 453 -91 -16.7Western Region 38,602 32,763 -5,839 -15.1 39,560 32,763 -6,797 -17.2Andhra Pradesh 10,681 10,428 -253 -2.4 12,018 10,428 -1,590 -13.2Karnataka 6,651 6,259 -392 -5.9 7,642 6,627 -1,015 -13.3Kerala 2,826 2,799 -27 -1.0 3,052 2,916 -136 -4.5Tamil Nadu 10,909 10,048 -861 -7.9 11,728 10,048 -1,680 -14.3Puducherry 307 296 -11 -3.6 318 296 -22 -6.9Lakshadweep # 6 6 0 0 6 6 0 0Southern Region 30,228 28,954 -1,274 -4.2 32,214 29,054 -3,160 -9.8Bihar 2,351 1,659 -692 -29.4 2,351 1,659 -692 -29.4DVC 2,056 1,840 -216 -10.5 2,059 2,046 -13 -0.6Jharkhand 871 845 -26 -3.0 1,012 1,012 0 0.0Orissa 3,285 3,285 0 0.0 3,355 3,340 -15 -0.4West Bengal 5,736 5,712 -24 -0.4 6,162 6,112 -50 -0.8Sikkim 81 80 -1 -1.2 81 81 0 0.0Andaman- Nicobar# 40 32 -8 -20 40 32 -8 -20Eastern Region 13,961 13,030 -931 -6.7 13,961 13,085 -876 -6.3Arunachal Pradesh 101 72 -29 -28.7 101 84 -17 -16.8Assam 955 937 -18 -1.9 971 937 -34 -3.5Manipur 115 101 -14 -12.2 118 105 -13 -11.0Meghalaya 255 202 -53 -20.8 281 212 -69 -24.6Mizoram 76 59 -17 -22.4 76 61 -15 -19.7Nagaland 100 93 -7 -7.0 118 102 -16 -13.6Tripura 220 197 -23 -10.5 220 197 -23 -10.5N -Eastern Region 1,913 1,560 -353 -18.5 1,913 1,560 -353 -18.5All India 118,533 107,394 -11,139 -9.4 119,437 107,394 -12,043 -10.1
# Lakshadweep and A & N Islands stand-alone systems, power supply position of these, does not form part of regional requiremene and availabilityNote: Both peak met and energy availability represent the net consumption (including the transmission losses) in the various States. Net export has been accounted for in the consumption of importing States. Source: Central Electricity Authority

COAL INSIGHTS 63 NOvember 2010
POWER SUPPLY TO AGRICULTURAL SECTOR DURING OCTOBER 2010State Average Hours of Supply
NORTHERN REGIONChandigarh 24 hrs/day
–
Delhi 24 hrs/dayHaryana Three Phase Supply: 6.50 hrs/dayHP 24 hrs/dayJ&K –Punjab Three Phase Supply: 23.82 hrs/dayRajasthan Three Phase Supply: 6.45 hrs/dayUttar Pradesh Three Phase Supply: 09.28 hrs/day Uttarakhand Three Phase Supply: 21.40 hrs/day WESTERN REGION Chattisgarh Three Phase Supply: 18 hrs/day –Gujarat Only 8 hours power supply in staggered form in rotation of day and night is given to Agriculture. No supply during rest of 16 hours. Jyotigram Yojana 24 hrs.Madhya Pradesh Three Phase Supply: 10:30 hrs/day Single phase Supply: 00:00 hrs/day Maharashtra Three Phase Supply: 16 hrs/day Single phase Supply: 20 hrs/dayGoa No restriction SOUTHERN REGION Andhra Pradesh Three Phase Supply: 07 hrs/day. –Karnataka Three Phase/ Single Phase Supply: 06 hrs/day No Supply: 12 hrs/day Kerala No Restrictions Tamil Nadu Three Phase Supply: 9 hrs/day Single Phase Supply: 15 hrs/dayPuducherry No RestrictionsEASTERN REGION Bihar About 18 hrs
–Jharkhand About 20 hrs Orissa About 24 hrs. West Bengal 24 hrs; Average about 23 hrs
Source: Central Electricity Authority
SUB-STATIONS (PROG & ACHIV) SEPT 2010 Fig. in MVA/MW
voltage Level/Sector
Prog. 2010-11 Including Slipped Prog. 2009-10
Oct 2010 Apr - Oct 2010
Prog. Achv. Prog. Achv.
+/- 500 kv HvDCCentral Sector 0 0 0 0 0State Sector 0 0 0 0 0TOTAL 0 0 0 0 0
765 kvCentral Sector 0 0 0 0 0State Sector 0 0 0 0 0TOTAL 0 0 0 0 0
400 KvCentral Sector 5010 315 945 945 1760State Sector 10320 630 0 5885 3780JV/Private Sector 630 0 0 0 0TOTAL 15960 645 645 6830 5540
220kvCentral Sector 650 0 0 300 400State Sector 11000 510 50 5610 4620JV/Private Sector 126 0 0 0 0TOTAL 11776 510 50 5910 5020GRAND TOTAL 27736 1455 995 12740 10560
Source: Central Electricity Authority
TRANSMISSION LINES (PROG & ACHIV) OCT 2010Fig. in ckt Kms
voltage Level/Sector
Prog. 2010-11 Including Slipped Prog. 2009-10
Oct 2010 Apr - Oct 2010Prog. Achv. Prog. Achv.
+/- 800 kv HvDCCentral Sector 0 0 0 0 0State Sector 0 0 0 0 0TOTAL 0 0 0 0 0+/- 500 kv HvDCCentral Sector 0 0 0 0 0JV/Private Sector 0 0 0 0 0TOTAL 0 0 0 0 0765 kvCentral Sector 0 0 0 0 0State Sector 0 0 0 0 0TOTAL 0 0 0 0 0400 kvCentral Sector 7261 1108 2051 3244 3145State Sector 2889 329 187 1629 1268JV/Private Sector 2365 220 0 1284 332TOTAL 12515 1657 2238 6157 4748220 kvCentral Sector 481 0 0 201 72State Sector 5375 443 194 2862 2922JV/Private Sector 192 0 0 86 358TOTAL 6048 443 194 3149 3352GRAND TOTAL 18563 2100 2432 9306 8097
Source: Central Electricity Authority
pOwER sECTOR upDATE
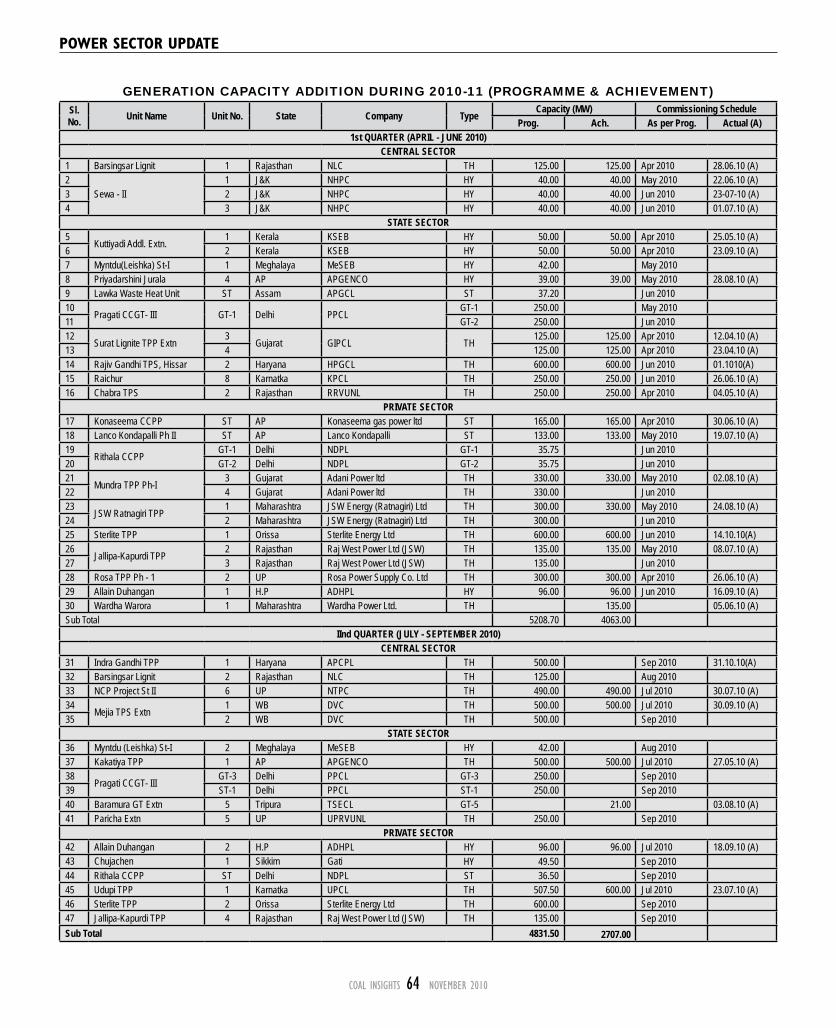
COAL INSIGHTS 64 NOvember 2010
GENERATION CAPACITY ADDITION DURING 2010-11 (PROGRAMME & ACHIEVEMENT)Sl. No. Unit Name Unit No. State Company Type
Capacity (mW) Commissioning ScheduleProg. Ach. As per Prog. Actual (A)
1st QUARTER (APRIL - JUNE 2010)CENTRAL SECTOR
1 Barsingsar Lignit 1 Rajasthan NLC TH 125.00 125.00 Apr 2010 28.06.10 (A)2
Sewa - II1 J&K NHPC HY 40.00 40.00 May 2010 22.06.10 (A)
3 2 J&K NHPC HY 40.00 40.00 Jun 2010 23-07-10 (A)4 3 J&K NHPC HY 40.00 40.00 Jun 2010 01.07.10 (A)
STATE SECTOR5
Kuttiyadi Addl. Extn.1 Kerala KSEB HY 50.00 50.00 Apr 2010 25.05.10 (A)
6 2 Kerala KSEB HY 50.00 50.00 Apr 2010 23.09.10 (A)7 Myntdu(Leishka) St-I 1 Meghalaya MeSEB HY 42.00 May 20108 Priyadarshini Jurala 4 AP APGENCO HY 39.00 39.00 May 2010 28.08.10 (A)9 Lawka Waste Heat Unit ST Assam APGCL ST 37.20 Jun 201010
Pragati CCGT- III GT-1 Delhi PPCLGT-1 250.00 May 2010
11 GT-2 250.00 Jun 201012
Surat Lignite TPP Extn3
Gujarat GIPCL TH125.00 125.00 Apr 2010 12.04.10 (A)
13 4 125.00 125.00 Apr 2010 23.04.10 (A)14 Rajiv Gandhi TPS, Hissar 2 Haryana HPGCL TH 600.00 600.00 Jun 2010 01.1010(A)15 Raichur 8 Karnatka KPCL TH 250.00 250.00 Jun 2010 26.06.10 (A)16 Chabra TPS 2 Rajasthan RRVUNL TH 250.00 250.00 Apr 2010 04.05.10 (A)
PRIvATE SECTOR17 Konaseema CCPP ST AP Konaseema gas power ltd ST 165.00 165.00 Apr 2010 30.06.10 (A)18 Lanco Kondapalli Ph II ST AP Lanco Kondapalli ST 133.00 133.00 May 2010 19.07.10 (A)19
Rithala CCPPGT-1 Delhi NDPL GT-1 35.75 Jun 2010
20 GT-2 Delhi NDPL GT-2 35.75 Jun 201021
Mundra TPP Ph-I3 Gujarat Adani Power ltd TH 330.00 330.00 May 2010 02.08.10 (A)
22 4 Gujarat Adani Power ltd TH 330.00 Jun 201023
JSW Ratnagiri TPP1 Maharashtra JSW Energy (Ratnagiri) Ltd TH 300.00 330.00 May 2010 24.08.10 (A)
24 2 Maharashtra JSW Energy (Ratnagiri) Ltd TH 300.00 Jun 201025 Sterlite TPP 1 Orissa Sterlite Energy Ltd TH 600.00 600.00 Jun 2010 14.10.10(A)26
Jallipa-Kapurdi TPP2 Rajasthan Raj West Power Ltd (JSW) TH 135.00 135.00 May 2010 08.07.10 (A)
27 3 Rajasthan Raj West Power Ltd (JSW) TH 135.00 Jun 201028 Rosa TPP Ph - 1 2 UP Rosa Power Supply Co. Ltd TH 300.00 300.00 Apr 2010 26.06.10 (A)29 Allain Duhangan 1 H.P ADHPL HY 96.00 96.00 Jun 2010 16.09.10 (A)30 Wardha Warora 1 Maharashtra Wardha Power Ltd. TH 135.00 05.06.10 (A)Sub Total 5208.70 4063.00
IInd QUARTER (JULY - SEPTEmBER 2010)CENTRAL SECTOR
31 Indra Gandhi TPP 1 Haryana APCPL TH 500.00 Sep 2010 31.10.10(A)32 Barsingsar Lignit 2 Rajasthan NLC TH 125.00 Aug 201033 NCP Project St II 6 UP NTPC TH 490.00 490.00 Jul 2010 30.07.10 (A)34
Mejia TPS Extn1 WB DVC TH 500.00 500.00 Jul 2010 30.09.10 (A)
35 2 WB DVC TH 500.00 Sep 2010STATE SECTOR
36 Myntdu (Leishka) St-I 2 Meghalaya MeSEB HY 42.00 Aug 201037 Kakatiya TPP 1 AP APGENCO TH 500.00 500.00 Jul 2010 27.05.10 (A)38
Pragati CCGT- IIIGT-3 Delhi PPCL GT-3 250.00 Sep 2010
39 ST-1 Delhi PPCL ST-1 250.00 Sep 201040 Baramura GT Extn 5 Tripura TSECL GT-5 21.00 03.08.10 (A)41 Paricha Extn 5 UP UPRVUNL TH 250.00 Sep 2010
PRIvATE SECTOR42 Allain Duhangan 2 H.P ADHPL HY 96.00 96.00 Jul 2010 18.09.10 (A)43 Chujachen 1 Sikkim Gati HY 49.50 Sep 201044 Rithala CCPP ST Delhi NDPL ST 36.50 Sep 201045 Udupi TPP 1 Karnatka UPCL TH 507.50 600.00 Jul 2010 23.07.10 (A)46 Sterlite TPP 2 Orissa Sterlite Energy Ltd TH 600.00 Sep 201047 Jallipa-Kapurdi TPP 4 Rajasthan Raj West Power Ltd (JSW) TH 135.00 Sep 2010Sub Total 4831.50 2707.00
pOwER sECTOR upDATE

COAL INSIGHTS 65 NOvember 2010
IIIrd QUARTER (OCTOBER - DECEmBER 2010)CENTRAL SECTOR
47 Koteshwar 1 Uttranchal THDC HY 100.00 Dec 201048 Korba STPP 7 Chattisgarh NTPC TH 500.00 Oct 201049 Kodarma TPP 1 Jharkhand DVC TH 500.00 Dec 201050 Neyveli TPS-II Exp 1 TN NLC TH 250.00 Nov 201051 Kaiga 4 Karnatka NPC Nucl. 220.00 Dec 201052 Durgapur Steel TPS 1 WB DVC TH 500.00 Dec 2010
STATE SECTOR53 Priyadarshini Jurala 5 AP APGENCO HY 39.00 Oct 201054 Rayalseema TPP St-III 5 AP APGENCO TH 210.00 Nov 201055 Pragati CCGT- I 1 Delhi PPCL GT-1 250.00 250.00 Dec 2010 24.10.10(A)56 ST-2 Delhi PPCL ST-2 250.00 Dec 201057 Hazira CCPP Extn GT+ ST Gujarat GSECL GT+ ST 351.00 Dec 201058 Khaperkheda TPS Expn 5 Maharashtra MSPGCL TH 500.00 Oct 201059 Santaldih TPP Extn Ph-II 6 WB WBPDCL TH 250.00 Nov 2010
PRIvATE SECTOR60 Budhil 1 HP LANCO HY 35.00 Oct 201061 2 HP LANCO HY 35.00 Nov 201062 Malana-II 1 HP Everest PC HY 50.00 Oct 201063 2 HP Everest PC HY 50.00 Nov 201064 Chujachen 2 Sikkim Gati HY 49.50 Oct 201065 JSW Ratnagiri TPP 3 Maharashtra JSW Energy (Ratnagiri) Ltd TH 300.00 Oct 201066 Jallipa-Kapurdi TPP 5 Rajasthan Raj West Power Ltd (JSW) TH 135.00 Nov 201067 6 Rajasthan Raj West Power Ltd (JSW) TH 135.00 Dec 2010Sub Total 4709.50 250.00
Ivth QUARTER (JANUARY - mARCH 2011)CENTRAL SECTOR
68 Chamera-III 1 HP NHPC HY 77.00 Mar 201169 Uri-II 1 J&K NHPC HY 60.00 Feb 201170 2 J&K NHPC HY 60.00 Mar 201171 Koteshwar 2 Uttranchal THDC HY 100.00 Mar 201172
Teesta Low Dam-III
1 WB NHPC HY 33.00 Jan 201173 2 WB NHPC HY 33.00 Jan 201174 3 WB NHPC HY 33.00 Feb 201175 4 WB NHPC HY 33.00 Feb 201176 Simhadri STPP Extn 3 AP NTPC TH 500.00 Jan 201177 Maithon RB TPP 1 Jharkhand DVC TH 525.00 Jan 201178 Durgapur Steel TPS 2 WB DVC TH 500.00 Mar 201179 Farakka STPS-III 6 WB NTPC TH 500.00 Feb 201180 Kudankulam 1 TN NPC Nucl. 1000.00 Mar 2011
STATE SECTOR81 Priyadarshini Jurala 6 AP APGENCO HY 39.00 Feb 201182 Nagarjuna Sagar TR 1 AP APGENCO HY 25.00 Mar 201183 Pulichintala 1 AP APGENCO HY 30.00 Mar 201184 Pipavav CCPP Block-1 Gujarat GSECL TH 351.00 Feb 201185 Bhusawal TPS Expn 4 Maharashtra MSPGCL TH 500.00 Mar 201186 Harduaganj Extn 8 UP UPRVUNL TH 250.00 Jan 201187 9 UP UPRVUNL TH 250.00 Mar 201188 Paricha Extn 6 UP UPRVUNL TH 250.00 Jan 2011
PRIvATE SECTOR89 Udupi TPP 2 Karnatka UPCL TH 507.50 Jan 201190 JSW Ratnagiri TPP 4 Maharashtra JSW Energy(Ratnagiri)ltd TH 300.00 Jan 201191 Jallipa-Kapurdi TPP 7 Rajasthan Raj West Power ltd(JSW) TH 135.00 Mar 201192 Anpara-C 1 UP Lanco Anpara Power TH 600.00 Jan 2011Sub Total 6691.50 0.00Grand Total 21441.20 7020.00
GENERATION CAPACITY ADDITION DURING 2010-11 (contd.)
Sl. No. Unit Name Unit No. State Company Type
Capacity (mW) Commissioning ScheduleProg. Ach. As per Prog. Actual (A)
Source: Central Electricity Authority
pOwER sECTOR upDATE

COAL INSIGHTS 66 NOvember 2010
E-AuCTIOn DATA
The eight coal producing subsidiaries of Coal India Ltd (CIL) sold a total of 3.67 million tons (mt) of coal through e-auction route during the month of September.
The subsidiaries had offered 3.84 mt coal for sale through the system during the month and almost 95.5 percent of the quantity offered was sold, indicating good demand from consumers. In August, the CIL subsidiaries had offered 3.95 mt and nearly 92 percent or 3.64 mt was sold.
The CIL earned a total of `705.15 crore in September from sale through the auctions, which was nearly 90 percent higher than notified price of `371.75 crore for the same quantity and 46 percent higher than floor price or reserve price of `483.28 crore. The realisations were up in September due to rise in international prices of coal, industry sources said.
The company had earned a total of `681.74 crore in August from sale through the auctions, which was 80 percent higher than notified price of `379.11 crore for the same quantity and 38.33 percent more than floor price or reserve price of `492.84 crore. For the period April-September or first half of 2010-11, CIL subsidiaries offered a total of 22.35 mt coal for sale through e-auctioon route and managed to sell 20.27 mt that helped them earn a revenue of `3664.70 crore, 174 percent higher than value of notified price of `2109.44 crore for the same quantity.
In other words, CIL earned additional revenue of `1555.26 crore by selling a portion of its production through e-auction route between April and September.
Sept CIL e-auction details
Name of subsidiary
Qty offered (In lakh tons)
Qty sold (in lakh tons)
Notified price (In Rs Cr)
Floor Price (In Rs Cr)
Realised Price (In Rs Cr)
ECL 1.97 0.58 11.79 15.33 16.88BCCL 2.76 2.58 36.36 47.26 62.32CCL 4.76 4.76 67.11 87.25 106.62NCL 1.25 1.19 17.01 22.12 35.77WCL 3.09 3.09 44.21 57.48 101.01SECL 8.58 8.58 77.43 100.65 180.99MCL 15.96 15.96 117.84 153.19 201.56NEC 0 0 0 0 0CIL 38.37 36.74 371.75 483.28 705.15
coaljunction A total of 1.95 mt coal of various types and grades was sold by seven subsidiaries of Coal India Ltd (CIL) through e-auction platform of coaljunction, a division of mjunction services ltd, during the month of September. In August, the subsidiaries had sold 1.83 mt coal and in July had sold 1.73 mt coal through
the same platform. The total offering through coaljunction in September stood at 2.16 mt compared with 2.06 mt offered in August and 2.29 mt offered in July. Of the total offering in September, 69,856 tons was through rail mode of which only 42,185 tons could be sold, while the offering through road mode stood at 2.09 mt of which 1.91 mt got sold.
Coking coal All varieties of coking coal, except a small quantity of W1 Slurry, offered for sale through e-auction platform of coaljunction in September met with good demand.
A total of 1,50,550 tons of W2, W3, W4, W4 tailings, W Rejects, W1 Slurry and W2 Slurry was offered from various mines of Bharat Coking Coal Ltd (BCCL) and Central Coalfields Ltd (CCL) during the month. Of the total offering, 1,26,040 tons was sold to various consumers at zero to moderate premium.
“A” grade coal A small quantity of “A” grade coal (GCV exceeding 6454 Kcal/kg) offered by two subsidiaries of Coal India Ltd (CIL) for sale through e-auction platform of coaljunction in September met with moderate to good demand.
The total offering by Eastern Coalfields Ltd (ECL) and South Eastern Coalfields Ltd (SECL) in September stood at 32,500 tons and the entire quantity was sold. In August, only one subsidiary – ECL – had offered 26,216 tons of “A” grade coal for sale through coaljunction’s platform.
“B” grade coal There was no bid from any of the consumers of traders for a total of 20,000 tons of “B” grade (GCV exceeding 6049 Kcal/kg, but not exceeding 6454 Kcal/kg) offered by Eastern Coalfields Ltd (ECL) for sale through e-auction platform of coaljunction in September.
However, the offerings from South Eastern Coalfields Ltd and that from Western Coalfields Ltd (WCL) continued to attract good demand, which together had offered 77,385 tons of “B” grade coal from various mines as the entire quantity was sold. Compared to 97,385 tons of “B” grade coal offered in September, only 19,000 tons was offered for sale through coaljunction’s platform in August. In July, SECL and WCL had offered 50,250 tons of “B” grade coal.
“C” grade coal The offering of “C” grade coal (GCV exceeding 5597 Kcal/kg, but not exceeding 6049 Kcal/kg) by subsidiaries of Coal India Ltd (CIL) for sale through coaljunction platform in September
CIL’s e-auction m-o-m coal salesrise marginally
Coal Insights Bureau

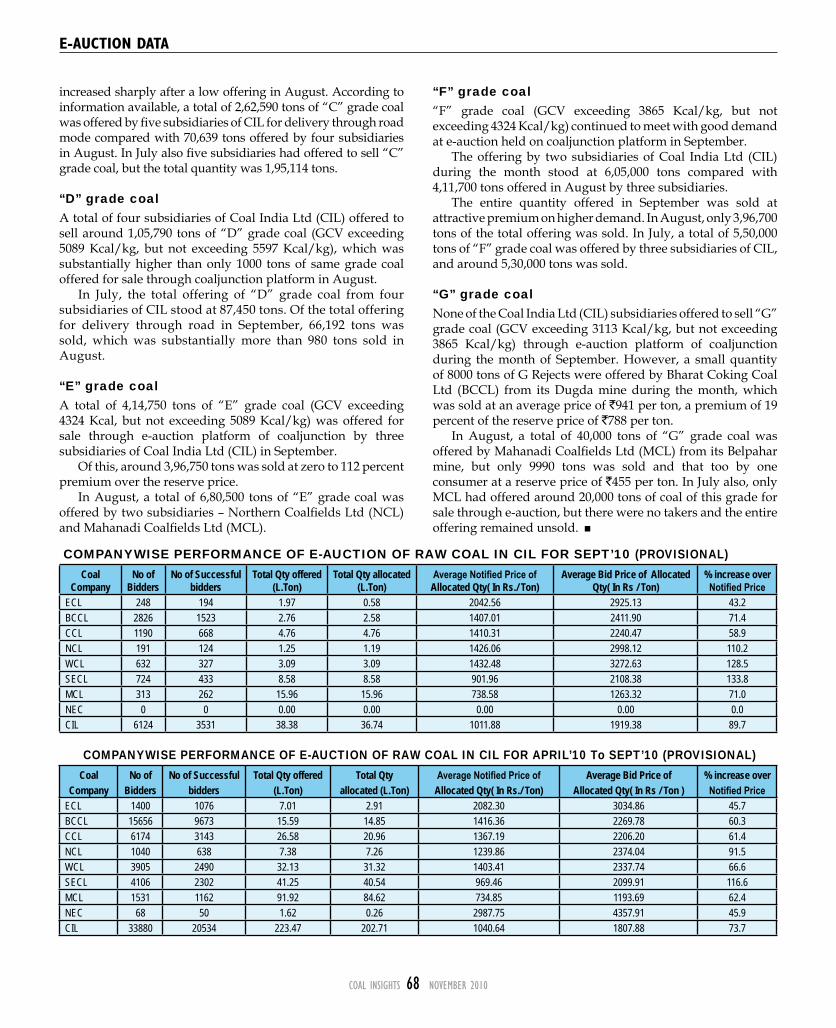
COAL INSIGHTS 68 NOvember 2010
E-AuCTIOn DATA
COMPANYWISE PERFORMANCE OF E-AUCTION OF RAW COAL IN CIL FOR SEPT’10 (PROVISIONAL)Coal
CompanyNo of
BiddersNo of Successful
biddersTotal Qty offered
(L.Ton)Total Qty allocated
(L.Ton)Average Notified Price of
Allocated Qty( In Rs./ Ton)Average Bid Price of Allocated
Qty( In Rs / Ton)% increase over
Notified PriceECL 248 194 1.97 0.58 2042.56 2925.13 43.2BCCL 2826 1523 2.76 2.58 1407.01 2411.90 71.4CCL 1190 668 4.76 4.76 1410.31 2240.47 58.9NCL 191 124 1.25 1.19 1426.06 2998.12 110.2WCL 632 327 3.09 3.09 1432.48 3272.63 128.5SECL 724 433 8.58 8.58 901.96 2108.38 133.8MCL 313 262 15.96 15.96 738.58 1263.32 71.0NEC 0 0 0.00 0.00 0.00 0.00 0.0CIL 6124 3531 38.38 36.74 1011.88 1919.38 89.7
COMPANYWISE PERFORMANCE OF E-AUCTION OF RAW COAL IN CIL FOR APRIL’10 To SEPT’10 (PROVISIONAL)Coal
CompanyNo of
BiddersNo of Successful
biddersTotal Qty offered
(L.Ton)Total Qty
allocated (L.Ton)Average Notified Price of
Allocated Qty( In Rs./ Ton)Average Bid Price of
Allocated Qty( In Rs / Ton )% increase over
Notified PriceECL 1400 1076 7.01 2.91 2082.30 3034.86 45.7BCCL 15656 9673 15.59 14.85 1416.36 2269.78 60.3CCL 6174 3143 26.58 20.96 1367.19 2206.20 61.4NCL 1040 638 7.38 7.26 1239.86 2374.04 91.5WCL 3905 2490 32.13 31.32 1403.41 2337.74 66.6SECL 4106 2302 41.25 40.54 969.46 2099.91 116.6MCL 1531 1162 91.92 84.62 734.85 1193.69 62.4NEC 68 50 1.62 0.26 2987.75 4357.91 45.9CIL 33880 20534 223.47 202.71 1040.64 1807.88 73.7
increased sharply after a low offering in August. According to information available, a total of 2,62,590 tons of “C” grade coal was offered by five subsidiaries of CIL for delivery through road mode compared with 70,639 tons offered by four subsidiaries in August. In July also five subsidiaries had offered to sell “C” grade coal, but the total quantity was 1,95,114 tons.
“D” grade coal A total of four subsidiaries of Coal India Ltd (CIL) offered to sell around 1,05,790 tons of “D” grade coal (GCV exceeding 5089 Kcal/kg, but not exceeding 5597 Kcal/kg), which was substantially higher than only 1000 tons of same grade coal offered for sale through coaljunction platform in August.
In July, the total offering of “D” grade coal from four subsidiaries of CIL stood at 87,450 tons. Of the total offering for delivery through road in September, 66,192 tons was sold, which was substantially more than 980 tons sold in August.
“E” grade coalA total of 4,14,750 tons of “E” grade coal (GCV exceeding 4324 Kcal, but not exceeding 5089 Kcal/kg) was offered for sale through e-auction platform of coaljunction by three subsidiaries of Coal India Ltd (CIL) in September.
Of this, around 3,96,750 tons was sold at zero to 112 percent premium over the reserve price.
In August, a total of 6,80,500 tons of “E” grade coal was offered by two subsidiaries – Northern Coalfields Ltd (NCL) and Mahanadi Coalfields Ltd (MCL).
“F” grade coal“F” grade coal (GCV exceeding 3865 Kcal/kg, but not exceeding 4324 Kcal/kg) continued to meet with good demand at e-auction held on coaljunction platform in September.
The offering by two subsidiaries of Coal India Ltd (CIL) during the month stood at 6,05,000 tons compared with 4,11,700 tons offered in August by three subsidiaries.
The entire quantity offered in September was sold at attractive premium on higher demand. In August, only 3,96,700 tons of the total offering was sold. In July, a total of 5,50,000 tons of “F” grade coal was offered by three subsidiaries of CIL, and around 5,30,000 tons was sold.
“G” grade coalNone of the Coal India Ltd (CIL) subsidiaries offered to sell “G” grade coal (GCV exceeding 3113 Kcal/kg, but not exceeding 3865 Kcal/kg) through e-auction platform of coaljunction during the month of September. However, a small quantity of 8000 tons of G Rejects were offered by Bharat Coking Coal Ltd (BCCL) from its Dugda mine during the month, which was sold at an average price of `941 per ton, a premium of 19 percent of the reserve price of `788 per ton.
In August, a total of 40,000 tons of “G” grade coal was offered by Mahanadi Coalfields Ltd (MCL) from its Belpahar mine, but only 9990 tons was sold and that too by one consumer at a reserve price of `455 per ton. In July also, only MCL had offered around 20,000 tons of coal of this grade for sale through e-auction, but there were no takers and the entire offering remained unsold.


COAL INSIGHTS 70 NOvember 2010
E-AuCTIOn DATA
Quantity Offered & Sold In Sept’10 VS Aug’10 BY Various Subsidiaries Rail & Road Qty. In Tons
Sepember 2010 August 2010 Variation (In Percent)QTY
OFFEREDQTY
SOLDQTY
OFFEREDQTY
SOLDOFFERED
QTYSOLD QTY
BCCL Road 907,500 283,750 393,200 266,550 130.80% 6.45%BCCL Rail 2,119,371 0 35,550 0 5861.66% 0.00%MCL Road 2,804,000 1,240,000 1,290,000 1,270,110 117.36% -2.37%MCL Rail 474,000 355,500 355,500 355,500 33.33% 0.00%NCL Road 105,000 104,980 75,000 74,980 40.00% 40.01%NCL Rail - - - - NA NANEC Road 20,000 14,320 10,000 3,500 100.00% 309.14%NEC Rail - - - - NA NASECL Road 724,200 724,200 565,800 439,800 28.00% 64.67%SECL Rail 134,225 134,225 111,215 111,215 20.69% 20.69%ECL Road 197,301 57,719 200,689 62,916 -1.69% -8.26%ECL Rail - - - - NA NAWCL Road 308,900 308,650 553,750 553,030 -44.22% -44.19%WCL Rail - - 8,000 8,000 NA NASCCL Road 56,750 56,750 100,000 99,995 -43.25% -43.25%SCCL Rail - - - - NA NACCL Road 703,750 551,760 638,450 478,060 10.23% 15.42%CCL Rail - - - - NA NATotal 8,554,997 3,831,854 4,337,154 3,723,656 97.25% 2.91%
Details of e-AuctionMONTH OFFERED QTY (in tons) SOLD QTY (in tons) Variation (In Percent)
Sep'09 4,927,901 3,103,123 -37.03Oct'09 3,260,580 3,080,738 -5.52Nov'09 6,999,080 5,659,042 -19.15Dec'09 5,453,411 4,236,653 -22.31Jan'10 6,576,301 5,757,565 -12.45Feb'10 6,151,869 5,049,310 -17.92Mar'10 7,929,689 4,778,310 -39.74Apr'10 4,260,583 3,555,683 -16.54May'10 6,490,803 3,088,019 -52.42Jun'10 4,491,718 2,993,635 -33.35Jul'10 4,727,689 3,724,154 -21.23Aug'10 4,337,154 3,723,656 -14.15Sep'10 8,554,997 3,831,854 -55.21TOTAL 74,161,775 52,581,742 -29.10
1,000,000
2,000,000
3,000,000
4,000,000
5,000,000
6,000,000
7,000,000
8,000,000
9,000,000
Mar'10 Apr'10 May'10 Jun'10 Jul'10 Aug'10 Sep'10
Qua
ntity
in T
ons
OFFERED QTY (in tons) SOLD QTY (in tons)
Quantity Offered & Sold
Monthly Data of Offered Quantity (Road & Rail)Qty. In Tons
MONTH OFFERED BY ROAD OFFERED BY RAILSep'09 4466500 461401Oct'09 2617350 643230Nov'09 5483390 1515690Dec'09 4666980 786431Jan'10 4669131 1907170Feb'10 4913280 1238589Mar'10 6110014 1819675Apr'10 3999550 261033May'10 5366085 1124718Jun'10 3870500 621218Jul'10 4004021 723668Aug'10 3826889 510265Sep'10 5827401 2727596Total 59821091 14340684 0
1000000
2000000
3000000
4000000
5000000
6000000
7000000
Mar'10 Apr'10 May'10 Jun'10 Jul'10 Aug'10 Sep'10
Qty O
ffere
d In T
ons
OFFERED BY ROAD OFFERED BY RAIL
Monthly Data of Offered Quantity(Road & Rail)
Note: The figures for March’10 are for only one service provider the rest all are from two service providers.
0
500,000
1,000,000
1,500,000
2,000,000
2,500,000
BC
CL
RO
AD
BC
CL
RA
IL
MC
L R
OA
D
MC
L R
AIL
NC
L R
OA
D
NC
L R
AIL
NE
C R
OA
D
NE
C R
AIL
SE
CL
RO
AD
SE
CL
RA
IL
EC
L R
OA
D
EC
L R
AIL
WC
L R
OA
D
WC
L R
AIL
SC
CL
RO
AD
SC
CL
RA
IL
CC
L R
OA
D
CC
L R
AIL
Companies
Qu
an
tity
In
To
ns
Sep-10 QTY OFFERED Sep-10 QTY SOLD Aug-10 QTY OFFERED Aug-10 QTY SOLD
0
500,000
1,000,000
1,500,000
2,000,000
2,500,000
BC
CL
RO
AD
BC
CL
RA
IL
MC
L R
OA
D
MC
L R
AIL
NC
L R
OA
D
NC
L R
AIL
NE
C R
OA
D
NE
C R
AIL
SE
CL
RO
AD
SE
CL
RA
IL
EC
L R
OA
D
EC
L R
AIL
WC
L R
OA
D
WC
L R
AIL
SC
CL
RO
AD
SC
CL
RA
IL
CC
L R
OA
D
CC
L R
AIL
Companies
Qua
ntity
In T
ons
Sep-10 QTY OFFERED Sep-10 QTY SOLD Aug-10 QTY OFFERED Aug-10 QTY SOLD
Qty Offered & Sold In Sep’10 Vs Aug’10

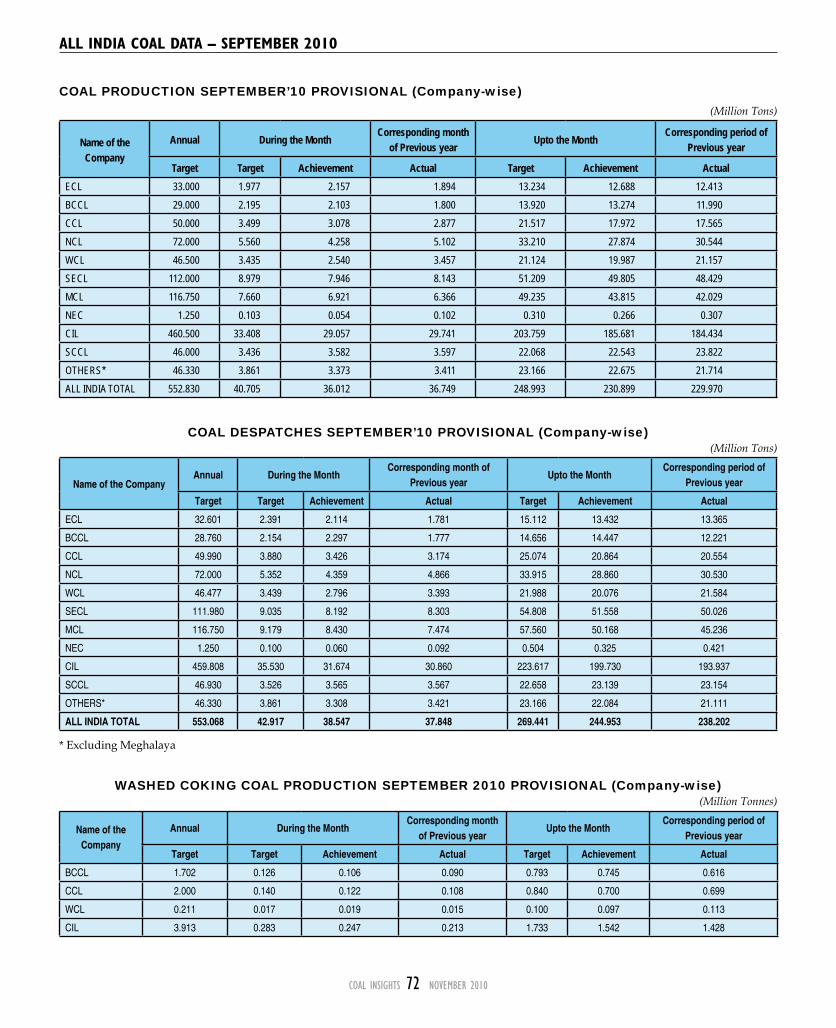
COAL INSIGHTS 72 NOvember 2010
ALL InDIA COAL DATA – sEpTEmbER 2010
COAL PRODUCTION SEPTEMBER’10 PROVISIONAL (Company-wise)(Million Tons)
Name of the Company
Annual During the monthCorresponding month
of Previous yearUpto the month
Corresponding period of Previous year
Target Target Achievement Actual Target Achievement ActualECL 33.000 1.977 2.157 1.894 13.234 12.688 12.413BCCL 29.000 2.195 2.103 1.800 13.920 13.274 11.990CCL 50.000 3.499 3.078 2.877 21.517 17.972 17.565NCL 72.000 5.560 4.258 5.102 33.210 27.874 30.544WCL 46.500 3.435 2.540 3.457 21.124 19.987 21.157SECL 112.000 8.979 7.946 8.143 51.209 49.805 48.429MCL 116.750 7.660 6.921 6.366 49.235 43.815 42.029NEC 1.250 0.103 0.054 0.102 0.310 0.266 0.307CIL 460.500 33.408 29.057 29.741 203.759 185.681 184.434SCCL 46.000 3.436 3.582 3.597 22.068 22.543 23.822OTHERS* 46.330 3.861 3.373 3.411 23.166 22.675 21.714ALL INDIA TOTAL 552.830 40.705 36.012 36.749 248.993 230.899 229.970
WASHED COKING COAL PRODUCTION SEPTEMBER 2010 PROVISIONAL (Company-wise)(Million Tonnes)
Name of the Company
Annual During the MonthCorresponding month
of Previous yearUpto the Month
Corresponding period of Previous year
Target Target Achievement Actual Target Achievement Actual
BCCL 1.702 0.126 0.106 0.090 0.793 0.745 0.616
CCL 2.000 0.140 0.122 0.108 0.840 0.700 0.699
WCL 0.211 0.017 0.019 0.015 0.100 0.097 0.113
CIL 3.913 0.283 0.247 0.213 1.733 1.542 1.428
COAL DESPATCHES SEPTEMBER’10 PROVISIONAL (Company-wise)(Million Tons)
Name of the Company Annual During the Month
Corresponding month of Previous year
Upto the MonthCorresponding period of
Previous year
Target Target Achievement Actual Target Achievement Actual
ECL 32.601 2.391 2.114 1.781 15.112 13.432 13.365
BCCL 28.760 2.154 2.297 1.777 14.656 14.447 12.221
CCL 49.990 3.880 3.426 3.174 25.074 20.864 20.554
NCL 72.000 5.352 4.359 4.866 33.915 28.860 30.530
WCL 46.477 3.439 2.796 3.393 21.988 20.076 21.584
SECL 111.980 9.035 8.192 8.303 54.808 51.558 50.026
MCL 116.750 9.179 8.430 7.474 57.560 50.168 45.236
NEC 1.250 0.100 0.060 0.092 0.504 0.325 0.421
CIL 459.808 35.530 31.674 30.860 223.617 199.730 193.937
SCCL 46.930 3.526 3.565 3.567 22.658 23.139 23.154
OTHERS* 46.330 3.861 3.308 3.421 23.166 22.084 21.111
ALL INDIA TOTAL 553.068 42.917 38.547 37.848 269.441 244.953 238.202
* Excluding Meghalaya
Tear
alo
ng th
e do
tted
line
Tear
alo
ng th
e do
tted
line
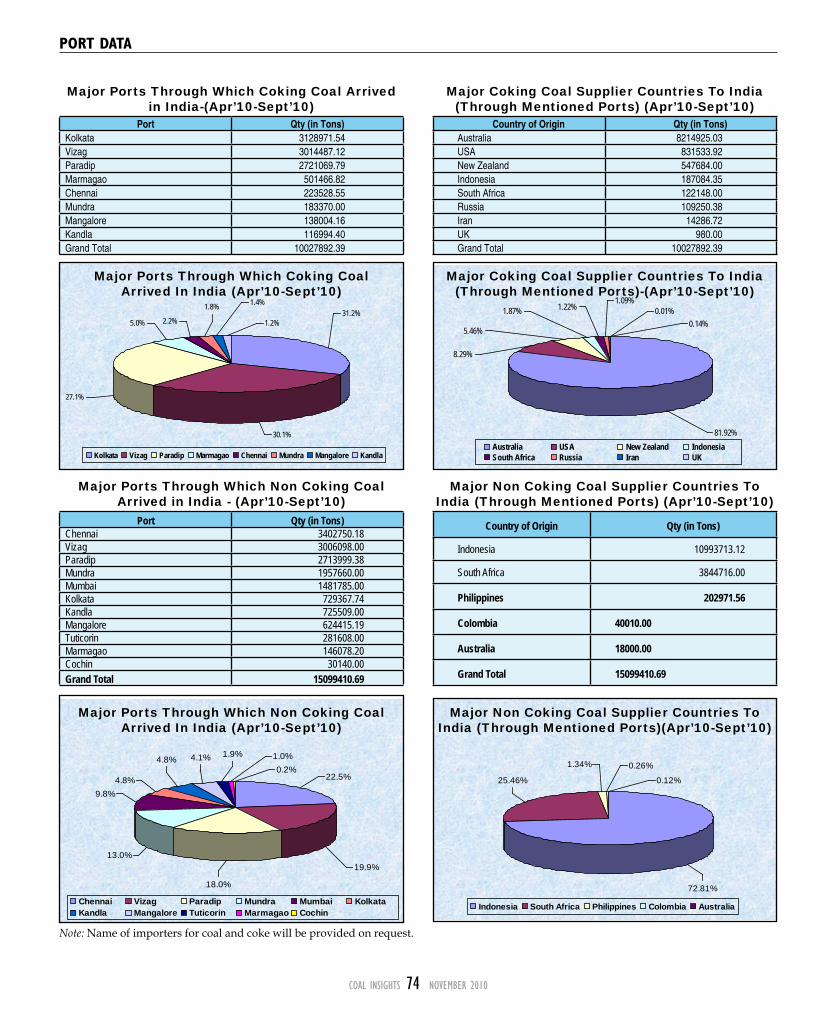
COAL INSIGHTS 74 NOvember 2010
0.2%1.0%4.8% 4.1% 1.9%
4.8%9.8%
13.0%
18.0%
19.9%
22.5%
Chennai Vizag Paradip Mundra Mumbai KolkataKandla Mangalore Tuticorin Marmagao Cochin
pORT DATA
Note: Name of importers for coal and coke will be provided on request.
Major Ports Through Which Coking Coal Arrived in India-(Apr’10-Sept’10)
Port Qty (in Tons)Kolkata 3128971.54Vizag 3014487.12Paradip 2721069.79Marmagao 501466.82Chennai 223528.55Mundra 183370.00Mangalore 138004.16Kandla 116994.40Grand Total 10027892.39
Major Coking Coal Supplier Countries To India (Through Mentioned Ports) (Apr’10-Sept’10)
Country of Origin Qty (in Tons)Australia 8214925.03USA 831533.92New Zealand 547684.00Indonesia 187084.35South Africa 122148.00Russia 109250.38Iran 14286.72UK 980.00Grand Total 10027892.39
31.2%
30.1%
27.1%
5.0% 2.2%
1.8% 1.4%
1.2%
Kolkata vizag Paradip marmagao Chennai mundra mangalore Kandla
Major Ports Through Which Coking Coal Arrived In India (Apr’10-Sept’10)
1.22%1.09%
1.87%
5.46%
8.29%
81.92%
0.14%0.01%
Australia USA New Zealand IndonesiaSouth Africa Russia Iran UK
Major Coking Coal Supplier Countries To India (Through Mentioned Ports)-(Apr’10-Sept’10)
Major Ports Through Which Non Coking Coal Arrived in India - (Apr’10-Sept’10)
Port Qty (in Tons)Chennai 3402750.18Vizag 3006098.00Paradip 2713999.38Mundra 1957660.00Mumbai 1481785.00Kolkata 729367.74Kandla 725509.00Mangalore 624415.19Tuticorin 281608.00Marmagao 146078.20Cochin 30140.00Grand Total 15099410.69
Major Ports Through Which Non Coking Coal Arrived In India (Apr’10-Sept’10)
Major Non Coking Coal Supplier Countries To India (Through Mentioned Ports) (Apr’10-Sept’10)
Country of Origin Qty (in Tons)
Indonesia 10993713.12
South Africa 3844716.00
Philippines 202971.56
Colombia 40010.00
Australia 18000.00
Grand Total 15099410.69
0.12%
0.26%
72.81%
25.46%
1.34%
Indonesia South Africa Philippines Colombia Australia
Major Non Coking Coal Supplier Countries To India (Through Mentioned Ports)(Apr’10-Sept’10)