361
COOLING TOWERS Selection, Design and Practice
| Date post: | 10-Dec-2015 |
| Category: |
Documents |
| Upload: | bemboy-subosa |
| View: | 457 times |
| Download: | 66 times |

COOLING TOWERS Selection, Design and Practice
- - - ,"",_ .. _ .. ....... .. ._" .. _ .. __ ., __ ----,.""""" __ .,.,_".,.;.'_ ,.,.-",.",,, ... ,,,.,-.. ~.:'.".:~"".""''''."=:''':.'''.c:,,.,,::,,''''',''·,~::,'''::,'',: , ::::,~,,"'o.~,,""'"":"., ... c:::"·:;;,: ~. _ ,. ___ . . , _____ . _____ , __ "----_.,.,,,,,_"'. .." ... _. ___ =-_. ___ - - - - _ - - - -~
COOLING TOWERS Selection, Design and Practice
by Nicholas P. Cheremisinoff Paul N. Cheremisinoff
I
I

Copyright © 1981 by Ann Arbor Science Publishers, Inc. P.O. Box 1425,230 Collingwood, Ann Arbor, Michigan 48106
Library of Congress Card Catalog Number 81-65711 ISBN 0-250-40407-9
Manufactured in the United States of America All Rights Reserved

r
PREFACE
As the least expensive and most efficient alternative, once-through cooling has historically been the preferred method for cooling hot process waters in industrial operations and power plants. However, since thermal pollution has become a major environmental problem, the unlimited use of water for cooling purposes has become one of the major social and political issues constraining plant siting in many parts of the country. As an example, a WOO-megawatt power plant utilizing once-through cooling requires 300,000 to 700,000 gallons per minute of water consumption. Plant sites have drastically diminished near water sources where such water usage is possible. Consequently, closed-cycle cooling methods thaFrattempt to make maximum use of limited water supplies have become the primary cooling option.
Cooling tower technology progressed slowly until very recently. New developments aim at improving the thermal efficiencies and minimizing maintenance of existing designs to save large capital investments. When sound engineering principles are applied to upgrade existing designs or new installations, cooling towers can produce colder process water and save input energy, while at the same time can minimize pollution impacts. To meet these objectives, design and process engineers' must thoroughly understand the operating principles and the limitations of the best technology that is presently available. Equally important is some insight into how technology needs are likely to change in the near future. '
This book gives state-of-the-art evaporative cooling tower techniques. Design practices and applications of modern cooling tower technology are presented. A design basis can be established through the detailed calculation procedures outlined and with selected use of the nearly 400 references compiled at the end of the book. Detailed abstracts of more than half of these references have been prepared so that the reader can readily obtain the most useful information for his or her specific problems,
iii
Nicholas P. Cheremisinoff Paul N. Cheremisinoff
Nicholas P. Cheremisinoff is Senior Project Engineer with : Exxon Research & Engineering Co. in Florham Park, N.J.
He received his BS, MS and PhD degrees in Chemical , Engineering from Clarkson College of Technology, where
he was an instructor from 1976 to 1977. Dr. Cheremisinoff is the author of a number of books and has contributed to the industrial press. He is a member of a number of
professional and honor societies including Tau Beta Pi, Sigma Xi and AIChE. His special research interests, include heat and mass transfer phenomena and new energy technology.
Paul N. Cheremisinoff is Associate Professor of Environmental Engineering at the New Jersey Institute of Technology. A consultant and registered professional engineer, he has more than 30 years of practical design, development and manufacturing engineering experience in a wide range of organizations, specifically in chemical processing. He is the author/editor of many Ann Arbor Science Publishers
handbooks, including Pollution Engineering Practice Handbook, Carbon Adsorption Handbook and Environmental Impact Data Book.
iv
F
CONTENTS
1. Overview ..................................... . Introduction. . . . . . . . . . . . . . . . . . . . . . . . . . . . . . . . . 1 Historical Developments. . . . . . . . . . . . . . . . . . . . . . . . . 2 Operating Principles. . . . . . . . . . . . . . . . . . . . . . . . . . . . 3 Cooling Tower Terminology . . . . . . . . . . . . . . . . . . . . . . 5 Design Overview ............... ' . . . . . . . . . . . . . . . 8
2. Properties and Definitions for the Air-Water System. . . . . . . . .. 13 Introduction. . . . . . . . . . . . . . . . . . . . . . . . . . . . . . . .. 13 Vapor Pressure . . . . . . . . . . . . . . . . . . . . . .". . . . . . . .. 13 Saturated Condition ................... '. . . . . . . .. 16 Definitions in Thermodynamics .................. " 18 Wet Bulb Temperature. . . . . . . . . . . . . . . . . . . . . . . . .. 26 Humidity Charts .......... ' .................. " 29 Notation. . . . . . . . . . . . . . . . . . . . . . . . . . . . . . . . . .. 31 Problems ........... , . . . . . . . . . . . . . . . . . . . . . .. 33
3. Heat and Mass Transfer Principles. . . . . . . . . . . . . . . . . . . . .. 35 Introduction ............. '. . . . . . . . . . . . . . . . . . .. 35 The General Energy Balance Equation. . . . . . . . . . . . . . .. 35 Principles of Energy and Material Balances. . . . . . . . . . . .. 39 Principles of Direct-Contact Transfer. . . . . . . . . . . . . . . .. 43 Heat and Mass Transfer Analogies ................. " 44 Mass Transfer Theory. . . . . . . . . . . . . . . . . . . . . . . . . .. 46 Transfer Units. . . . . . . . . . . . . . . . . . . . . . . . . . . . . . .. 51 Lewis Number Relationship. . . . . . . . . . . . . . . . . . . . . .. 52 Notation. . . . . . . . . . . . . . . . . . . . . . . . . . . . . . . . . .. 53 Problems. . . . . . . . . . . . . . . . . . . . . . . . . . . . . . . . . .. 55
4. Cooling Tower Classifications . . . . . . . . . . . . . . . . . . . . . . .. 59 Introduction. . . . . . . . . . . . . . . . . . . . . . . . . . . . . . . .. 59 Cooling Tower Subclassifications and Configurations. . . . .. 59
v
Fill Arrangements . . . . . . . . . . . . . . . . . . . . . . . . . . . .. 70 Distribution Systems . . . . . . . . . . . . . . . . . . . . . . . . . .. 70 Mechanical-Draft Cooling Towers. . . . . . . . . . . . . . . . . .. 70 Factory-Assembled Towers. . . . . . . . . . . . . . . . . . . . . .. 74 Fan Assisted Hyperbolic Towers. . . . . . . . . . . . . . . . . . .. 75 New Tower Designs. . . . . . . . . . . . . . . . . . . . . . . . . . .. 77 Dry Cooling Towers. . . . . . . . . . . . . . . . . . . . . . . . . . .. 79 Wet/Dry Tower Systems ................ : .... : . .. 83
5. Theory and Design Principles. . . . . . . . . . . . . . . . . . . . . . . .. 87 Introduction. . . . . . . . . . . . . . . . . . . . . . . . . . . . . . . .. 87 Gas-Liquid Contacting. . . . . . . . . . . . . . . . . . . . . . . . .. 87 Application of Psychrometric Chart. . . . . . . . . . . . . . . .. 91 Application of the Energy Balance . . . . . . . . . . . . . . . . .. 96 Construction of Equilibrium Curves . . . . . . . . . . . . . . . .. 102 Guidelines for Tower Specification. . . . . . . . . . . . . . . . .. 104 General Design Considerations and Packing Coefficients. . .. 108 Correcting for Liquid Film Resistance. . . . . . . . . . . . . . .. 112 Integrating Procedures for Tower Sizing. . . . . . . . . . . . . .. 113 Notation. . . . . . . . . . . . . . . . . . . . . . . . . . . . . . . . . .. 119 Problems. . . . . . . . . . . . . . . . . . . . . . . . . . . . . . . . . .. 120
6. Operation and Design Practices . . . . . . . . . . . . . . . . . . . . . .. 125 Introduction. . . . . . . . . . . . . . . . . . . . . . . . . . . . . . . .. 125 Tower Coefficients . . . . . . . . . . . . . . . . . . . . . . . . . . .. 125 Tower Characteristics and Performance. . . . . . . . . . . . . .. 127 Power Conditions . . . . . . . . . . . . . . . . . . . . . . . . . . . .. 130 Considerations in Cooling Tower Selection. . . . . . . . . . . .. 134 Empirical Approach to Tower Sizing. . . . . . . . . . . . . . . .. 136 Problems Related to Outside Installation. . . . . . . . . . . . .. 138 Winter Operation. . . . . . . . . . . . . . . . . . . . . . . . . . . . .. 141 Problems with Fog Formation. . . . . . . . . . . . . . . . . . . .. 143 Blowdown . . . . . . . . . . . . . . . . . . . . . . . . . . . . . . . . .. 146 Water Consumption and Recirculation Rates . . . . . . . . . .. 149 Gas Cooling Operations . . . . . . . . . . . . . . . . . . . . . . . .. 150 Fire Hazard and Safety Precautions with
Cooling Towers. . . . . . . . . . . . . . . . . . . . . . . . . . . .. 153 Cooling Tower Plumes . . . . . . . . . . . . . . . . . . . . . . . . .. 154 Cooling Tower Specification Guide. . . . . . . . . . . . . . . . .. 158 Notation. . . . . . . . . . . . . . . . . . . . . . . . . . . . . . . . . .. 159 Problems. . . . . . . . . . . . . . . . . . . . . . . . . . . . . . . . . .. 160
vi
r !
7. Mechanical Components of Cooling Towers ............. " 163 Introduction. . . . . . . . . . . . . . . . . . . . . . . . . . . . . . . .. 163 Circulating Pumps. . . . . . . . . . . . . . . . . . . . . . . . . . . .. 163 Fans. . . . . . . . . . . . . . . . . . . . . . . . . . . . . . . . . . . . .. 165 Speed Reducers .................. '. . . . . . . . . . . .. 167 Drive Shafts. . . . . . . . . . . . . . . . . . . . . . . . . . . . . . . .. 167 Instrumentation, Valves and Flowsheets . . . . . . . . . . . . .. 168 Example of Cooling Tower Requisition. . . . . . . . . . . . . .. 169 Cooling Tower Testing. . . . . . . . . . . . . . . . . . . . . . . . .. 179 Bids Evaluation. . . . . . . . . . . . . . . . . . . . . . . . . . . . . .. 179 Cooling Tower Economics. . . . . . . . . . . . . . . . . . . . . . .. 183
8. Cooling Tower Water Treatment. . . . . . . . . . . . . . . . . . . . . .. 185 Introduction. . . . . . . . . . . . . . . . . . . . . . . . . . . . . . . .. 185 Problems Inherent to Water Contaminants. . . . . . . . . . . .. 186 Pretreatment of Cooling Water Systems. . . . . . . . . . . . . .. 188 Corrosion Detection .......................... " 190 Methods of Evaluating Cooling Water Inhibitors. . . . . . . .. 191 Langelier and Ryznar Equations: Saturation and
Stability Index. . . . . . . . . . . . . . . . . . . . . . . . . . . . .. 191 Organic Growths .................... ,", . . . . . . .. 192 Legionnaires' Disease ................. .'. . . . . . . .. 193 Water Analysis and Treatment. . . . . . . . . . . . . . . . . . . .. 194 Plastic Cooling Towers ...... : . . . . . . . . . . . . . . . . . .. 198
9. Guidelines for Winter Operation. . . . . . . . . . . . . . . . . . . . . .. 207 Introduction ............................... " 207 Overall Ice Prevention System Design . . . . . . . . . . . . . . .. 207 Mechanics of the Fill Bypass and Ice Prevention
Ring Sections. . . . . . . . . . .'. . . . . . . . . . . . . . . . . . .. 209 Supplemental Ice Control: Fill Zoning. . . . . . . . . . . . . . .. 211 Guidelines for Integrated System Operation. . . . . . . . . . .. 212 Conclusions. . . . . . . . . . . . . . . . . . . . . . . . . . . . . . . .. 213
Appendix A': Steam Tables ....................... . 215 Appendix B: Conversion Factors ................... . 225 Appendix C: Solutions to Selected Chapter Problems ...... . 245 Appendix D: Source Listing and Abstracts of the Cooling
Tower Literature ..................... . 259 Author Index ................................ . 335 Subject Index ................................ . 341
vii

FIGURES
1.1 Cooling tower operation. . . . . . . . . . . . . . . . . . . . . . . . . . . . 4 1.2 Countercurrent and crossflow cooling towers ............. , 10 2.1 Vapor pressure curve for water. . . . . . . . . . . . . . . . . . . . . . .. 14 2.2 Heat capacity curves for air and water vapor. . . . . . . . . . . . . .. 22 2.3 Graphic representation of enthalpy change. . . . . . . . . . . . . . .. 23 2.4 The principle of wet-bulb temperature. . . . . . . . . . . . . . . . . .. 27 2.5 Psychrometric chart for the air-water vapor system . . . . . . . . .. 30 2.6 Humidity chart example. . . . . . . . . . . . . . . . . . . . . . . . . . .. 31 3.1 Energy, balance for an open system .................... , 36 3.2 Energy balance for a closed system ................... " 37 3.3 Process operations or equipment can be represented by a
generalized flow process known as the black box technique. . . . . . . . . . . . . . . . . . . . . . . . . . . . . . .. 39
3.4 Generalized flow process considered in Example 1. . . . . . . . . .. 41 3.5 The action of diffusion ............................ , 47 3.6 The Arnold diffusion cell. . . . . . . . . . . . . . . . . . . . . . . . . .. 55 3.7 Water tank for problem 3.7 . . . . . . . . . . . . . . . . . . . . . . . . .. 56 3.8 Adiabatic gas-liquid contact system for problem 3.9. . . . . . . . .. 57 4.1 Subclassifications of cooling towers . . . . . . . . . . . . . . . . . . .. 60 4.2 Atmospheric spray tower. . . . . . . . . . . . . . . . . . . . . . . . . .. 61 4.3 Hyperbolic natural draft tower. . . . . . . . . . . . . . . . . . . . . . .. 61 4.4 Counterflow tower . . . . . . . . . . . . . . . . . . . . . . . . . . . . . .. 62 4.5 Crossflow tower . . . . . . . . . . . . . . . . . . . . . . . . . . . . . . . .. 63 4.6 Single-structure type wet/dry cooling tower. . . . . . . . . . . . . .. 64 4.7 Wet/dry cooling tower. . . . . . . . . . . . . . . . . . . . . . . . . . . .. 64 4.8 Coil shed cooling tower . . . . . . . . . . . . . . . . . . . . . . . . . . .. 65 4.9 Cross section of a simple cooling tower formed by enclosing
a spraypond with louvered walls ................... , 66 4.10 Various geometries employed in constructing redwood fill
for cooling towers. . . . . . . . . . . . . . . . . . . . . . . . . . . .. 67 4.11 Power plant installation where multiple tower arrangement is
viii
F
4.12
4.13 4.14
4.15 4.16 4.17
4.18 4.19 4.20
4.21
4.22
4.23
4.24 5.1 5.2 5.3
5.4 5.5 5.6 5.7 5.8
5.9 5.10 5.11 5.12
5.13 5.14 5.15 5.16 6.1
utilized (towers are operated in parallel). Cooling towers are placed in a row at right angles to the prevailing winds
Differences between crossflow and counterflow hyperbolic cooling towers .............................. .
Operating principles behind splash-packing and. film-packing ... . Gravity and splash-type water distribution systems employed
in cooling towers ............................. . Large mechanical-draft cooling towers .................. . Design elements of mechanical-draft cooling towers ......... . Factory-assembled units are shipped in modular package form
and erected in the field. . . . . . . . . . . . . . . . . . . . . . . . . . Forced draft tower curves and manufacturer's design procedure .. Fan-assisted hyperbolic tower ....................... . Cooling tower design developed by Baltimore Aircoil Co. The
system is designed to operate without fill packing ....... . Direct, dry-type cooling tower condensing system utilizing a
mechanical-draft tower ......................... . Indirect, dry-type cooling tower condensing system employing
a natural-draft tower .......................... . Schematic of advanced dry cooling system proposed by
McHale et al. ...................... ":1 •••••.••
Design features of the wet! dry cooling tower ..... ' ........ . Free and interrupted flow through a column .............. . Tower packing configurations ....................... . Cross-sectional view of commonly used cooling tower
fill arrangements ............................. . Example of adiabatic humidification ................... . Cooling tower operation for Example 2 ................. . Countercurrent cooling tower operation ................ . General operating diagram for a cooling tower ............ . Daily and annual variations in ambient air wet-bulb
temperatures ............................... . Effect of flow variance on cooling tower size factor ......... . Effect of range variance on tower size factor. ............. . Variation in tower size factor with approach .............. . Important design parameters for the countercurrent cooling
tower operation ............................. . Cooling tower operation for Example 3 ................. . Equilibrium curve and operating line for Example 3 ......... . Evaluation ofNTU' for Example 3 .................... . Cooling tower operation for problem 5.5 ................ . Countercurrent cooling diagram for constant conditions,
variable L:G ratio ............................ .
ix
68
69 71
72 73 74
75 76 77
79
80
81
83 84 89 90
90 92 94 97
102
106 108 108 109
110 115 116 118 122
126
6.2 Crossflow tower cooling diagram. . . . . . . . . . . . . . . . . . . . .. 127 6.3 Generalized tower characteristic curves. . . . . . . . . . . . . . . . .. 129 6.4 Countercurrent cooling tower rating chart for 15° range . . . . . .. 130 6.5 The effects of varying process conditions on a cooling
tower's enthalpy temperature diagram. . . . . . . . . . . . . . .. 133 6.6 The effect of variations in performance requirement on tower
ground area for a fixed tower design with constant G . . . . .. 136 6.7 Catwalks are an essential part of the cooling tower package.
Shown here is a small cooling tower with a walkway around the entire unit for inspection and maintenance purposes. . .. 139
6.8 Interface and recirculation problems. . . . . . . . . . . . . . . . . . .. 139 6.9 Proper tower orientation can avoid interference from multiple
tower arrangements .. '. . . . . . . . . . . . . . . . . . . . . . . . .. 140 6.10 Heat balance about a cooling tower. . . . . . . . . . . . . . . . . . . .. 141 6.11 Equation 6.8 correlated mechanical-draft performance data .... , 142 6.12 Portion of psychrometric chart illustrating fog formation. . . . .. 144 6.13 Fog formation assisted by wake formation and hourly
variations in ambient air humidity . . . . . . . . . . . . . . . . .. 145 6.14 Chart for estimating cooling tower makeup requirements. . . . .. 148 6.15 Chart for estimating cooling tower blowdown. . . . . . . . . . . . .. 149 6.16 Lewis number correlation for the air-water system. . . . . . . . . .. 151 6.17 Typical pl~t comparing relative ground concentration in the
cooling tower stack direction. Ground-level concentrations are normally averaged over the year . . . . . . . . . . . . . . . .. 157
7.1 Recommended minimum submergence depths versus velocity. .. 164 7.2 Various methods to prevent vortex formation. . . . . . . . . . . . .. 164 7.3 Centrifugal fan configurations. . . . . . . . . . . . . . . . . . . . . . .. 167 7.4 Typical flowsheet for a cooling tower system . . . . . . . . . . . . .. 170 7.5 Typical cooling tower performance curves for different
water loadings. . . . . . . . . . . . . . . . . . . . . . . . . . . . . . .. 180 8.1 Modular constructed plastic cooling towers . . . . . . . . . . . . . .. 199 9.1 Illustrates the danger of freezing for normal cooling
tower operation . . . . . . . . . . . . . . . . . . . . . . . . . . . . .. 208 9.2 Diagram showing the proper flow allocations during low heat
load operation, with water flow diverted from the fill section ................................ " 210
9.3 Typical fill water ,distribution pattern in the zoned mode of operation. . . . . . . . . . . . . . . . . . . . . . . . . . . . . . . .. 212
9.4 Operating regions for the winter operating modes for ice prevention. . . . . . . . . . . . . . . . . . . . . . . . . . . . . . .. 213
x
r I
TABLES
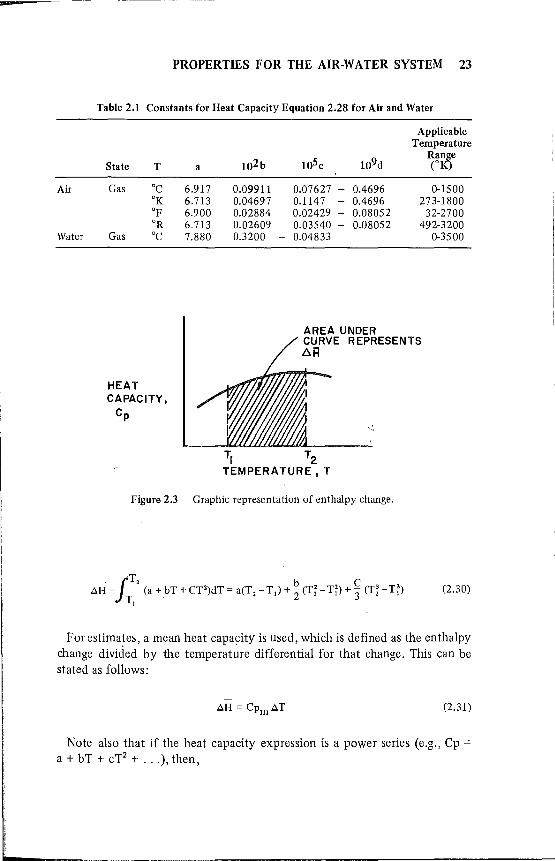
2.1 Constants for Heat Capacity Equation 2.28 for Air and Water. . . . . . . . . . . . . . . . . . . . . . . . . . . . . . .. 23
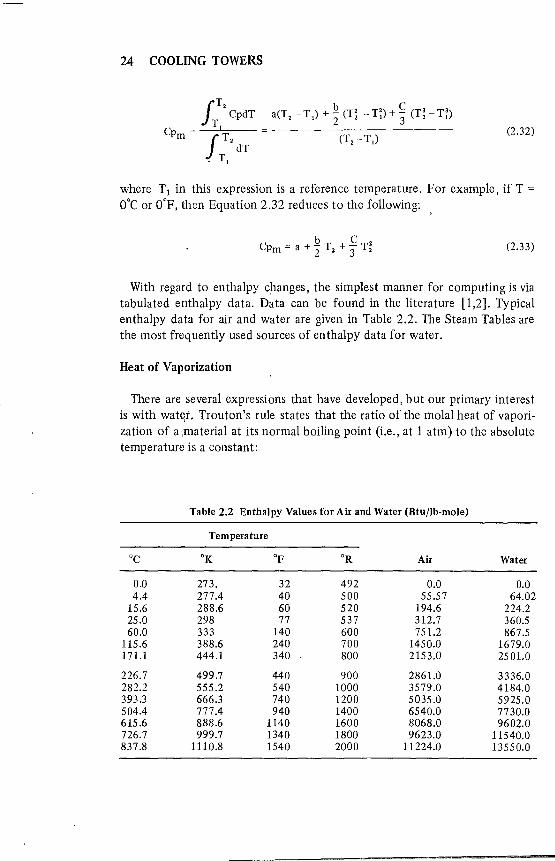
2.2 Enthalpy Values for Air and Water. . . . . . . . . . . . . . . . . .. 24 4.1 Comparison Between Characteristics of Mechanical- and
Natural-Draft Cooling Towers .................... , 78 4.2 Design Considerations and Characteristics of Dry Cooling. . .. 82 5.1 Heat Absorbed by Cooling Water for Various Operations. . .. 105 5.2 Humidification Characteristics of Packing Materials. . . . . . .. 112 5.3 Guide to Packing Height Specification. . . . . . . . . . . . . . . .. 112 5.4 Air-Water Mixtures-Enthalpies and Humidities. . . . . . . . . .. 115 5.5 Computations for Construction of Figure 5.15 . :\ . . . . . . .. 117 6.1 Maximum Temperatures and Maximum Wind Velocities for
Different Cities in the United States. . . . . . . . . . . . . . . .. 131 6.2 Fill Packing Factors at 120°F .. ',' . . . . . . . . . . . . . . . . . .. 137 6.3 Specification List for Cooling Towers. . . . . . . . . . . . . . . .. 158 7.1 Economic Considerations of Wet Cooling Systems. . . . . . . .. 181 7.2 Procedure for Estimating Potential Water Cost and Sewer
Taxes Savings ............................... , 182 8.1 Pretreatment Procedures. . . . . . . . . . . . . . . . . . . . . . . . .. 190 8.2 Chemical Treating Agents for Cooling Water Towers ..... " 197 8.3 High-Impact Polyethylene Properties. . . . . . . . . . . . . . . . .. 200 8.4 Plastics Chemicals Resistance Chart. . . . . . . . . . . . . . . . . .. 201
xi
l

CHAPTER 1
OVERVIEW
INTRODUCTION
In the light of the ecological renaissance of the last two decades, thermal pollution is now receiving serious attention. It is environmentally unacceptable to directly discharge hot water back to its source after it has been used to cool chemical process equipment, electrical generating turbines or refrigeration and air conditioning equipment. Hot process waters must either be cooled before discharge, or cooled and recyoled. Purchasing and then discarding large quantities of water into sewage systems is cost prohibitive in many parts of the country, and even if favorable economics were to exist, environmental concerns would forbid such practices.
In the past, abundant resources made' it possible to use cold water on a once-through basis. Where topographical considerations were accounted for, large ponds, lakes or canals were used to contain, cool and recirculate or discharge process waters. To facilitate cooling and reduce land requirements, spray systems were often employed to aerate the water in the ponds.
In today's economic framework, however, energy conservation matches the importance of our ecology. Consequently, utilizing cooling water efficiently is a vital engineering consideration. As examples, by using colder water, a chemical plant can condense more salable condensate, refrigeration/ air conditioning machinery will consume less power, and power plants can significantly reduce energy generation debits.
Cooling tower technology has progressed slowly until recently. A large portion of the recent advances is aimed at improving existing cooling towers to save large capital investments. When sound modern engineering principles are applied to upgrading existing designs or to "grass-roots" installations, cooling towers can produce colder water and save input energy, while at the same time eliminating potential pollution problems.
To meet these objectives, both design and process engineers must have a thorough understanding of the principles of operation and the limitations
2 COOLING TOWERS
of the best available technology that presently exists. Equally important is some insight into how technology needs are likely to change in the near future. This book is intended as a state-of-the-art review of the design and application of modern-day cooling tower technology.
HISTORICAL DEVELOPMENTS
The technique of evaporative cooling can be traced back to ancient times when rivers, seas, lakes, ponds, etc., were utilized as a medium of water supply. With limited industrial activities of the past ages and plentiful resources, cold water could be used "once-through," discharged and forgotten. Where topographical corisiderations were taken into account in plant site selection, large ponds or canals were employed to hold, cool, recirculate or discharge process waters. This type of an approach required large land areas. To reduce the amount of real estate needed, spray systems were installed to aerate the water in holding ponds and to promote faster cooling by generating more water' surface to the atmosphere in the form of spray. This early development eliminated the need to rely on top layer evaporation and sensible heat exchange.
The next logic~ development of cooling tower technology came when it was discovered that by spraying downwards in a box, instead of upwards, lower temperatures could be achieved. Shortly after this observation was made, instead of relying on prevailing winds for air movement in spray ponds and atmospheric spray towers, aerodynamically designed fans or air movers were incorporated into designs.
As the mechanics and hydrodynamics of water cooling became better understood, fill or packing material was included in designs to slow the vertical fall of water and to provide greater air/water interfacial contact for more difficult cooling. Today, everyone of these techniques is utilized in some form or another.
Cooling tower technology appears to have made an entire circle, as emphasis is once again directed toward atmospheric cooling. However, there are significant differences in these modern designs compared to early prototypes. Hyperbolic cooling towers are being constructed without the use of fans or air movers. These structures measure about 980-1700 meters in diameter at the base a~d 980-1700 meters in height. With structures of this magnitude, detailed and reliable engineering design practices are essential.
Presently, the United States accounts for 50% of the world cooling tower market. About 25% of the U.S. market is with the petrochemical industry, 15% involved in personal comfort and 60% with electric power generation [1]. More than twice as many of these towers are mechanical draft, as opposed to natural draft, units. The former type are employed nationwide,

~- ---~~-- --~-- ~~~-
OVERVIEW 3
while the latter are concentrated in the Appalachian area because of favorable climatic conditions. This balance, however, is likely to change in the light of developing technology.
OPERATING PRINCIPLES
Cooling tower operation is based on evaporative condensation and exchange of sensible heat. The mixing of two fluid streams at different temperatures (in this case air and water) releases latent heat of vaporization, causing a cooling effect to the warmer fluid (water). This cooling effect is accomplished by transforming a portion of the liqUid into a vapor state, thereby releasing the latent heat of vaporization.
This effect can be simply demonstrated by wetting the back of your hand and blowing on it. The airstream releases the latent heat of vaporization, causing the temperature of the water on the skin to drop. As the water is transformed to the vapor state, it consumes heat, which it derives from the remaining water on the skin. The net effect is one of cooling.
In a cooling tower's operation, sensible heat also plays a role. When warm water contacts cooler air, the air cools the water and its temperature rises as it gains the sensible heat of the water. Roughly 25% ,gf the sensible heat transfer takes place within the tower, with the bala~ce of the cooling phenomenon achieved from the evaporative effect of the latent heat of vaporization. In simple terms, a cooling tower is a device that transfers quantities of heat from one mass to another. As we will see in later chapters, a cooling tower is simply an air-mass heat exchanger.
A more technical description of a cooling tower is that it represents a heat rejection solution to the chemical process, or correction of the heat penalty generation of compression equipment [2]. Regardless which definition is preferred, cooling towers simply move heat from point A to point B and ultimately discharge the heat to the atmosphere. The atmosphere thus represents the ultimate disposal site for waste thermal energy and is appropriately referred to as a "heat sink."
During operation there is a loss of water. Water vapor passes through the cooling tower and is discharged into the atmosphere. For normal operation, water losses amount to approximately 0.2% of the total volume of water circulated for every 10° of cooling range, 1 % for each 12° temperature differential in the area of 1000 Btu/lb of water evaporated. As an example, a 1O,000-gpm unit with a 20° temperature range (Le., water entering at 100°F) and exiting at 80°F) will lose an average of 167 gpm of water because of evaporation. Evaporation losses are due to a number of factors, principal ones being blowdown, splashing and drift. These will be discussed in detail later.
When the temperature of the heated air is below 140°F, cooling towers

4 COOLING TOWERS
generally represent the most economical atmospheric heat rejection system. Temperature differential is related to the ambient wet-bulb temperature. It is a function of natural conditions and is independent of tower design.
In normal operations, continuously recirculating water picks up waste heat from a refrigeration compressor or process heat exchanger, and the hot water is pumped to the top of the tower and dropped over the cooling tower. Evaporative action removes the heat from the water and adds it to the air. The hot, moist air is ejected from the fan stack, and the cooled 'water returns to the compressor or exchanger to pick up more heat. Figure 1.1 illustrates the cooling tower operation.
As noted, two principles of heat transfer are involved: evaporation and convection. The rate of heat transfer by both convection and evaporation increases with an increase in air-to-water interfacial surface, relative velocity, contact time and temperature differential. Packing and fill in a tower serve to increase the interfacial surface area; the tower chimney or fans create the relative air-to-water velocity; and contact time is a function of tower size. These three factors all may be influenced by the tower design.
The ability of a tower to function is measured by how close it brings the cold water temperature to the wet-bulb temperature of the surrounding
FROM ENTERING TOWER AT TEMPERATURE TI
TO LEAVING TOWER AT T2
EXAMPLE: AT A SPECIFIED WET-BULB
TEMPERATURE (Twb ) OF 78°F -
RANGE::: ~T ::: TI - T2 ::: 20°F
APPROACH ::: T2 - Twb ::: 7 OF
Figure 1.1 Cooling tower operation.

OVERVIEW 5
air. The lower the wet-bulb temperature (which indicates either cool air, low humidity or a combination), the colder the tower can make the water. The water temperature will never go below the temperature of the incoming air. In practice, the final water temperature will be several degrees above the wet-bulb temperature.
COOLING TOWER TERMINOLOGY
There are a number of terms with rather rigorous definitions within the context of cooling tower technology. It is' worthwhile for the newcomer to this subject to learn these definitions early on in the discussions. In subsequent chapters we will apply the following definitions to establishing specific design guidelines.
Acceptance Testing-Test procedures to determine the water cooling capacity of towers. Instrumentation used and measurement procedures should be those recommended by the Cooling Tower Institute (CT!) in its "Acceptant Text Procedures."
Air Inlet-That portion of the cooling tower structure in which air is drawn into the system.
Ambient Dry-Bulb Temperature-External outdoor te'l11perature as indicated by a dry-bulb thermometer and expressed in degrees ,Fahrenheit.
Ambient Wet-Bulb Temperature- The temperature in degrees Fahrenheit to which air can be cooled, making it adiabatic to saturation by the addition of water vapor. In practical terms, the wet-bulb temperature is the temperature indicated by a thermometer, the bulb of which is kept moist by a wick and over which air is circulated.
Approach or Approach to the Wet-Bulb-The difference in temperature CF) of the cold water leaving the tower and the wet-bulb temperature of the ambient air.
Balancing Valve-Hand or mechanically operated valve installed in each riser pipe of a multicell tower to control water flow.
Basin-The area at the bottom of the tower for collecting cold water. Crossflow towers have a hot water distribution basin at the top and, in some cases, 'a water basin between the top and bottom basins.
Blowdown (Purge)-The continuous or intermittent wasting of small amounts of circulating water. Its purpose is to prevent an increase in the concentration of solids in the water due to evaporation, normally expressed as a percentage of the water being circulated.
Capacity-The average amount of water circulating in the cooling system at any given time, expressed in gallons per minute.
Casing-The vertical enclosing side- or endwall of a tower, exclusive of the air inlet louvers.
6 COOLING TOWERS
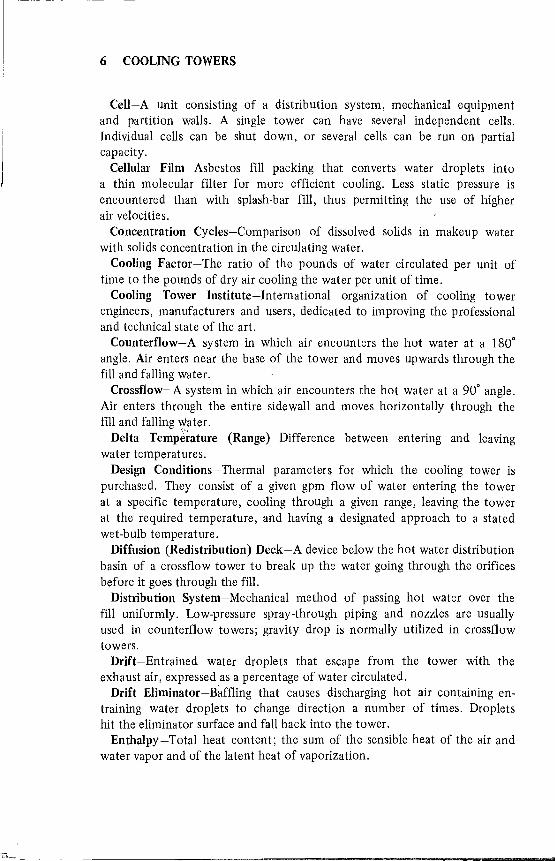
Cell-A unit consisting of a distribution system, mechanical equipment and partition walls. A single tower can have several independent cells. Individual cells can be shut down, or several cells can be run on partial capacity.
Cellular Film-Asbestos fill packing that converts water droplets into a thin molecular filter for more efficient cooling. Less static pressure is encountered than with splash-bar fill, thus permitting the use of higher air velocities.
Concentration Cycles-Comparison of dissolved solids in makeup water witli solids concentration in the circulating water.
Cooling Factor-The ratio of the pounds of water circulated per unit of time to the pounds of dry air cooling the water per unit of time.
Cooling Tower Institute-International organization of cooling tower engineers, manufacturers and users, dedicated to improving the professional and technical state of the art.
Counterflow-A system in which air encounters the hot water at a 1800
angle. Air enters near the base of the tower and moves upwards through the fill and falling water.
Crossflow- A system in which air encounters the hot water at a 900
angle. Air enters through the entire sidewall and moves horizontally through the fill and falling water.
Delta Temp~rature (Range)-Difference between entering and leaving water temperatures.
Design Conditions-Thermal parameters for which the cooling tower is purchased. They consist of a given gpm flow of water entering the tower at a specific temperature, cooling through a given range, leaving the tower at the required temperature, and having a designated approach to a stated wet-bulb temperature.
Diffusion (Redistribution) Deck-A device below the hot water distribution basin of a crossflow tower to break up the water going through the orifices before it goes through the fill.
Distribution System-Mechanical method of passing hot water over the fill uniformly. Low-pressure spray-through piping and nozzles are usually used in counterflow towers; gravity drop is normally utilized in crossflow towers.
Drift-Entrained water droplets that escape from the tower with the exhaust air, expressed as a percentage of water circulated.
Drift Eliminator-Baffling that causes discharging hot air containing entraining water droplets to change direction a number of times. Droplets hit the eliminator surface and fall back into the tower.
Enthalpy -Total heat content; the sum of the sensible heat of the air and water vapor and of the latent heat of vaporization.
OVERVIEW 7
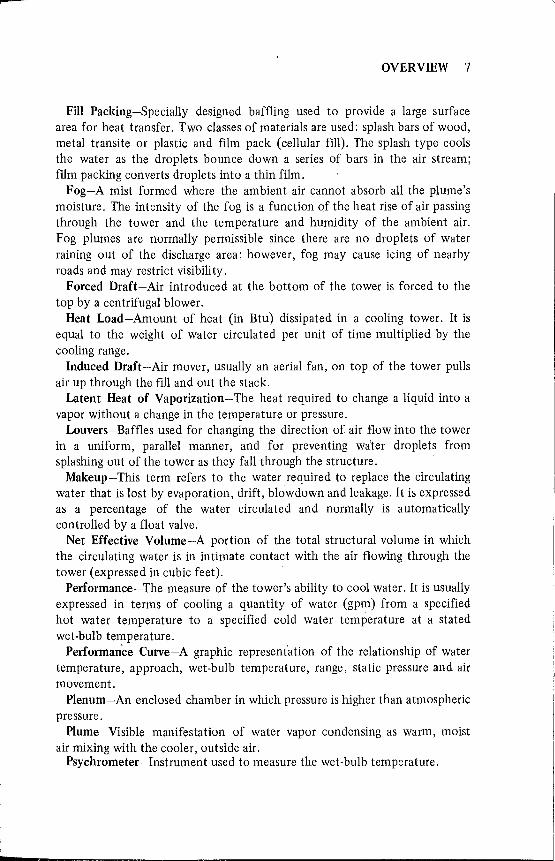
Fill Packing-Specially designed baffling used to provide a large surface area for heat transfer. Two classes of materials are used: splash bars of wood, metal transite or plastic and film pack (cellular fill). The splash type cools the water as the droplets bounce down a series of bars in the air stream; film packing converts droplets into a thin film ..
Fog-A mist formed where the ambient air cannot absorb all the plume's moisture. The intensity of the fog is a function of the heat rise of air passing through the tower and the temperature and humidity of the ambient air. Fog plumes are normally permissible since there are no droplets of water raining out of the discharge area; however, fog may cause icing of nearby roads and may restrict visibility.
Forced Draft-Air introduced at the bottom of the tower is forced to the top by a centrifugal blower.
Heat Load-Amount of heat (in Btu) dissipated in a cooling tower. It is equal to the weight of water circulated per unit of time multiplied by the cooling range.
Induced Draft-Air mover, usually an aerial fan, on top of the tower pulls air up through the fill and out the stack.
Latent Heat of Vaporization-The heat required to change a liquid into a vapor without a change in the temperature or pressure.
Louvers-Baffles used for changing the direction of air flow into the tower in a uniform, parallel manner, and for preventing water droplets from splashing out of the tower as they fall through the structure.
Makeup -This term refers to the water required to replace the circulating water that is lost by evaporation, drift, bl~wdown and leakage. It is expressed as a percentage of the water circulated and normally is automatically controlled by a float valve.
Net Effective Volume-A portion of the total structural volume in which the circulating water is in intimate contact with the air flowing through the tower (expressed in cubic feet).
Performance-The measure of the tower's ability to cool water. It is usually expressed in terms of cooling a quantity of water (gpm) from a specified hot water temperature to a specified cold water temperature at a stated wet-bulb temperature.
Performance Curve-A graphic representation of the relationship of water temperature, approach, wet-bulb temperature, range, static pressure and air movement.
Plenum-An enclosed chamber in which pressure is higher than atmospheric pressure.
Plume-Visible manifestation of water vapor condensing as warm, moist air mixing with the cooler, outside air.
Psychrometer-Instrument used to measure the wet-bulb temperature.

8 COOLING TOWERS
Pumping Head-The energy required to raise water to the distribution elevation and overcome friction losses through pipe, valves, fittings and nozzles. It is expressed in feet of liquid the pump must move and is equal to the total friction loss, static head and pressure drop through the distribution system.
Range-The numerical difference between the temperature of the hot water entering the cooling tower at the distribution system and the temperature of the colder water leaving the sump basin. '
Recirculation (Recycle)-Hot exhaust air forced downward and back into the cooling tower raises the wet-bulb temperature of the entering air above dry-bulb temperature, impairing tower performance. It is usually caused by design, wind or placement problems.
Sensible Heat-The heat requIred to change the temperature of air or water.
Static Pressure Drop-The reduction of air movement through the tower resulting from resistance of internal components such as air-intake louvers, fill packing, water distribution system, internal supporting beams, drift eliminators and fan stack configuration.
Sump-Depressed section of the cold water collecting basin, from which cooled water retlfrns to the heat source.
TDS-Total di~solved solids contained in solution in the cooling water system.
Water Load-Circulating rate of water over the tower, expressed in gallons per minute.
Wet-Bulb Temperature-The temperature of saturated air. The lower the wet-bulb temperature, the more exchange of heat a cooling tower can do. A tower cannot cool the water to a temperature below the wet-bulb temperature of the entering air.
Windage-The loss of water through the air-intake louvers as a result of malfunctioning of the wind check walls in the lower section of the tower.
DESIGN OVERVIEW
One of the earliest cooling tower configurations was developed so that the water would pass through the distribution of piping or troughs and fall vertically through the Jill packing area. In this design, air was drawn to the bottom of the tower and then moved vertically upward through the fill packing. During the fluid-fluid mixing, both air and water flowed counter to each other, thus the term counterflow tower.
To meet other requirements, such as increased water throughput, lower architectural profile demands and greater utilization of electrical energy, as well as to improve cooling efficiency, crossflow designs were developed.
....
OVERVIEW 9
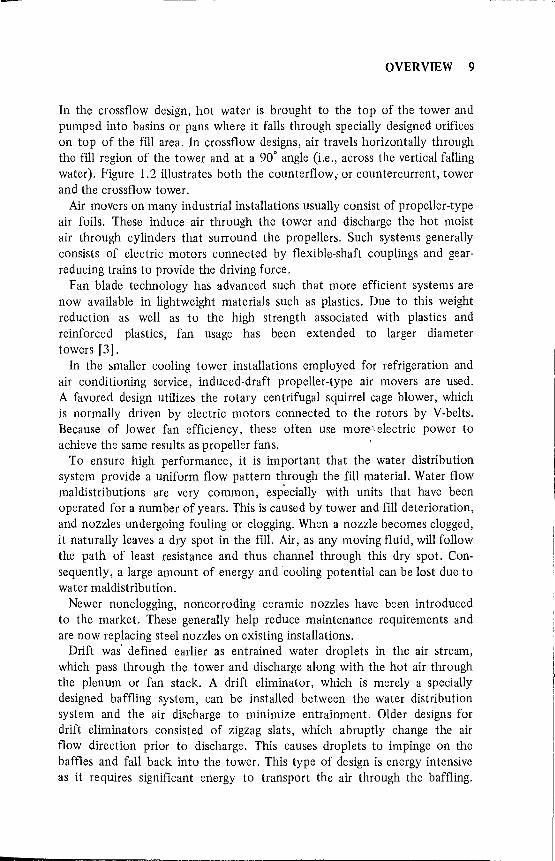
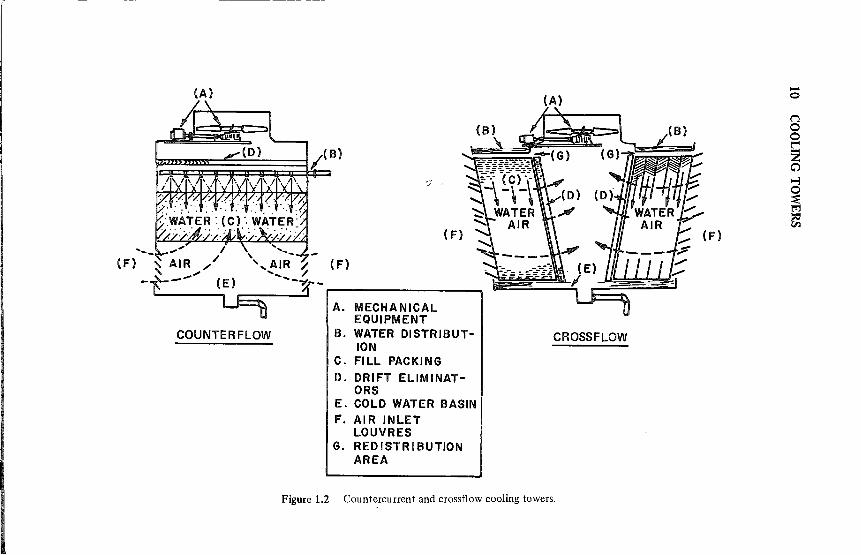
In the crossflow design, hot water is brought to the top of the tower and pumped into basins or pans where it falls through specially designed orifices on top of the fill area. In crossflow designs, air travels horizontally through the fill region of the tower and at a 90° angle (Le., across the vertical falling water). Figure 1.2 illustrates both the counterflow,· or countercurrent, tower and the crossflow tower.
Air movers on many industrial installations usually consist of propeller-type air foils. These induce air through the tower and discharge the hot moist air through cylinders that surround the propellers. Such systems generally consists of electric motors connected by flexible-shaft couplings and gearreducing trains to provide the driving force.
Fan blade technology has advanced such that more efficient systems are now available in lightweight materials such as plastics. Due to this weight reduction as well as to the high strength associated with plastics and reinforced plastics, fan usage has been extended to larger diameter towers [3].
In the smaller cooling tower installations employed for refrigeration and air conditioning service, induced-draft propeller-type air movers are used. A favored design utilizes the rotary centrifugal squirrel cage blower, which is normally driven by electric motors connected to the rotors by V-belts. Because of lower fan efficiency, these often use more,,> electric power to achieve the same results as propeller fans.
To ensure high performance, it is important that the water distribution system provide a uniform flow pattern through the fill material. Water flow maldistributions are very common, especially with units that have been operated for a number of years. This is caused by tower and fill deterioration, and nozzles undergoing fouling or clogging. When a nozzle becomes clogged, it naturally leaves a dry spot in the fill. Air, as any moving flUid, will follow the path of least resistance and thus channel through this dry spot. Consequently, a large amount of energy and 'cooling potential can be lost due to water maldistribution.
Newer nonclogging, noncorroding ceramic nozzles have been introduced to the market. These generally help reduce maintenance requirements and are now replacing steel nozzles on existing installations.
Drift was' defined earlier as entrained water droplets in the air stream, which pass through the tower and discharge along with the hot air through the plenum or fan stack. A drift eliminator, which is merely a specially designed baffling system, can be installed between the water distribution system and the air discharge to minimize entrainment. Older designs for drift eliminators consisted of zigzag slats, which abruptly change the air flow direction prior to discharge. This causes droplets to impinge on the baffles and fall back into the tower. This type of design is energy intensive as it requires significant energy to transport the air through the baffling.
(A)
, ( F)
' ... AIR / (F) ...... /
"'-1(-.-----------, iiE~=~ A. MECHANICAL
EQUIPMENT ....... ~-
COUNTERFLOW B. WATER DISTRIBUTION
CROSSFLOW
C. FILL PACKING D. DRIFT ELIMINAT
ORS E. COLD WATER BASIN F. AIR INLET
LOUVRES G. REDISTRIBUTION
AREA
Figure 1.2 Countercurrent and crossflow cooling towers.
-0
("') 0 0
2 C')
~ 0 ~ t!'l
~ (F)

F
OVERVIEW 11
Cellular eliminators (discussed later) can cause the air to change less abruptly and make multiple direction changes as well. This is a more efficient method of minimizing entrainment than the conventional wooden slat system.
Cooling towers themselves can be sources of pollution since they do not destroy heat but merely move it from one plaoe to another, ultimately discharging it to the atmosphere. There are engineering principles that can assist in the selection of the method and area of discharge. We will examine these principles in more detail in the chapters to follow.
REFERENCES
1. Kolfat, T.D. "Cooling Tower Practices," Power Eng. (January 1975). 2. Burger, R. "Cooling Tower Technology," Poll. Eng. (May 1980). 3. Cheremisinoff, N. P., and P. N. Cheremisinoff, Fiberglass-Reinforced
Plastics Deskbook (Ann Arbor, MI: Ann Arbor Science Publishers, Inc., 1978).
SUGGESTED READING
1. Burger, R. "Know Your Cooling Tower," Power (March 1979). 2. Burger, R. "Cooling Tower Retrofit," Chern. Eng. Prog:"(March 1979). 3. Dickey, 1. B. "Managing Waste Heat With the Water Cobling Tower," Com
bustion (May 1979). 4. Holzhauer, R. "Industrial Cooling Towers," Plant Eng. (July 1975). 5. Knuesch, T. "Keep Your Cool When Selecting the Right Tower," Process
Eng. (September 1978). 6. Knuesch, T. "Environmental Aspects of Cooling Tower Selection," Process
Eng. (November 1978). 7. Maze, R. W. "Air Cooler or Water Tower-Which for Heat Disposal,"
Chern. Eng. (January 1975). 8. McGraw, M. G. "Before-the-Fact Modeling Solves Tower Problem," Elec
trical World (October 1979).

INTRODUCTION
CHAPTER 2
PROPERTIES AND DEFINITIONS FOR THE AIR-WATER SYSTEM
In this chapter we will review some of the principles of thermochemistry, with particular attention to the air-water vapor system. Basic definitions in thermodynamics are reviewed along with important physical properties and definitions for gaseous mixtures. It is important that these definitions be learned early on. Note, however, that this chapter is only meant as a review. The references listed at the end of this chapter should be consulted for a detailed treatment of these subjects. Further, example problems are included at the end of the chapter to stress principles discussed.
VAPOR PRESSURE
A gas existing below its critical temperature is generally referred to as a vapor because it can condense. If a pure gas is maintained at a constant temperature below its critical temperature and the pressure is increased, eventually the gas begins to condense into a liquid. This procedure can be reversed by decreasing the applied pressure and the liquid will be transformed back to its gaseous state. In our discussions, the term vapor will be used to refer to a gas below its critical point in a process where the phase change is of interest. The terms gas and noncondensable gas will refer to a gas above the critical point or to a gas that cannot condense.
If both temperature and pressure are kept constant, then vaporization and condensation are equilibrium processes. The equilibrium pressure is referred to as the vapor pressure. There is only one pressure at which the liqUid and vapor phases of a pure substance can exist in equilibrium at a given temperature. Naturally, either phase may exist over a wide range of conditions.
13

14 COOLING TOWERS
A pressure-temperature diagram best illustrates the processes of vaporization and condensation. Figure 2.1 is such a diagram for pure water. From this plot, a corresponding pressure can be obtained at which water vapor and water liquid exist in equilibrium. Boiling water is a good example of an equilibrium condition. Any substance has an infinite number of boiling points. The "normal" boiling point, however, refers to the temperature at which boiling occurs at a pressure of 1 atm (760 mm). For water, the normal boiling point occurs when the vapor pressure of the water equals the pressure of the surrounding atmosphere.
To illustrate the' vaporization process, let us assume that we begin heating a pan of water from an initial temperature of 150°F (Point A on Figure 2.1). If the pan is open to the atmosphere, then the water vapor above the liquid surface is at all times in eqUilibrium with the liquid. As the temperature rises (and the atmospheric pressure remains constant), nothing really occurs until the water reaches 212°F, at which temperature the water begins to boil or evaporate. Evaporating water molecules push back the atmosphere and completely change from liqUid into vapor (Point B on Figure 2.1). If we now cover the pan with a lid and continue heating the water vapor from point B
D , go
A I
:x:: ---'-B C - 760 .J I 0
E ::l I 0 ICE (SOLID) E 11.1 E 500 z
11.1
15 TYPICAL
0:: LIQUID CONSTANT ::l (f) (SUBCOOLED) VOLUME LINE (f) 0 11.1 ..J F (CHARLES' LAW) 0:: a.. dS
0:: 0 VAPOR 0 180 (SUPERHEATED) a.. oct >
5 150 190 212
SOLID a VAPOR TEMPERATURE (0 F)
IN EQUILIBRIUM
Figure 2.1 Vapor pressure curve for water.
L
PROPERTIES FOR THE AIR-WATER SYSTEM 15
(which is formed at constant pressure), then the gas laws become applicable in the region B-C and higher temperatures. To reverse this process, we would cool the liquid to point B where vapor condenses to form a liqUid. The temperature at point B represents the dew point for the case described.
The process of vaporization/condensation at constant temperature can be explained by the points D, E and F on Figure 2.1. Water either would condense or vaporize at constant temperature as the pressure approaches point E on the vapor-pressure curve.
Line G-H shows that when the solid form (ice) passes directly into the vapor phase without first becoming a liquid, then sublimation is said to occur. Water sublimes below 32°F. As an example, everyone has seen frost disappear in the winter, even though the thermometer might have read 25°F.
The pressure-temperature plot of Figure 2.1 extends all the way to the critical temperature and pressure, which has not been shown. Above the critical temperature, water strictly exists as a gas. The term saturated is used to describe the vapor-liquid portion of the curve. Basically, it implies the same thing as saying that vapor and liqUid are in equilibrium with each other. The gas is said to be saturated if it is ready to condense the first drop of liqUid. Conversely, the liquid is saturated if it is just about to vaporize. For the gas, this condition is called the dew point; for the liquid, it is the bubble point.
The term "wet gas" refers to a mixture of liquid and vapor at equilibrium (Le., both liqUid and vapor are saturated). The region to the right of the vapor-pressure curve in Figure 2.1 is the superheated region. The region to the left of the curve is the subcooled regfon. The temperatures in the superheated region, when measured as the difference (line K-L) between the actual temperature of the superheated vapor and the saturation temperature for the same pressure, are referred to as the degrees of superheat. Another term we will use in later discussions is "quality." Quality refers to the weight fraction of vapor.
As we have already observed, the vapor-pressure-temperature curve is nonlinear. To reduce this curve to a linear form, a plot of log (p*) versus (l/T) can be made for moderate temperature intervals. The resultant straight line is described by the following expression, which can be derived from the Clausius-Clapeyron equation.
1 log (p*) = m T + C (2.1)
Equation 2.1 describes the change of a substance's vapor pressure with temperature. The intercept C depends on the specific substance.
An equation for the change of vapor pressure with total pressure at constant temperature is as follows:
16 COOLING TOWERS
(2.2)
where V is the molal volume of saturated liquid or gas, and Pt is the total pressure.
Under normal conditions this effect can be neglected.
SATURA TED CONDITION
The molecules of water vapor are free to migrate randomly in all directions. If in a closed vessel, the molecules will eventually distribute themselves throughout the entire volume of the container.
When any gas contacts a liquid, the gas acquires vapor from the liquid. If sufficient contact time is allowed, equilibrium will result. At equilibrium, the partial pressure of the vapor equals the vapor pressure of the liqUid at the temperature of the system. At equilibrium, the gas is said to be saturated with the vapor at the given temperature (Le., the gas is at its dew point).
Both air and water vapor can be described by the ideal gas laws. We can use this fact to col1tpute the partial pressure of air at saturation conditions. From the perfect gas l~ws at constant temperature:
and
when 7) is moles. This can be rearranged to give
Pair Pair PH,O - Pt - Pair
where Pt is total pressure.
Yair
Vt - Yair
Equation 2.5 can be generalized for any two components:
Subscripts indicate component 1 and 2.
(2.3)
(2.4 )
(2.5)
f"'
PROPERTIES FOR THE AIR-WATER SYSTEM 17
The most useful form of Equation 2.6 is:
(2.7)
If equilibrium has not been reached between a mixture of components, the condition is referred to as partial saturation. At partial saturation the gas mixture obeys real gas laws. There are several ways to express the concentration of a vapor in a mixture of gases. Most often, weight or mole fraction is used. Other definitions are relative saturation (relative humidity), molal saturation (molal humidity) and absolute saturation (absolute humidity).
Relative humidity is defined by the following relation:
Pvapor --=oRs Psatd
where Rs =0 relative saturation
(2.8)
P vapor =0 partial pressure of the vapor in the gas mix ture Psatd = partial pressure of the vapor in the gas mixture if the gas were satu
rated at the given temperature of the mixture
For the air-water system, %RH = PH,o/PH,o (100)_ A;,\OO% relative humidity, the partial pressure of the vapor is the same as the vapor pressure of the condensed vapor,
Another way to express vapor concentration is by molal saturation, which is the ratio of the moles of vapor to the moles of vapor-free gas.
where Ms =0 molal saturation 7)v =0 moles of vapor 7)' =0 the moles of vapor-free or dry gas
For a two-component system, ,
and
7), P, VI 7)1 P, v, -:::::-:;::-:::::--=--=0---
(2.9)
(2.10)
(2.1l)
(2.12)
18 COOLING TOWERS
Multiplying by the ratio of the molecular weights, the weight of vapor per weight of dry gas can be computed:
7Jy (MWy) = Wy
(MW') W' (2.13 ) ,
7J
Subscript V refers to vapor and superscript prime (') refers to the dry gas. MW is molecular weight.
Absolute saturation is defined as the ratio of the moles of vapor per mole of dry gas to the moles of vapor that would be present per mole of dry gas if the mixture were completely saturated at the existing temperature and total pressure. We can express this as
(2.14)
Note that PI saturated is really pi and that Pt = PI + P 2. Then the relation-ship becomes '
, PI
\'. . Pt- P, PI(pt-p;) % SaturatIOn = (100)--*- =* -P _p 100
PI PI t I (2.15)
Pt - pi
From Equation 2.8 we can write the following:
(Pt- P*) % Saturation = RH Pt _ P: 100 (2.16)
The percent saturation is never greater than the relative saturation except at saturated conditions or at zero percent saturation (where % saturation = %RH).
DEFINITIONS IN THERMODYNAMICS
This section reviews some basic definitions and formulas in thermodynamics. These definitions will be used to develop energy balances to describe cooling tower operations. In our discussions we will use the following terms: system, property, extensive and intensive properties, and
L
PROPERTIES FOR THE AIR-WATER SYSTEM 19
state. The term system refers to any specified mass of material or piece of equipment under consideration. Any system enclosed by a boundary that prevents the exchange of mass with the surroundings is a nonflow or closed system. An open or flow system, such as a cooling tower, has exchange of both mass and energy with the surroundings.
The term property refers to a characteristic of a material and can be measured. Examples are pressure, temperature and volume. Properties may also be computed, such as, for example, internal energy, which cannot be measured directly. An extensive property is one whose value is the sum of each of the subsystems comprising the entire system. An example is a gas mixture, in which each constituent (or subsystem) has masses or volumes different from the original system. Thus, mass or volume is an extensive property.
An intensive property is one whose values are not additive and do not vary with the quantity of the sample in the system. Examples are temperature, pressure and density.
The term state refers to material with a specified set of properties at a given time. It is not a function of the system configuration but only of its intensive properties.
Heat
Heat can be defined as a portion of the total energy flo~ across a system boundary and is caused by a temperature difference between the system and the surroundings. Heat can be exchanged by conduction, convection and/or radiation. We can evaluate heat transfer by use of the energy balance, which will be discussed later.
Work
Work can be defined as the energy transferred between the system and surroundingso It is often expressed as a vector force acting through a vector displacement on the system boundaries:
W= fFdX (2.17)
where F is in the direction of dx. Work can be classified as energy that can be transferred to or from a
mechanical state. This should not be confused with heat, which is the transfer of energy to atomic or molecular states. The former is macroscopically observable, whereas the latter is not.
20 COOLING TOWERS
Kinetic Energy
Kinetic energy refers to the energy that a system possesses because of its velocity relative to the surroundings. Mathematically it is defined as follows:
where v is fluid velocity.
Potential Energy
1 kE = -mY'
2 (2.18)
Potential energy refers to the energy a system possesses due to the force exerted on its mass by a gravitational field with respect to some reference plane. Mathematically, it is' defined as follows:
PE = mgh (2.19)
Internal Energy
Internal energy refers to the macroscopic changes of molecular, atomic and subatomic energies. All these follow rigorous conservation laws for dynamic systems. Irlternal energy is an exact differential, which, for a pure substance, can be e~pressed exclusively in terms of temperature and specific volume, U = U(T,V), where the bar (-) refers to per unit mass. By taking a total derivative we can state the following:
dU=(au)_ dT+ (a:Q) dV aT v av T (2.20)
The term (aU/aT)" is defined from thermodynamics as the heat capacity at constant volume (Cv). The second term on the right hand side (RRS) of Equation 2.20, (au/avh, is much less than Cv and can be neglected. By taking the integral of our differential expression we obtain a relation for internal energy:
- fT, t;U = CvdT
T, (2.21)
Engineers prefer to estimate internal energy changes from enthalpies.
Enthalpy
Enthalpy is an exact differential, which is expressed as the sum of two variables:

PROPERTIES FOR THE AIR-WATER SYSTEM 21
H = U + pV (2.22)
where p is pressure and V is volume. Enthalpy is a function of both temperature and pressure: H = H(T,P)-and can be expressed by the following differential expression:
dH=(aH) dT+(aH') dP aT P ap T (2.23)
(aH/aT)p is the heat capacity at constant pressure (Cp). The second term on the RHS of Equation 2.23 can be neglected at modest pressures. Therefore, the integral of this expression gives the following:
(2.24)
Enthalpy changes are most frequently computed with respect to a reference condition. In the steam tables, this reference condition is liquid water at 32°F and its vapor pressure. Thus, the left-hand side (LHS) of Equation 2.24 is
FINAL STATE OF INITIAL STATE OF SYSTEM ENTHALPY SYSTEM ENTHALPY ~~
t.H = NET ENTHALPY CHANGE = (H, - Href)
= Hz - H, (2.25)
Heat Capacity
Previously, we defined the heat capacity t~rms as follows:
Cp = (aH') aT P (2.26)
(2.27)
A simplified definition of heat capacity is the amount of energy needed to raise the temperature of a material by 1°. Various units for heat capacity include cal/(g-mole )CC), kcal/(kg-mole )(C), Btu/(lb-mole )CF), cal/(g)(C) or Btu/(lbm)CF). Heat capacity curves for water vapor and air are given in Figure 2.2.

22 COOLING TOWERS
0. .... (.)LI..
0 ..... p ....
>-11.1 1-...1 -0 (.):I!! «. Q. m «...I (.) ..... 1-' «;:) ~~
16
14
12
10
8
6 o o II)
o 0 o 0 o ~ N N
TEMPERATURE ( °c )
Figure 2.2 Heat capacity curves for air and water vapor.
o o CD It)
Most equations for heat ~apacities of substances are empirical. Heat capacity at constant pressure is generally expressed in terms of temperature with a power, series type formula:
Cp = a + bT + CT' + dT3 + ...
or sometimes in the following form:
Cp = a + bT + CT-lI' + .. .
Cp = a + bT - cr' + .. .
(2.28)
(2.29a)
(2.29b)
In general, heat capacity equations are valid only over a moderate range of temperatures. Table 2.1 gives constants to be used with Equation 2.28 for air and water gases. The units of heat capacity with these constants are cal/(g-mole )CK or °C) or Btu/ (lb -mole)(R or OF).
Another useful term is specific heat, which is the ratio of the heat capacity of one substance to the heat capacity of a reference material. The heat capacity of water is approximately unity in cgs and American engineering units.
Heat capacity is used to compute enthalpy changes. Note that the definition given by Equation 2.24 is really the area under the heat capacity curve between temperatures Tl and T2 (Figure 2.3). We can also obtain an exact integral by substituting an expression for Cp (such as Equation 2.28) into Equation 2.24 and performing the following integration:
--
Air
Water
PROPERTIES FOR THE AIR-WATER SYSTEM 23
Table 2.1 Constants for Heat Capacity Equation 2.28 for Air and Water
State T
Gas °C oK of oR
Gas °C
HEAT CAPACITY,
Cp
a
6.917 6.713 6.900 6.713 7.880
Applicable Temperature
102b lOSc 109d Range CK)
0.09911 0.07627 - 0.4696 0-1500 0.04697 0.1147 - 0.4696 273-1800 0.02884 0.02429 - 0.08052 32-2700 0.02609 0.03540 - 0.08052 492-3200 0.3200 - 0.04833 0-3500
AREA UNDER CURVE REPRESENTS L\R
T, T2 TEMPERATURE, T
Figure 2.3 Graphic representation of enthalpy change.
(2.30)
For estimates, a mean heat capacity is used, which is defined as the enthalpy change divided by the temperature differential for that change. This can be stated as follows:
(2.31)
Note also that if the heat capacity expression is a power series (e.g., Cp ==
a + bT + cT2 + ... ), then,
==
L
PROPERTIES FOR THE AIR-WATER SYSTEM 25
Ab l/J = Tb (2.34)
where Ab is the molal heat of vaporization in cal/g-mole and Tb is the normal boiling point in oK. For water, the constant ljJ has a value of 26.
The Clausius-Clapeyron equation is an exact thermodynamic relationship between the slope of the vapor pressure curve and the molal heat of vaporization:
dP* A
dT T(VG - VI)
where p* = vapor pressure T = absolute temperature
, A = molal heat of vaporization at temperature T V,G = molal volume of gas VI = molal volume ofliquid
(2.35)
Equation 2.35 can be rearranged to a simpler form by neglecting VI to give
dlnP* d(1/T) = -AIR (2.36)
where R is the ideal ~ga:;.s_l_a_w_c~o_n_s_ta_n_t_.~",!"," __________________ _
On integrating this I?xprl?ssion, WI? obtain
log,op* = A + a 2.303 RT
(2.37)
where a is a constant of the integration.
Dry-Bulb Temperature
This is the'temperature of a vapor-gas mixture as ordinarily determined by immersion of a thermometer in the gas mixture.
Dew Point
Dew Point, as waS defined earlier, is the temperature at which a vapor-gas mixture becomes saturated when cooled at a constant total pressure out of contact with a liquid.
24 COOLING TOWERS
CPm = f T z dT
_ T,
f TZ CpdT
T, aCT z - T ,) + ~ (T~ - T~) + ~ (T; - T~)
(T z -T,) (2.32)
where T 1 in this expression is a reference temperature. For example, if T =
O°C or O°F, then Equation 2.32 reduces to the following:
b C Cp = a + - T + - T Z
m 2 2 3 z (2.33)
With regard to enthalpy changes, the simplest manner for computing is via tabulated enthalpy data. Data can be found in the literature [1,2]. Typical enthalpy data for air and water are given in Table 2.2. The Steam Tables are the most frequently used sources of enthalpy data for water.
Heat of Vaporization
There are several expressions that have developed, but our primary interest is with wat~i. Trouton's rule states that the ratio of the molal heat of vaporization of a,material at its normal boiling point (Le., at 1 atm) to the absolute temperature is a constant:
Table 2.2 Enthalpy Values for Air and Water (Btujlb-mole)
Temperature
°C oK of oR Air Water
0.0 273. 32 492 0.0 0.0 4.4 277.4 40 500 55.57 64.02
15.6 288.6 60 520 194.6 224.2 25.0 298 77 537 312.7 360.5 60.0 333 140 600 751.2 867.5
115.6 388.6 240 700 1450.0 1679.0 171.1 444.1 340 800 2153.0 2501.0
226.7 499.7 440 900 2861.0 3336.0 282.2 555.2 540 1000 3579.0 4184.0 393.3 666.3 740 1200 5035.0 5925.0 504.4 777.4 940 1400 6540.0 7730.0 615.6 888.6 1140 1600 8068.0 9602.0 726.7 999.7 1340 1800 9623.0 11540.0 837.8 1110.8 1540 2000 11224.0 13550.0
26 COOLING TOWERS
Humid Volume
The humid volume of a gas-vapor mixture is the volume, in ft3, of 1 lb of dry gas and its accompanying vapor at the prevailing temperature and pressure_ From the ideal gas law we can write the following:
( 1 .JIa ) TG+460 1 (l.J1a )TG+460
vH= MWB
+MWA (359) 492 Pt
=0.730 MWB +MWA ' Pt
(2.38)
where ~H = humid volume, ft3 T G = temperature of the gas, 0 F Pt = total pressure, atm
MW A B = molecular weight of constituent A, B ila = absolute humidity
Humid Heat
This is the heat capacity, of an air-water vapo~ mixture expressed on the basis of a unit weight of bone dry air. For a mixture of absolute humidity, Jla,
(2.39)
If neither vaporization nor condensation occurs, then the heat required to raise the temperature of W A lb of dry gas and its accompanying vapor AT is
(2.40)
where Q is the heat quantity (Btu).
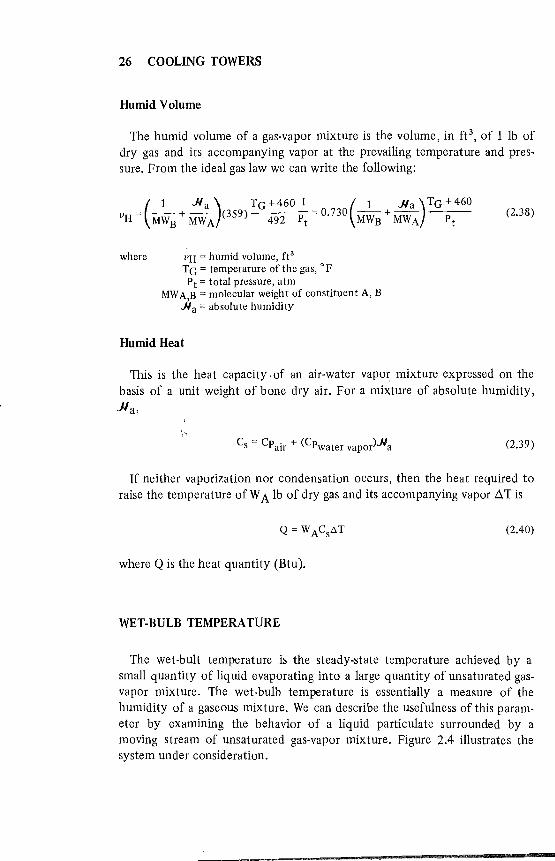
WET-BULB TEMPERATURE
The wet-buH temperature is the steady-state temperature achieved by a small quantity of liquid evaporating into a large quantity of unsaturated gasvapor mixture. The wet-bulb temperature is essentially a measure of the humidity of a gaseous mixture. We can describe the usefulness of this parameter by examining the behavior of a liquid particulate surrounded by a moving stream of unsaturated gas-vapor mixture. Figure 2.4 illustrates the system under consideration.

r PROPERTIES FOR THE AIR-WATER SYSTEM 27
P.* J: VAPOR w P-A-R-T-I-A-L----l~!..--- LATENT H~AT
PRESSURE I I PA I I
{
/ /
I I
I /' LIQUID DROP
\ \ /1
" I ...... -- ....... 1 I I I T
tw P+--SENSI~LE I I HEAT
TEMPERATURE
Figure 2.4 The principle of wet-bulb temperature.
If the liquid droplet is initially at a higher temperature than the gas dew point, then the liquid's vapor pressure would be greater at the gas-liquid interface than the partial pressure of the vapor in the gas. Under these conditions, the liquid will evaporate and water vapor molecules will diffuse into the gas stream. The latent heat needed for evaporation will first be derived from the sensible heat of the liquid drop, causing it to cool down. When the liquid temperature has dropped below the dry-bulb temperature of the gas, heat begins to flow from the gas to the liquid. The rate at which this heat transfer occurs increases as the temperature differential becomes greater. After sufficient time, the heat transfer rate from gas to liquid matches the rate of heat requirement for the evaporation. Here, the temperature of the liquid remains at some constant low value known as the wet-bulb temperature.
We can describe this process by a simple mathematical model developed for steady-state conditions. The total heat release at the interface, q, can be expressed in terms of the latent heat of vaporization and heat of solution, qs:
(2.41)
where A. is the molar-heat of evolution and NAB is the mass rate of diffusion or mass flux.
In the example given by Figure 2.4, there is no heat transfer across the gas-liquid interface (Le., q = 0), and we can assume that air does not diffuse into the liquid droplet (Le., NB= 0).

28 COOLING TOWERS
By asswning the rate of mass transfer is small and using principles of the film theory [3], the following expressions can be developed:
qs = N MW C /1 (TG - tW) "" hG(TG - tW) 1 - e- A A A lG
where CA = heat capacity, Btu/(lb)CF) hG == heat transfer coefficient of the gas, Btu/(hr)(ft'WF) TG == temperature of the gas, of tw = wet-bulb temperature, of F' = overall mass transfer coefficient, Ib-mol/(hr)(ft2)
kG = gas phase mass transfer coefficient, Ib-mole/(hr)(ft2)(atm) Pt = total pressure, atm
P 1,B = partial pressure, atm PAW = vapor pressure of component A at the wet-bulb temperature, atm
(2.42)
(2.43)
Equations 2-42, 2-43 and 2-41 can be combined and, through some algebraic acrobaNcs, the following expression derived:
TG -tw (2.44 )
The quantity TG - tw is known as the wet-bulb depression. kH is the redefined mass transfer coefficient defined by
(2.45)
where PGM is the average partial pressure of the gas . .Ha and .HaW are the molal absolute humidity at TG and tw, respectively
(Ib-mole vapor/lb-mole gas). hG/kH is known as the psychrometric ratio. The wet-bulb temperature is measured with a device called a psychrometer. .
A simple one can be made by attaching a wick or porous cotton cloth to the mercury bulb of a thermometer and then wetting the wick. As long as the gas flow past the wick is turbulent, readings are not affected by gas velocity and the psychrometric ratio is constant. Dropkin [4] showed that for the air-water system hG/kH "'" 0.227.
r PROPERTIES FOR THE AIR-WATER SYSTEM 29
HUMIDITY CHARTS
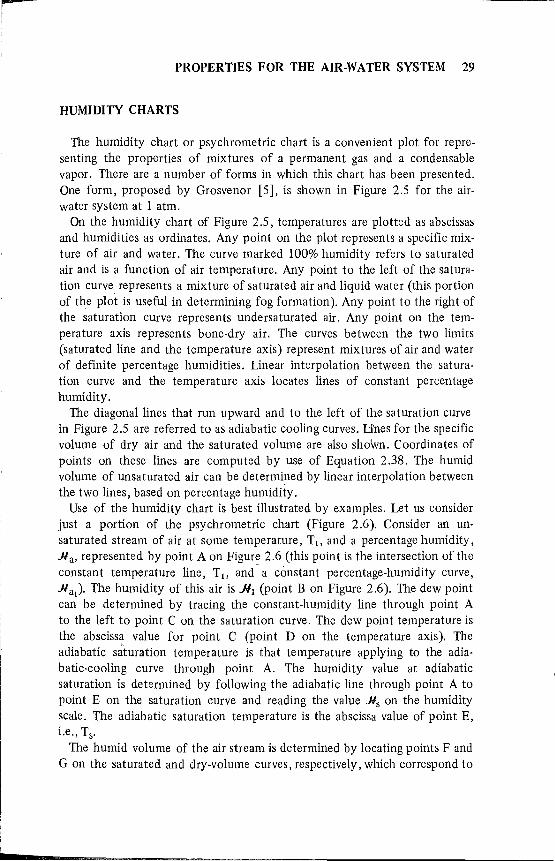
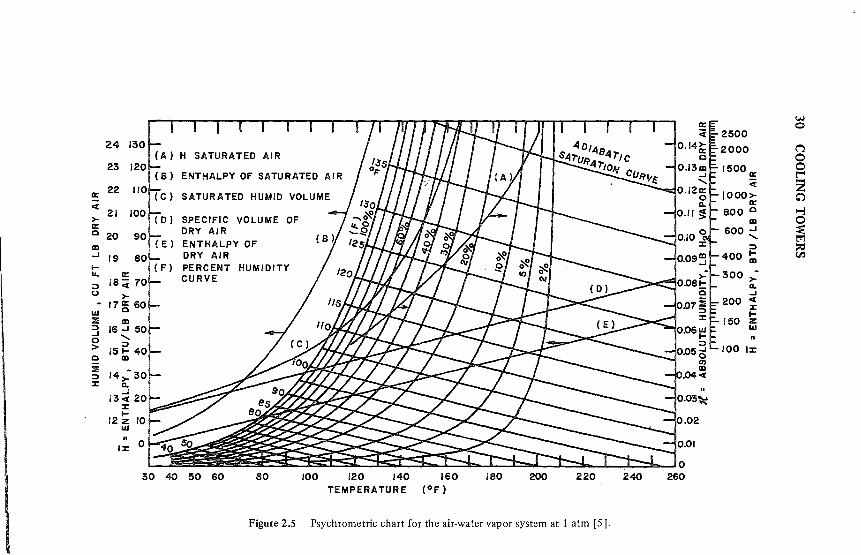
The humidity chart or psychrometric chart is a convenient plot for representing the properties of mixtures of a permanent gas and a condensable vapor. There are a number of forms in which this chart has been presented. One form, proposed by Grosvenor [5], is shown in Figure 2.5 for the airwater system at 1 atm.
On the humidity chart of Figure 2.5, temperatures are plotted as abscissas and humidities as ordinates. Any point on the plot represents a specific mixture of air and water. The curve marked 100% humidity refers to saturated air and is a function of air temperature. Any point to the left of the saturation curve represents a mixture of saturated air and liquid water (this portion of the plot is useful in determining fog formation). Any point to the right of the saturation curve represents undersaturated air. Any point on the temperature axis represents bone-dry air. The curves between the two limits (saturated line and the temperature axis) represent mixtures of air and water of definite percentage humidities. Linear interpolation between the saturation curve and the temperature axis locates lines of constant percentage humidity.
The diagonal lines that run upward and to the left of the saturation curve in Figure 2.5 are referred to as adiabatic cooling curves. Li'nes for the specific volume of dry air and the saturated volume are also shown. Coordinates of points on these lines are computed by use of Equation 2.38. The humid volume of unsaturated air can be determi!1ed by linear interpolation between the two lines, based on percentage humidity.
Use of the humidity chart is best illustrated by examples. Let us consider just a portion of the psychrometric chart (Figure 2.6). Consider an unsaturated stream of air at some temperature, T b and a percentage humidity, Jla, represented by point A on Figure 2.6 (this point is the intersection of the constant temperature line, T 1, and - a constant percentage-humidity curve, Jla1). The humidity of this air is fi1 (point B on Figure 2.6). The dew point can be determined by tracing the constant-humidity line through point A to the left to point C on the saturation curve. The dew point temperature is the abscissa value for point C (point D on the temperature axis). The adiabatic s;turation temperature is that temperature applying to the adiabatic-cooling curve through point A. The humidity value at adiabatic saturation is determined by following the adiabatic line through point A to point E on the saturation curve and reading the value Jls on the humidity scale. The adiabatic saturation temperature is the abscissa value of point E, Le., Ts.
The humid volume of the air stream is determined by locating points F and G on the saturated and dry-volume curves, respectively, which correspond to
w 0
2500 24 130
(A) H SATURATED AIR 2000 ("')
0 23 120
ENTHALPY OF SATURATED
II:: 22
< 21 100
SPECIFIC VOLUME OF >-II:: DRY AIR c 20 III ENTHALPY OF ..J 19 DRY AIR
150011:: 0 t""
< Z 1000>- C')
II:: BOO C ~
III 0 600 Z ~
~ ::c 400 ~ tor.l
I- PERCENT HUMIDITY .... CURVE 300 ; ~ II. 0 ..J
200 < :z:
1&1 I-::IE ~
150 z 1&1
..J 0 > 100 I:z: c ::E ~ :z:
10
I:z: 0
30 40 50 60 SO 100 120 140 160 180 200 220 240 TEMPERATURE (OF)
Figure 2.5 Psychrometric chart for the air-water vapor system at 1 atm [5].
r !
i I
L
---------
PROPERTIES FOR THE AIR-WATER SYSTEM 31
Ts T. TEMPERATURE
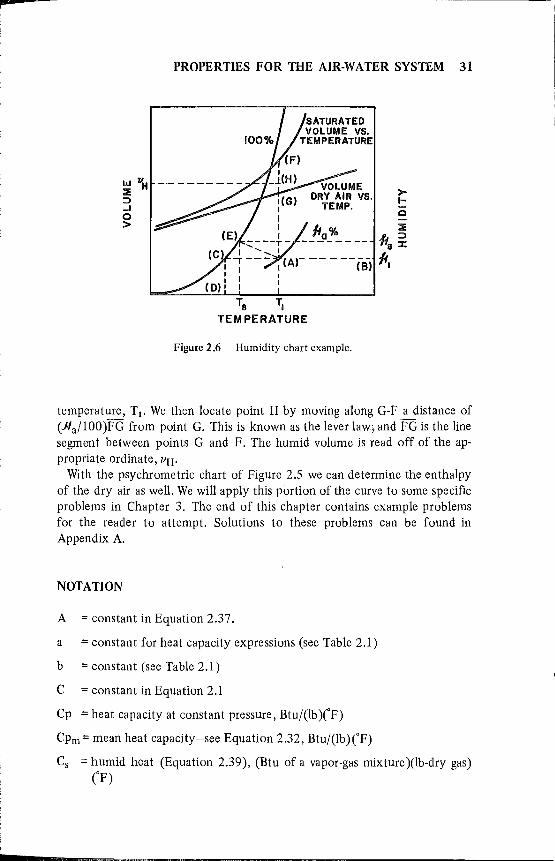
Figure 2.6 Humidity chart example.
temperature, T!. We then locate point H by moving along G-F a distance of (Ra/lOO)FG from point G. This is known as the lever law; and FG is the line segment between points G and F. The humid volume is read off of the appropriate ordinate, /lH'
With the psychrometric chart of Figure 2.5 we can determine the enthalpy of the dry air as well. We will apply this portion of the curve to some specific problems in Chapter 3. The end of this chapter contains example problems for the reader to attempt. Solutions to these problems can be found in Appendix A.
NOTATION
A = constant in Equation 2.37.
a = constant for heat capacity expressions (see Table 2.1)
b = constant (see Table 2.1)
C = constant in Equation 2.1
Cp = heat capacity at constant pressure, Btu/(lb )(F)
CPm = mean heat capacity-see Equation 2.32, Btu/(lb) (F)
Cs = humid heat (Equation 2.39), (Btu of a vapor-gas mixture )(lb-dry gas) (F)

32 COOLING TOWERS
Cv = heat capacity at constant volume, Btu/(lb )CF)
c = constant (see Table 2.1)
F = force, lbf
Fl = mass transfer coefficient, Ib-mole/(hr)(ft2)
g = gravitational acceleration, 32.2 ft/sec2 or (980 cm/se,c2)
H = enthalpy, Btu/lb
.JI = humidity, lb vapor /lb dry gas
h = distance above reference plane, ft
hG = heat transfer coefficient, Btu/(hr)(ft2)CF)
KE = kinetic energy, Btu
k = mass transfer coefficient, Ib-mole/(hr)(ft2)(atm)
MW = molecular weight, lb/lb;mole
Ms = molal saturation, moles vapor/moles dry gas
m = mass, lb
N = molar hux, Ib-mole/(hr)(ft 2)
P = pressure, atm
PE = potential energy, Btu
p = partial pressure, atm
p * = vapor pressure, atm
Q = heat quantity, Btu
q = heat release, Btu/sec
R = gas constant, 0.729 (ft 3)( atm )/(lb-mole )CR)
Rs = relative saturation
RH = relative humidity
T = temperature, ~F
tw = wet-bulb temperature, of
U = internal energy, Btu/lb
V = volume, fe
V = molar volume, ft3/lb-mole
r
I L
PROPERTIES FOR THE AIR-WATER SYSTEM 33
v = fluid velocity, fps
W = work done, ft-lb[
w = weight or mass, lb
x = distance, ft
7) = number of moles, lb-mole
A. = latent heat of vaporization, Btu/lb
/J == humid volume, ft3
ljJ = ratio of molal heat of vaporization to its normal boiling point.
Subscripts
1,2 = positions 1, 2
a = absolute
A = substance A, the vapor
B == substance B, the gas
G == refers to gas
= saturated
w = at wet-bulb temperature
PROBLEMS
2.1 A mixture of vapor and liquid is 'in equilibrium. The density of the mixture is 0.99 lb/ft3. From the Steam Tables, determine the quality of steam for the conditions of 305°F and 72.2 psia.
2.2 A lS00-cm3 sample of wet H2 is saturated at 35°C and 752 mm Hg. Determine the volume of dry gas at standard conditions. The vapor pressure of water at 35°C is 42.18 mm Hg.
2.3 The percentage humidity of air at 90°F and total pressure of 755 mm Hg is 29%. Determine the percent relative humidity, the partial pressure of the water vapor in the air, and the dew point.
2.4 Prove that the heat capacity for an ideal gas is given by Cp = Cv + R, where R is the gas law constant.
2.5 The heat capacity equation for a material is as follows:

This page intentionally left blank
-
I
l
CHAPTER 3
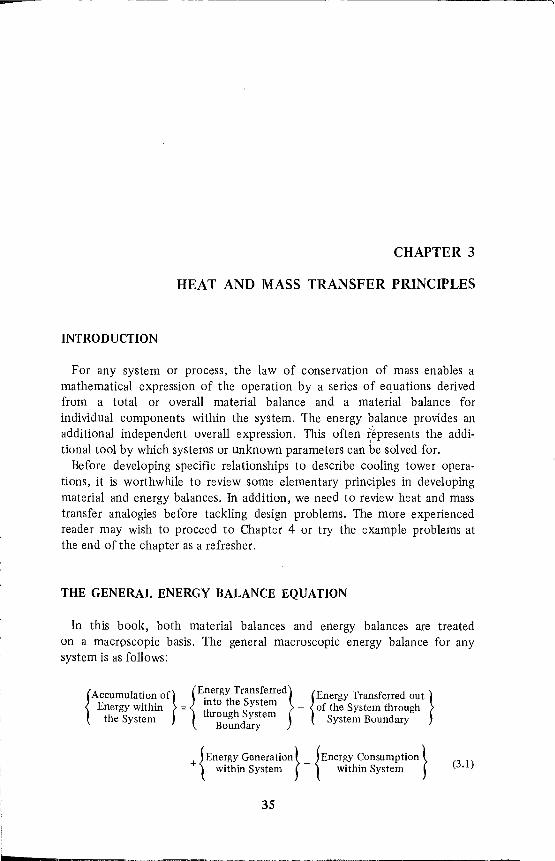
HEAT AND MASS TRANSFER PRINCIPLES
INTRODUCTION
For any system or process, the law of conservation of mass enables a mathematical expression of the operation by a series of equations derived from a total or overall material balance and a material balance for individual components within the system. The energy balance provides an additional independent overall expression. This often <~presents the additional tool by which systems or unknown parameters can be solved for.
Before developing specific relationships to describe cooling tower operations, it is worthwhile to review some elementary principles in developing material and energy balances. In addition, we need to review heat and mass transfer analogies before tackling design problems. The more experienced reader may wish to proceed to Chapter 4 or try the example problems at the end of the chapter as a refresher.
THE GENERAL ENERGY BALANCE EQUATION
In this book, both material balances and energy balances are treated on a macrpscopic basis. The general macroscopic energy balance for any system is as follows:
{A .} {Energy TranSferred} { } ccumulat~o~ of into the S s em Energy Transferred out
Energy wlthm = thr I S y t - of the System through the System Boug ld ystem System Boundary
oun ary
{Energy Generation} _ {Energy consumption}
+ within System within System (3.1)
35
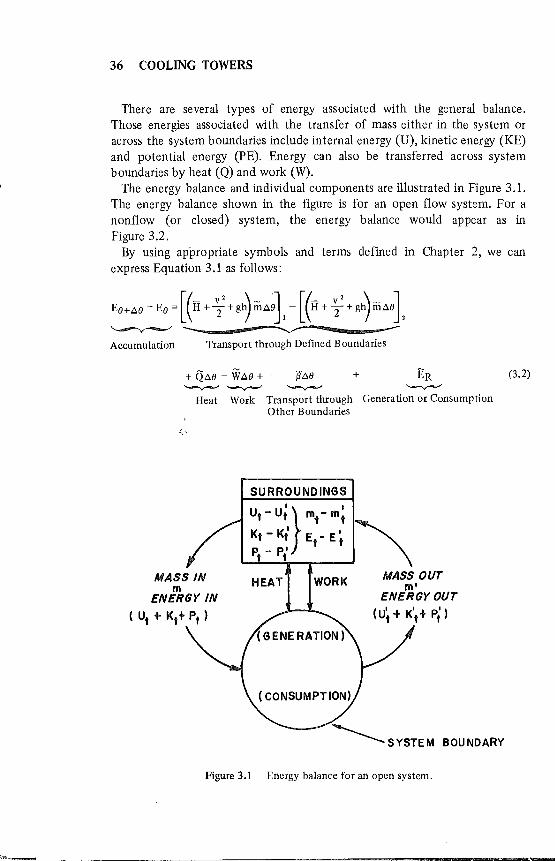
36 COOLING TOWERS
There are several types of energy associated with the general balance. Those energies associated with the transfer of mass either in the system or across the system boundaries include internal energy (U), kinetic energy (KE) and potential energy (PE). Energy can also be transferred across system boundaries by heat (Q) and work (W).
The energy balance and individual components are illustrated in Figure 3.l. The energy balance shown in the figure is for an open flow system. For a nonflow (or closed) system, the energy balance would appear as in Figure 3.2.
By using appropriate symbols and terms defined in Chapter 2, we can express Equation 3.1 as follows:
Ee+t.e- Ee = [(II + ;'+ gl) mt.~l- [(II + ;' + gl~mt.el ~- ~ ---Accumulation Transport through Defined Boundaries
+ Qt.e - WM +' ~t.e + '--v-"' '--v-"' '--v-"'
Heat Work Transport through Other Boundaries
MASS IN m
ENERGY IN ( Ut + Kt+ Pt )
SURROUNDINGS
HEAT WORK
ER '--v-"'
Generation or Consumption
MASS OUT m'
ENERGY OUT ( U' + K' + P') t t t
BOUNDARY
Figure 3.1 Energy balance for an open system.
(3.2)
~---- ----------------------------------------------------------------~--~---
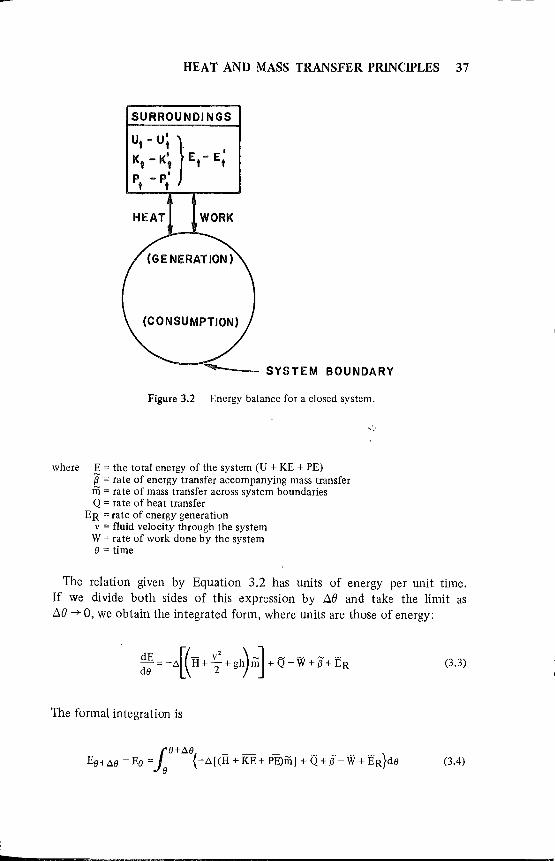
L
HEAT AND MASS TRANSFER PRINCIPLES 37
HEAT WORK
SYSTEM BOUNDARY
Figure 3.2 Energy balance for a closed system.
where E = the total energy of the system (U + KE + PE) 'if = rate of energy transfer accompanying mass transfer m = rate of mass transfer across system boundaries Q = rate of heat transfer
E R = rate of energy generation v = fluid velocity through the system
W = rate of work done by the system IJ = time
The relation given by Equation 3.2 has units of energy per unit time. If we divide both sides of this expression by !::J.8 and take the limit as !::J.8 -+ 0, we obtain the integrated form, where units are those of energy:
(3.3)
The formal integration is
(3.4)
38 COOLING TOWERS
and, finally,
Ee+M - Ee = -t.[(H + KE + PE)mj + Q - W + ER 0.5)
The quantities designated in Equation 3.5 without the tilde (~) are integrated values. The bar (-) indicates per unit mass.
Note that the enthalpy expression is really
t.H = t.U + t.pV (3.6)
where Llp V represents the pressure energy, Le., the work required to transfer a unit mass of material into a system and the work done by the system on a unit mass leaving the system. As defined in Chapter 2, work is
(3.7)
and if the pressures at the entrance and exit to the system remain constant for differential displacements of mass,
0.8)
where the subscript 1 now refers to the upstream condition and V is the volume per unit mass. By the same reasoning, the work recovered is W2 =P,V,.
For many cases, including cooling towers, not all the terms of the general energy balance expression need be considered. The most common assumptions applied to the general energy balance are summarized below. Some of these assumptions we will later apply to developing specific relationships for cooling towers.
(No Mass Transfer), Le., a closed system
b.E = Q - W
This is known as the first law of thermodynamics.
(No Accumulation, No Mass Transfer, No Reactions)
Q=W
(No Accumulation, No Reactions, With Mass Flow)
Q - W = b.[(H + KE + PE)mj
(3.9)
0.10)
(3.11)
-- ---~~ -------------------------------"-----

r
I I I
l
HEAT AND MASS TRANSFER PRINCIPLES 39
(No Accumulation)
Q,W,KE,PE,ER,b.H = 0 (3.12)
(No Accumulation, No Mass Transfer)
W,KE,PE= 0 (3.13)
(3.14)
Additional cases applied to the general energy balance are:
1. Isothermal. This is a constant-temperature system (i.e., dT = 0). 2. Adiabatic. This means no heat exchange (i.e., Q = 0). Examples include
insulated systems, small Q in relation to other terms in the energy equation, and very fast processes where there is insufficient time for heat transfer to take place.
3. Isobaric. This is a constant-pressure system (i.e., dP-':= 0). 4. Isometric. This is a constant-volume system (Le., dV = 0).
PRINCIPLES OF ENERGY AND MATERIAL BALANCES
Engineers like to approach process problems with a "black box" technique. That is, any system or piece of equipment operating under steady-state conditions can be represented by a bo~ with input and output streams consisting of mass flows and/or energy. Figure 3.3 illustrates the concept.
MS INPUT STREA
A, LI kg/sec ,
B, GI
W, WOR~ OUT
+ I I I
ER = ENERGY
RELEASED FROM SOLUTION, REACTION, ETC., AT SOME REFERENCE TEMP.
T
OUTP UT STREAMS
2 e,L
D, G2
Figure 3.3 Process operations or equipment can be represented by a generalized flow process known as the black box technique.
40 COOLING TOWERS
For the generalized process in Figure 3.3, an overall material balance would be as follows:
MASS IN - MASS OUT = ACCUMULATION (3.1Sa)
or
MASS IN = MASS OUT, @ STEADY STATE (3.1Sb)
(3.1Sc)
as derived from Figure 3.3. If we have several components in the streams that we can distinguish as
a, b, c ... , then we can describe each of these by Xji, the weight fraction of any component, j, for any input or output stream, i. Thus, a material balance for component "a" would be
(3.16)
For component b, etc., it would be
(3.17)
We can also write an overall energy balance by defining Hi as the enthalpy of the system with respect to some reference temperature of any component. If we neglect kinetic and potential energy changes, we obtain the following:
(3.18)
The solution of steady-state material and energy balances can be quite tedious, depending on the complexity of the process. Consequently, computers must be relied on heavily for more complex analysis. The following example illustrates a slightly more involved system than the one shown in Figure 3.3. As a refresher, the reader may try some of the study problems at the end of this chapter. More examples can be found in the literature [1-3].
Example I-Developing Simultaneous Material and Energy Balances
We can examine the generalized flow process of Figure 3.3 by its individual equipment or process components. For the purposes of this
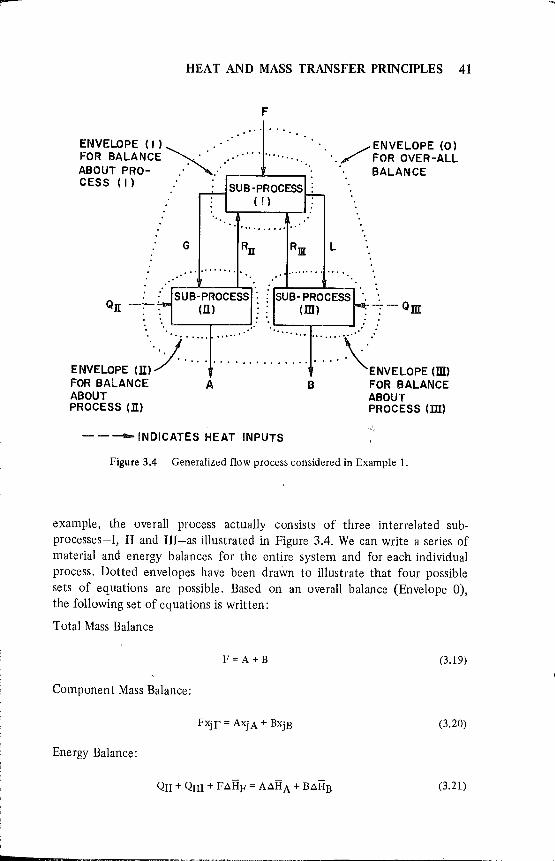
l
HEAT AND MASS TRANSFER PRINCIPLES 41
F 0" ".
ENVELOPE (I) ... ' .. '. ENVELOPE (0) FOR BALANCE ~., ........ .......... '. / FOR OVER-ALL
ABOUT PRO- ... "." '. BALANCE CESS (I) SUB-PROCESS .
(I)
" •••••••••• 0'
G L
" ...... . . ............ .
SUB-PROCESS: ; SUB-PROCESS (IT) • . (m) ~ -7 - Qm
ENVELDPE In~):···:··· ·:····:·\ENVELOPE (UD
FOR BALANCE A B FOR BALANCE ABOUT ABOUT PROCESS (n) PROCESS (m)
- - - INDICATES HEAT INPUTS
Figure 3.4 Generalized flow process considered in Example 1.
example, the overall process actually consists of three interrelated subprocesses-I, II and III-as illustrated in Figure 3.4. We can write a series of material and energy balances for the entire system and for each individual process. Dotted envelopes have been drawn to illustrate that four possible sets of equations are possible. Based on an overall balance (Envelope 0), the following set of equations is written:
Total Mass Balance
F=A+B (3.19)
Component Mass Balance:
(3.20)
Energy Balance:
(3.21)

42 COOLING TOWERS
For a balance about subprocess I (Envelope I):
Total:
F + Rn + Rill = G + L (3.22)
Component:
(3.23)
Energy:
(3.24)
For a balance about subprocess II (Envelope II):
Total:
(3.25)
Component:
(3.26)
Energy:
(3.27)
For a balance about subprocess III (Envelope III):
Total:
L = RIll + B (3.28)
Component:
(3.29)
Energy:
(3.30)
Note that not all of these equations are independent. For example, if we sum up the mass balances from Envelopes I, II and III, the overall material balance (Equation 3.19) is obtained. Similarly, the sum of the
i
I
L
HEAT AND MASS TRANSFER PRINCIPLES 43
energy balances from Envelopes I, II and III gives the overall energy balance (Equation 3.21).
PRINCIPLES OF DIRECT-CO NT ACT TRANSFER
A review of heat exchanger design and configuration is beyond the scope of this volume. However, the reader who wishes to review some of these principles can refer to the literature [2-4]. In conventional heat exchangers, the hot and cold fluids are separated by impervious boundaries or surfaces. If the equipment is tubular, it is the tube that limits the intimacy of contact between the two fluids. It also acts as a surface on which resistances tend to accumulate. These resistances develop in the form of fouling and scale films. So that a fluid in turbulent motion within the tube receives heat, particles in the eddying fluid body must be able to contact a warm film at the tube wall. Here it acquires heat by means of conduction, then mixes with the eddying fluid body. On the shells ide of the exchanger a similar process takes place, with the net heat exchange occurring through as many as seven individual resistances.
Shell and tube heat exchangers evolved because of the need to prevent contamination of the hot fluid by the cold fluid in ril'any heat transfer operations. In the case of a water cooling tower, where ~ne of the fluids is a gas and the other a liqUid, an impervious surface or separation is not necessary because the gas and liqUid are .readily separable after mixing and exchanging heat.
Cooling towers fall under the general category of direct-contact equipment. In direct-contact equipment, fouling resistances are automatically eliminated because a surface is no longer available on which they can form. This is a unique feature because it allows direct-con tact equipment to operate indefinitely without interruption in therm~l performance.
As noted back in Chapter 1, a cooling tower is basically a box-like structure with internals designed to promote better air-water contact. Cooling towers are used to contact hot water from process cooling systems with air for the purpose of cooling this water, thus making it again useful in the process. Normal cooling tower operation can reduce fresh cooling water reqUirements by as much as 98%. However, as we will see later, there is some mutual contamination caused by the saturation of air with water vapor.
The principles of direct-contact heat transfer, treated in the discussions to follow, are presently almost exclusively applied to water cooling and humidification of air. It should be noted, however, that these very same principles can be applied to the cooling or heating of just about any insoluble gas or liqUid.

44 COOLING TOWERS
HEAT AND MASS TRANSFER ANALOGIES
Suppose we take a sample of bone-dry air at some temperature, Tb and directly contact it with water until it becomes saturated at the same temperature. The water vapor that enters into the air contains with it its latent heat of vaporization. The vapor pressure of water out of the liquid will be greater than it is in the saturated air, causing yaporization to occur and subsequently increasing the humidity of the air-water-vapor mixture. The pr9cess of vaporization ends when the vapor pressure of the water in the air becomes equal to that of the liqUid. At this condition the air is saturated. During the air saturation process, isothermal conditions for the water can be maintaine~ if heat is supplied to replace the heat lost from it to the gas as latent heat of vaporization. Thus, heat transfer during the saturation of a gas with a liqUid can be accomplished without a temperature differential (although this is rarely encountered). This type of heat transfer phenomenon, better known as diffusional heat transfer, is different from conduction, convection or radiation.
The transfer of mass from on~ phase to another because of a concentration difference (or, in this case, because of vapor pressure) is called diffusion. Diffusion, or mass transfer, although analogous to heat transfer, must be set apart from the basic concepts of heat transfer.
Analogies have been developed between heat transfer and fluid friction (Le., energy and momentum analogies) [5-7]. Similarly, analogies have been developed for systems having a transfer of matter by diffusion accompanied by heat transfer [8-10]. Our discussion here is limited to flow in a tube.
When handling gases, the heat transfer factor for a fluid flowing inside a tube [8,9] is best expressed as follows:
Often the heat transfer factor is deduced as jh:
where D = inside tube diameter, ft G = mass velocity, lb/(hr)(fe)
And from a simple heat balance,
(3.31)
(3.32)
(3.33)
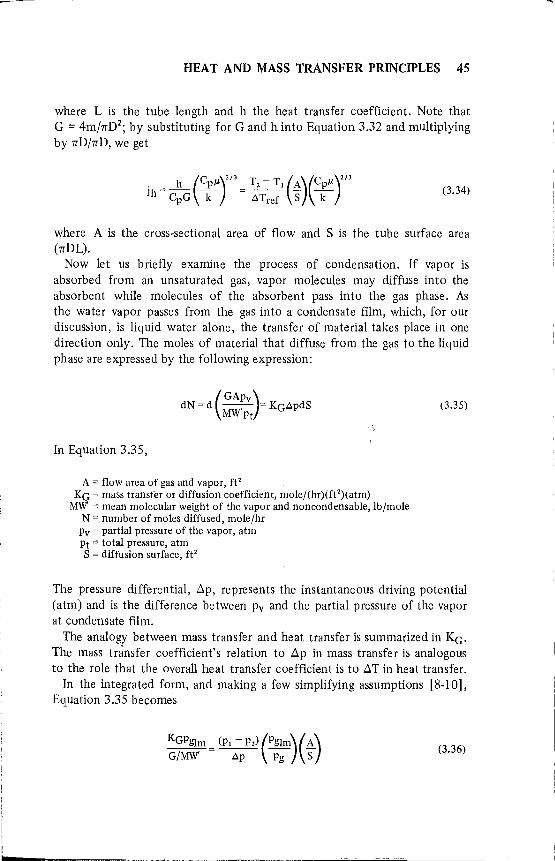
HEA T AND MASS TRANSFER PRINCIPLES 45
where L is the tube length and h the heat transfer coefficient. Note that G = 4m/7TD2
; by substituting for G and h into Equation 3.32 and multiplying by 7TD/7TD, we get
ih = l (CPIl)2/3 = T2 - TI (.A)(CPIl)2/3 CpG k l>Tref S k
(3.34)
where A is the cross-sectional area of flow and S is the tube surface area (7TDL).
Now let us briefly examine the process of condensation. If vapor is absorbed from an unsaturated gas, vapor molecules may diffuse into the absorbent while molecules of the absorbent pass into the gas phase. As the water vapor passes from the gas into a condensate film, which, for our discussion, is liquid water alone, the transfer of material takes place in one direction only. The moles of material that diffuse from the gas to the liqUid phase are expressed by the following expression:
(GAPV) dN = d --, - = KGl>pdS MWPt
In Equation 3.35,
A = flow area of gas and vapor, ft2 KG = mass transfer or diffusion coefficient, mole/(hr)(ft2)(atm)
MW = mean molecular weight of the vapor and noncondensable, lb/mole N = number of moles diffused, mole/hr
Pv = partial pressure of the vapor, atm Pt = total pressure, atm S = diffusion surface, ft'
(3.35)
The pressure differential, Llp, represents the instantaneous driving potential (atm) and is the difference between Pv and the partial pressure of the vapor at condensate film.
The analogy between mass transfer and heat transfer is summarized in KG. The mass transfer coefficient's relation to Llp in mass transfer is analogous to the role that the overall heat transfer coefficient is to LlT in heat transfer.
In the integrated form, and making a few simplifying assumptions [8-10], Equation 3.35 becomes
KGPg}m = (PI - P2) (pglm) (.A) G/MW' l>p Pg S
(3.36)

46 COOLING TOWERS
where Pl,P2 are the partial pressures of the diffusing material at Sl and S2, respectively. Pglm is the log mean of the pressure of the inert gas in the gas body, Pg. Colburn et al. have reduced this expression to the following:
(3.37)
where jd and kd are the diffusion or mass transfer factor and the diffusion coefficient, respectively. Note the similarity between Equations 3.37 and 3.32.
There is a great deal of evidence to show that both jd and jh have the same functional dependency on the Reynolds number. By equating the expressions for jd and jh we can develop an expression for the overall mass transfer coefficient in terms of heat and mass transfer coefficients.
h(C Jl/k) 21 3
K = p G C P MW'(Jl/pkd)2/3 P glm
(3.38)
Equation 3.38 properly implies that both the rates of diffusion and heat transfer are not Independent.
There are nu'fnerous empirical correlations that have been developed for the diffusi vity, kd. One expression developed. by Gilliland [11] is given below. Others can be found in the literature [12]:
T3/
2 (1 1 )1/2 kd = 0.0166 Pt(vA3 + Vlt)2 MWA + MWB
where the units ofkd are ft2/hr, and
v A, VB = molecular volumes of diffusing and inert gases T = absolute temperature, OK
MW A B = molecular weights of the diffusing and inert gases Pt = total pressure, atm
MASS TRANSFER THEORY
(3.39)
The action of diffusion is illustrated in Figure 3.5 for a system consisting of air, acetone and water. Let us assume we have a column in which fresh water continuously flows down the walls in the form of a film or thin layer. If we introduce a gaseous mixture of acetone and air to the column, the acetone will diffuse into the water phase. For the purposes of this example, assume the air to be insoluble in water. In our idealized system a stagnant
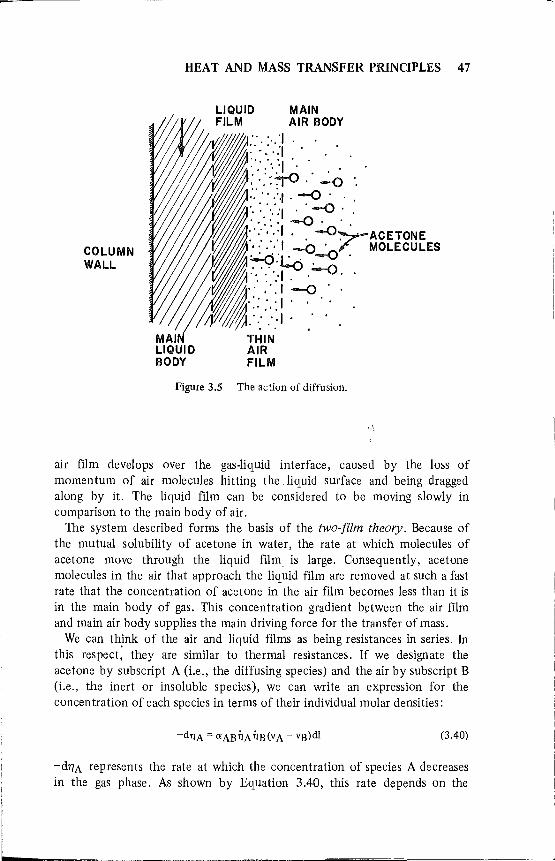
l
COLUMN WALL
HEAT AND MASS TRANSFER PRINCIPLES 47
LIQUID FILM
MAIN AIR BODY
~III :.:;;:i ." ..
I:::<r~~ ... '., ',:1 ' -0', .'. -0 . :<:'-:-:1 , . ~;-;"-ACETONE •. t.:p~{ MOLECULES
MAIl' /1. THIN LIQUID AIR BODY FILM
Figure 3.5 The action of diffusion.
air film develops over the gas-liquid interface, caused by the loss of momentum of air molecules hitting the Jiquid surface and being dragged along by it. The liquid film can be considered to be moving slowly in comparison to the main body of air.
The system described forms the basis of the two-film theory. Because of the mutual solubility of acetone in water, the rate at which molecules of acetone move through the liquid film is large. Consequently, acetone molecules in the air that approach the liquid film are removed at such a fast rate that the concentration of acetone in the air film becomes less than it is in the main body of gas. This concentration gradient between the air film and main air body supplies the main driving force for the transfer of mass.
We can think of the air and liquid films as being resistances in series. In this respect; they are similar to thermal resistances. If we designate the acetone by subscript A (Le., the diffusing species) and the air by subscript B (Le., the inert or insoluble species), we can write an expression for the concentration of each species in terms of their individual molar densities:
(3.40)
-d7)A represents the rate at which the concentration of species A decreases in the gas phase. As shown by Equation 3.40, this rate depends on the
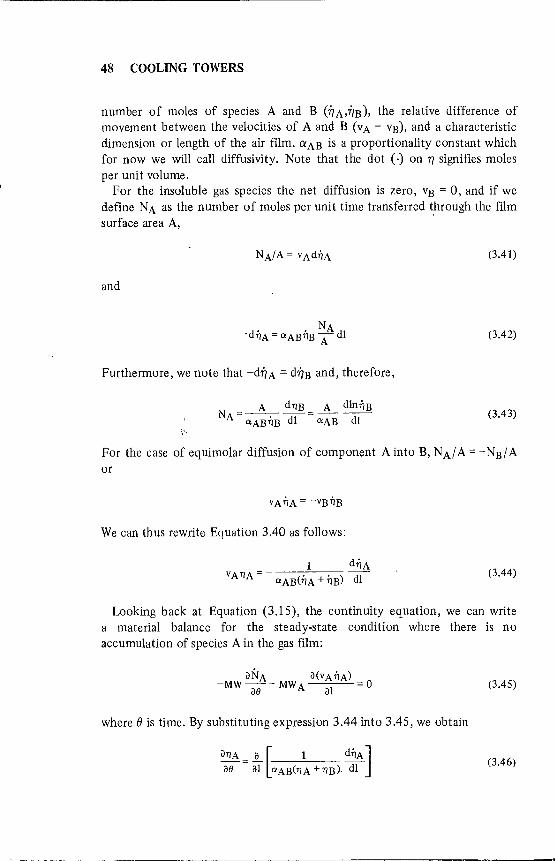
48 COOLING TOWERS
number of moles of species A and B Ci) A,ilB), the relative difference of movement between the velocities of A and B (VA - VB), and a characteristic dimension or length of the air film. Cl:AB is a proportionality constant which for now we will call diffusivity. Note that the dot (-) on 7) signifies moles per unit volume.
For the insoluble gas species the net diffusion is zero, vB = 0, and if we define NA as the number of moles per unit time transferred through the film surface area A, ,
(3.41)
and
(3.42)
Furthermore, we note that -dilA = dilB and, therefore,
A d7JB A dln7]B N --------
A - OIAB7]B dl - OIAB dl (3.43)
For the case of equimolar diffusion of component A into B, N AI A = - NB I A or
We can thus rewrite Equation 3.40 as follows:
1 d7]A VA7JA = - OIAB(7]A + 7JB) ill (3.44)
Looking back at Equation (3.15), the continuity equation, we can write a material balance for the steady·state condition where there is no accumulation of species A in the gas film:
(3.45)
where e is time. By substituting expression 3.44 into 3.45, we obtain
(3.46)
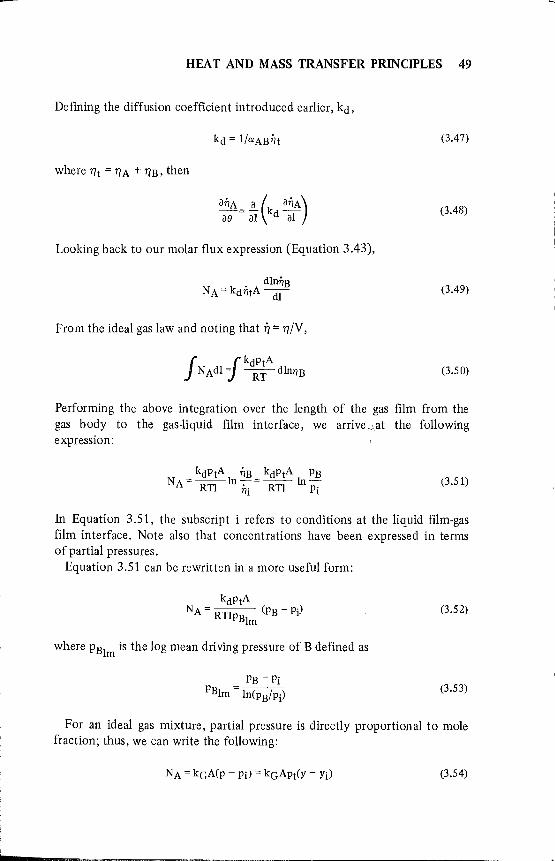
,......
l
HEAT AND MASS TRANSFER PRINCIPLES 49
Defining the diffusion coefficient introduced earlier, kd,
(3.47)
where 7)t = 7) A + 7)B, then
aiJA = 1- (k aiJA) ae a1 d a1 (3.48)
Looking back to our molar flux expression (Equation 3.43),
(3.49)
From the ideal gas law and noting that 1) = 7)/V,
(3.50)
Performing the above integration over the length of the gas film from the gas body to the gas-liquid film interface, we arrive , .. \at the following expression:
(3.51)
In Equation 3.51, the subscript i refers to conditions at the liquid film-gas film interface. Note also that concentrations have been expressed in terms of partial pressures.
Equation 3.51 can be rewritten in a more useful form:
(3.52)
where PB1m is the log mean driving pressure of B defined as
(3.53)
For an ideal gas mixture, partial pressure is directly proportional to mole fraction; thus, we can write the following:
(3.54)
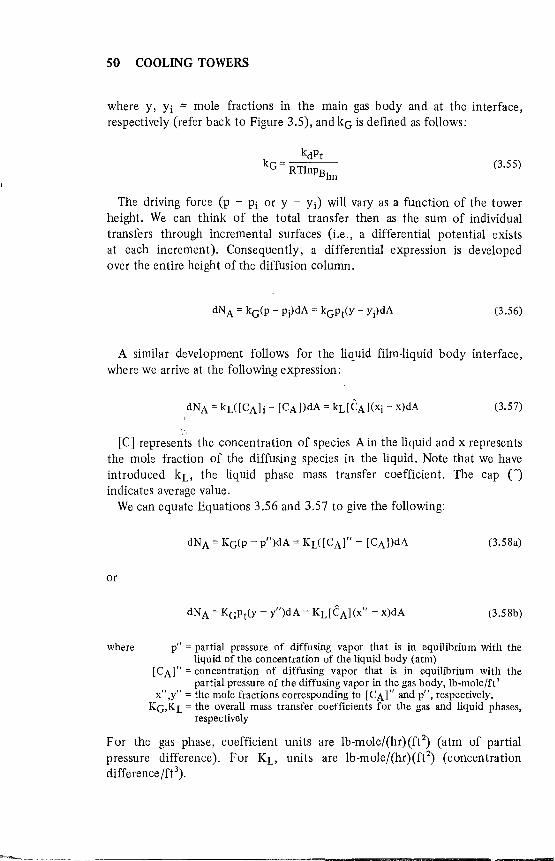
50 COOLING TOWERS
where y, Yi = mole fractions in the main gas body and at the interface, respectively (refer back to Figure 3.5), and kG is defined as follows:
(3.55)
The driving force (p - Pi or Y - Yi) will vary as a function of the tower height. We can think of the total transfer then as the sllm of individual transfers through incremental surfaces (i.e., a differential potential exists at each increment). Consequently, a differential expression is developed over the entire height of the diffusion column.
(3.56)
A similar development follows for the liquid film-liquid body interface, where we arrive at the followin,g expression:
(3.57)
[C] represents the concentration of species A in the liquid and x represents the mole fraction of the diffusing species in the liquid. Note that we have introduced kL , the liquid phase mass transfer coefficient. The cap C) indicates average value.
We can equate Equations 3.56 and 3.57 to give the following:
(3.58a)
or
(3.58b)
where p" = partial pressure of diffusing vapor that is in eqUilibrium with the liquid of the concentration of the liquid body (atm)
[CAl" = concentration of diffusing vapor that is in equilibrium with the partial pressure of the diffusing vapor in the gas body, Ib-mole/ft 3
x",Y" = the mole fractions corresponding to [CAJ" and p", respectively. KG,K L = the overall mass transfer coefficients for the gas and liquid phases,
respectively
For the gas phase, coefficient units are Ib-mole/(hr)(ft 2) (atm of partial
pressure difference). For KL, units are Ib-mole/(hr)(ft2) (concentration
difference Ife).

F"
l
HEAT AND MASS TRANSFER PRINCIPLES 51
TRANSFER UNITS
The overall mass transfer coefficients KG and KL can be related through Henry's Law, which states that
(3.58)
where p" is the equilibrium partial pressure of species A in the gas phase (Le., corresponding to a liquid concentration of [CAr). KH is the Henry's law constant. Henry's law is applicable only to relatively dilute solutions. With the use of Equation 3.58, the overall mass transfer coefficients can be expressed as follows:
(3.59)
and
(3.60)
Classical treatment of mass transfer is to consider a unL~ of mass transfer as a measure of the interphase equilibrium changes needed to produce a desired degree of diffusion [13]. This concept is best applied to the concept of a theoretical plate in distillation [4]. Defining Gm as the gas superficial molar velocity (mole/hr/ft2 of tower cross' section) and dy as the change of concentration of the diffusing species, then
(3.61)
The molar flux expression (Equation 3.58) can thus be rewritten as follows:
(3.62)
Let "a" signify the surface area per cubic foot of tower (ft2/ft3). Then the total area is '
dA = adV (3.63)
where V is the volume of the tower per unit area of tower cross section. And we Can define the following relation:
f dy V Ntu = --,,= KGa-
y-y Gm (3.64)
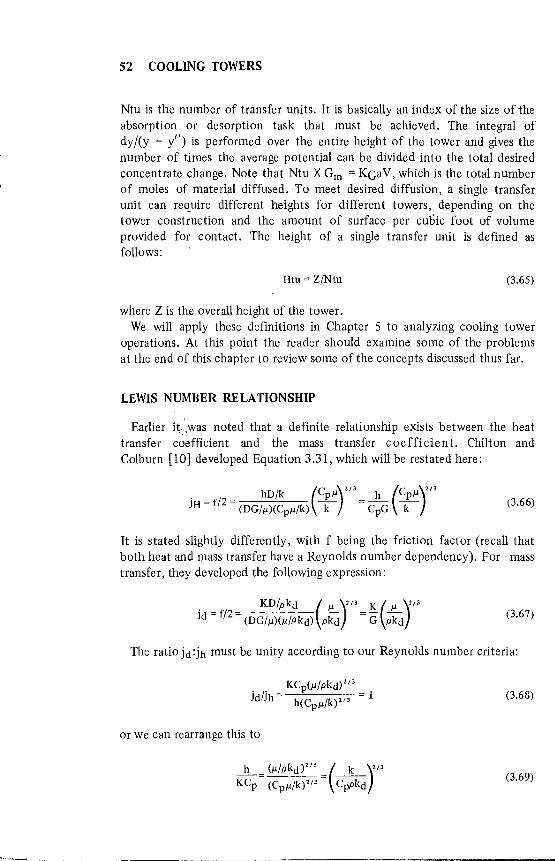
52 COOLING TOWERS
Ntu is the number of transfer units. It is basically an index of the size of the absorption or desorption task that must be achieved. The integral of dy/(y - yl/) is performed over the entire height of the tower and gives the number of times the average potential can be divided into the total desired concentrate change. Note that Ntu X Gm = KGaV, which is the total number of moles of material diffused. To meet desired diffusion, a single transfer unit can require different heights for different towers, depending on the tower construction and the amount of surface per cubic foot of volume provided for contact. The height of a single transfer unit is defined as follows:
Htu = Z/Ntu (3.65)
where Z is the overall height of the tower. We will apply these definitions in Chapter 5 to analyzing cooling tower
operations. At this point the reader should examine some of the problems at the end of this chapter to review some of the concepts discussed thus far.
LEWIS NUMBER RELATIONSHIP
Earlier it,.',was noted that a definite relationship exists between the heat transfer coefficient and the maSs transfer coefficient. Chilton and Colburn [10] developed Equation 3.31, which will be restated here:
. hD/k ( CPIl)'t3 h ( CPIl)'t3 lH = f/2 = (DG/Il)(Cpll/k) k = CpG k (3.66)
It is stated slightly differently, with f being the friction factor (recall that both heat and mass transfer have a Reynolds number dependency). For mass transfer, they developed the following expression:
(3.67)
The ratio jd:jh must be unity according to our Reynolds number criteria:
KC (ll/pkd)'/3 . /. - p - 1 Jd Jh - h(Cp ll/k)2I3 - (3.68)
or we can rearrange this to
(3.69)
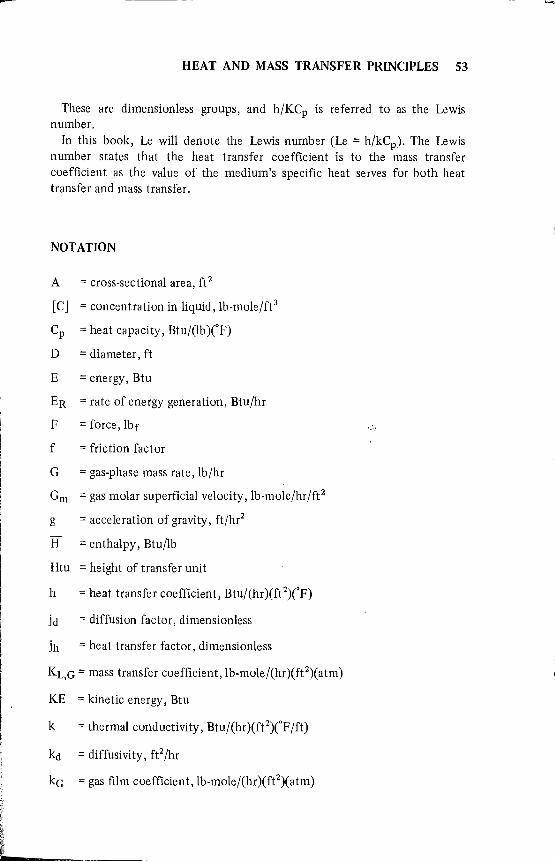
-HEAT AND MASS TRANSFER PRINCIPLES 53
These are dimensionless groups, and h/KCp is referred to as the Lewis number.
In this book, Le will denote the Lewis number (Le = h/kCp)' The Lewis number states that the heat transfer coefficient is to the mass transfer coefficient as the value of the medium's specific heat serves for both heat transfer and mass transfer.
NOTATION
A = cross-sectional area, ft2
[C] = concentration in liquid, lb-mole/ft3
Cp = heat capacity, Btu/(lb )CF)
D = diameter, ft
E = energy, Btu
ER = rate of energy generation, Btu/hr
F = force, lbf
f = friction factor
G = gas-phase mass rate, lb/hr
Gm = gas molar superficial velocity, lb-mole/hr/ft2
g = acceleration of gravity, ft/hr2
H = enthalpy, Btu/lb
Htu = height of transfer unit
h = heat transfer coefficient, Btu/(hr)(ft2)CF)
jd = diffusion factor, dimensionless
jh = heat transfer factor, dimensionless
KL,G = mass transfer coefficient, lb-mole/(hr)(ft2)(atm)
KE = kinetic energy, Btu
k = thermal conductivity, Btu/(hr)(fe)CF /ft)
kd = diffusivity, ft2/hr
kG = gas film coefficient, lb-mole/(hr)(ft2)(atm)
------'''''
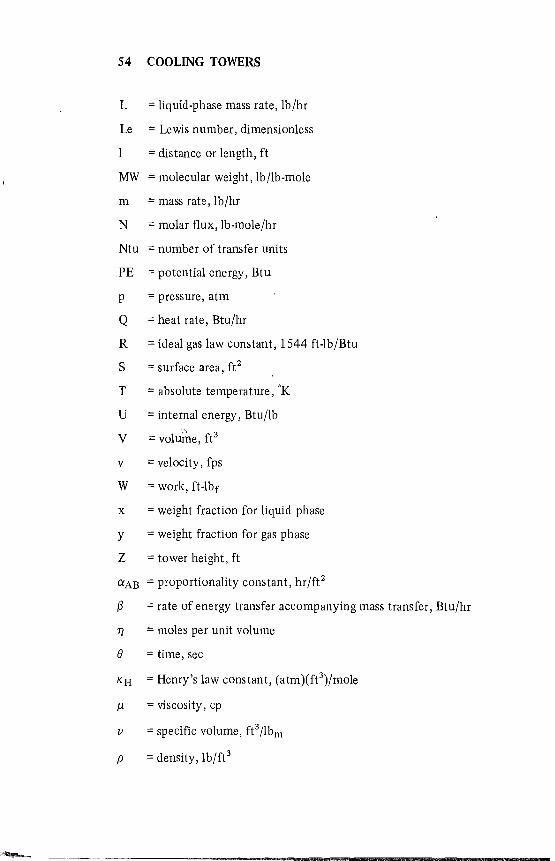
54 COOLING TOWERS
L = liquid-phase mass rate, lb/hr
Le = Lewis number, dimensionless
= distance or length, ft
MW = molecular weight, lb/lb-mole
m = mass rate, lb/hr
N = molar flux, lb-mole/hr
Ntu = number of transfer units
PE = potential energy, Btu
p = pressure, atm
Q = heat rate, Btu/hr
R = ideal gas law constant, 1544 ft-Ib/Btu
S = surface area, ft 2
T = absolute temperature, oK
U = internal energy, Btu/lb
V = vol uine, fe
v = velocity, fps
W = work, ft-Ibf
x = weight fraction for liquid phase
y = weight fraction for gas phase
Z = tower height, ft
Cl:AB = proportionality constant, hr/ft 2
~ = rate of energy transfer accompanying mass transfer, Btu/hr
7) = moles per unit volume
e = time, sec
KH = Henry's law constant, (atm)(ft3)/mole
J1 = viscosity, cp
/J = specific volume, fe/Ibm
p = density, Ib/ft3
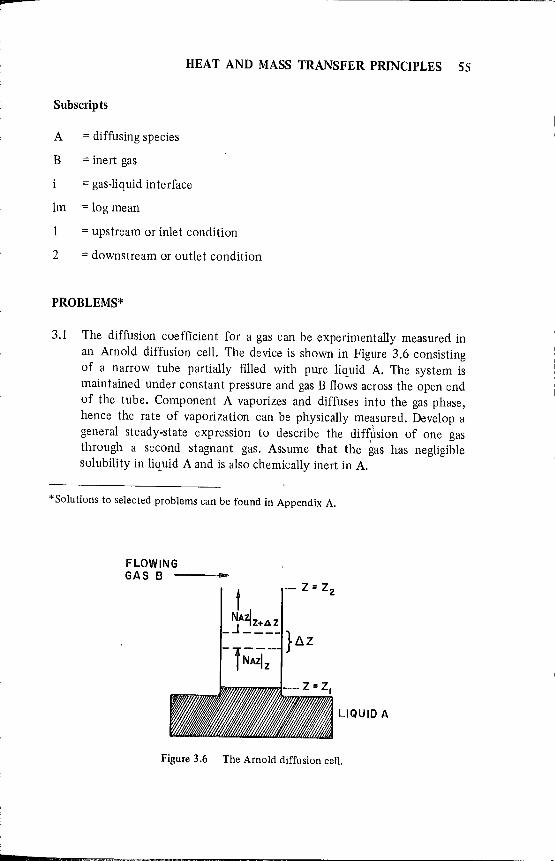
L
HEAT AND MASS TRANSFER PRINCIPLES 55
Subscripts
A = diffusing species
B = inert gas
= gas-liquid interface
1m = log mean
= upstream or inlet condition
2 = downstream or outlet condition
PROBLEMS*
3.1 The diffusion coefficient for a gas can be experimentally measured in an Arnold diffusion cell. The device is shown in Figure 3.6 consisting of a narrow tube partially filled with pure liqUid A. The system is maintained under constant pressure and gas B flows across the open end of the tube. Component A vaporizes and diffuses into the gas phase, hence the rate of vaporization can be phYSically measured. Develop a general steady-state expression to describe the dif~Jision of one gas through a second stagnant gas. Assume that the gas has negligible solubility in liqUid A and is also chemically inert in A.
*Solutions to selected problems can be found in Appendix A.
FLOWING GAS B '"
LIQUID A
Figure 3.6 The Arnold diffusion cell.

56 COOLING TOWERS
3.2 For problem 3.1, assume an ideal gas and express the steady-state equation in terms of partial pressures.
3.3 We wish to estimate the time it takes to evaporate a puddle of water. The depth of the puddle is 0.08 inches and covers a surface area of 2 ft2. Both the surr.ounding air (which is stagnant) and the water are at a constant temperature of 77°F. The absolute humidity is 0.001 lb water/lb dry air. Assume the evaporation to occur, through stagnant gas film that is 0.28 inches thick. The gas diffusion coefficient of water vapor at these conditions is 0.259 cm2/ses:.
3.4 For the system described in problem 3.3 develop a general expression for computing the water vapor concentration profile through the stagnant air film.
3.5 A 30-ft-deep water well has a cross-sectional area of 5 ft2. The temperature of the water and the air in the well is 84°F. If there is a slight breeze of air with humidity of 0.03 Ibm H20/Ibm dry air blowing across the top of the well, estimate the rate at which the water evaporates.
3.6 A lO-ft-diameter cylindrical tank contains water at a level of 3 ft below,;'the top of the vessel. The capacity of the tank is 80 gallons. If the top of the tank is open, determine the weight of water evaporated per unit time. Assume dry air at 90°F is blowing across the vesse1's top.
3.7 A tapered top water tank (Figure 3.7) is open to the atmosphere. Determine the weight loss of water per hour if air with an absolute humidity of 0.02 lb H20/lb dry air blows across the top of the tank.
AIR FLOW
p-
--1 6ft I--(....---. ______ :1 ft 80 f t 12 ft
Figure 3.7 Water tank for problem 3.7.
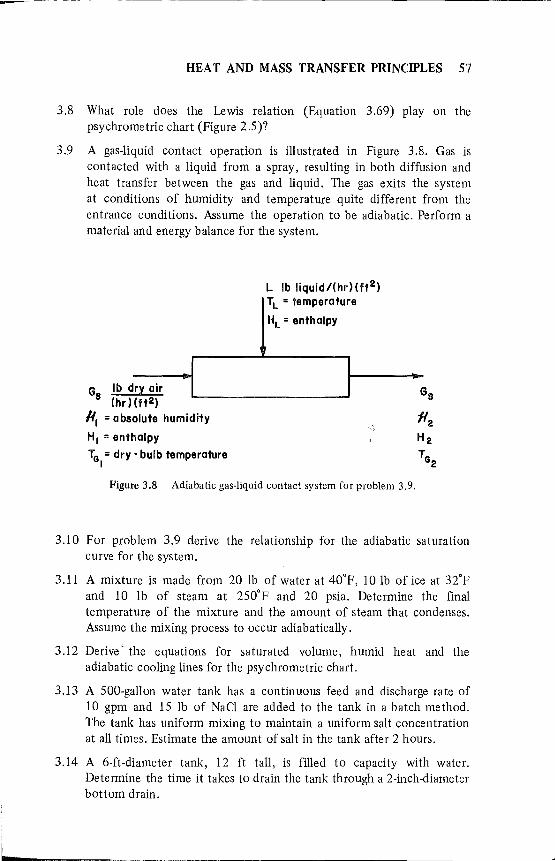
L
HEA T AND MASS TRANSFER PRINCIPLES 57
3.8 What role does the Lewis relation (Equation 3.69) play on the psychrometric chart (Figure 2.S)?
3.9 A gas-liquid contact operation is illustrated in Figure 3.8. Gas is contacted with a liquid from a spray, resulting in both diffusion and heat transfer between the gas and liquid. The gas exits the system at conditions of humidity and temperature quite different from the entrance conditions. Assume the operation to be adiabatic. Perform a material and energy balance for the system.
G Ib dry air s (hr )(ft2)
III = absolute humidity
HI = enthalpy
TG = dry - bUlb temperature I
L Ib liquid/(hr)(ft2) TL = temperature
HL = enthalpy
Figure 3.8 Adiabatic gas-liquid contact system for problem 3.9.
3.1 0 For problem 3.9 derive the relationship for the adiabatic saturation curve for the system.
3.11 A mixture is made from 20 lb of water at 40°F, 10 lb of ice at 32°F and 10 lb of steam at 2S0°F and 20 psia. Determine the final temperature of the mixture and the amount of steam that condenses. Assume the mixing process to occur adiabatically.
3.12 Derive' the equations for saturated volume, humid heat and the adiabatic cooling lines for the psychrometric chart.
3.13 A SOO-gallon water tank has a continuous feed and discharge rate of 10 gpm and IS lb of NaCI are added to the tank in a batch method. The tank has uniform mixing to maintain a uniform salt concentration at all times. Estimate the amount of salt in the tank after 2 hours.
3.14 A 6-ft-diameter tank, 12 ft tall, is filled to capacity with water. Determine the time it takes to drain the tank through a 2-inch-diameter bottom drain.

This page intentionally left blank

r
CHAPTER 4
COOLING TOWER CLASSIFICATIONS
INTRODUCTION
Cooling towers are classified according to the method by which air is introduced to the tower. The principal types are atmospheric spray, natural-draft, mechanical-draft, deck-filled, spray-filled, coil shed and hyperbolic towers. Most industrial cooling tower installations are field-erected units designed for specific thermal characteristics.
In an atmospheric spray tower the air movement, is dependent on atmospheric conditions and the aspirating effect of the spray nozzles. Natural-draft cooling tower operation depends on a chimney or stack to induce air movement. Mechanical-draft cboling towers utiliZe fans to move ambient air through the tower. Deck-filled towers contain tiers of splash bars or decks to assist in the breakup of water drops to increase the total water surface and subsequently the evaporation rate. Spray-filled towers depend only on spray nozzles for water breakup. Coil shed towers are comprised of a combination structure of a cooling tower installed on top of a substructure that contains atmospheric section coils. Hyperbolic natural-draft cooling towers are typically large-capacity systems.
There is also a separate class of towers based on a dty cooling principle. Each of these major designs is described below.
COOLING TOWER SUBCLASSIFICATIONS AND CONFIGURATIONS
Cooling towers are broadly classified on the basis of the type of draft: natural draft (natural convection), mechanical draft (forced convection) and mechanical and natural. Further distinction is made based on (1) the type of flow-crossflow, counterflow, co current flow; (2) the type of heat dissipation-wet (evaporative cooling), dry, wet-dry; and (3) the type
59
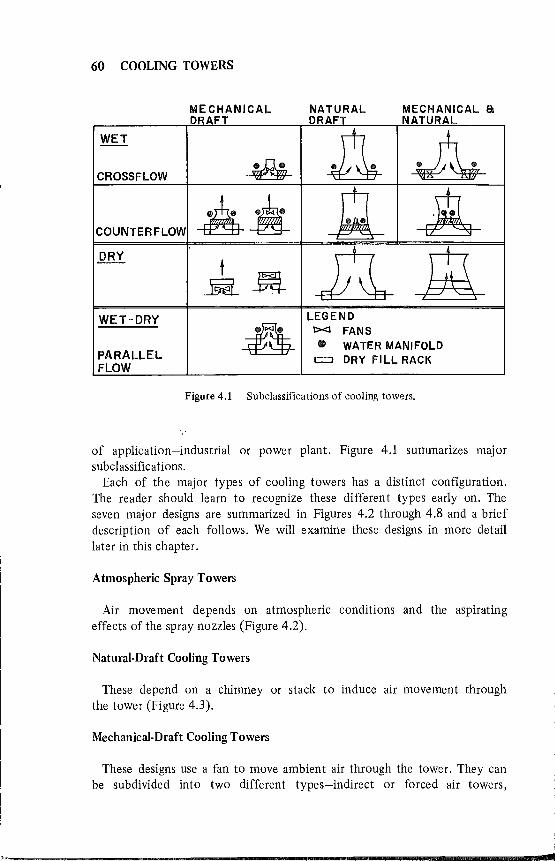
60 COOLING TOWERS
MECHANICAL DRAFT
WET
CROSSFLOW ~
COUNTERFLOW AA DRY
t N---R-
WET-DRY
4 PARALLEL FLOW
NATURAL DRAFT
a Jl 11
LEGEND 1><1 FANS
MECHANICAL a NATURAL
A-A ~
• WATER MANIFOLD c=J DRY FILL RACK
Figure 4.1 Subclassifications of cooling towers.
of application-industrial or power plant. Figure 4.1 summarizes major subclassifications.
Each of the major types of cooling towers has a distinct configuration. The reader should learn to recognize these different types early on. The seven major designs are summarized in Figures 4.2 through 4.8 and a brief description of each follows. We will examine these designs in more detail later in this chapter.
Atmospheric Spray Towers
Air movement depends on atmospheric conditions and the aspirating effects of the spray nozzles (Figure 4.2).
Natural-Draft Cooling Towers
These depend on a chimney or stack to induce air movement through the tower (Figure 4.3).
Mechanical-Draft Cooling Towers
These designs use a fan to move ambient air through the tower. They can be subdivided into two different types-indirect or forced air towers,
i I
~--~~----------------------------------------------------------------..... ~
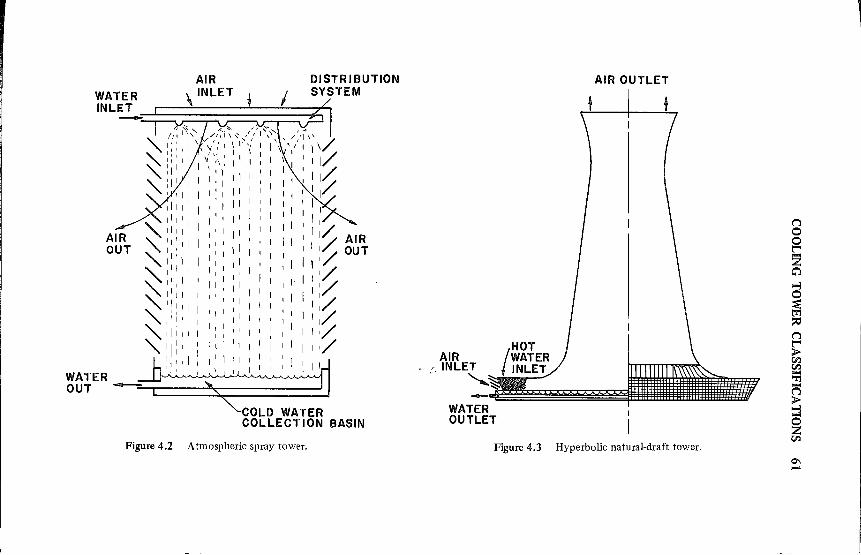
AIR DISTRIBUTION SYSTEM WATER \ INLET
INLET :--l===========:::::;~
, , , I' II , ' I II I ,
I I I II I I
'I' I I III I II I , I I
I ,
I I I I,' I I' , I I,
~ 1'1 I I I I 11/ AIR II AIR
': 'I " , I , I 111/ OUT
~ I', ' I
) 1 I I I I 11'/
OUT I I, II II , I, I I
11 ' / , I I' I I I,
~ , II II 1:/ ',I I I , ' I I
I" 1 ' II I I 1,/ , I
'" ' , 'I I
"
I I 11/ 'I' I , ,
I
~Ii'l I, I , I I
, I 1,/ , ,
" I:' ' : I.
, 'I I I I 1'/
I I ' 1 'I , I I I
" , I I ,
WATER -.b '", 1 , , I
OUT ---COLD WATER COLLECTION BASIN
Figure 4.2 A tmospheric spray tower.
AIR INLET
WATER OUTLET
Figure 4.3
l I
AIR OUTLET
Hyperbolic natural-draft tower.
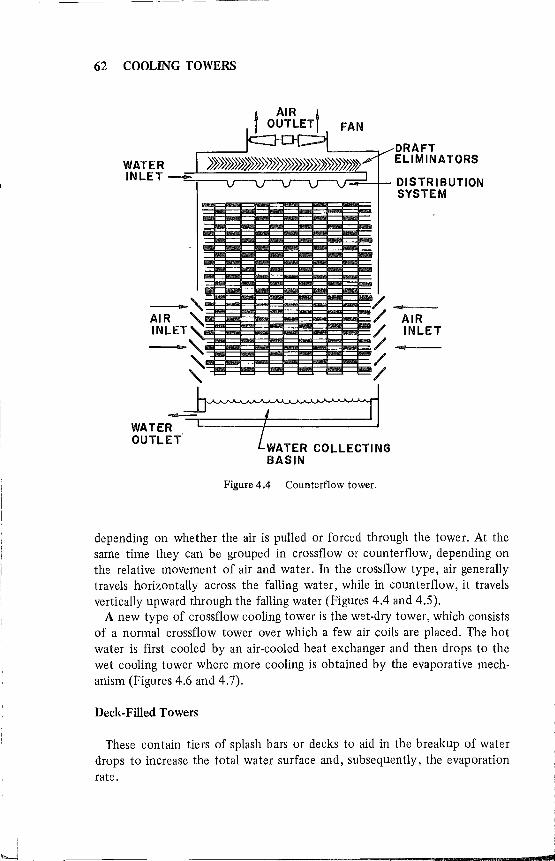
~'--- --~---- --
62 COOLING TOWERS
1..-_-..,,/ DRAFT WATER ELIMINATORS
IN LET --~=~~~~~:::~~r:::'~-+- 01 STR I BUT ION SYSTEM
-'\. y----AIR " YAIR INLET ~ INLET
--~ Y •
WATER-h=::rl OUTLET G
BASIN
Figure 4.4 Counterflow tower.
depending on whether the air is pulled or forced through the tower. At the same time they can be grouped in crossflow or counterflow, depending on the relative movement of air and water. In the cross flow type, air generally travels horizontally across the falling water, while in counterflow, it travels vertically upward through the falling water (Figures 4.4 and 4.5).
A new type of crossflow cooling tower is the wet-dry tower, which consists of a normal crossflow tower over which a few air coils are placed. The hot water is first cooled by an air-cooled heat exchanger and then drops to the wet cooling tower where more cooling is obtained by the evaporative mechanism (Figures 4.6 and 4.7).
Deck-Filled Towers
These contain tiers of splash bars or decks to aid in the breakup of water drops to increase the total water surface and, subsequently, the evaporation rate.
i
I J
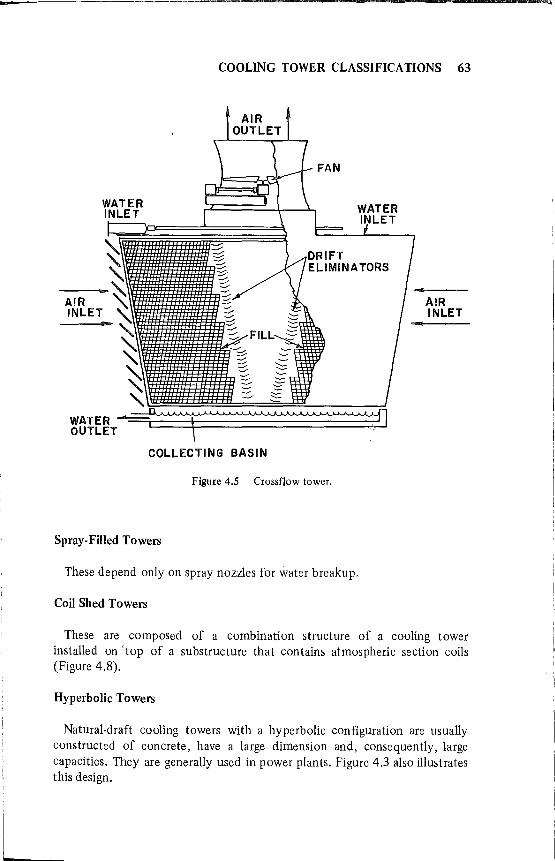
I
l
COOLING TOWER CLASSIFICATIONS 63
WATER INLET
FAN
COLLECTING BASIN
Figure 4.5 Crossflow tower.
Spray-Filled Towers
These depend only on spray nozzles for water breakup,
Coil Shed Towers
AIR INLET
These are composed of a combination structure of a cooling tower installed on 'top of a substructure that contains atmospheric section coils (Figure 4.8).
Hyperbolic Towers
Natural-draft cooling towers with a hyperbolic configuration are usually constructed of concrete, have a large dimension and, consequently, large capacities. They are generally used in power plants. Figure 4.3 also illustrates this design.
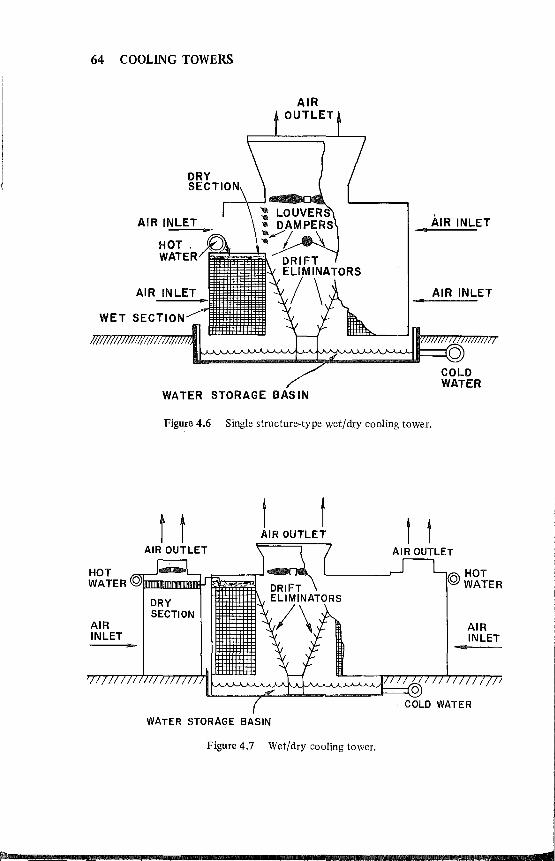
64 COOLING TOWERS
AIR INLET
HOT, WATE
AIR INLET
WET SECTiO
WATER STORAGE BASIN
AIR INLET
AIR INLET
Figure 4.6 Single structure-type wet/ dry cooling tower.
HOT WATER 0
AIR INLET
t t AIR OUTLET
AIR OUTLET
DRY SECTION
WATER STORAGE BASIN
Figure 4.7 Wet/dry cooling tower.
t t AIR OUTLET
HOT o WATER
-AIR INLET
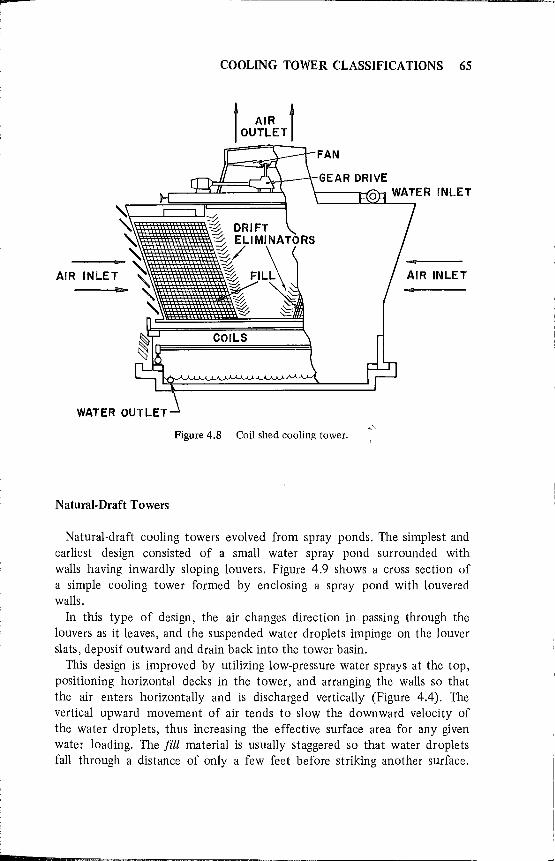
r I
i I i
l
COOLING TOWER CLASSIFICATIONS 65
AIR
Figure 4.8 Coil shed cooling tower.
Natural-Draft Towers
Natural-draft cooling towers evolved from spray ponds. The simplest and earliest design consisted of a small water spray pond surrounded with walls having inwardly sloping louvers. Figure 4.9 shows a cross section of a simple cooling tower formed by enclosing a spray pond with louvered walls.
In this type of design, the air changes direction in passing through the louvers as it leaves, and the suspended water droplets impinge on the louver slats, deposit outward and drain back into the tower basin.
This design is improved by utilizing low-pressure water sprays at the top, positioning horizontal decks in the tower, and arranging the walls so that the air enters horizontally and is discharged vertically (Figure 4.4). The vertical upward movement of air tends to slow the downward velocity of the water droplets, thus increasing the effective surface area for any given water loading. The fill material is usually staggered so that water droplets fall through a distance of only a few feet before striking another surface.
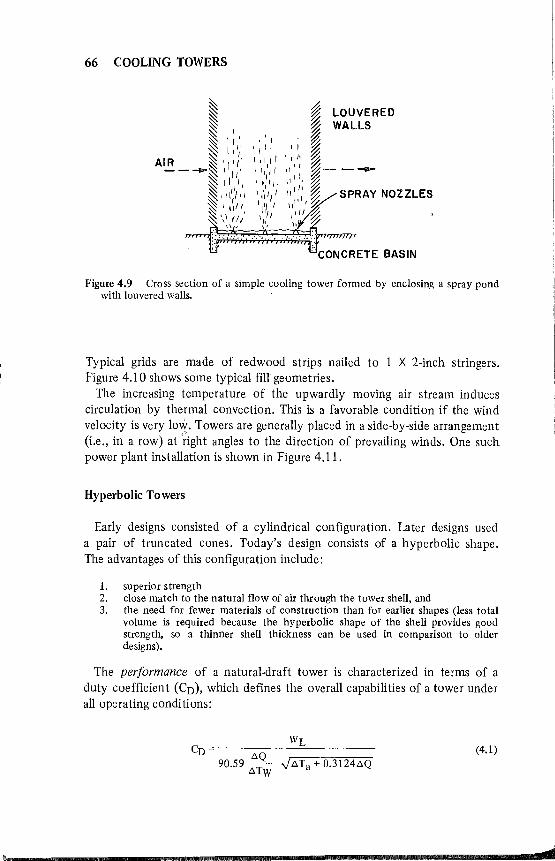
66 COOLING TOWERS
~ ~ LOUVERED ~ ~ WALLS
~ ':' .'1 ~ ~ 1,1' '1'1 "~ AIR ~, ,i' ',1,1 1',1' ~ __ -IP'~,II" '",',I ",: ~----
~ II" ""I'" ,~ ~. 11"/11 "';'1' 11
1/,' ~ SPRAY NOZZLES
~ I \ ",//. ~'\I/' 1'/' II ~
~;;f;.J;:.:.;~ . CONCRETE BASIN
Figure 4.9 Cross section of a simple cooling tower formed by enclosing a spray pond with louvered walls.
Typical grids are made of redwood strips nailed to 1 X 2-inch stringers. Figure 4.10 shows some typical fill geometries.
The increasing temperature of the upwardly moving air stream induces circulation by thermal convection. This is a favorable condition if the wind velocity is very 10»,. Towers are generally placed in a side-by-side arrangement (i.e., in a row) at '~ight angles to the direction of prevailing winds. One such power plant installation is shown in Figure 4.11.
Hyperbolic Towers
Early designs consisted of a cylindrical configuration. Later designs used a pair of truncated cones. Today's design consists of a hyperbolic shape. The advantages of this configuration include:
1. superior strength 2. close match to the natural flow of air through the tower shell, and 3. the need for fewer materials of construction than for earlier shapes (less total
volume is required because the hyperbolic shape of the sheli provides good strength, so a thinner shell thickness can be used in comparison to older designs).
The performance of a natural-draft tower is characterized in terms of a duty coefficient (CD), which defines the overall capabilities of a tower under all operating conditions:
WL CD = -----~"------
~Q ~------90.59 -T V~Ta + 0.3124~Q ~ W
(4.1)
d

-
L
COOLING TOWER CLASSIFICA nONS 67
DECKS A a B
"'---8"--""'" VERTICAL SPACING A=9", B = 12"
DECK E
VERTICAL SPACING 24"
DECK I
VERTICAL
DECKS caD
VERTICAL SPACING C=IS", D =24"
DECK F
2-1/4" VERTICAL SPACING 24"
DECK"
\ t~':~ ~ VERTICAL SPACING 24"
Figure 4.10 Various geometries employed in constructing redwood fill for cooling towers.
where WL = water loading, lb/hr .:l.Q = total heat of the air passing through the tower, Btu/lb of dry air
.:l. TW = change in temperature of water passing through tower, of .:l. T a = difference between the dry-bulb temperature and wet-bulb temperature
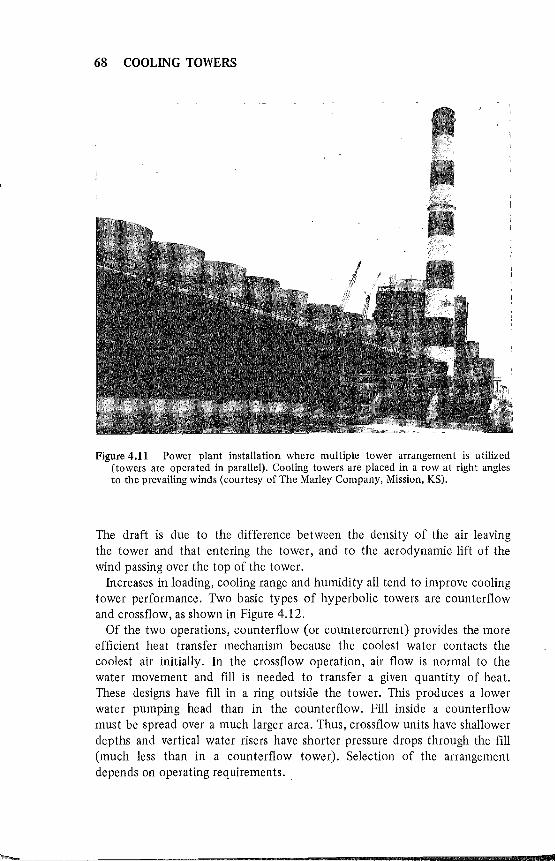
68 COOLING TOWERS
Figure 4.11 Power plant installation where multiple tower arrangement is utilized (towers are operated in parallel). Cooling towers are placed in a row at right angles to the prevailing winds (courtesy of The Marley Company, Mission, KS).
The draft is due to the difference between the density of the air leaving the tower and that entering the tower, and to the aerodynamic lift of the wind passing over the top of the tower.
Increases in loading, cooling range and humidity all tend to improve cooling tower performance. Two basic types of hyperbolic towers are counterflow and crossflow, as shown in Figure 4.12.
Of the two operations, counterflow (or countercurrent) provides the more efficient heat transfer mechanism because the coolest water contacts the coolest air initially. In the crossflow operation, air flow is normal to the water movement and fill is needed to transfer a given quantity of heat. These designs have fill in a ring outside the tower. This produces a lower water pumping head than in the counterflow. Fill inside a counterflow must be spread over a much larger area. Thus, crossflow units have shallower depths and vertical water risers have shorter pressure drops through the fill (much less than in a counterflow tower). Selection of the arrangement depends on operating requirements ..
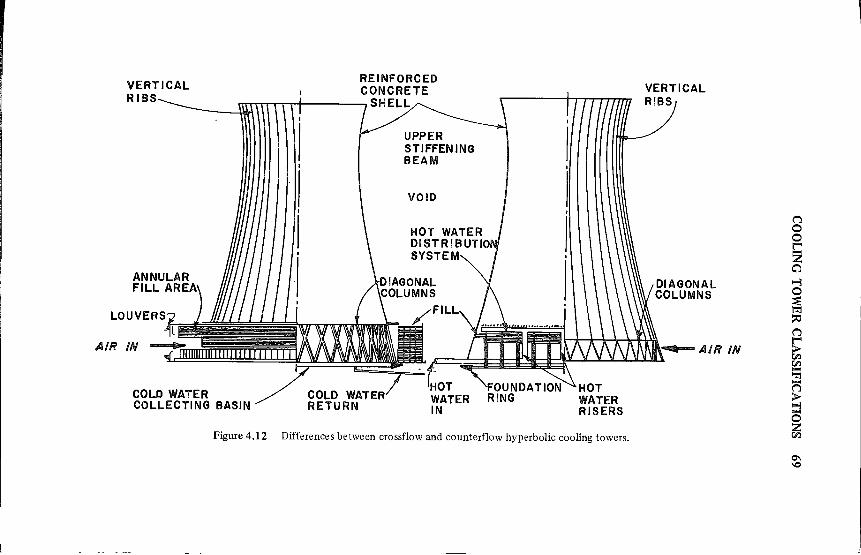
VERTICAL RIBS
AIR IN
COLD WATER COLLECTING BASIN
COLD WAT RETURN
VOID
WATER IN
HOT WATER RISERS
Figure 4.12 Differences between crossflow and counterflow hyperbolic cooling towers.
VERTICAL RIBS
AIR IN
("') 0 0
2 C"l ~ 0
~ ~ ("')
~ CI:l -'"rI -("') > ~ 0 Z CI:l
0\ \0
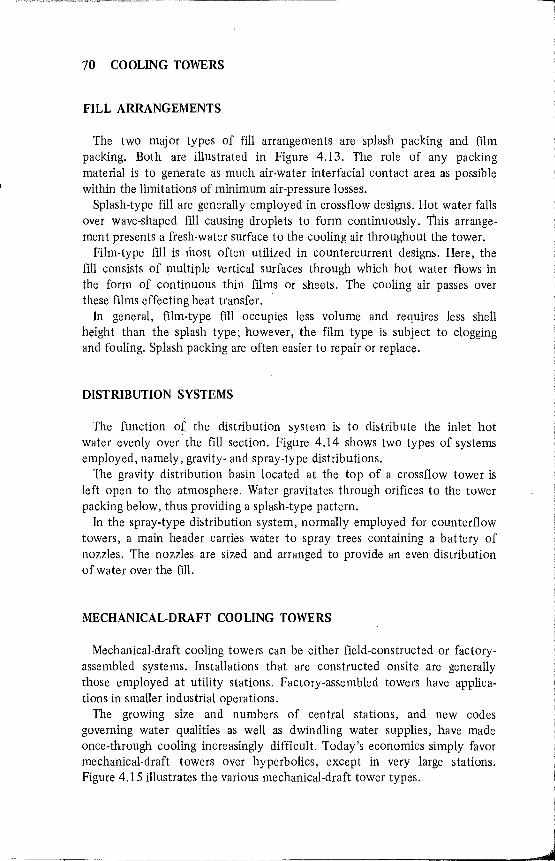
70 COOLING TOWERS
FILL ARRANGEMENTS
The two major types of fill arrangements are splash packing and film packing. Both are illustrated in Figure 4.13. The role of any packing material is to generate as much air-water interfacial contact area as possible within the limitations of minimum air-pressure losses.
Splash-type fill are generally employed in cross flow designs. Hot water falls over wave-shaped fill causing droplets to form continuously. This arrangement presents a fresh-water surface to the cooling air throughout the tower.
Film-type fill is most often utilized in countercurrent designs. Here, the fill consists of multiple vertical surfaces through which hot water flows in the form of continuous thin films or sheets. The cooling air passes over these films effecting heat transfer. <
In general, film-type fill occupies less volume and requires less shell height than the splash type; however, the film type is subject to clogging and fouling. Splash packing are often easier to repair or replace.
DISTRIBUTION SYSTEMS
The function o£ the distribution system is to distribute the inlet hot water evenly over the fill section. Figure 4.14 shows two types of systems employed, namely, gravity- and spray-type distributions.
The gravity distribution basin located at the top of a crossflow tower is left open to the atmosphere. Water gravitates through orifices to the tower packing below, thus providing a splash-type pattern.
In the spray-type distribution system, normally employed for counterflow towers, a main header carries water to spray trees containing a battery of nozzles. The nozzles are sized and arranged to provide an even distribution of water over the fill.
MECHANICAL-DRAFT COOLING TOWERS
Mechanical-draft cooling towers can be either field-constructed or factoryassembled systems. Installations that are constructed onsite are generally those employed at utility stations. Factory-assembled towers have applications in smaller industrial operations.
The growing size and numbers of central stations, and new codes governing water qualities as well as dwindling water supplies, have made once-through cooling increasingly difficult. Today's economics simply favor mechanical-draft towers over hyperbolics, except in very large stations. Figure 4.15 illustrates the various mechanical-draft tower types.
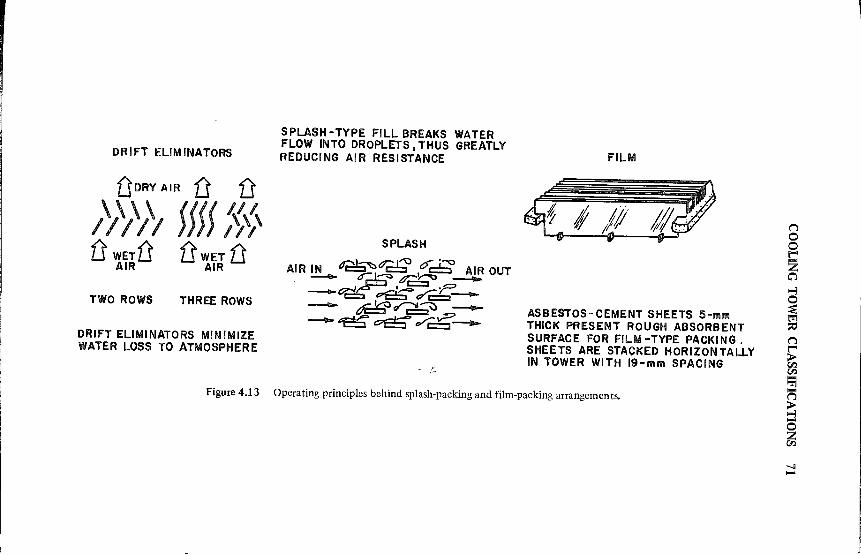
DRIFT ELIMINATORS
DDRYAIR D D \ \ \ \ { ( (( I{,',
1/ III )))) III fr WETtJ fr WET D
AIR AIR
TWO ROWS THREE ROWS
DRIFT ELIMINATORS MINIMIZE WATER LOSS TO ATMOSPHERE
Figure 4.13
SPLASH -TYPE FILL BREAKS WATER FLOW INTO DROPLETS. THUS GREATLY REDUCING AIR RESISTANCE
SPLASH .....,.1_ ~.,r.~
AIR IN d2::::::::!~.:7i::S ""c::!:::i AIR OUT --- ::it? t?;::~ --~~~~--- ~~~-----~ t7C5' ..r,:~--
FILM
ASBESTOS-CEMENT SHEETS 5-mm THICK PRESENT ROUGH ABSORBENT SURFACE FOR FILM -TYPE PACKING. SHEETS ARE STACKED HORIZONTALLY IN TOWER WITH 19-mm SPACING
Operating principles behind splash-packing and film-packing arrangements.
l I
!
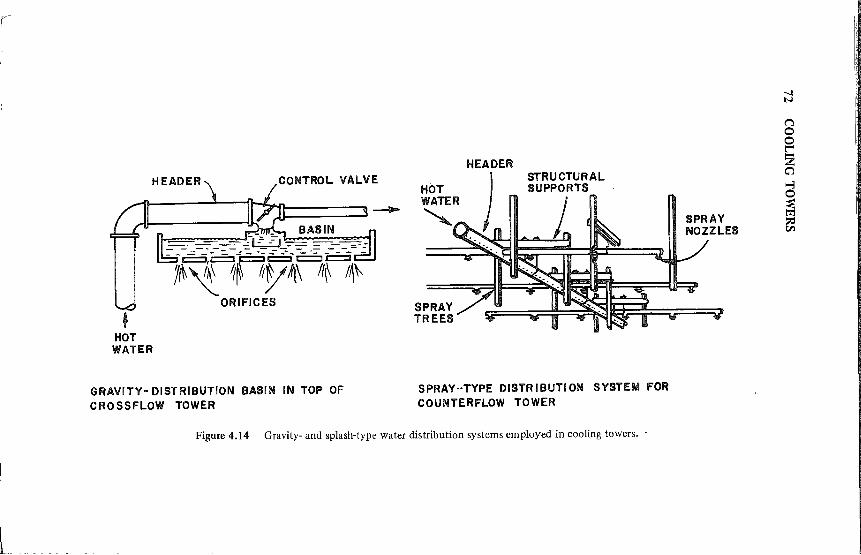
t HOT WATER
CONTROL VALVE
BASIN =:---=---=- -=-, :- --=-, -=-= =--- --
~i~~~V4M'H~ ORIFICES
GRAVITY- DISTRIBUTION BASIN IN TOP OF CROSSFLOW TOWER
SPRAY TREES
SPRAY-TYPE DISTRIBUTION SYSTEM FOR COUNTERFLOW TOWER
Figure 4.14 Gravity- and splash-type water distribution systems employed in cooling towers. -
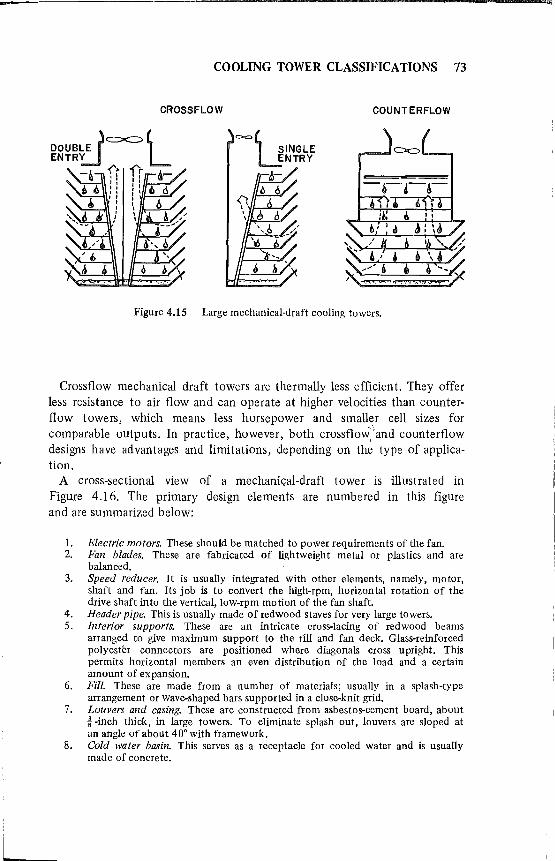
L
COOLING TOWER CLASSIFICA nONS 73
CROSSFLOW COUNTERFLOW
Figure 4.15 Large mechanical-draft cooling towers.
Crossflow mechanical draft towers are thermally less efficient. They offer less resistance to air flow and can operate at higher velocities than counterflow towers, which means less horsepower and smaller cell sizes for comparable outputs. In practice, however, both crossflO\v;" and counterflow designs have advantages and limitations, depending on the type of application.
A cross-sectional view of a mechanical-draft tower is illustrated in Figure 4.16. The primary design elements are numbered in this figure and are summarized below:
1. Electric motors. These should be matched to power requirements of the fan. 2. Fan blades. These are fabricated of lightweight metal or plastics and are
balanced. 3. Speed reducer. It is usually integrated with other elements, namely, motor,
shaft and fan. Its job is to convert the high-rpm, horizontal rotation of the drive shaft into the vertical, low-rpm motion of the fan shaft.
4. Header pipe. This is usually made of redwood staves for very large towers. 5. Interior supports. These are an intricate cross-lacing of redwood beams
arranged to give maximum support to the fill and fan deck. Glass-reinforced polyester connectors are positioned where diagonals cross upright. This permits horizontal members an even distribution of the load and a certain amount of expansion.
6. Fill. These are made from a number of materials; usually in a splash-type arrangement or wave-shaped bars supported in a close-knit grid.
7. Louvers and casing. These are constructed from asbestos-cement board, about f -inch thick, in large towers. To eliminate splash out, louvers are sloped at an angle of about 40° with framework.
8. Cold water basin. This serves as a receptacle for cooled water and is usually made of concrete.
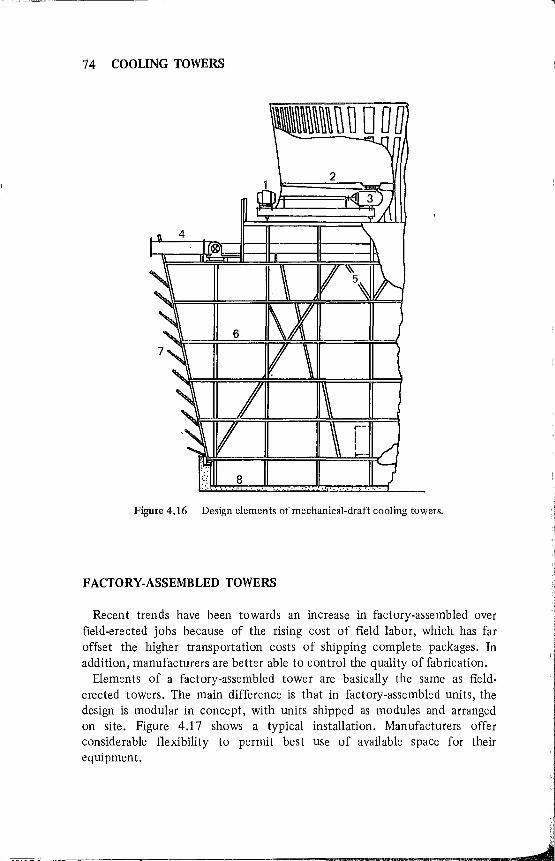
74 COOLING TOWERS
Figure 4.16 Design elements of mechanical-draft cooling towers.
FACTORY-ASSEMBLED TOWERS
Recent trends have been towards an increase in factory-assembled over field-erected jobs because of the rising cost of field labor, which has far offset the higher transportation costs of shipping complete packages. In addition, manufacturers are better able to control the quality of fabrication.
Elements of a factory-assembled tower are basically the same as fielderected towers. The main difference is that in factory-assembled units, the design is modular in concept, with units shipped as modules and arranged on site. Figure 4.17 shows a typical installation. Manufacturers offer considerable flexibility to permit best Use of available space for their equipment.
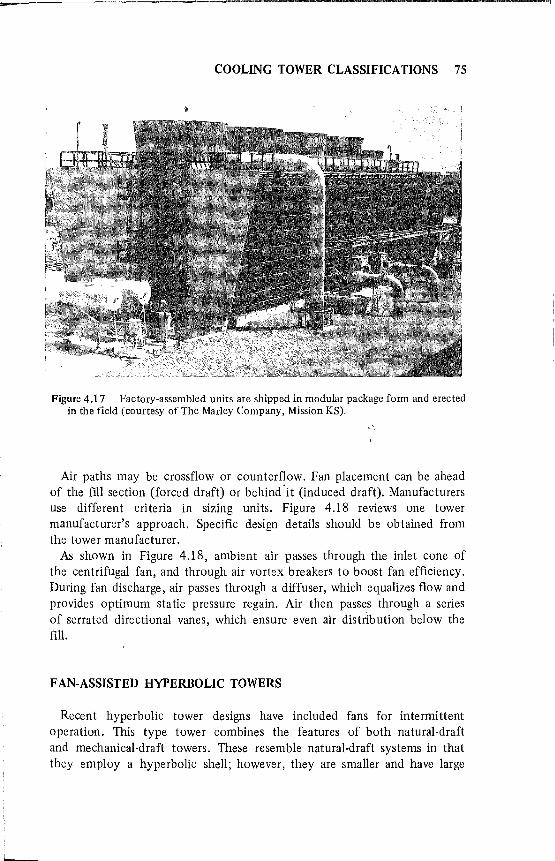
--p----------------------------------------------------------------------------~
L
COOLING TOWER CLASSIFICATIONS 75
Figure 4.17 Factory-assembled units are shipped in modular package form and erected in the field (courtesy of The Marley Company, Mission KS),
Air paths may be crossflow or counterflow. Fan placement can be ahead of the fIll section (forced draft) or behind'it (induced draft). Manufacturers use different criteria in sizing units. Figure 4.18 reviews one tower manufacturer's approach. Specific design details should be obtained from the tower manufacturer.
As shown in Figure 4.18, ambient air passes through the inlet cone of the centrifugal fan, and through air vortex' breakers to boost fan efficiency. During fan discharge, air passes through a diffuser, which equalizes flow and provides optimum static pressure regain. Air then passes through a series of serrated directional vanes, which ensure even air distribution below the fill.
FAN-ASSISTED HYPERBOLIC TOWERS
Recent hyperbolic tower designs have included fans for intermittent operation. This type tower combines the features of both natural-draft and mechanical-draft towers. These resemble natural-draft systems in that they employ a hyperbolic shell; however, they are smaller and have large
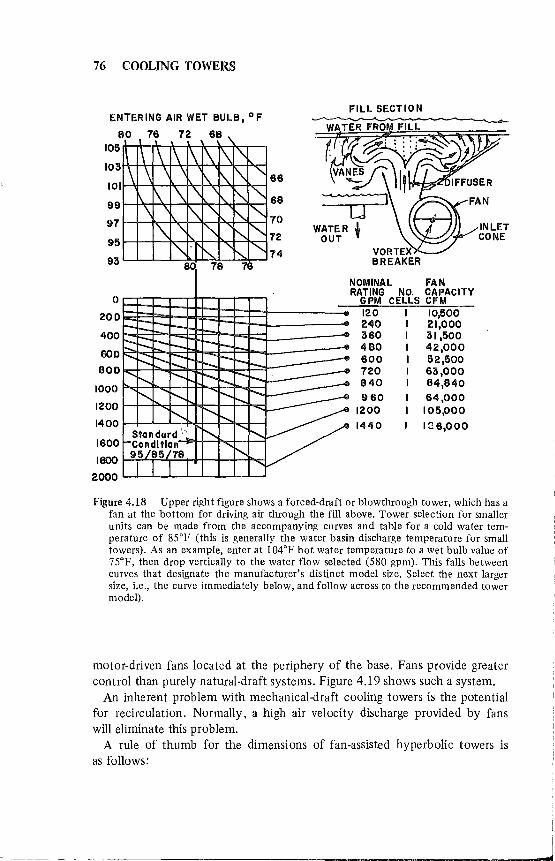
~~~~~~~~-- --
76 COOLING TOWERS
ENTER ING AIR WET BULB, 0 F
80 76 72 6B
FILL SECTION
TER FROM FILL
105 hM;\-~*-*-*-",*-..-..,
97 WATER INLET
95 OUT CONE
93
NOMINAL FAN RATING NO. CAPACITY
0 GPM CELLS CFM
200 120 I 10,500 240 I 21,000
400 360 I 31,500
600 4BO I 42,000 600 I 52,500
800 720 63,000
1000 840 84,840 960 64,000
1200 1200 105,000 1400 1440 1~6,OOO
1600
1600
2000
Figure 4.18 Upper right figure shows a forced-draft or blowthrough tower, which has a fan at the bottom for driving air through the fill above. Tower selection for smaller units can be made from the accompanying curves and table for a cold water temperature of 85°F (this is generally the water basin discharge temperature for small towers). As an example, enter at 104°F hot water temperature to a wet bulb value of 75°F, then drop vertically to the water flow selected (580 gpm). This falls between curves that designate the manufacturer's distinct model size. Select the next larger size, i.e., the curve immediately below, and follow across to the recommended tower model).
motor-driven fans located at the periphery of the base. Fans provide greater control than purely natural-draft systems. Figure 4.19 shows such a system.
An inherent problem with mechanical-draft cooling towers is the potential for recirculation. Normally, a high air velocity discharge provided by fans will eliminate this problem.
A rule of thumb for the dimensions of fan-assisted hyperbolic towers is as follows:
j
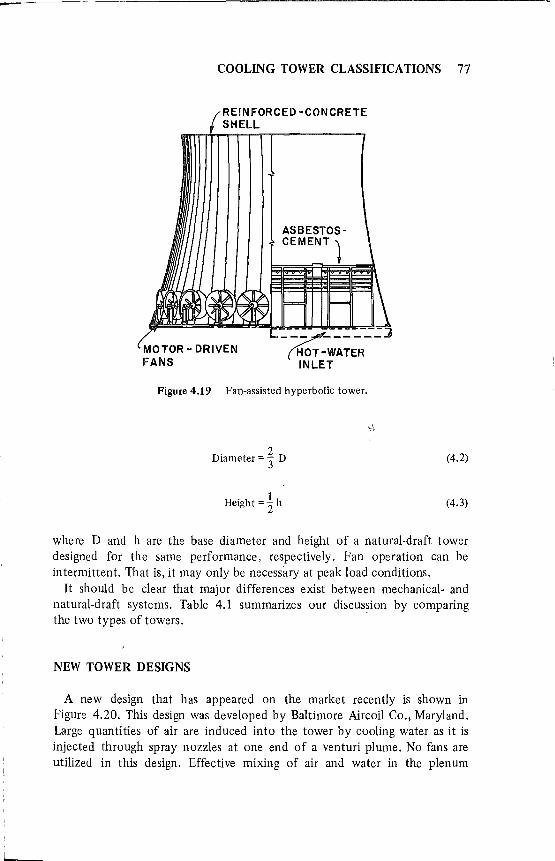
i
L
COOLING TOWER CLASSIFICATIONS 77
(REINFORCED -CONCRETE SHELL
ASBESTOSCEMENT)
Figure 4.19 Fan-assisted hyperbolic tower.
. 2 Diameter ="3 D
Height = 1 h
(4.2)
(4.3)
where D and h are the base diameter and height of a natural-draft tower designed for the same performance, respectively. Fan operation can be intermittent. That is, it may only be necessary at peak load conditions.
It should be clear that major differences exist between mechanical- and natural-draft systems. Table 4.1 summarizes our discussion by comparing the two types of towers.
NEW TOWER DESIGNS
A new design that has appeared on the market recently is shown in Figure 4.20. This design was developed by Baltimore AircoH Co., Maryland. Large quantities of air are induced into the tower by cooling water as it is injected through spray nozzles at one end of a venturi plume. No fans are utilized in this design. Effective mixing of air and water in the plenum
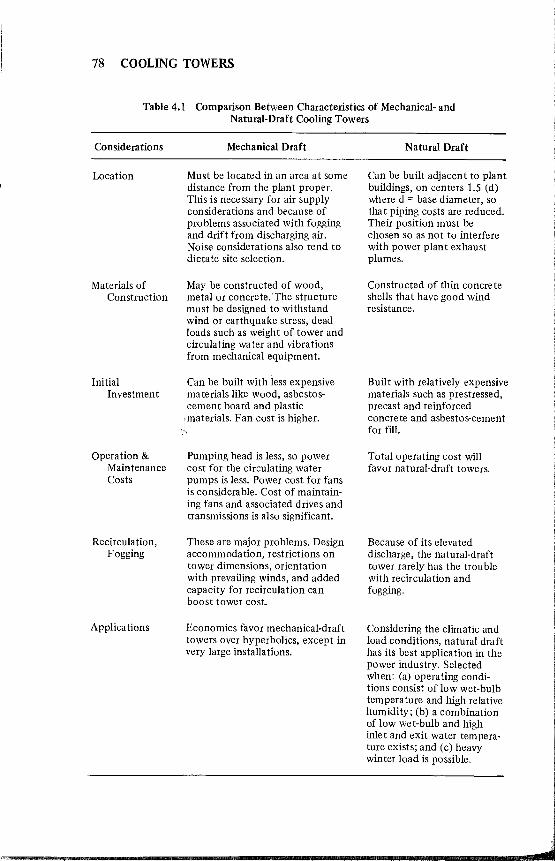
78 COOLING TOWERS
Table 4.1 Comparison Between Characteristics of Mechanical- and Natural-Draft Cooling Towers
Considerations
Location
Materials of Construction
Initial Investment
Operation & Maintenance Costs
Recirculation, Fogging
A pplica tions
Mechanical Draft
Must be located in an area at some distance from the plant proper. This is necessary for air supply considerations and because of problems associated with fogging and drift from discharging air. Noise considerations also tend to dictate site selection.
May be constructed of wood, metal or concrete.'The structure must be designed to withstand wind or earthquake stress, dead loads such as weight of tower and circulating water and vibrations from mechanical equipment.
Can be built with less expensive materials like wood, asbestoscement board and plastic
,materials. Fan cost is higher.
Pumping head is less, so power cost for the circulating water pumps is less. Power cost for fans is considerable. Cost of maintaining fans and associated drives and transmissions is also significant.
These are major problems. Design accommodation, restrictions on tower dimensions, orientation with prevailing winds, and added capacity for recirculation can boost tower cost.
Economics favor mechanical-draft towers over hyperbolics, except in very large instalJations.
Natural Draft
Can be built adjacent to plant buildings, on centers 1.5 (d) where d = base diameter, so tha t piping CO$ts are reduced. Their position must be chosen so as not to interfere with power plant exhaust plumes.
Constructed of thin concrete shells that have good wind resistance.
Built with relatively expensive materials such as prestressed, precast and reinforced concrete and asbestos-cement for fill.
Total operating cost will favor na tural-draft towers.
Because of its eleva ted discharge, the natural-draft tower rarely has the trouble with recircula tion and fogging.
Considering the climatic and load conditions, natural draft has its best application in the power industry. Selected when: (a) operating conditions consist of low wet-bulb temperature and high relative humidity; (b) a combination of low wet-bulb and high inlet and exit water temperature exists; and (c) heavy winter load is possible.
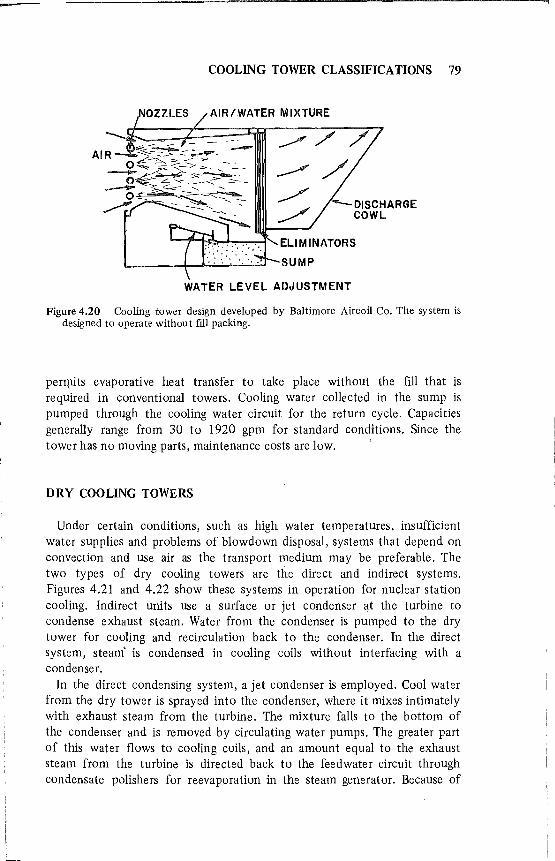
COOLING TOWER CLASSIFICATIONS 79
AIR/WATER MIXTURE
DISCHARGE COWL
-;-~,..,........,....,.,.-,-lf'.. ELIMINATORS
SUMP
WATER LEVEL ADJUSTMENT
Figure 4.20 Cooling tower design developed by Baltimore Aircoil Co. The system is designed to operate withou t fill packing.
perl11its evaporative heat transfer to take place without the fill that is required in conventional towers. Cooling water collected in the sump is pumped through the cooling water circuit for the return cycle. Capacities generally range from 30 to 1920 gpm for standard conditions. Since the tower has no moving parts, maintenance costs are low.
DRY COOLING TOWERS
Under certain conditions, such as high water temperatures, insufficient water supplies and problems of blowdown disposal, systems that depend on convection and Use air as the transport medium may be preferable. The two types of dry cooling towers are the direct and indirect systems. Figures 4.21 and 4.22 show these systems in operation for nuclear station cooling. Indirect units use a surface or jet condenser at the turbine to condense exhaust steam. Water from the condenser is pumped to the dry tower for cooling and recirculation back to the condenser. In the direct system, steam' is condensed in cooling coils without interfacing with a condenser.
In the direct condensing system, a jet condenser is employed. Cool water from the dry tower is sprayed into the condenser, where it mixes intimately with exhaust steam from the turbine. The mixture falls to the bottom of the condenser and is removed by circulating water pumps. The greater part of this water flows to cooling coils, and an amount equal to the exhaust steam from the turbine is directed back to the feed water circuit through condensate polishers for reevaporation in the steam generator. Because of

TO FEEDWATER CIRCUIT
I' PUMP
( CONDENSATE POLISHERS
Figure 4.21
\( ~
FAN
EXHAUST STEAM ---
""'"'"
EXHAUST---".,. STEAM TRUNK
CONDENSATE HEADER
(STEAM TURBINE
EXHAUST ""~tl( \~ STEAM ~~.J Ie. 'lJ t:J '"'---.........
U ..... -.......... ----Direct, dry-type cooling tower condensing system utilizing a mechanical-draft tower.
t
00 o

I I
I
l
COOLING TOWER CLASSIFICATIONS 81
WATER RECOVERy ............ TURBINE '"
STEAM TURBINE
......... ~~~=:::::/
STEAM SUPPLY
DIRECT-CONTACT CONDENSER
V PUMP MOTOR
/ '--___ '--___ ....... _____ -L.-.Q- CONDENSATE TO
/ REACTOR FEED-
CONDENSATE WATER CIRCUIT POLISHERS
Figure 4.22 Indirect, dry-type cooling tower condensing system employing a naturaldraft tower.
the intimate mixing achieved when using a jet condense],: .. circulating water must be of condensate purity. .
After passing through a water recovery turbine, circulating water is again introduced into the condenser and recycled through the system. The recovery turbine is coupled to the drive shaft of the circulating water pump to recover some of the pressure head between cooling coils and the condenser. Circulating water does not come into direct contact with cooling air; thus, no evaporative loss occurs, as with the wet-type tower.
In direct condensing, turbine exhaust steam is conveyed through a trunk to the air-cooled coils, where cooling air passing over the finned coil surfaces condenses the steam. Steam enters the coil section and condenses as it travels downward, with steam and condensate flowing in the same direction, minimizing pressure loss and increasing the heat transfer coefficient.
These designs have provisions for the removal of non condensable vapors and air, for the prevention of freezing during cold weather. Excessive buildup of non condensable vapors in the main condenser would prevent effective condensation. Protection against ice formation is usually accomplished by warm air recirculation and/or fan control. Condensed steam from cooling coils flows by gravity to condensate receivers and is pumped back to the feedwater circuit by a condensate pump.
The major difference between the two systems is the large volume of exhaust steam that must be handled in the direct system, as compared to the smaller volume of circulating water in the indirect system. Cooling
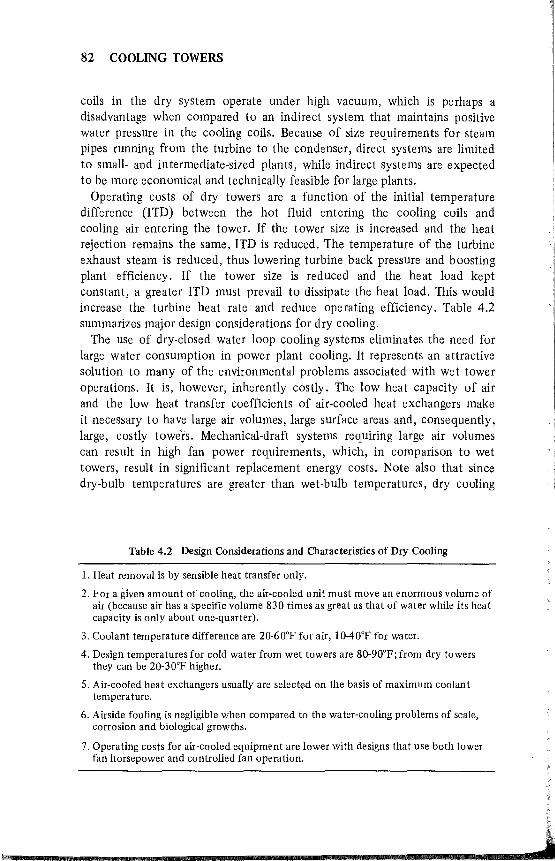
b
82 COOLING TOWERS
coils in the dry system operate under high vacuum, which is perhaps a disadvantage when compared to an indirect system that maintains positive water pressure in the cooling coils. Because of size requirements for steam pipes running from the turbine to the condenser, direct systems are limited to small- and intermediate-sized plants, while indirect systems are expected to be more economical and technically feasible for large plants.
Operating costs of dry towers are a function of the initial temperature difference (lTD) between the hot fluid entering the cooling coils and cooling air entering the tower. If the tower size is increased and the heat rejection remains the same, lTD is reduced. The temperature of the turbine exhaust steam is reduced, thus lowering turbine back pressure and boosting plant efficiency. If the tower size is reduced and the heat load kept constant, a greater lTD must prevail to dissipate the heat load. This would increase the turbine heat rate and reduce operating efficiency. Table 4.2 summarizes major design considerations for dry cooling.
The use of dry-closed water loop cooling systems eliminates the need for large water consumption in power plant cooling. It represents an attractive solution to many of the environmental problems associated with wet tower operations. It is, however, inherently costly. The low heat capacity of air and the low heat transfer coefficients of air-cooled heat exchangers make it necessary to have large air volumes, large surface areas and, consequently, large, costly towers. Mechanical-draft systems requiring large air volumes can result in high fan power requirements, which, in comparison to wet towers, result in significant replacement energy costs. Note also that since dry-bulb temperatures are greater than wet-bulb temperatures, dry cooling
Table 4.2 Design Considerations and Characteristics of Dry Cooling
1. Heat removal is by sensible heat transfer only.
2. For a given amount of cooling, the air-cooled unit must move an enormous volume of air (because air has a specific volume 830 times as great as that of water while its heat capacity is only about one-quarter).
3. Coolant temperature difference are 20-60°F for air, 10-40°F for water.
4. Design temperatures for cold water from wet towers are 80-90°F; from dry towers they can be 20-30°F higher.
5. Air-cooled heat exchangers usually are selected on the basis of maximum coolant temperature.
6. Airside fouling is negligible when compared to the water-cooling problems of scale, corrosion and biological growths.
7. Operating costs for air-cooled equipment are lower with designs that use both lower fan horsepower and controlied fan operation.
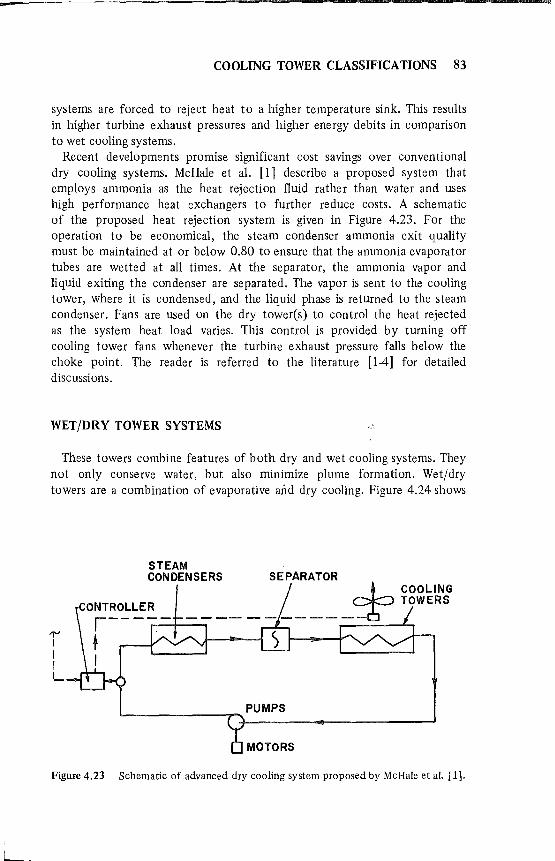
-------------------------------------------------------------------------------~
COOLING TOWER CLASSIFICATIONS 83
systems are forced to reject heat to a higher temperature sink. This results in higher turbine exhaust pressures and higher energy debits in comparison to wet cooling systems.
Recent developments promise significant cost savings over conventional dry cooling systems. McHale et al. [1] describe a proposed system that employs ammonia as the heat rejection fluid rather than water and uses high performance heat exchangers to further reduce costs. A schematic of the proposed heat rejection system is given in Figure 4.23. For the operation to be economical, the steam condenser ammonia exit quality must be maintained at or below 0.80 to ensure that the ammonia evaporator tubes are wetted at all times. At the separator, the ammonia vapor and liqUid exiting the condenser are separated. The vapor is sent to the cooling tower, where it is condensed, and the liqUid phase is returned to the steam condenser. Fans are used on the dry tower(s) to control the heat rejected as the system heat load varies. This control is provided by turning off cooling tower fans whenever the turbine exhaust pressure falls below the choke point. The reader is referred to the literature [1-4] for detailed discussions.
WETjDRY TOWER SYSTEMS
These towers combine features of both dry and wet cooling systems. They not only conserve water, but also minimize plume formation. Wet/dry towers are a combination of evaporative and dry cooling. Figure 4.24 shows
'1" I I I L
STEAM CONDENSERS SEPARATOR
-----------~ .....--1---,
~ __________ -r~PUMPS 4---------~------------~
MOTORS
Figure 4.23 Schematic of advanced dry cooling system proposed by McHale et al. [ll.
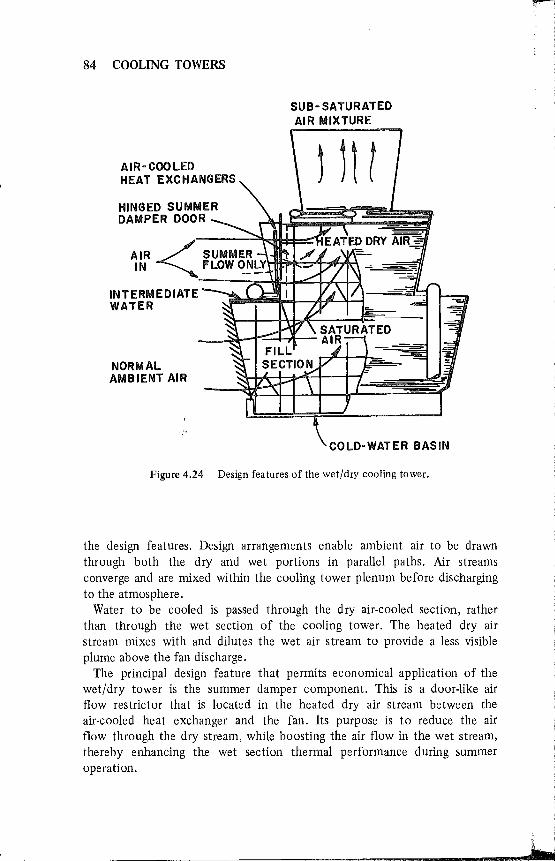
84 COOLING TOWERS
AIR-COOLED HEAT EXCHANGERS
INTERMEDIATE WATER
NORMAL AMBIENT AIR
SUB-SATURATED AIR MIXTURE
J 11 !
COLD-WATER BASIN
Figure 4.24 Design features of the wet/dry cooling tower.
the design features. Design arrangements enable ambient air to be drawn through both the dry and wet portions in parallel paths. Air streams converge and are mixed within the cooling tower plenum before discharging to the atmosphere.
Water to be cooled is passed through the dry air-cooled section, rather than through the wet section of the cooling tower. The heated dry air stream mixes with and dilutes the wet air stream to provide a less visible plume above the fan discharge.
The principal design feature that permits economical application of the wet/dry tower is the summer damper component. This is a door-like air flow restrict or that is located in the heated dry air stream between the air-cooled heat exchanger and the fan. Its purpose is to reduce the air flow through the dry stream, while boosting the air flow in the wet stream, thereby enhancing the wet section thermal performance during summer operation.
~ . I I
b

-COOLING TOWER CLASSIFICATIONS 85
REFERENCES
1. McHale, C. E., G. E. Jablonka, J. A. Bartz and D. J. Webster. "New Developments in Dry Cooling of Power Plants," Combustion 51 (11) (May 1980).
2. Van Der Walt, N. T., L. A. West, T. J. Sheef and D. Kubal. "The Design and Operation of a Dry Cooling System for a 200 MW Turbo-Generator at Grootv1ei Power Station-South Africa," paper presented at the IX World Energy Conference, Detroit, MI, (1974).
3. Gottzmann, C. F., and P. S. O'Neill. "Field Experience with High Efficiency Heat Exchangers," paper presented at the AIChE 74th National Meeting, March 12-15,1973.
4. Oleson, K. A., G. J. Silvestri, V. S. Ivins and S. W. W. Mitchell. "Dry Cooling Affects More Than Cost," Elect. World (July 1, 1972).
SUGGESTED READING
1. Kolflat, T. D., et al. "Cooling Tower Practices," Power Eng. (January 1974).
2. Lichtenstein, J. "Performance and Selection of Mechanical Draft Cooling Towers," ASME Trans. (1943).
3. Smith, E. C., and M. W. Larin off. "Alternative Arrangements and Design of Wet/Dry Cooling Towers," Power (May 1976).

This page intentionally left blank
CHAPTER 5
THEORY AND DESIGN PRINCIPLES
INTRODUCTION
The use of cooling towers has grown tremendously during the last two to three decades, due to an increasing necessity. Cooling towers, along with air conditioning spray chambers, spray driers, spray towers and spray ponds, are the largest users of applied diffusional heat transfer principles. As pointed out in Chapter 1, many industrial locations do not lend thems~lves to unlimited use of cold fresh water as a cooling medium. The supply of sufficient surface and subsurface cooling water has become such a major problem today that many new plants are attempting to develop continual reuse of limited water that they may obtain from outside sources:
The cooling water's available temperature is a major consideration, having direct impact on the economics of the design. This is especially true today for the chemical and power industries. Chemical plants establish their cooling water temperatures on the operating pressures on the condensers of distillation and evaporation operations and, consequently, on equipment preceding them. Power plants base it on turbine- or engine-discharge pressures and the ultimate heat recovery. To ensure that the proper water temperature is made available, careful analysis of process requirements, as well as careful review of cooling tower design principles, must be made. We will now use the definitions presented in Chapters 2 and 3 to address the theory of cooling tower operation and to develop specific design criteria.
GAS-LIQUID CONTACTING
The interfacial surface area made available for a gas and liquid to contact largely establishes the thermal efficiency of the contact device. That is, the gas-liquid interface is also the heat transfer surface. Consequently, the greater
87
88 COOLING TOWERS
this interfacial contact area, the greater the degree of heat exchange that takes place. In spray ponds and spray towers this contact area is promoted by utilizing spray nozzles to generate small liquid droplets.
In addition to interfacial area, the time of contact between the two phases affects thermal efficiency. This is best illustrated by the example given in Figure 5.1. Suppose we have a column Z feet tall and we gravity feed water in the form of droplets at a rate of 1 drop/sec. If there is no initial velocity imparted to the drops, then each drop descends through the column in accordance with the free-fall law:
(5.1)
where e is the time it takes to fall through the column. If our column is 32 feet tall, then it takes Y2 sec for a single drop to pass through. At the feed rate of 1 drop/sec then, there will always be 1.41 drops present in the column. At the discharge, 1 drop/sec will be removed continuously. Consequently, the interfacial or effective area in the column is that of \l2 droplets.
Now if we alter the column by installing some baffles or plates on which droplets can impinge or be deflected, we could increase the time it takes for each droplet to pass through the column. By interrupting the flow then, we might increase the droplet holdup time to 5 seconds. Then, as shown in Figure 5.1, although 1 drop/sec is fed to the column and 1 drop/sec discharges, there will always be 5 drops of water at anyone time in the column for a continuous flow system. We thus have 5/ Y2, or 3.5 times more effective surface than for the case of free-fall.
In gas absorption equipment, such as packed tower wet scrubbers, the interfacial gas-liquid contact area and the contact time are established in the form of a film surface. This film surface is generated by packing material. The role of packing is to increase the turbulence and the contact surface between the two phases. It is also designed to provide a tortuous path to prevent bypassing. In early designs, broken rock or coke was used as a packing material; however, these have been replaced by specially designed geometric shapes to provide greater contacting efficiency. Figure 5.2 illustrates some common packing shapes that are commercially available.
Cooling towers have different design restrictions than absorption columns. Because of large air volume and small allowable pressure drop requirements, common cooling tower designs employ wooden slats of either triangular or rectangular cross section at spaced intervals within the structure. This type of packing arrangement leaves the tower substantially unobstructed.
Cooling tower packing material is commonly referred to as fill. The two most common configurations used are illustrated in Figure 5.3. The purpose
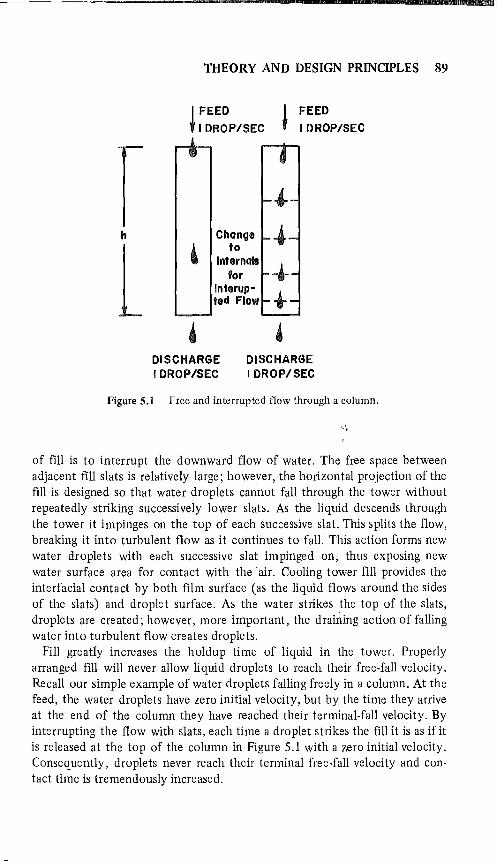
r h
L
THEORY AND DESIGN PRINCIPLES 89
I FEED
t I DROP/SEC
Change to
Interna" for
Interupted Flow
I FEED
t I DROP/SEC
DISCHARGE I DROP/SEC
DISCHARGE I DROP/SEC
Figure 5.1 Free and interrupted flow through a column.
of fill is to interrupt the downward flow of water. The free space between adjacent fill slats is relatively large; however, the horizontal projection of the fill is designed so that water droplets can'not fall through the tower without repeatedly striking successively lower slats. As the liquid descends through the tower it impinges on the top of each successive slat. This splits the flow, breaking it into turbulent flow as it continues to fall. This action forms new water droplets with each successive slat impinged on, thus exposing new water surface area for contact with the' air. Cooling tower fill provides the interfacial contact by both film surface (as the liquid flows around the sides of the slats) and droplet surface. As the water strikes the top of the slats, droplets are created; however, more important, the draining action of falling water into turbulent flow creates droplets.
Fill greatly increases the holdup time of liquid in the tower. Properly arranged fill will never allow liquid droplets to reach their free-fall velocity. Recall our simple example of water droplets falling freely in a column. At the feed, the water droplets have zero initial velocity, but by the time they arrive at the end of the column they have reached their terminal-fall velocity. By interrupting the flow with slats, each time a droplet strikes the fill it is as if it is released at the top of the column in Figure 5.1 with a zero initial velocity. Consequently, droplets never reach their terminal free-fall velocity and contact time is tremendously increased.
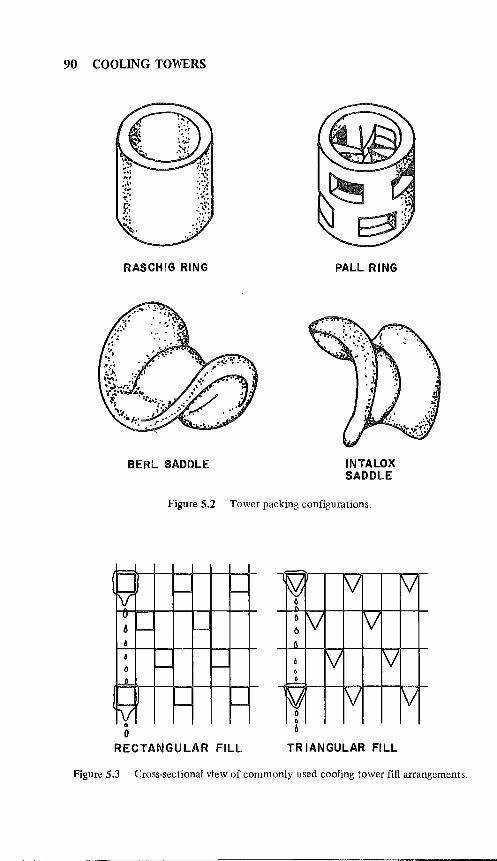
90 COOLING TOWERS
RASCHIG RING PALL RING
BERL SADDLE INTALOX SADDLE
Figure 5.2 Tower packing configurations.
(
K1 f-- '--
u
6 r- '--
I
G
0 '-- r-i
(fV '--
• r-
o o
o &
RECTANGULAR FILL TR IAN GULAR FILL
Figure 5.3 Cross-sectional view of commonly used cooling tower fill arrangements.
THEORY AND DESIGN PRINCIPLES 91
It is important that no bypassing of the two phases occurs in the tower. A uniform liquid distribution across the tower's cross section is essential. This is accomplished by spraying the water over the top of the tower. Spray nozzles also help to create droplet surface and increase contact time.
APPLICATION OF THE PSYCHROMETRIC CHART
The reader should be familiar with the use of the air-water psychrometric chart (Figure 2.5). If not, the reader should take a look at some of the problems at the end of Chapters 2 and 3. By way of review, the basic chart consists of a humidity(JI)-temperature (dry-bulb) set of coordinates along with additional parameters (curves) of constant relative humidity, constant moist volume (humid volume), adiabatic cooling curves (which are the same as the wet-bulb or psychrometric lines, for water vapor only) and the 100% relative humidity curve, also called the saturated-air curve. If any two values are known, we can determine the air-moisture condition on Figure 2.5 and evaluate all other required parameters.
The left-hand scale gives the enthalpy per pound of dry air of a saturated air-water vapor mixture. The enthalpy of the wet air (in Btu/lb dry air) is actually the following:
AH = AHair + AHH 0 UI) 2
(5.2)
Vapor
There are alternate methods available for computing enthalpy values [1,2]. For our specific system we could expand Equation 5.2 to the following:
AH = 0.240 (T - OaF) + .H[107S +. 0.45 (T - 32°F)] (5.3)
where 0.240 (T - 0) is Cp(ilT) for air (with OaF as the reference temperature, .H(1075) is the heat of vaporization of water at 32°F and 0.45 (T - 32) is Cp(ilT) for water vapor (with 32°F as the reference temperature).
Equation 5:3 can be cleaned up to give the following:
AH= 0.240T + .H(1061 + O.4ST) (5.4)
where T is in OF. The use of these relationships in constructing and applying humidity charts
is best illustrated by examining a simplified case, that of adiabatic cooling or humidification. Figure 5.4 illustrates this process between air and water that is recycled through the cooling tower. In this operation air is both cooled and

92 COOLING TOWERS
H A
OT IR
Tj
RECIRCULATED WATER
~ T
PACKED COOL TOWER OR AIR COOLING TOWER To
I r MAKE-UP WATER'
, Figure 5.4 Example of adiabatic humidification.
humidified while a portion of the recirculated water undergoes evaporation. If equilibrium is reached the air becomes saturated and both the air and water temperatures are the same. If the operation occurs adiabatically, then by application of~n energy balance (see Chapter 3) we can develop an expression defining the adiabatic cooling line of the humidity chart.
(Enthalpy Of) (EnthalPY of H 20 vapor) = (EnthalPY Of)
Air in + in Air Entering Tower Exit Air
(Enthalpy of H,G vapor)
+ in Exit Air
And defining Ts as the equilibrium temperature of the water,
0.240(Ti - Ts) + .H(~HHPB- + 0.45 (Tair - Ts) 1 Ts
= 0.240 (Ts - Ts) +.Hsl ~HH,GB- + 0.45 (Ts - Ts) 1 Ts
(5.5)
where the subscript s refers to saturation conditions, which is actually the wet-bulb temperature (T wb).
Equation 5.5 can be rearranged to give the following:
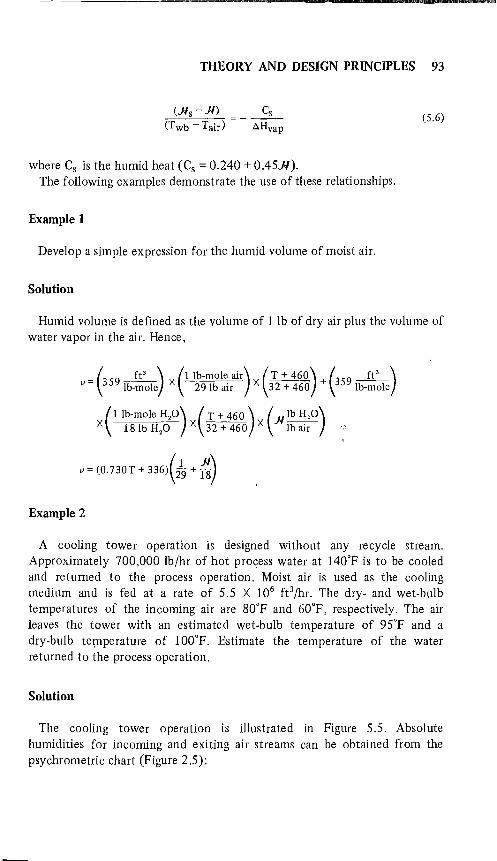
THEORY AND DESIGN PRINCIPLES 93
(.Hs - .H) = __ ~_s_ (Twb - Tair) A Hvap
(5.6)
where Cs is the humid heat (Cs = 0.240 + 0.45)1). The following examples demonstrate the use of these relationships.
Example 1
Develop a simple expression for the humid volume of moist air.
Solution
Humid volume is defined as the volume of 1 lb of dry air plus the volume of water vapor in the air. Hence,
( ft') (lIb-mOle air) (T + 460) ( ft') v = 3591b_mole X 291b air X 32 + 460 + 3591b_mole
(lIb-mOle HP) (T + 460) (.H Ib H20)
X 181bH20 X 32+460 X Ibair
v = (0.730T + 336)U9 + ts) Example 2
A cooling tower operation is designed without any recycle stream. Approximately 700,000 lb/hr of hot process water at 140°F is to be cooled and returned to the process operation. Moist air is used as the cooling medium and is fed at a rate of 5.5 X 10⁶ fe/hr. The dry- and wet-bulb temperatures of the incoming air are 80°F and 60°F, respectively. The air leaves the tower with an estimated wet-bulb temperature of 95°F and a dry-bulb telJlperature of lOO°F. Estimate the temperature of the water returned to the process operation.
Solution
The cooling tower operation is illustrated in Figure 5.5. Absolute humidities for incoming and exiting air streams can be obtained from the psychrometric chart (Figure 2.5):
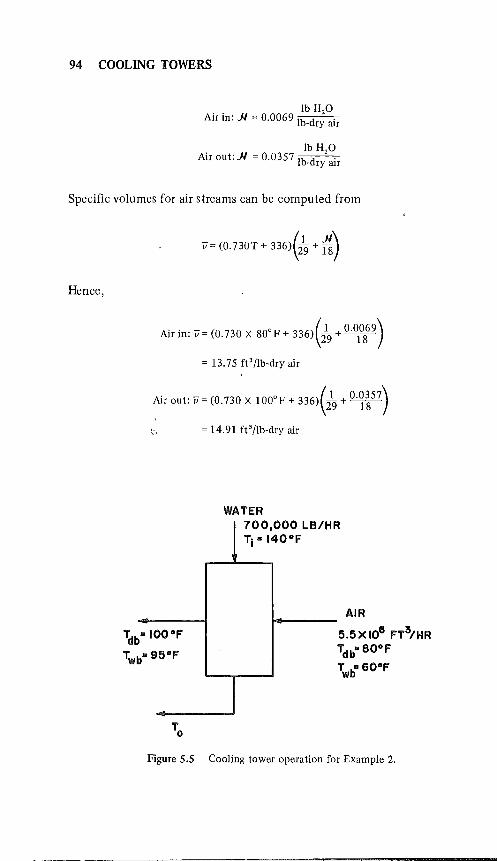
94 COOLING TOWERS
. . Ib H20 Au m: .JI = 0.0069 Ib d . - ryaIT
. Ib H20 An out:.JI = 0.0357 Ib d . - ry aIT
Specific volumes for air streams can be computed from
Hence,
v= (0.730T + 336)(219 + :s)
Air in: v = (0.730 X 80° F + 336) (l9 + 0.010869)
= 13.75 ft' /Ib-dry air
~ir out: v= (0.730 X 100°F + 336)(2~ + 0.~~57) \' = 14.91 ft'/Ib-dry air
WATER 700,000 LB/H Tj D 140°F
D 1000F
bD 95°F
R
AIR
5.5X10⁶ FT3/HR TdbD BO°F
TwbD GO°F
Figure 5.S Cooling tower operation for Example 2.
THEORY AND DESIGN PRINCIPLES 95
Enthalpies of the moist air streams can be computed from
~H = 0.240(T - 0) + .H(1075 + 0.45(T - 32» ~ '--v-" ~ Cp(~T) for Heat of Cp(~T) for
air vaporization H20 vapor at 32° F
and consolidating terms:
~H= 0.240T + .H(1061 + 0.45T)
Air in: ~H= 0.240 X 80°F + 0.0069 (1061 + 0.45 X 80°F)
= 26.77 Btu/lb-dry air
Air out: ~H= 0.240 X 100° F + 0.0357 (1061 + 0.45 X 100° F)
~H = 63.48 Btu/lb-dry air
Enthalpy of entering water:
~Hi = Cp H 0 ~T = 1.(140 - 32) = 108 Btu/lb-H~b 2
Enthalpy of exiting water:
~H= 1.(To -32)
where 32°F is the reference temperature. Amount of dry air to the cooling tower is
ft' ft' lb-dry air 5.5 X 10· hr /13.751b_dry air = 4.0 X 10 5 hr
Amount of process water sent to the tower per unit mass of air is
lb-H20 lb-dryair 700,000 11T /4.0 X 10 5 hr = 1. 75 lb H2 0/1b-dry air
The amount of water evaporated is
0.0357 - 0.0069 = 0.0288 lb Hp/lb-dry air

96 COOLING TOWERS
The exiting temperature of the water for this operation can be computed from a total energy balance about the tower. Reviewing each term in the energy balance:
Moist air in:
Btu 5 Ib-dry air 7' 26.77 Ib-dry air X 4.0 X10 hr = 1.07 X 10 Btu/hr
Water stream in:
~ Ib H20 . 5 Ib-dry air _ 7 Btu 1081b-H20 X 1.751b_dry air X 4.0 X 10 hr -7.56 X 10 hr
Moist air out:
Btu 5 Ib-dry air _ 7
63.481b_dryair X 4.0 X 10 hr - 2.54 X 10 Btu/hr
Water stream out:
Btu Ib-H20 Ib-dryair (T -32) Ib-H,G X (1.75 -0.0288) Ib-dry air X 4.0 X 10⁵ hr
= 6.89 X 10⁵ (To -32) Btu/hr
At steady-state, energy in = energy out:
1.07 X 10 7 + 7.56 X 10 7 = 2.54 X 10 7 + 6.89 X 10⁵(To - 32)
Solving for To,
Additional problems are given at the end of this chapter.
APPLICATION OF THE ENERGY BALANCE
Let us now develop material and energy balances directly applicable to cooling towers. The idealized cooling tower operation is illustrated in Figure 5.6. The cooling tower operates with some type of heat source (a con-
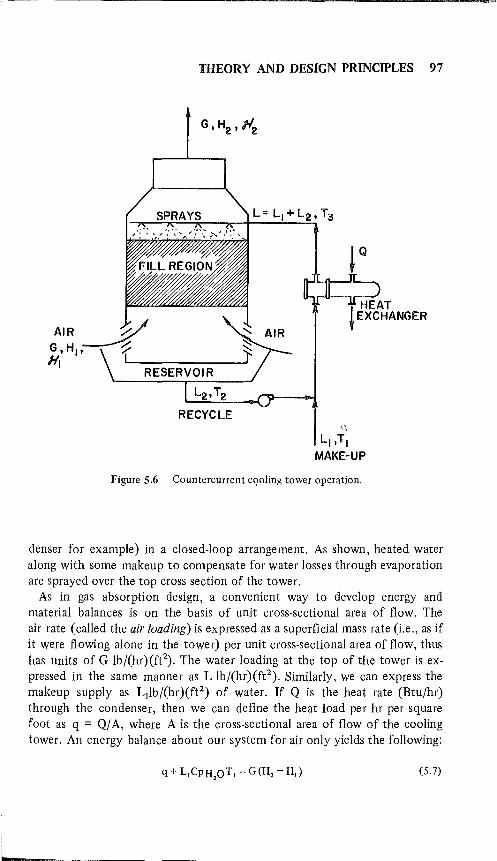
THEORY AND DESIGN PRINCIPLES 97
RESERVOIR
RECYCLE
Figure 5.6 Countercurrent cQoling tower operation.
denser for example) in a closed-loop arrangement. As shown, heated water along with some makeup to compensate for water losses through evaporation are sprayed over the top cross section of the tower.
As in gas absorption design, a convenient way to develop energy and material balances is on the basis of unit cross-sectional area of flow. The air rate (called the air loading) is expressed as a superficial mass rate (i.e., as if it were flowing alone in the tower) per unit cross-sectional area of flow, thus has units of G lb/(hr) (ft2). The water loading at the top of the tower is expressed in the same manner as L lb/(hr)(ftl). Similarly, we can express the makeup supply as L1lb/(hr)(ft2) of water. If Q is the heat rate (Btu/hr) through the condenser, then we can define the heat load per hr per square foot as q = Q/ A, where A is the cross-sectional area of flow of the cooling tower. An energy balance about our system for air only yields the following:
(5.7)
98 COOLING TOWERS
In writing Equation 5.7 we have used a reference temperature of OaF for air. Note that HI 2 is the enthalpy per pound of dry air and includes the heat of the vapor associated with a pound of dry air.
An energy balance for the water component alone gives
q = LCp(T3 -T,) + L,Cp(T, -T,) (5.8)
Equating both balances we get
G(H, - H,) = LCp(T3 -T,) + L, CpT, (5.9)
where
L = L, + L,
The amount of makeup water that is needed to compensate for evaporation losses is
L, = G(.H, - .H,) (5.10)
By dividing Equation 5.9 by L J and using Equation 5.l0, we can rearrange our balance into a more generalized form:
( H, -H') L, .H,-.H, =LCp(T3-T,)+L,CpT, (5.11)
If we then combine Equations 5.l1 and 5.8, a general expression for makeup water requirements for any fixed set of conditions is obtained:
L = q , (H, - H,)/(.H, - .H,) - CpT, (5.12)
In cooling towers, cold air is used to cool hot water. As water descends through the tower, it is possible for the temperature of the water to become lower than the dry-bulb temperature of the incoming air; however, it will not fall below the inlet air's wet-bulb temperature. In the upper regions of a tower, hot water first contacts the discharging air which is still colder than the water. It should be noted that in this region the partial pressure of the water out of the liquid exceeds that which is in the exit air stream, while at the same time the water temperature is greater than the discharging air. Both these facts can be considered as potentials that tend to lower the water temperature through the mechanisms or evaporation and sensible transfer to the air. The net result is an increase in the air enthalpy. Both potentials may
THEORY AND DESIGN PRINCIPLES 99
operate adiabatically and in the same direction while saturating the air. This is the main principle behind cooling tower operation and is the reason why this particular direct contacting operation works so effectively in cooling water.
As water travels down through the lower regions of the cooling tower, it will have a temperature of, or less than, the dry-bulb temperature of the air. Under these conditions, sensible heat and mass transfer are in opposite directions. This is analogous to the conditions of a wet-bulb thermometer (see Chapter 2). In fact, the wet-bulb temperature represents the limit to which the discharge water temperature can fall to in a cooling tower where adiabatic equilibrium exists between the water and inlet air.
Merkel [3] has developed the equations describing the performance of a cooling tower and Kern [4] has outlined the derivation in detail. The discussion below follows Kern's outline.
The total heat transfer in a cooling tower consists of two components: the transfer of heat by diffusion and by convection from the water to the air:
Total Heat Transfer Per Unit
Area
Diffusional = Heat Transfer +
Rate
where q's are in Btu/(hr)(ft2).
Heat Transfer By
Convection
(5.13)
The heat transferred by diffusion can 'be expressed in terms of the latent heat of vaporization of the water:
(5.14)
where "AVG is an average value for al( the water vaporized in the tower. Combining this expression with Equation 5.8 and rearranging terms we get the following expression:
qc LCp(T, -T,) + Ll Cp(T, -T1 ) - Ll A. qD - LIA. (5.15)
An expression for the makeup water, LJ, is given by Equation 5.10. Incorporating this and Equation 5.9 into Equation 5.15, the following compact expression is obtained:
(5.16)
100 COOLING TOWERS
Note that Equation 5.16 gives us the opportunity to see which heat transfer mechanism is dominant. That is, it provides the ratio of the heat transferred by convection to that transferred by diffusion.
The sensible heat transfer from the water to the air is given by the following expression:
(5.17)
where a = effective surface area of water per unit volume of tower (as both droplet and film surface)
dV = differential tower volume
The value of "a" cannot be directly determined as it consists of both droplet and film surface area. Film surfa~e is independent of the thickness of the water film; however, the droplet surface is a function of both the liquid loading generating drops and the size distribution of droplets formed. We can bypass the difficulty in measuring "a" by measuring the product Ka for the entire tower at specific operating conditions. This is discussed at greater length later. '
The heat transfer area is, then,
dAH = adV
And we can also define
dQc = GCpdT air
dqD = A.dL
(5.18)
(5.19)
(5.20)
dL represents the rate at which one component (water) diffuses. Using the mass flux relationships developed in Chapter 3, it can be shown that
dL = K(.JI s - .JI)adV (5.21)
where K is the overall mass transfer coefficient (lb/(hr)(ft2 )(lb/lb)). Substituting for dL in Equation 5.20 we obtain the following:
dqD = KA,(,Hs -.JI) adV (5.22)
The total heat transfer, dq, is given by Equation 5.13, which in the differential form is restated here:
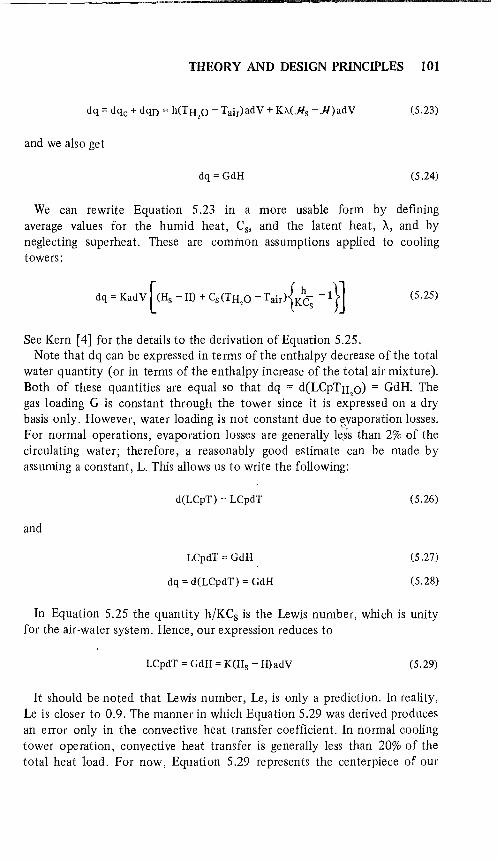
THEORY AND DESIGN PRINCIPLES 101
dq = dqc + dqD = h(THzO - Tair)adV + KA.(.Hs - .H)adV (5.23)
and we also get
dq = GdH (5.24)
We can rewrite Equation 5.23 in a more usable form by defining average values for the humid heat, Cs, and the latent heat, A, and by neglecting superheat. These are common assumptions applied to cooling towers:
dq = KadV [(Hs - H) + Cs(TH,Q -Tair){K~s -I}] (5.25)
See Kern [4] for the details to the derivation of Equation 5.25. Note that dq can be expressed in terms of the enthalpy decrease of the total
water quantity (or in terms of the enthalpy increase of the total air mixture). Both of these quantities are equal so that dq = d(LCpTH 0) = CdH. The
z gas loading C is constant through the tower since it is expressed on a dry basis only. However, water loading is not constant due to y,Yaporation losses. For normal operations, evaporation losses are generally le:ss than 2% of the circulating water; therefore, a reasonably good estimate can be made by assuming a constant, L. This allows us to write the following:
d(LCpT) = LCpdT
and
LCpdT = GdH
dq = d(LCpdT) = GdH
(5.26)
(5.27)
(5.28)
In Equation 5.25 the quantity h/KCs is the Lewis number, which is unity for the air-water system. Hence, our expression reduces to
LCpdT = GdH = K(Hs - H)adV (5.29)
It should be noted that Lewis number, Le, is only a prediction. In reality, Le is closer to 0.9. The manner in which Equation 5.29 was derived produces an error only in the convective heat transfer coefficient. In normal cooling tower operation, convective heat transfer is generally less than 20% of the total heat load. For now, Equation 5.29 represents the centerpiece of our
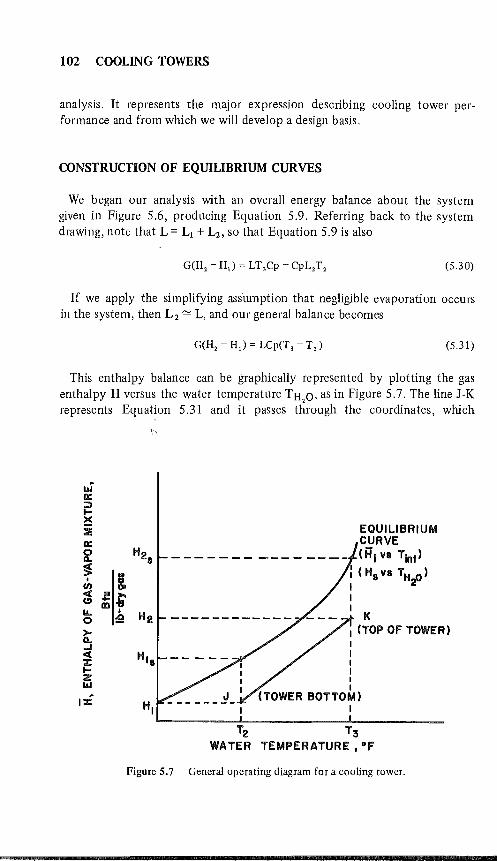
102 COOLING TOWERS
analysis. It represents the major expression describing cooling tower performance and from which we will develop a design basis.
CONSTRUCTION OF EQUILIBRIUM CURVES
We began our analysis with an overall energy balance about the system given in Figure 5.6, producing Equation 5.9. Referring back to the system drawing, note that L = LJ + ~, so that Equation 5.9 is also
(5.30)
If we apply the simplifying assllmption that negligible evaporation occurs in the system, then L z ~ L, and our general balance becomes
G(H2 - HI) = LCp(T 3 - T 2) (5.31)
This enthalpy balance can be graphically represented by plotting the gas enthalpy II versus the water temperature TH
20, as in Figure 5.7. The line J-K
represents Equat~on 5.31 and it passes through the coordinates, which
aJ 0::: :;:) I-~ :::Ii 0:::
~ ~ ..
I CII til CIt c(
~" (!)
IL. ID,
0 :!:! >-0.. ..J c( ::I: I-Z 1&.1
1::1:
H2 s
H2
His
HI
EQUILIBRIUM CURVE (Hi vs Tint)
: (HsVSTHi') I I I
K I (TOP OF TOWER) I I I I I I
(TOWER BOTTOM) I
T2 T3 WATER TEMPERATURE ,oF
Figure 5.7 General operating diagram for a cooling tower.
mEORY AND DESIGN PRINCIPLES 103
represent the terminal conditions of the two fluids. As long as our assumption holds that L - L2 is small, then JK is a straight line having a slope of LCp/G. This is referred to as the operating line. Further, since Cp = 1.0 for water, its slope is just the ratio of the liquid to air loading. Note that the equilibrium curve represents conditions of the gas at the gas-liquid interface; that is, it is the enthalpy of saturated gas at each temperature.
In our general discussion of diffusion theory (Chapter 3) we showed that the number of transfer units [Equation 3.64 - Ntu = f dy/(Y - y")] represented a method of estimating the magnitude of effort needed to achieve a specified amount of mass transfer through diffusion. And if the height of a single transfer unit (Htu) is known, then we can compute the total height of the tower per unit cross section from the product Ntu X Htu (Equation 3.65). By following the same reasoning behind the development of Equation 3.64, we can rearrange our major cooling tower equation (Equation 5.29) to the following:
f -dB = Ka Y (5.32) Hs -H G
Multiplying by GIL and noting that Cp for water is 1.0: '\
Ntu' = L dT - = Ka YL
(5.33) jHs-H
The number of transfer units for a cooling tower is distinguished from the general definition given back in Chapter 3 by the prime ('). Note that some texts prefer to call this the number of diffusion units (Ndu) and distinguish Htu by the height of a diffusion unit (Hdu). The definitions of Ntu and Ntu' are analogous, so it is not necessary to distinguish a box from a container.
Note that Ntu' is determined from process conditions imposed on the operation. It is not based on the performance of the tower itself. The water temperature ,unfortunately is not a simple function of IIvapor, hence Equation 5.33 must be solved either numerically or via graphic solution.
Note that the value of II at any point on the operating line in Figure 5.7 can be determined by
(5.34)
The area of the plot bound between the equilibrium curve (saturation curve) and the operating line represents the potential that drives the total

104 COOLING TOWERS
heat transfer. Suppose we change some of the process conditions so that the operating line JK in Figure 5.7 is shifted downward. Then we would have a larger area bound between the operating line and the saturation curve. In a physical sense, this means that fewer transfer units and less height of any type of tower are needed.
GUIDELINES FOR TOWER SPECIFICATION
Before applying our generalized equations to sizing cooling towers, we need to review some of the criteria for specifying operating conditions. The critical conditions that must be established before the design is initiated are the heat load, wet-bulb temperature, hot and cold water temperature and water rate.
Heat Load Determination
The determination of the heat to be dissipated by a cooling tower is an essential factor that not only affects the tower size, but also its effectiveness. If the heat load ,determination is not accurate, either too high or too low, a larger or smalle,~ size tower than is needed for a particular job could be selected.
The imposed heat load on a cooling tower is determined by the process operation. The degree of cooling is controlled by the normal operating temperature level of the process fluid. Sometimes a low temperature is desired to improve the quantity or quality of the final product or to increase process efficiency. For example, low operating temperatures are required in oil refineries to condense volatile vapors that otherwise would be lost. In other cases, high operating temperatures are desirable, one example being internal combustion engines. It is important to determine the heat load as accurately as possible to select the proper size cooling tower.
Dependable information has been developed for the heat rejector requirements of different types of power equipment: air compressors, refrigeration equipment, steam condensers, diesel engines and natural gas engines. Table 5.1 gives information on the heat absorbed by cooling water for this type of power equipment.
Wet-Bulb Temperature Determination
The wet-bulb temperature is an important factor in the sizing, selection and design of water cooling equipment. It is defined as the temperature CF) to which air can be cooled adiabatically to saturation by the addition of water vapor and can be expressed as the lowest temperature to which water can be cooled by the evaporative method.
THEORY AND DESIGN PRINCIPLES 105
Table 5.1 Heat Absorbed by Cooling Water for Various Operations
Air Compressors Single·stage Single-stage with aftercooler Two-stage with intercooler Two-stage with intercooler and
aftercooler
Refrigeration Compression Absorption
Steam Jet Refrigeration Condenser 100 psi steam supply (dry) 2 inch Hg condenser Steam turbine condenser
Diesel Engine (Jacket Water) Four-cycle supercharged Four-cycIe nonsupercharged Two-cycle, crankcase compressor Two-cycle, large unit Two-cycle, high speed
Natural Gas Engines Four-cycle (250 psi compressor) Two-cycle (250 psi compressor)
Btu/min/ton
250 500
900
Btu/lb of steam
1100 1000
Btu/Bhp/hr
380 2545 1530
2545
2600 3000 2000 2300 2100
4500 3000
Theoretically, a cooling tower will cool water to the entering wet-bulb temperature when operating without a heat load; however, a thermal potential is required in all heat rejection processes, so it is not possible to cool water to the entering wet-bulb temperature when a heat load is applied. The wet-bulb temperature has a direct impact on the operating temperature of the plant and influences operating conditions, plant efficiencies and operating cost.
The selection of the design wet-bulb temperature is made on the condition existing at the tower site and measured with a sling psychrometer. The selected temperature is normally close to the average maximum wet-bulb for the summer months.
Selection of wet-bulb temperatures that are not exceeded by more than 5% during a normal summer have given satisfactory performance for most industrial installations. The hours that wet-bulb temperatures exceed the average maximum by 5% need not be consecutive hours and may occur in periods of short duration. Study should be made on daily wet-bulb temperature cycle as well as monthly and even yearly temperature cycles. Figure 5.8 shows typical wet-bulb temperature cycle curves.
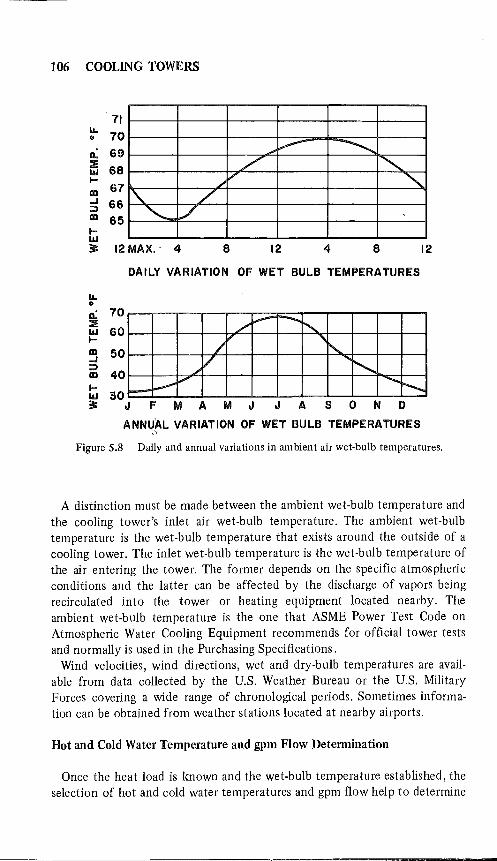
106 COOLING TOWERS
v -.......... /' ""-
. 71
~ 70
0.. 69
i5 68 .... ID 67 ~" " :5 66 ID 65 .... w
I'\. "- L/
3: 12 MAX.' 4
./
8 12 4 8
DAILY VARIATION OF WET BULB TEMPERATURES
IL. o 0.: 70 ::liE w 60 .... ~ 50 :;:) ID 40
/ ..... V
/" ""'" t...... I'..
f'.-
12
.... w 30
I....- ...... -..... r--..... F--
3: J F M A M J J A SON D
ANNI,IAL VARIATION OF WET BULB TEMPERATURES ("I
Figure 5.8 Daily and annual variations in ambient air wet-bulb temperatures.
A distinction must be made between the ambient wet-bulb temperature and the cooling tower's inlet air wet-bulb temperature. The ambient wet-bulb temperature is the wet-bulb temperature that exists around the outside of a cooling tower. The inlet wet-bulb temperature is the wet-bulb temperature of the air entering the tower. The former depends on the specific atmospheric conditions and the latter can be affected by the discharge of vapors being recirculated into the tower or heating equipment located nearby. The ambient wet-bulb temperature is the one that ASME Power Test Code on Atmospheric Water Cooling Equipment recommends for official tower tests and normally is used in the Purchasing Specifications.
Wind velocities, wind directions, wet and dry-bulb temperatures are available from data collected by the U.S. Weather Bureau or the U.S. Military Forces covering a wide range of chronological periods. Sometimes information can be obtained from weather stations located at nearby airports.
Hot and Cold Water Temperature and gpm Flow Determination
Once the heat load is known and the wet-bulb temperature established, the selection of hot and cold water temperatures and gpm flow help to determine
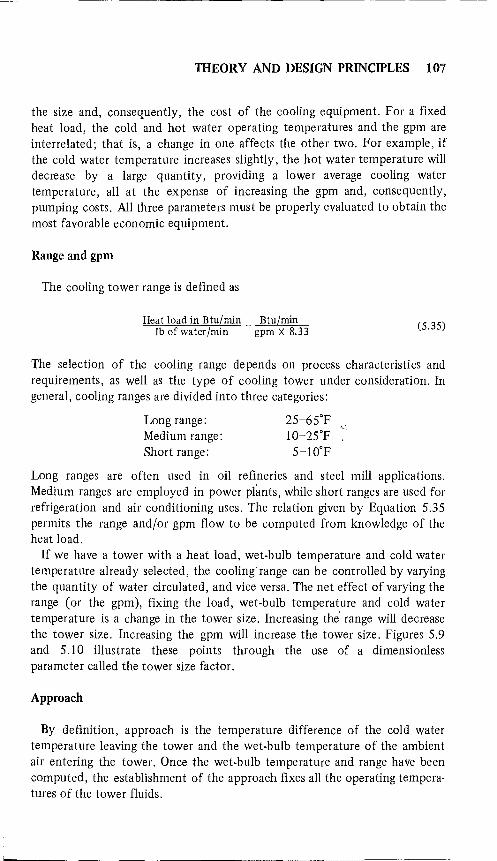
mEORY AND DESIGN PRINCIPLES 107
the size and, consequently, the cost of the cooling equipment. For a fixed heat load, the cold and hot water operating temperatures and the gpm are interrelated; that is, a change in one affects the other two. For example, if the cold water temperature increases slightly, the hot water temperature will decrease by a large quantity, providing a lower average cooling water temperature, all at the expense of increasing the gpm and, consequently, pumping costs. All three parameters must be properly evaluated to obtain the most favorable economic equipment.
Range and gpm
The cooling tower range is defined as
Heat load in Btu/min lb of water/min
Btu/min gpm X 8.33 (5.35)
The selection of the cooling range depends on process characteristics and requirements, as well as the type of cooling tower under consideration. In general, cooling ranges are divided into three categories:
Long range: Medium range: Short range:
25-65°F 1O-25°F
5-10°F
Long ranges are often used in oil refineries and steel mill applications. Medium ranges are employed in power plants, while short ranges are used for refrigeration and air conditioning uses. The relation given by Equation 5.35 permits the range and/or gpm flow to be computed from knowledge of the heat load.
If we have a tower with a heat load, wet-bulb temperature and cold water temperature already selected, the cooling range can be controlled by varying the quantity of water circulated, and vice versa. The net effect of varying the range (or the gpm), fixing the load, wet-bulb temperature and cold water temperature is a change in the tower size. Increasing the' range will decrease the tower size. Increasing the gpm will increase the tower size. Figures 5.9 and 5.10 illustrate these points through the use of a dimensionless parameter called the tower size factor.
Approach
By definition, approach is the temperature difference of the cold water temperature leaving the tower and the wet-bulb temperature of the ambient air entering the tower. Once the wet-bulb temperature and range have been computed, the establishment of the approach fixes all the operating temperatures of the tower fluids.
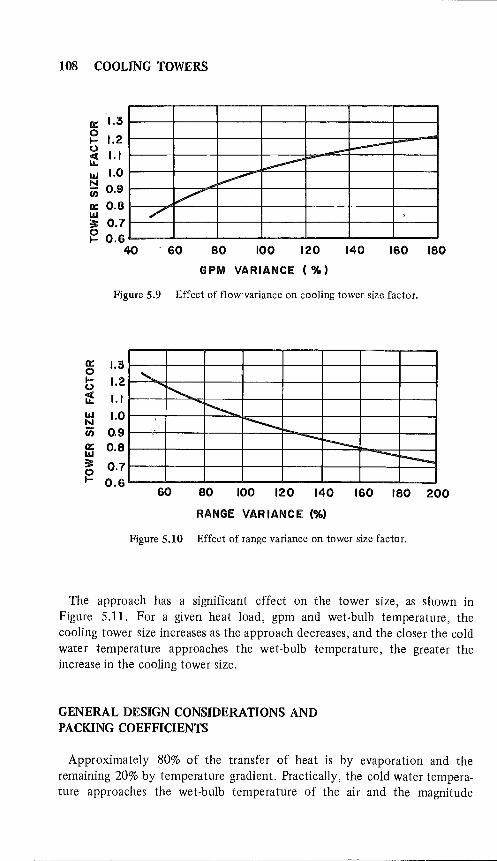
108 COOLING TOWERS
a:: 1.3
~ 1.2 (.)
~ 1.1 1&.1 1.0 !::! til 0.9 a:: O.B 1&.1 3: 0.7 ~ 0.6
40
-L----I-L....--
~ V
.,/
. 60 BO 100 120 140 160 IBO
GPM VARIANCE C %)
Figure 5.9 Effect of flow·variance on cooling tower size factor.
a:: 1.3 0 .... 1.2 (.)
~ 1.1 1&.1 1.0 N iii 0.9 a:: O.B 1&.1 3: 0.7 0 .... 0.6
.......
.,
............. i'-......
r---- -r-- ----60 BO 100 120 140 160 IBO 200
RANGE VARIANCE C%)
Figure 5.10 Effect of range variance on tower size factor.
The approach has a significant effect on the tower size, as shown in Figure 5.11. For a given heat load, gpm and wet-bulb temperature, the cooling tower size increases as the approach decreases, and the closer the cold water temperature approaches the wet-bulb temperature, the greater the increase in the cooling tower size.
GENERAL DESIGN CONSIDERATIONS AND PACKING COEFFICIENTS
Approximately 80% of the transfer of heat is by evaporation and the remaining 20% by temperature gradient. Practically, the cold water temperature approaches the wet-bulb temperature of the air and the magnitude
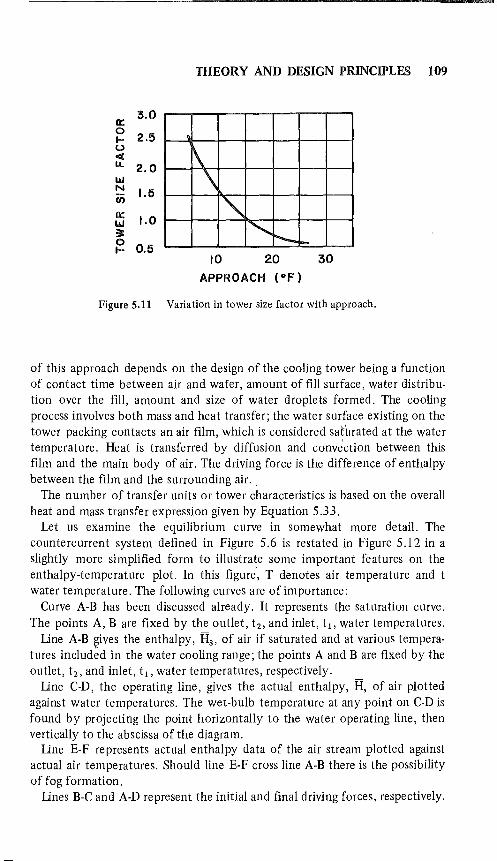
mEORY AND DESIGN PRINCIPLES 109
0::: 3.0
0 2.5 .... u c( I.L 2.0 1&.1 N 1.5 C/)
0::: 1.0 1&.1 3: 0
0.5 I-
~ \
" "-;----I-
10 20 30
APPROACH (OF)
Figure 5.11 Variation in tower size factor with approach.
of this approach depends on the design of the cooling tower being a function of contact time between air and water, amount of fill surface, water distribution over the fill, amount and size of water droplets formed. The cooling process involves both mass and heat transfer; the water surface existing on the tower packing contacts an air film, which is considered safbrated at the water temperature. Heat is transferred by diffusion and conve'ction between this film and the main body of air. The driving force is the difference of enthalpy between the film and the surrounding air. ,
The number of transfer units or tower characteristics is based on the overall heat and mass transfer expression given by Equation 5.33.
Let us examine the equilibrium curve in somewhat more detail. The countercurrent system defined in Figure 5.6 is restated in Figure 5.12 in a slightly more simplified form to illustrate some important features on the enthalpy-temperature plot. In this figure', T denotes air temperature and t water temperature. The following curves are of importance:
Curve A-B has been discussed already. It represents t/le saturation curve. The points A, B are fixed by the outlet, t 2 , and inlet, t l , water temperatures.
Line A-B gives the enthalpy, lIs, of air if saturated and at various temperatures includ~d in the water cooling range; the points A and B are fixed by the outlet, t 2 , and inlet, t l , water temperatures, respectively.
Line C-D, the operating line, gives the actual enthalpy, H, of air plotted against water temperatures. The wet-bulb temperature at any point on C-D is found by projecting the point horizontally to the water operating line, then vertically to the abscissa of the diagram.
Line E-F represents actual enthalpy data of the air stream plotted against actual air temperatures. Should line E-F cross line A-B there is the possibility of fog formation.
Lines B-C and A-D represent the initial and final driving forces, respectively.
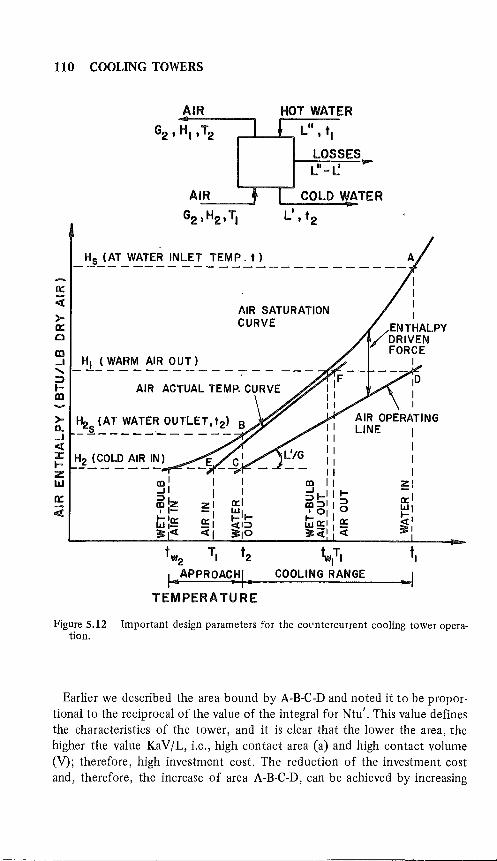
110
It:
«
>a.. ...J «
COOLING TOWERS
AIR
G2 , HI' T2
AIR
G2 ,H2 , TI
~ HjiC~L~ ~~I~) z L&J
It:
«
HOT WATER
I , L" t , I
LOSSES L"-~
--r 1 COLD WATER
L', t2
AIR SATURATION CURVE
II II II II II
CD I I 3 .... 11 .... al::>1 I i5 1°1 ~O:IIQ: 3:CiI I «
ID I I
AIR OPERATING LINE I
1 1 1
~I
0: 1
wI .... , ~I
TEMPERATURE
Figure 5.12 Important design parameters for the COl'ntercurrent cooling tower operation.
Earlier we described the area bound by A-B-C-D and noted it to be proportional to the reciprocal of the value of the integral for Ntu'. This value defines the characteristics of the tower, and it is clear that the lower the area, the higher the value KaV/L, i.e., high contact area (a) and high contact volume (V); therefore, high investment cost. The reduction of the investment cost and, therefore, the increase of area A-B-C-D, can be achieved by increasing

mEORY AND DESIGN PRINCIPLES 111
the approach or reducing the L:G ratio. By reducing the L:G ratio we obtain a high area mass velocity, i.e., large power consumption for the fans.
Approach and cooling range are also indicated in the diagram. Note that the smaller the approach, the smaller the area A-B-C-D and, consequently, the higher the investment cost.
Cooling tower performance is largely affected by internal arrangements. A large amount of information exists in the literature on the performance of different types of packing and fills [5,6]. Modern diffusion calculations find their roots from well-established absorption practices. Consequently, much of the literature data are presented in the form of a plot of KGa versus G, where the gas film is diffusion controlling. Such plots are presented on the basis of pound-moles of water transferred with a driving potential expressed in atmospheres. In humidification problems these units are not very useful. Common practice has been to express pounds of water transferred and driving potential as humidity units. The relation between Htu' and Ka is
Htu' = ~ y. Ka L (5.36)
The relationship between K and KG for absorption theory was given in Chapter 3 as
(5.37)
where the subscript B refers to the air. Htu' or Ka represents the performance characteristics of a given fill or
packing material. Recall that Ntu' represents the degree of effort needed for meeting the process conditions. For packed towers the performance of packings over a wide range of conditions can be expressed by an equation having the following form:
Ka = ¢G'Y (5.38)
Table 5.2 gives some data for Raschig rings and Berl saddles. More data can be found in the literature [7,8].
The Cooling Tower Institute has also recommended the following equation for the performance of commercially used cooling tower packings.
KaV/L = ¢(L/Ga)-O.6 (5.39)
Note that Ga is the air mass-velocity in lb dry air/(hr) and ¢ is a function of the type of packing and number of packing deck levels. This, in turn, fixes
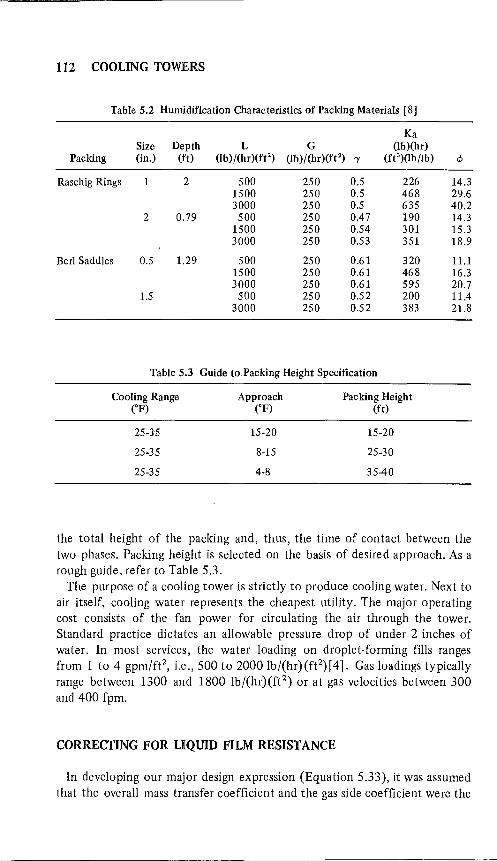
112 COOLING TOWERS
Table 5.2 Humidification Characteristics of Packing Materials [8]
Ka Size Depth L G (Ib)(hr)
Packing (in.) (ft) (Ib)/(hr)(ft') (lb)/(hr)(ft 2) 'Y (ft 3)(lb lib)
Raschig Rings 1 2 500 250 0.5 226 1500 250 0.5 468 3000 250 0.5 635
2 0.79 500 250 0.47 190 1500 250 0.54 301 3000 250 0.53 351
Berl Saddles 0.5 1.29 500 250 0.61 320 1500 250 0.61 468 3000 250 0.61 595
1.5 SOO 250 0.52 200 3000 250 0.52 383
Table 5.3 Guide to,Packing Height Specification
Cooling Range ("F)
25-35
25-35
25-35
Approach ("F)
15-20
8-15
4-8
Packing Height (ft)
15-20
25-30
35-40
¢
14.3 29.6 40.2 14.3 15.3 18.9
11.1 16.3 20.7 11.4 21.8
the total height of the packing and, thus, the time of contact between the two phases. Packing height is selected on the basis of desired approach. As a rough guide, refer to Table 5.3.
The purpose of a cooling tower is strictly to produce cooling water. Next to air itself, cooling water represents the cheapest utility. The major operating cost consists of the fan power for circulating the air through the tower. Standard practice dictates an allowable pressure drop of under 2 inches of water. In most services, the water loading on droplet-forming fills ranges from 1 to 4 gpm/ft2, i.e., 500 to 2000 Ib/(hr)(fe)[4]. Gas loadings typically range between 1300 and 1800 Ib/(hr)(ft2) or at gas velocities between 300 and 400 fpm.
CORRECTING FOR LIQUID FILM RESISTANCE
In developing our major design expression (Equation 5.33), it was assumed that the overall mass transfer coefficient and the gas side coefficient were the
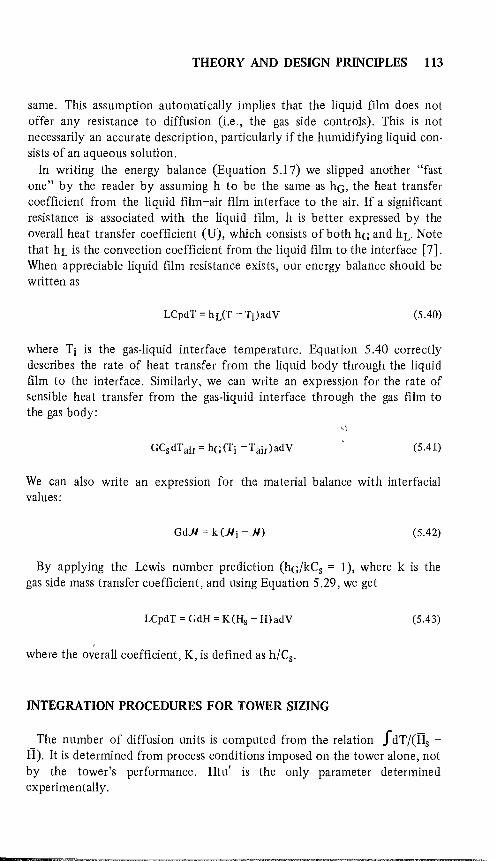
THEORY AND DESIGN PRINCIPLES 113
same. This assumption automatically implies that the liquid film does not offer any resistance to diffusion (i.e., the gas side controls). This is not necessarily an accurate description, particularly if the humidifying liquid consists of an aqueous solution.
In writing the energy balance (Equation 5.17) we slipped another "fast one" by the reader by assuming h to be the same as hG, the heat transfer coefficient from the liquid film-air film interface to the air. If a significant resistance is associated with the liquid film, h is better expressed by the overall heat transfer coefficient (U), which consists of both hG and hL. Note that hL is the convection coefficient from the liqUid film to the interface [7]. When appreciable liquid film resistance exists, our energy balance should be written as
LCpdT = hL(T - TUadV (5.40)
where Ti is the gas-liquid interface temperature. Equation 5.40 correctly describes the rate of heat transfer from the liqUid body through the liquid film to the interface. Similarly, we can write an expression for the rate of sensible heat transfer from the gas-liquid interface through the gas film to the gas body:
(5.41)
We can also write an expression for the material balance with interfacial values:
Gd.H = k (.Hi - .H) (5.42)
By applying the Lewis number prediction (hG/kCs = 1), where k is the gas side mass transfer coefficient, and using Equation 5.29, we get
LCpdT = GdH = K (Hs - H) adV (5.43)
, where the overall coefficient, K, is defined as h/Cs.
INTEGRATION PROCEDURES FOR TOWER SIZING
The number of diffusion units is computed from the relation f dT/(Rs -R). It is determined from process conditions imposed on the tower alone, not by the tower's performance. Htu' is the only parameter determined experimentally.
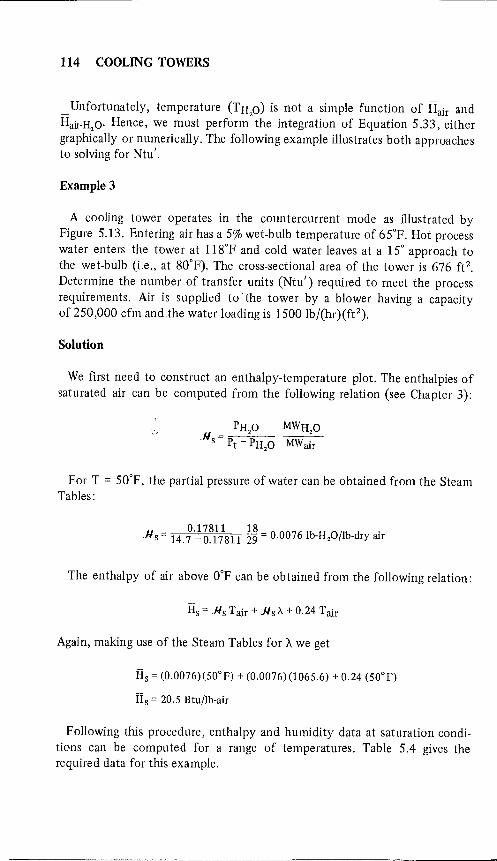
114 COOLING TOWERS
Unfortunately, temperature (TH 0) is not a simple function of Bair and Bair-H.O' Hence, we must perform 2 the integration of Equation 5.33, either graphically or numerically. The following example illustrates both approaches to solving for Ntu'.
Example 3
A cooling tower operates in the countercurrent mode as illustrated by Figure 5.13. Entering air has a 5% wet-bulb temperature of 65°F. Hot process water enters the tower at IISoF and cold water leaves at a 15° approach to the wet-bulb (i.e., at SO°F). The cross-sectional area of the tower is 676 ft2. Determine the number of transfer units (Ntu') required to meet the process requirements. Air is supplied to'the tower by a blower having a capacity of 250,000 cfm and the water loading is 1500 lb/(hr)(ft2).
Solution
We first need to construct an enthalpy-temperature plot. The enthalpies of saturated air can be computed from the following relation (see Chapter 3):
.H = :-P_H--=:2=----0_ MWH20 s Pt - PH20 MW air
For T = 50°F, the partial pressure of water can be obtained from the Steam Tables:
0.17811 18 . .Hs = 14.7 -0.17811 29 = 0.00761b-Hp/lb-dry au
The enthalpy of air above OaF can be obtained from the following relation:
Hs =.Hs Tair +.Hs A. + 0.24 Tair
Again, making use of the Steam Tables for A we get
Hs = (0.0076)(50°F) + (0.0076)(1065.6) + 0.24 (50°F)
Hs = 20.5 Btu/lb-air
Following this procedure, enthalpy and humidity data at saturation conditions can be computed for a range of temperatures. Table 5.4 gives the reqUired data for this example.
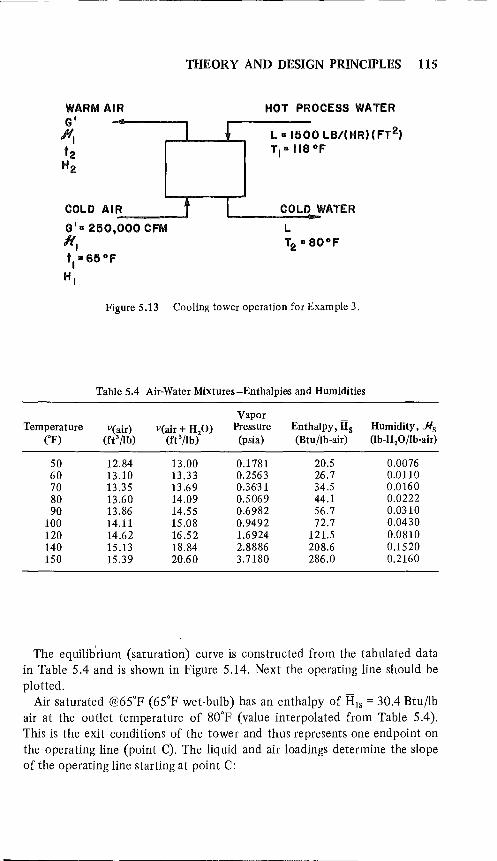
THEORY AND DESIGN PRINCIPLES 115
I HOT PROCESS WATER
LIB 1500 LB/CHR)(FT 2) TIIB liB OF
COLD AIR f ----.... I COLD WATER
GlIB 250,000 CFM L /(1 T2 IB BO°F
t • 65 OF I HI
Figure 5.13 Cooling tower operation for Example 3.
Table 5.4 Air-Water Mixtures-Enthalpies and Humidities
Vapor Temperature V(air) V(air + H.o) Pressure Enthalpy, lis Humidity, Jls
("F) (ft' jIb) (ft"/lb) (psia) (Btu/lb-air) (lb-H,O/lb-air)
50 12.84 13.00 0.1781 20.5 0.0076 60 13.10 13.33 0.2563 26.7 0.0110 70 13.35 13.69 0.36'31 34.5 0.0160 80 13.60 14.09 0.5069 44.1 0.0222 90 13.86 14.55 0.6982 56.7 0.0310
100 14.11 15.08 0.9492 72.7 0.0430 120 14.62 16.52 1.6924 121.5 0.0810 140 15.13 18.84 2.8886 208.6 0.1520 150 15.39 20.60 3.7180 286.0 0.2160
The equilib'rium (saturation) curve is constructed from the tabulated data in Table 5 A and is shown in Figure 5.14. Next the operating line should be plotted.
Air saturated @65°F (65°F wet-bulb) has an enthalpy of Rls = 30A Btuflb air at the outlet temperature of 80°F (value interpolated from Table SA). This is the exit conditions of the tower and thus represents one endpoint on the operating line (point C). The liquid and air loadings determine the slope of the operating line starting at point C:
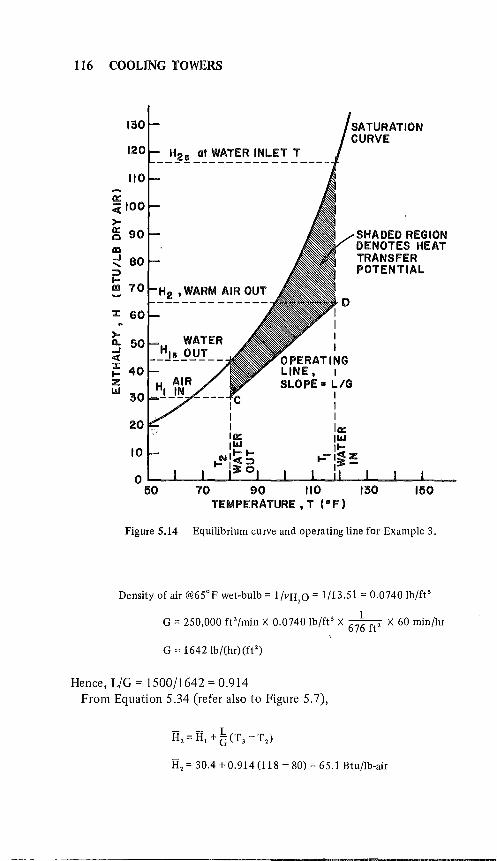
116 COOLING TOWERS
130
120 _!l~!_a~!i~!~,!~~L~!.! ___ _
110
0::: ;;( 100 )0-0::: 90 SHADED REGION 0
ID DENOTES HEAT ..J BO TRANSFER ...... POTENTIAL :;:) .... ID 70 H2 ,WARM AIR OUT
0 :::t: 60 I
I )0- I 0.. I ..J « OPERATING :::t: .... 40 LINE, I z SLOPE· LtG IJJ
30 I I
20 I
10::: IIJJ
10 I .... .... -I~Z
I -
0 50 70 90 110 130 150
TEMPERATURE,T (OF)
Figure 5.14 Equilibrium curve and operating line for Example 3.
Density of air @65°F wet-bulb = l/vH,O = 1/13.51 = 0.0740 lb/ft'
G = 250,000 ft'/min X 0.0740 lb/ft' X 67~ ft' X 60 min/hr
G = 1642 Ib/Chr)(ft2)
Hence, L/G = 1500/1642 = 0.914 From Equation 5.34 (refer also to Figure 5.7),
- - L H, = H, + GCT, -T,)
if, = 30.4 + 0.914 (118 - 80) = 65.1 Btu/lb-air
----~ --- - -----------------------------------

THEORY AND DESIGN PRINCIPLES 117
Hence we can locate the other endpoint of the operating line, point D (ll8°F, 65.1 Btu/lb-air).
The area bound between the saturation line and the operating line is proportional to the potential for heat transfer. We now have two choices on how to obtain the final solution (Ntu'): a graphical or numerical solution. Each is outlined below:
Graphical Solution
Our expression for Ntu' is Equation 5.33 or
Ntu' = J-dT - = Ka V/L. . Hs-H
To evaluate the integral graphically, it is best to replot our data as l/(Rs - R) versus T. Table 5.5 summarizes these data, and Figure 5.15 shows the plot. We can now evaluate the area under the curve between the inlet and exit water temperatures by counting squares in the shaded region. From this the solution is
f T 2 dT Ntu' = =---= = 1. 7
T Hs-H I
Numerical Solution
By numerical integration we can use Simpson's rule to evaluate the data in columns land 5 of Table 5.5.
Table 5.5 Computations for Construction of Figure 5.15
_1_ TeF) lIs II lIs-II (Us - U)
80 44.1 30.4 l3.7 0.073 85 50.0 34.9 15.1 0.066 90 56.7 39.5 17.2 0.058 95 64.2 44.1 20.1 0.050
100 72.7 48.7 24.0 0.042 105 82.5 53.3 29.2 0.034 110 93.8 57.8 36.0 0.028 115 106.7 62.4 44.3 0.023 120 121.5 67.0 54.5 0.018
---------- -- -_._-
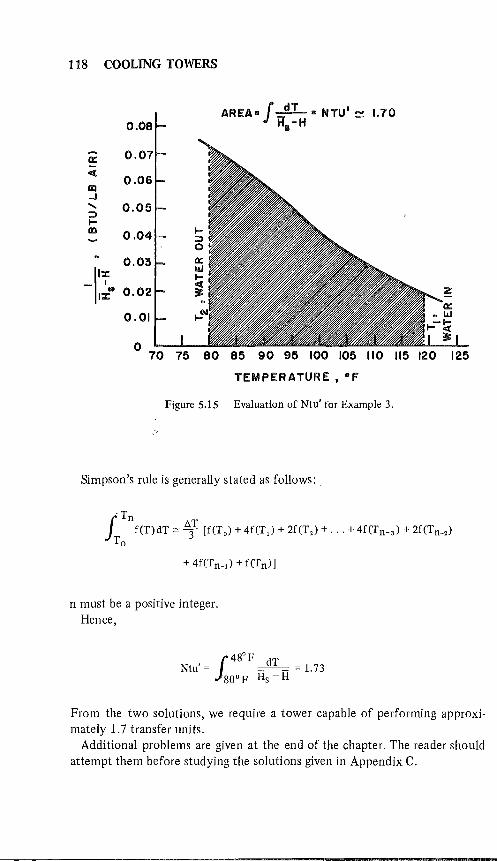
118 COOLING TOWERS
0::: c(
III ..J ...... :;:) .... III
0.05
0.04
0.03
AREA- J _dT .. NTU' ~ 1.70 H.-H
_11'7,. I::t: 0.02
0.01
o 70 75 80 85 90 95 100 105 110 115 120
TEMPERATURE, of
Figure 5.15 Evaluation of Ntu' for Example 3.
125
Simpson's rule is generally stated as follows: .
T r n AT )1 f(T)dT::-: 3"" [f(To) + 4f(T 1 ) + 2f(T,) + ... + 4f(Tn-,) + 2f(Tn_,) To
n must be a positive integer. Hence,
, 1480F dT Ntu = =--= = 1. 73
80 0 F Hs-H
From the two solutions, we require a tower capable of performing approximately 1.7 transfer units.
Additional problems are given at the end of the chapter. The reader should attempt them before studying the solutions given in Appendix C.
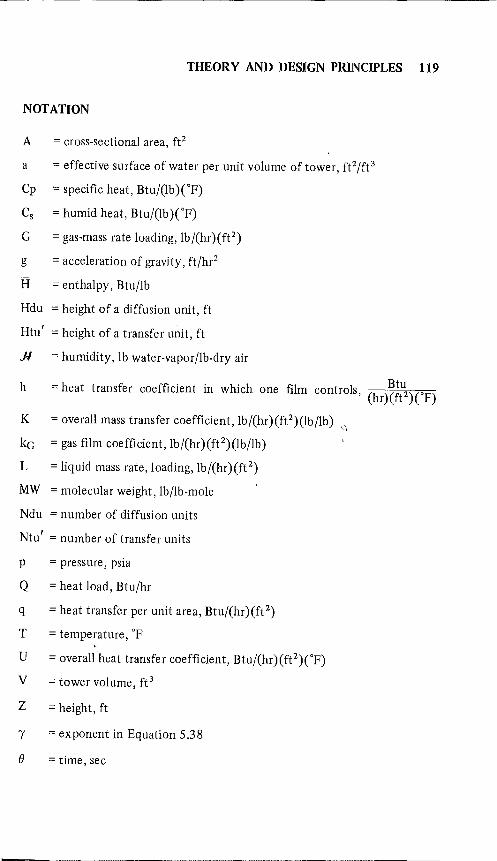
THEORY AND DESIGN PRINCIPLES 119
NOTATION
A = cross-sectional area, fe
a = effective surface of water per unit volume of tower, fe/ft 3
Cp = specific heat, Btu/(lb )CF)
CS = humid heat, Btu/(lb )CF)
G = gas-mass rate loading, lb/(hr)(ft2)
g = acceleration of gravity, ft/hr2
H = enthalpy, Btu/lb
Hdu = height of a diffusion unit, ft
Htu' = height of a transfer unit, ft
.N = humidity, lb water-vapor/lb-dry air
h = heat transfer coefficient in which one film controls, (hr)~g~)CF)
K = overall mass transfer coefficient, lb/(hr)(ftl)(lb/lb)
kG = gas film coefficient, lb/(hr)(ft 2 )(lb/lb)
L = liquid mass rate, loading, lb/(hr)(ft2)
MW = molecular weight, lb/lb-mole
Ndu = number of diffusion units
Ntu' = number of transfer units
p = pressure, psia
Q = heat load, Btu/hr
q = heat transfer per unit area, Btu/(hr)(ft 2)
T = temperature, OF
U = overall heat transfer coefficient, Btu/(hr)(ft2)CF)
V = tower volume, ft3
Z = height, ft
I = exponent in Equation 5.38
e = time, sec
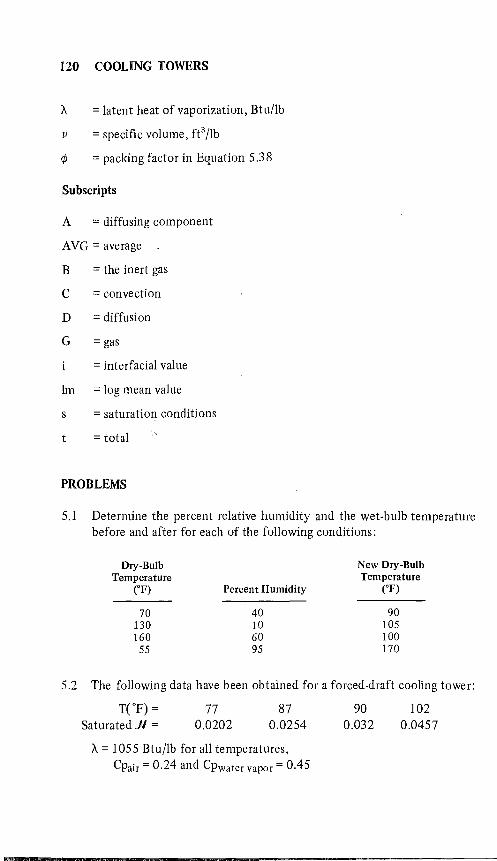
120 COOLING TOWERS
A = latent heat of vaporization, Btu/lb
v = specific volume, fe lIb
¢ = packing factor in Equation 5.38
Subscripts
A = diffusing component
A VG = average
B = the inert gas
C = convection
D = diffusion
G = gas
= interfacial value
1m = log mean value
= saturation conditions
= total
PROBLEMS
5.1 Determine the percent relative humidity and the wet-bulb temperature before and after for each of the following conditions:
Dry-Bulb Temperature
('F)
70 130 160
55
Percent Humidity
40 10 60 95
New Dry-Bulb Temperature
("F)
90 105 100 170
5.2 The following data have been obtained for a forced-draft cooling tower:
TCF) =
Saturated jJ = 77
0.0202 87
0.0254
A = 1055 Btu/lb for all temperatures,
CPair = 0.24 and CPwater vapor = 0.45
90 0.032
102 0.0457
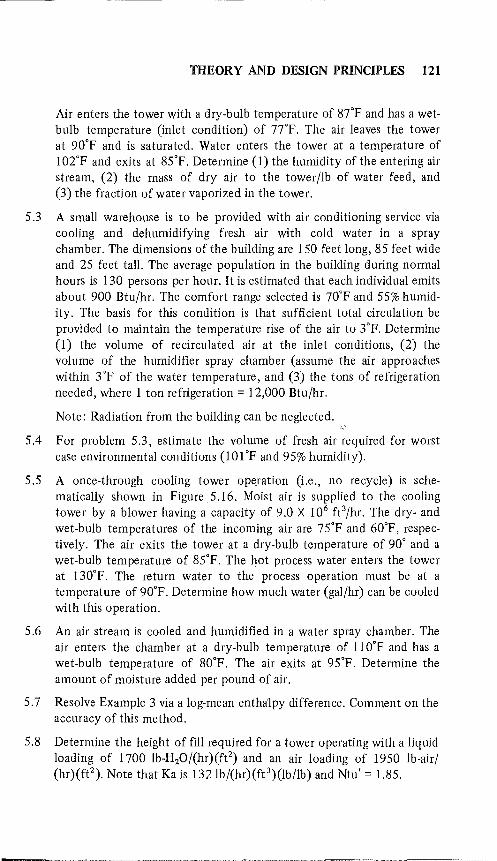
THEORY AND DESIGN PRINCIPLES 121
Air enters the tower with a dry-bulb temperature of 87°F and has a wetbulb temperature (inlet condition) of nOF. The air leaves the tower at 90°F and is saturated. Water enters the tower at a temperature of 102°F and exits at 85°F. Determine (1) the humidity of the entering air stream, (2) the mass of dry air to the tower lib of water feed, and (3) the fraction of water vaporized in the tower.
5.3 A small warehouse is to be provided with air conditioning service via cooling and dehumidifying fresh air with cold water in a spray chamber. The dimensions of the building are 150 feet long, 85 feet wide and 25 feet tall. The average population in the building during normal hours is 130 persons per hour. It is estimated that each individual emits about 900 Btu/hr. The comfort range selected is 70°F and 55% humidity. The basis for this condition is that sufficient total circulation be provided to maintain the temperature rise of the air to 3°F. Determine (1) the volume of recirculated air at the inlet conditions, (2) the volume of the humidifier spray chamber (assume the air approaches within 3°F of the water temperature, and (3) the tons of refrigeration needed, where 1 ton refrigeration = 12,000 Btu/hr.
Note: Radiation from the building can be neglected.
5.4 For problem 5.3, estimate the volume of fresh air required for worst case environmental conditions (lOI°F and 95% humidity).
5.5 A once-through cooling tower ope.ration (i.e., no recycle) is schematically shown in Figure 5.16. Moist air is supplied to the cooling tower by a blower having a capacity of 9.0 X 106 ft 3/hr. The dry- and wet-bulb temperatures of the incoming air are 75°F and 60°F, respectively. The air exits the tower at a dry-bulb temperature of 90° and a wet-bulb temperature of 85°F. The hot process water enters the tower at 130°F. The return water to the process operation must be at a temperature of 90°F. Determine how much water (gal/hr) can be cooled with this operation.
5.6 An air stream is cooled and humidified in a water spray chamber. The air enters the chamber at a dry-bulb temperature of 110°F and has a wet-bulb temperature of 80°F. The air exits at 95°F. Determine the amount of moisture added per pound of air.
5.7 Resolve Example 3 via a log-mean enthalpy difference. Comment on the accuracy of this method.
5.8 Determine the height of fill required for a tower operating with a liquid loading of 1700 lb-HzO/(hr)(ftz) and an air loading of 1950 lb-airl (hr)(ftz). Note that Ka is 132Ib/(hr)(ft3)(lb/lb) and Ntu' = 1.85.
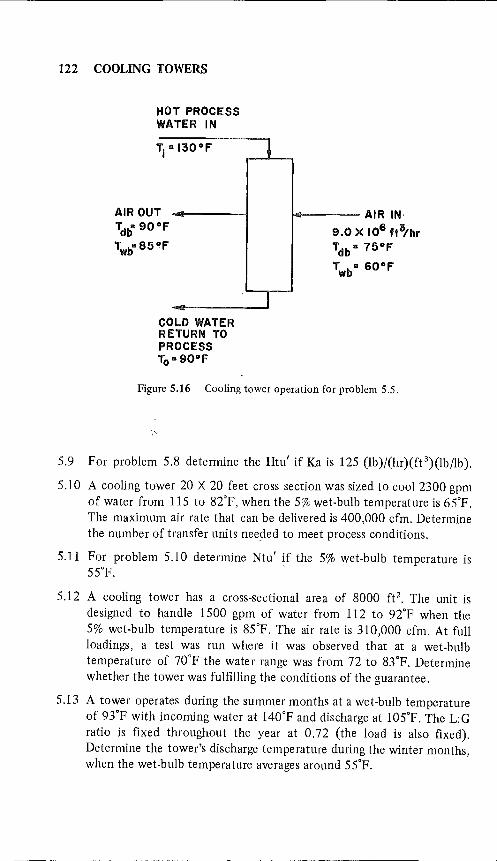
122 COOLING TOWERS
HOT PROCESS WATER IN
AIR OUT
Tdb'" 90°F
Twb'"S5'!F
COLD WATER RETURN TO PROCESS To'" 90°F
I
1+---- AIR IN,
9.0 X 106 ft'hr Tdb'" 75°F
TWb'" GO°F
Figure 5.16 Cooling tower operation for problem 5.5.
S.9 For problem S.8 determine the Htu' if Ka is 12S (lb)/(hr)(ft 3)(lb/lb).
S.lO A cooling tower 20 X 20 feet cross section was sized to cool 2300 gpm of water from lIS to 82°F, when the S% wet-bulb temperature is 6SoF. The maximum air rate that can be delivered is 400,000 cfm. Determine the number of transfer units needed to meet process conditions.
S.ll For problem S.lO determine Ntu' if the S% wet-bulb temperature is SSoF.
S.12 A cooling tower has a cross-sectional area of 8000 ft2. The unit is designed to handle lS00 gpm of water from 112 to 92°F when the S% wet-bulb temperature is 8SoF. The air rate is 310,000 cfm. At full loadings, a test was run where it was observed that at a wet-bulb temperature of 70°F the water range was from 72 to 83°F. Determine whether the tower was fulfilling the conditions of the guarantee.
S.13 A tower operates during the summer months at a wet-bulb temperature of 93°F with incoming water at 140°F and discharge at lOSoF. The L:G ratio is fixed throughout the year at 0.72 (the load is also fixed). Determine the tower's discharge temperature during the winter months, when the wet-bulb temperature averages around S SOF.
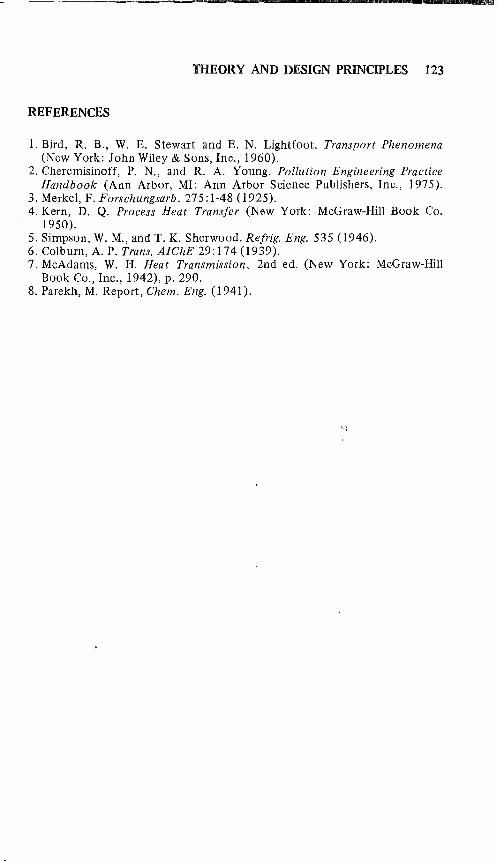
THEORY AND DESIGN PRINCIPLES 123
REFERENCES
1. Bird, R. B., W. E. Stewart and E. N. Lightfoot. Transport Phenomena (New York: John Wiley & Sons, Inc., 1960).
2. Cheremisinoff, P. N., and R. A. Young. Pollution Engineering Practice Handbook (Ann Arbor, MI: Ann Arbor Science Publishers, Inc., 1975).
3. Merkel, F. Forschungsarb. 275: 1-48 (1925). 4. Kern, D. Q. Process Heat Transfer (New York: McGraw-Hill Book Co.
1950). 5. Simpson, W. M., and T. K. Sherwood. Refrig. Eng. 535 (1946). 6. Colburn, A. P. Trans. AIChE 29: 174 (1939). 7. McAdams, W. H. Heat Transmission, 2nd ed. (New York: McGraw-Hill
Book Co., Inc., 1942), p. 290. 8. Parekh, M. Report, Chern. Eng. (1941).

This page intentionally left blank

CHAPTER 6
OPERATION AND DESIGN PRACTICES
INTRODUCTION
Plant operations personnel generally purchase cooling towers rather than construct them themselves. The philosophy behind this policy is that it makes available to operators a wealth of practical knowledge directly applicable in the field. The operator must specify the amount of water and the tempera· ture range required to handle a specific set of process conditions. It is the fabricator's responsibility to propose a system that will meet the operatorfurnished conditions for the 5% wet-bulb in the plant locality. This also means that the fan power with which the operation will be accomplished will be guaranteed. .
Although the operator does not construct the actual tower or even prepare the details of the final tower design, his role in the designing stage is not passive. A thorough understanding of process system requirements and the purpose for certain design details are essential on the part of the operator. This defines the operational limitations of a particular cooling tower design and provides better insight into field operations. In this chapter we will apply the design principles of Chapter 5 in outlining specific criteria for process conditions selection and identify problems in cooling tower operations.
TOWER COEFFICIENTS
The Ntu' corresponding to a set of hypothetical conditions is called the required coefficient. When operational tests have been performed, the Ntu' represents the available coefficient and is an evaluation of the equipment involved.
The minimum required coefficient for a given temperature occurs at an L:G ratio of zero. This situation corresponds to an infinite air rate. There is
125
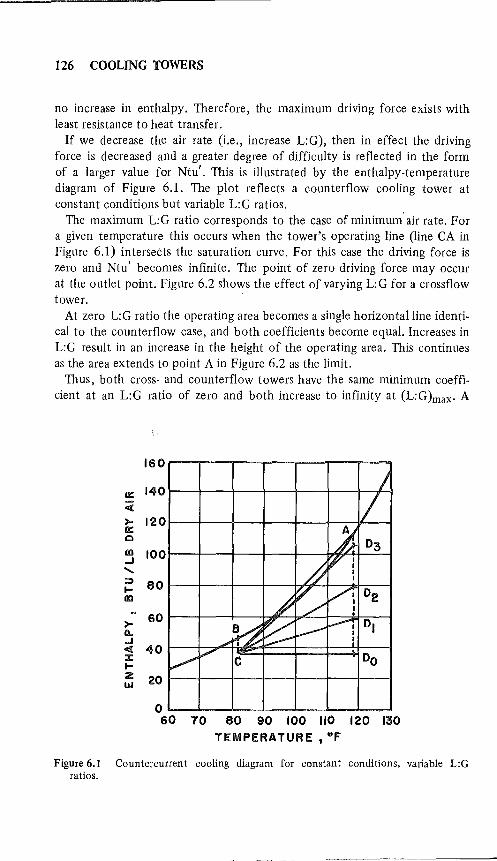
126 COOLING TOWERS
no increase in enthalpy. Therefore, the maximum driving force exists with least resistance to heat transfer.
If we decrease the air rate (i.e., increase L:G), then in effect the driving force is decreased and a greater degree of difficulty is reflected in the form of a larger value for Ntu'. This is illustrated by the enthalpy-temperature diagram of Figure 6.1. The plot reflects a counterflow cooling tower at constant conditions but variable L:G ratios.
The maximum L:G ratio corresponds to the case of minimum' air rate. For a given temperature this occurs when the tower's operating line (line CA in Figure 6.1) intersects the saturation curve. For this case the driving force is zero and Ntu' becomes infinite. The point of zero driving force may occur at the outlet point. Figure 6.2 shows the effect of varying L: G for a cross flow tower.
At zero L:G ratio the operating area becomes a single horizontal line identical to the counterflow case, and both coefficients become equal. Increases in L:G result in an increase in the height of the operating area. This continues as the area extends to point A in Figure 6.2 as the limit.
Thus, both cross- and counterflow towers have the same minimum coefficient at an L:G ratio of zero and both increase to infinity at (L:G)max. A
0::: c(
>-0::: 0
III .J ..... :;:) 80 I-m
>- 60 0.. ..J c( 40 ::t: I-Z 20 1&.1
O~~--~--~--~------~--~ 60 10 80 90 100 110 120 I!O
TEMPERATURE, OF
Figure 6.1 Countercurrent cooling diagram for constant conditions, variable L:G ratios.

OPERATION AND DESIGN PRACTICE 127
130
A 0::: -110 c(
>-0::: 0
90 III ...J ..... :;:)
I-
10 III
>-0..
50 ..J c(
B ::t:
40 I-Z 1&.1
30 10 80 90 100 110 120
TEMPERATURE t of
Figure 6.2 Crossflow tower cooling diagram.
cooling tower can be designed to operate at any point within the two limits; however, practical considerations limit the design to much narrower limits, which are determined by the air velocity.
A low air rate requires a large tower, while a high air rate in a smaller tower requires greater fan power. Limitations in air velocities are typically 300-500 fpm in counterflow towers, and 350--{)50 fpm in crossflow towers.
Higher velocities are obtainable in crossflow towers because of larger air inlet and greater eliminator area. Also, the discharging air does not pass through the water distribution system.
Cooling towers are capable of operating over a wide range of water rates, air rates and heat loads. Variations are reflected in the approach of the cold water to the' wet-bulb temperature. The available tower coefficient is not a constant but varies with operating conditions.
TOWER CHARACTERISTICS AND PERFORMANCE
Cooling tower characteristics can only be deduced from actual field tests. Tower characteristics are generally presented in the form of an empirical correlation. This correlation defines the relationship between the available

128 COOLING TOWERS
coefficient and the operating conditions. Variations in the available coefficient occur because the calculations consider temperature change per unit driving force without regard to tower height or water rate. Since the coefficients of mass and energy transfer increase with air velocity, this is reflected in the available coefficient.
Cooling tower data are most often plotted in the form of KaV: L versus L:G for various air wet-bulb temperatures and cooling ranges. This approach allows us to avoid solving the Ntu' integral (Equation 5.33). These graphs have been published by the Cooling Tower Institute (CTI) and are similar to the one shown in Figure 6.3. Note that the validity of these graphs is good up to 300 foot elevation above sea level.
Common practice is to neglect the effect of air velocity and develop the tower correlation in the form of a power law relation:
(6,1)
where the exponent n can vary between -0.35 and -l.1. Average values of n are between -0.55 and -0.65. A family of curves can also be generated with the following formula format:
(6,2)
where m typically varies between 0.6 and 1.1. Tower performance is specified in terms of the cooling tower's range,
approach, wet-bulb temperature and water rate. The rating of a tower is established by developing a series of charts that relates these variables.
Rating factors correspond to tower units per gpm, which represents some functions of tower area in ftljgpm. Hence,
Rating factor (RF) X gpm = tower units/area (6,3)
Rating charts are reported by McDowell [1] for different temperature ranges. Figure 6.4 gives an example of a rating chart for one temperature range. The use of this chart is illustrated in the following example.
Example 1
A cooling tower has been designed to handle 7650 gpm of hot water at a 15°F range and a lOoF approach to 70°F wet-bulb temperature. Determine the tower units of rated area.

4
o t; 3
0::: 1&.1 .... o c( 0::: c( :::t: o 0::: 2 1&.1 3: o .... ..J ...... > a ~
Solution
o
I 1/3
j /
I II ) J
V V / 1/ /
V V / V ./ V
....".
i--' / .-
t::: ;::::::. ~ ~
~
I I II II J
/ / ~ V5 { I
V\ II
OPERATION AND DESIGN PRACTICE 129
II I
/ 1/5
J I
II
12°WET BULB 50 0 RANGE
II II I / II I
/ / J J
I J 1/
II / / II 1,7
VB liIo 1r2 /r4/JS/rB 120, J V 1/ V V I/APPRn~HEs
II / J / / j
) J ) V I V II V V 1)( II / 1// / J
J ) V I V V V / / / )< ~ '/ J / / 7; ,c-r:t ./
V 25-/ I PLOT OF
// / / // V EQN. (5.1) /'
/'
/ / '/ ~ / V ./ V ~ / V .....
./ V ~ /' ,/ i"'"
--,;:; "..,.. ~O ./ .......
V V V ~ ~ -- -~ ~ --I--
2
LtG. WATER TO AIR RATIO
Figure 6.3 Generalized tower characteristic curves.
From the chart (Figure 6.4), the rating factor (RF) = 1.42. Hence,
RF X gpm = 1.42 X 7650 = 10,900 tower units of rated area
Performance curves are based on a constant air rate. The following equation can be applied to such performance curves as the one given in Figure 6.4 by
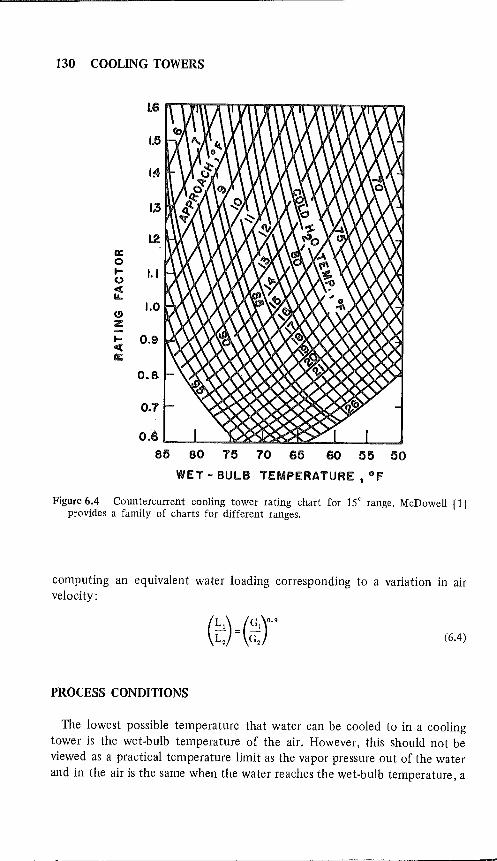
130 COOLING TOWERS
1.5
1!4
1.2 0::: 0 I- 1.1 0 c( IL.
(!> 1.0
Z
I- 0.9 c( 0:::
O.B
60 55 50
WET - BULB TEMPERATURE, of
Figure 6.4 Countercurrent cooling tower rating chart for 15° range. McDowell [1] provides a family of charts for different ranges.
computing an equivalent water loading corresponding to a variation in air velocity:
(6.4 )
PROCESS CONDITIONS
The lowest possible temperature that water can be cooled to in a cooling tower is the wet-bulb temperature of the air. However, this should not be viewed as a practical temperature limit as the vapor pressure out of the water and in the air is the same when the water reaches the wet-bulb temperature, a
.. ---.~-------------------------------------------------

OPERATION AND DESIGN PRACTICE 131
condition that results in a zero diffusion potential for which an infinitely tall tower would be needed. The approach in a cooling tower is the difference between the water-exit temperature and the wet-bulb temperature. We can think of the approach as an index or gauge of how difficult it will be to perform a cooling operation.
Table 6.1 gives some climatological data for different parts of the country in terms of maximum temperatures and wind velocities. In the northeastern region of the U.S., the 5% wet-bulb temperature averages about 75°F. It is common practice in this region to cool the water in a cooling tower to a 10° approach, i.e., 85°F. The 5% wet-bulb temperature is about 80°F on the Gulf Coast, where typically a 5° approach is used (but again to 85°F). Note that when a cooling tower is designed for a definite approach to the 5% wet-bulb, there will be some time periods where the water discharged from the cooling
Table 6.1 Maximum Temperatures and Maximum Wind Velocities for Different Cities in the United States
Max. Temperature CF) Max. Wind
De\~Point Velocity
State City Dry Bulb Wet Bulb (mph) ,
Alabama Mobile 95 82 80 87 Arizona Phoenix 113 78 74 40 California Fresno 110 75 66 41
San Diego 88 74 72 43 Colorado Denver 99 68 64 53
Connecticut Hartford 82 58 Florida Miami 92 81 79 87 Georgia Atlanta 101 82 79 51 Illinois Chicago 104 80 77 65 Indiana Evansville 102 82 79 60
Massachusetts Boston 90 78 76 60 Minnesota St. Paul 103 79 75 78 Montana Helena 97 70 60 54 Nevada Reno 102 66 56 46 New Jersey Newark 99 81 77
New Mexico Albuquerque 98 68 66 63 New York Albany 97 78 75 59
New York 100 81 78 73 Ohio Cincinnati 106 81 78 54 Oregon Portland 99 70 68 43
Pennsylvania Pittsburgh 98 79 74 56 Tennessee Memphis 103 83 80 58 Texas Houston 100 81 79 63
San Antonio 102 83 82 56 Washington Spokane 106 68 58 41

132 COOLING TOWERS
tower will be warmer than originally specified in the process conditions. Cooling towers are normally designed to withstand wind speed of up to 100 mph (or about 30 lbrlftz).
A common fallacy arises that cooling towers cannot function when the inlet air is at its wet-bulb temperature. To the contrary, when air at the wet-bulb temperature enters the tower it acquires sensible heat from the hot water, thereby raising its temperature so that it is no longer saturated. Consequently, water evaporates continuously into the air phase as it ascends through the tower and cooling takes place.
There are various process changes that can have a dramatic effect on the height, cross section of the tower and/or the cost of its operation. Some of these we have already discussed (the L:G ratio, for one); however, their effects are best illustrated by studying how the enthalpy-temperature plot is affected (specifically how the area between the saturation and operating lines changes as this is a measure of the total potential). Recall that the smaller this bound area the taller the tower needed to meet process conditions. Chief process changes affecting designs are the L:G ratio, the degree of unsaturation of the inlet air, close approach, staging and elevation.
There are many situations in which the tower's ground area may be too limited, an example being when a cooling tower is erected atop a building. In such a case, it ~,ay be necessary to utilize a high liquid loading without increasing the air rate. The maximum economical air velocity is roughly about 400 fpm. Looking back at Figure 6.1, we see that this will decrease the tower cross section but increase the slope of the operating line. The net result is a decreased potential and a taller tower. This is the simplest observation made by an operator that the smaller the amount of air sent to the tower per pound of water, the smaller the extent of cooling.
In most of the situations described thus far it has been assumed that the incoming air is adiabatically saturated. This causes the operating line to drop from H.-H2 to H~-H~ in Figure 6.S(A). The shaded region on this plot represents the increase in potential. By not correcting for the enthalpy of the dry-bulb, we achieve results that are slightly conservative. For this reason it is common practice to specify only the wet-bulb in preparing designs.
By using a close approach, we arrive at the situation shown in Figure 6.S(B). Both operating lines have the same L:G ratios (i.e., the same slopes and the same ranges for the removal of the same process load). The operating line H'.-H~ attempts to perform the same cooling as HI -H2 and with the same inlet air but between two different temperatures (T;, T~). The area between the saturation curve and the operating line is greatly reduced by H'I-H~; hence, we obtain a lower potential.
Staging is a technique used for overcoming small L:G ratios. Staging in effect involves the use of two or more towers in series. Water introduced to the top of the first tower is hot and first contacts air of enthalpy, H2, along
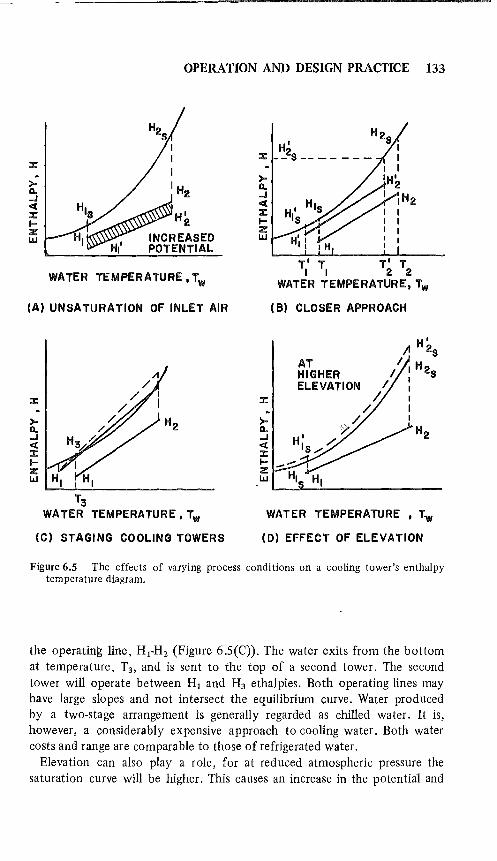
OPERATION AND DESIGN PRACTICE 133
~
>-0.. ..J c( :t: .... Z W
WATER TEMPERATURE,Tw
(A) UNSATURATION OF INLET AIR
/1 /
:t: /
~ rP// H2 ;t H3~/. ::t:
5 H, : H,
T3 WATER TEMPERATURE,Tw
(C) STAGING COOLING TOWERS
H2 H2 8 I
:t: _ - 8 -- - - - - - I
>-0.. ..J c( ::t: .... Z W
I I
~IH2
H I IH2 H"8~1 '8 I I , I I
H'I ' I 'I I H I
T' T T' T " 2 2
WATER TEMPERATURE, Tw
(B) CLOSER APPROACH
AT HIGHER ELEVATION
WATER TEMPERATURE , Tw
(D) EFFECT OF ELEVATION
Figure 6.5 The effects of varying process conditions on a cooling tower's enthalpy temperature diagram.
the operating line, HrHz (Figure 6.S(C)). The water exits from the bottom at temperature, T3, and is sent to the top of a second tower. The second tower will operate between HI and H3 ethalpies. Both operating lines may have large slopes and not intersect the equilibrium curve. Water produced by a two-stage arrangement is generally regarded as chilled water. It is, however, a considerably expensive approach to cooling water. Both water costs and range are comparable to those of refrigerated water.
Elevation can also play a role, for at reduced atmospheric pressure the saturation curve will be higher. This causes an increase in the potential and
134 COOLING TOWERS
reduces the required size of a tower if operating conditions are kept constant. The reasons for this are that {he humidity of saturated air at higher elevations is greater and although the partial pressure of the water is fixed, by going to higher elevations the total pressure is reduced.
Since the atmosphere serves as the tower's cooling medium, operating performance is also affected by variations in atmospheric conditions. When we operate the tower at the design wet-bulb, water should be produced at the range and temperature specified in the guarantee. If, however, the wetbulb temperature drops, in effect the potential in the tower increases. If L, G and the heat load do not change, the water will still undergo the same number of degrees of cooling in; however, the inlet and outlet temperatures will be lower than guaranteed. A tower can only continue removing the same heat load by automatically reducing the potential difference (Le., the water temperatures reduce accordingly with the wet-bulb).
If either the water or air loadings to a specific tower are changed, then the number of diffusion units the system is capable of providing also changes. In general, the loadings on a single unit do not change significantly. It is not uncommon for designs to anticipate a 25% deviation from the mean of the design water loading (this is about the maximum variation that can be handled). The ma~imum discharge capacity will be roughly 120-125% of the design. When lesst.han 80% of the design water rate is used, the dispersion of droplets is reduced along with the total quantity of water. Cooling tower fabricators can specify the temperature range assumed by the cooling water at 80% and 120% of its design loading when the operating wet-bulb is below the design wet-bulb. Under this condition, it is desirable to use the increased potential to generate more cooling water at the original design temperature range. Problem 6.1 at the end of this chapter illustrates how much cold water can be produced for a particular design by varying loading conditions.
CONSIDERATIONS IN COOLING TOWER SELECTION
The size of a cooling tower is primarily established by the water loading, L. The air loading must be chosen on the basis of other considerations and before the tower size is fixed. There are two extreme design cases. First, a tower can be selected for a close approach to the wet-bulb temperature and with a large range. The other extreme is a tower selected for a large approach and small range.
In the first design, a small L:G ratio must be used. Since G cannot be increased beyond certain limitations (because of economics), L should be small. Experiments on cooling towers have indicated that their characteristics break sharply when L approaches a critical point varying with design. The
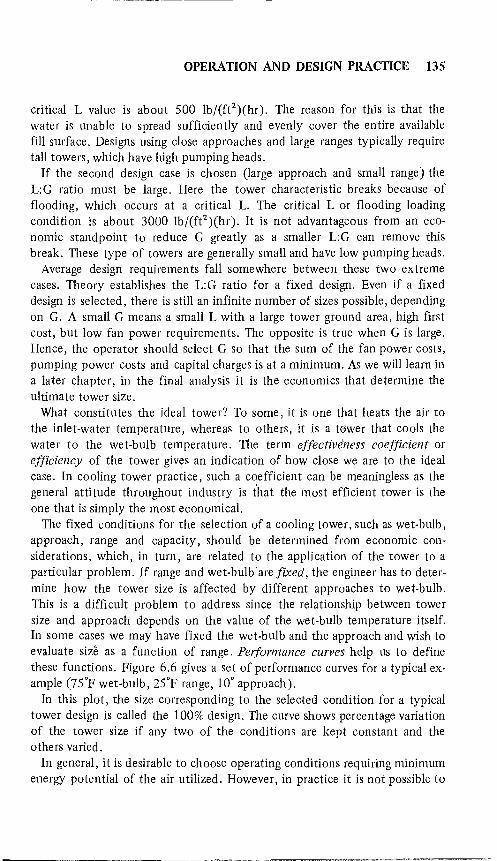
OPERATION AND DESIGN PRACTICE 135
critical L value is about 500 Ib/(ft2)(hr). The reason for this is that the water is unable to spread sufficiently and evenly cover the entire available fill surface. Designs using close approaches and large ranges typically require tall towers, which have high pumping heads.
If the second design case is chosen (large approach and small range) the L:G ratio must be large. Here the tower characteristic breaks because of flooding, which occurs at a critical L. The critical L or flooding loading condition is about 3000 Ib/(ft2)(hr). It is not advantageous from an economic standpoint to reduce G greatly as a smaller L:G can remove this break. These type of towers are generally small and have low pumping heads.
Average design requirements fall somewhere between these two extreme cases. Theory establishes the L:G ratio for a fixed design. Even if a fixed design is selected, there is still an infinite number of sizes possible, depending on G. A small G means a small L with a large tower ground area, high first cost, but low fan power requirements. The opposite is true when G is large. Hence, the operator should select G so that the sum of the fan power costs, pumping power costs and capital charges is at a minimum. As we will learn in a later chapter, in the final analysis it is the economics that determine the ultimate tower size.
What constitutes the ideal tower? To some, it is one that heats the air to the inlet-water temperature, whereas to others, it is a Wwer that cools the water to the wet-bulb temperature. The term effective'ness coefficient or efficiency of the tower gives an indication of how close we are to the ideal case. In cooling tower practice, such a coefficient can be meaningless as the general attitude throughout industry is t'hat the most efficient tower is the one that is simply the most economical.
The fixed conditions for the selection of a cooling tower, such as wet-bulb, approach, range and capacity, should be determined from economic considerations, which, in turn, are related to the application of the tower to a particular problem. If range and wet-bulb are fixed, the engineer has to determine how the tower size is affected by different approaches to wet-bulb. This is a difficult problem to address since the relationship between tower size and approach depends on the value of the wet-bulb temperature itself. In some cases we may have fixed the wet-bulb and the approach and wish to evaluate size as a function of range. Performance curves help us to define these functions. Figure 6.6 gives a set of performance curves for a typical example (75°F wet-bulb, 25°F range, 10° approach).
In this plot, the size corresponding to the selected condition for a typical tower design is called the 100% design. The curve shows percentage variation of the tower size if any two of the conditions are kept constant and the others varied.
In general, it is desirable to choose operating conditions requiring minimum energy potential of the air utilized. However, in practice it is not possible to
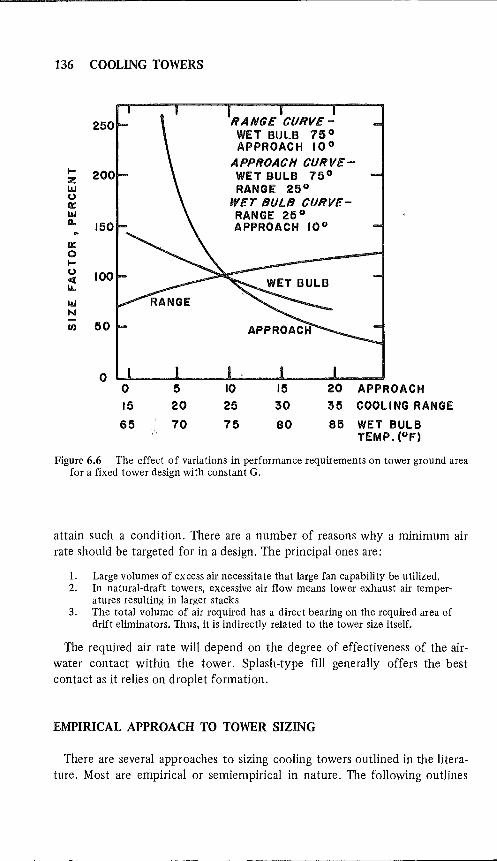
136 COOLING TOWERS
.... z w (.)
0:: w 0..
0:: 0 .... (.) c( IL.
W N
til
200
50
o 15
65
5 20
70
RANGE CURVE-WET BULB ?f,o APPROAC H 10°
APPROACH CURVE-WET BULB 75° RANGE 25°
WET BULB CURVE-RANGE 25° APPROACH 10°
10 25
75
15 30
80
20 APPROACH
35 COOLING RANGE
85 WET BULB TEMP. (OF)
Figure 6.6 The effect of variations in performance requirements on tower ground area for a fixed tower design with constant G.
attain such a condition. There are a number of reasons why a minimum air rate should be targeted for in a design. The principal ones are:
1. Large volumes of excess air necessitate that large fan capability be utilized. 2. In natural-draft towers, excessive air flow means lower exhaust air temper
atures resulting in larger stacks 3. The total volume of air required has a direct bearing on the required area of
drift eliminators. Thus, it is indirectly related to the tower size itself-
The required air rate will depend on the degree of effectiveness of the airwater contact within the tower. Splash-type fill generally offers the best contact as it relies on droplet formation.
EMPIRICAL APPROACH TO TOWER SIZING
There are several approaches to sizing cooling towers outlined in the literature. Most are empirical or semiempirical in nature. The following outlines
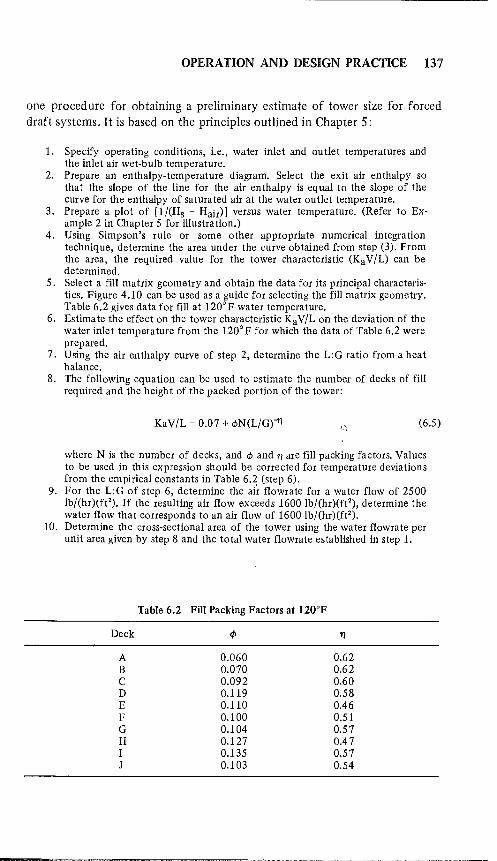
OPERATION AND DESIGN PRACTICE 137
one procedure for obtaining a preliminary estimate of tower size for forced draft systems. It is based on the principles outlined in Chapter 5:
1. Specify operating conditions, i.e., water inlet and outlet temperatures and the inlet air wet-bulb temperature.
2. Prepare an enthalpy-temperature diagram. Select the exit air enthalpy so that the slope of the line for the air enthalpy is equal to the slope of the curve for the enthalpy of saturated air at the water outlet temperature.
3. Prepare a plot of [1/(Hs - Hair)] versus water temperature. (Refer to Example 2 in Chapter 5 for illustration.)
4. Using Simpson's rule or some other appropriate numerical integration technique, determine the area under the curve obtained from step (3). From the area, the required value for the tower characteristic (Ka V/L) can be determined.
5. Select a fill matrix geometry and obtain the data for its principal characteristics. Figure 4.10 can be used as a guide for selecting the fill matrix geometry. Table 6.2 gives data for fill at 120°F water temperature.
6. Estimate the effect on the tower characteristic KaV/L on the deviation of the water inlet temperature from the 120° F for which the data of Table 6.2 were prepared.
7. Using the air enthalpy curve of step 2, determine the L:G ratio from a heat balance.
8. The following equation can be used to estimate the number of decks of fill required and the height of the packed portion of the tower:
KaV/L = 0.07 + ¢N(L/G)-11 (6.5)
where N is the number of decks, and ¢ and 1) are fill packing factors. Values to be used in this expression should be corrected for temperature deviations from the empirical constants in Table 6.2 (step 6).
9. For the L:G of step 6, determine the ai~ flowrate for a water flow of 2500 Ib/(hr)(ft2). If the resulting air flow exceeds 1600 Ib/(hr)(ft2), determine the water flow that corresponds to an air flow of 1600 Ib/(hr)(ft2).
10. Determine the cross-sectional area of the tower using the water flowrate per unit area given by step 8 and the total water flowrate established in step 1.
Table 6.2 Fill Packing Factors at 120°F
Deck cP 1)
A 0.060 0.62 B 0.070 0.62 C 0.092 0.60 D 0.119 0.58 E 0.110 0.46 F 0.100 0.51 G 0.104 0.57 H 0.127 0.4 7 I 0.135 0.57 J 0.103 0.54

138 COOLING TOWERS
11. Select the horizontal dimensions of the tower to give the area defined by step 9, keeping the dimension in the direction of the prevailing wind to no less than the packed height and no more than 40 feet, The overall height should be packed height plus about one and one-half times the depth in the direction of the prevailing wind.
PROBLEMS RELATED TO OUTSIDE INSTALLATION
With the exception of very small units, cooling towers are located outdoors, and their placemenf has a significant bearing on the overall cost of the initial installation and the effectiveness of the operation.
The location of the tower can create problems if it is not situated properly. Its orientation must be considered with respect to the prevailing wind direction and to the plot plan of the plant. Although cooling towers usually are installed with air inlets facing the direction of the prevailing wind, this may be a disadvantage in sandy, high wind areas. Sand can enter into the circuit creating problems connected with the suspension of solids in the water. Sand and other materials (for example leaves) can also be a problem if open water distribution basins are provided on top of the towers. Attention must be given to the proximity of the unit to any heat source that could decrease the tower's efficiency" Drift and fogging may be objectionable if the tower is located too close to parking lots or streets.
Locating the tower away from possible noise complainants can often result in a satisfactory installation that otherwise would have been a problem. Towers should not be located upwind of any electrical equipment, and easy access for working space should be provided on all sides around the tower to perform maintenance operations (Figure 6.7). In chemical plants where acid vapors occur, corrosion can be expected if these acid vapors contact the humid air discharging from the cooling tower stack. Corrosive vapors also may enter into solution in the circulating water, causing corrosion throughout the entire system.
Interference is defined as an adulteration of the atmosphere entering the tower by a portion of the atmosphere leaving another nearby cooling tower. Recirculation is an adulteration of the atmosphere entering the tower by a portion of the atmosphere leaving the tower. Both are illustrated in Figure 6.8.
This adulteration by the exhaust air raises the wet-bulb temperature of the entering air above that of the ambient air, reducing the tower's overall performance.
These problems are typical in mechanical-draft cooling towers and virtually nonexistent in hyperbolic towers because of the height of vapor discharge. The magnitudes of interference and recirculation depend primarily on wind
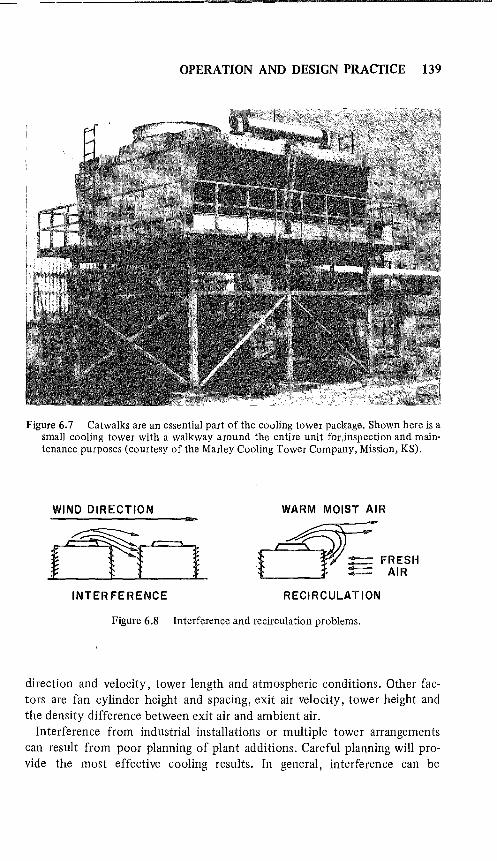
OPERATION AND DESIGN PRACTICE 139
Figure 6.7 Catwalks are an essential part of the cooling tower pacl<;age. Shown here is a small cooling tower with a walkway around the entire unit for,inspection and maintenance purposes (courtesy of the Marley Cooling Tower Company, Mission, KS).
WIND DIRECTION WARM MOIST AIR ....
I' ~ i ~ F:F"s" INTER FERENCE RECIRCULATION
Figure 6.8 Interference and recirculation problems.
direction and velocity, tower length and atmospheric conditions. Other factors are fan cylinder height and spacing, exit air velocity, tower height and the density difference between exit air and ambient air.
Interference from industrial installations or multiple tower arrangements can result from poor planning of plant additions. Careful planning will provide the most effective cooling results. In general, interference can be
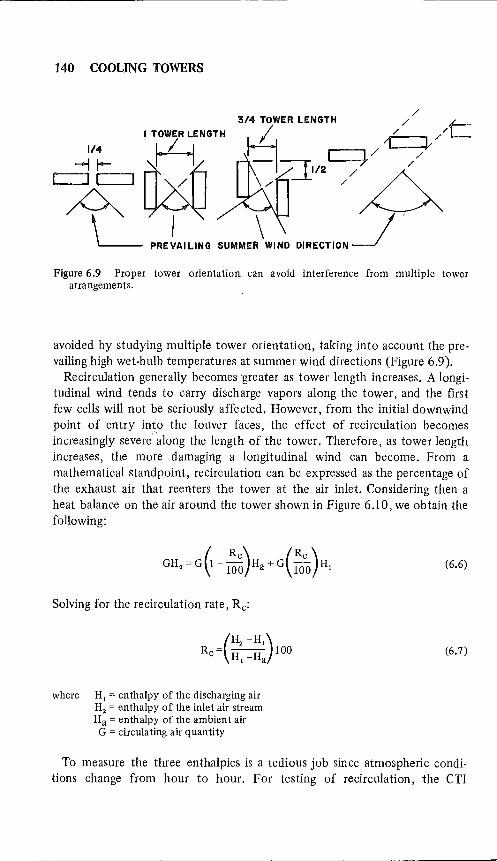
140 COOLING TOWERS
3/4 ToWER LENGTH / /
c:::::J c:::::J / \ / / D ~ p"LuNG SUMME~WIND DIRECTION~ ,
Figure 6.9 Proper tower orientation can avoid interference from multiple tower arrangements.
avoided by studying multiple tower orientation, taking into account the prevailing high wet-bulb temperatures at summer wind directions (Figure 6.9).
Recirculation generally becomes 'greater as tower length increases. A longitudinal wind tends to carry discharge vapors along the tower, and the first few cells will not be seriously affected. However, from the initial downwind point of entry into the louver faces, the effect of recirculation becomes increasingly severe'along the length of the tower. Therefore, as tower length increases, the more damaging a longitudinal wind can become. From a mathematical standpoint, recirculation can be expressed as the percentage of the exhaust air that reenters the tower at the air inlet. Considering then a heat balance on the air around the tower shown in Figure 6.10, we obtain the following:
Solving for the recirculation rate, Rc:
where HI = enthalpy of the discharging air H2 = enthalpy of the inlet air stream Ha = enthalpy of the ambient air G = circulating air quantity
(6.6)
(6.7)
To measure the three enthalpies is a tedious job since atmospheric conditions change from hour to hour. For testing of recirculation, the cn

OPERATION AND DESIGN PRACTICE 141
I I
Gx( 1- Rc"OO) (at Ha)
Figure 6.10 Heat balance about a cooling tower.
developed a formula that gives the maximum recirculati,on as a function of the tower length for mechanical-draft cooling towers: "i
0.073 X tower length R =----------------c 1 + 0.004 X tower length
(6.8)
where Rc is expressed as a percentage. Equation 6.8 was obtained from mechanical-draft tower testing. The equa
tion is shown to correlate the data in Figure 6.1l. One of the more serious problems associated with outside installation is
winter operation.
WINTER OPERATION
As the ambient wet-bulb temperature falls during the winter months, the operation of mechanical-draft cooling towers must take this effect into consideration to avoid serious degradation of tower performance. If the heat load is maintained constant throughout the year, it is clear that during winter the cold water temperature leaving the tower will decrease significantly and, therefore, the water flow through the tower should be decreased to maintain the same heat load.
In large multi cell towers it is common practice to reduce or stop the water

142 COOLING TOWERS
~ z o 15~--~----r----r----r----r----r---~--~ .... el ..J :;:) o 0::
o 1&.1
0:: 5 :;: :;:) :;: z :;: o 50 100 150
TOWER LENGTH
200 250
( FT)
300 350 400
Figure 6.11 Equation 6.8 correlates mechanical-draft performance data. (Data obtained from Cooling Tower Institute Bulletin PFM-ll 0.)
flow to one or more cells to achieve the desired outlet water temperature. Inspection and maintenance work can be performed on cells during this downtime. Once ~ne cell has been inspected and cleaned, it can be placed back into operation and the next one shut down following the same cycle. Saving energy and cleaning the tower at the same time is a good practice to avoid unpleasant surprises when the weather becomes warmer.
For one- or two-cell cooling towers the water flow is normally maintained, and to limit the fall in water temperature the air flowrate is controlled through the tower. The simplest method is an on/off control of the air fan by means of a thermostat with a sensing element in the water leaving the tower. Another relatively simple method of control is to use a two-speed motor together with a two-step thermostat to have high-speed or low-speed fan rpm, depending on the water temperature.
Towers that operate in freezing weather reqUired special consideration to provide dependable service and to prevent damage from freezing and ice accumulation. The most prevalent winter operating problem of water cooling towers is the formation of ice on the louvers to the extent of seriously, or even totally, restricting the air flow.
There are various precautions that minimize the danger of icing. Firstly, and obviously, the fan should not be run if there is no cooling load. Secondly, if there is no cooling load, it is better to shut off the water flow completely or, if that is not possible or desirable, keep the water flowrate at maximum. The danger of icing is increased if very small water flowrates are maintained. In fact, if this occurs while the fan is running, severe icing is
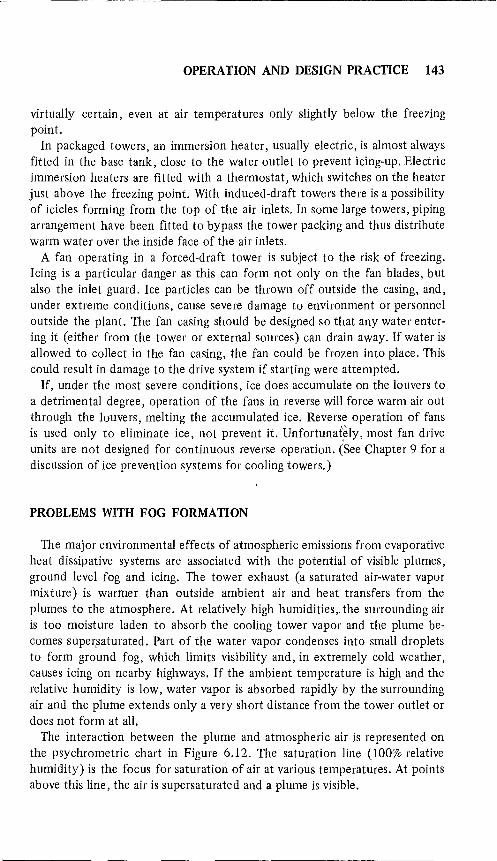
OPERATION AND DESIGN PRACTICE 143
virtually certain, even at air temperatures only slightly below the freezing point.
In packaged towers, an immersion heater, usually electric, is almost always fitted in the base tank, close to the water outlet to prevent icing-up. Electric immersion heaters are fitted with a thermostat, which switches on the heater just above the freezing point. With induced-draft towers there is a possibility of icicles forming from the top of the air inlets. In some large towers, piping arrangement have been fitted to bypass the tower packing and thus distribute warm water over the inside face of the air inlets.
A fan operating in a forced-draft tower is subject to the risk of freezing. Icing is a particular danger as this can form not only on the fan blades, but also the inlet guard. Ice particles can be thrown off outside the casing, and, under extreme conditions, cause severe damage to environment or personnel outside the plant. The fan casing should be designed so that any water entering it (either from the tower or external sources) can drain away. If water is allowed to collect in the fan casing, the fan could be frozen into place. This could result in damage to the drive system if starting were attempted.
If, under the most severe conditions, ice does accumulate on the louvers to a detrimental degree, operation of the fans in reverse will force warm air out through the louvers, melting the accumulated ice. Reverse operation of fans is used only to eliminate ice, not prevent it. Unfortunai~ly, most fan drive units are not designed for continuous reverse operation. (See Chapter 9 for a discussion of ice prevention systems for cooling towers.)
PROBLEMS WITH FOG FORMATION
The major environmental effects of atmospheric emissions from evaporative heat dissipative systems are associated with the potential of visible plumes, ground level fog and icing. The tower exhaust (a saturated air-water vapor mixture) is warmer than outside ambient air and heat transfers from the plumes to the atmosphere. At relatively high humidities, the surrounding air is too moisture laden to absorb the cooling tower vapor and the plume becomes super,saturated. Part of the water vapor condenses into small droplets to form ground fog, which limits visibility and, in extremely cold weather, causes icing on nearby highways. If the ambient temperature is high and the relative humidity is low, water vapor is absorbed rapidly by the surrounding air and the plume extends only a very short distance from the tower outlet or does not form at all.
The interaction between the plume and atmospheric air is represented on the psychrometric chart in Figure 6.12. The saturation line (100% relative humidity) is the focus for saturation of air at various temperatures. At points above this line, the air is supersaturated and a plume is visible.
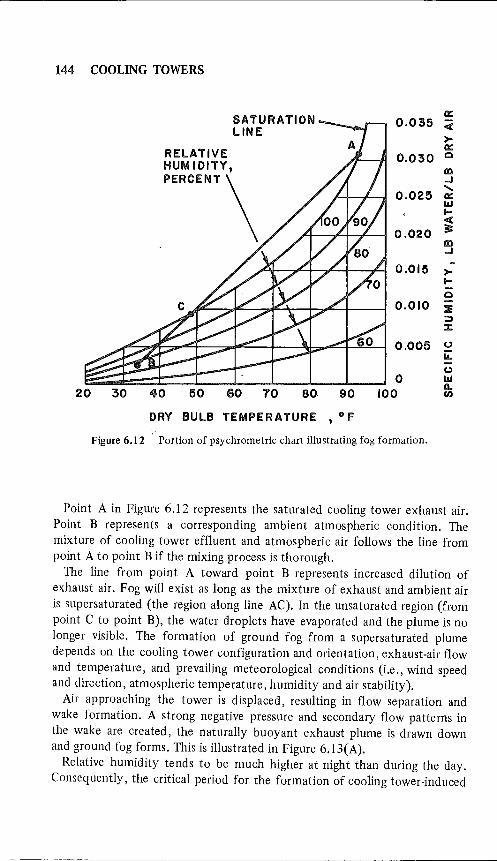
144 COOLING TOWERS
20 30
RELATIVE HUMIDITY,
SATURATION LINE
PERCENT \
40 50 60 10 80· 90
DRY BULB TEMPERATURE t of
0::: 0.035 el
>-0:::
0.030 0
III ..J .....
0.025 0::: 1&.1 .... el
0.020 3: lID ..J
0.015 >-....
0.010 ::Ii: :;:) ::t:
0.005 (.) IL.
(.)
o ~ 100 til
Figure 6.12 .. Portion of psychrometric chart illustrating fog formation.
Point A in Figure 6.12 represents the saturated cooling tower exhaust air. Point B represents a corresponding ambient atmospheric condition. The mixture of cooling tower effluent and atmospheric air follows the line from point A to point B if the mixing process is thorough.
The line from point A toward point B represents increased dilution of exhaust air. Fog will exist as long as the mixture of exhaust and ambient air is supersaturated (the region along line AC). In the unsaturated region (from point C to point B), the water droplets have evaporated and the plume is no longer visible. The formation of ground fog from a supersaturated plume depends on the cooling tower configuration and orientation, exhaust-air flow and temperature, and prevailing meteorological conditions (i.e., wind speed and direction, atmospheric temperature, humidity and air stability).
Air approaching the tower is displaced, resulting in flow separation and wake formation. A strong negative pressure and secondary flow patterns in the wake are created, the naturally buoyant exhaust plume is drawn down and ground fog forms. This is illustrated in Figure 6.13(A).
Relative humidity tends to be much higher at night than during the day. Consequently, the critical period for the formation of cooling tower-induced
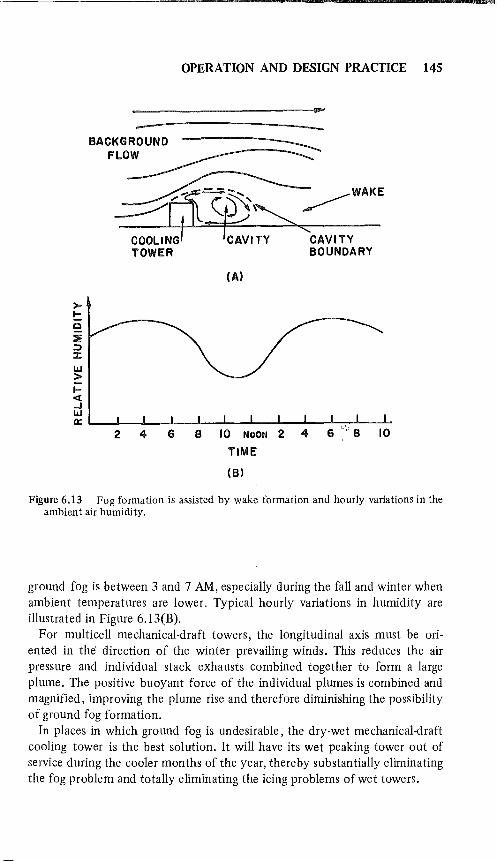
>-.... o ::Ii: ::> ::t: w > .... « ..J w
BACKGROUND FLOW
OPERATION AND DESIGN PRACTICE 145
~--=---
TOWER BOUNDARY
CA)
~ ~ __ L-~~~~~ __ ~ __ -L __ -L __ ~ __ ~~~ __ ~
2 4 6 B 10 NOON 2
TIME
(B)
Figure 6.13 Fog formation is assisted by wake formation and hourly variations in the ambient air humidity.
ground fog is between 3 and 7 AM, especially during the fall and winter when ambient temperatures are lower. Typical hourly variations in humidity are illustrated in Figure 6.13(B).
For multicell mechanical-draft towers, the longitudinal axis must be oriented in the' direction of the winter prevailing winds. This reduces the air pressure and individual stack exhausts combined together to form a large plume. The positive buoyant force of the individual plumes is combined and magnified, improving the plume rise and therefore diminishing the possibility of ground fog formation.
In places in which ground fog is undesirable, the dry-wet mechanical-draft cooling tower is the best solution. It will have its wet peaking tower out of service during the cooler months of the year, thereby substantially eliminating the fog problem and totally eliminating the icing problems of wet towers.
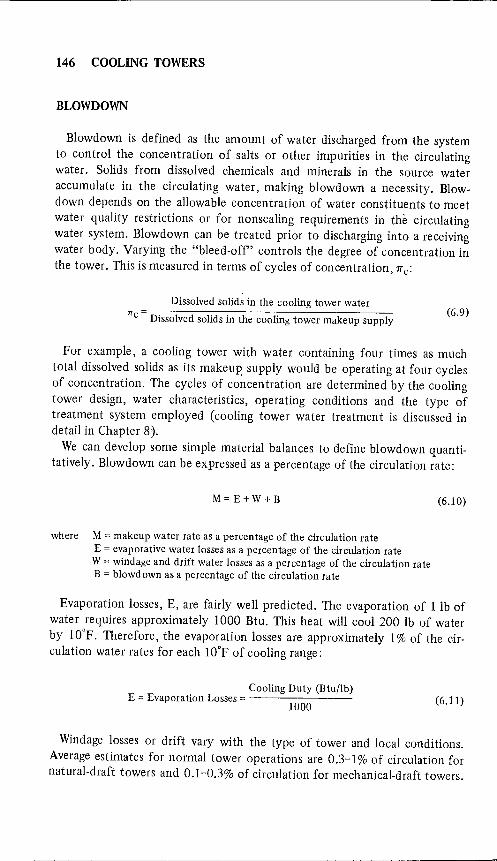
146 COOLING TOWERS
BLOWDOWN
Blowdown is defined as the amount of water discharged from the system to control the concentration of salts or other impurities in the circulating water. Solids from dissolved chemicals and minerals in the source water accumulate in the circulating water, making blowdown a necessity. Blowdown depends on the allowable concentration of water constituents to meet water quality restrictions or for nonscaling requirements in the circulating water system. Blowdown can be treated prior to discharging into a receiving water body. Varying the "bleed-off' controls the degree of concentration in the tower. This is measured in terms of cycles of concentration, 7r c:
1Tc Dissolved solids in the cooling tower makeup supply
Dissolved solids in the cooling tower water (6.9)
For example, a cooling tower with water containing four times as much total dissolved solids as its makeup, supply would be operating at four cycles of concentration. The cycles of concentration are determined by the cooling tower design, water characteristics, operating conditions and the type of treatment system employed (cooling tower water treatment is discussed in detail in Chapter 8).
We can develop some simple material balances to define blowdown quantitatively. Blowdown can be expressed as a percentage of the circulation rate:
M=E+W+B
where M = makeup water rate as a percentage of the circulation rate E = evaporative water losses as a percentage of the circulation rate W = windage and drift water losses as a percentage of the circulation rate B = blowdown as a percentage of the circulation rate
(6.10)
Evaporation losses, E, are fairly well predicted. The evaporation of 1 lb of water requires approximately 1000 Btu. This heat will cool 200 lb of water by 10°F. Therefore, the evaporation losses are approximately 1 % of the circulation water rates for each 10°F of cooling range:
Cooling Duty (Btu/lb) E = Evaporation Losses = --------
1000 (6.11)
Windage losses or drift vary with the type of tower and local conditions. Average estimates for normal tower operations are 0.3-1 % of circulation for natural-draft towers and 0.1-0.3% of circulation for mechanical-draft towers.

OPERATION AND DESIGN PRACTICE 147
Cycles of concentration compare the concentration of the dissolved salts in the circulating water with that of the makeup water. Usually, the circulating water salt content is limited to 3-7 times the makeup salt content (this is referred to the number of concentrations of 3-7).
The number of concentration is conveniently expressed as the ratio of the chlorides in the circulating water to chlorides in the makeup water. Chloride salts are soluble and will remain in solution; consequently, their concentration increases during the evaporative cooling process.
The basic items normally considered in a material balance of a cooling tower are the range, T, circulating water rate, C (in U.S. gpm), the ppm (parts per million of any soluble salts in C (Xc), and M, B, E and W. Xc is normally expressed in terms of equivalent chlorides.
It must be noted that concentration of soluble salts in blowdown and windage losses equals that in circulating water. Thus, Xm = ppm of any soluble salts in M and
Xc 7Tc =x = cycle of concentration
m
The overall balance is given by Equation 6.10 and the s,.~luble salts balance is
MXm = BXc + WXc
or we can rewrite this as
MXm = Xc(B + W)
or
B + W = M/7Tc
Substituting Equation 6.13 into 6.10 we obtain
M=E+M 7Tc
but M(n c - 1) = ncE, but E = 0.1 AT. Hence,
(6.12)
(6.13)
(6.14 )
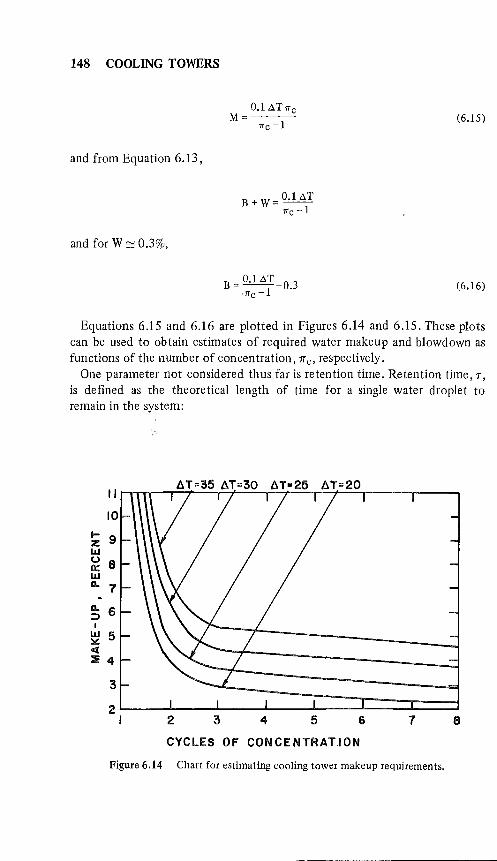
148 COOLING TOWERS
and from Equation 6.13,
and for W ==' 0.3%,
O.I.1..T7Tc M=---
7Tc -1
B = O.I.1..T -0.3 <7Tc -1
(6.15)
(6.16)
Equations 6.15 and 6.16 are plotted in Figures 6.14 and 6.15. These plots can be used to obtain estimates of required water makeup and blowdown as functions of the number of concentration, 7r c, respectively.
One parameter not considered thus far is retention time. Retention time, r, is defined as the theoretical length of time for a single water droplet to remain in the system:
II
10
I- 9 z lLI U 8 0:: lLI 0.. 7
0.. 6 :::> I
lLI 5 ~ c(
::Ii: 4
3
2 3 4 5 6 7 8
CYCLES OF CONCENTRATJON
Figure 6.14 Chart for estimating cooling tower makeup requirements.
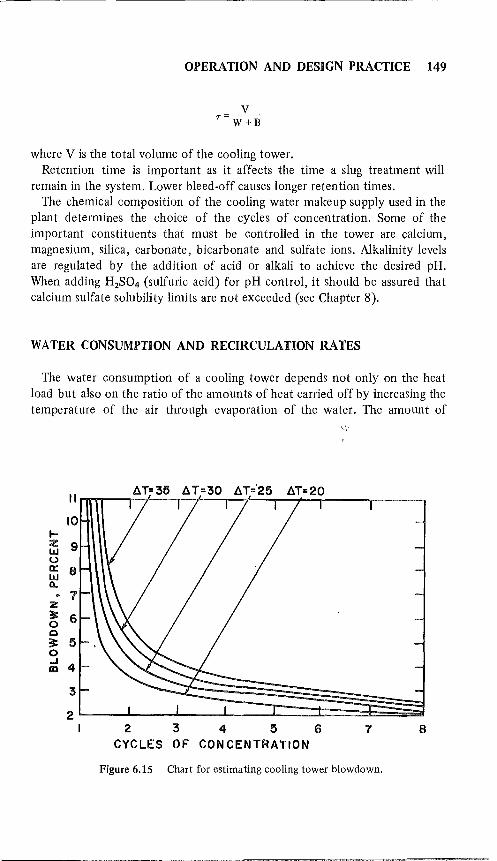
OPERATION AND DESIGN PRACTICE 149
V r=--W+B
where V is the total volume of the cooling tower. Retention time is important as it affects the time a slug treatment will
remain in the system. Lower bleed-off causes longer retention times. The chemical composition of the cooling water makeup supply used in the
plant determines the choice of the cycles of concentration. Some of the important constituents that must be controlled in the tower are calcium, magnesium, silica, carbonate, bicarbonate and sulfate ions. Alkalinity levels are regulated by the addition of acid or alkali to achieve the desired pH. When adding H2S04 (sulfuric acid) for pH control, it should be assured that calcium sulfate solubility limits are not exceeded (see Chapter 8).
WATER CONSUMPTION AND RECIRCULATION RATES
The water consumption of a cooling tower depends not only on the heat load but also on the ratio of the amounts of heat carried off by increasing the temperature of the air through evaporation of the water. The amount of
" 6T=35 6T=30 6T='25 6T=20
10 I-Z 9 I.LI U 0:: 8 I.LI 0. ~ 1
z 3: 6 0 0 ~ 5 0 ..J
4 lID
3
2 I 2 3 4 5 6 7 8
CYCLES OF CON CENTRATION
Figure 6.15 Chart for estimating cooling tower blowdown.

150 COOLING TOWERS
water lost in the form of suspended droplets in the exit air stream is usually less than 1 % of the water consumption. Thus, the water consumption, L, of a cooling tower can be related to the air flowrate and the air inlet and outlet water vapor contents, Xl and x2 , as follows:
L = Wa(x, - XI) (6.18)
If the air entering the tower is saturated, as much as one-third of the heat removed from the water may go into heating the air, while the balance will go into evaporating the water. Thus the water consumption will be only about two-thirds of what would be required if the entire heat load went into evaporation of the water. On the other hand, under unusual conditions at light loads, with a low temperature range and very dry air, evaporation of the water may actually reduce the air dry-bulb temperature so that heat is removed from, rather than added to, the air, and the amount of heat going to evaporate the water actually exceeds the heat load on the tower.
Under some wind conditions, a portion of the warm moist air leaving the tower may recirculate back through the tower inlet and thus degrade performance. Forced-draft towers have recirculation rates that are about double those of induced-draft towers. Both water loading and tower height play the dominant role in', ,recirculation. Correlations exist in the literature for defining the effects of these parameters, and corrections can be applied to the wet-bulb temperature [2,3]. Cooling tower fabricators can supply data to estimate the severity of the problem.
GAS COOLING OPERATIONS
Our discussion up to now has concerned the cooling of hot process waters exclusively. However, we insisted back in Chapter 1 that a cooling tower is nothing more than a device that transfers heat from one mass to another. Therefore, gas coolers are governed by the same theory of operation and design principles as are water cooling towers. , In developing our generalized expression for the number of transfer units
(Ntu') in Chapter 5 we assumed that the Lewis number prediction (Le = 1) for the air-water diffusion system was strictly true. However, there is experimental evidence that Le is less than unity, in which case the basic design theory developed could have built-in errors (although for most cooling tower operations the error is small). Figure 6.16 shows the Lewis number relationship for air-water. Correcting our generalized design expression (Equation 5.33):
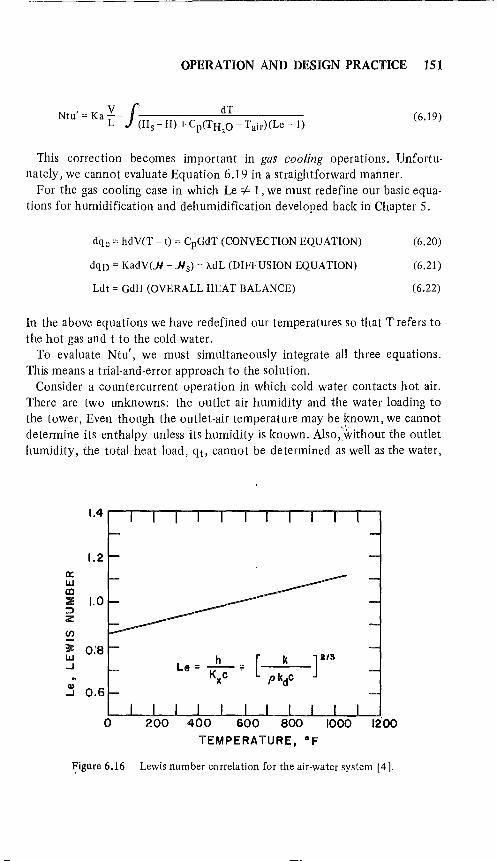
--~~-~~--------------------------------
OPERATION AND DESIGN PRACTICE 151
Ntu' = Ka Y =11 dT (6.19) L (Hs - H) + Cp(TH
20 - Tair)(Le - I)
This correction becomes important in gas cooling operations. Unfortunately, we cannot evaluate Equation 6_19 in a straightforward manner.
For the gas cooling case in which Le =1= 1, we must redefine our basic equations for humidification and dehumidification developed back in Chapter 5_
dqc'" hdV(T - t) '" CpGdT (CONVECTION EQUATION)
dqD '" KadV(.H - .Hs) = AdL (DIFFUSION EQUATION)
Ldt'" GdH (OVERALL HEAT BALANCE)
(6.20)
(6.21)
(6.22)
In the above equations we have redefined our temperatures so that T refers to the hot gas and t to the cold water.
To evaluate Ntu', we must simultaneously integrate all three equations. This means a trial-and-error approach to the solution.
Consider a countercurrent operation in which cold water contacts hot air. There are two unknowns: the outlet air humidity and the water loading to the tower, Even though the outlet-air temperature may be ~nown, we cannot determine its enthalpy unless its humidity is known. Also,\'vithout the outlet humidity, the total heat load, qt, cannot be determined as well as the water,
1.4
1.2 0: w CD ::Ii: 1.0 :;:) z (/)
3: 0:8 w ....J
Q)
0.6 ....J
h [ __ .;..:.k __ ] 2/8 La = -
K)(C'" pkdc
0 1200 TEMPERATURE, of
Figure 6.16 Lewis number correlation for the air-water system [4].

152 COOLING TOWERS
L, from Equation 6.22. Hence, for a gas-cooling problem the evaluation of process conditions depends entirely on the value of the outlet air humidity. If, however, we assume a humidity for the exit air for a specified discharge temperature, we can complete the heat balance and determine a value for the L:G ratio.
The tower's required height is related to the needed Ntu'. By assuming exit gas humidity, L is evaluated, and the amount of water d~ffused in the tower and the quantity of heat transferred can be determined through the definitions KaV/L or haV/L. Both these definitions are related through the Lewis number. K~rn [5] outlines the trial-and-error solution in detail. By starting at the bottom of the tower (the gas inlet) an increment of Kab.V/L is assumed and the amounts of heat and mass transfer over the increment are computed (L is known and Kab. V represents the actual number of pounds of mass transfer over the increment). A height should be reached in the tower in which all the heat transferred matches Equation 6.22. If the initial value of the enthalpy of the outlet gas and inlet water temperature does not occur at the same height, then a new outl~t enthalpy is chosen and the procedure repeated until agreement is reached. Problem 6.3 illustrates the method and Kern [5] gives other examples, Sherwood and Reed [6] also give the solution of the three differential equations (Equations 6.20,6.21 and 6.22). This is not a trial-and-ertor solution; however, it is a rather tedious calculation method.
There is a special case sometimes encountered with gas coolers, which leads to a simplified calculation procedure. This is the case in which hot gas contacts a nonvolatile cooling liquid. In such a situation the mass transfer can be negligible, and for some systems the latent heat of vaporization may be so small that the diffusion heat load can be neglected. It is possible then to neglect mass transfer altogether in this type of gas cooling operation.
Convection alone can be estimated from mass transfer data in packed towers through the relationship developed in Chapter 5.
haV/L = (Le)Cp(KaV/L) (6.23 )
If there is no mass transfer occurring, then the enthalpy of the gas is directly proportional to the difference in temperatures between the gas and cooling medium. We know that
haV/L = jdt/AT (6.24 )
where b. T = T - t. And, since only sensible heat changes occur, we can write
OPERATION AND DESIGN PRACTICE 153
haY =f~ (6.25) L ",,-TIm
where ATlm is the log-mean temperature difference. This equation can be rearranged to give the number of transfer units (see
Kern [5] for details):
Ntu =Le --I 1 dt ""-TIm
or
I haY Ntu = L(Le)Cp
FIRE HAZARD AND SAFETY PRECAUTIONS WITH COOLING TOWERS
(6.26a)
(6.27b)
Tower interiors, except those having special nozzles, cahsist of "fill" material designed to break up the falling water and permit upward air flow. This "fill" material may be of wood or plastic slats or treated paper honeycomb. Most of these materials are combustible and, when dry, create an unusually hazardous arrangement difficult to extingliish promptly and effectively with hose streams.
Induced- or forced-draft towers usually have a shell of wood or cement asbestos, a framework of wood and wooden slat filL Some towers are entirely noncombustible, with a shell of galvanized sheet steel or cement asbestos, a framework of steel and with either spray nozzles or fill materials proven by appropriate fire tests to be nonhazardous.
A natural-draft tower has no fans but usually has completely louvered sides and ends to allow wind to pass horizontally through the dripping water. These towers usually have wooden framing, wooden louvered sides and wooden fill or spray nozzles to break up the flow of water. Their framing and louvers may be of noncombustible material.
Cooling towers of combustible construction pose a fire hazard to nearby structures. Conversely, combustible cooling towers exposed to incinerators or process or cupola stacks that produce sparks are equally dangerous. The following safety gUidelines should be applied to locating and operating cooling towers.
1. If towers must be located within 40 feet of each other, within 40 feet of
154 COOLING TOWERS
a building or on the roof of a building of combustible construction, use noncombustible construction for forced- and natural-draft towers.
2. If possible, locate combustible cooling towers at a safe distance from ignition sources such as incinerators or stacks. Towers that must be near such hazards should be constructed entirely of noncombustible material, or at least the shell should be made from noncombustible materials. Fan openings should be protected with ~-in corrosion-proof wire mesh.
3. Locate any unsprinklered combustible building at least 40 feet from a combustible tower. Where unsprinklered cooling towers expose adjacent buildings, protection is needed because of the exposure. Such protection may be by sprinklers for the tower or protection for the exposed building.
4. Provide automatic sprinkler protection for induced-draft water-cooling towers where property damage < and business interruption could result. In estimating the extent of possible damage, it should be remembered that the exterior and certain interior portions of the towers are normally dry and that whole towers as well as single cells of multi cell towers may be taken out of service for repairs.
5. Post "No Smoking" rules at the tower and strictly enforce them. 6. Interlock all tower fans with the sprinkler system so that the fans will
be shut off if sprinklers operate. 7. Do not loca# electric light or power circuits above cooling towers.
COOLING TOWER PLUMES
Studies have shown that the atmospheric turbulence in the vicinity of natural-draft cooling towers can increase significantly due to the influence of plumes. Stack flue gases entering this turbulent region are more rapidly diluted. Unfortunately, this can lead to appreciable changes in the ground concentration of precipitated pollutants. As such, impairment is generally greater in the immediate vicinity of the plant and significantly lower at greater distances from the source. Perrinjaquet et al. [7] have studied the extent to which cooling tower plumes increase vertical diffusion to better estimate the environmental impacts of stack discharges.
In recent years, acute air pollution problems have been associated with large power plants. Stack discharges depend on the type of power plant. In oil-fired power plants, the emissions are mainly S02 and NOx ' In coal-fired operations, emissions include S02, NOx and a variety of radioactive nuclides derived from coal. In nuclear power plants, emissions are limited to small amounts of radioactive fission products.
Ground-level concentrations of pollutants in the vicinity of discharge sources can be estimated from diffusion models, which attempt to quantita-
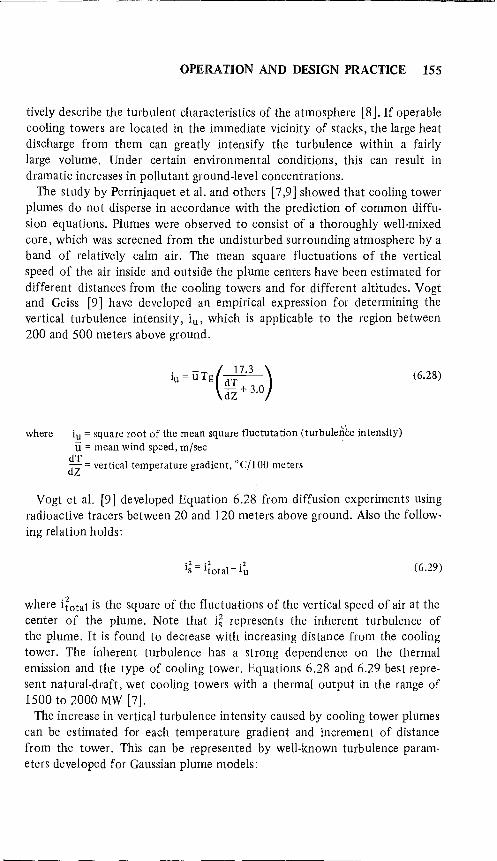
OPERATION AND DESIGN PRACTICE 155
tively describe the turbulent characteristics of the atmosphere [8]. If operable cooling towers are located in the immediate vicinity of stacks, the large heat discharge from them can greatly intensify the turbulence within a fairly large volume. Under certain environmental conditions, this can result in dramatic increases in pollutant ground-level concentrations.
The study by Perrinjaquet et al. and others [7,9] showed that cooling tower plumes do not disperse in accordance with the prediction of common diffusion equations. Plumes were observed to consist of a thoroughly well-mixed core, which was screened from the undisturbed surrounding atmosphere by a band of relatively calm air. The mean square fluctuations of the vertical speed of the air inside and outside the plume centers have been estimated for different distances from the cooling towers and for different altitudes. Vogt and Geiss [9] have developed an empirical expression for determining the vertical turbulence intensity, iu, which is applicable to the region between 200 and 500 meters above ground.
. -T ( 17.3 ) IU = U g dT -dZ + 3.0
(6.28)
where iu = square root of the mean square tluctutation (turbulen1:e intensity) U = mean wind speed, m/sec '
:~ = vertical temperature gradient, DC/I 00 meters
Vogt et al. [9] developed Equation 6.28 from diffusion experiments using radioactive tracers between 20 and 120 meters above ground. Also the following relation holds:
·2.2 .2 IS = Itotal- lu (6.29)
where iiotal is the square of the fluctuations of the vertical speed of air at the center of the plume. Note that i~ represents the inherent turbulence of the plume. It is found to decrease with increasing distance from the cooling tower. The fnherent turbulence has a strong dependence on the thermal emission and the type of cooling tower. Equations 6.28 and 6.29 best represent natural-draft, wet cooling towers with a thermal output in the range of 1500 to 2000 MW [7].
The increase in vertical turbulence intensity caused by cooling tower plumes can be estimated for each temperature gradient and increment of distance from the tower. This can be represented by well-known turbulence parameters developed for Gaussian plume models:
156 COOLING TOWERS
( .2) IS ·2 .2 '2 .2 .2 Itotal = IU + IS = IU 1 +~ =i3lu (6.30)
In this expression, (3 represents the increase factor of vertical diffusion due to the plume. Gaussian plume or dispersion models are based on standard deviations of the plume dimensions (ux , uy , uz ). These represent a measure of the diffusive capacity of the atmosphere. They are dependent on the turbulence conditions of the atmosphere, the vertical temperature gradient (which helps to establish atmospheric turbulence in the vertical direction) and the transporting distance.
Classical theory of turbulent diffusion assumes some sort of constant mixing length, whereby
(6.31)
And the effective vertical dispersion coefficient in the plume is defined as
(6.32)
where uz, in meters, is the vertical dispersion coefficient and is dependent on climatic conditions. If stable weather conditions exist with a temperature gradient of +2°C/100 meters and wind speeds are mild (at or below 1 meter/sec), then (3 has a value between 30 (for l-km distance from the tower) and 20 (for 6-km distance). This correction factor is much smaller if unstable weather conditions and high wind speeds exist. An advantage to using (3 is that it can be related to different meteorological classifications (or stability classes) once values for the vertical temperature gradients are known. A stability class comprises atmospheric conditions that possess approximately equal diluting characteristics.
When a stack is situated near the cooling tower, stack gases are very likely to enter the turbulent plume zone. Average yearly concentrations, which are normally computed from the frequency of various atmospheric stability classes at ground level, will not provide good estimates. The reason for these poor estimates is that for average situations stability class estimates assume conditions that are too stable and too low in turbulence. By employing the increase factor, (3, in Gaussian dispersion models, it is possible to correctly estimate the extent to which ground level concentrations averaged over the year can change due to the influence of cooling tower discharges. Groundlevel concentration predictions are best illustrated by a plot similar to Figure 6.17.

E Q" Q"
z o .... « 0: .... Z W (.)
Z o (.)
o z :;:) o 0: (!)
W > .... « ..J w 0:
OPERATION AND DESIGN PRACTICE 157
ALLOWANCE MADE FOR COOLING TOWER PLUME
PREDICTIONS WITHOUT
CORRECTING FOR PLUME
EFFECTS
DISTANCE FROM STACK I m
Figure 6.17 Typical plot comparing relative ground concentrati,o,n in the cooling tower stack direction. Ground-level concentrations are normally aver,aged over the year.
Worst-case environmental conditions occur when an inversion exists and there is no wind. An inversion is defined as an atmospheric stratification in which a warmer air layer overlies a colder air mass. This situation typically occurs in the center of a zone of high pressure after a clear night in a bowlshaped valley. The layer of air immediately above the ground is essentially stagnant under these conditions so that smoke ascends vertically from the stacks and tends to spread out in all directions at a certain altitude. In an extremely bad case, a cooling tower below the inversion would likely establish a small circulatory system. Because of the inherent turbulence of the plume, this would,probably lead to greater turbulence in this region. The air in our enclosed bowl of the valley would warm up by several degrees in a matter of a few hours until the inversion is broken down from below sufficiently for the cooling tower plume to break through. The cooling tower plume would maintain an exchange between the valley bowl air surroundings from this point onwards.
Similar effects would be exerted by a tower during the existence of fog in a town. That is, the plume would help to ventilate the town. Note, however, that this positive effect is likely to be minimal under most conditions.
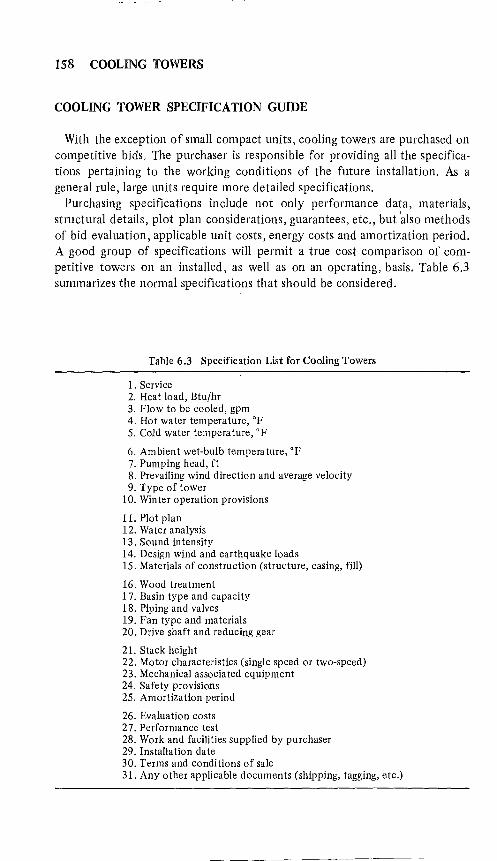
158 COOLING TOWERS
COOLING TOWER SPECIFICATION GUIDE
With the exception of small compact units, cooling towers are purchased on competitive bids. The purchaser is responsible for providing all the specifications pertaining to the working conditions of the future installation. As a general rule, large units require more detailed specifications.
Purchasing specifications include not only performance data, materials, structural details, plot plan considerations, guarantees, etc., but 'also methods of bid evaluation, applicable unit costs, energy costs and amortization period. A good group of specifications will permit a true cost comparison of competitive towers on an installed, as well as on an operating, basis. Table 6.3 summarizes the normal specifications that should be considered.
Table 6.3 Specification List for Cooling Towers
1. Service 2. Heat load, Btu/In 3. Flow to be cooled, gpm 4. Hot water temperature, OF 5. Cold water temperature, OF
6. Ambient wet-bulb tempera ture, OF 7. Pumping head, ft 8. Prevailing wind direction and average velocity 9. Type of tower
10. Winter operation provisions
11. Plot plan 12. Water analysis 13. Sound intensity 14. Design wind and earthquake loads 15. Materials of construction (structure, casing, fill)
16. Wood treatment 17. Basin type and capacity 18. Piping and valves 19. Fan type and materials 20. Drive shaft and reducing gear
21. Stack heigh t 22. Motor characteristics (single speed or two-speed) 23. Mechanical associated equipment 24. Safety proviSions 25. Amortization period
26. Evaluation costs 27. Performance test 28. Work and facilities supplied by purchaser 29. Installation date 30. Terms and conditions of sale 31. Any other applicable documents (shipping, tagging, etc.)
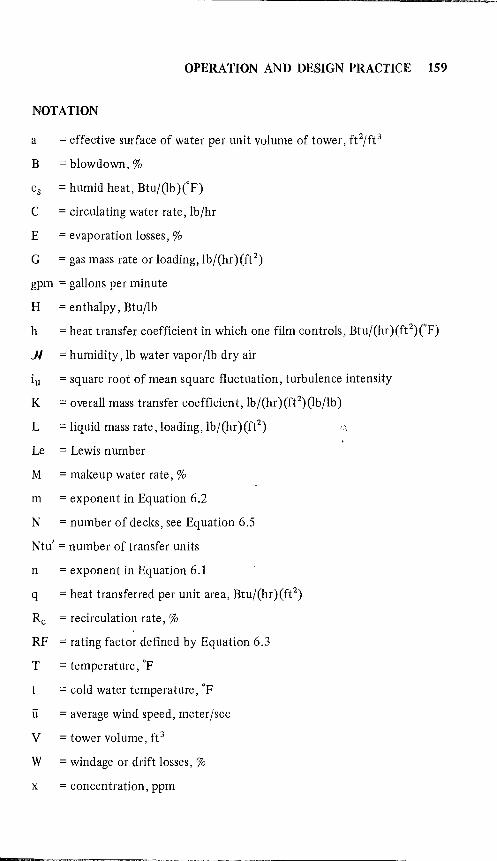
OPERATION AND DESIGN PRACTICE 159
NOTATION
a = effective surface of water per unit volume of tower, ft 2/ft 3
B = blowdown, 0/0
Cs = humid heat, Btu/(lb )('F)
C = circulating water rate, lbjhr
E = evaporation losses, 0/0
G = gas mass rate or loading, lbj(hr)(ft2)
gpm = gallons per minute
H = enthalpy, Btu/lb
h = heat transfer coefficient in which one film controls, Btuj(hr)(ft2)(F)
.JI = humidity, lb water vaporjlb dry air
iu = square root of mean square fluctuation, turbulence intensity
K = overall mass transfer coefficient, lbj(hr )(ft2)(lb/lb)
L = liquid mass rate, loading, lb/(hr)(ft2)
Le = Lewis number
M = makeup water rate, 0/0
m = exponent in Equation 6.2
N = number of decks, see Equation 6.5
Ntu' = number of transfer units
n = exponent in Equation 6.1
q = heat transferred per unit area, Btu/(hr ) (ft2)
Rc = recirculation rate, 0/0
RF = rating factor defined by Equation 6.3
T = temperature, of
= cold water temperature, of
u = average wind speed, meter/sec
V = tower volume, ft3
W = windage or drift losses, 0/0
x = concentration, ppm
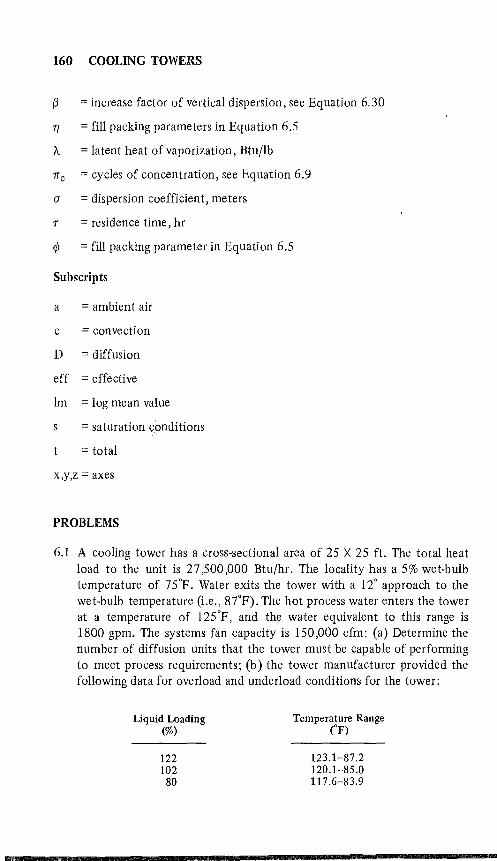
160 COOLING TOWERS
(3 = increase factor of vertical dispersion, see Equation 6.30
77 = fill packing parameters in Equation 6.S
A = latent heat of vaporization, Btuflb
1T c = cycles of concentration, see Equation 6.9
a = dispersion coefficient, meters
r = residence time, hr
¢ = fill packing parameter in Equation 6.S
Subscripts
a = ambient air
c = convection
D = diffusion
eff = effective
1m = log mean value
= saturation conditions
= total
x,y,z = axes
PROBLEMS
6.1 A cooling tower has a cross-sectional area of 2S X 2S ft. The total heat load to the unit is 27 ,SOO ,000 Btufhr. The locality has a S% wet-bulb temperature of 7 SOF. Water exits the tower with a 12° approach to the wet·bulb temperature (Le., 87°F). The hot process water enters the tower at a temperature of 12SoF, and the water equivalent to this range is 1800 gpm. The systems fan capacity is lS0,000 cfm: (a) Determine the number of diffusion units that the tower must be capable of performing to meet process requirements; (b) the tower manufacturer provided the following data for overload and underload conditions for the tower:
Liquid Loading (%)
122 102
80
Temperature Range CF)
123.1-87.2 120.1-85.0 117.6-83.9

OPERATION AND DESIGN PRACTICE 161
Determine how much water the tower can provide from 115°F to 85°F when the wet bulb is only 70°F. (Hint: a trial-and -error solution must be used to match conditions on a plot of KaV:L versus L:G).
6.2 A 4.0-ft-diameter (inside diameter) tower has a packed section 15 ft tall. The packing material is 3-inch Berl saddles. Water (50 gpm feed to the tower) is to be cooled from 128°F to 87°F. Approximately 4000 cfm of air is used to cool the water. The air has a dry bulb of 83°F and a wet bulb of 77°F.
In a field test at a gas loading of 1500 Ib/(hr)(ft2), a diffusion coeffi
cient of 380 lb/(hr) (ft2) (lb/lb ) was obtained. Determine the temperature to which the same tower could cool 7500 cfm to gas if the packing height were increased to 20 f1. Repeat the problem for 30 ft of packing height.
6.3 A direct-contact gas cooler system operates as follows: Approximately 35,000 lb /hr of bone-dry air is passed over hot trays. The air is heated from 150°F to 325°F as it passes over the trays. It exits from the unit with a due point of 105°F. The hot air is sent to a direct-contact cooler, where its temperature is reduced back to 150°F. During the cooling stage, the air is dehumidified with water that is heated from 75°F to 105°F. The unit is rated at 3.5 inches of water pressure drop : (a) Determine the number of diffusion units needed for this operation; and (b) Establish the required dimensions for the direct-contact cooling tower (Hint: Use standard low-pressure-drop data from the literature. Some of the older literature give pressure drop data for simple fill. See Sherwood, T. K. and C. E. Reed [6].
6.4 For problem 6.3, determine how many diffusion units are needed to cool the gas from 700°F to 150°F. Assume same operating conditions.
REFERENCES
, 1. McDowell, D. W., II. "The Corrosion Engineer Looks at the Cooling Tow
er," Cooling Tower Institute, Houston, TX (June 1964). 2. Lichtenstein, J. "Performance and Selection of Mechanical Draft Cooling
Towers," Trans. ASME 779 (1943). 3. Strauss, S. "Guide to Evaluate Cooling Tower Performance," Power (Oct
tober 1975). 4. Hilpert, R. Forschungsheft 3:355 (1932). 5. Kern, D. Q. Process Heat Transfer (New York:McGraw-Hill Book Co.,
1950). 6. Sherwood, T. K., and C. E. Reed. Applied Mathematics in Chemical Engi
neering (New York: McGraw-Hill Book Co., 1939).
162 COOLING TOWERS
7. Perrinjaquet, M., A. Baden, F. Gassmann and D. Haschke. "Increase in the Turbulent Diffusion of Pollutants by Cooling Towers," Combustion 51 (11) (May 1980).
8. Cheremisinoff, P. N., and R. A. Young. Air Pollution Control and Design Handbook (New York: Marcel Dekker Inc., 1977).
9. Vogt, K. J., and H. Geiss. "Tracer Experiments on the Dispersion of Plumes over Terrain of Major Surface Roughness," KFA-lulich Jul-113l-ST(October 1974).
SUGGESTED READING
l. Bauer, R. O. "Industrial Cooling Tower Systems," Plant Eng. (June 14, 1979 ).
2. Cabral, B. F. A. "Winter Operation of Mechanical Draft Cooling Towers," Heat Transfer Survey (1974).
3. Dolar, N. E. "Understanding Cooling Tower Fog," Plant Eng. (Dec. 8, 1977).
4. Troscinski, E. S., and R. G. Watson, "Controlling Deposits in Cooling Water Systems," Chemical Eng. (March 9,1970).
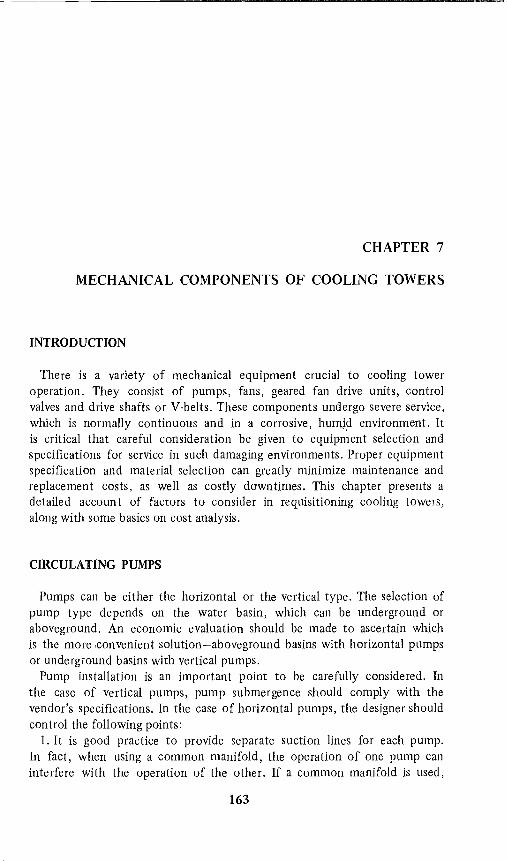
CHAPTER 7
MECHANICAL COMPONENTS OF COOLING TOWERS
INTRODUCTION
There is a variety of mechanical equipment crucial to cooling tower operation. They consist of pumps, fans, geared fan drive units, control valves and drive shafts or V-belts. These components undergo severe service, which is normally continuous and in a corrosive, hurn;,d environment. It is critical that careful consideration be given to equipment selection and specifications for service in such damaging environments. Proper equipment specification and material selection can greatly minimize maintenance and replacement costs, as well as costly downtimes. This chapter presents a detailed account of factors to consider in requisitioning cooling towers, along with some basics on cost analysis.
CIRCULATING PUMPS
Pumps can be either the horizontal or the vertical type. The selection of pump type depends on the water basin, which can be underground or aboveground. An economic evaluation should be made to ascertain which is the more ,convenient solution-aboveground basins with horizontal pumps or underground basins with vertical pumps.
Pump installation is an important point to be carefully considered. In the case of vertical pumps, pump submergence should comply with the vendor's specifications. In the case of horizontal pumps, the designer should control the following points:
1. It is good practice to provide separate suction lines for each pump. In fact, when using a common manifold, the operation of one pump can interfere with the operation of the other. If a common manifold is used,
163
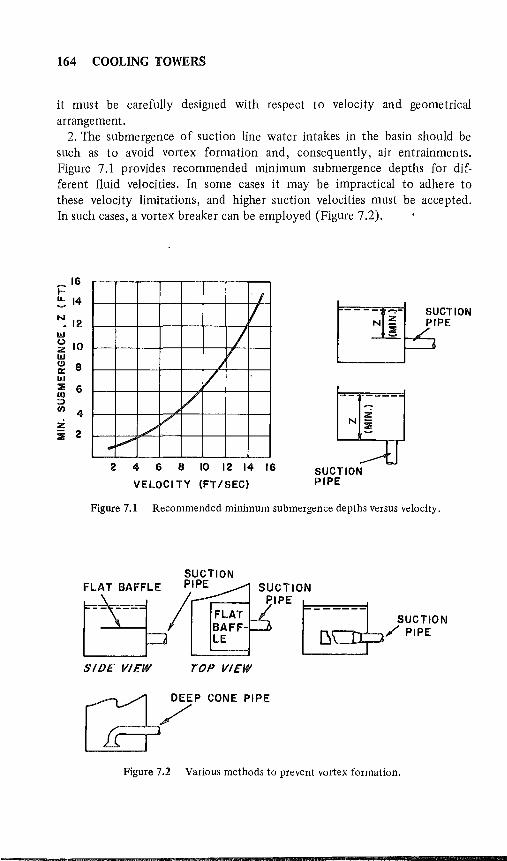
164 COOLING TOWERS
it must be carefully designed with respect to velocity and geometrical arrangement.
2. The submergence of suction line water intakes in the basin should be such as to avoid vortex formation and, consequently, air entrainments. Figure 7.1 provides recommended minimum submergence depths for different fluid velocities. In some cases it may be impractical to adhere to these velocity limitations, and higher suction velocities must be accepted. In such cases, a vortex breaker can be employed (Figure 7.2).
~ 16 I-~ 14
~ 12 LIJ (,)
10 z LIJ C!I 8 II:: LIJ ;:'I; 6 til ::::> I/)
4 ~
2 ;:'I;
I V
/ /
I
/ /
L /'
... V
2 4 6 8 10 12 14 16
VELOCITY (FT/SEC)
I:rr1 ;~CTION ~PE
SUCTION PIPE
Figure 7.1 Recommended minimum submergence depths versus velocity.
SUCTION
(Si~~r /LIP_E-====I
SlOE VIEW TOP VIEW
~PCONEPIPE
Figure 7.2 Various methods to prevent vortex formation.

MECHANICAL COMPONENTS OF COOLING TOWERS 165
3. Normal water level in the basin must be at least 6 inches above the top of the pump casing.
4. Water velocity in the pump suction line should not exceed 8.5 ft/sec. In the discharge line, the water velocity should not be greater than 12 ft/sec to avoid excessive erosion of piping (especially where water containing grit is used).
5. Each pump should be isolated with suction and discharge valves. 6. Pumps should be provided with strainers at their suction inlet,
normally with 3/8-inch screen openings to avoid leaves, pieces of wood and other foreign material from getting into the pump impeller.
7. The design capacity of the pumps should be 110-115% of normal capacity. Pumps should have suitable spares, depending on the number of pumps provided; for example, two 100% capacity or three 50% capacity pumps. For a large installation, where more than two pumps are required to operate simultaneously, one spare machine every two pumps should be provided.
8. The circulating pumps should be specified on the basis of the bubble point liquid at the net positive suction head (NPSH).
FANS
Cooling tower fans move large volumes of air; therefore, they must be designed to do it economically. In addition, fan operation must be smooth. Vibration and air pulsation can be detrimental to mechanical equipment and tower structures. The materials of construction not only must be compatible with their design, but also capable of withstanding the corrosive effects of their environmental.
Both propeller- and centrifugal-type fans are in general use on cooling towers, with propeller-type fan installations dominating the industry. Propeller fans have the ability to deliver large volumes of air at low static heads and are used almost exclusively on towers for outdoor installations. They are relatively inexpensive, can be used on any size tower and are particularly suited to cooling tower usage where low draft losses prevail. In properly designed fan cylinders, propeller fans operate at efficiencies as high as 80%. They are currently produced in volume in sizes up to 30 inches in diameter. Centrifugal fans operate effectively against high static heads and are used for most indoor installations; sizes generally range up to 36 inches in diameter.
An important characteristic of propeller fans is that their operating smoothness is directly proportional to the number of blades loading and unloading as they pass over the mechanical equipment supports and tower

166 COOLING TOWERS
framework, but also to the basic blade load. As a design requirement, for the same air flow and blade tip speed, a fan with a few blades requires wider blades than a fan with a larger number of blades. The resulting higher blade with the wide blade fan produces much greater pulsation of air flow with proportionate increases in fan cylinder and tower vibration. This can definitely reduce the effective service life of the tower.
Four blades are ordinarily considered a desirable minimum for mediumsized fans, with eight blades a minimum for large diameters. Twelve blades are a practical maximum. Fan diameters are basically determined by the volume of air to ,be handled. Air velocities through the fan range from 1200 to 2500 fpm. An economic design value is about 1800 fpm. Acceptable fan blade tip speeds, with low noise as the criterion, vary with the type tower, the type of fan cylinder and the blade tip clearance.
On industrial installations where noise is not a major consideration, tip speeds as high as 15,000 fpm are acceptable on fans 10 feet in diameter and larger. However, tip speeds seldom exceed 12,000 fpm. Designs for office building installations provide for tip speeds on the order of 8000-12,000 fpm, with fan diameters varying from 3 to 8 feet. Small packaged towers for residential air conditioning duty usually employ sheet metal fan blades 10-24 inches in diameter, with tip speeds seldom exceeding 5000 fpm.
In the larger diameters, a properly designed propeller fan will be proportioned so that a uniform air velocity will be produced from hub to blade tip. Aluminum alloys provide excellent materials for production of this type of fan blade. Aluminum blades produced as castings are relatively inexpensive, have desirable internal vibration damping properties and are highly corrosion resistant in most cooling tower applications. Another material that has great potential for cooling tower fan blades is reinforced plastic resin. (The reader is referred to the literature [1] for a discussion of fiberglass fans and fan reconditioning.)
Blade castings can also be produced from brass and stainless steel, but their Use is generally limited because of their relatively high cost and weight. If the blade shanks and hub are of dissimilar metals, they should be insulated from each other to prevent galvanic corrosion from occurring.
Centrifugal fans of the double inlet type are used predominantly on cooling towers for indoor installations. Their inherent characteristics of high static capability and qUiet operation make them particularly suitable for this type of tower installation. Centrifugal fans are available in three types: (1) forward curve blade fans, (2) radial blade fans, and (3) backward curve blade fans (Figure 7.3). The characteristics of the forward curve blade fan make it the most appropriate type for cooling tower applications. Centrifugal fans are usually of sheet metal construction. The most popular protective coating is hot dipped galvanizing.

MECHANICAL COMPONENTS OF COOLING TOWERS 167
FOWARD CURVED (INCLINED) BLADE
RADIAL BLADE (PADDLE WHEEL)
BACKWARD INCLINED BLADE
Figure 7.3 Centrifugal fan configurations: (a) forward curve blade; (b) radial blade fan; (c) backward curve blade.
SPEED REDUCERS
The primary design requirements for cooling tower gear reducers (speed reducers) are long life and minimum maintenance. To attain this, they must be ruggedly constructed so they can withstand the continuous service and severe environment in which they operate. The gear components may be of different types. Helical, spiral bevel and worm gear are the most common. Depending on the reduction ratio, they may,,~be single-stage or two-stage reducer~.
The required service factor is an important specification. The service factor is defined as the ratio of calculated basic horsepower to the applied horsepower. The service factor can be as high as 2 for spiral-bevel reducers, but with continuous service this factor could be as low as 1.25 to have a good reducer life.
Gear reducer life is also dependent on bearing life. Bearings are normally selected for a calculated life compatible with the type of service. Bearings for industrial cooling tower gear reducers, considered for continuous duty, are selected by quality manufacturers on the basis of a 100,000 hour B-lO life. B-lO life is defined as the life expectancy in hours during which 90% or more of a given group of bearings under a specific loading condition will still be in service.
Lubrication is highly important to assure long trouble-free service life. The lubrication system should be capable of providing lubrication for short periods of time and for reverse rotation operation.
DRIVE SHAFTS
The function of the drive shaft is to transmit power from the prime mover to the gear reducer. It operates in the humid air stream so it must

168 COOLING TOWERS
be durable. It is a high speed unit so its design must include balancing facilities. Since tower structures are not completely rigid, the drive shaft must be able to operate with a limited degree of misalignment.
Drive shafts are described as floating shafts equipped with flexible couplings at both ends. They must be constructed from corrosion-resistant materials because of the humid environment in which they operate. The floating shaft is usually fabricated from carbon steel tubing furnished with a protective coating (hot dipped galvanized being preferred). Stainless steel tubing is used quite frequently because it is more durable although it is more expensive.
It is important that drive shafts be properly balanced. Imbalance not only causes tower vibration but also induces higher loads and excessive wear on the mechanical equipment coupled to the shaft. With drive shafts approaching speeds of 1800 rpm in most cooling tower applications, it is necessary that the shafts be dynamically balanced to reduce vibrational forces to a minimum.
INSTRUMENTATION, VALVES AND FLOWSHEETS
The instrument~ usually provided for cooling towers and circulating pumps include:
.. LlC (Level Indicator Control) with low-level alarm on the cooling tower basin and an actuating valve on the water makeup line;
.. PIC (Pressure Indicator Control) with low-pressure alarm on the cooling water supply header and an automatic cut-in device to start spare pumps when supply pressure falls below a certain level;
.. a vibration cut-out switch with alarm to stop the electric motors of fans in the event of high vibration. This switch must be provided with a reset device to set its action at the desired level of vibration above the normal. A vibration switch is used to trip the motor at the startup of fans; and
.. a pH analyzer with high and low pH alarms to actuate a sulfuric acid pump motor.
Valves are used to control the water flow through the water lines of the cooling tower distribution system. Valves used for this type application include stop valves, flow control valves and float control valves. The types of valves, quantity required and complexity of design are dictated by the type and size of tower.
Stop valves are used on both counterflow and crossflow towers to regulate the water flow, particularly between cells on multicell towers, and to shut off the water for maintenance or other purposes. In regions in which freezing temperatures are not encountered, conventional stop valves may be replaced on crossflow towers with flow control valves that
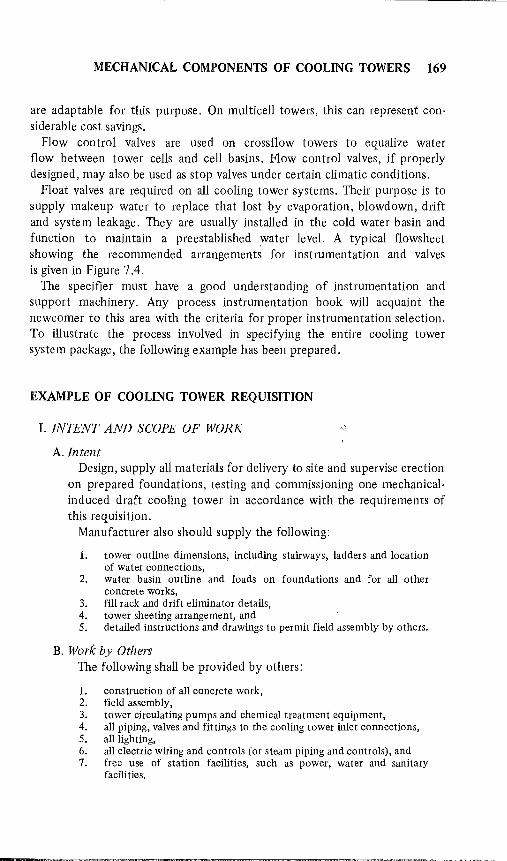
MECHANICAL COMPONENTS OF COOLING TOWERS 169
are adaptable for this purpose. On multicell towers, this can represent considerable cost savings.
Flow control valves are used on cross flow towers to equalize water flow between tower cells and cell basins. Flow control valves, if properly designed, may also be used as stop valves under certain climatic conditions.
Float valves are required on all cooling tower systems. Their purpose is to supply makeup water to replace that lost by evaporation, blowdown, drift and system leakage. They are usually installed in the cold water basin and function to maintain a preestablished water level. A typical flowsheet showing the recommended arrangements for instrumentation and valves is given in Figure 7.4.
The specifier must have a good understanding of instrumentation and support machinery. Any process instrumentation book will acquaint the newcomer to this area with the criteria for proper instrumentation selection. To illustrate the process involved in specifying the entire cooling tower system package, the following example has been prepared.
EXAMPLE OF COOLING TOWER REQUISITION
I. INTENT AND SCOPE OF WORK
A. Intent Design, supply all materials for delivery to site and supervise erection
on prepared foundations, testing and commissioning one mechanicalinduced draft cooling tower in accordance with the requirements of this requisition.
Manufacturer also should supply the following:
1. tower outline dimensions, including stairways, ladders and location of water connections,
2. water basin outline and loads on foundations and for all other concrete works,
3. fill rack and drift eliminator details, 4. tower sheeting arrangement, and 5. detailed instructions and drawings to permit field assembly by others.
B. Work by Others The following shall be provided by others:
1. construction of all concrete work, 2. field assembly, 3. tower circulating pumps and chemical treatment equipment, 4. all piping, valves and fittings to the cooling tower inlet connections, 5. all lighting, 6. all electric wiring and controls (or steam piping and controls), and 7. free use of station facilities, such as power, water and sanitary
facilities.
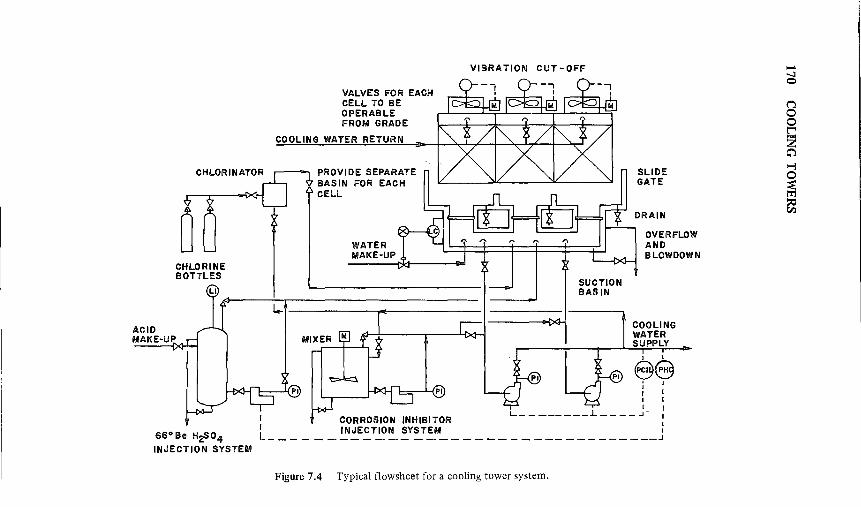
CHLORINE BOTTLES
ACID MAKE-UP
66°Be Hil 04 INJECTION SYSTEM
VALVES FOR EACH CELL TO BE OPERABLE FROM GRADE
COOLING WATER RETURN
PROVIDE SEPARATE BASIN FOR EACH CELL
WATER MAKE-UP
VIBRATION CUT -OFF
~T-----------~-----------
SLIDE GATE
DRAIN
OVERFLOW AND BLOWDOWN
COOLING WATER SUPPLY
I I
88 I r I I
I CORROSION INHIBITOR L ________ .L ____ ..J' :
I INJECTION SYSTEM I L __________________________________ J
Figure 7.4 Typical flowsheet for a cooling tower system.
..-.l o
MECHANICAL COMPONENTS OF COOLING TOWERS 171
C. Quality of Materials All materials shall be of first-class quality and free from all defects
that would cause unworkmanlike appearance. All materials used shall be suitable for the service under which they will operate.
D. Performance Tests The cooling tower manufacturer shall conduct the acceptance
performance test and shall supply the necessary instruments to conduct the test in accordance with the requirements of the cn Test Procedure ATP-10S, latest revision.
The manufacturer's proposal shall include performance curves of the tower, based on design fan horsepower, showing cold water temperature versus air wet-bulb temperature for 90%, 100% and 110% of design water flow. The curves shall cover cooling ranges of lSoF, 20°F, 2SoF, 30°F and design range.
II. REQUIREMENTS-SIZE, CAPACITY AND OPERATION
The cooling tower shall meet the following requirements: A. Design Conditions
• water flow over cooling water, U.S. GPM • Inlet water temperature, of • Outlet water temperature. of • Wet-bulb temperature, of • Relative humidity, % • Altitude above sea level, ft • Pumping head limitations, ft • Maximum drift losses
B. Physical Data
• Maximum width, ft • Maximum length, ft • Maximum height, ft • Location of nearby heat sources, ft • Direction and intensity of prevailing winds • Orientation of longitudinal axis of tower • Live wind load, Ib/ft 2
• Earthquake load, g • Available power-V/phase/cycles
Motors up to Motors above
• Preferred arrangement (number of cells) • Preferred volume of tower basin (standard, 2-ft, 6-inch water
level), fe
172 COOLING TOWERS
III. COOLING TOWER DETAILS-MATERIALS AND DESIGN
A. Framework The supporting structure will be an independent structure in rein
forced concrete and so calculated to be able to carry the static loads as well as the mechanical equipment. The construction will be properly reinforced and braced to transfer directly to the foundations all loads and tresses.
The anchor bolts will be included in the supply. The structural frame of the tower also shall be designed to withstand
the wind pressure in any horizontal direction or earthquake loading, as specified in the section of the requisition entitled RequirementsSize, Capacity and Operation.
B. Sheeting The external wall shall be single-wall construction (watertight de
sign) using i-inch flat or corrugated cement asbestos board according to CTI Std. 127 (Philip Carey Industrial AC Board, Johns-Manville Transite or equal) or glass-reinforced polyester, fire-retardant opaque type. Utility boards or similar grades of cement asbestos board are NOT acceptable. Vertical joints shall have an adequately sealed overlap or ;be covered with a batten. Horizontal joints shall have an adequate overlap. Fasteners shall be of stainless steel to prevent staining. Nails shall not be used for attachments.
C. Filling Individual fill assemblies shall be designed to be removable. Fill shall
be properly supported and fastened to prevent warping or buckling under all expected operating or icing conditions.
Tower fill material is to be of impregnated fir, polypropylene or polyethylene and other approved plastic materials.
Manufacturer shall quote wood filling as an alternative to plastic filling.
Fill racks used in the counterflow design shall be capable of supporting a man or 25 Ib/ft 2 10ading.
To prevent biological attack, one of the following preservatives may be selected to impregnate lumber for tower fill and other wood parts:
1. Erdalith Preservative shall be used to treat redwood lumber by the pressure treating process. The waterborne salts are, by weight, 33% copper sulfate, 56% potassium dichromate and 11% arsenic pentoxide. Lumber treatment shall be to an average retention at shipment of 0.75 lb/ft'.
2. Creosote Preservative shall be used to treat redwood lumber by the pressure treating process. Lumber treatment shall be to an average retention at shipment of 10 lb/ft'.

MECHANICAL COMPONENTS OF COOLING TOWERS 173
Treatment of the lumber by either of the above preservatives shall be in accordance with the American-Wood Preservers' Association Standards CI and C2 for Pacific Coast Douglas Fir, except that the lumber shall not be incised. The empty- and full-cell process shall be used for the Creosote and waterborne preservative treatments, respectively. Treatment shall be guaranteed to the extent that the average chemical retention will be as stated above.
D. Distribution System The distribution system shall be designed to permit flexible opera
tion of the tower and permit each cell to be taken out of the service individually.
The nozzle shall be a self-draining, nonclogging-type nonferrous material. All internal piping or header for multicells, if employed, shall be galvanized steel or cast iron.
Impregnated wood, glass-reinforced polyester or precast concrete are acceptable materials for water basin.
E. Drift Eliminators Eliminators shall be fabricated in easily removable panel sections
and so designed to limit the drift loss to less than 0.2% of the water flow: 1,.\,
1. In the counterflow design, where eliminators are subject to live loads, the racks shall be capable of supporting the weight of a man or 25 lb/ft'. The minimum thickness of wood slats shall be t inch.
2. In the crossflow design, where eliminators are not subject to live loads, the minimum dimension of each board shall be t inch.
F. Louvers Air inlet louver boards shall be easily removed to permit access to
the tower and designed for an even air distribution into the tower. Minimum thickness of louver board shall be I-inch nominal for wood and i-inch nominal for corrugated asbestos cement. Glass-reinforced polyester louvers may be employed.
G. Partitions Partition and air baffle walls shall be constructed of ~-inch net
wood or other approved material. In multicell towers, the transverse internal partition walls shall
extend to the full height of the tower. The longitudinal partition wall in "back-to-back" cell arrangements shall extend from the fan deck to the elevation of the distribution system and, in addition, an air baffle shall be provided to at least the height of the air inlet
174 COOLING TOWERS
louvers to prevent air from blowing through the louvered portion of the tower. The longitudinal partition wall in "in-line" cell arrangement shall consist only of an air baffle to the height of the air inlet.
H. Decks and Stacks
Fan and water distribution decks are to be of precast concrete and designed for a live load of 60 Ib/ft2 plus any conc~ntrated or distributed dead loads, such as fans, motors and maintenance equipment.
Stacks shall extend to a height of at least four feet above the fan deck, not only to provide protection for operating personnel, but to properly direct the discharge air upward and away from the cooling tower.
I. Hardware
Bolts, nuts, washers and timber connectors shall be (galvanized steel) (yellow brass) (Silicon bronze) (stainless steel). Anchor castings shall be cast iron unless nonferrous fasteners are specified, then anchor castings shall be red brass. Nails shall be copper or bronze.
1. Mechanical 4:quipment
l. Fans shall be of a design that has operated satisfactorily in cooling tower service for at least five years. The fans shall have a minimum of four blades of aluminum alloy, stainless steel, monel or equivalent. Plastic blades are not acceptable. Blades shall be adjustable for degree of pitch and shall be individually fastened to a hub of welded steel or cast iron (stainless steel optional at extra cost).
The fans shall be designed with a tip speed less than 12,000 ft/ min.
The noise level of the fans when measured on ground level 50 feet from the cooling tower shall not exceed 75 decibels on the International B Scale.
2. Gear Reducers shall be of the spiral bevel type or its equivalent. The speed reducers shall be especially designed for cooling tower service and rated in accordance with the standard practices of the American Gear Manufacturers' Association. A service factor of at least 2.0 shall be applied to the basic AGMA rating to correspond to continuous moderate-shock operation. Gears must conform to cooling tower Institute Standard STD-III, latest revision.
3. Motors shall be sqUirrel cage induction type with (totally enclosed, fan-cooled) (encapsulated) (splashproof) enclosure and roller-type bearings with NEMA Class A insulation. Motors shall be (single
MECHANICAL COMPONENTS OF COOLING TOWERS 175
speed) (two speed, one winding, variable torque) designed to operate on 400-V, 3-phase, 60-cycle current and designed for across-the-line starting.
4. Turbines shall be sllitable and guaranteed for continuous duty at the conditions of service specified by the purchaser. Turbines shall also be suitable and guaranteed for outdoor installation in cooling tower service. Materials of constructions shall be manufacturer's standard for the service conditions specified. Turbine accessories shall include a mechanical flyweight constant-speed governor, emergency-overspeed governor operating separate trip valve, a hand-speed changer, a corrosion-resistant steam strainer and a sentinel casing warning valve. All turbine pressure parts shall be hydro tested to 11- times the manufacturer's design pressure. Turbine rotor shall be statistically and dynamically balanced.
5. Flexible Coupled Shaft shall be provided to connect each motor and speed reducer assembly. The coupling flanges shall be (zincplated steel) (stainless steel) of the nonlubricated type with stainless-steel flexing disc rings. The shaft shall be hollow tube (stainless steel) (zinc-plated steel) of a sufficient size to adequately transmit the full rated motor horsepower. The shaft and coupling assembly shall be dynamically balanced.
6. Vibration cut-out switches shall be supplied and installed outside the fan ring for wiring by the purchaser to the motor energizing circuit.
7. Mechanical equipment supports 'of galvanized structural steel shall be supplied to properly mount the fan, gear and motor assemblies. Each framework shall form an integral unit and be laterally supported by galvanized steel members bolted to the tower posts.
K. Access A sufficient number of access doors, ladders and walkways shall
be provided for safe and easy accessibility to internals and mechanical equipment of the tower for inspection and maintenance. Access doors shall be tight, resistant and easy to operate. Access ladders from the ground should be located in such a position to permit future cell addition.
IV. GUARANTEE
A. Performance The cooling tower must be guaranteed to perform as specified
herein when tested in accordance with the Cooling Tower Institute Acceptance Test Procedure ATP-l 05, latest revision. Should the
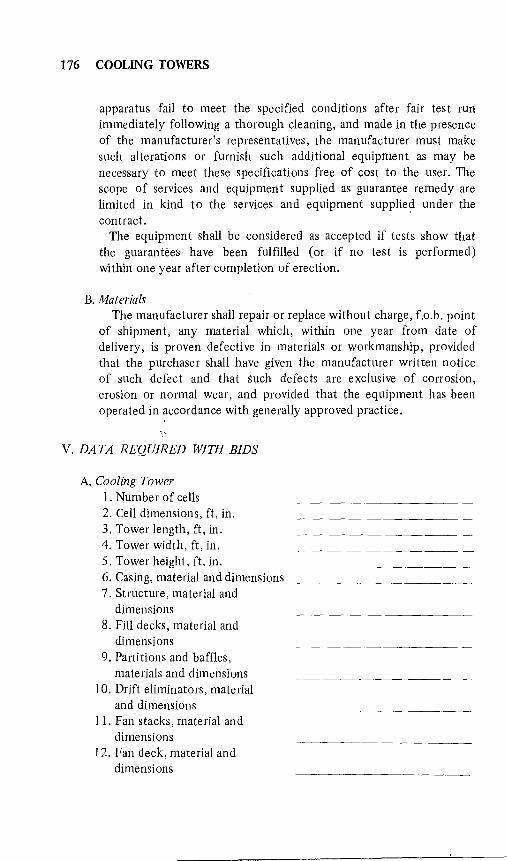
176 COOLING TOWERS
apparatus fail to meet the specified conditions after fair test run immediately following a thorough cleaning, and made in the presence of the manufacturer's representatives, the manufacturer must make such alterations or fUrnish such additional equipment as may be necessary to meet these specifications free of cost to the user. The scope of services and equipment supplied as guarantee remedy are limited in kind to the services and equipment supplie~ under the contract.
The equipment shall be considered as accepted if tests show that the guarantees have been fulfilled (or if no test is performed) within one year after completion of erection.
B. Materials The manufacturer shall repair or replace without charge, f.o.b. point
of shipment, any material which, within one year from date of delivery, is proven defective in materials or workmanship, provided that the purchaser shall have given the manufacturer written notice of such defect and that such defects are exclusive of corrosion, erosion or normal wear, and provided that the equipment has been operated in accordance with generally approved practice.
V. DATA REQUIRE,]] WITH BIDS
A. Cooling Tower 1. Number of cells 2. Cell dimensions, ft, in. 3. Tower length, ft, in. 4. Tower width, ft, in. 5. Tower height, ft, in. 6. Casing, material and dimensions 7. Structure, material and
dimensions 8. Fill decks, material and
dimensions 9. Partitions and baffles,
materials and dimensions 10. Drift eliminators, material
and dimensions 11. Fan stacks, material and
dimensions 12. Fan deck, material and
dimensions
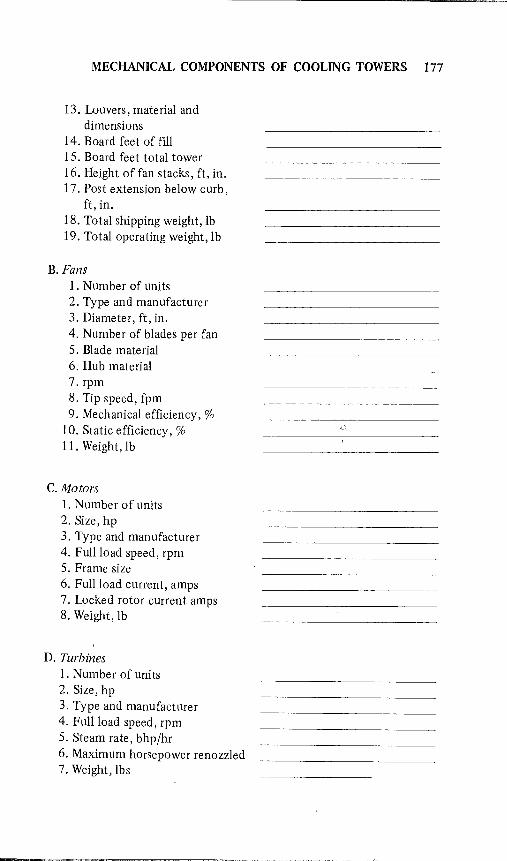
MECHANICAL COMPONENTS OF COOLING TOWERS 177
13. Louvers, material and dimensions
14. Board feet of fill IS. Board feet total tower 16. Height of fan stacks, ft, in. 17. Post extension below curb,
ft, in. 18. Total shipping weight, Ib 19. Total operating weight, lb
B. Fans 1. Number of units 2. Type and manufacturer 3. Diameter, ft, in. 4. Number of blades per fan S. Blade material 6. Hub material 7. rpm 8. Tip speed, fpm 9. Mechanical efficiency, 0/0
10. Static efficiency, 0/0 11. Weight, lb
C. Motors 1. Number of units 2. Size, hp 3. Type and manufacturer 4. Full load speed, rpm S. Frame size 6. Full load current, amps 7. Locked rotor current amps 8. Weight, lb
D. Turbines 1. Number of units 2. Size, hp 3. Type and manufacturer 4. Full load speed, rpm S. Steam rate, bhp/hr
6. Maximum horsepower renozzled 7. Weight, Ibs

178 COOLING TOWERS
E. Gear Reducers 1. Number of units 2. Type and manufacturer 3. Rating, hpa 4. Shafts, material 5. Coupling flanges, material 6. Flexing elements, material
F. Drive Shafts and Couplings 1. Number of units 2. Type and manufacturer 3. Rating, hpa 4. Shafts, material 5. Coupling flanges, material 6. Flexing elements, material
G. Miscellaneous Equipment 1. Mechanical equipment
supports, material 2. Vibration cut-out switches,
included' 3. Derrick [Sr handling mechanical
equipment, included
H. Distribution System 1. Number and size of inlet flanges 2. Height of water inlet above curb,
ft, in. 3. Header material 4. Lateral material 5. Nozzle, or dowl)spout material
1. Design Performance 1. Pumping head from top of
basin curb, ft 2. Spray loss, max. % 3. Evaporation loss, max. % 4. Fill wetted surface, ft2 5. Total wetted surface, ft 2
6. Effective splash surface, ft2 7. Effective cooling volume, ft3
(from eliminators to water level)
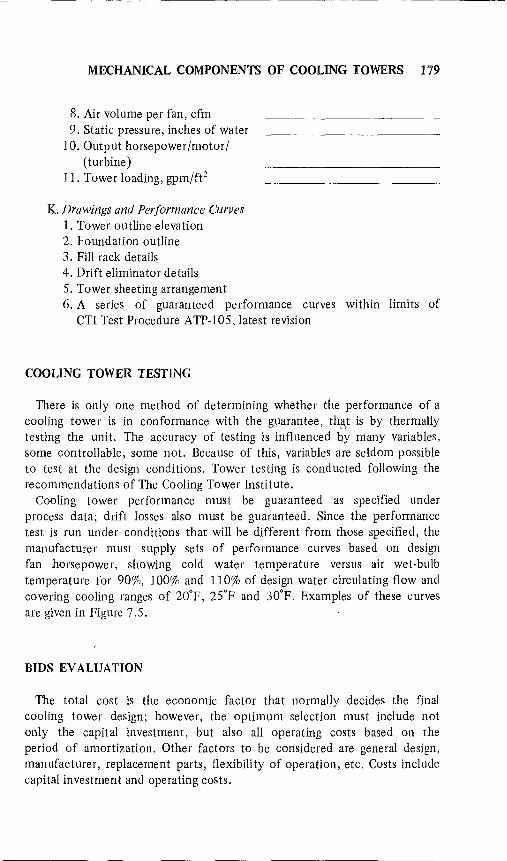
MECHANICAL COMPONENTS OF COOLING TOWERS 179
8. Air volume per fan, cfm 9. Static pressure, inches of water
10. Output horsepower/motor/ (turbine)
11. Tower loading, gpm/ft2
K. Drawings and Performance Curves 1. Tower outline elevation 2. Foundation outline 3. Fill rack details 4. Drift eliminator details 5. Tower sheeting arrangement 6. A series of guaranteed performance curves within limits of
CTI Test Procedure ATP-lOS, latest revision
COOLING TOWER TESTING
There is only one method of determining whether the performance of a cooling tower is in conformance with the guarantee, thCl,t is by thermally testing the unit. The accuracy of testing is influenced by many variables, some controllable, some not. Because of this, variables are seldom possible to test at the design conditions. Tower testing is conducted following the recommendations of The Cooling Tower Institute.
Cooling tower performance must be guaranteed as specified under process data; drift losses also must be guaranteed. Since the performance test is run under conditions that will be different from those specified, the manufacturer must supply sets of performance curves based on design fan horsepower, showing cold water temperature versus air wet-bulb temperature for 90%, 100% and 110% of design water circulating flow and covering cooling ranges of 20°F, 25°F and 30°F. Examples of these curves are given in Figure 7.5.
BIDS EVALUATION
The total cost is the economic factor that normally decides the final cooling tower design; however, the optimum selection must include not only the capital investment, but also all operating costs based on the period of amortization. Other factors to be considered are general design, manufacturer, replacement parts, flexibility of operation, etc. Costs include capital investment and operating costs.
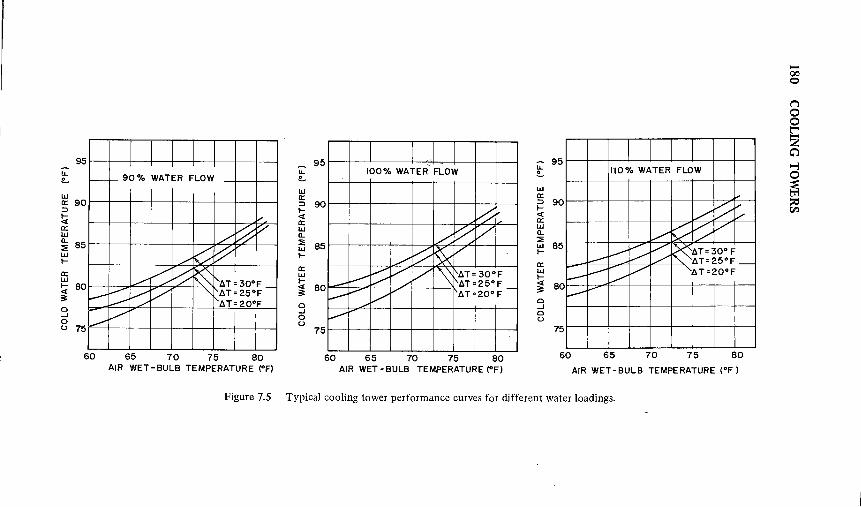
95
"-° ~
LLJ IX: 90 ::> ~ <t IX: LLJ a..
85 ::E LLJ ~
IX: LLJ ~ 80 <t ;;: V 0 ...J 0 u 75 ---
60
j- 90% WATER FLOW
, 100% WATER FLOW
95 "-~
1-10% WATER FLOW "-95
~
V_
./. ~ V
./ l-::::: ~ ~ l--::: ~ ~ l't.T = 30°F
V ~ V " t.T=25°F-L---- t.T=20°F
V I
~ /. ~ V
./ r::::: ~ V
V t;:: V V ""\ t.T= 30°F - ./ t.T=25°F
V V V t.T=20°F -
V
LLJ IX: ::> 90 ~ <t IX: LLJ a.. ::E 85 LLJ ~
IX: LLJ ~ <t 80 ;;: 0 ...J 0 u
75
~
V t:/ J..-V
V ~ ~ V
V V ~ ~t.T=30°F --- I"- t.T=25°F_
V V V V t. T=20°F
1--....
LLJ IX: ::> 90 ~ <t IX: LLJ a.. :::;: LLJ 85 ~
IX: LLJ ~ <t 80 ;;: 0 ...J 0 U
75
65 70 75 80 60 65 70 75 80 60 65 70 75 80
AIR WET - BULB TEMPERATURE (OF) AIR WET-BULB TEMPERATURE (OF) AIR WET-BULB TEMPERATURE (OF)
Figure 7.S Typical cooling tower performance curves for different water loadings.
-00 o
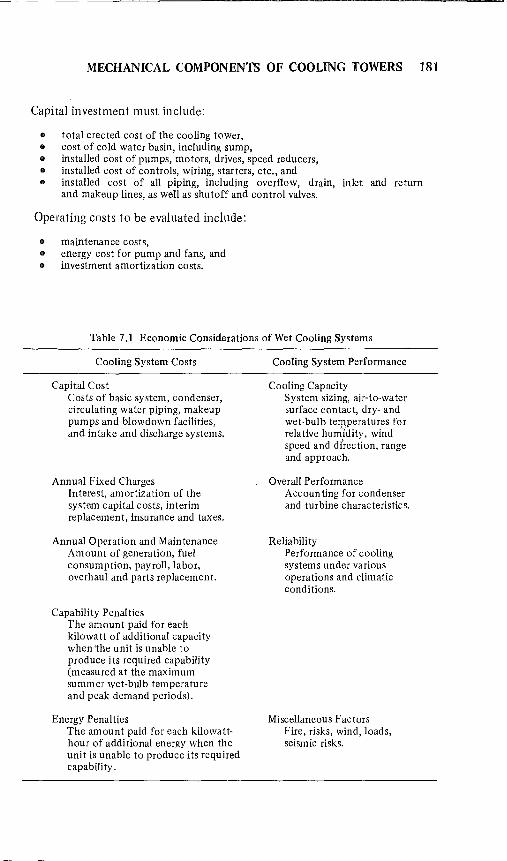
MECHANICAL COMPONENTS OF COOLING TOWERS 181
Capital investment must include:
II total erected cost of the cooling tower, II cost of cold water basin, including sump, II installed cost of pumps, motors, drives, speed reducers, II installed cost of controls, wiring, starters, etc., and II installed cost of all piping, including overflow, drain, inlet and return
and makeup lines, as well as shutoff and control valves.
Operating costs to be evaluated include:
II maintenance costs, II energy cost for pump and fans, and II investment amortization costs.
Table 7.1 Economic Considerations of Wet Cooling Systems
Cooling System Costs
Capital Cost Costs of basic system, condenser, circulating water piping, makeup pumps and blowdown facilities, and intake and discharge systems.
Annual Fixed Charges Interest, amortization of the system capital costs, interim replacement, insurance and taxes.
Annual Operation and Maintenance Amount of generation, fuel consumption, payroll, labor, overhaul and parts replacement.
Capability Penalties The amount paid for each kilowatt of additional capacity when 'the unit is unable to produce its required capability (measured at the maximum summer wet-bulb temperature and peak demand periods).
Energy Penalties The amount paid for each kilowatthour of additional energy when the unit is unable to produce its required capability.
Cooling System Performance
Cooling Capacity System sizing, air-to-water surface contact, dry- and wet-bulb temperatures for rela tive huml'dity, wind speed and direction, range and approach.
Overall Performance Accounting for condenser and turbine characteristics.
Reliability Performance of cooling systems under various operations and climatic conditions.
Miscellaneous Factors Fire, risks, wind, loads, seismic risks.
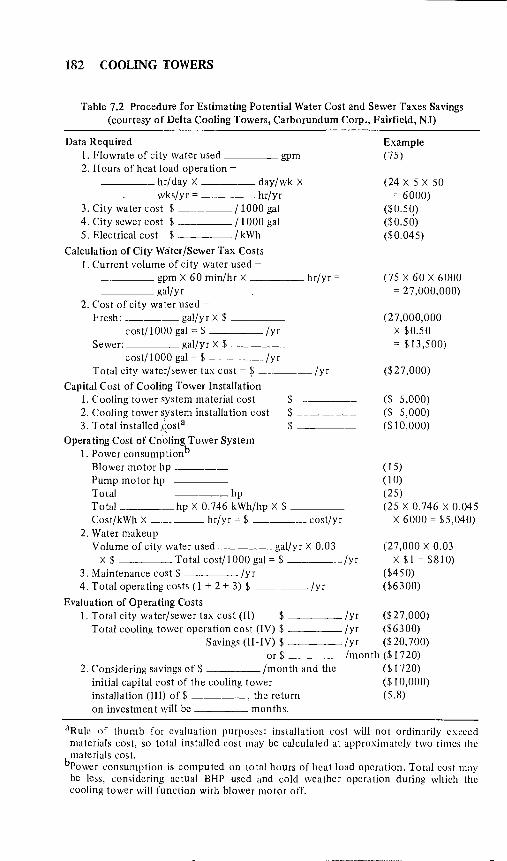
182 COOLING TOWERS
Table 7.2 Procedure for Estimating Potential Water Cost and Sewer Taxes Savings (courtesy of Delta Cooling Towers, Carborundum Corp., Fairfield, NJ)
Data Required I. Flowrate of city water used ____ gpm 2. Hours of heat load operation -
____ hr/day X _____ day/wk X ____ wks/yr = hr/yr
3. City water cost $ /1000 gal 4. City sewer cost $ /1000 gal 5. Electrical cost $ /kWh
Calculation of City Water/Sewer Tax Costs I. Current volume of city water used -
____ gpm X 60 min/hr X ____ hr/yr =
____ gal/yr 2. Cost of city water used -
Fresh: ___ gal/yrX $ ___ _ cost/IOOO gal = $ ____ /yr
Sewer: gal/yr X $ ___ _ cost/IOOO gal = $ ____ /yr
Total city water/sewer tax cost = $ ____ /yr
Capital Cost of Cooling Tower Installation 1. Cooling tower system material cost $ ____ _ 2. Cooling tower system installation cost $ ____ _ 3. Total installed ~osta $ ____ _
Operating Cost of Co\~ling Tower System 1. Power consumptionb
Blower motor hp ---Pump motor hp Total hp Total _____ hp X 0.746 kWh/hp X $ ___ _
Cost/kWh X hr/yr = $ cost/yr 2. Water makeup
Volume of city water used gal/yr X 0.03 X $ Total cost/IOOO gal = $ /yr
3. Maintenance cost $ /y r 4. Total operating costs (1 + 2 + 3) $ _____ /yr
Evaluation of Operating Costs
Example (75)
(24 X 5 X 50 = 6000)
($0.50) ($0.5(l) ($0.045)
(75 X 60 X 6000 = 27,000,000)
(27,000,000 X $0.50 = $13,500)
($27,000)
($ 5,000) ($ 5,000) ($10,000)
(15) (10) (25) (25 X 0.746 X 0.045
X 6000 = $5,040)
(27,000 X 0.03 X $1 = $810)
($450) ($6300)
I. Total city water/sewer tax cost (II) $ ____ /yr ($ 27,000) Total cooling tower operation cost (IV) $ /yr ($6300)
Savings (II-IV) $ /yr ($20,700) or $ /month ($1720)
2. Considering savings of $ /montl1 and the ($1720) initial capital cost of the cooling tower ($10,000) installation (Ill) of$ , the return (5.8) on investment will be months.
aRulc of thumb for evaluation purposes: installation cost will not ordinarily exceed materials cost, so total installed cost may be calculated at approximately two times the materials cost.
bPower consumption is computed on total hours of heat load operation. Total cost may be less, considering actual BHP used and cold weather operation during which the cooling tower will function with blower motor off.
MECHANICAL COMPONENTS OF COOLING TOWERS 183
COOLING TOWER ECONOMICS
The cost of cooling tower systems can be divided into five general categories, namely, capital cost, annual fixed charges, annual operation and maintenance, capability penalties, and replacement energy costs. Selection of the optimum tower is based on a proper balance among capital investment, operating costs, performance, and potential environmental and social impacts. Table 7.1 summarizes the major economic considerations for evaluating wet cooling systems.
An important factor that should be considered in the economic analysis is the potential savings of water costs and sewer taxes that could be realized by choosing one system over another. Table 7.2 outlines a good procedure for estimating potential water cost savings.
REFERENCES
l. Cheremisinoff, N. P., and P. N. Cheremisinoff. Fiberglass-Reinforced Plastics Deskbook (Ann Arbor, MI: Ann Arbor Science Publishers, Inc., 1978).
SUGGESTED READING
I. Cheremisinoff, N. P. Applied Fluid FlolV Measurement-Fundamentals and Technology (New York: Marcel Dekker; Inc., 1979).
2. Cheremisinoff, P. N., and R. A. Young. Pollution Engineering Practice Handbook (Ann Arbor, MI: Ann Arbor Science Publishers, Inc., 1975).
3. Monroe, R. C. "Fans-Key to Optimum Cooling Tower Design," Oil Gas J., (May 27,1974).
4. Strauss, S. "Guide to Evaluate Cooling Tower Performance," Power (October 1975).

This page intentionally left blank
CHAPTER 8
COOLING TOWER WATER TREATMENT
INTRODUCTION
Water has experienced extensive use in cooling operations, both because it is an excellent cooling medium and because it is relatively inexpensive. All natural waters do, however, contain dissolved solids, gases and a variety of suspended matter in different amounts. These contaminants can be the source of varying operating problems. Bicarbonates and sulfates of calcium, sodium and iron are the most common dissolved solids. The amount of each will depend on their abundance in the earth at the source of the water. Carbon dioxide is the most common of the dissolved gases found in water and the highest concentrations exist in waters from shallow wells and lakes due to decay processes. Suspended solids may consist of silt and a variety of organic constituents. All water systems are capable of developing algae and slimes in varying degrees if environmental conditions are proper.
The presence of suspended and dissolved matter can lead to precipitation under the proper conditions causing severe scaling or fouling problems in process equipment and distribution systems. High concentrations of suspended matter can result in erosion. Both problems can be translated into lost dollars because of costly maintenance and downtimes for equipment replacement. In the case of organic constituents, the ideal environment for microorganisms to grow can exist, posing serious health hazards in certain applications.
Because of the inherent problems of scale formation and potential health hazards in some applications, cooling tower water treatment must be carefully considered in the overall cooling system design.
185
186 COOLING TOWERS
PROBLEMS INHERENT TO WATER CONTAMINANTS
In addition to the common minerals absorbed from the soil, natural waters can also be affected by industrial drainage, often resulting in acidic conditions. Faulty processing equipment may introduce a variety of contaminants such as oils, fats, acids, alkalies and hydrocarbons directly into the cooling system. Undesirable airborne contaminants, such as hydrogen sulfide and acid vapors released by processing equipment and fly ash from' coal-burning furnaces, may be drawn into the tower and dissolved in the circulating water. Without proper co'ntrol, the presence of any of these materials may cause corrosion of metal parts, wood deterioration or loss in thermal performance throughout the entire cooling system.
There are five types of cooling water problems encountered in cooling tower systems. These are: scale formation, corrosion, organic (algae and bacteria slime) growths, suspended (sand, mud, silt, etc.) matter and oil leakage. With the exception of oil leakage, these problems can be controlled to a certain extent by standard water treatment techniques. Different types of treatment have been employed with various degrees of success. Treatments employed include using a circulating system with a small quantity of treated makeup water, with or without the addition of chemical inhibitors to the circulating water..:Another method of controlling contaminations and scale
.' formation is the use of alloy tubes. Unfortunately, this is an expensive solution and often one that is difficult to justify economically.
In addition to the first four problems, which are of water origin, oil leakage into the water also causes problems. Oil will interfere with other treatments employed. It is therefore desirable to eliminate oil leakage as much as possible by repairing leaks as soon as they develop.
Due to evaporation, salts contained in the water tend to concentrate and could precipitate, causing scale in the system. The scaling tendency of the circulating water can be controlled by an appropriate blowdown to lower the salt content, and by the addition of treating chemicals. These chemicals are inhibitors that prevent precipitation from occurring. The corrosion problems encountered in evaporative cooling water systems concern the cooling circuit (i.e., exchangers, piping, etc.) and the cooling tower itself.
Oxygen, carbon dioxide and various chemicals used to reduce scaling can cause corrosion. Corrosion control is provided largely by the use of inhibitors such as chromates, polyphosphates, silicates and alkalies.
Corrosion within the tower itself is due mainly to the particular conditions existing therein (air, humidity and temperature) and also to the chemical treatment of the water. All construction materials exposed to these conditions must be selected carefully. Hardware and piping for distribution headers have been successfully made with hot-dipped galvanized steel, cadmiumcoated steel, stainless steel and silicon bronze.
COOLING TOWER WATER TREATMENT 187
Scaling and corrosion are related phenomena. The properties of water influencing both are the calcium hardness, alkalinity, total dissolved solids, pH and temperature. Theoretically, the above conditions can be controlled so that the water is in equilibrium and neither corrosion nor scaling results. In practice, however, this equilibrium is difficult to achieve since it is a border condition, and a delicate balance must be maintained.
Water corrosion of iron and steel is simply oxidation of the metal forming iron oxide by galvanic action. The rate of oxidation is faster at higher oxygen concentrations. This is why corrosion is more of a problem in recirculating cooling water systems than in once-through systems. Likewise, the rate of attack is higher for waters of higher acidity because a low-pH water is a better electrolyte. Therefore, increasing the pH up to the equilibrium point decreases corrosion. However, increasing the pH further causes scale formation.
The principal scale-forming material in cooling systems is calcium carbonate, which has a solubility of about 15 ppm and is formed by the decom position of calcium bicarbonate.
Scaling results when the solubility limit of calcium carbonate is reached, at which point precipitation onto tube surfaces occurs. The extent of calcium carbonate precipitation is a function of the composition of the water and the temperature. The alkalinity, dissolved solids and pH determine the scaling characteristics. Decreasing the pH by the direct audition of acid or by carbonization will decrease the scaling tendencies of the water within limits. If a water is on the scaling side of equilibrium, increasing the temperature will increase the scale deposition ..
Calcium carbonate scale is objectionable because of the resistance offered to heat transfer in heat exchanger equipment. It is of interest to point out that increasing the temperature will increase the rates of scaling and corrosion. Scaling and corrosion are not likely to ocCUr simultaneously, although it is possible owing to temperature differences in the system. The water could be on the corrosive side at the inlet and on the scaling side at the outlet. If water is close to this equilibrium condition, the rates of corrosion and scaling would exist, but are likely to be very small.
Corrosion is less of a problem in once-through cooling water systems, where the oxygen content is relatively low. Likewise, scaling is less of a problem in once-through systems than in recirculating systems because the water has not been concentrated, as in the recirculating case. In recirculating systems, the water is reaerated in cooling towers, which makes it more aggressive from the standpoint of corrosion. The purpose in using circulating cooling systems is to conserve makeup water; however, this is difficult to achieve because of the dissolved solids concentrate buildup from evaporation losses. .
188 COOLING TOWERS
Summarizing the above discussion, the dissolved mineral matter in most natural waters consists mainly of calcium in the form of bicarbonate or temporary hardness and chlorides and sulfates as permanent hardness. The tendency of the water to deposit scale when made alkaline by heating or to attack metals corrosively depends on the balance of these various constituents.
The scale formed under moderate temperatures is usually due to temporary (bicarbonate) hardness being converted into calcium carbonate, which occurs on heating or increase in alkalinity sufficient to result in calcium carbonate saturation. The soI'ubility of calcium carbonate also affects corrosion since the alkalinity of dissolved carbon dioxide in the water is greatly reduced as the saturation equilibrium is approached. Ideally, at equilibrium the various forms of carbon dioxide (free CO 2 , bicarbonate and carbonate) are so balanced that they cause neither scale nor corrosion.
PRETREATMENT OF COOLING WATER SYSTEMS
The prevention of scale formation and corrosion is common to all heat transfer equipmen,t, not just cooling towers. The need for protecting metal surfaces against cqrrosion in cooling water systems is essential to achieving maximum system efficiency and equipment life. Corrosion that is inadequately controlled can lead to irreversible equipment damage and costly unscheduled unit outages for cleaning operations or equipment replacement. Unscheduled shutdowns can seriously undermine plant efficiency and productivity.
Effective corrosion control programs are essential in reducing unit downtimes. To be effective, the program must address not only specific corrosion problems, but anticipate and prevent them as well. Consequently, effective pretreatment in addition to other corrosion control measures is important.
Corrosion control of metal surfaces depends on the formation and maintenance of a protective corrosion inhibitor film on the exposed metal surface. This protective film may be established during normal application of a corrosion inhibitor program; however, there will be some lag time before the film is completely built up. Metal surfaces that are exposed to the cooling water before the film is completed may become candidates for accelerated corrosion during the initial system operation. Normally, localized corrosion or pitting is common during these early stages of operation.
Allowing a unit to undergo no treatment for periods of time before being placed into operation can result in severe damage to exposed metal surfaces. In addition to the loss of the metal and shortened equipment life, voluminous and porous corrosion by-products may form and actually act as a barrier to the formation of the protective inhibitor film.
COOLING TOWER WATER TREATMENT 189
In dealing with metal water cooling systems, today's trend is toward the use of nonchromate-based treatment chemicals. Nonchromate applications rely on less tenacious films for corrosion protection, rather than conventional chromate systems. As such, it is extremely important that the corrosion protection film be established very early in the operation.
We can define pretreatment as the initial conditioning period whereby a corrosion inhibitor is applied to the metal surfaces of the cooling system. Pretreatment conditions must be conducive to the rapid formation of the protective barrier. The conditioning procedure should involve (1) the cleaning and preparation of metal surfaces, and (2) the actual application of higher than normal inhibitor concentrations.
The cleaning and passivation can be done separately or in a combined step. There are several procedures that can be employed to clean metal surfaces. Common techniques include hydroblasting, treatment with a mild inhibited acid cleaner and/or alkaline cleaner, and the use of special surfactants during cleansing. The system must be flushed thoroughly after the cleaning stage to minimize undue metal attack by residual concentrations of cleaning chemicals.
Chemical passivation should be started as soon as possible after the cleaning of metal surfaces. Accumulation of new corrosion products can occur if it is not initiated soon after cleaning. It may be achieved by 'treating equipment either on- or offline.
Online passivation involves elevating the corrosion inhibitor concentration as high as three times normal maintenance levels. At higher concentrations, the rate at which the protective film forms is accelerated. This, in turn, reduces the degree of initial corrosion on clean but unprotected metal surfaces. The rate at which corrosion protection takes place depends on the temperature, pH and inhibitor used.
Offline passivation involves treatment of equipment currently out of service. Treatment levels are typically higher; consequently, passivation is completed more quickly. Passivation of nonchromate treatment generally uses either a polyphosphate, zinc, molybdate or other nonchromate-based inhibitor in combination with various surface-active cleaning agents. The passivation solution should be disposed of after the pretreatment stage, rather than' dumped back into the cooling system where the potential for fouling can exist due to the precipitation of pretreatment compounds such as zinc or phosphate. Table 8.1 outlines both online and offline pretreatment procedures.
The first methods of cooling tower corrosion control involved adding several hundred parts per million of sodium chromate, as chromate is capable of excellent anodic corrosion control at these dosages. However, these early programs were both inefficient and expensive. The advent of synergized zinc chromate-polyphosphate treatments not only made corrosion control more

190 COOLING TOWERS
Table 8.1 Pretreatment Procedures
Online Pretreatment Procedures
I. Increase inhibitor concentration to 2-3 times its normal level.
2. Circulate the high inhibitor concentration slurry for 4-12 hours. Maintain pH between 6 and 7 and temperatures between 49 and 60°C. If ambient temperatures must be used, increase the pretreatment period to 24-48 hours.
, 3. After passivation, the system should be deconcentrated. Reduce the inhibitor concen
tration to normal maintenance levels.
4. Initiate normal treatment program.
Offline Passiva tion Procedures
1. Thoroughly clean system of all dirt, oil, scale, organics and corrosion by-products.
2. After system cleaning, refill with fresh water. Add the pretreatment formulation to the required concentration level.
3. Circulate the solution throughout the unit, maintaining pH levels between 6 and 7. Circulation should continue for 2-12 hours at temperatures between 49 and 60°C.
4. After passivation, remove the pretreatment solution and replace it with normally treated cooling water.
5. Place unit back online and resume normal service.
effective, but also lowered its cost. Excellent corrosion control requires only 30-60 ppm of inhibitor, instead of a concentration one to two orders of magnitude higher.
Polyphosphates are also used in cooling systems to attain sufficient corrosion control. Cooling towers are operated in a pH range of 6.0 to 7.5 to provide optimum stability for the polyphosphate. The feasibility of cooling tower operation at higher pH levels, in which the potential for corrosion is decreased, has increased the popularity oflow-chromate programs.
CORROSION DETECTION
Corrosion detection plays an important role in any corrosion control program. Most of the methods employ nondestructive test methods and include: hydrogen evaluation, radiography, dynamic pressure, corrosion probes, strain gauges and eddy current measurements. Of these, the methods employed in cooling tower practice are hydrogen evaluation and corrosion probes.
Hydrogen evaluation is used to detect corrosion in closed systems at low or slightly elevated temperatures in aqueous environments. Sensitive detectors
-----------------
COOLING TOWER WATER TREATMENT 191
are available to detect the presence of hydrogen, which is a by-product of most aqueous corrosion processes. This method cannot locate the corrosion but can predict the approximate total corrosion rate.
Corrosion probes detect and measure the amount of corrosion occurring at a given point in a system and can be used to estimate the total amount of corrosion and the type of corrosion anticipated. Probes are available for use in a wide variety of temperature and pressure conditions.
METHODS OF EVALUATING COOLING WATER INHIBITORS
There are three methods available for evaluating cooling water inhibitors. These are laboratory methods, service exposure and sample exposure.
Laboratory Methods
In general, these methods are unreliable and often give misleading results.
Actual Service Exposure
The most reliable evaluation can be obtained by this m,ethod; however, it can be very expensive and usually only few materials can be evaluated.
Exposing Sample Materials
This method involves the assembly of several specimens in the form of a corrosion test spool. Test specimens are weighed before and after exposure in the actual service where data are urgently needed.
Unfortunately, there are no commonly accepted standard procedures for securing reliable corrosion data. Any data collected from any test methods will have value only if they can be interpreted properly. Many corrosion environments can vary widely from day to day and even from hour to hour. Even slight variations in operating procedures can drastically affect the corrosion characteristics of the cooling tower. Therefore, it is important to establish methods on how the corrosion data are to be accumulated, evaluated and put to use.
LANGELIER AND RYZNAR EQUATIONS: SATURATION AND STABILITY INDEX
A convenient method of interpreting water analysis for the purpose of determining the calcium carbonate solubility equilibrium conditions is embodied in the Langelier equation. The Langelier equation can be used to

192 COOLING TOWERS
detennine the carbonate stability or corrosive properties of a cooling water for a specific temperature when the contents of dissolved solids, total calcium, total alkalinity and pH values are known.
The Saturation Index is the difference between the actual measured pH and the calculated pH's at saturation with calcium carbonate:
Saturation Index I = pH (actual) - pH's (Langelier equation) , (8.1)
where
pH = (9.3 + A + B) - (C + D)
where A = total solids, ppm B = temperature, 0 F C = calcium hardness, expressed as ppm CaCO, D = alkalinity, expressed as ppm CaCO,
(8.2)
If the Saturation Index is 0, water is said to be in chemical balance. If the Saturation Index is positive, scale-forming tendencies are indicated. Finally, if the Saturation Index is negative, corrosive tendencies are indicated.
The Ryznar equ(ition was developed to provide a closer correlation between the calculated prediction and the quantitative results obtained in the field.
Stability Index = 2 pH's - pH (actual) (Ryznor equation) (8.3)
For Equation 8.3:
I. If the Stability Index is 6.5, the water is scale formi11g. 2. If the Stability Index ranges from 6.5 to 7.0, the water is in a good range. 3. If the Stability Index is 7.0, the water is corrosive.
The optimum value for the Stability Index is 6.6. However, these convenient indexes must serve strictly as guides rather than
as absolute control methods, the reason being that uneven temperatures exist throughout a cooling system. Because of this, some exchangers will scale, some will be protected, while still others will corrode.
Note that the pH (actual) is the Log of the hydrogen ion concentration.
ORGANIC GROWTHS
Organic matter also aggravates scaling and fouling conditions in cooling systems by combining with silt and/or calcium carbonate to plug up or scale
COOLING TOWER WATER TREATMENT 193
up equipment, thus reducing the effectiveness of the heat transfer surface. Microbiological growths on heat exchangers retard cooling, cut plant efficiency and increase maintenance cost. Iron- and sulfur-reducing bacteria are often a direct cause of corrosion. Algae growths can occur in all types of heat exchangers. Chlorine and chlorinated organic compounds are the most commonly used chemicals to prevent attack from bacteria and algae. Fungus and other forms of microorganisms can biologically attack the wood inside the cooling tower. This problem can be minimized by the use of impregnated cooling tower lumber.
Undissolved solids or suspended matter plug up cooling and condensing equipment, as well as fill up the cooling tower with silt and mud, which can lead to pumping problems. In addition, suspended matter aggravates scaling conditions in cooling water because silt and mud combine physically with the calcium carbonate to produce a thicker and softer scale than would be formed by calcium carbonate alone. This interferes with heat transfer and water flow. Normally, these are eliminated by continuous filtration.
LEGIONNAIRES' DISEASE
Following the American Legion Convention at a Philadelphia hotel in July 1976, the public first became aware of a new type of disease (Legionnaires' Disease). Of the 221 cases of Legionnaires' Disease, 34 resulted in death. Since that date, the Center for Disease Control in Atlanta, Georgia has isolated and confirmed that a bacteriuni microorganism had produced the illness in Philadelphia and at least eleven other locations.
The Legionnaires' Disease organism was discovered breeding in cooling water at several locations where the disease broke out. The conditions for this bacteria to turn lethal were created when the energy crisis of 1973 imposed conservation measures on water usage.
More and more water is now being recycled. Reducing cooling tower blowdown increases the volume of suspended solids, mineral and salts, and as the cycles of concentration become higher, the pH and nutrient levels for biological growth increases. The temperature of hot water return to the tower, normally around 120-130°F, creates an ideal condition for the breeding and rapid reproduction of different organisms.
Legionnaires' Disease organism may exist in the ground water and even in the air. The bacterium is in a dormant state until ideal life conditions appear. Once the bacterium enters the environment of the cooling tower, it can reproduce very rapidly by binary fission, creating a potential disease outbreak. It can be carried away by blowdown or windage droplets, and unless the water treatment expert develops a comprehensive program to minimize the possibility of the bacterium breeding in the cooling system,

194 COOLING TOWERS
another outbreak is inevitable. Biocides are required and must be monitored continually to ensure that the proper rate is maintained in the cooling water.
WATER ANALYSIS AND TREATMENT
For control of scaling, corrosion, and algae and bacterial growth, the cooling tower water supply must be analyzed and properly treated. Water analysis covers three areas: water hardness, alkalinity and detection of inerts.
Hardness can be distinguished in the following:
" Carbonate Hardness. This is the presence of calcium (Ca) and magnesium (Mg) carbonate and bicarbonate.
" Noncarbonate Hardness. This is the presence of other salts of C'a and Mg. " Total Hardness. This is the sum of the carbonate and noncarbonate hardness. " Temporary Hardness. This is the presence of C'a and Mg bicarbonate and can
be eliminated by boiling the water to transform bicarbonate into insoluble carbonate. Temporary hardness is slightly different from carbonate hardness because it does not take into account the presence of carbonate, which is only slightly soluble.
" Permanent Hardness. This is Ca and Mg residue in the water after boiling and differs from noncarbonate hardness because it also measures the carbonate remaining in solution.
The normal units,:used to measure water hardness are:
" French degrees = g CaCO,/100 I water " German degrees = g CaO/100 I water " English degrees = g CaCO,/l imp. gal water
The value of the different degrees are:
" 1° French = 10 ppm CaCO, " 1° German = 1.78° French = 17.8 ppm CaCO, " 1 ° English = 1.43 French 14.3 ppm CaCO,
With respect to total hardness, makeup water can be classified as follows:
Very Soft Soft Medium Hard Hard Very Hard
Total Hardness (ppm CaCO,)
15 15-50 50-100
100-200 200
Alkalinity is a measure of the concentration of all electrolytes that give basic reaction when hydrolyzed in water, i.e., salts of strong bases and weak acids (hydrates, carbonates, bicarbonates, phosphates, silicates, borates, sulfites, etc.). Chlorides and sulfates do not contribute to alkalinity. The
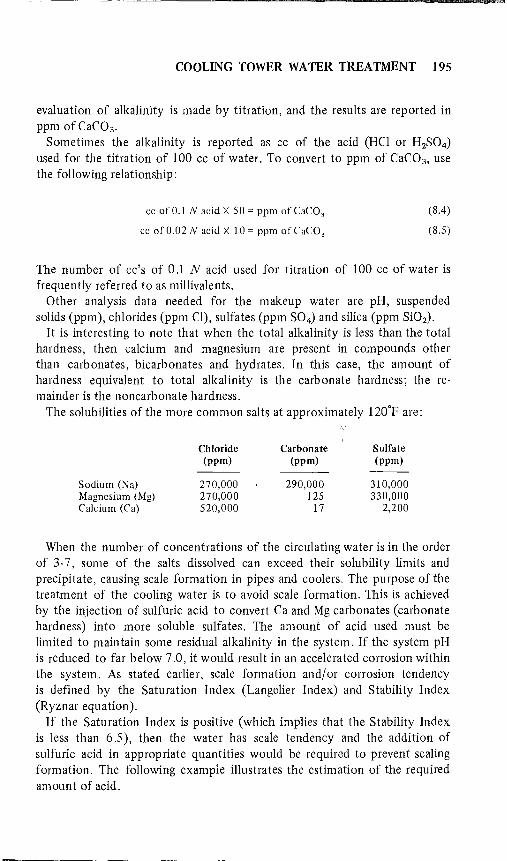
COOLING TOWER WATER TREATMENT 195
evaluation of alkalinity is made by titration, and the results are reported in ppm of CaC0 3 .
Sometimes the alkalinity is reported as cc of the acid (HCl or H2S04) used for the titration of 100 cc of water. To convert to ppm of CaC0 3 , use the following relationship:
cc of 0.1 N acid X 50 = ppm of CaCO,
cc ofO.02N acid X 10 = ppm ofCaC0 3
(8.4)
(8.5)
The number of cc's of 0.1 N acid used for titration of 100 cc of water is frequently referred to as millivalents.
Other analysis data needed for the makeup water are pH, suspended solids (ppm), chlorides (ppm Cl), sulfates (ppm S04) and silica (ppm Si02).
It is interesting to note that when the total alkalinity is less than the total hardness, then calcium and magnesium are present in compounds other than carbonates, bicarbonates and hydrates. In this case, the amount of hardness equivalent to total alkalinity is the carbonate hardness; the remainder is the noncarbonate hardness.
The solubilities of the more common salts at approximately 120°F are:
Chloride Carbonate Sulfate (ppm) (ppm) (ppm)
Sodium (Na) 270,000 290,000 310,000 Magnesium (Mg) 270,000 125 330,000 Calcium (Ca) 520,000 17 2,200
When the number of concentrations of the circulating water is in the order of 3-7, some of the salts dissolved can exceed their solubility limits and precipitate, causing scale formation in pipes and coolers. The purpose of the treatment of the cooling water is to avoid scale formation. This is achieved by the injection of sulfuric acid to convert Ca and Mg carbonates (carbonate hardness) into more soluble sulfates. The amount of acid used must be limited to maintain some residual alkalinity in the system. If the system pH is reduced to far below 7.0, it would result in an accelerated corrosion within the system. As stated earlier, scale formation and/or corrosion tendency is defined by the Saturation Index (Langelier Index) and Stability Index (Ryznar equation). If the Saturation Index is positive (which implies that the Stability Index
is less than 6.5), then the water has scale tendency and the addition of sulfuric acid in appropriate quantities would be required to prevent scaling formation. The following example illustrates the estimation of the required amount of acid.
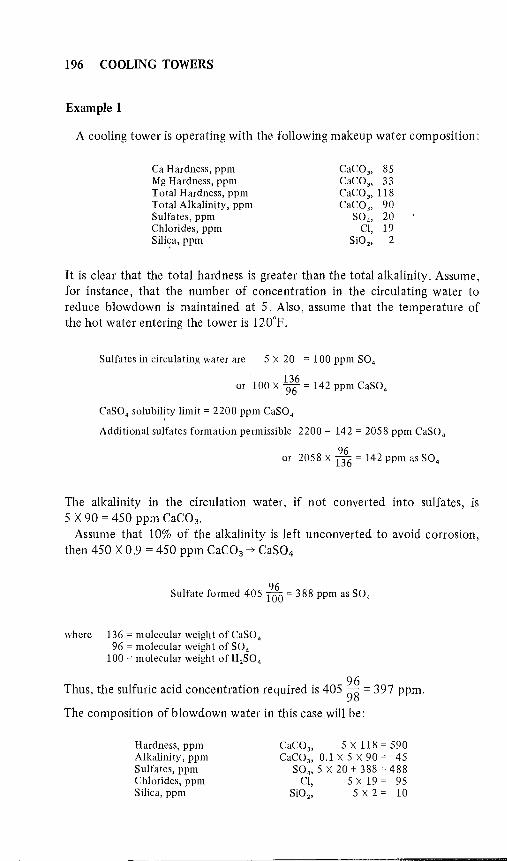
196 COOLING TOWERS
Example 1
A cooling tower is operating with the following makeup water composition:
Ca Hardness, ppm Mg Hardness, ppm Total Hardness, ppm Total Alkalinity, ppm Sulfates, ppm Chlorides, ppm Sili~a, ppm
CaCO" 85 CaCO" 33 CaCO" 118 CaC0 3 , 90
S04' 20 Cl, 19
SiO" 2
It is clear that the total hardness is greater than the total alkalinity. Assume, for instance, that the number of concentration in the circulating water to reduce blowdown is maintained at 5. Also, assume that the temperature of the hot water entering the tower is 120°F.
Sulfates in circulating water are 5 X 20 = 100 ppm S04
, 136 or 100 X % = 142 ppm CaSO,
CaS04 solubility limit = 2200 ppm CaS0 4
Additional sulfates formation permissible 2200 - 142 = 2058 ppm CaS0 4
96 or 2058 X 136 = 142 ppm as S04
The alkalinity in the circulation water, if not converted into sulfates, is 5 X 90 = 450 ppm CaC0 3 .
Assume that 10% of the alkalinity is left unconverted to avoid corrosion, then 450 X 0.9 = 450 ppm CaC03 -+ CaS04
96 Sulfate formed 405 100 = 388 ppm as S04
where 136 = molecular weight ofCaSO. 96 = molecular weight of SO.
100 = molecular weight of H,S04
Thus, the sulfuric acid concentration required is 405 :~ = 397 ppm.
The composition of blow down water in this case will be:
Hardness, ppm Alkalinity, ppm Sulfates, ppm Chlorides, ppm Silica, ppm
CaCO" 5 X 118 = 590 CaCO" 0.1 X 5 X 90 = 45
S04' 5 X 20 + 388 = 488 Cl, 5 X 19 = 95
SiO" 5 X 2 = 10
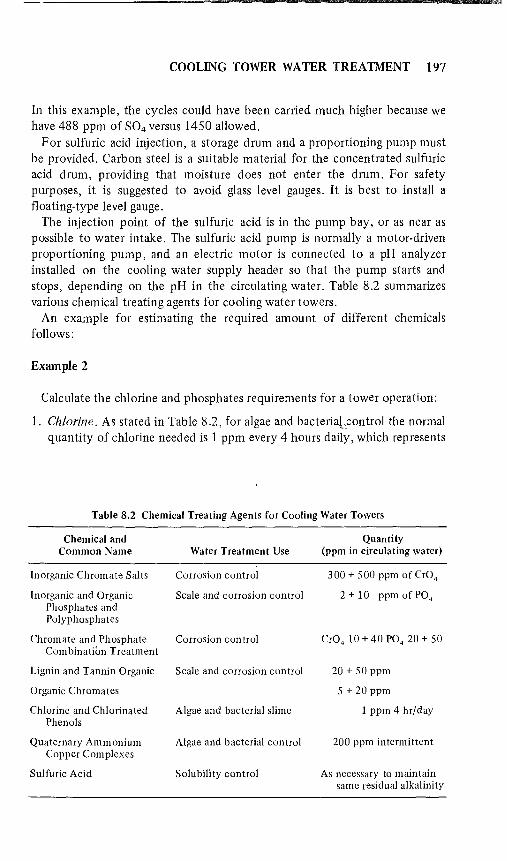
COOLING TOWER WATER TREATMENT 197
In this example, the cycles could have been carried much higher because we have 488 ppm of S04 versus 1450 allowed.
F or sulfuric acid injection, a storage drum and a proportioning pump must be provided. Carbon steel is a suitable material for the concentrated sulfuric acid drum, providing that moisture does not enter the drum. For safety purposes, it is suggested to avoid glass level gauges. It is best to install a floating-type level gauge.
The injection point of the sulfuric acid is in the pump bay, or as near as possible to water intake. The sulfuric acid pump is normally a motor-driven proportioning pump, and an electric motor is connected to a pH analyzer installed on the cooling water supply header so that the pump starts and stops, depending on the pH in the circulating water. Table 8.2 summarizes various chemical treating agents for cooling water towers.
An example for estimating the required amount of different chemicals follows:
Example 2
Calculate the chlorine and phosphates requirements for a tower operation:
1. Chlorine. As stated in Table 8.2, for algae and bacteriatcontrol the normal quantity of chlorine needed is 1 ppm every 4 hours daily, which represents
Table 8.2 Chemical Treating Agents for Cooling Water Towers
Chemical and Quantity Common Name Water Treatment Use (ppm in circulating water)
Inorganic Chromate SaIts Corrosion control 300 + 500 ppm orCr04
Inorganic and Organic Scale and corrosion control 2 + 10 ppm of PO. Phosphates and Polyphosphates
Chromate and Phosphate Corrosion control Cr0 4 10 + 40 P0 4 20 + 50 Combination Treatment
Lignin and Tannin Organic Scale and corrosion control 20 + 50 ppm
Organic Chromates
Chlorine and Chlorinated Phenols
Quaternary Ammonium Copper Complexes
Sulfuric Acid
Algae and bacterial slime
Algae and bacterial control
Solubility control
5 + 20 ppm
1 ppm 4 In/day
200 ppm intermittent
As necessary to maintain same residual alkalinity

198 COOLING TOWERS
4 hr/day ] ppm X 24 hr/day ~ 0.2 ppm
continuously. Suppose a tower operates with 100,000 gpm of circulating flow:
. 100,000 gal/min X 1440 min/day Chlonne (lb/day) ~ 7.48 gal/ft3 X ft3/62.4 Ib
0.21b CI 2
X 1,000,000]b H20 ~ 240 Ib/day
2. Phosphate. From the table, the requirements of phosphate are 2-10 ppm of P04 . The loss of phosphates will be due only to slowdown and windage. To calculate the phosphate requirements:
Phosphate (lb/ day)
where W ~ windag~ losses B ~ blowduwn losses
10 Ib PO, X (W + B) gal/min X 1440 min/day
1,000,000]b H 20 X 7.48 gal/ft' X ft3/62.4lb
All other chemicals can be calculated in the same way.
PLASTIC COOLING TOWERS
Corrosion problems and costly water treatment can be minimized in many applications through the use of plastics. Since about 1970 the use of industrial-grade plastics has become widely accepted in prepackaged, factoryassembled cooling tower units. There are numerous advantages to component construction, including polyethylene shell, ABS wet decking and drift eliminator system, and PVC distribution assembly, which have proven superior to steel and wood construction in many applications. There are several advantages of plastics construction over wood or steel. Plastics are noncorrosive, have a seamless, leakproof one-piece shell, are nonbrittle, nonporous/one-piece when wet and are lighter. Further, they require less maintenance and give longer service.
Figure 8.1 shows one manufacturer's unit constructed from plastic. Each tower consists of a seamless tubular shell, which houses a specially designed wet decking. The decking, of angled baffle construction, and wound in a
- ~--~--~ ~-------------------------

COOLING TOWER WATER TREATMENT 199
Figure 8.1 Modular constructed plastic cooling towers (courtesy of Delta Cooling Towers, Carborundum Corp., Fairfield, NJ).
continuous spiral, provides good air/water contact. These are counterflow operating towers. The wet decking and shells are constructed of noncorrosive plastics, which are impervious to industrial smoke, chemical fumes, salt, heavy dust, and alkaline, chlorinated or acid water. In addition, these materials resist algae growth, which greatly reduces water treatment chemical costs and maintenance.
The shells of the cooling towers shown in Figure 8.1 are constructed of polyethylene. Table 8.3 summarizes some of the properties of high-impact polyethylene. This plastic is also employed in constructing fill packing. Table 8.4 also gives chemical resistance information on various plastic resins.
SUGGESTED READING
l. Lee, J. W. "Pretreatment of Cooling Water Systems," Chem. Eng. Prog., 76(7) (1980).
2. Puckorius, P. R. "Pretreatment-The Key to Effective Protection of Cooling Water Systems," paper presented at the 21st Annual Water Conference, Pittsburgh, PA, Oct. 1960.
3. Pludek, V. R. Design and Corrosion Control (New York: John Wiley & Sons, Inc., 1977).
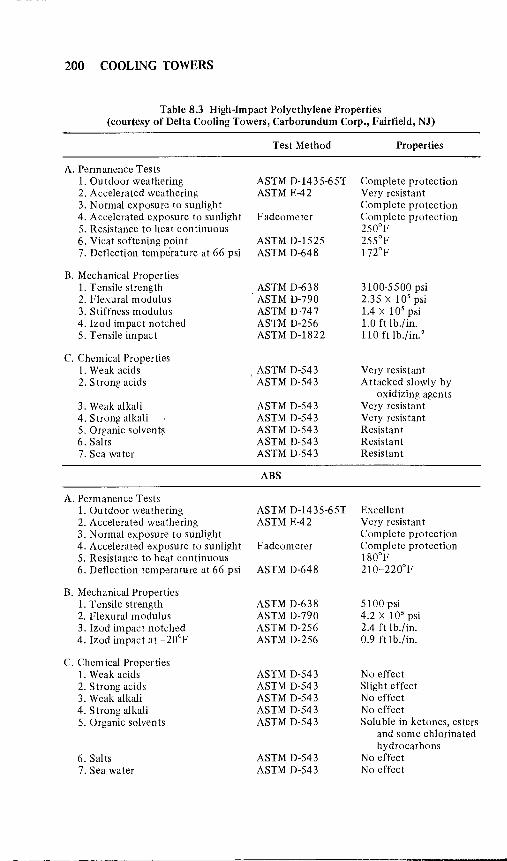
200 COOLING TOWERS
Table 8.3 High-Impact Polyethylene Properties (courtesy of Delta Cooling Towers, Carborundum Corp., Fairfield, NJ)
A. Permanence Tests 1. Ou tdoor wea thering 2. Accelerated wea thering 3. Normal exposure to sunlight 4. Accelerated exposure to sunlight 5. Resistance to heat continuous 6. Vicat softening point 7. Deflection temperature at 66 psi
B. Mechanical Properties 1. Tensile strength 2. Flexural modulus 3. Stiffness modulus 4. lzod impact notched 5. Tensile impact
C. Chemical Properties I. Weak acids 2. Strong acids
3. Weak alkali 4. Strong alkali 5. Organic solvent{;, 6. Salts 7. Sea water
A. Permanence Tests 1. Ou tdoor weathering 2. Accelerated weathering 3. Normal exposure to sunlight 4. Accelerated exposure to sunlight 5. Resistance to heat continuous 6. Deflection temperature at 66 psi
B. Mechanical Properties 1. Tensile strength 2. Flexural modulus 3. lzod impact notched 4. Izod impact at -20°F
C. Chemical Properties 1. Weak acids 2. Strong acids 3. Weak alkali 4. Strong alkali 5. Organic solvents
6. Salts 7. Sea water
Test Method
ASTM D-1435-65T ASTM E-42
Fadeometer
ASTM D-1525 ASTM D-648
ASTM D-638 ASTM D-790 ASTM D-747 ASTM D-256 ASTM D-1822
ASTM D-543 ASTM D-543
ASTM D-543 ASTM D-543 ASTM 0-543 ASTM D-543 ASTM D-543
ABS
ASTM D-1435-65T ASTM E-42
Fadeometer
ASTM D-648
ASTM D-638 ASTM D-790 ASTM D-256 ASTM 0-256
ASTM D-543 ASTM D-543 ASTM D-543 ASTM D-543 ASTM D-543
ASTM D-543 ASTM 0-543
Properties
Complete protection Very resistant Complete protection Complete protection 250°F 255°F 172°F
3100-5500 psi 2.35 X 10' psi 1.4 X 10' psi 1.0 ft lb./in. 110 ft Ib./in. 2
Very resistant Attacked slowly by
oxidizing agents Very resistant Very resistant Resistant Resistant Resistant
Excellent Very resistan t Complete protection Complete protection 180°F 210-220°F
5100 psi 4.2 X 10' psi 2.4 ft lb./in. 0.9 ft lb./in.
No effect Slight effect No effect No effect Soluble in ketones, esters
and some chlorinated hydrocarbons
No effect No effect
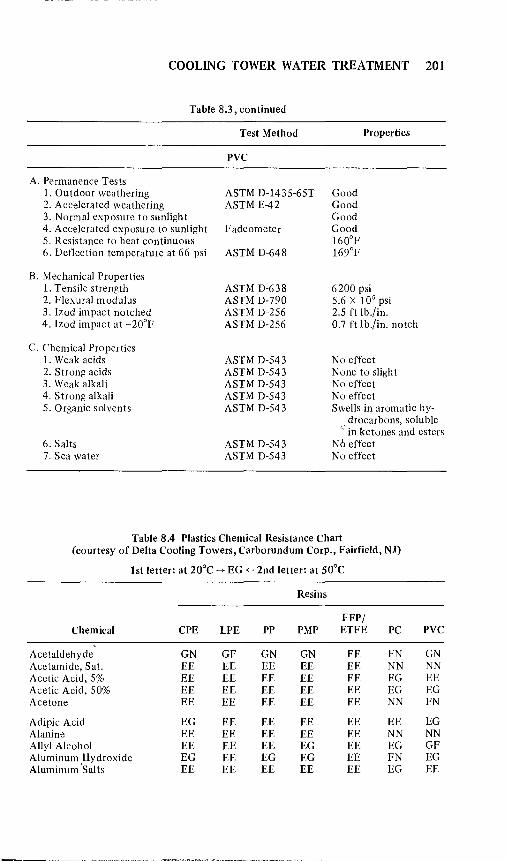
COOLING TOWER WATER TREATMENT 201
Table 8.3, continued
A. Permanence Tests 1. Ou tdoor wea thering 2. Accelerated weathering 3. Normal exposure to sunlight 4. Accelerated exposure to sunlight 5. Resistance to heat continuous 6. Deflection temperature at 66 psi
B. Mechanical Properties 1. Tensile strength 2. Flexural modulus 3. lzod impact notched 4. lzod impact at -20°F
C. Chem ical Properties 1. Weak acids 2. Strong acids 3. Weak alkali 4. Strong alkali 5. Organic solvents
6. Salts 7. Sea water
Test Method
PVC
ASTM D-1435-65T ASTM E-42
Fadeometer
ASTM D-648
ASTM 0-638 ASTM 0-790 ASTM 0-256 ASTM 0-256
ASTM 0-543 ASTM 0-543 ASTM 0-543 ASTM 0-543 ASTM 0-543
ASTM 0-543 ASTM 0-543
Good Good Good Good 160°F 169°F
Properties
6200 psi 5.6 X 10' psi 2.5 ft lb./in. 0.7 ft lb./in. notch
No effect None to slight No effect No effect Swells in aromatic hy
drocarbons, soluble ""in ketones and esters
No effect No effect
Table 8.4 Plastics Chemical Resistance Chart (courtesy of Oelta Cooling Towers, Carborundum Corp., Fairfield, NJ)
1st letter: at 20°C --+ EG <--"2nd letter: at 50°C
Resins
FEP/ Chemical CPE LPE PP PMP ETFE PC PVC
Acetaldehyde GN GF GN GN EE FN GN Acetamide, Sat. EE EE EE EE EE NN NN Acetic Acid, 5% EE EE EE EE EE EG EE Acetic Acid, 50% EE EE EE EE EE EG EG Acetone EE EE EE EE EE NN FN
Adipic Acid EG EE EE EE EE EE EG Alanine EE EE EE EE EE NN NN Allyl Alcohol EE EE EE EG EE EG GF Aluminum Hydroxide EG EE EG EG EE FN EG Aluminum 'Salts EE EE EE EE EE EG EE
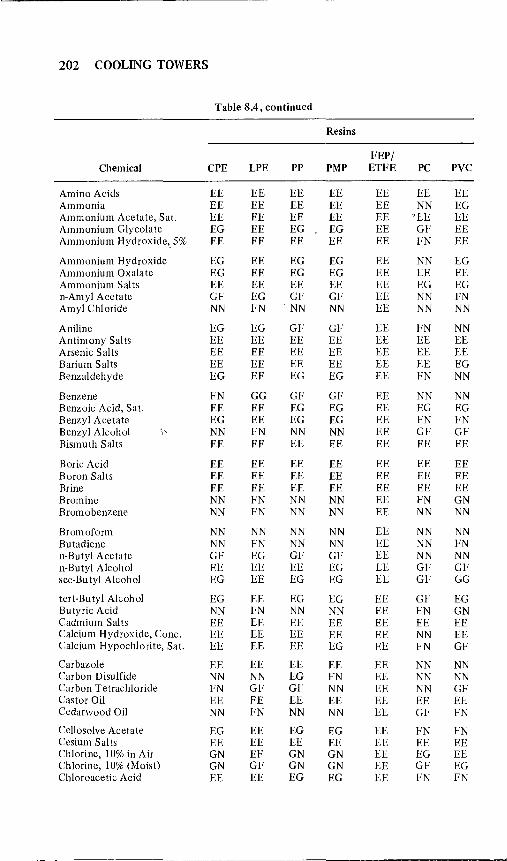
202 COOLING TOWERS
Table 8.4, continued
Resins
FEP/ Chemical CPE LPE PP PMP ETFE PC PVC
Amino Acids EE EE EE EE EE EE EE Ammonia EE EE EE EE EE NN EG Ammonium Acetate, Sat. EE EE EE EE EE 'EE EE Ammonium Glycolate EG EE EG EG EE GF EE Ammonium Hydroxide" 5% EE EE EE EE EE FN EE
Ammonium Hydroxide EG EE EG EG EE NN EG Ammonium Oxalate EG EE EG EG EE EE EE Ammonium Salts EE EE EE EE EE EG EG n-Amyl Acetate GF EG GF GF EE NN FN Amyl Chloride NN FN ·NN NN EE NN NN
Aniline EG EG GF GF EE FN NN Antimony Salts EE EE EE EE EE EE EE Arsenic Salts EE EE EE EE EE EE EE Barium Salts EE EE EE EE EE EE EG Benzaldehyde EG EE EG EG EE 1'N NN
Benzene FN GG G1' GF EE NN NN Benzoic Acid, Sat. EE EE EG EG EE EG EG Benzyl Acetate EG EE EG EG EE FN FN Benzyl Alcohol NN FN NN NN EE GF GF Bismuth Salts EE EE EE EE EE EE EE
Boric Acid EE EE EE EE EE EE EE Boron Salts EE EE EE EE EE EE EE Brine EE EE EE EE EE EE EE Bromine NN FN NN NN EE FN GN Bromobenzene NN FN NN NN EE NN NN
Bromoform NN NN NN NN EE NN NN Butadiene NN FN NN NN EE NN FN n-Butyl Acetate GF EG GF GF EE NN NN n-Butyl Alcohol EE EE EE EG EE GF GF sec-Butyl Alcohol EG EE EG EG EE GF GG
tert-Butyl Alcohol EG EE EG EG EE GF EG Butyric Acid NN FN NN NN EE FN GN Cadmium Salts EE EE EE EE EE EE EE Calcium Hydroxide, Conc. EE EE EE EE EE NN EE Calcium Hypochlorite, Sat. EE EE EE EG EE FN GF
Carbazole EE EE EE EE EE NN NN Carbon Disulfide NN NN EG FN EE NN NN Carbon Tetrachloride FN GF GF NN EE NN GF Castor Oil EE FE EE EE EE EE EE Cedarwood Oil NN FN NN NN EE GF FN
Cellosolve Acetate EG EE EG EG EE FN FN Cesium Salts EE EE EE EE EE EE EE Chlorine, 10% in Air GN E1' GN GN EE EG EE Chlorine, 10% (Moist) GN GF GN GN EE G1' EG Chloroacetic Acid EE EE EG EG EE FN FN

COOLING TOWER WATER TREATMENT 203
Table 8.4, continued
Resins
FEPI Chemical CPE LPE PP PMP ETFE PC PVC
p-Chloroacetophenone EE EE EE EE EE NN NN Chloroform FN GF GF FN EE NN NN Chromic Acid, 10% EE EE EE EE EE EG EG Chromic Acid, 50% EE EE EG EG EE EG EF Cinnamon Oil NN FN NN NN EE GF NN
Citric Acid, 10% EE EE EE EE EE EG GG Citric Acid, Crystals EE EE EE EE EE EE EG Coconut Oil EE EE EE EG EE EE GF Cresol NN FN EG NN EE NN NN Cydohexane GF EG GF NN EE EG GF
Decalin GF EG GF FN EE NN EG o-Dichlorobenzene FN FF FN FN EE NN GN p-Dichlorobcnzene FN GF EF GF EE NN NN Diethyl Benzene NN FN NN NN EE FN NN Diethyl Ether NN FN NN NN EE NN FN
Diethyl Ketone GF GG GG GF EE NN NN Diethyl Malonate EE EE EE EG EE FN GN Diethylene Glycol EE EE EE EE EE GF FN Diethylene Glycol Ethyl Ether EE EE EE EE EE FN FN Dimethyl Formamide EE EE EE EE EE NN FN
Dimethylsulfoxide EE EE EE EE EE NN NN 1 A-Dioxane GF GG GF GF EE GF FN Dipropylene Glycol EE EE EE EE EE GF GF Ether NN FN NN NN EE NN FN Ethyl Acetate EE EE EE EG EE NN FN
Ethyl Alcohol EG EE EG EG EE EG EG Ethyl Alcohol, 40% EG EE EG EG EE EG EE Ethyl Benzene FN GF FN FN EE NN NN Ethyl Benzoate FF GG· GF GF EE NN NN Ethyl Butyrate GN GF GN FN EE NN NN
Ethyl Chloride, Liquid FN FF FN FN EE NN NN Ethyl Cyanoacetate EE EE EE EE EE FN FN Ethyl Lactate EE EE EE EE EE FN FN Ethylene Chloride GN GF FN NN EE NN NN Ethylene Glycol EE EE EE EE EE GF EE
Ethylene Glycol Methyl Ether EE EE EE EE EE FN FN Ethylene Oxide FF GF FF FN EE FN FN Fluorides EE EE EE EE EE EE EE Fluorine FN GN FN FN EG GF EG Formaldehyde, 10% EE EE EE EG EE EG GF
Formaldehyde, 40% EG EE EG EG EE EG GF Formic Acid, 3% EG EE EG EG EE EG GF Pormic Acid, 50% EG EE EG EG EE EG GP Formic Acid, 98-100% EG EE EG EF EE EF FN Fuel Oil FN GF EG GF EE EG EE
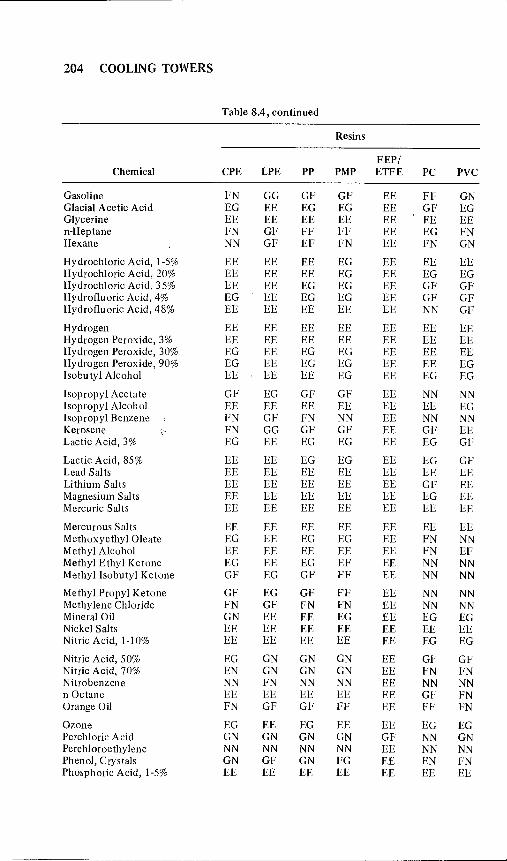
204 COOLING TOWERS
Table 8.4, continued
Resins
FEPI Chemical CPE LPE PP PMP ETFE PC PVC
Gasoline FN GG GF GF EE FF GN Glacial Acetic Acid EG EE EG EG EE GF EG Glycerine EE EE EE EE EE EE EE n-Heptane FN GF FF FF EE EG FN Hexane NN GF EF FN EE FN GN
Hydrochloric Acid, 1-5% EE EE EE EG EE EE EE Hydrochloric Acid, 20% EE EE EE EG EE EG EG Hydrochloric Acid, 35% EE EE EG EG EE GF GF Hydrofluoric Acid, 4% EG EE EG EG EE GF GF Hydrofluoric Acid, 48% EE EE EE EE EE NN GF
Hydrogen EE EE EE EE EE EE EE Hydrogen Peroxide, 3% EE EE EE EE EE EE EE Hydrogen Peroxide, 30% EG EE EG EG EE EE EE Hydrogen Peroxide, 90% EG EE EG EG EE EE EG Isobutyl Alcohol EE EE EE EG EE EG EG
Isopropyl Acetate GF EG GF GF EE NN NN Isopropyl Alcohol EE EE EE EE EE EE EG Isopropyl Benzene FN GF FN NN EE NN NN Kerosene \'./ FN GG GF GF EE GF EE Lactic Acid, 3% EG EE EG EG EE EG GF
Lactic Acid, 85% EE EE EG EG EE EG GF Lead Salts EE EE EE EE EE EE EE Lithium Salts EE EE EE EE EE GF EE Magnesium Salts EE EE EE EE EE EG EE Mercuric Salts EE EE EE EE EE EE EE
Mercurous Salts EE EE EE EE EE EE EE MethoxyethylOieate EG EE EG EG EE FN NN Methyl Alcohol EE EE EE EE EE FN EF Methyl Ethyl Ketone EG EE EG EF EE NN NN Methyl Isobutyl Ketone GP EG GF FF EE NN NN
Methyl Propyl Ketone GF EG GF FlO EE NN NN Methylene Chloride FN GF FN FN EE NN NN Mineral Oil GN EE EE EG EE EG EG Nickel Salts EE EE EE EE EE EE EE Nitric Acid, 1-10% EE EE EE EE EE EG EG
Nitric Acid, 50% EG GN GN GN EE GF GF Nitric Acid, 70% EN GN GN GN EE FN FN Nitrobenzene NN FN NN NN EE NN NN n-Octane EE EE EE EE EE GF FN Orange Oil FN GF GF FF EE FF FN
Ozone EG EE EG EE EE EG EG Perchloric Acid GN GN GN GN GF NN GN Perchloroethylene NN NN NN NN EE NN NN Phenol, Crystals GN GF GN FG EE EN FN Phosphoric Acid, 1-5% EE EE EE EE EE EE EE
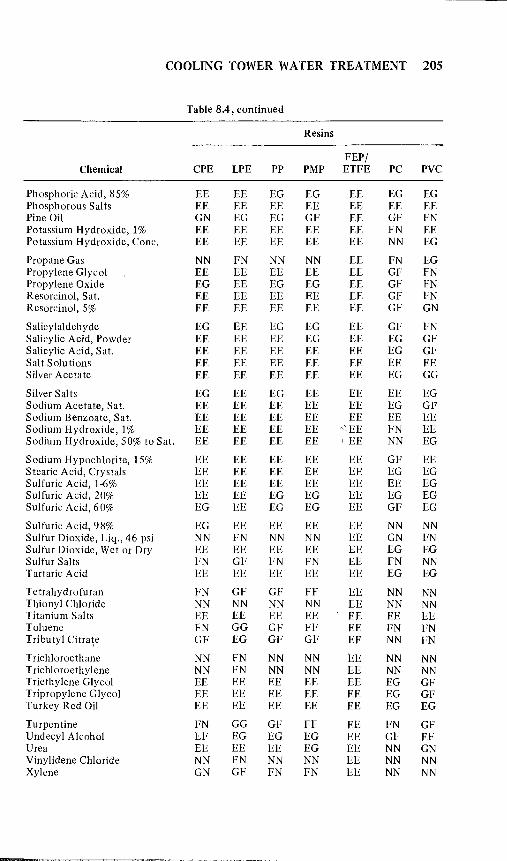
COOLING TOWER WATER TREATMENT 205
Table 8.4, continued
Resins
FEP/ Chemical CPE LPE PP PMP ETFE PC PVC
Phosphoric Acid, 85% EE EE EG EG EE EG EG Phosphorous Salts EE EE EE EE EE EE EE Pine Oil GN EG EG GF EE GF FN Potassium Hydroxide, 1% EE EE EE EE EE FN EE Potassium Hydroxide, Conc. EE EE EE EE EE NN EG
Propane Gas NN FN NN NN EE FN EG Propylene Glycol EE EE EE EE EE GF FN Propylene Oxide EG EE EG EG EE GF FN Resorcinol, Sat. EE EE EE EE EE GF FN Resorcinol, 5% EE EE EE EE EE GF GN
Salicylaldehyde EG EE EG EG EE GF FN Salicylic Acid, Powder EE EE EE EG EE EG GF Salicylic Acid, Sat. EE EE EE EE EE EG GF Salt Solu tions EE EE EE EE EE EE EE Silver Acetate EE EE EE EE EE EG GG
Silver Salts EG EE EG EE EE EE EG Sodium Acetate, Sat. EE EE EE EE EE EG GF Sodium Benzoate, Sat. EE EE EE EE EE EE EE Sodium Hydroxide, 1% EE EE EE EE ",EE FN EE Sodium Hydroxide, 50% to Sat. EE EE EE EE ' EE NN EG
Sodium Hypochlorite, 15% EE EE EE EE EE GF EE Stearic Acid, Crystals EE EE EE EE EE EG EG Sulfuric Acid, 1-6% EE EE EE EE EE EE EG Sulfuric Acid, 20% EE EE EG EG EE EG EG Sulfuric Acid, 60% EG EE EG EG EE GF EG
Sulfuric Acid, 98% EG EE EE EE EE NN NN Sulfur Dioxide, Liq., 46 psi NN FN NN NN EE GN FN Sulfur Dioxide, Wet or Dry EE EE EE EE EE EG EG Sulfur Salts FN GF FN FN EE FN NN Tartaric Acid EE EE EE EE EE EG EG
Tetrahydrofuran FN GF GF FF EE NN NN Thionyl Chloride NN NN NN NN EE NN NN Titanium Salts EE EE EE EE EE EE EE Toluene FN GG GF FF EE FN FN Tributyl Citra\e GF EG GF GF EE NN FN
Trichloroethane NN FN NN NN EE NN NN Trichloroethylene NN FN NN NN EE NN NN Triethylene Glycol EE EE EE EE EE EG GF Tripropylene Glycol EE EE EE EE EE EG GF Turkey Red Oil EE EE EE EE EE EG EG
Turpentine FN GG GF FF EE FN GF Undecyl Alcohol EF EG EG EG EE GF EF Urea EE EE EE EG EE NN GN Vinylidene Chloride NN FN NN NN EE NN NN Xylene GN GF FN FN EE NN NN
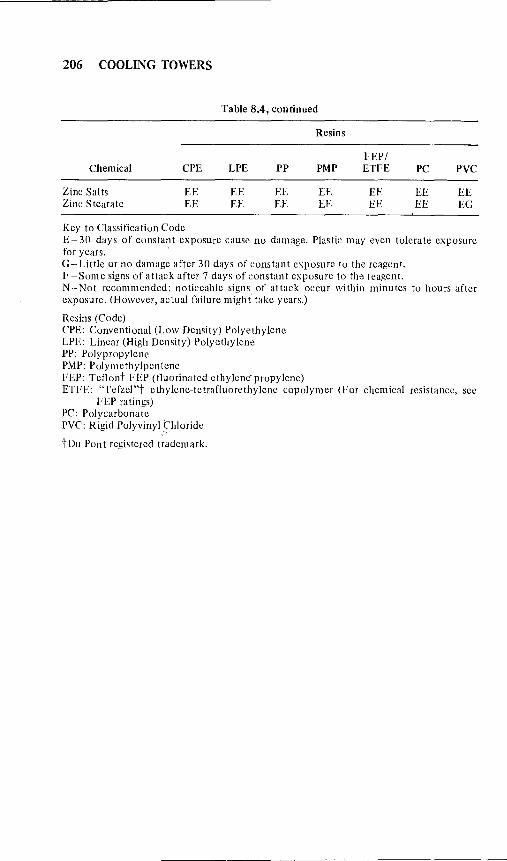
206 COOLING TOWERS
Table 8.4, continued
Resins
FEP/ Chemical CPE LPE PP PMP ETFE PC PVC
Zinc Salts EE EE EE EE EE EE EE Zinc Stearate EE EE EE EE EE EE EG
Key to Classification Code E - 30 days of constant exposure cause no damage. Plastic may even tolerate exposure for years. . G- Little or no damage after 30 days of constant e."posure to the reagent. F -Some signs of attack after 7 days of constant exposure to the reagent. N-Not recommended; noticeable signs of attack occur within minutes to hours after exposure. (However, actual failure might take years.)
Resins (Code) CPE: Conventional (Low Density) Polyethylene LPE: Linear (High Density) Polyethylene PP: Polypropylene PMP: Polymethylpentene FEP: Tet10nt FEP (t1uorinated ethylene' propylene) ETFE: "Tefzel"t ethylene-tetrat1uorethylene copolymer (For chemical resistance, see
FEP ratings) PC: Polycarbonate PYC: Rigid Polyvinyl Chloride
','I
t Du Pont registered trademark.

CHAPTER 9
GUIDELINES FOR WINTER OPERATION
INTRODUCTION
In an earlier chapter we briefly examined some of the problems encountered during the winter operation of cooling towers. Although advanced designs for ice prevention systems have been developed, ice-related structural damage continues to plague cooling tower systems, particularly hyperbolic natural-draft towers. Ice damage is often a severe problem, with the potential for structural damage. Because of the grave operating 'problems and their frequency of occurrence, a separate chapter is devoted to this subject.
Today's trend is moving away from constructing natural-draft towers in geographical regions where winter climates are severe. Counterflow naturaldraft towers are generally less susceptible to ice damage. In these systems, the fill is sheltered within the tower shell and the air inlet design usually does not include louvers. Advanced designs and new guidelines have resulted in a significant reduction in the frequency and extent of ice damage in counterflow natural-draft cooling towers.
OVERALL ICE PREVENTION SYSTEM DESIGN
There are basically three phases or subsystems currently used for ice prevention in natural-draft cooling towers:
I. Pill bypass systems, which are capable of diverting the entire hot water flow directly into the tower basin, comprise the first.
2. The second comprises designs that include an ice prevention ring that distributes a portion of the total hot water flow across the cooling tower air inlet as a veil of falling water.
3. A fill zoning subsystem designed to divert the water flow away from the center of the tower fill is the third system. This creates an annular flow operating configuration with a zone of high-density water loading about the outer region of tower fill.
207
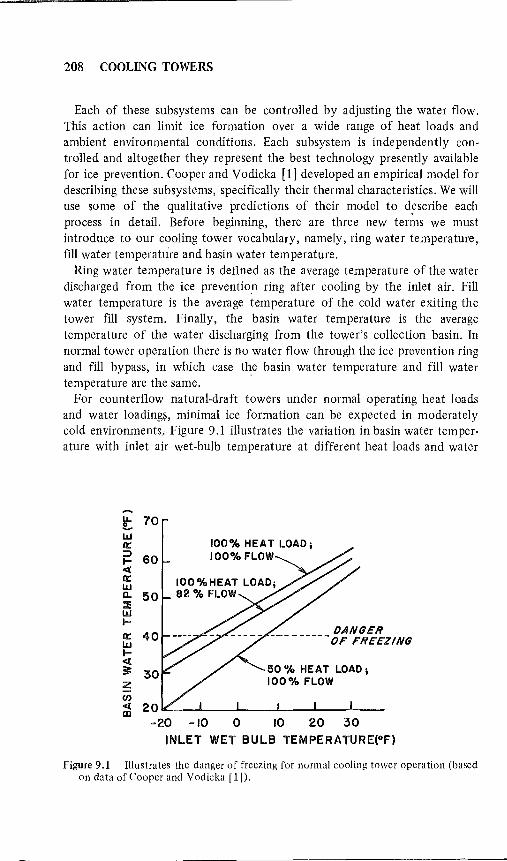
208 COOLING TOWERS
Each of these subsystems can be controlled by adjusting the water flow. This action can limit ice formation over a wide range of heat loads and ambient environmental conditions. Each subsystem is independently controlled and altogether they represent the best technology presently available for ice prevention. Cooper and Vodicka [1] developed an empirical model for describing these subsystems, specifically their thermal characteristics. We will use some of the qualitative predictions of their model to d~scribe each process in detail. Before beginning, there are three new terms we must introduce to our cooling tower vocabulary, namely, ring water temperature, fill water temperature and basin water temperature.
Ring water temperature is defined as the average temperature of the water discharged from the ice prevention ring after cooling by the inlet air. Fill water temperature is the average temperature of the cold water exiting the tower fIll system. Finally, the basin water temperature is the average temperature of the water discharging from the tower's collection basin. In normal tower operation there is no water flow through the ice prevention ring and fill bypass, in which case the basin water temperature and fill water temperature are the same. '
For counterflow natural-draft towers under normal operating heat loads and water loading~, minimal ice formation can be expected in moderately cold environments.", Figure 9.1 illustrates the variation in basin water temperature with inlet air wet-bulb temperature at different heat loads and water
t 70 w 0::
i= 60 <I: 0:: W a. 50 ~ W I-
0:: 40 w I<I: ~ ;z fI)
100% HEAT LOAD; 100%FLOW
OANGER OF FREEZING
~ 20"--........ ---'-----''-----'-----''----20 -10 0 10 20 30
INLET WET BULB TEMPERATURE(OF)
Figure 9.1 Illustrates the danger of freezing for normal cooling tOlVer operation (based on data of Cooper and Vodicka [lj).
GUIDELINES FOR WINTER OPERATION 209
loadings. The plot illustrates that at conditions of full water flow and heat load, the potential for freezing does not occur until very low wet-bulb temperatures are reached. (Note that since water temperature gradients exist between the central and peripheral regions of large cooling towers, a basin or fill water temperature of 40°F or less constitutes a condition of high freezing potential in a cooling tower [1].) A more subtle observation that can be made from Figure 9.1 is that a reduction in water loading significantly increases the tower's susceptibility to localized freezing. By reducing the water loading to the fill, the tower impedence of air flow is reduced. This results in an increase in the air mass flowrate through the tower. High water loading over the fill is most often recommended for winter operation.
MECHANICS OF THE FILL BYPASS AND ICE PREVENTION RING SECTIONS
In the normal operating mode, the entire water loading is distributed over the heat exchange surface (fill material). In the fill bypass operating mode, a portion of the hot water loading is diverted directly to the cooling tower basin. This results in an increase in the overall average water basin temperature. Fill bypass operation is an essential step when placing cooling towers onstream during cold weather.
In the northeastern region of the U.S., a great many natural-draft cooling towers are operated in a fill bypass mode and, in many cases, this represents the only means of controlling tower water temperatures in cold weather. Cooper and Vodicka [1] examined the thermal performance capabilities and limitations of fill bypass systems and presented their observations in the form of a plot of the fill water temperature as a function of basin water temperature for ambient wet-bulb temperatures and bypass flows. They found for a typical operation that at 0% bypass flow and -9.0°F (-22. 7°C) ambient wet-bulb temperature, the basin water temperature and fill water temperature approached an operating minimum of 40°F .. At a given wet-bulb temperature, as more water was made to bypass the fill, the basin water temperature was observed to increase, while the fill water temperature decreased. TIle decrease in fill water temperature can be attributed to the decrease in the fill water loading and, thus, the subsequent reduction in total thermal energy available to the fill. Under steady-state conditions, the bypass operating arrangement can maintain elevated basin water temperatures in moderately cold weather.
There is, however, a danger for ice formation in the fill if too much water is bypassed. In the majority of cooling tower operations, standard practice is to open and close the bypass valves in a cyclic fashion to maintain a desired average basin water temperature while minimizing fill ice formation.
M

210 COOLING TOWERS
The main disadvantage with bypass cycling is that continual operator attention is generally required.
The portion of the tower most susceptible to icing is at the air inlet, which includes the diagonal structural supports and peripheral fill sections. This is especially true with counterflow natural-draft towers. In recent years, the so-called "ice prevention ring" has been incorporated into cooling tower designs operating in colder climates. The basis for its design is that for any given wet-bulb temperature, as the ring water flow is i~creased, the fill water, ring water and basin water temperatures increase. Modern ice prevention rings operate typically with ring flows of 20-40% of the total water loading to the tower.
In general, the thermal effects ,of the ice prevention ring water on the average fill water temperature is small. The role of the ice prevention ring is to preheat the air entering the fill and thus prevent the formation of ice in the peripheral fill sections of the tower. The falling veil of water is densest at the upper regions of the air inlet. This characteristic causes a constriction at the air inlet and causes the air stream to change its direction toward the lower portion of the air inlet. The' peripheral sections of the fill thus become effectively shielded from direct exposure to the incoming cold air. When the ice prevention ring and bypass system are operated simultaneously, a wide range of ice-free :.operations can be achieved by proportioning the proper water flows to each subsystem. Also, by increasing the bypass flowrate, increases in the ring water and basin water temperatures are achieved, accompanied by a decrease in the fill water temperature.
Another operating mode for the fill bypass and ice prevention ring is illustrated in Figure 9.2. In this case, the hot water loading over the fill is
AIR FLOW
FILL BYPASS
WATER DISTRIBUTION PIPE
FILL SYSTEM
Figure 9.2 Diagram showing the proper flow allocations during low heat load opera-tion, with water flow diverted from the fill section.

GUIDELINES FOR WINTER OPERA nON 211
totally diverted to the ice prevention ring and fill bypass subsystems. In normal operation this is accomplished by opening the bypass valves to the point that the water level in the distribution flumes falls below the inverts of the fill water distribution piping (see Chapter 4 for a discussion on the distribution pipes). At this lower flume water depth, no water reaches the fill section, causing a substantial head to exist over the open valves connecting the flumes to the ice prevention ring subsystem. This is a preferred operating mode in extremely cold weather as it provides steady-state, lowheat loading operation. This mode essentially short circuits the fill section, causing all heat rejection to take place in the descending water in the ice prevention ring.
There is one final ice prevention configuration worth noting, only because it is still utilized in older installations. In tins design, a circumferential hot water distribution pipe is positioned above, and adjacent to, the inside face of the tower air inlet. Tins subsystem is referred to as a deicing ring and consists of multiple-pipe sections that are perforated or stalled on the underside. The design includes valve-controlled flow connections to the main fill hot water distribution system. Typical diameters for the deicing ring pipe section are between 6 and 12 inches, with maximum design flow about 10% of the total water loading.
The deicing ring was designed to distribute a small amount of hot water over the air inlet opening, thus causing ice accumulatioris on the air inlet structures to melt. In general, industry has complained that the deicing ring does not effectively mininlize peripheral ice accumulations. In fact, numerous installations have been reported to freeze and rupture, and motor-operated deicing flow control valves have been proven to be unreliable because of freezing and corrosion. This approach is no longer applied to new naturaldraft towers but can be found on installations that have been in service more than 10 years.
SUPPLEMENTAL ICE CONTROL: FILL ZONING
The fill zoning subsystem is another supplemental approach for ice formation control. In this operating mode, the hot water loading over the center region of the tower fill is diverted to the peripheral fill sections. This increase in the peripheral fill region water loading causes a dramatic reduction of the effective interfacial contact area between the air and water. Figure 9.3 illustrates a typical fill water distribution pattern in the zoned mode of operation. The annular airflow formed results in an increase in the air flow impedance of the tower, thus reducing its air loading through the fill section. Fill zoning alone unfortunately is not enough to protect the peripheral fill

212 COOLING TOWERS
DRY FILL REGION
Figure 9.3 Typical fill water distribution pattern in the zoned mode of operation.
sections from ice damage. The best available technology recommends operating counterflow systems with the zoning subsystem in conjunction with the ice prevention ring.
GUIDELINES FOR INTEGRATED SYSTEM OPERA nON
There are many applications in which it is important to maintain an average basin water temperature at an optimum value. One example is a utility cooling tower application in which an optimum average basin water temperature is required to ensure efficient turbine operation. In this example, the optimum temperature falls between 60° and 75°F. Ice prevention systems should be designed to provide sufficient flexibility to control the basin water temperature between specified limits without significant ice formation for a wide range of heat load and ambient environmental conditions.
This flexibility can be achieved through the use of three operating nobs, that is, by proper adjustment of water flow allocations to the three ice prevention subsystems. We can summarize everything in this chapter into four operating modes.
1. Mode I Operation is the normal cooling tower operating fashion in which hot water is distributed evenly over the entire fill plan area. In this operation, all the valves to the ice prevention ring are in the closed position. The fill bypass can be operated if needed to maintain an optimum basin water temperature.
2. Mode II Operation comprises full operation of the ice prevention ring to prevent icing on the peripheral fill sections. The fill bypass subsystem can be operated to provide a specified temperature range for the basin water.
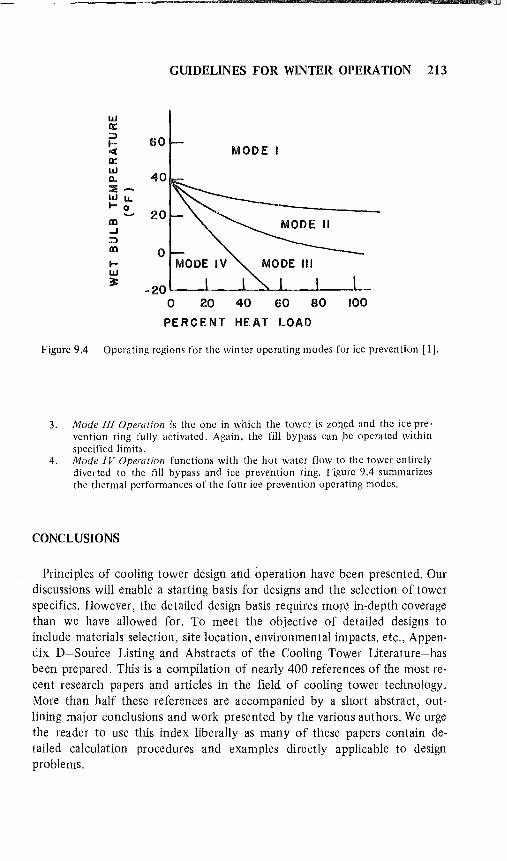
GUIDELINES FOR WINTER OPERATION 213
W 0:: ;:)
60 I-MODE I <I:
0:: W a.. :::e~ WI.!.. 1-0
20 In ...J ;:)
In 0 I-W ~
-20 0 20 40 60 80 100
PERCENT HEAT LOAD
Figure 9.4 Operating regions for the win ter operating modes for ice prevention [1].
3. Mode III Operation is the one in which the tower is ZOlWd and the ice prevention ring fully activated. Again, the fill bypass can ,be operated within specified limits.
4. Mode IV Operation functions with the hot water flow to the tower entirely diverted to the fill bypass and ice prevention ring. Figure 9.4 summarizes the thermal performances of the four ioe prevention operating modes.
CONCLUSIONS
Principles of cooling tower design and operation have been presented. Our discussions will enable a starting basis for designs and the selection of tower specifics. However, the detailed design basis requires more in-depth coverage than we have allowed for. To meet the objective of detailed designs to include materials selection, site location, environmental impacts, etc., Appendix D-Source Listing and Abstracts of the Cooling Tower Literature-has been prepared. This is a compilation of nearly 400 references of the most recent research papers and articles in the field of cooling tower technology. More than half these references are accompanied by a short abstract, outlining major conclusions and work presented by the various authors. We urge the reader to use this index liberally as many of these papers contain detailed calculation procedures and examples directly applicable to design problems.

214 COOLING TOWERS
REFERENCE
1. Cooper, J. W., and V. Vodicka. "Cooling Tower Ice Prevention Systems: State-of-the-Art-Designs," Combustion 51 (11) (1980).
SUGGESTED READING
1. Roffman, A., et al. "The State of the Art of Saltwater Cooling Towers for Steam Electric Generating Plants," WASH 1244, Appendix C (1973).
APPENDIX A
STEAM TABLES
(Ste am Properties courte sy of the American Society of Mechanical Engineers)
215
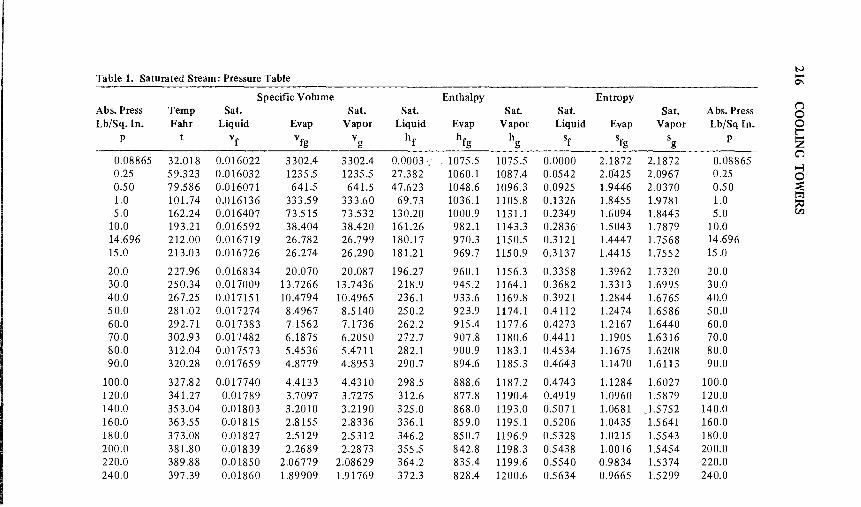
N Table 1. Saturated Steam: Pressure Table -0'1
Specific Volume Enthalpy Entropy ("'J
Abs. Press Temp Sat. Sat. Sat. Sat. Sat. Sat. Abs. Press 0 Lb/Sq. In. Fahr Liquid Evap Vapor Liquid Evap Vapor Liquid Evap Vapor Lb/Sq In. 0
p vf v hf hfg h sf Sfg s P
t""' vfg g g g Z 0.08865 32.018 0.016022 3302.4 3302.4 0.0003 ~ 1075.5 1075.5 0.0000 2.1872 2.1872 0.08865
C'l
0.25 59.323 0.016032 1235.5 1235.5 27.382 1060.1 1087.4 0.0542 2.0'425 2.0967 0.25 --l 0
0.50 79.586 0.016071 641.5 641.5 47.623 1048.6 1096.3 0.0925 1.9446 2.0370 0.50 :;: 1.0 101.74 0.016136 333.59 333.60 69.73 1036.1 1105.8 0.1326 1.8455 1.9781 l.0 i:"l ::c 5.0 162.24 0.016407 73.515 73.532 130.20 1000.9 1131.1 0.2349 1.6094 1.8443 5.0 CIl
10.0 193.21 0.016592 38.404 38.420 161.26 982.1 1143.3 0.2836 1.5043 1.7879 10.0 14.696 212.00 0.016719 26.782 26.799 180.17 970.3 1150.5 0.3121 1.4447 1.7568 14.696 15.0 213.03 0.016726 26.274 26.290 18l.21 969.7 . 1150.9 0.3137 1.4415 1.7552 15.0
20.0 227.96 0.016834 20.070 20.087 196.27 960.1 1156.3 0.3358 1.3962 1.7320 20.0 30.0 250.34 0.017009 13.7266 13.7436 218.9 945.2 1164.1 0.3682 1.3313 1.6995 30.0 40.0 267.25 0.017151 10.4794 10.4965 236.1 933.6 1169.8 0.3921 1.2844 1.6765 40.0 50.0 28l.02 0.017274 8.4967 8.5140 250.2 923.9 1174.1 0.4112 1.2474 1.6586 50.0 60.0 292.71 0.017383 7.1562 7.1736 262.2 915.4 1177.6 0.4273 1.2167 l.6440 60.0 70.0 302.93 0.017482 6.1875 6.2050 272.7 907.8 1180.6 0.4411 1.1905 l.6316 70.0 80.0 312.04 0.017573 5.4536 5.4711 282.1 900.9 1183.1 0.4534 1.1675 l.6208 80.0 90.0 320.28 0.017659 4.8779 4.8953 290.7 894.6 1185.3 0.4643 1.1470 1.6113 90.0
100.0 327.82 0.017740 4.4133 4.4310 298.5 888.6 1187.2 0.4743 1.1284 l.6027 100.0 120.0 341.27 0.01789 3.7097 3.7275 312.6 877.8 1190.4 0.4919 1.0960 1.5879 120.0 140.0 353.04 0.01803 3.2010 3.2190 325.0 868.0 1193.0 0.5071 1.0681 "1.5752 140.0 160.0 363.55 0.01815 2.8155 2.8336 336.1 859.0 1195.1 0.5206 1.0435 1.5641 160.0 180.0 373.08 0.01827 2.5129 2.5312 346.2 850.7 1196.9 0.5328 1.0215 1.5543 180.0 200.0 381.80 0.01839 2.2689 2.2873 355.5 842.8 1198.3 0.5438 1.0016 1.5454 200.0 220.0 389.88 0.01850 2.06779 2.08629 364.2 835.4 1199.6 0.5540 0.9834 1.5374 220.0 240.0 397.39 0.01860 1.89909 1.91769 372.3 828.4 1200.6 0.5634 0.9665 l.5299 240.0

260.0 404.44 0.01870 1.75548 1.77418 379.9 821.6 1201.5 0.5722 0.9508 1.5230 260.0 280.0 411.07 0.01880 1.63169 1.65049 387.1 815.1 1202.3 0.5805 0.9361 1.5166 280.0 300.0 417.35 0.01889 1.52384 1.54274 394.0 808.9 1202.9 0.5882 0.9223 1.5105 300.0 350.0 431.73 0.01912 1.30642 1.32554 409.8 794.2 1204.0 0.6059 0.8909 1.4968 350.0 400.0 444.60 ,0.01934 1.14162 1.16095 424.2 780.4 1204.6 0.6217 0.8630 1.4847 400.0 450.0 456.28 0.01954 1.01224 1.03179 437.3 767.5 1204.8 0.6360 0.8378 1.4738 450.0 500.0 467.01 0.01975 0.90787 0.92762 449.5 755.1 1204.7 0.6490 0.8148 1.4639 500.0 550.0 476.94 0.01994 0.82183 0.84177 460.9 743.3 1204.3 0.6611 0.7936 1.4547 550.0 600.0 486.20 0.02013 0.74962 0.76975 471.7 732.0 1203.7 0.6723 0.7738 1.4461 600.0 650.0 494.89 0.02032 0.68811 0.70843 481.9 720.9 1202.8 0.6828 0.7552 1.4381 650.0 700.0 503.08 0.02050 0.63505 0.65556 491.6 710.2 1201.8 0.6928 0.7377 1.4304 700.0 800.0 518.21 0.02087 0.54809 0.56896 509.8 689.6 1199.4 0.7111 0.7051 1.4163 800.0 900.0 531.95 0.02123 0.47968 0.50091 526.7 669.7 1196.4 0.7279 0.6753 1.4032 900.0
1000.0 544.58 0.02159 0.42436 0.44596 542.6 650.4 1192.9 0.7434 0.6476 1.3910 1000.0 1200.0 567.19 0.02232 0.340l3 0.36245 571.9 6l3.0 1184.8 0.7714 0.5969 1.3683 1200.0 1400.0 587.07 0.02307 0.27871 0.30178 598.8 576.5 1175.3 0.7966 0.5507 1.3474 1400.0 1600.0 604.87 0.02387 0.23159 0.25545 624.2 540.3 1164.5 0.8199 0.5076 1.3274 1600.0 1800.0 621.02 0.02472 0.19390 0.21861 648.5 503.8 1152.3 0.8417 0.4662 1.3079 1800.0 2000.0 635.80 0.02565 0.16266 0.18831 672.1 466.2 1138.3 0.8625 0.4256 1.2881 2000.0 2200.0 649.45 0.02669 0.l3603 0.16272 695.5 426.7 1122.2 0.8828 0.3848 1.2676 2200.0 2400.0 662.11 0.02790 0.11287 0.14076 719.0 384.8 1103.7 0.9031 0.3430 1.2460 2400.0 2600.0 673.91 0.02938 0.09172 0.12110 744.5 337.6 1082.0 0.9247 0.2977 1.2225 2600.0 CIl
--l 2800.0 684.96 0.03l34 0.07171 0.10305 770.7 285.1 1055.8 0.9468 0.2491 1.1958 2800.0 i:"l 3000.0 695.33 0.03428 0.05073 0.08500 80 1.8 ~ 218.4 1020.3 0.9728 0.1891 1.1619 3000.0 > 3200.0 705.08 0.04472 0.01191 0.05663 875.5 56.1 931.6 1.0351 0.0482 1.0832 3200.0
::::: 3208.2 * 705.47 0.05078 0.00000 0.05078 906.0 0.0 906.0 1.0612 0.0000 1.0612 3208.2* --l
> *Critical pressure.
t:e t""' i:"l CIl
N --..l
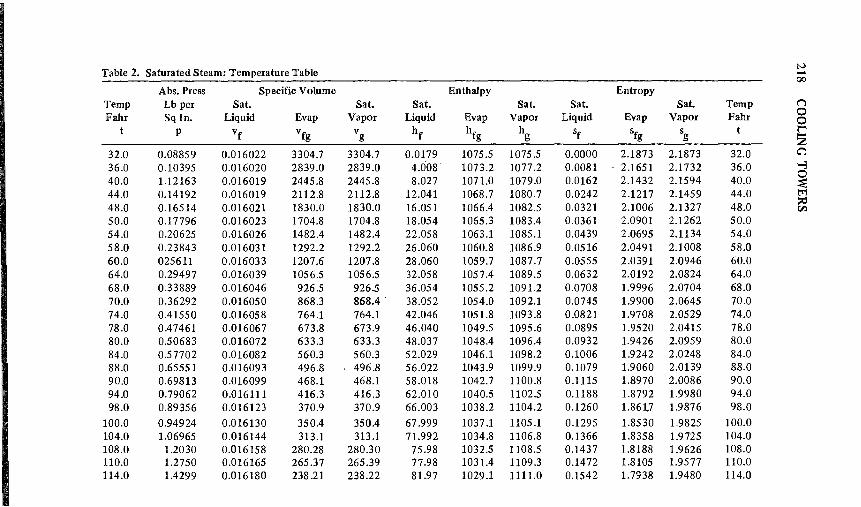
Table 2. Saturated Steam: Temperature Table N ..... 00
Abs. Press Specific Volume Enthalpy Entropy Temp Lb per Sat. Sat. Sat. Sat. Sat. Sat. Temp ("J
Pahr Sq In. Liquid Evap Vapor Liquid Evap Vapor Liquid Evap Vapor Pahr 0 0
t P vf vfg Vg hf hfg hg Sf Sfg Sg ~ 32.0 0.08859 0.016022 3304.7 3304.7 0.0179 1075.5 1075.5 0.0000 2.1873 2.1873 32.0 C"l 36.0 0.10395 0.016020 2839.0 2839.0 4.008·· 1073.2 1077.2 0.0081 2.1651 2.1732 36.0 >-3
40.0 1.12163 0.016019 2445.8 2445.8 8.027 1071.0 1079.0 0.0162 2.1432 2.1594 40.0 0 ~
44.0 0.14192 0.016019 2112.8 2112.8 12.041 1068.7 1080.7 0.0242 2.1217 2.1459 44.0 i:"l
48.0 0.16514 0.016021 1830.0 1830.0 16.051 1066.4 1082.5 0.0321 2.1006 2.1327 48.0 ~ 50.0 0.17796 0.016023 1704.8 1704.8 18.054 1065.3 1083.4 0.0361 2.0901 2.1262 50.0 54.0 0.20625 0.016026 1482.4 1482.4 22.058 1063.1 1085.1 0.0439 2.0695 2.1134 54.0 58.0 0.23843 0.016031 1292.2 1292.2 26.060 1060.8 1086.9 0.0516 2.0491 2.1008 58.0 60.0 025611 0.016033 1207.6 1207.8 28.060 1059.7 1087.7 0.0555 2.0391 2.0946 60.0 64.0 0.29497 0.016039 1056.5 1056.5 32.058 1057.4 1089.5 0.0632 2.0192 2.0824 64.0 68.0 0.33889 0.016046 926.5 926.5 36.054 1055.2 1091.2 0.0708 1.9996 2.0704 68.0 70.0 0.36292 0.016050 868.3 868.4· 38.052 1054.0 1092.1 0.0745 1.9900 2.0645 70.0 74.0 0.41550 0.016058 764.1 764.1 42.046 1051.8 1093.8 0.0821 1.9708 2.0529 74.0 78.0 0.47461 0.016067 673.8 673.9 46.040 1049.5 1095.6 0.0895 1.9520 2.0415 78.0 80.0 0.50683 0.016072 633.3 633.3 48.037 1048.4 1096.4 0.0932 1.9426 2.0959 80.0 84.0 0.57702 0.016082 560.3 560.3 52.029 1046.1 1098.2 0.1006 1.9242 2.0248 84.0 88.0 0.65551 0.016093 496.8 496.8 56.022 1043.9 1099.9 0.1079 1.9060 2.0139 88.0 90.0 0.69813 0.016099 468.1 468.1 58.018 1042.7 1100.8 0.1115 1.8970 2.0086 90.0 94.0 0.79062 0.016111 416.3 416.3 62.010 1040.5 1102.5 0.1188 1.8792 1.9980 94.0 98.0 0.89356 0.016123 370.9 370.9 66.003 1038.2 1104.2 0.1260 1.8617 1.9876 98.0
100.0 0.94924 0.016130 350.4 350.4 67.999 1037.1 1105.1 0.1295 1.8530 1.9825 100.0 104.0 1.06965 0.016144 313.1 313.1 71.992 1034.8 1106.8 0.1366 1.8358 1.9725 104.0 108.0 1.2030 0.016158 280.28 280.30 75.98 1032.5 1108.5 0.1437 1.8188 1.9626 108.0 110.0 1.2750 0.016165 265.37 265.39 77.98 1031.4 1109.3 0.1472 1.8105 1.9577 110.0 114.0 1.4299 0.016180 238.21 238.22 81.97 1029.1 1111.0 0.1542 1.7938 1.9480 114.0

118.0 1.6009 0.016196 214.20 214.21 85.97 1026.8 1112.7 0.1611 1.7774 1.9386 118.0 120.0 1.6927 0.016204 203.25 203.26 87.97 1025.6 1113.6 0.1646 1.7693 1.9339 120.0 124.0 1.8901 0.016221 183.23 183.24 91.96 1023.3 1115.3 0.1715 1.7533 1.9247 124.0 128.0 2.1068 0.016238 165.45 165.4 7 95.96 1021.0 1117.0 0.1783 1.7374 1.9157 128.0 130.0 2.2230 Q.016247 157.32 157.33 97.96 1019.8 1117.8 0.1817 1.7295 1.9112 130.0 134.0 2.4717 0.016265 142.40 142.41 101.95 1017.5 1119.5 0.1884 1.7140 1.9024 134.0 138.0 2.7438 0.016284 129.09 129.11 105.95 1015.2 1121.1 0.1951 1.6986 1.8937 138.0 140.0 2.8892 0.016293 122.98 123.00 107.95 1014.0 1122.0 0.1985 1.6910 1.8895 140.0 144.0 3.1997 0.016312 111.74 111.76 111.95 1011.7 1123.6 0.2051 1.6759 1.8810 144.0 148.0 3.5381 0.016332 101.68 101.70 115.95 1009.3 1125.3 0.2117 1.6610 1.8727 148.0 150.0 3.7184 0.016343 97.05 97.07 117.95 1008.2 1126.1 0.2150 1.6536 1.8686 150.0 154.0 4.0125 0.016363 88.50 88.52 121.95 1005.8 1127.7 0.2216 1.6390 1.8606 154.0 158.0 4.5197 0.016384 80.82 80.83 125.96 1003.4 1129.4 0.2281 1.6245 1.8526 158.0 160.0 4.7414 0.016395 77.27 77.29 127.96 1002.2 1130.2 0.2313 1.6174 1.8487 160.0 164.0 5.2124 0.016417 70.70 70.72 131.96 999.8 1131.8 0.2377 1.6032 1.8409 164.0 168.0 5.7223 0.016440 64.78 64.80 135.97 997.4 1133.4 0.2441 1.5892 1.8333 168.0 170.0 5.9926 0.016451 62.04 62.06 137.97 996.2 1134.2 0.2473 1.5822 1.8295 170.0 174.0 6.5656 0.016474 56.95 56.97 141.98 993.8 1135.8 0.2537 1.5684 1.8221 174.0 178.0 7.1840 0.016498 52.35 52.36 145.99 991.4 1137.4 0.2600 1.5548 1.8147 178.0 180.0 7.5110 0.016510 50.21 50.22 148.00 990.2 1138.2 0.2631 1.5480 1.8111 180.0 190,O 9.340 0.016572 40.941 40.957 158.04 984.1 1142.1 0.2787 1.5148 1.7934 190.0
200.0 11.526 0.016637 33.622 33.639 168.09 977.9 1146.0 0.2940 1.4824 1.7764 200.0 CIl --l
220.0 17.186 0.016775 23.131 23.148 188.23 965.2 1153.4 0.3241 1.4201 1.7442 220.0 i:'1 > 240.0 24.968 0.016926 16.304 16.321 208.45 952.1 1160.6 0.3533 1.3609 1.7142 240.0 :::::
260.0 35.427 0.017089 11.745 11.762 228.76 938.6 1167.4 0.3819 1.3043 1.6862 260.0 --l 280.0 49.200 0.017264 8.627 8.644 249.17 924.6 1173.8 0.4098 1.2501 1.6599 280.0 > 300.0 67.005 0.01745 6.4483 6.4658 269.7 910.0 1179.7 0.4372 1.1979 1.6351 300.0 t:e
320.0 89.643 0.01766 4.8961 4.9138 290.4 894.8 1185.2 - 0.4640 1.1477 1.6116 320.0 r;; CIl
340.0 117.992 0.D1787 3.7699 3.7878 311.3 878.8 1190.1 0.4902 1.0990 1.5892 340.0 360.0 153.010 0.01811 2.9392 2.9573 332.3 862.1 1194.4 0.5161 1.0517 1.5678 360.0 N
380.0 195.729 0.01836 2.3170 2.3353 353.6 844.5 1198.0 0.5416 1.0057 1.5473 380.0 -\0
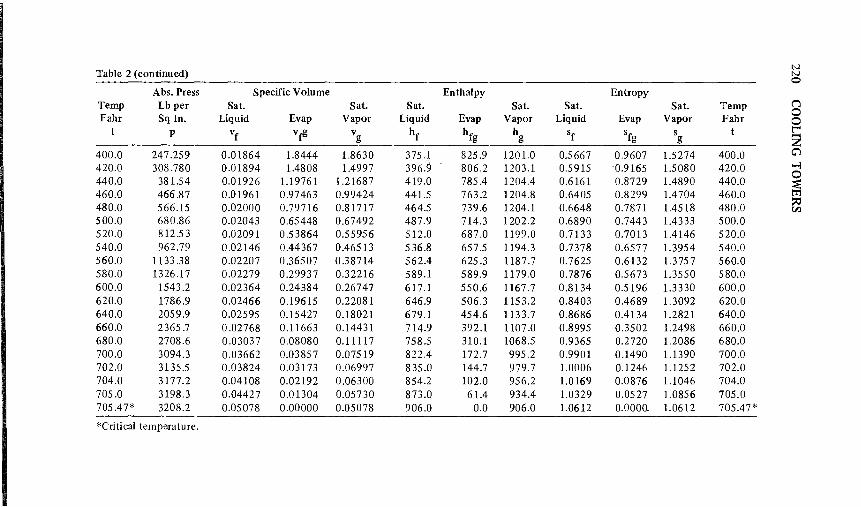
Table 2 (continued) N N 0
Abs. Press Specific Volume Enthalpy Entropy Temp Lb per Sat. Sat. Sat. Sat. Sat. Sat. Temp ("J
0 Fahr Sq In. Liquid Evap Vapor Liquid Evap Vapor Liquid Evap Vapor Fahr 0 p vf vfg Vg hf hfg h sf Sfg s t t'"'
g g -Z 400.0 247.259 0.01864 1.8444 1.8630 375.1 825.9 1201.0 0.5667 0.9607 1.5274 400.0 C'l 420.0 308.780 0.01894 1.4808 1.4997 39d 806.2 1203.1 0.5915 '0.9165 1.5080 420.0 --l
440.0 381.54 0.01926 1.19761 1.21687 419.0 785.4 1204.4 0.6161 0.8729 1.4890 440.0 0 ~
460.0 466.87 0.01961 0.97463 0.99424 441.5 763.2 1204.8 0.6405 0.8299 1.4704 460.0 i:'1
480.0 566.15 0.02000 0.79716 0.81717 464.5 739.6 1204.1 0.6648 0.7871 1.4518 480.0 ::tI CIl
500.0 680.86 0.02043 0.65448 0.67492 487.9 714.3 1202.2 0.6890 0.7443 1.4333 500.0 520.0 812.53 0.02091 0.53864 0.55956 512.0 687.0 1199.0 0.7133 0.7013 1.4146 520.0 540.0 962.79 0.02146 0.44367 0.46513 536.8 657.5 1194.3 0.7378 0.6577 1.3954 540.0 560.0 1133.38 0.02207 0.36507 0.38714 562.4 625.3 1187.7 0.7625 0.6132 1.3757 560.0 580.0 1326.17 0.02279 0.29937 0.32216 589.1 589.9 1179.0 0.7876 0.5673 1.3550 580.0 600.0 1543.2 0.02364 0.24384 0.26747 617.1 550.6 1167.7 0.8134 0.5196 1.3330 600.0 620.0 1786.9 0.02466 0.19615 0.22081 646.9 506.3 1153.2 0.8403 0.4689 1.3092 620.0 640.0 2059.9 0.02595 0.15427 0.18021 679.1 454.6 113 3.7 0.8686 0.4134 1.2821 640.0 660.0 2365.7 0.02768 0.11663 0.14431 714.9 392.1 1107.0 0.8995 0.3502 1.2498 660.0 680.0 2708.6 0.03037 0.08080 0.11117 758.5 310.1 1068.5 0.9365 0.2720 1.2086 680.0 700.0 3094.3 0.03662 0.03857 0.07519 822.4 172.7 995.2 0.9901 0.1490 1.1390 700.0 702.0 3135.5 0.03824 0.03173 0.06997 835.0 144.7 979.7 1.0006 0.1246 1.1252 702.0 704.0 3177.2 0.04108 0.02192 0.06300 854.2 102.0 956.2 1.0169 0.0876 1.1046 704.0 705.0 3198.3 0.04427 0.01304 0.05730 873.0 61.4 934.4 1.0329 0.0527 1.0856 705.0 705.47* 3208.2 0.05078 0.00000 0.05078 906.0 0.0 906.0 1.0612 0.0000. 1.0612 705.47*
*Critica\ temperature.

Table 3. Superheated Stearn .
Abs. Press LbjSqIn. Sat. Sat. Temperature-Degrees Fahrenheit
(Sat. Temp) Water Stearn 200 250 300 350 400 450 500 600 700 800 900 1000 1100 1200
Sh 98.26 148.26 198.26 248.26 298.26 348.26 398.26 498.26 598.26 698.26 798.26 898.26 998.26 1098.26 1 v 0.01614 333.6 392.5 422.4 452.3 482.1 511.9 541.7 571.5 631.1 690.7 750.2 809.8 869.4 929.1 988.7
(101.74) h 69.73 1105.8 1150.2 1172.9 1195.7 1218.7 1241.8 1265.1 1288.6 1336.1 1284.5 1431.0 1480.8 1531.4 1583.0 1635.4 0.1326 1.9781 2.0509 2.0841 2.1152 2.1445 2.1722 2.1985 2.2237 2.2708 2.3144 2.3512 2.3892 2.4251 2.4592 2.4918
Sh 37.76 87.76 137.76 187.76 237.76 287.76 337.76 437.76 537.76 637.76 737.76 837.76 937.76 1037.76 5 v 0.01641 73.53 78.14 84.21 90.24 96.25 102.24 108.23 114.21 126.15 138.08 150.01 161.94 173.86 185.78 197.70
(162.24) h 130.20 1131.1 1148.6 1171.7 1194.8 1218.0 1241.3 1264.7 1288.2 1335.9 1384.3 1433.6 1483.7 1534.7 1586.7 1639.6 0.2349 1.8443 1.8716 1.9054 1.9369 1.9664 1.9943 2.0208 20460 2.0932 2.1369 2.1776 2.2159 2.2521 2.2866 2.3194
Sh 6.79 56.79 106.79 156.79· 206.79 256.79 306.79 406.79 506.79 606.79 706.79 806.79 906.79 1006.79 10 v 0.01659 38.42 38.84 41.93 44.98 48.02 51.03 54.04 57.04 63.03 69.00 74.98 80.94 86.91 92.87 98.84
(193.21) h 161.26 1143.3 1146.6 1170.2 1193.7 1217.1 1240.6 1264.1 1287.8 1335.5 1384.0 1433.3 1483.5 1534.6 1586.6 1639.5 0.2836 1.7879 1.7928 1.8273 1.8593 1.8892 1.9l73 1.9439 1.9692 2.0166 2.0603 2.1011 2.1394 2.1757 2.2101 2.2430
Sh 38.00 88.00 138.00 188.00 238.00 288.00 388.00 448.00 588.00 688.00 788.00 888.00 988.00 14.696* v 0.0167 26.828 28.44 30.52 32.61 34.65 36.73 38.75 42.83 46.91 50.97 55.03 59.09 63.19 67.25 CIl
(212.00) h 180.07 1150.4 1169.2 1192.0 1215.4 1238.9 1262.1 1285.4 1333.0 1381.4 1430.5 1480.4 1531.1 1582.7 1635.1 --l i:'1
0.3120 1.7566 1.7838 1.8148 1.8446 1.8727 ~ 1.;8989 1.9238 1.9709 2.0145 2.0551 2.0932 2.1292 2.1634 2.1960 > Sh 36.97 86.97 136.97 186.97 236.97 286.97 386.97 486.97 586.97 686.97 786.97 886.97 986.97 :::::
15 v 0.01673 26.290 27.837 29.899 31.939 33.963 35.977 37.985 41.986 45.978 49.964 53.946 57.926 61.905 65.882 --l (213.03) h 181.21 1150.9 1168.7 1192.5 1216.2 1239.9 1263.6 1287.3 1335.2 1383.8 1433.2 1483.4 1534.5 1586.5 1639.4 >
t:e 0.3137 1.7552 1.7809 1.8134 1.8437 1.8720 1.8988 1.9242 1.9717 2.0155 2.0563 2.0946 2.1309 2.1653 2.1982 t'"'
372.04 772.04 872.04 972.04 i:'1
Sh 22.04 72.04 122.04 172.04 222.04 272.04 472.04 572.04 672.04 CIl
20 v 0.01683 20.087 20.788 22.356 23.900 25.428 26.946 28.457 31.466 34.465 37.458 40.447 43.435 46.420 49.405 (227.96) h 196.27 1156.3 1167.1 1191.4 1215.4 1239.2 1263.0 1286.9 1334.9 1383.5 1432.9 1483.2 1534.3 1586.3 1639.3 N
0.3358 1.7320 1.7475 1.7805 1.8111 1.8397 1.8666 1.8921 1.9397 1.9836 2.0244 2.0628 2.0991 2.1336 2.1665 N -

N N
Table 3 (continued) N
Abs. Press ("') Lb/Sq In. Sat. Sat. Temperature-Degrees Fahrenheit 0
(Sat. Temp) Water Stearn 200 250 300 350 400 450 500 600 700 800 900 1000 1100 1200 0 r
Sh 9.93 59.93 109.93 159.93 209.93 259.93 359.93 459.93 559.93 659.93 759.93 859.93 959.93 ~ 25 v 0.01693 16.30.1 16.558 17.829 19.076 20.307 21.527 22.740 25.153 27.557 29.954 32.348 34.740 37.130 39.518 C'l
(240.07) h 208.52 1160.6 1165.6 1190.2 1214.5 1238.5 l;262.5 1286.4 1334.6 1383.3 1432.7 1483.0 1534.2 1586.2 1639.2 --l 0.3535 1.7141 1.7212 1.7547 1.7856 1.8145 1.8415 1.8672 1.9149 1.9588 1.9997 2.0381 2.0744 2.1089 2.1418 0
Sh 49.66 99.66 149.66 199.66 249.66 349.66 449.66 549.66 649.66 749.66 849.66 949.66 ~ 30 v 0.01701 13.744 14.810 15.859 16.892 17.914 18.929 20.945 22.951 24.952 26.949 28.943 30.936 32.927 ~ (250.34) h 218.93 1164.1 1189.0 1213.6 1237.8 1261.9 1286.0 1334.2 1383.0 1432.5 1482.8 1534.0 1586.1 1639.0
0.3682 1.6995 1.7334 1.7647 1.7937 1.8210 1.8467 1.8946 1.9386 1.9795 2.0179 2.0543 2.0888 2.1217
Sh 40.71 90.71 140.71 190.71 240.71 340.71 440.71 540.71 640.71 740.71 840.71 940.71 35 v 0.01708 11.896 12.654 13.562 14.453 15.334 16.207 17.939 19.662 21.379 23.092 24.803 26.512 28.220
(259.29) h 228.03 1167.1 1187.8 1212.7 1237.1 1261.3 1285.5 1333.9 1382.8 1432.3 1482.7 1533.9 1586.0 1638.9 03809 1.6872 1.7152 1.7468 1.7761 1.8035 1.8294 1.8774 1.9214 1.9624 2.0009 2.0372 2.0717 2.1046
Sh 32.75 82.75 l32.75 182.75 232.75 332.75 432.75 532.75 632.75 732.75 832.75 932.75 40 v 0.01715 10.497 11.036 11.838 12.624 13.398 14.165 15.685 17.195 18.699 20.199 21.697 23.194 24.689
(l{lJn1i' ~ d?6 14 'if,@ Q 1 i'fL\lWiiF 1??E • 1 Z"C 0 m£g tU'lC 1'lQ1..£ lt1?'l.:1 14..21 ~ 1~::I:2"'L--....l.c::Q~Q 1.-'20 Q
0.3921 1.6765 1.6992 1.7312 1.7608 1.7883 1.8143 1.8624 1.9065 1.9476 1.9860 2.0224 2.0569 2.0899
""tJ . - -- • b.l12,"'", ~O-:J~q. "-'--(j.iO~ ~."t2'" 1O.v02O 1O.UOO ,L.1 • .:JUQ J.,I;; • .J,I;;;7 1.":}.I"t.1 .1"t~~r"'.i'b:.1-.JU .1/ • .:J.JU J.t..3~
(281.02) h 250.21 1174.1 1184.1 1209.9 1234.9 1259.6 1284.1 1332.9 l382.0 1431.7 1482.2 1533.4 1585.6 1638.6 0.4112 1.6586 1.6720 1.7048 1.7349 1.7628 1.7890 1.8374 1.8816 1.9227 1.9613 1.9977 2.0322 2.0652
Sh 7.29 57.29 107.29 157.29 207.29 307.29 407.29 507.29 607.29 707.29 807.29 907.29 60 v 0.1738 7.174 7.257 7.815 8.354 8.881 9.400 10.425 11.438 12.446 l3.450 14.452 15.452 16.450
(292.71) h 262.21 1177.6 1181.6 1208.0 1233.5 1258.5 1283.2 l332.3 l381.5 1431.3 1481.8 lS33.2 1585.3 1638.4 0.4273 1.6440 1.6492 1.6934 1.7134 1.7417 1.7681 1.8168 1.8612 1.9024 1.9410 1.9774 2.0120 2.0450
Sh 47,07 97.07 147.07 197.07 297.07 397.07 497.07 597.07 697.07 797.07 897.07 70 v 0.01748 6.205 6.664 7.l33 7.590 8.039 8.922 9.793 10.659 11.522 12.382 l3.240 14.097
(302.93) h 272.74 1180.6 1206.0 1232.0 1257.3 1282.2 l331.6 l381.0 1430.9 1481.5 1532.9 1585.1 1638.2 0.4411 1.6316 1.6640 1.6951 1.7237 1.7504 1.7993 1.8439 1.8852 1.9238 1.9603 l.9949 2.0279

Table 3 (continued)
Abs. Press LbjSq In. Sat. Sat. Temperature-Degrees Fahrenheit
(Sat. Temp) Water Stearn 350 400 450 500 550 600 700 BOO 900 1000 1100 1200 1300 1400
Sh 37.96 87.96 137.96 187.96 237.96 287.96 387.96 487.96 587.96 687.96 787.96 887.96 987.96 1087.96 80 v 0.01757 5.471 5.801 6.218 6.622 7.018 7.408 7.794 8.560 9.319 10.075 10.829 11.581 12.331 13.081 13.829
(312.04) h 282.15 1183.1 1204.0 1230.5 1256.1 1281.3 1306.2 1330.9 1380.5 1430.5 1481.1 1532.6 1584.9 1638.0 1692.0 1746.8 0.4534 1.6208 1.6473 1.6790 1.7080 1.7349 1.1602 1.1842 1.8289 1.8702 1.9089 1.9454 1.9800 2.0131 2.0446 2.0750
Sh 29.72 79.72 129.72 179.72 229.72 279.72 379.72 479.72 579.72 679.72 779.72 879.72 979.72 1079.72 90 v 0.01766 4.895 5.128 5.505 5.869 6.223 6.572 6.917 7.600 8.277 8.950 9.621 10.290 10.958 11.625 12.290
(320.28) h 290.69 1185.3 1202.0 1228.9 1254.9 1280.3 l305.4 1330.2 1380.0 1430.1 1480.8 1532.3 1584.6 1637.8 1691.8 1746.7 0.4643 1.6113 1.6323 1.6646 1.0940 1.7212 1.7467 1.7707 1.8156 1.8570 1.8957 1.9323 1.9669 2.0000 2.0316 2.0619
Sh 22.18 72.18 122.18 172.18 222.18 272.18 372.18 472.18 572.18 672.18 772.18 872.18 972.18 1072.18 100 v 0.01774 4.431 4.590 4.935 5.266 5.588 5.904 6.216 6.833 7.443 8.050 8.655 9.258 9.860 10.460 11.060
(327.82) h 298.54 llB7.2 1199.9 1227.4 1253.7 1279.3 1304.6 1329.6 1379.5 1429.7 1480.4 1532.0 1584.4 1637.6 1691.6 1746.5 0.4743 1.6027 1.6187 1.6516 1.6814 1.7088 1.7344 1.7586 1.8036 1.8451 l.8839 1.9205 l.9552 1.9883 2.0199 2.0502
Sh 15.21 65.21 115.21 165.21 215.21 265.21 365.21 465.21 565.21 665.21 765.21 865.21 965.21 1065.21 110 v 0.01782 4.048 4.149 4.468 4.772 5.068· 5.357 5.642 6.205 6.761 7.314 7.865 8.413 8.961 9.507 10.053
(334.79) h 305.80 1188.9 1197.7 1225.8 1252.5 1278.3 1303.8 1328.9 1379.0 1429.2 1480.1 1531.7 1584.1 1637.4 1691.4 1746.4 s 0.4834 l.5950 1.6061 1.6396 1.6698 1.6975 1.7233 1.7476 1.7928 l.8344 1.8732 1.9099 1.9446 1.9777 2.0093 2.0397
Sh 8.73 58.73 108.73 158.73 208.73 258.73 358.73 458.73 558.73 658.73 758.73 858.73 958.73 1058.73 120 v 0.01789 3.7275 3.7815 4.0786 4.3610 4.6341 4.9009 5.1637 5.6813 6.1928 6.7006 7.2060 7.7096 8.2119 8.7130 9.2134
(341.27) h 312.58 1190.4 1195.6 1224.1 1251.2 1277.4 1302.9 1328.2 1378.4 1428.8 1479.8 1531.4 1583.9 1637.1 1691.3 1746.2 CIl --l
0.4919 1.5879 1.5943 1.6286 1.6592 1.6872 1.7132 1.7376 1.7829 1.8246 1.8635 1.9001 1.9349 19680 1.9996 2.0300 i:"l
146.96 196.96 - i·
446.96 546.96 646.96 746.96 846.96 946.96 1046.96 > Sh 49.96 96.96 246.96 346.96 :::::
140 v 0.01803 3.2190 3.4661 3.7143 3.9526 4.1844 4.4119 4.8588 5.2995 5.7364 6.1709 6.6036 7.0349 7.4652 7.8946 --l
(353.04) h 324.96 1193.0 1220.8 1248.7 1275.3 1301.3 1326.8 1377.4 1428.0 1479.1 1530.8 1583.4 1636.7 1690.9 1745.9 > 0.5071 1.5752 1.6085 1.6400 1.6686 1.6949 1.7196 1.7652 1.8071 l.8461 l.8828 1.9176 1.9508 1.9825 2.0129 !:Xi
r;; CIl
N N IN
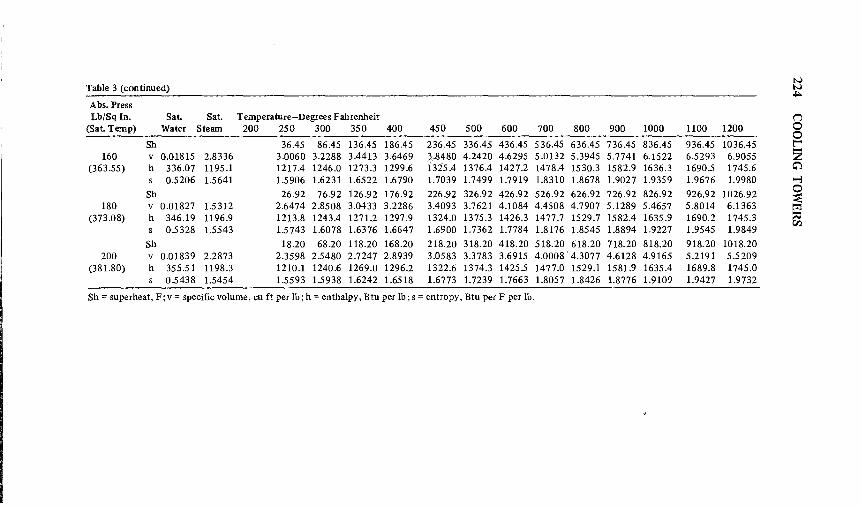
N Table 3 (continued) N
.j::..
Abs. Press Lb/Sq In. Sat. Sat. Temperature-Degrees Fahrenheit ("'J
(Sat. Temp) Water Steam 200 250 300 350 400 450 500 600 700 800 900 1000 1100 1200 0 0
Sh 36.45 86.45 136.45 186.45 236.45 336.45 436.45 536.45 636.45 736.45 836.45 936.45 1036.45 t""' 160 v 0.01815 2.8336 3.0060 3.2288 3.4413 3.6469 3 .. 8480 4.2420 4.6295 5.0132 5.3945 5.7741 6.1522 6.5293 6.9055 Z
(363.55) h 336.07 1195.1 1217.4 1246.0 1273.3 1299.6 1325.4 1376.4 1427.2 1478.4 1530.3 1582.9 1636.3 1690.5 1745.6 C'l 0.5206 1.5641 1.5906 1.6231 1.6522 1.6790 1.7039 1.7499 1.7919 1.8310 1.8678 1.9027 1.9359 1.9676 1.9980 --l
Sh 26.92 76.92 126.92 176.92 226.92 326.92 426.92 526.92 626.92 726.92 826.92 926.92 1026.92 0 ~
180 v 0.01827 1.5312 2.6474 2.8508 3.0433 3.2286 3.4093 3.7621 4.1084 4.4508 4.7907 5.1289 5.4657 5.8014 6.1363 i:"l (373.08) h 346.19 1196.9 1213.8 1243.4 1271.2 1297.9 1324.0 1375.3 1426.3 1477.7 1529.7 1582.4 1635.9 1690.2 1745.3 ::tI
CIl 0.5328 1.5543 1.5743 1.6078 1.6376 1.6647 1.6900 1.7362 1.7784 1.8176 1.8545 1.8894 1.9227 1.9545 1.9849
Sh 18.20 68.20 118.20 168.20 218.20 318.20 418.20 518.20 618.20 718.20 818.20 918.20 1018.20 200 v 0.01839 2.2873 2.3598 2.5480 2.7247 2.8939 3.0583 3.3783 3.6915 4.0008 4.3077 4.6128 4.9165 5.2191 5.5209
(381.80) h 355.51 1198.3 1210.1 1240.6 1269.0 1296.2 1322.6 1374.3 1425.5 1477.0 1529.1 1581.9 1635.4 1689.8 1745.0 0.5438 1.5454 1.5593 1.5938 1.6242 1.6518 1.6773 1.7239 1.7663 1.8057 1.8426 1.8776 1.9109 1.9427 1.9732
Sh = superheat, F; v = specific volume, cu ft per lb; h = enthalpy, Btu per lb; s = entropy. Btu per F per lb.

APPENDIXB
CONVERSION FACTORS
Multiply By To Obtain
Acres 43.560 Square feet Acres 4,047 Square meters Acres 1.562 x 10⁻³ Square miles Acres 4840 Square yards Acre-feet 43.560 Cubic-feet Acre-feet 3.259 x 10 5 Gallons Angstrom units 3.937 x 10⁻⁹ Inches Atmospheres 76.0 Centimeters of mercury Atmospheres 29.92 Inches of mercury Atmospheres 33.90 Feet of water Atmospheres 10,333 Kilograms/square meter Atmospheres 14.70 Pounds/square inch Atmospheres 1.058 Tons/square foot Barrels (British, dry) 5.780 Cubic feet Barrels (British, dry) 0.1637 Cubic meters Barrels (British, dry) 36 Gallons (British) Barrels, cement 170.6 Kilograms Barrels, cement 376 Pounds of cement Barrels, oil' 42 Gallons (U.S.) Barrels, (U.S., liquid) 4.211 Cubic feet Barrels, (US., liquid) 0.1192 Cubic meters Barrels (U.S., liquid) 31.5 Gallons (U.S.) Bars 0.9869 Atmospheres Bars 1 x 10 6 Dynes/square centimeter Bars 1.020 x 10⁴ Kilograms/square meter Bars 2.089 x 10³ Pounds/square foot Bars 14.50 Pounds/square inch
225
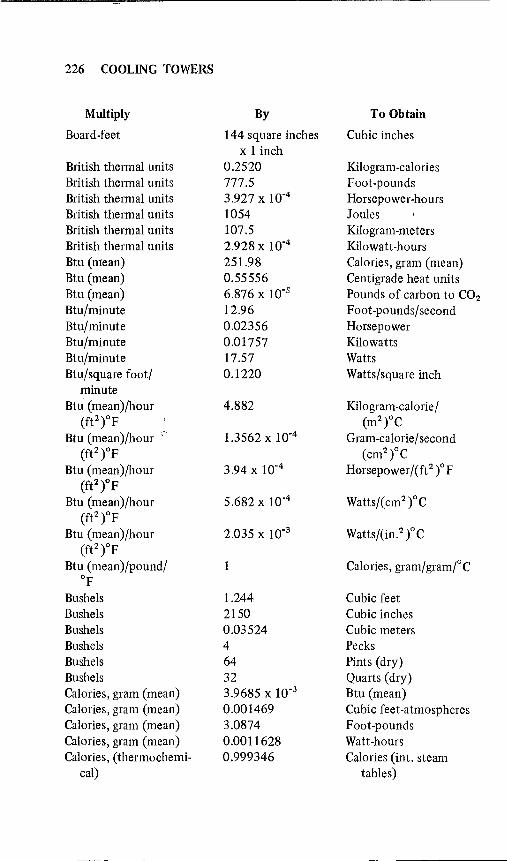
226 COOLING TOWERS
Multiply By To Obtain
Board-feet 144 square inches Cubic inches x 1 inch
British thermal units 0.2520 Kilogram-calories British thermal units 777.5 Foot-pounds British thermal units 3.927 x 10⁻⁴ Horsepower-hours British thermal units 1054 Joules British thermal units 107.5 Kilogram-meters British thermal units 2.928 x 10⁻⁴ Kilowatt-hours Btu (mean) 251.98 Calories, gram (mean) Btu (mean) 0.55556 Centigrade heat units Btu (mean) 6.876 x 10⁻⁵ Pounds of carbon to CO2 Btu/minute 12.96 Foot-pounds/second Btu/minute 0.02356 Horsepower Btu/minute 0.01757 Kilowatts Btu/minute 17.57 Watts Btu/square foot/ 0.1220 Watts/square inch
minute Btu (mean)/hour 4.882 Kilogram-calorie /
(ft2tF (m 2 tC Btu (mean)/hour 1.3562 x 10⁻⁴ Gram-calorie/second
(ft2 tF (cm2tC Btu (mean)/hour 3.94 x 10⁻⁴ Horsepower / ( ft 2 )0 F
(ft2tF Btu (mean)/hour 5.682 x 10⁻⁴ Watts/( cm2 tc
(ft2tF Btu (mean)/hour 2.035 x 10⁻³ Watts/(in.2 tc
(ft 2 tF Btu (mean)/pound/ 1 Calories, gram/gramtC
of
Bushels 1.244 Cubic feet Bushels 2150 Cubic inches Bushels 0.03524 Cubic meters Bushels 4 Pecks Bushels 64 Pints (dry) Bushels 32 Quarts (dry) Calories, gram (mean) 3.9685 x 10⁻³ Btu (mean) Calories, gram (mean) 0.001469 Cubic feet-atmospheres Calories, gram (mean) 3.0874 Foot-pounds Calories, gram (mean) 0.0011628 Watt-hours Calories, (thermochemi- 0.999346 Calories (int. steam
cal) tables)

CONVERSION FACTORS 227
Multiply By To Obtain
Calories, gram (mean)/gram 1.8 Btu (mean)/pound Centigrams 0.01 Grams Centiliters 0.01 liters Centimeters 0.0328083 Feet (U.S.) Centimeters 0.3937 Inches Centimeters 0.01 Meters Centimeters 393.7 Mils Centimeters 10 Millimeters Centimeter-dynes 1.020 x 10⁻³ Centimeter-grams Centimeter-dynes 1.020 x 10⁻⁸ Meter-kilograms Centimeter-dynes 7.376 x 10⁻⁸ Pound-feet Centimeter-grams 980.7 Centimeter-dynes Centimeter-grams 10-5 Meter-kilograms Centimeter-grams 7.233 x 10⁻⁵ Pound-feet Centimeters of 0.01316 Atmospheres
mercury Centimeters of 0.4461 Feet of water
mercury Centimeters of 136.0 Kilograms/square meter
mercury Centimeters of 27.85 Pounds/square foot
mercury Centimeters of 0.1934 Pounds/square inch
mercury Centimeters/second 1.969 Feet/minute Centimeters/second 0.03281 Feet/second Centimeters/second 0.036 Kilometers/hour Centimeters/second 0.6 Meters/minute Centimeters/second 0.02237 Miles/hour Centimeters/ second 3.728 x 10⁻⁴ Miles/minute Centimeters/ second/ 0.03281 Feet/second/second
second Centimetels/ second/ 0.036 Kilometers/hour/second
second Centimeters/ second/ 0.02237 Miles/hour/second
second Circular mils 5.067 x 10⁻⁶ Square centimeters Circular mils 7.854 x 10⁻⁷ Square inches Circular mils 0.7854 Square mils Cord-feet 4 feet x 4 feet x Cubic feet
1 foot
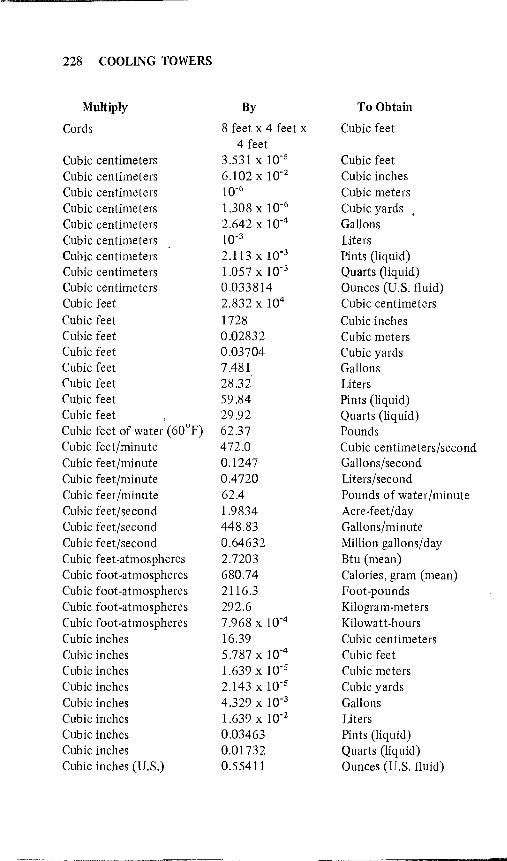
228 COOLING TOWERS
Multiply By To Obtain
Cords 8 feet x 4 feet x Cubic feet 4 feet
Cubic centimeters 3.531 x 10⁻⁵ Cubic feet Cubic centimeters 6.102 x 10⁻² Cubic inches Cubic centimeters 10-6 Cubic meters Cubic centimeters 1.308 x 10⁻⁶ Cubic yards Cubic centimeters 2.642 x 10⁻⁴ Gallons Cubic centimeters 10-3 Liters Cubic centimeters 2.113 x 10⁻³ Pints (liqUid) Cubic centimeters 1.057 x 10⁻³ Quarts (Jiq uid) Cubic centimeters 0.033814 Ounces (U.S. fluid) Cubic feet 2.832 x 10⁴ Cubic centimeters Cubic feet 1728 Cubic inches Cubic feet 0.02832 Cubic meters Cubic feet 0.03704 Cubic yards Cubic feet 7.481 Gallons Cubic feet 28.32 Liters Cubic feet 59.84 Pints (liquid) Cubic feet 29.92 Quarts (liquid) Cubic feet of water{60°F) 62.37 Pounds Cubic feet/minute 472.0 Cubic centimeters/second Cubic feet/minute 0.1247 Gallons/second Cubic feet/minute 0.4720 Liters/second Cubic feet/minute 62.4 Pounds of water/minute Cubic feet/second 1.9834 Acre-feet/day Cubic feet/second 448.83 Gallons/minute Cubic feet/second 0.64632 Million gallons/day Cubic feet-atmospheres 2.7203 Btu (mean) Cubic foot-atmospheres 680.74 Calories, gram (mean) Cubic foot-atmospheres 2116.3 Foot-pounds Cubic foot-atmospheres 292.6 Kilogram-meters Cubic foot-atmospheres 7.968 x 10⁻⁴ Kilowatt-hours Cubic inches 16.39 Cubic centimeters Cubic inches 5.787 x 10⁻⁴ Cubic feet Cubic inches 1.639 x 10⁻⁵ Cubic meters Cubic inches 2.143 x 10⁻⁵ Cubic yards Cubic inches 4.329 x 10⁻³ Gallons Cubic inches 1.639 x 10⁻² Liters Cubic inches 0.03463 Pints (liquid) Cubic inches 0.01732 Quarts (liquid) Cubic inches (U.S.) 0.55411 Ounces (U.S. fluid)
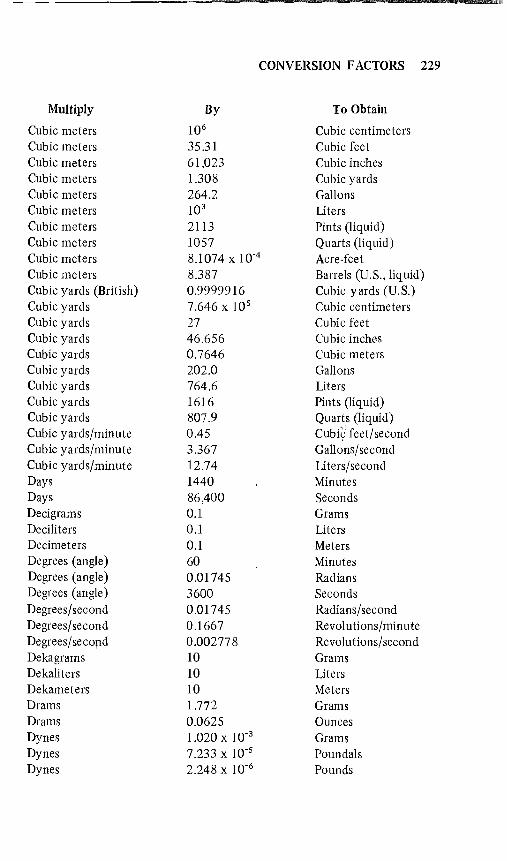
CONVERSION FACTORS 229
Multiply By To Obtain
Cubic meters 106 Cubic centimeters Cubic meters 35.31 Cubic feet Cubic meters 61,023 Cubic inches Cubic meters 1.308 Cubic yards Cubic meters 264.2 Gallons Cubic meters 103 Liters Cubic meters 2113 Pints (liquid) Cubic meters 1057 Quarts (liquid) Cubic meters 8.1074 x 10⁻⁴ Acre-feet Cubic meters 8.387 Barrels (U.S., liquid) Cubic yards (British) 0.9999916 Cubic yards (U.S.) Cubic yards 7.646 x 10⁵ Cubic centimeters Cubic yards 27 Cubic feet Cubic yards 46.656 Cubic inches Cubic yards 0.7646 Cubic meters Cubic yards 202.0 Gallons Cubic yards 764.6 Liters Cubic yards 1616 Pints (liquid) Cubic yards 807.9 Quarts (liquid) Cubic yards/minute 0.45 Cubi~\ feet/ second Cubic yards/minute 3.367 Gallons/second Cubic yards/minute 12.74 Liters/second Days 1440 Minutes Days 86,400 Seconds Decigrams 0.1 Grams Deciliters 0.1 Liters Decimeters 0.1 Meters Degrees (angle) 60 Minutes Degrees (angle) 0.01745 Radians Degrees (angle) 3600 Seconds Degrees/second 0.01745 Radians/second Degrees/second 0.1667 Revolutions/minute Degrees/secord 0.002778 Revolutions/second Dekagrams 10 Grams Dekaliters 10 Liters Dekameters 10 Meters Drams 1.772 Grams Drams 0.0625 Ounces Dynes 1.020 x 10⁻³ Grams Dynes 7.233 x 10⁻⁵ Poundals Dynes 2.248 x 10⁻⁶ Pounds
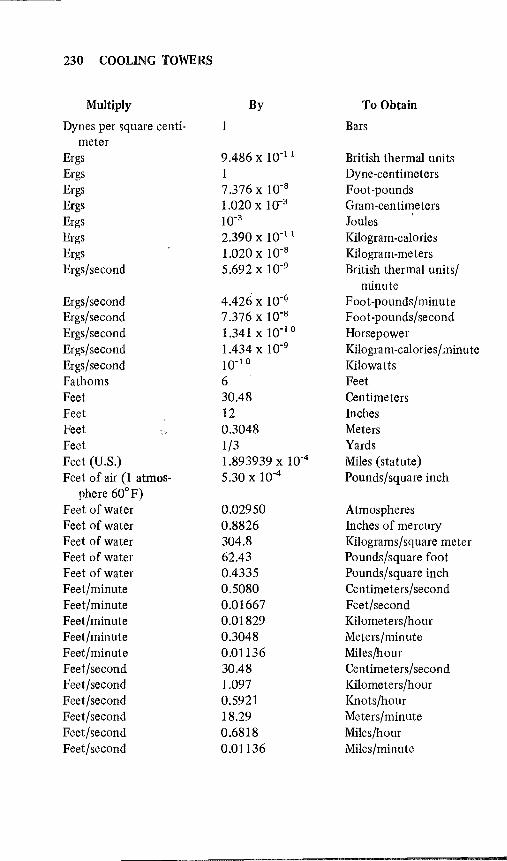
230 COOLING TOWERS
Multiply By To Obtain
Dynes per square centi- Bars meter
Ergs 9.486 x 10⁻¹ I British thermal units Ergs 1 Dyne-centimeters Ergs 7.376 x 10⁻⁸ Foot-pounds Ergs 1.020 x 1(f3 Gram-centimeters Ergs 10-3 Joules Ergs 2.390 x 10⁻¹ I Kilogram-calories Ergs 1.020 x 10⁻⁸ Kilogram-meters Ergs/second 5.692 x 10⁻⁹ British thermal units/
minute Ergs/second 4.426 x 10⁻⁶ Foot-pounds/minute Ergs/second 7.376 x 10⁻⁸ Foot-pounds/second Ergs/second 1.341 x 10⁻¹⁰ Horsepower Ergs/second 1.434 x 10⁻⁹ Kilogram-calories/minute Ergs/second 10-10 Kilowatts Fathoms 6 Feet Feet 30.48 Centimeters Feet 12 Inches Feet 0.3048 Meters Feet 1/3 Yards Feet (U.S.) 1.893939 x 10⁻⁴ Miles (statute) Feet of air (1 atmos- 5.30 x 10⁻⁴ Pounds/square inch
phere 60°F) Feet of water 0.02950 Atmospheres Feet of water 0.8826 Inches of mercury Feet of water 304.8 Kilograms/square meter Feet of water 62.43 Pounds/square foot Feet of water 0.4335 Pounds/square inch Feet/minute 0.5080 Centimeters/second Feet/minute 0.01667 Feet/second Feet/minute 0.01829 Kilometers/hour Feet/minute 0.3048 Meters/minute Feet/minute 0.01136 Miles/hour Feet/second 30.48 Centimeters/second Feet/second 1.097 Kilometers/hour Feet/second 0.5921 Knots/hour Feet/second 18.29 Meters/minute Feet/second 0.6818 Miles/hour Feet/second 0.Q1136 Miles/minute

CONVERSION FACTORS 231
Multiply By To Obtain
Feet/100 feet 1 Percent Grade Feet/second/second 30.48 Centimeters/second/
second Feet/second/second 1.097 Kilometers/hour/second Feet/second/second 0.304'8 Meters/second/second Feet/second/second 0.6818 Miles/hour/second Foot-poundals 3.9951 x 10⁻⁵ Btu (mean) Foot-poundals 0.0421420 Joules (abs) Foot-pounds 0.013381 Liter-atmospheres Foot-pounds 3.7662 x 10⁻⁴ Watt-hours (abs) Foot-pounds 1.286 x 10⁻³ British thermal units Foot-pounds 1.356 x 10⁷ Ergs Foot-pounds 5.050 x 10⁻⁷ Horsepower-hours Foot-pounds 1.356 Joules Foot-pounds 3.241 x 10⁻⁴ Kilogram-calories Foot-pounds 0.1383 Kilogram-meters Foot-pounds 3.766 x 10⁻⁷ Kilowatt-hours Foot-pounds/minute 1.286 x 10⁻³ British thermal units/
minute Foot-pounds/minute 0.01667 Foot-pounds/second Foot-pounds/minute 3.030 x 10⁻⁵ Horsepower Foot -pounds/minute 3.241 x 10⁻⁴ Kilogram-calories/minute Foot-pounds/minute 2.260 x 10⁻⁵ , Kilowatts Foot-pounds/second 7.717 x 10⁻² British thermal units/
minute Foot-pounds/second 1.818xlO-3 Horsepower Foot-pounds/second 1.945 x 10⁻² Kilogram-calories/minute Foot-pounds/second 1.356 x 10⁻³ Kilowatts Foot-pounds/second 4.6275 Btu (mean)/hour Foot-pounds/second 1.35582 Watts (abs) Gallons (British) 4516.086 Cubic centimeters Gallons (British) 1.20094 Gailons (U.S.) Gallons (British) 10 Pounds (avordupois) of
of water at 62°F Gallons (U.S.) 128 Ounces (U.S. fluid) Gallons 3785 Cubic centimeters Gallons 0.1337 Cubic feet Gallons 231 Cubic inches Gallons 3.785 x 10⁻³ Cubic meters Gallons 4.951 x 10⁻³ Cubic yards Gallons 3.785 Liters
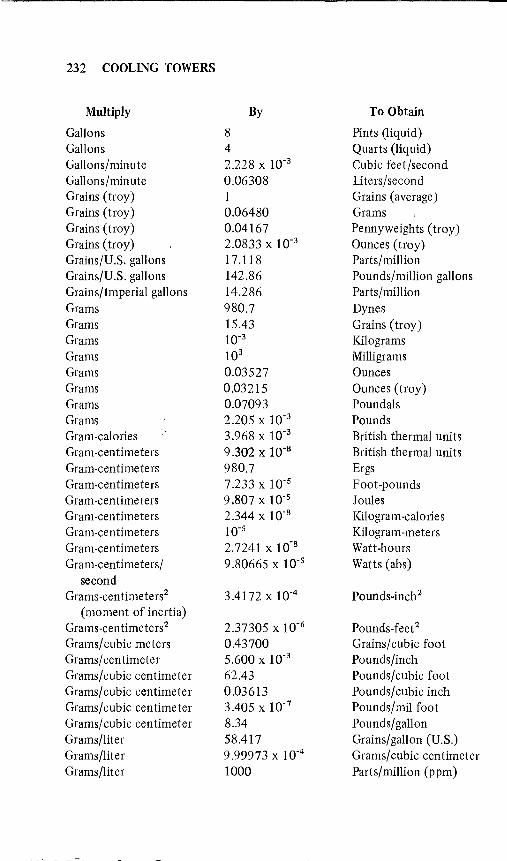
232 COOLING TOWERS
Multiply
Gallons Gallons Gallons/minute Gallons/minute Grains (troy) Grains (troy) Grains (troy) Grains (troy) Grains/U.S. gallons Grains/U.S. gallons Grains/Imperial gallons Grams Grams Grams Grams Grams Grams Grams Grams Gram-calories Gram-centimeters Gram -cen time te rs Gram-centimeters Gram-centimeters Gram-centimeters Gram-centimeters Gram-centimeters Gram-centimeters/
second Grams-centimeters2
(moment of inertia) Grams-centimeters2
Grams/cubic meters Grams/centimeter Grams/cubic centimeter Grams/cubic centimeter Grams/cubic centimeter Grams/ cubic centimeter Grams/liter Grams/liter Grams/liter
By
8 4 2.228 x 10⁻³
0.06308 1 0.06480 0.04167 2.0833 x 10⁻³
17.118 142.86 14.286 980.7 15.43 10-3
103
0.03527 0.03215 0.07093 2.205 x 10⁻³
3.968 x 10⁻³
9.302 x 10⁻⁸
980.7 7.233 x 10⁻⁵
9.807 x 10⁻⁵
2.344 x 10⁻⁸
10-5
2.7241 x 10⁻⁸
9.80665 x 10⁻⁵
3.4172 x 10⁻⁴
2.37305 x 10⁻⁶
0.43700 5.600 x 10⁻³
62.43 0.03613 3.405 x 10⁻⁷
8.34 58.417 9.99973 x 10⁻⁴
1000
To Obtain
Pints (liquid) Quarts (liquid) Cubic feet/second Liters/second Grains (average) Grams Pennyweights (troy) Ounces (troy) Parts/million Pounds/million gallons Parts/million Dynes Grains (troy) Kilograms Milligrams Ounces Ounces (troy) Poundals Pounds British thermal units British thermal units Ergs Foot-pounds Joules Kilogram-calories Kilogram-meters Watt-hours Watts (abs)
Pounds-inch2
Pounds-feet2
Grains/cubic foot Pounds/inch Pounds/cubic foot Pounds/cubic inch Pounds/mil foot Pounds/ gallon Grains/gallon (U.S.) Grams/cubic centimeter Parts/million (ppm)
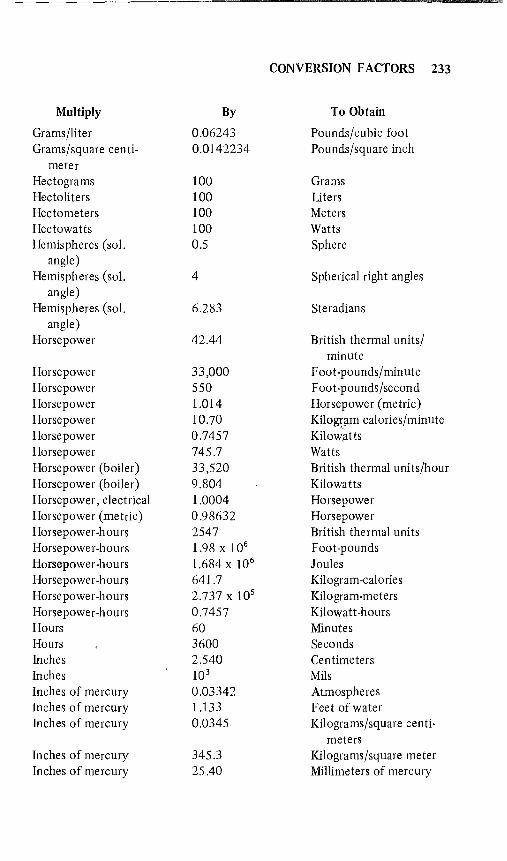
CONVERSION FACTORS 233
Multiply By To Obtain
Grams/liter 0.06243 Pounds/cubic foot Grams/square centi- 0.0142234 Pounds/square inch
meter Hectograms 100 Grams Hectoliters 100 Liters Hectometers 100 Meters Hectowatts 100 Watts Hemispheres (sol. 0.5 Sphere
angle) Hemispheres (sol. 4 Spherical right angles
angle) Hemispheres (sol. 6.283 Steradians
angle) Horsepower 42.44 British thermal units/
minute Horsepower 33,000 Foot-pounds/minute Horsepower 550 Foot-pounds/second Horsepower 1.014 Horsepower (metric) Horsepower 10.70 Kilogram calories/minute
~.
Horsepower 0.7457 Kilowatts Horsepower 745.7 Watts Horsepower (boiler) 33,520 British thermal unifs/hour Horsepower (boiler) 9.804 Kilowatts Horsepower, electrical 1.0004 Horsepower Horsepower (me tric) 0.98632 Horsepower Horsepower-hours 2547 British thermal units Horsepower-hours 1.98 x 10⁶ Foot-pounds Horsepower-hours 1.684 x 10⁶ Joules Horsepower -hours 641.7 Kilogram-calories Horsepower-hours 2.737 x 10⁵ Kilo gram-meters Horsepower-hours 0.7457 Kilowatt-hours Hours 60 Minutes Hours 3600 Seconds Inches 2.540 Centimeters Inches 103 Mils Inches of mercury 0.03342 Atmospheres Inches of mercury 1.133 Feet of water Inches of mercury 0.0345 Kilograms/square centi-
meters Inches of mercury 345.3 Kilograms/square meter Inches of mercury 25.40 Millimeters of mercury
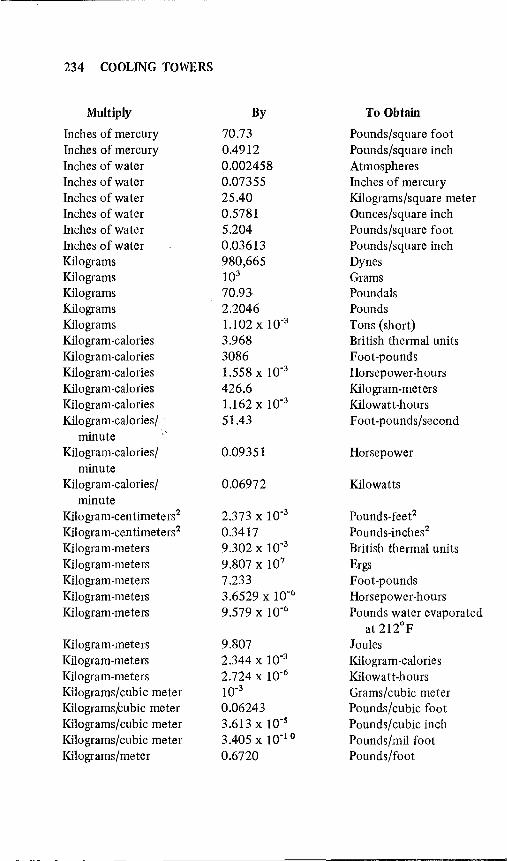
234 COOLING TOWERS
Multiply By To Obtain
Inches of mercury 70.73 Pounds/square foot Inches of mercury 0.4912 Pounds/square inch Inches of water 0.002458 Atmospheres Inches of water 0.07355 Inches of mercury Inches of water 25.40 Kilograms/square meter Inches of water 0.5781 Ounces/square inch Inches of water 5.204 Pounds/square foot Inches of water 0.03613 Pounds/square inch Kilograms 980,665 Dynes Kilograms 103 Grams Kilograms 70.93 Poundals Kilograms 2.2046 Pounds Kilograms 1.102 x 10⁻³ Tons (short) Kilogram-calories 3.968 British thermal units Kilogram-calories 3086 Foot-pounds Kilogram-calories 1.558 x 10⁻³ Horsepower -hours Kilogram-calories 426.6 Kilogram-meters Kilogram-calories 1.162 x 10⁻³ Kilowatt-hours Kilogram-calories/ . 51.43 Foot-pounds/second
minute Kilogram-calories/ 0.09351 Horsepower
minute Kilogram-calories/ 0.06972 Kilowatts
minute Kilo gram -cen timeters 2 2.373 x 10⁻³ Pounds-feet2
Kilogram-centimeters2 0.3417 Pounds-inches2
Kilogram-meters 9.302 x 10⁻³ British thermal units Kilogram-meters 9.807 x 10⁷ Ergs Kilogram-meters 7.233 Foot-pounds Kilogram-meters 3.6529 x 10⁻⁶ Horsepower-hours Kilogram-meters 9.579 x 10⁻⁶ Pounds water evaporated
at 212°F Kilogram-meters 9.807 Joules Kilogram-meters 2.344 x 10⁻³ Kilogram-calories Kilogram-meters 2.724 x 10⁻⁶ Kilowa tt-hours Kilograms/cubic meter 10-3 Grams/cubic meter Kilograms,tubic meter 0.06243 Pounds/cubic foot Kilograms/cubic meter 3.613 x 10⁻⁵ Pounds/cubic inch Kilograms/cubic meter 3.405 x 10⁻¹⁰ Pounds/mil foot Kilograms/meter 0.6720 Pounds/foot
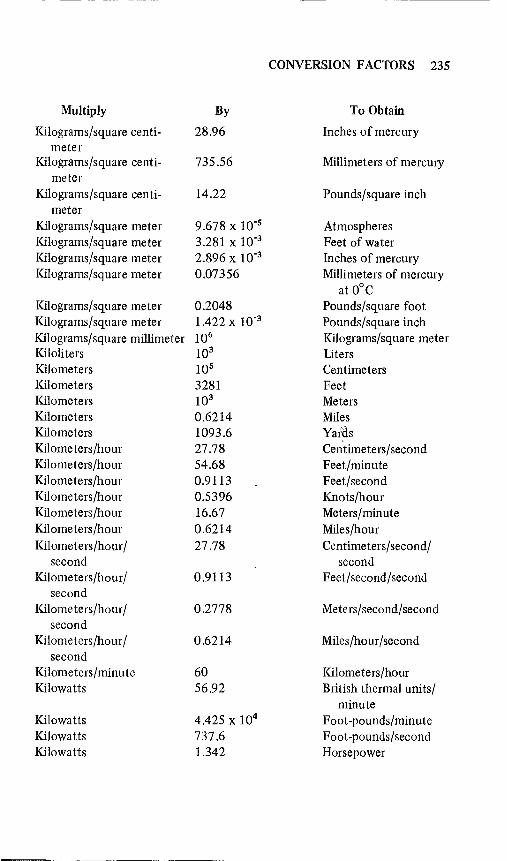
CONVERSION FACTORS 235
Multiply By To Obtain
Kilograms/square centi- 28.96 Inches of mercury meter
Kilograms/square centi- 735.56 Millimeters of mercury meter
Kilograms/square centi- 14.22 Pounds/square inch meter
Kilograms/square meter 9.678 x 10⁻⁵ Atmospheres Kilograms/square meter 3.281 x 10⁻³ Feet of water Kilograms/square meter 2.896 x 10⁻³ Inches of mercury Kilograms/square meter 0.07356 Millimeters of mercury
at O°C Kilograms/square meter 0.2048 Pounds/square foot Kilograms/square meter 1.422 x 10⁻³ Pounds/square inch Kilograms/ square millimeter 106 Kilograms/square meter Kiloliters 103 Liters Kilometers 105 Centimeters Kilometers 3281 Feet Kilometers 103 Meters Kilometers 0.6214 Miles Kilometers 1093.6 Yarlfs Kilometers/hour 27.78 Centimeters/second Kilometers/hour 54.68 Feet/minute Kilometers/hour 0.9113 Feet/second Kilometers/hour 0.5396 Knots/hour Kilometers/hour 16.67 Meters/minute Kilometers/hour 0.6214 Miles/hour Kilometers/hour / 27.78 Centimeters/second/
second second Kilometers/hour/ 0.9113 Feet/second/second
second Kilometers/hour/ 0.2778 Meters/second/second
second Kilometers/hour/ 0.6214 Miles/hour/second
second Kilometers/minute 60 Kilometers/hour Kilowatts 56.92 British thermal units/
minute Kilowatts 4.425 x 10⁴ Foot-pounds/minute Kilowatts 737.6 Foot-pounds/second Kilowatts 1.342 Horsepower
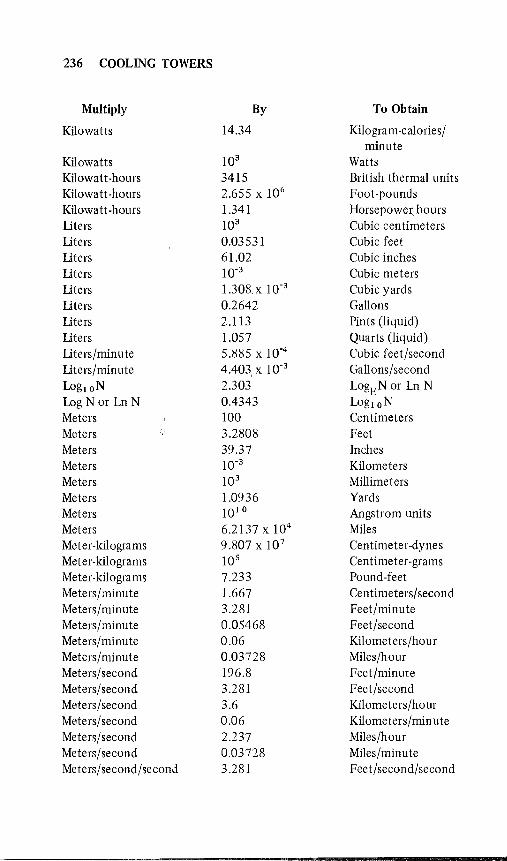
236 COOLING TOWERS
Multiply By To Obtain
Kilowatts 14.34 Kilogram-calories/ minute
Kilowatts 103 Watts Kilowa tt -hours 3415 British thermal units Kilowatt-hours 2.655 x 10⁶ Foot-pounds Kilowatt-hours 1.341 Horsepower, hours Liters 103 Cubic centimeters Liters 0.03531 Cubic feet Liters 61.02 Cubic inches Liters 10-3 Cubic meters Liters 1.308. x 10-3 Cubic yards Liters 0.2642 Gallons Liters 2.113 Pints (liquid) Liters 1.057 Quarts (liquid) Liters/minute 5.885 x 10⁻⁴ Cubic feet/second Liters/minute 4.403, x 10-3 Gallons/second Log, oN 2.303 LogEN or Ln N Log N or Ln N 0.4343 Log, oN Meters 100 Centimeters Meters 3.2808 Feet Meters 39.37 Inches Meters 10-3 Kilometers Meters 103 Millimeters Meters 1.0936 Yards Meters 10'0 Angstrom units Meters 6.2137 x 10⁴ Miles Meter-kilograms 9.807 x 10 7 Centimeter-dynes Meter-kilograms 10 5 Centimeter-grams Meter-kilograms 7.233 Pound-feet Meters/minute 1.667 Centimeters/second Meters/minute 3.281 Feet/minute Meters/minute 0.05468 Feet/second Meters/minute 0.06 Kilometers/hour Meters/minute 0.03728 Miles/hour Meters/ second 196.8 Feet/minute Meters/second 3.281 Feet/second Meters/second 3.6 Kilometers/hour Meters/second 0.06 Kilometers/min ute Meters/ second 2.237 Miles/hour Meters/second 0.03728 Miles/minute Meters/second/second 3.281 Feet/second/second
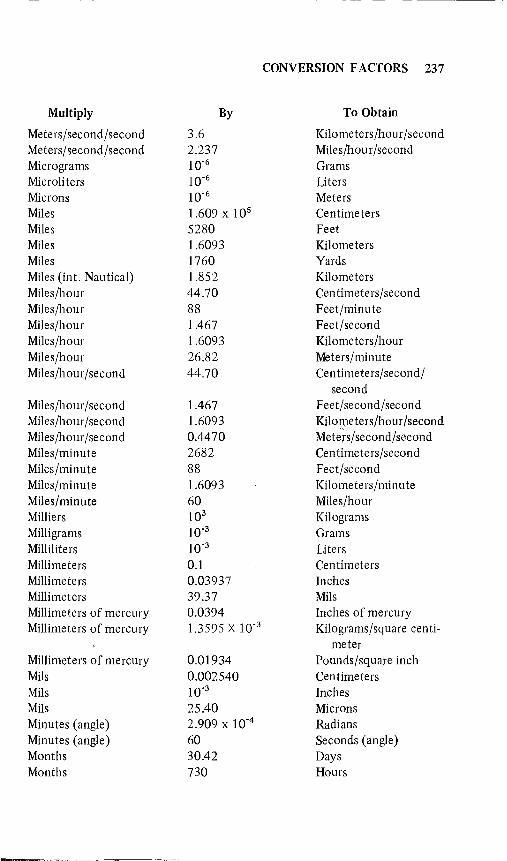
CONVERSION FACTORS 237
Multiply By To Obtain
Meters/second/second 3.6 Kilometers/hour/second Meters/second/second 2.237 Miles/hour/second Micrograms 10-6 Grams Microliters 10-6 Liters Microns 10-6 Meters Miles 1.609 x lOs Centimeters Miles 5280 Feet Miles 1.6093 Kilometers Miles 1760 Yards Miles (int. Nautical) 1.852 Kilometers Miles/hour 44.70 Centimeters/second Miles/hour 88 Feet/minute Miles/hour 1.467 Feet/second Miles/hour 1.6093 Kilometers/hour Miles/hour 26.82 Meters/minute Miles/hour/second 44.70 Centimeters/second/
second Miles/hour /second 1.467 Feet/second/second Miles/hour /second 1.6093 KiloIl)eters/hour /second Miles/hour /second 0.4470 Met~rs/second/second Miles/minute 2682 Centimeters/second Miles/minute 88 Feet/second Miles/minute 1.6093 Kilometers/minute Miles/minute 60 Miles/hour Milliers 103 Kilograms Milligrams 10-3 Grams Millili te rs 10-3 Liters Millimeters 0.1 Centimeters Millimeters 0.03937 Inches Millimeters 39.37 Mils Millimeters of mercury 0.0394 Inches of mercury Millimeters of mercury 1.3595 X 10⁻³ Kilograms/square centi-
meter Millimeters of mercury 0.01934 Pounds/square inch Mils 0.002540 Centimeters Mils 10-3 Inches Mils 25.40 Microns Minutes (angle) 2.909 x 10⁻⁴ Radians Minutes (angle) 60 Seconds (angle) Months 30.42 Days Months 730 Hours
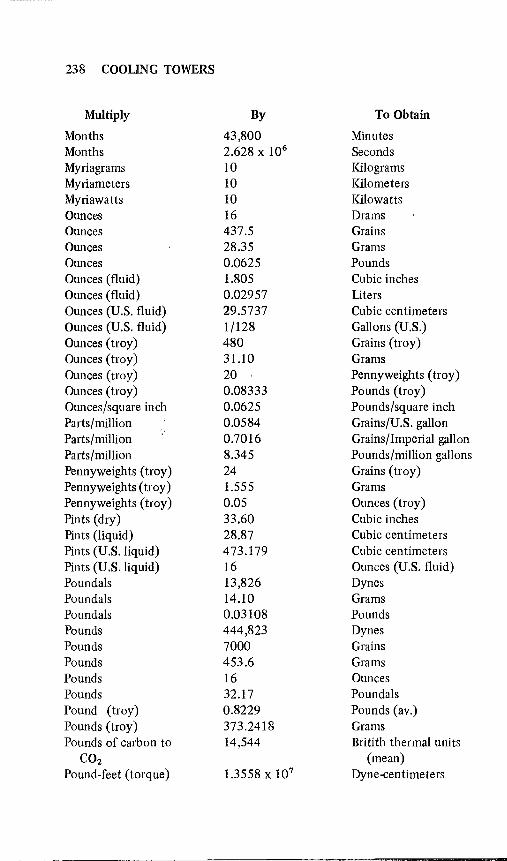
238 COOLING TOWERS
Multiply By To Obtain
Months 43,800 Minutes Months 2.628 x 10⁶ Seconds Myriagrams 10 Kilograms Myriameters 10 Kilometers Myriawatts 10 Kilowatts Ounces 16 Drams Ounces 437.5 Grains Ounces 28.35 Grams Ounces 0.0625 Pounds Ounces (fluid) 1.805 Cubic inches Ounces (fluid) 0.02957 liters Ounces (U.S. fluid) 29.5737 Cubic centimeters Ounces (U.S. fluid) 1/128 Gallons (U.S.) Ounces (troy) 480 Grains (troy) Ounces (troy) 31.10 Grams Ounces (troy) 20 Pennyweights (troy) Ounces (troy) 0.08333 Pounds (troy) Ounces/square inch 0.0625 Pounds/square inch Parts/million 0.0584 Grains/U.S. gallon Parts/million 0.7016 Grains/Imperial gallon Parts/million 8.345 Pounds/million gallons Pennyweights (troy) 24 Grains (troy) Pennyweights (troy) 1.555 Grams Pennyweights (troy) 0.05 Ounces (troy) Pints (dry) 33.60 Cubic inches Pints (liquid) 28.87 Cubic centimeters Pints (U.S. liquid) 473.179 Cubic centimeters Pints (U.S. liquid) 16 Ounces (U.S. flUid) Poundals 13,826 Dynes Poundals 14.10 Grams Poundals 0.03108 Pounds Pounds 444,823 Dynes Pounds 7000 Grains Pounds 453.6 Grams Pounds 16 Ounces Pounds 32.17 Poundals Pound (troy) 0.8229 Pounds (av.) Pounds (troy) 373.2418 Grams Pounds of carbon to 14,544 Britith thermal units
CO2 (mean) Pound-feet (torque) 1.3558 x 10⁷ Dyne-centimeters
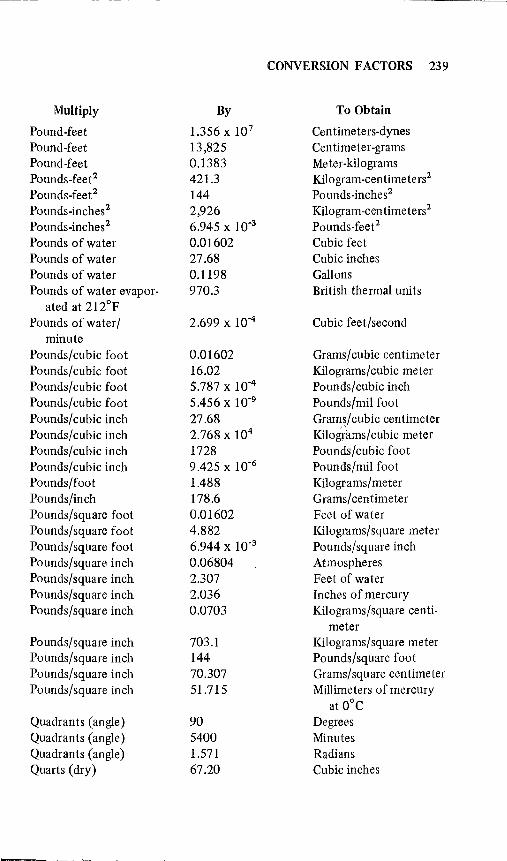
CONVERSION FACTORS 239
Multiply By To Obtain
Pound-feet 1.356 x 10⁷ Centimeters-dynes Pound-feet 13,825 Centimeter-grams Pound-feet 0.1383 Meter-kilograms Pounds-feet2 421.3 Kilogram-centimeters2
Pounds-feee 144 Pounds-inches2
Pounds-inches 2 2,926 Kilogram-centimeters2
Pounds-inches2 6.945 x 10⁻³ Pounds-feet2
Pounds of water 0.01602 Cubic feet Pounds of water 27.68 Cubic inches Pounds of water 0.1198 Gallons Pounds of water evapor- 970.3 British thermal units
ated at 212°F Pounds of water / 2.699 x 10⁻⁴ Cubic feet/second
minute Pounds/cubic foot 0.01602 Grams/cubic centimeter Pounds/cubic foot 16.02 Kilograms/cubic meter Pounds/cubic foot 5.787 x 10⁻⁴ Pounds/cubic inch Pounds/cubic foot 5,456 x 10-9 Pounds/mil foot Pounds/cubic inch 27.68 Grams/cubic centimeter Pounds/cubic inch 2.768 x 10⁴ Kilogl:ams/cubic meter Pounds/cubic inch 1728 Pounds/cubic foot Pounds/cubic inch 9.425 x 10⁻⁶ Pounds/mil foot Pounds/foot 1.488 Kilograms/meter Pounds/inch 178.6 Grams/centimeter Pounds/square foot 0.01602 Feet of water Pounds/square foot 4.882 Kilograms/square meter Pounds/square foot 6.944 x 10⁻³ Pounds/square inch Pounds/square inch 0.06804 Atmospheres Pounds/square inch 2.307 Feet of water Pounds/square inch 2.036 Inches of mercury Pounds/square inch 0.0703 Kilograms/square centi-
meter Pounds/square inch 703.1 Kilograms/square meter Pounds/square inch 144 Pounds/square foot Pounds/square inch 70.307 Grams/square centimeter Pounds/square inch 51.715 Millimeters of mercury
at O°C Quadrants (angle) 90 Degrees Quadrants (angle) 5400 Minutes Quadrants (angle) 1.571 Radians Quarts (dry) 67.20 Cubic inches
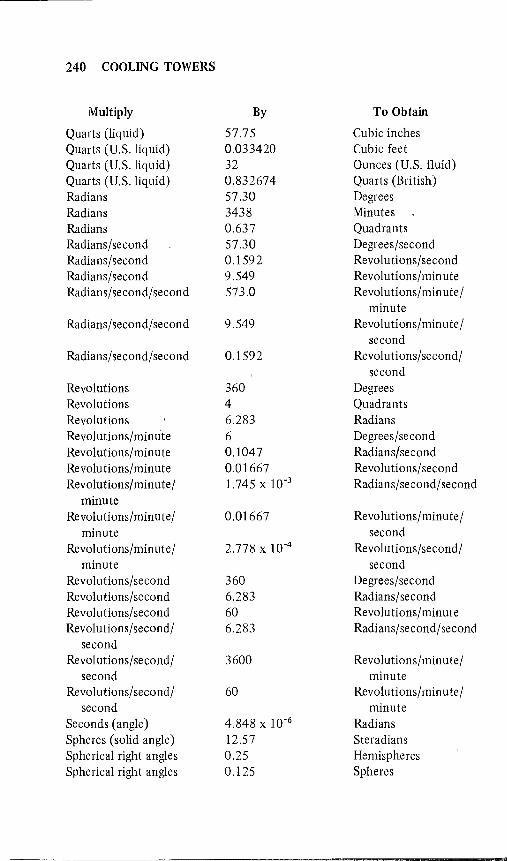
240 COOLING TOWERS
Multiply By To Obtain
Quarts (liquid) 57.75 Cubic inches QUarts (US. liquid) 0.033420 Cubic feet Quarts (US. liquid) 32 Ounces (US. fluid) Quarts (US. liquid) 0.832674 Quarts (British) Radians 57.30 Degrees Radians 3438 Minutes Radians 0.637 Quadrants Radians/second 57.30 Degrees/second Radians/second 0.1592 Revolutions/second Radians/second 9.549 Revolutions/minute Radians/second/second 573.0 Revolutions/minute/
minute Radians/second/second 9.549 Revolutions/minute/
second Radians/second/second 0.1592 Revolutions/second/
second Revolutions 360 Degrees Revolu tions 4 Quadrants Revolutions 6.283 Radians Revolutions/minufe 6 Degrees/second Revolutions/minute 0.1047 Radians/second Revolutions/minute 0.01667 Revolutions/second Revolutions/minute/ 1.745 x 10⁻³ Radians/second/second
minute Revolutions/minute/ 0.01667 Revolutions/minute/
minute second Revolutions/minute/ 2.778 x 10⁻⁴ Revolutions/second/
minute second Revolutions/second 360 Degrees/second Revolutions/second 6.283 Radians/second Revol utions/ second 60 Revolutions/minute Revolutions/second/ 6.283 Radians/second/second
second Revolutions/second/ 3600 Revolutions/minute/
second minute Revolutions/second/ 60 Revolutions/minute/
second minute Seconds (angle) 4.848 x 10⁻⁶ Radians Spheres (solid angle) 12.57 Steradians Spherical right angles 0.25 Hemispheres Spherical right angles 0.125 Spheres

CONVERSION FACTORS 241
Multiply By To Obtain
Spherical right angles 1.571 Steradians Square centimeters 1.973 x 10⁵ Circular mils Square centimeters 1.076 x 10⁻³ Square feet Square centimeters 0.1 550 Square inches Square centimeters 10-6 Square meters Square centimeters 100 Square millimeters Square centimeters- 0.02420 Square inches-inches
centimeters squared squared Square feet 2.296 x 10⁻⁵ Acres Square feet 929.0 Square centimeters Square feet 144 Square inches Square feet 0.09290 Square meters Square feet 3.587 x 10⁻⁸ Square miles Square feet 1/9 Square yards Square feet-feet squared 2.074 x 10⁴ Square inches-inches
squared Square inches 1.273 x 10 6 Circular mils Sq uare inches 6.452 Square centimeters Square inches 6.944 x 10⁻³ Square feet Square inches 106 Squar'emils Square inches 645.2 Square millimeters Square inches (U.S.) 7.71605 x 10⁻⁴ Sq uare yards Square inches-inches 41.62 Square centimeters-
squared centimeters squared Square kilometers 247.1 Acres Square kilometers 10.76 x 10⁶ Square feet Square kilometers 106 Square meters Square kilometers 0.3861 Square miles Square kilometers 1.196 x 10 6 Square yards Square meters 2.471 x 10⁻⁴ Acres Square meters 10.764 Square feet Square meters 3.861 x 10⁻⁷ Square miles Square meter,s 1.196 Square yards Square miles 640 Acres Square miles 27.88 x 10 6 Square feet Square miles 2.590 Square kilometers Square miles 3.098 x 10⁶ Square yards Square millimeters 1.973 x 10³ Circular mils Square millimeters 0.01 Square centimeters Square millimeters 1.550 x 10⁻³ Square inches Square mils 1.273 Circular mils
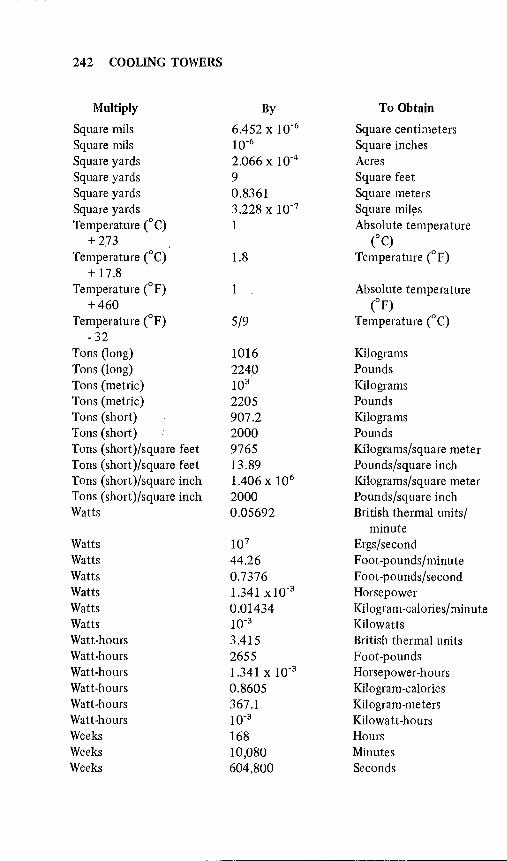
242 COOLING TOWERS
Multiply By To Obtain
Square mils 6.452 x 10⁻⁶ Square centimeters Square mils 10-6 Square inches Square yards 2.066 x 10⁻⁴ Acres Square yards 9 Square feet Square yards 0.8361 Square meters Square yards 3.228 x 10⁻⁷ Square milys Temperature CC) 1 Absolute temperature
+273 ("C) Temperature CC) 1.8 Temperature ("F)
+ 17.8 Temperature ("F) Absolute temperature
+460 ("F) Temperature CF) 5/9 Temperature ("C)
- 32 Tons (long) 1016 Kilograms Tons (long) 224.0 Pounds Tons (metric) 103 Kilograms Tons (metric) 2205 Pounds Tons (short) 907.2 Kilograms Tons (short) 2000 Pounds Tons (short)/square feet 9765 Kilograms/square meter Tons (short)/square feet 13.89 Pounds/square inch Tons (short)/square inch 1.406 x 10⁶ Kilograms/square meter Tons (short)/square inch 2000 Pounds/square inch Watts 0.05692 British thermal units/
minute Watts 107 Ergs/second Watts 44.26 Foot-pounds/minute Watts 0.7376 Foot-pounds/second Watts 1.341 xlO-3 Horsepower Watts 0.01434 Kilogram-calories/minute Watts 10-3 Kilowatts Watt-hours 3.415 British thermal units Watt-hours 2655 Foot-pounds Watt-hours 1.341 x 10⁻³ Horsepower-hours Watt-hours 0.8605 Kilogram-calories Watt-hours 367.1 Kilogram-meters Watt-hours 10-3 Kilowatt-hours Weeks 168 Hours Weeks 10,080 Minutes Weeks 604,800 Seconds
- - -- --------------------------------
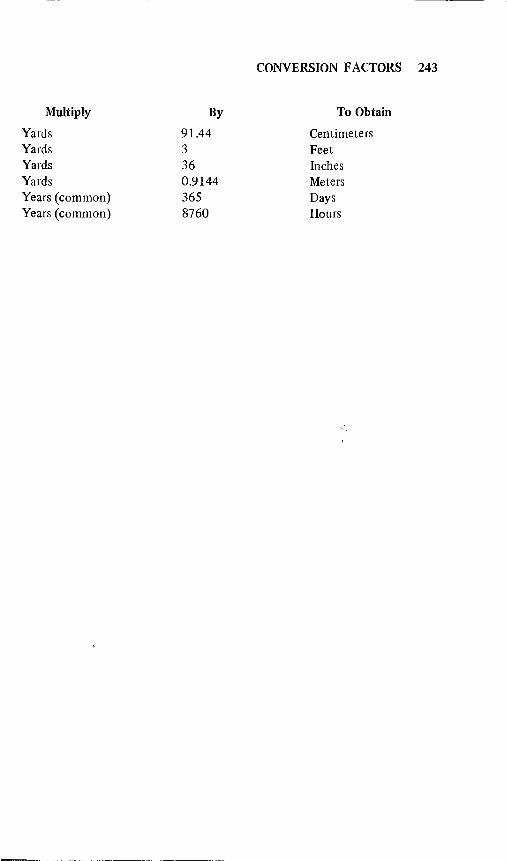
CONVERSION FACTORS 243
Multiply By To Obtain
Yards 91.44 Centimeters Yards 3 Feet Yards 36 Inches Yards 0.9144 Meters Years (common) 365 Days Years (common) 8760 Hours

This page intentionally left blank
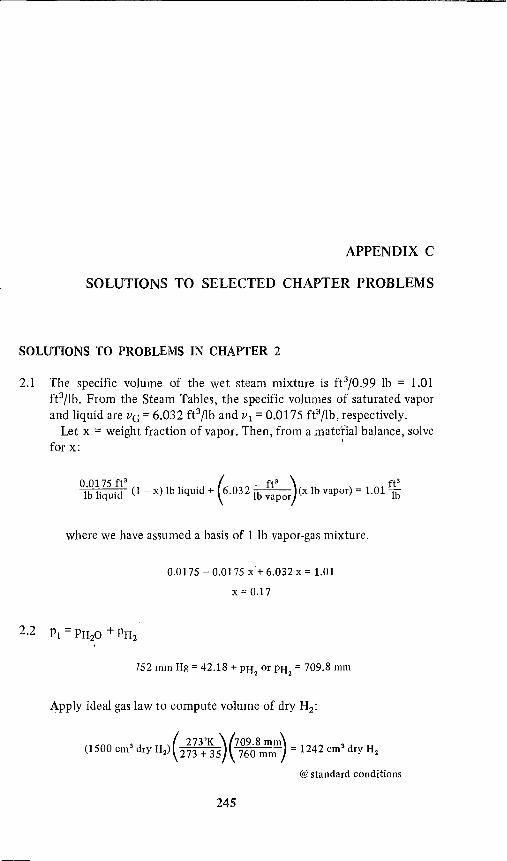
APPENDIX C
SOLUTIONS TO SELECTED CHAPTER PROBLEMS
SOLUTIONS TO PROBLEMS IN CHAPTER 2
2.1 The specific volume of the wet steam mixture is ft3/0.99 lb = 1.01 ft3/lb. From the Steam Tables, the specific volumes of saturated vapor and liquid are vG = 6.032 fe/lb and VI = 0.0175 ft3/lb, respectively.
Let x = weight fraction of vapor. Then, from a mate'rial balance, solve for x: '
00175 ft' (ft' ) ft' ib liquid (1 - x) Ib liquid + \6.03 21b vapor (x lb vapor) = 1.01 Th
where we have assumed a basis of I lb vapor-gas mixture.
0.0175 - 0.0175 x<+ 6.032 x = 1.01
x = 0.17
152 mm Hg = 42.18 + PH2
or PH2
= 709.8 mm
Apply ideal gas law to compute volume of dry H2 :
500 'd )( 2730
K\(709<8mm\_1 2 'd (1 em ryH2 273+35) 760mmJ- 24 em ryH 2
@ standard conditions
245
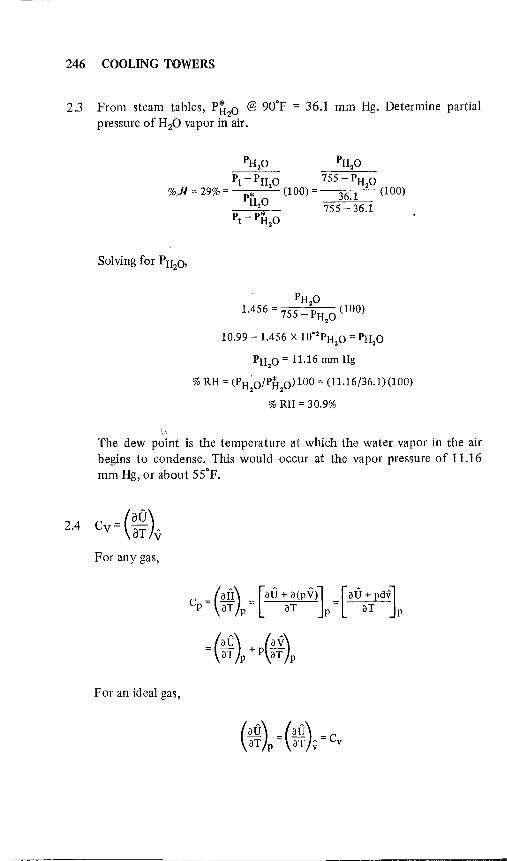
246 COOLING TOWERS
2.3 From steam tables, Piho @ 90°F = 36.1 mm Hg. Determine partial pressure of H20 vapor in air.
PHzO PHzO Pt-PH 0 755 -PH 0
%.).1 = 29% = p* z (100) = 36.1 z (100)
Hz~ 755 - 36.1 Pt - PHzO
PH 0 1.456 = 755 _ zPH 0 (100)
z
10.99 - 1.456 X lO-zPHzO = PHzO
PHzO = 11.16 mm Hg
% RH = (PHzO/PHz0)100 = (11.16/36.1)(100)
% RH = 30.9%
The dew point is the temperature at which the water vapor in the air begins to condense. This would occur at the vapor pressure of 11.16 mm Hg, or about 55°F.
For any gas,
c = (ali) = [au + a(Pv)] = [au + PdV] P aT P aT P aT P
For an ideal gas,
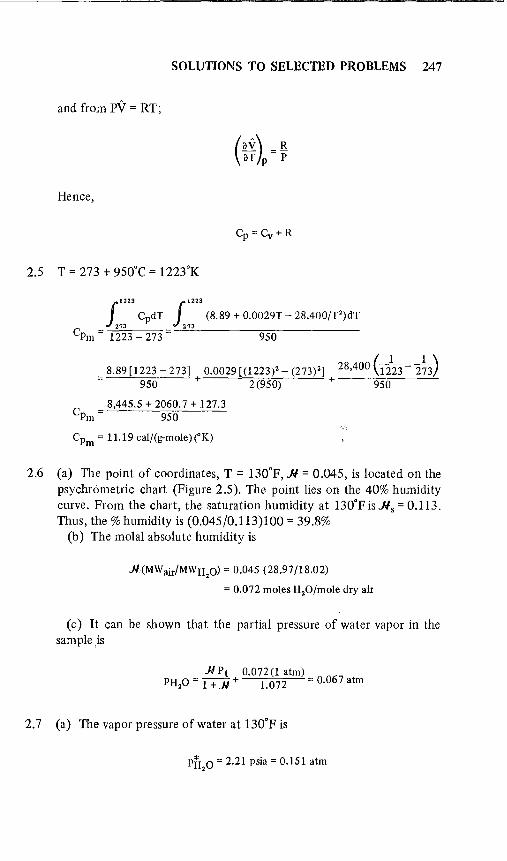
SOLUTIONS TO SELECTED PROBLEMS 247
and from PV = RT;
(av) R aT P =P
Hence,
Cp = Cv + R
2.5 T = 273 + 950°C = 1223°K
1223 f.t223
f CpdT (8.89 + 0.0029T - 28,400/T')dT ,73 ~27~3 __________ _
CPm = 1223 - 273 = 950
8.89 [1223 - 273] 0.0029 [(1223)2 - (273)2] 28,400 (-dB -~) = 950 + 2(950) + 950
8,445.5 + 2060.7 + 127.3 Cpm = 950
Cpm = 11.19 cal/(g-mole)("K)
2.6 (a) The point of coordinates, T = 130°F,.J.I = 0.045, is located on the psychrometric chart (Figure 2.5). The point lies on the 40% humidity curve. From the chart, the saturation humidity at 130°F is.J.Is = 0.113. Thus, the % humidity is (0.045/0.113)100 = 39.8%
(b) The molal absolute humidity is
J.I,(MWair/MWH20) = 0.045 (28.97/18.02)
= 0.072 moles H20/mole dry air
(c) It can be shown that the partial pressure of water vapor in the sample ,is
J.I Pt 0.072(1 atm) PH20 = 1 + J.I + 1.072 = 0.067 atm
2.7 (a) The vapor pressure of water at 130°F is
PH,O = 2.21 psia = 0.151 atm

248 COOLING TOWERS
Hence,
% RH = PH O(100)/PB 0 2 2
= (0.067 atm)(100)/0.151 = 44.4%
(b) Dew point. From psychrometric chart, tw = 101°F (c) Humid Volume. From Figure 2.5, the specific voluI,lle of dry air
@ 130°F is 14.8 ft3/1b dry air. The humid volume of saturated air is 17.5 ft3/lb dry air. Interpolating for 40% humidity,
VH = 14.8 + (17.5 - 15.0) (0.40) = 15.8 ft' wet air/lb dry air
(d) Humid Heat. From Equation 2.39,
Btu for wet air Cs = Cair + J.lCH 20 = 0.24 + (0.045)(0.45) = 0.260 (lb dry air)(OF)
(e) Enthalpy. From the chart @ 130°F, enthalpy of dry air is 23.5 Btu/lb dry air; enthalpy for saturated air is 150 Btu/lb dry air.
Interpolating for 40% humidity,
H = 23.5 + (150 - 23.5) (0.40)
= 74.1 Btu/lb dry air
2.8 Locate the point T = 135°F, .J.I = 0.029, on the psychrometric chart (Figure 2.5). As in problem 2.7, the humid volume must be determined by interpolating for 22.9% humidity:
VH = 15.0 + (18.15 - 15.0)(0.229) = 15.72 ft' wet air/lb dry air
The mass of dry air = Wair = 400/VH = 25.4 lb. From Equation 2.40,
Q = WairCsAT = 25.4 (0.254) (180 -135) = 291 Btu
2.9 From the psychrometric chart (Figure 2.5), follow the adiabatic saturation curve for tw = 95°F down to the dry-bulb temperature 165°F, where
J.I = 0.02
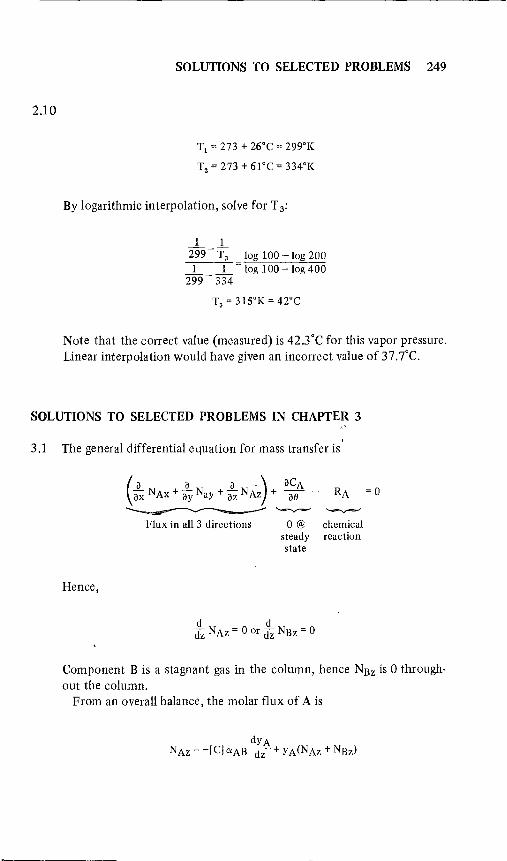
2.10
SOLUTIONS TO SELECTED PROBLEMS 249
Tl = 273 + 26°C = 299°K
To = 273 + 6loC = 334°K
By logarithmic interpolation, solve for T 3:
1 1 m--r, 1 1
299-334
log 100 -log 200 log 100 - log 400
T3 = 3lSoK = 42°C
Note that the correct value (measured) is 42.3°C for this vapor pressure. Linear interpolation would have given an incorrect value of 37 .7°C.
SOLUTIONS TO SELECTED PROBLEMS IN CHAPTER 3
3.1 The general differential equation for mass transfer is'
Hence,
Flux in all 3 directions o @ chemical steady reaction state
d d dz NAz = 0 or dz NBz = 0
Component B is a stagnant gas in the column, hence NBz is 0 throughout the column.
From an overall balance, the molar flux of A is

250 COOLING TOWERS
or
[C] O<AB dy A N - -----Az-- l-YA dz
where O!AB, the proportionality constant, is the diffusivity.
or
'[C]O<AB (I-YA2
)
NA =---In z (z - z ) (1 - YA ) 2 I I
Defining a log-mean concentration for B in terms of A,
YA I - YA2
YB lm = In[(l- YA )/(l-YA)] 2 I
since YB = r~ Y A. Hence,
3.2 For an ideal gas,
where n is number moles. Hence,
Then,
O<ABPt (PAl - P A) N Az = =-R=T--'-(z=----'-z""7) PB
2 I 1m
where PBlm is the log-mean pressure.

SOLUTIONS TO SELECTED PROBLEMS 251
3.3 Volume of water = (2 ft2)(0.08 in./12 in./ft) = 1.33 X 10⁻² ft3
Weight of water = 62.4 1b/ft3 X 1.33 X 10-2 ft3 = 0.832 Ibm
Moles of water = (0.832Ibm>/(18Ibm/lb-mole) = 0.046Ib-mo1e
The moles of water evaporated per unit area per unit time can be expressed by the following (see problem 3.1):
From the ideal gas law, the total molar concentration in the gas is
n p [Cj =-=
v RT
1 atm Ib-mole [Cj = (0.73 atm-ft3/Ib-mole-OR)(537°F) = 0.00255----rt'
From Figure 2.5 (psychrometric chart), at 77°F the ~aturated humidity is 0.019 1b H20/1b dry air or '"
( Ibm H20 )(lb-mole H20)( 29lbm ) lb-mole H20
0.019 Ibm dry air 181bm ' lb-mole air = 0.0304 Ib-mole air
Hence, mole fraction is
0.0304 y A, = 1.0304 = 0.0295
The air's humidity is
I. Ibm H20 ) (29) Ib-mole H20 \0.001 Ibm dry air 18 = 0.0016 lb-mole air
Hence,
YA2 = 0.0016/1.0016 = 0.00161
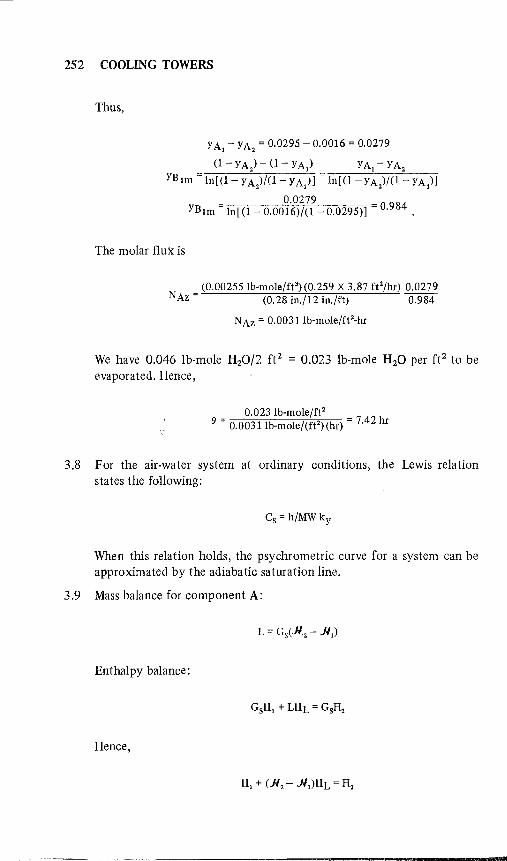
252 COOLING TOWERS
Thus,
Y A, - Y A2 = 0.0295 - 0.0016 = 0.0279
(1 - Y A2) - (1- Y A,) Y A, - Y A2
YB 1m = In[(I- YA )/(1- YA)] = In[(I-YA )/(I-YA)] 2 1 2 1
0.0279 YBl m = In[ (1- 0.0016)/0 - 0.0295)] = 0.984 ,
The molar flux is
(0.00255 Ib-mole/ft 3)(0.259 X 3.87 fe/hr) 0.0279 NAz = (0.28 in./12 in./ft) 0.984
NAz = 0.00311b-mole/ft 2-hr
We have 0.046 lb-mole H20/2 ft2 = 0.023 lb-mole H20 per ft 2 to be evaporated. Hence,
0.023 Ib-mole/ft2
fI = 0.00311b-mole/(ft2)(hr) = 7.42 hr
3.8 For the air-water system at ordinary conditions, the Lewis relation states the following:
Cs = h/MW ky
When this relation holds, the psychrometric curve for a system can be approximated by the adiabatic saturation line.
3.9 Mass balance for component A:
Enthalpy balance:
Hence,
zr

•• + AM4WiiWi_ _ 1
SOLUTIONS TO SELECTED PROBLEMS 253
This can be expanded from the definition of H to give
where To = reference temp . .J.I = absolute humidity Ao = latent heat of vaporization at To C = heat capacity
Cs = humid heat
(See definitions and symbols used in Chapter 2.)
3.1 0 For the case in which the exiting gas-vapor mixture is saturated, we have the term T as, .JI.as , Has. The liquid enters at T as and the gas is humidified by evaporation of liquid and cooled. By expansion of the humid heat terms in the equation derived for problem 3.9,
CB(TGj
- To) + .Nt CA (T Gt - To) + .J.It Ao + (.Nas - .Nt)C AL(Tas - To)
= CB(Tas-To) + .NasCA(Tas - To) + .NasAo
where .Nas = saturated absolute humidity at adiabatic saturation temperature Tas = adiabatic-saturation temperature (see chapteJ 2)
Subtracting .JIIC A T as from both sides and rearranging,
(CB + .NtCA)(TGt - Tas) = CSt (TG t - Tas)
= (.Nas - .Nt)[CA(Tas - To) + Ao - CAL(Tas - To)]
or we get
This is the equation of the adiabatic saturation curve, which passes through the points (.JIas , Tas) on the 100% saturation curve and (.Jib T GI)' Note that
SOLUTIONS TO SELECTED PROBLEMS IN CHAPTER 5
5.5 Absolute humidities for incoming and exiting air streams can be obtained from the psychrometric chart (Figure 2.5):
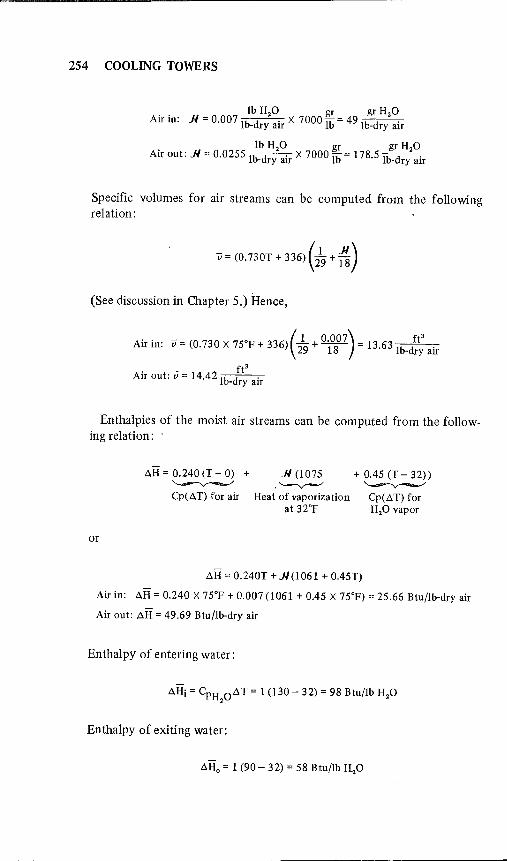
254 COOLING TOWERS
Ib H20 gr gr H20 Air in: ).I = 0.007 Ib-dry air X 7000 TIJ = 49 Ib-dry air
. Ib H20 gr gr H20 Au out: ).I = 0.0255 Ib-dry air X 7000 TIJ'" 178.5 Ib-dry air
Specific volumes for air streams can be computed from the following relation:
v = (0.730T + 336) (;9 +"ts)
(See discussion in Chapter 5.) Hence,
Air in: v = (0.730 X 75°p + 336) (£9 + 010807) = 13.63 Ib-d:~ air
. - 1442 ft' Au out: v = . Ib-dryair
Enthalpies of the moist air streams can be computed from the following relation:
AH=0.240(T-0) + ).1(1075 + 0.45 (T-32)) ~ .'--v-'" ~ Cp(AT) for air Heat of vaporization Cp(AT) for
at 32°P H20 vapor
or
AlI '" 0.240T +).1(1061 + 0.45T)
Air in: AlI = 0.240 X 75T + 0.007 (1061 + 0.45 X 75°P) = 25.66 Btu/lb-dry air
Air out: AH = 49.69 Btu/lb-dry air
Enthalpy of entering water:
AlIi = CpH OAT'" 1 (130 - 32) = 98 Btu/lb H20 2
Enthalpy of exiting water:
AHo = 1 (90 - 32) = 58 Btu/lb H20

SOLUTIONS TO SELECTED PROBLEMS 255
where 32°p has been chosen as the reference temperature. Amount of dry air fed to the cooling tower:
Ib-dryair 9 X 10· ft3/hr/13.63 ft3/1b-dry air = 6.60 X 10⁵ hr
The amount of H20 cooled can be determined from an overall energy (enthalpy) balance:
Amount H20 evaporated into air = 0.0255 - 0.007
= 0.0185 Ib H20/1b-dry air
Let w = mass rate of water entering the tower in the water stream per unit mass of incoming air. Then mass rate of water leaving the tower in the water stream per unit mass of incoming air is (w - 0.0185). Reviewing each term in the energy balance,
Moist air in:
Btu 5 Ib-dry air _ . 7 25.66 Ib-dry air X 6.60 X 10 hr - 1.694 X 10 Btu/hr
Water stream in:
Btu Ib-H 20 Ib-dry air 98 Ib-H
20 X w Ib-dry air X 6.6 X 10⁵ hr 6.468 X 10
7 Btu/hr
Moist air out:
Btu sib-dry air _ 7
, 49.69 Ib-dry air X 6.6 X 10 hr - 3.280 X 10 Btu/hr
Water stream out:
Btu Ib H,o Ib-dry air 58 Ib-H,O X (w - 0.0185) Ib-dry air X 6.6 X 10⁵ hr
= 3.828 X 10 7 (w ~ 0.0185) Btu/hr
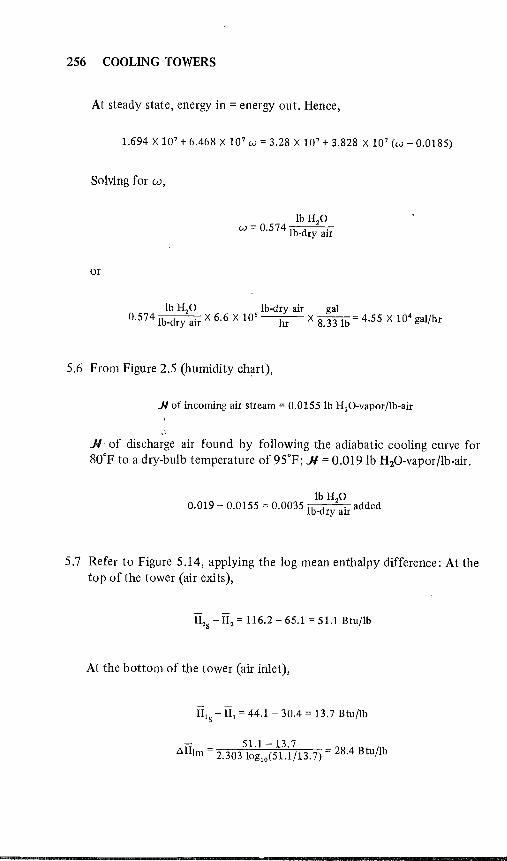
256 COOLING TOWERS
At steady state, energy in = energy out. Hence,
1.694 X 10⁷ + 6.468 X 10 7 w = 3.28 X 10 7 + 3.828 X 10⁷ (w - 0.0185)
Solving for w,
or
Ib HzO w = 0.574 Ib-dry air
lb HzO lb-dry air gal 0.574Ib_dry air X 6.6 X 10
5 hr X 8.33 lb = 4.55 X 10⁴ gal/hr
5.6 From Figure 2.5 (humidity ch~rt),
J.I of incoming air stream = 0.0155 lb HzO-vapor/lb-air
.J.I. of discharge air found by following the adiabatic cooling curve for 80°F to a dry-bulb temperature of 95°F; .J.I = O.019lb H20-vapor/lb-air.
lb HzO 0.019 - 0.0155 = 0.0035 lb-dry air added
5.7 Refer to Figure 5.14, applying the log mean enthalpy difference: At the top of the tower (air exits),
Hzs - Hz = 116.2 - 65.1 = 51.1 Btu/lb
At the bottom of the tower (air inlet),
H,s - H, = 44.1 - 30.4 = 13.7 Btu/lb
- 51.1-13.7 AHlm = 2.303 log,o(51.1/13.7) = 28.4 Btu/lb

SOLUTIONS TO SELECTED PROBLEMS 257
Hence,
Ntu' = KaV = _ dT_ L Hs-H
Ntu' = 1l~8~480 = 1.34
The answer obtained from numerical integration was 1.73, or a 23% difference in the solutions. The error introduced by using a log-mean value increases with larger ranges. Log-mean calculations should be used only when the range is small.
5.8 Assume a basis of 1 ft 2 cross-sectional area of tower. Then,
, Ka(Z X 1) Ntu = L
Ntu' 0.85)(1700) Z = Ka = 13 2 = 23.8 ft
5.9 The height of a transfer unit is simply Z/Ntu'. Hence,';
Ntu'L (1.85)(1700) Z=~= 125 = 25.2ft
and
Htu' = i:8~ = 13.6 ft

This page intentionally left blank
APPENDIX D
SOURCE LISTING AND ABSTRACTS OF THE COOLING TOWER LITERATURE
The following citations and abstracts cover all phases of the cooling tower spectrum.
1) Influence of Atmospheric Precipitation on the Operation of a Natural Draught Indirect-Contact Cooling Tower Herberholz, Peter; Schulz, Siesfried, L., & C. Steinmueller, Gummersbach, Ger. Ger. Chern. Eng., V. 2, N. 6, Dec. 1979, pp. 352-360
This paper discusses the natural draught indirect-contact cooling tower which is part of a recirculation cooling system developed mainly for power generating plants. Warm. process fluids exchange their energy in a tubular heat exchanger with colder ambient air, which derives its flow energy from thermal buoyancy. In addition, too many other atmospheric manifestations, precipitation has not yet been quantified and it is a phenomenon constituting a factor which can impair the operation of the air heat exchanger with respect to ideal meteorological conditions. A procedure for the calculation of the deterioration in the efficiency of an indirect-contact cooling tower as a result of precipitation is presented in this paper. The model is based on input data of the meteorological situation and parameters of the tower. This work aims at adding to the knowledge of design and systematic study of parameters. 15 refs. cited.
2) Hybrid Cooling System Thermodynamics and Economics Giaquinta, Arthur R.; Croley, Thomas E., II; Hsu, Tai-Dan Univ. of Iowa, Iowa City J. Energy Div. Proc. ASCE, V. 106, N. 1, April 1980, pp. 89-107
Wet cooling towers can be used for once-through cooling at riverside power-plant sites where the permissible river heat assimilation capacity is inadequate to absorb all of the waste heat. A comprehensive compu ter model is presented giving a thermodynamic analysis, economic assessment, and optimum design of once-through/wet tower hybrid cooling systems. Several different configurations are investigated, and results
259
260 COOLING TOWERS
are presented for an 1,150 MW nuclear power plant located on the Missouri River at Sioux City, Iowa. One hybrid cooling system described is arranged in a series water path with a partially closed-cycle loop. The model shows this arrangement to be the most economical configuration for the site conditions studied when zero water costs are used. Comparison of hybrid systems with once-through cooling and closed-cycle wet tower systems indicate that hybrid cooling systems are economically superior. A trade-off function between total cost and water evaporation is presented to indicate the best hybrid arrangement fOT sites where water availability is limited. 16 refs. cited.
3) Wind Effects'on Cooling-Tower Shells Niemann, Hans-Jursen Ruhr-Univ Bochum, Ger. ASCE J. Struct Div., V. 106,N. 3, March 1980, pp.' 643-66 1
This paper discusses the impact of wind action on natural-draft cooling towers. The structure of the wind load may be divided into a static, a qUasistatic, and a resonant part. The effect of surface roughness of the shell and of wind profile on the static load is discussed. The quasistatic load may be described by the variance of the pressure fluctuations and their circumferential and meridional correlations. The high-frequency end of the pressure spectra ~nd of the coherence functions are used for the analysis of the resonant response. It is shown that the resonant response is small even for very high towers, however, it increases linearly with wind velocity. Equivalent static loads may be defined using appropriate gu'st-response factors. These loads produce an approximation of the behavior of the structure and in general are accurate. 11 refs. cited.
4) Method of Using Agricultural Wastewater For Power-Plant Cooling Septhon, Hugo, H.; Klein, Gerhard; Jarvis, Thomas J.; Vermeulen, Theodore. Water Resour. Cent. Desalin. Rep. Univ. Calif., N. 68, June 1979, 180 p.
This report discusses the technical and economic feasibility for using saline wastewaters collected from irrigated fields by underground tile drainage systems for power plant cooling purposes. A novel process sequence was employed comprising of ion-exchange resin softening whereby nearly all the calcium was removed from drainage water. A pilot plant facility of 2,000 GPD capacity was designed, constructed and tested, including a softening and regeneration facility, a cooling tower operating under realistic process conditions and a complete verticaltube foam evaporation facility. 14 refs. cited.
5) Construction and Design of Large Cooling Towers Zerna, Wolfgang; Mungan, Ihsan Ruhr-Univ. Bochum, Ger. ASCE J. Struct Div., V. 106, N. 2, February 1980, pp. 531-544
Large natural-draft cooling towers are used for dry-type cooling of power plants with high capacity. Through the choice of an appropriate offset distance between the axis of the hyperbola and axis of rotation the stress distribution as well as buckling and vibration behavior can be influenced greatly. To maintain the required buckling safety and lowest
COOLING TOWER LITERATURE 261
natural frequency as the dimensions of the cooling tower shell are increased stiffening of the shell becomes indispensable. Numerical studies show that the efficiency of the stiffeners is different, rings being more effective than meridional ribs. Stiffening rings can be built easily after slight modification of the existing climbing form work. Reinforced concrete shells stiffened by rings can compete with cable network structures, even beyond a height of 200 m (656 ft). 13 refs. cited.
6) Zero Discharge of Cooling Water by Sidestream Softening Matson, Jack V.; Harris, Teaue G. III Univ. of Houston, Tex. J. Water Pollut. Control Fed., V. 51, N. 11, Nov. 1979, pp. 2602-2614
A preliminary design methodology is presented for the sidestream softeners in zero-discharge cooling water systems. The methodology consists of semiempirical chemical equations which were calibrated by experiments and which are linked to the mass balances of the important chemical species. The only inputs required are the makeup water quality and certain cooling water system parameters. 20 refs. cited.
7) Zero Blowdown: Is It Feasible? Brooke, J. M. Hydrocarbon Process, V. 58, N. 7, July 1979, pp. 211-214.
For every million BTU's of heat dissipated in a cooling tower, an average of 35 ~allons of circulating cooling water is wasted to blowdown. This represents monies to obtain the water., to pretreat it, for scale and fouling prevention, for corrosion protection, for pumping it from place to place, and to treat it before it can be released as waste. Cooling tower operation economy can be achieved by decreasing the blowdown. The ultimate economy comes when the blowdown is reduced to zero. This paper presents some' suggestions related to water pretreatment which will help achieve this goal. Several examples of calculation for zero blowdown are given. 4 refs. cited.
8) Noise Prediction/Control In Design of Power Plant Cooling Towers Mirsky, Gary R.; Lemmens, Pierre Hamon Cooling Tower Div., Somerville, NJ Nat'l. Eng., V. 83, N. 7, July 1979, pp. 11-14
The paper discusses noise sources, types, production and control from the earliest design state of a cooling tower project.
9) Protecting Cooling Towers From Overpressure Veazey, J. A. Monsanto Agric. Prod. Co., Luling, LA Chern. Eng. Prog., V. 75, N. 7, July 1979, pp. 73-77.
Monsanto Corp. operates three amonia plants in Luling, LA; a dualreform train unit built by Chemicao (1954), a 600 ton/day (544 metric tid) facility erected by Kellogg (1965), and a 1,040 metric tid complex put up by Kellogg (1975-1976). This last facility suffered damage to its cooling tower in October, 1977, while it was onstream when a heat exchanger failed. Preventive measures are discussed which constitute a vent installed on top of the riser. It was found to be sufficient to relieve

262 COOLING TOWERS
a large surge condition caused by failure of an exchanger when a second accident occurred three months later without damaging the tower. Details of the system and its operations are given.
10) Scaling Characteristics of Cooling Tower Water Lee, S. H.; Knudsen, 1. G. Oreg. State Univ., Corvallis ASHRAE Trans., V. 85, pt. 1, 1979, Tech and Symp paper presented at the ASHRAE Semiannual Meeting, Philadelphis, PA, Jan. 28-Feb 1, 1979, pp. 281-302.
The paper discusses a study and presents the deposition models for systematic evaluation of condenser water fouling as applied to the airconditioning and refrigeration industry. The equipment used in the study was designed to simulate the operating conditions of a cooling tower. Before the cooling water entered the test sections, it was heated to 35°C in two shell and tube heat exchangers by warm water circulated from a domestic water heater. 18 refs. cited.
11) Influence of Fish Protection Considerations on the Design of Cooling Water Intakes Mussalli, Uysuf G.; Hofmann, Peter; Taft, Edward P. Stone & Webster Eng. Corp., Boston, MA Proc. Jt. Symp. on Des. and Oper. of Fluid Mach., Colo. State Univ., Fort Collins, June 12-14, 1978. Sponsored by IAHR, Delft, Neth., ASME, New York, NY, and ASCE, New York, NY. Pub!. by Colo. State Univ., Fort Collins, 1978, V. 1, pp. 413-424.
Stringent regulatory requirements in the United States often require the incorporation of fish protection facilities at power plant intakes. There are three different concepts that can be used: fish collection and removal, fish diversion, and fish deterrance. The incorporation of fish protection systems at specific sites can necessitate modifications to conventional intake designs. Such modifications can influence screenwell layouts and selection of screens and pumps, and in certain cases require model studies to develop design criteria which will ensure that fish protection facilities will be biologically effective and not adversely affect plant operations. 9 refs. cited.
12) Drift From the Chalk Point Natural Drift Brackish Water Cooling Tower: Source Definition, Downwind Measurements, Transport Modeling Webb, Ronald 0.; Schrecker, Gunther 0.; Guild, Dennis A. Environ. Syst. Corp., Knoxville, Tenn. Waste Heat Manage and Util., Proc. of a Conf., Miami Beach, FL, May 9-11, 1977, Pub!. by Hemisphere Pub!. Corp., New York, NY and London, Engl., 1979, V. 3, pp. 1761-1797.
Drift data are presented. The data was acquired in and around PEPCO's Chalk Point Unit #3 natural draft cooling water tower. Source data in the form of droplet size spectra and salt mass emission were acquired via an equal area traverse near the exit plane of the 400 foot tower and in the 712 foot stack. Results show that the drift fraction of
-----~----~-----------

COOLING TOWER LITERATURE 263
the tower is within the manufacturer's guarantee when the tower circulating water flow rate is assumed to be the design value (260,000 GPM). The droplet spectra showed an average droplet mass median diameter of 79 microns for the measurement series. Results also showed that the stack which uses a brackish water scrubber may caUse problems to cooling tower drift modeling studies. Downwind measurements at ground level of airborne salt concentration and droplet number per unit volume of air were compared with predicted results from drift transport models using the source data as input. Comparison of predicted and measured downwind values show good agreement. 5 refs. cited.
13) Computerized Engineering Model for Evaporative Water Cooling Towers Park, J. E.; Vance, J. M.; Cross, K. E.; Van Wie, N. H. Union Carbide Corp., Oak Ridge, TN Waste Heat Manage. and Util., Proc. of a Conj., Miami Beach, FL, May 9-11,1977, Publ. by Hemisphere Pub!. Corp., New York, NY and London, Engl., 1979, V. 2, pp. 1007-1024.
This paper represents a physical model for crossflow and counterflow cooling towers which imposes rigoroUS heat and mass balances on each increment of the tower under study. Individual towers are characterized by specification of a mass evaporation rate equation. The solution algorithm allows reduction of test data, interpolation of the reduced data, and comparison of test results to design data. These capabilities can be used to evaluate acceptance tests for new "towers, to monitor changes in tower performance as an aid in planning maintenance, and to predict tower performance under changed operating conditions. 3 refs. cited.
14) Improving Cooling Tower Fan Syste~ Efficiencies Monroe, Robert Co. Hudson Prod. Corp. Combustion, V. SO, N. 11, May 1979, pp. 20-26.
The authors briefly discuss some of the problems for air cooled heat exchangers and cooling towers using axial fans. The balance of the paper discusses ways to improve system efficiencies in three areas: before the fan system design is finalized, improvements in the physical equipment as installed, and recognition of performance problems caused by adjacent equipment. Results of a full-scale test illustrating fan efficiency contributions of various components are given. 1 ref. cited.
15) Close Study of Cooling-Tower Pump Intakes Adds to Reliability Over Performance Range Dicmas, John L.; Fornesi, Robert Johnston Pump Co. Power, V. 123,N. I,Jan. 1979,pp. 94-96
The paper discusses suction-intake design, suction-bell submergence, air-entrainment potential, and net positive suction head of cooling towers. Guidelines on possible problems and ways to assure reliable operation of cooling towers are given.

264 COOLING TOWERS
16) Cooling Tower Retrofit BUrger, Robert Robert Burger Assoc., Inc., New York, NY Chern. Eng. Prog., V. 75, N. 3, March 1979, pp. 78-81.
This paper stresses energy conservation and cost savings which can be achieved in chemical plants through proper design and maintenance of water cooling towers. These advantages can be obtained in both chemical processing and refrigeration systems. To emphasize money loss contributed by a malfunctioning or inefficient cooling tower, calculations are presented to illustrate this contention. The paper covers the following top,ics: impact of improper maintenance; energy conservation examples; phosphate plant problem. 5 refs. cited.
17) Development and Verification of a Wet Cooling Tower Drift Deposition Model Miksad, Richard W.; Ratcliff, Michael A. Univ. of Texas, Austin Proc. Air. Pollut. Control Assoc., 71st Annual Meeting, Houston, Texas, June 25-30, 1978. Pub. by Air Poll. Control Assoc., Pittsburgh, P A, 1978, V. 4, Pap. 48, 3, 15 p.
This paper discusses preliminary results of a model which is designed to predict drift deposition drop size distributions and number flux. The influence of evaporation and the drop breakaway process are studied by using both a bulk breakaway criteria and a distributed partial breakaway criterill for each drop size. Comparisons are made at several downwind receptor sites for drop size distribution and number flux. 13 refs. cited.
18) Cooling Towers: Design and Performance Hundemann, Audrey S. (Ed.) NTIS, Springfield, VA NTIS Search, Search Period covered 1 970-Aug. 1978. Pub!. by NTIS, Springfield, VA, Aug. 1978. Available from Eng. Index, New York, NY.
Provides abstracts of worldwide research on design and performance of mechanical draft and natural draft wet, dry, and dry-wet combination cooling towers. Abstracts cover studies on size reduction, corrosion protection, and economic optimization of cooling towers primarily used with nuclear power plants and fossil fuel power plants. Also covered are abstracts which pertain to cooling towers used in wastewater treatment. It contains 305 abstracts, 65 of which are new entries to the previous edition.
19) Stabilitaetsverhalten Hyperbolischer Kuehltunnschalen Unter Windbelastung (Stability of Hyperbolic Cooling Tower Shells Under Wind Load) Walther, Jochen; Woelfel, Roland Hochsch fuer Archit und Bauwes Weimar, E. Ger. BauplanungBautech, V. 32, N.l1, Nov. 1978, pp. 510-512.
Based on model studies, an approximation formula for the critical wind pressure was developed. Buckling effective factors, including dead
&M&4 iil!Ml!!l!iliPf J
COOLING TOWER LITERATURE 265
weight, flexibility of support, imperfections of the structure, fracture areas and constructional conditions of hyperbolic towers were qualitatively and quantitatively studied. 15 refs. cited. (In German).
20) Specifying Tolerance Limits for Meridional Imperfections in Cooling Towers Croll, J. G. A.; Kemp, K. O. J. Am. Con cr. Inst., V. 76, N. 1, Jan. 1979, pp. 139-158.
The collapse of a large cooling tower shell in Great Britain was believed to have been primarily due to the combined effects of geometric imperfections and vertical cracks. Design implications of geometric imperfections in the meridional profiles of cooling towers are reassessed in this paper. The authors suggest that the present and proposed tolerance recommendations are not sufficiently linked to the specific nature of the shell and its reinforcement, and if followed could result in serious overstressing. On the basis of a simplified approach to the analysis of a geometrically imperfect shell, tentative, code oriented, and rational tolerance specifications are presented. 11 refs. cited.
21) Better Water Treatment in Cooling Tower Systems Klen, E. F.; Grier, J. C. Na1co Chern. Co., Oak Brook, lllinois Ammonia Plant Sa!., V. 20; Annual Ammonia Saf. Symp., 22nd, Denver, Colorado, Aug. 29-31, 1977. Publ. by AIChE (a CEP Tech. Man.), New York, NY, 1978, pp. 57-63.
The paper discusses a two-step approach to guide an ammonia plant operator in the design, selection, and implementation of the optimum cooling water management program for this cooling system.
22) Estimate Cooling Tower Requirements Easily Meytsar, J. Favra Int., Milan, Italy Hydrocarbon Process, V. 57, N. 11, Nov. 1978, pp. 238-239.
This paper presents graphs resulting from hundreds of stUdies of cooling towers. With these curves one can determine the following data related to a cooling tower: power adsorbed by fans; dimensions of cooling tower; and quantity of air operated by fans. The cooling towers considered have the fixed data shown. Cell widths were selected to make cooling tower dimensions easier to establish.· These assumptions are accurate enough for the estimations given.
23) Utilizb1g Water Chillers Efficiently Cooper, Kenneth W. Borg Warner Corp., York, PA Energy Use Manage., Proc. of the Int. Conf., Tucson, Arizona, Oct. 24-28, 1977. Publ. by Persamon Press, Elmsford, NY and Oxford, Engl., 1977, V. 1, pp. 293-241.
This provides curves for cooling tower performance and typical off design performance of centrifugal compressor chilled water systems. These graphs show typical coincident wet and dry bulb temperatures, in

266 COOLING TOWERS
addition to hours of occurrence per year. Since the outdoor wet temperature is at its design value for only a few hours per year, a typical centrifugal chiller cooled with cooling tower water can take advantage of the lower outdoor wet bulb and operate at reduced heat dUring a significant portion of the year. Examples of the energy savings possible with varying cooling water temperatures are given. The effects of raising the leaving chilled water temperature, changing compressor operating speed, and limiting the use of hot gas bypass are discussed. 2 refs. cited.
24) Cooling Tower Technology; Cold Water Makes Profits Burger, Robert Robert BUrger Assoc., New York, NY Ind. Water Eng., V. 15, p. 4, July-Aug. 1978, pp. 14-18. ,
The paper discusses design conditions and criterion of cooling tower performance. These criterion are specified when the cooling tower is purchased and/or rebuilt to maintain cooling of a specific quantity of circulating water from entering the tower at a particular temperature and leaving at a definite value. Enthalpy pressure diagram presented relates cold water to the energy needed for refrigerant utilization.
25) Optimization of Cooling-Water Circuit Design Paul, G. T.; Wearmouth, J. W. McLellan & Part., West Byfleet, Surry, England Met. Technol., V. 5, Pt. 6, June 1978, pp. 203-211.
The mecbanism of dissipating unwanted process heat energy to the atmosphere "is examined. The importance of considering the heatexchange equipment in the process plant as part of the cooling circuit is stressed. Seven types of cooling-water circuits often found in the metals industries are outlined and water supplies and treatment are discussed. Particular reference is given to the prevention of scaling and corrosion at high heat fluxes. The influence of the water source on any subsequent treatment for a particular circuit is pointed out and the relative performance of evaporative cooling towers, cooling ponds, and air-to-water and water-to-water heat exchangers examined. 6 refs. cited.
26) Cross Wind and Internal Flow Characteristics of Dry Cooling Towers Russell, C. M. ·B.; McChesney, H. R.; Holder, D. W.; Jones, T. V., Verlinden, M. C-E Lummus, Combust. Eng. Inc. Combustion, V. 49, N. 11, May 1978, pp. 20-24.
The authors in association with Oxford University, undertook research, to determine how the arrangement of heat exchanger bundles at the base of a tower affects the tower's internal flow and its sensitivity to cross winds. To learn more about these effects, experiments were conducted with model towers in which heat exchanger bundles were represented by gauze screens. Two types of tests were conducted: The first study involved a tower flow in the absence of cross winds which was made at high Reynolds numbers. The second was a study of crosswind effects made at much reduced Reynolds numbers in a 4m by 2m wind tunnel. 8 refs. cited.
27)
28)
29)
30)
COOLING TOWER LITERATURE 267
Chromate Removal by Ion Exchange Seward, Roger B. ARCO Chern. Co., Channelview, Texas Int. Water Conf., Annual Meeting, 38th, Proc., Pittsburgh, PA, Nov. 1-3, 1977. Publ. by Eng. Soc. of West PA, Pittsburgh, 1977, pp. 201-210.
The Lyondell plant (ARCO Chemical Company) operates one of the first industrial scale chromate recovery systems in the U.S. The chromate recovery system is located in the ethylene plant of the Channelview, Texas, chemical complex. It was designed to treat a 1100 GPM cooling tower blowdown stream containing a 20-25 ppm chromate (Cr04). A strong base anion resin is used to selectively remove the chromate. This unit was placed in service in June, 1976. Information presented in this paper is based upon operating experiences. Economic considerations are also included.
Vibration Analysis ofAxi-Symmetric Shell by Mode Superposition Nakao, Yoshiaki; Abiru, Hisanori Hiroshima Tech. Inst., Japan Mitsubishi Heavy Ind. Mitsubishi Tech. Bull., N. 127, Jan. 1978,8 p.
In designing axi-symmetric shell structures such as large-type cooling towers, it is necessary to predict the vibration responses to various external forces. The authors describe the linear vibration response analysis of ax i-symmetric shell structures by the finite element method. They also analyze geometric nonlinear (large deflection) vibration which poses a problem in thin shell structures causes dy,namic buckling in cooling towers. They present examples of numerical calculation and study the validity of this method. 11 r!:1fs. cited.
Why-and When-Cooling Towers Pay Off Hanna, J. P. Conair, Inc., Franklin, P A Plast. Technol., V. 24, N. 3, March 1978, pp. 77-80.
The paper discusses recirculating cooling-tower systems and their capability reducing water usage by up to 95% are a boon to plastics processors in using large quantities of cooling water to remove heat from processing machinery. Descnbed are the design and operation techniques of cooling towers and factors determining the best type of system for individual plant needs. Economic considerations are also included.
Cooling Tower Supporting Columns and Reinforcing Rings In Small and Large Displacement Analyses Chan, A. S. L., Wolf, J. P. Imp. CoIl. of Sci. & Technol., London, England Comput. Methods Appl. Mech. Eng., V. 13, N. 1, Jan. 1978, pp. 1-26.
Basic elastic and geometric stiffness properties of the individual supporting columns are synthesized into a stiffness matrix compatible with an axisymmetrical shell element by a series of transformations. These are to be used in conjunction with a finite element representation of the cooling tower, where the displacements are decomposed into Fourier
268 COOLING TOWERS
31)
32)
33)
hannonics. The effect of the column supports can be rigorously accounted for in a large displacement nonlinear analysis. To complete the stiffness property of the cooling tower structure, the elastic and geometric stiffness of the reinforcing rings are also included. Examples are given to show the effect of these additions on the buckling wind load and the stress distribution. 12 refs. cited.
Wet Coolhtg Tower Backfitting Economics Croley, Thomas E. II; Giaquinta, Arthur R.; Patel, Virendra C. Iowa Inst. of Hydraul. Res., Univ. of Iowa, Iowa City ASCE J. Power Div., V. 104, p. 2, April 1978, pp. 115-130.
Because of recent legislation designed to reduce thermal pollution, the electric utilities industry is faced with the prospect of backfitting their existing installations with closed-cycle cooling systems. Wet cooling towers offer an attractive solution since they perform well and they are well established. The paper presents a method for evaluating the cost of backfitting a power plant currently using open-cycle cooling with a closed-cycle mechanical-draft crossflow wet cooling tower. Basic equations and normalized charts for estimating the total backfit cost have been developed and are recommended, enabling inclusion of first costs and continuing resultant operating costs appropriate to the backfit cost estimate. An example is given to illustrate the methodology and the relevant parameters for cost estimating.
Centrifugal Water Chilling Systems: Focus on Off-Design Performance Cooper, Kenneth W.; Erth, Richard A. Borg-Warner Corp., York, PA Heat Piping Air Cond., V. 50, N. 1, Jan. 1978, pp. 63-67.
The paper discusses the off-design performance of a centrifugal water chiller. The effect of changes in operating variables on its power consumption are discussed along with a simplified method for estimating annual operating costs, using the chiller's off-design performance, cooling tower performance, and building load profile.
Large Cooling Towers: The Present Trend Diver, M.; Paterson, A. C. Socotec, Paris, France Struct. Eng., V. 55, N. 10, Oct. 1977, pp. 431-445.
The paper reviews relevant design parameters such as wind pressure, including wind induced vibrations, thermal gradient, self-weight and moments in the shell. Comparative calculations were performed varying the value of one parameter at a time and considering the effect on concrete and steel stresses. The influence of the modulus of elasticity used in calculations of thermal effects is discussed and illustrated. A number of possible approaches to the towers' buckling behavior are discussed. A detailed comparison is made between towers designed for similar conditions in England and a number of other EUropean countries and in the United States. 19 refs. cited.
COOLING TOWER LITERATURE 269
34) Use Side Stream Softening to Reduce Pollution Reed, D. T.;Klen, E. F.; Johnson, D. A. Nalco Chern. Co., Oak Brook, IL Hydrocarbon Process, V. 56, N. 11, Nov. 1977, pp. 339-342.
The paper discusses design procedures which are available for minimizing cooling tower blowdown flow in petroleum refineries. Side stream softening is used to reduce cooling tower blowdown, reduce pollution and save water. By-pass lime softening appears to be a practical technique for use both with new and existing cooling tower systems while synergistic chromate formations can be expected to adequately protect cooling water systems in high dissolved solids applications. A method is available for designing lime softening systems for use in zero blowdown applications and for predicting the steady state chemistry conditions. Each situation must, however, be tested to determine the extent of the various effects such as softener interferences, corrosion, etc., on a potential design. Details of the test procedure are illustrated by examples. 10 refs. cited.
35) Air·Vapor Dynamics in Large-Scale Atmospheric Spray Cooling Systems Chaturvedi, Sushil; Porter, R. W. Ill. Inst. of Technol., Chicago ASME Pap., for Meeting Nov. 27-Dec. 2, 1977, 11 p.
A quantity NTU containing the spray drop wise parameters allows prediction of cooling range if local wet-bulb temperature is known. The essential problem is characterized by NTU and other parameters. Theory was developed for this purpose using various analytical and numerical approximations, wind attenuation and turbulent diffusion in the atmospheric boundary layer. EXperiments were run on a large flowthrough spray canal involving segments with two types of floating spray modules where both·local spray temperatures and wet-bulb temperature correlated with ambient conditions, geometry and thermal parameters. Previous experimental data are available for a fixed-manifolded spray pond. 21 refs. cited.
36) Considerations Sur Le Calcul Des Refrigerants Atmospheriques (Remarks on the Design of Natural Draft Cooling Towers) Diver, Marius SOCOTEC, Paris, France Ann. Inst. Tech. Batim. Trav Publics, N. 353, Sept. 1977, pp. 61-91.
The paper discusses a study of the current methods for the design of reinforced concrete natural cooling towers. It accounts for the following criteria: the state of the art with particular reference on theoretical and experimental aspects; and the influence of certain parameters (wind pressure, thermal gradient, factored weight, shell moments, Young's modulus) on concrete and steel stresses. The French experience is compared to current techniques and codes used in other countries. The paper leads to the formulation of practical proposals to be used in the design of natural draft cooling towers, whose increasing dimensions makes their conception complex. 20 refs. cited. (In French with English abstract).
270 COOLING TOWERS
37) Comparative Performance Evaluation of Current Design Evaporative Cooling Tower Drift Eliminators Chan, Joseph; Golay, Michael W. MIT, Cambridge, MA Atmos. Environ., V. 11, N. 8, 1977, pp. 775-781.
The paper gives an analysis of the performance of standard industrial evaporative cooling tower drift eliminators using both numerical simulation methods and experimental techniques. The simulation methods make use of computer codes to calculate the two-dimensional laminar flow velocity field and pressure loss in a drift eliminator geometry. The collection efficiency is computed by performing trajectory calculations for droplets of a given size by a fourth order Runse-Kutta numerical method. The experiments make use of a laser light scattering technique for the measurement of the droplet size spectra both at the inlet and outlet of the eliminator. From these measured spectra, the collection efficiency as a function of droplet size can be deduced. 12 refs. cited.
38) Spray Cooling: An Alternative to Cooling Towers Shell, Gerry L.; Wendt, Ronald C. Gerry Shell Environ. Eng., Brentwood, TN Pollut. Eng., V. 9, N. 7, July 1,977, pp. 32-36.
The paper describes a spray nozzle cooler design concept which uses a multiple nozzle assembly supported on a floating platform. A pumpmanifold-nozzle design produces effective heat transfer while the floating platform Offers quick, flexible installation. Heated water is sprayed into the air tb achieve the desired heat dissipation. Spray coolers require more land than wet cooling towers but less than 5% of the land required for cooling ponds. The effect of drift is less for spray coolers than for wet cooling towers, and no chemical additives are required for biological growth control. 5 refs. cited.
39) New Technology and Cooling Tower Design Practices Lefevre, Marcel Hamon Cooling Tower Div., Research Cottrell Combustion, V. 48, N. 11, May 1977, pp. 28-32.
The paper considers the state-of-the-art in cooling towers, covering various types of towers in use. It discusses how they respond to the present and the future needs of the industry. A trend toward the counterflow design in the heat exchanger is indicated, and a forced draft counterflow tower is described. The design of the fan-assisted tower using both mechanical and natural draft is briefly dealt with. 1 ref. cited.
40) Dry and Wet-Peaking Tower Cooling Systems for Power Plant Application Larinoff, M. W.; Forster, L. L. Hudson Prod. Corp., Houston, TX Combustion, V. 48, N. 11, May 1977, pp. 8-21.
The paper presents a new concept of the power plant heat-sink system which employs the combination of a conventional wet-tower and a conventional dry-tower. The purpose of this system is to reduce
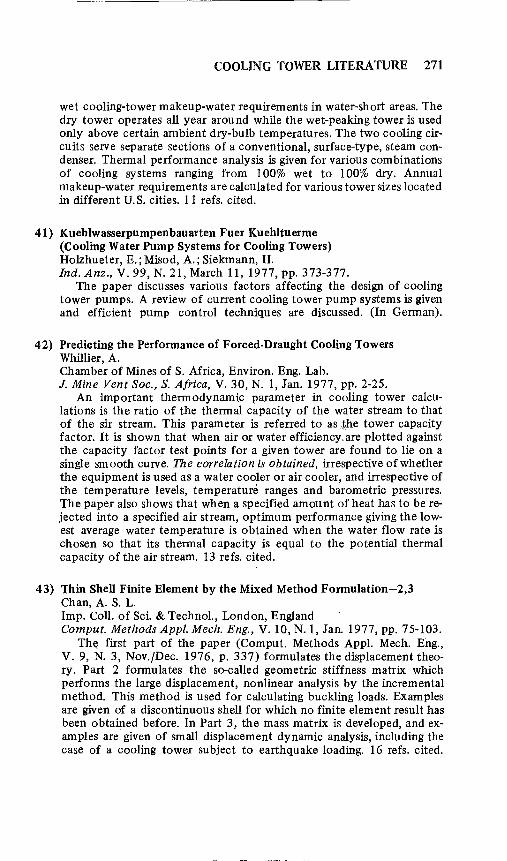
COOLING TOWER LITERATURE 271
wet cooling-tower makeup-water requirements in water-short areas. The dry tower operates all year around while the wet-peaking tower is used only above certain ambient dry-bulb temperatures. The two cooling circuits serve separate sections of a conventional, surface-type, steam condenser. Thermal performance analysis is given for various combinations of cooling systems ranging from 100% wet to 100% dry. Annual makeup-water requirements are calculated for various tower sizes located in different U.S. cities. 11 refs. cited.
41) Kuehlwasserpumpenbauarten Fuer Kuehltuerme (Cooling Water Pump Systems for Cooling Towers) Holzhueter, E.; Misod, A.; Siekmann, H. Ind. Anz., V. 99, N. 21, March 11, 1977, pp. 373-377.
The paper discusses various factors affecting the design of cooling tower pumps. A review of current cooling tower pump systems is given and efficient pump control techniques are discussed. (In German).
42) Predicting the Performance of Forced-Draught Cooling Towers Whillier, A. Chamber of Mines of S. Africa, Environ. Eng. Lab. J. Mine Vent Soc., S. Africa, V. 30, N. I, Jan. 1977, pp. 2-25.
An important thermodynamic parameter in cooling tower calculations is the ratio of the thermal capacity of the water stream to that of the sir stream. This parameter is referred to as ,the tower capacity factor. It is shown that when air or water efficiency,~re plotted against the capacity factor test points for a given tower are found to lie on a single smooth curve. The correlation is obtained, irrespective of whether the equipment is used as a water cooler or air cooler, and irrespective of the temperature levels, temperature ranges and barometric pressures. The paper also shows that when a specified amount of heat has to be rejected into a specified air stream, optimum performance giving the lowest average water temperature is obtained when the water flow rate is chosen so that its thermal capacity is equal to the potential thermal capacity of the air stream. 13 refs. cited.
43) Thin Shell Finite Element by the Mixed Method Formulation-2,3 Chan, A. S. L. Imp. Coli. of Sci. & Technol., London, England Comput. Methods Appl. Mech. Eng., V. 10, N.I, Jan. 1977, pp. 75-103.
Th~ first part of the paper (Comput. Methods Appl. Mech. Eng., V. 9, N. 3, Nov./Dec. 1976, p. 337) formulates the displacement theory. Part 2 formulates the so-called geometric stiffness matrix which performs the large displacement, nonlinear analysis by the incremental method. This method is used for calculating buckling loads. Examples are given of a discontinuous shell for which no finite element result has been obtained before. In Part 3, the mass matrix is developed, and examples are' given of small displacement dynamic analysis, including the case of a cooling tower subject to earthquake loading. 16 refs. cited.
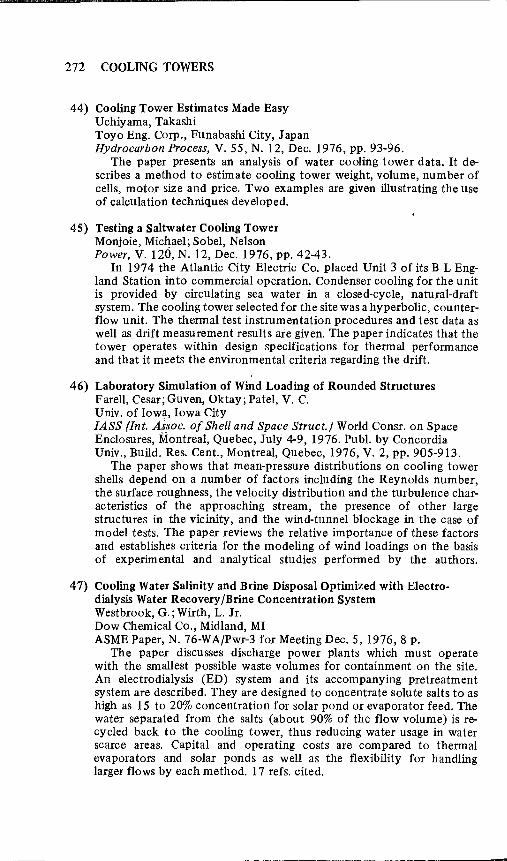
272 COOLING TOWERS
44) Cooling Tower Estimates Made Easy Uchiyama, Takashi Toyo Eng. Corp., Funabashi City, Japan Hydrocarbon Process, V. 55, N. 12, Dec. 1976, pp. 93-96.
The paper presents an analysis of water cooling tower data. It describes a method to estimate cooling tower weight, volume, number of cells, motor size and price. Two examples are given illustrating the use of calculation techniques developed.
45) Testing a Saltwater Cooling Tower Monjoie, Michael; Sobel, Nelson Power, V. 120, N. 12, Dec. 1976, pp. 42-43.
In 1974 the Atlantic City Electric Co. placed Unit 3 of its B L England Station into commercial operation. Condenser cooling for the unit is provided by cirCUlating sea water in a closed-cycle, natural-draft system. The cooling tower selected for the site was a hyperbolic, counterflow unit. The thermal test instrumentation procedures and test data as well as drift measurement results are given. The paper indicates that the tower operates within design specifications for thermal performance and that it meets the environmental criteria regarding the drift.
46) Laboratory Simulation of Wind Loading of Rounded Structures Farell, Cesar; Guven, Oktay; Patel, V. C. Univ. of Iowa, Iowa City lASS (Int. Assoc. of Shell and Space Struct.) World Consr. on Space Enclosures, Montreal, Quebec, July 4-9,1976. Pub!. by Concordia Univ., Build. Res. Cent., Montreal, Quebec, 1976, V. 2, pp. 905-913.
The paper shows that mean-pressure distributions on cooling tower shells depend on a number of factors including the Reynolds number, the surface roughness, the velocity distribution and the turbulence characteristics of the approaching stream, the presence of other large structures in the vicinity, and the wind-tunnel blockage in the case of model tests. The paper reviews the relative importance of these factors and establishes criteria for the modeling of wind loadings on the basis of experimental and analytical studies performed by the authors.
47) Cooling Water Salinity and Brine Disposal Optimized with Electrodialysis Water Recovery/Brine Concentration System Westbrook, G.; Wirth, L. Jr. Dow Chemical Co., Midland, MI ASME Paper, N. 76-WA/Pwr-3 for Meeting Dec. 5, 1976,8 p.
The paper discusses discharge power plants which must operate with the smallest possible waste volumes for containment on the site. An electrodialysis (ED) system and its accompanying pretreatment system are described. They are designed to concentrate solute salts to as high as 15 to 20% concentration for solar pond or evaporator feed. The water separated from the salts (about 90% of the flow volume) is recycled back to the cooling tower, thus reducing water usage in water scarce areas. Capital and operating costs are compared to thermal evaporators and solar ponds as well as the flexibility for handling larger flows by each method. 17 refs. cited.
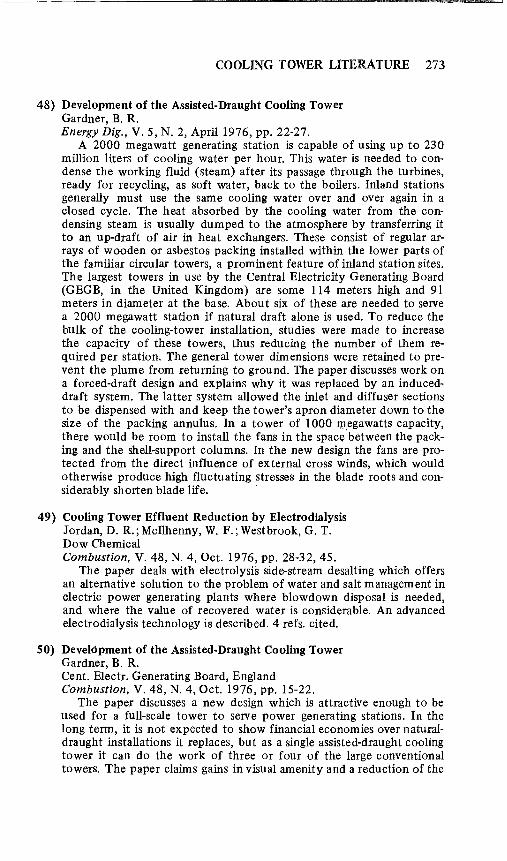
COOLING TOWER LITERATURE 273
48) Development of the Assisted-Draught Cooling Tower Gardner, B. R. Energy Dig., V. 5, N. 2, April 1976, pp. 22-27.
A 2000 megawatt generating station is capable of using up to 230 million liters of cooling water per hour. This water is needed to condense the working fluid (steam) after its passage through the turbines, ready for recycling, as soft water, back to the boilers. Inland stations generally must use the same cooling water over and over again in a closed cycle. The heat absorbed by the cooling water from the condensing steam is usually dumped to the atmosphere by transferring it to an up-draft of air in heat exchangers. These consist of regular arrays of wooden or asbestos packing installed within the lower parts of the familiar circular towers, a prominent feature of inland station sites. The largest towers in use by the Central Electricity Generating Board (GEGB, in the United Kingdom) are some 114 meters high and 91 meters in diameter at the base. About six of these are needed to serve a 2000 megawatt station if natural draft alone is used. To reduce the bulk of the cooling-tower installation, studies were made to increase the capacity of these towers, thus reducing the number of them required per station. The general tower dimensions were retained to prevent the plume from returning to ground. The paper discusses work on a forced-draft design and explains why it was replaced by an induceddraft system. The latter system allowed the inlet and diffuser sections to be dispensed with and keep the tower's apron diameter down to the size of the packing annulus. In a tower of 1000 1)1egawatts capacity, there would be room to install the fans in the space'between the packing and the shell-support columns. In the new design the fans are protected from the direct influence of external cross winds, which would otherwise produce high fluctuating stresses in the blade roots and con-siderably shorten blade life. .
49) Cooling Tower Effluent Reduction by Electrodialysis Jordan, D. R.;McIlhenny, W. F.; Westbrook, G. T. Dow Chemical Combustion, V. 48, N. 4, Oct. 1976, pp. 28-32,45.
The paper deals with electrolysis side-stream desalting which offers an alternative solution to the problem of water and salt management in electric power generating plants where blowdown disposal is needed, and where the value of recovered water is considerable. An advanced electrodialysis technology is described. 4 refs. cited.
50) Develdpment of the Assisted-Draught Cooling Tower Gardner, B. R. Cent. Electr. Generating Board, England Combustion, V. 48, N. 4, Oct. 1976, pp. 15-22.
The paper discusses a new design which is attractive enough to be used for a full-scale tower to serve power generating stations. In the long term, it is not expected to show financial economies over naturaldraught installations it replaces, but as a single assisted-draught cooling tower it can do the work of three or four of the large conventional towers. The paper claims gains in visual amenity and a reduction of the
274 COOLING TOWERS
land area occupied by a station utilizing this design. The paper begins by outlining the basic principles of cooling-tower design and gives some account of the work which has brought the first 1000 megawatt (electrical) induced-draught tower to the stage of being a practical proposition.
51) Heutiger Entwicklungsstand Der Kombinierten Nass-/Trockenkuehlung In Der Bundesrepublik Deutschland Und Erste Betriebserfahrungen Mit Den Verschiedenen Verfahren , (Present State of Development of Combined Wet/Dry Cooling in the Federal Republic of Germany and Initial Operating Experience with Different Processes) Vodicka, V. Balcke-Duerr, Bochum, Germany VGB Kraftswerkstech, V. 46, N. 10, Oct. 1976, pp. 630-637.
The paper explains the physical background to the development of visible cooling tower vapor. There are several processes where it is possible to suppress the firmness of the vapor. As the paper shows, parallel connection of both the wet and dry sections of the air side offer the most economical approach. The paper presents designs of large scale installations, explains their, operating procedures and discusses costs. It is shown that wet/dry cooling even in designs with a relatively high proportion of dry removed heat is more economical than pure dry cooling. 7 refs. cited. (In German).
52) Computer Simulation of Atmospheric Effects of Waste Heat Rejected From Conceptual Large Power Parks Bhumralkar, C. M. Stanford Res. Inst., Menlo Park, CA ASME Paper, N. 76-WA/HT-20 for Meet. Dec. 5,1976,8 p.
Proposals to install large power complexes at single site (generating capacity 10,000 to 50,000 MW/le) raise concern for the inadvertent weather modification by attendant effluents. A mesoscale model designed to simulate the inadvertent modification of the atmosphere caused by localized perturbations of heat and/or moistUre, was applied to a hypothetical development at a site near Baton Rouge, LA. Numerical studies determined the relationships between local meteorological variables, orientation of cooling towers to the ambient wind, and other factors, and the resultant atmospheric effects. The preliminary results presented indicate that the model's treatment of the temperature and moisture perturbations caused by natural draft wet cooling towers is realistic and physically consistent. The results also provide indication that significant weather modification can result from the type of power park development proposed. It is believed that the model can make valuable contributions to the design of the facilities for disposing waste heat at large power complexes. 9 refs. cited.
53) Mean Wind Loading on Rough-Walled Cooling Towers Farell, Cesar; Guven, Oktay; Maisch, Federico Univ. of Iowa, Iowa City ASCE J. Eng. Mech. Div., V. 102, N. 6, Dec. 1976, pp. 1059-1081.
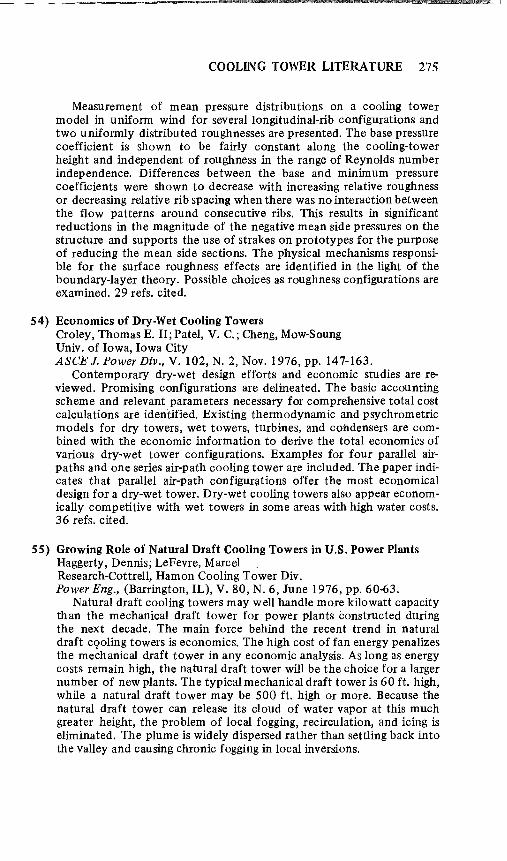
COOLING TOWER LITERATURE 275
Measurement of mean pressure distributions on a cooling tower model in uniform wind for several longitudinal-rib configurations and two uniformly distributed roughnesses are presented. The base pressure coefficient is shown to be fairly constant along the cooling-tower height and independent of roughness in the range of Reynolds number independence. Differences between the base and minimum pressure coefficients were shown to decrease with increasing relative roughness or decreasing relative rib spacing when there was no interaction between the flow patterns around consecutive ribs. This results in significant reductions in the magnitude of the negative mean side pressures on the structure and supports the use of strakes on prototypes for the purpose of reducing the mean side sections. The physical mechanisms responsible for the surface roughness effects are identified in the light of the boundary-layer theory. Possible choices as roughness configurations are examined. 29 refs. cited.
54) Economics of Dry-Wet Cooling Towers Croley, Thomas E. II; Patel, V. c.; Cheng, Mow-Soung Univ. of Iowa, Iowa City ASCE J. Power Div., V. 102, N. 2, Nov. 1976, pp. 147-163.
Contemporary dry-wet design efforts and economic studies are reviewed. Promising configurations are delineated. The basic accounting scheme and relevant parameters necessary for comprehensive total cost calculations are identified. Existing thermodynamic and psychrometric models for dry towers, wet towers, turbines, and condensers are combined with the economic information to derive the total economies of various dry-wet tower configUrations. Examples for four parallel airpaths and one series air-path cooling tower are included. The paper indicates that parallel air-path configurations offer the most economical design for a dry-wet tower. Dry-wet cooling towers also appear economically competitive with wet towers in some areas with high water costs. 36 refs. cited.
55) Growing Role of Natural Draft Cooling Towers in U.S. Power Plants Haggerty, Dennis; LeFevre, Marcel Research-Cottrell, Hamon Cooling Tower Div. Power Eng., (Barrington, IL), V. 80, N. 6, June 1976, pp. 60-63.
Natural draft cooling towers may well handle more kilowatt capacity than the mechanical draft tower for power plants constructed during the next decade. The main force behind the recent trend in natural draft c<;>oling towers is economics. The high cost of fan energy penalizes the mechanical draft tower in any economic analysis. As long as energy costs remain high, the natural draft tower will be the choice for a larger number of new plants. The typical mechanical draft tower is 60 ft. high, while a natural draft tower may be 500 ft. high or more. Because the natural draft tower can release its cloud of water vapor at this much greater height, the problem of local fogging, recirculation, and icing is eliminated. The plume is widely dispersed rather than settling back into the valley and causing chronic fogging in local inversions.
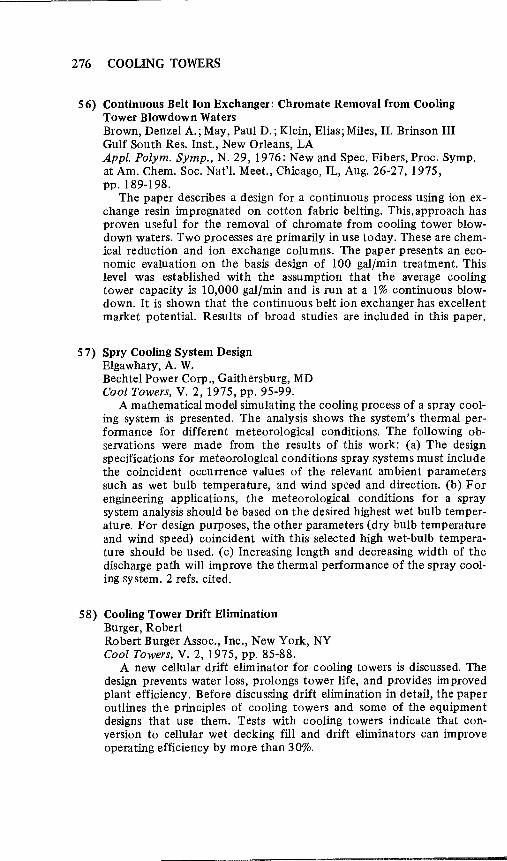
276 COOLING TOWERS
56) Continuous Belt Ion Exchanger: Chromate Removal from Cooling Tower Blowdown Waters Brown, Denzel A.; May, Paul D.; Klein, Elias; Miles, H. Brinson III Gulf South Res. Inst., New Orleans, LA Appl. Polym. Symp., N. 29,1976: New and Spec. Fibers, Proc. Symp. at Am. Chern. Soc. Nat'I. Meet., Chicago, IL, Aug. 26-27,1975, pp.189-198.
The paper describes a design for a continuous process using ion exchange resin impregnated on cotton fabric belting. This, approach has proven useful for the removal of chromate from cooling tower blowdown waters. Two processes are primarily in use today. These are chemical reduction and ion exchange columns. The paper presents an economic evaluation on the basis design of 100 gal/min treatment. This level was established with the assumption that the average cooling tower capacity is 10,000 gal/min and is run at a 1 % continuous blowdown. It is shown that the continuous belt ion exchanger has excellent market potential. Results of broad studies are included in this paper.
57) Spry Cooling System Design Elgawhary, A. W. Bechtel Power Corp., Gaithersburg, MD Cool Towers, V. 2, 1975, pp. 95-99.
A mathematical model simulating the cooling process of a spray cooling system is presented. The analysis shows the system's thennal perfonnance for different meteorological conditions. The following observations were made from the results of this work: (a) The design specifications for meteorological conditions spray systems must include the coincident occurrence values of the relevant ambient parameters such as wet bulb temperature, and wind speed and direction. (b) For engineering applications, the meteorological conditions for a spray system analysis should be based on the desired highest wet bulb temperature. For design purposes, the other parameters (dry bulb temperature and wind speed) coincident with this selected high wet-bulb temperature should be used. (c) Increasing length and decreasing width of the discharge path will improve the thennal perfonnance of the spray cooling system. 2 refs. cited.
58) Cooling Tower Drift Elimination BUrger, Robert Robert Burger Assoc., Inc., New York, NY Cool Towers, V. 2, 1975, pp. 85-88.
A new cellular drift eliminator for cooling towers is discussed. The design prevents water loss, prolongs tower life, and provides improved plant efficiency. Before discussing drift elimination in detail, the paper outlines the principles of cooling towers and some of the equipment designs that use them. Tests with cooling towers indicate that conversion to cellular wet decking fill and drift eliminators can improve operating efficiency by more than 30%.
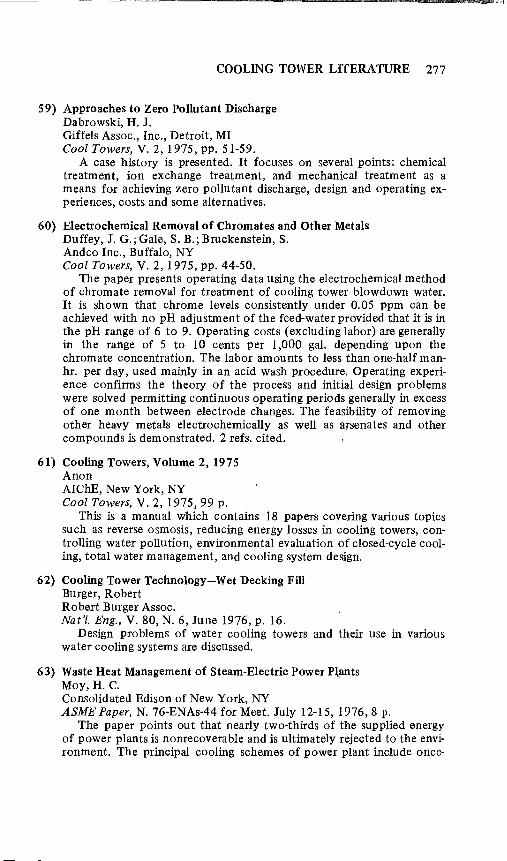
COOLING TOWER LITERATURE 277
59) Approaches to Zero Pollutant Discharge Dabrowski, H. J. Giffels Assoc., Inc., Detroit, MI Cool Towers, V. 2, 1975, pp. 51-59.
A case history is presented. It focuses on several points: chemical treatment, ion exchange treatment, and mechanical treatment as a means for achieving zero pollutant discharge, design and operating experiences, costs and some alternatives.
60) Electrochemical Removal of Chromates and Other Metals Duffey, J. G.; Gale, S. B.; Bruckenstein, S. Andco Inc., Buffalo, NY Cool Towers, V. 2, 1975, pp. 44-50.
The paper presents operating data using the electrochemical method of chromate removal for treatment of cooling tower blowdown water. It is shown that chrome levels consistently under 0.05 ppm can be achieved with no pH adjustment of the feed-water provided that it is in the pH range of 6 to 9. Operating costs (excluding labor) are generally in the range of 5 to 10 cents per 1,000 gal. depending upon the chromate concentration. The labor amounts to less than one-half manhr. per day, used mainly in an acid wash procedure. Operating experience confirms the theory of the process and initial design problems were solved permitting continuous operating periods generally in excess of one month between electrode changes. The feasibility of removing other heavy metals electrochemically as well as a/senates and other compounds is demonstrated. 2 refs. cited.
61) Cooling Towers, Volume 2, 1975 Anon AIChE, New York, NY Cool Towers, V. 2, 1975, 99 p.
This is a manual which contains 18 papers covering various topics such as reverse osmosis, reducing energy losses in cooling towers, controlling water pollution, environmental evaluation of closed-cycle cooling, total water management, and cooling system design.
62) Cooling Tower Technology-Wet Decking Fill Burger, Robert Robert BUrger Assoc. Nat'l. Eng., V. 80, N. 6, June 1976, p. 16.
DeSign problems of water cooling towers and their use in various water cooling systems are discussed.
63) Waste Heat Management of Steam-Electric Power P~ants Moy, H. C. Consolidated Edison of New York, NY ASME Paper, N. 76-ENAs-44 for Meet. July 12-15, 1976,8 p.
The paper points out that nearly two-thirds of the supplied energy of power plants is nonrecoverable and is ultimately rejected to the environment. The principal cooling schemes of power plant include once-
R
278 COOLING TOWERS
through, closed-cycle, and a combination of both. The paper discusses the technology of each. It is concluded that avoidance of undesirable detrimental environmental effects must be a major consideration in the design of any once-through cooling system. Although closed-cycle alternatives may offer minimal ecological impact, their cost is high. As for waste heat utilization, its beneficial usage in agriculture and aquaculture appears to be practical and economically feasible. 12 refs. cited.
64) Alternative Arrangements and Designs for Wet/Dry Cooling Towers Smith, E. C.; Larinoff, M. W. Hudson Prod. Corp., Houston, TX Power, Eng., '(Barrington, IL), V. 80, N. 5, May 1976, pp. 58-61.
The paper makes a comparison between separate-structure wet/dry cooling towers with different condensers or the same condenser and with parallel or series circulating water flow. The use of single-structure versus separate structure wet/dry towers is also considered.
65) Optimum Shape of Cooling Towers Reinschmidt, Kenneth F.; Narayanan, R. Comput. Struct., V. 5, N. 5-6, Dec. 1975, pp. 321-325.
The determination of the optimal shape of continuous surface structures can be approached by algebraic techniques suitable for digital computation. When the coordinates of the middle surface of a shell are expressed by a finite polynomial series, an optimization problem in a finite set of discrete variables materializes. The method is applied to a particular example of a shell of revolution describing a natural draft cooling tower. A simple preliminary design model is formulated to evaluate the potential savings due to numerical optimization, and the resulting nonlinear programming problem is solved by iterated linear programming. The results indicate that the method is feasible and that significant savings could be achieved by computerized shape optimization. 5 refs. cited.
66) Role of Geometric Imperfections in the Collapse of a Cooling Tower Kemp, K. 0.; Croll, J. G. A. Univ. Coll., London, England Struct. Eng., V. 54, N. I, Jan. I976,pp. 33-37.
Effects of geometric imperfections in the form of the meridians of hyperboloidal cooling towers are described. The authors show that even moderate imperfections induce hoop stresses in the vicinity of the imperfection that are of the same order of magnitude as the meridional stresses that would occur in this same area of the perfect shell. By examining a shell of form similar to the Ardeer shell which recently collapsed, it is indicated that imperfections may have had an important contributory role in initiating this failure. The authors suggest that for fu ture designs, greater attention be given to specifying imperfection. 11 refs. cited.
67) Gust Factors for Hyperbolic Cooling Towers Singh, Mahendra P.; Gupta, Ajaya K. Sargent & I.undy, Chicago, IL ASCE J. Struct. Div., V. 102, N. 2, Feb. 1976, pp. 371-386.
COOLING TOWER LITERATURE 279
The paper notes that wind pressure distribution and dynamic behavior of hyperbolic cooling towers are significantly different from those of simple slender structures. As such, the gust response factors developed for design of simple structures may not be applicable to cooling towers. The author introduces a method which considers the dynamic interaction of the wind and tower to obtain the gust factors for cooling tower design. Wind pressure distribution measurements made on model towers in wind tunnels are presented. Simplifying assumptions are made concerning the correlation characteristics of wind pressure on a tower surface. Effect of change in wind and tower parameters on gust factors is examined. 12 refs. cited'.
68) Thermodynamic Models of Dry-Wet Cooling Towers Croley, Thomas E. II; Patel, V. C.; Cheng, Mow-Soung Inst. of Hydraul. Res., Univ. of Iowa, Iowa City ASCEJ.PowerDiv., V.102,N.1,Jan.1976,pp.I-I9.
Basic thermodynamic models are discussed. The models are necessary for a comprehensive consideration of all cooling system costs. They are outlined for the combination dry-wet cooling towers. The various subsystem models of indirect air-cooled heat exchangers, crossflow evaporative piles, turbines, and condensers are combined to give a manageable overall thermodynamic model, suitable for large numbers of repetitive calculations at different meteorological conditions. The resulting model represents several configurations of the parallel air-path, crossflow, induced-draft, dry-wet cooling tower. EXamples are given to illustrate the model use and indicate its large applicability in economic, water consumption, and plume emission studies. 44 refs. cited.
69) Comparison of Different Combinations of Wet and Dry Cooling Towers von Cleve, H. H. GEA Des fuer Luftkondensation, Ger. ASME Paper, N. 75-WA/Pwr-1O for Meet., Nov. 30-Dec. 4, 1975, 7 p.
The paper notes that the most economical solution for any design is a combination of conventional wet cooling towers with direct air cooled condensers. Various limitations at particular sites, such as ambient air conditions which require that wet cooling tower plumes be avoided, makeup water quantity available, and maximum turbine backpressure acceptable only dictate the individual design data for the wet and dry sections. The author describes simple methods to determine the design of both individual sections. To meet makeup water and/or backpressure requirements the wet and the dry section must not necessarily be combined into one unit. However, one combined cooling system is required to avofd wet cooling tower plumes.
70) Power Spray Cooling-Unit and System Performance Soo, S. L. Univ. of Illinois at Urbana-Champaign ASME Paper, N. 75-WA/Pwr-8 for Meet. Nov. 30-Dec. 4,1975,11 p.
The author notes that the performance of unit sprays can be expressed in the coefficient of performance per unit temperature difference of water to that of the wet bUlb. For large unit sprays, cross wind is important to the performance because the local humidity depends on
280 COOLING TOWERS
its rate of removal. Low power requirements of spray cooling systems requires optimum droplet size and high pump efficiency. The ratio of spray flow to through-flow controls the loss from mixing. Optimum design should strive for small mean droplet sizes around 5-mm-dia. and spray height around 4 m to limit the loss by cross wind while insuring large heat release rates. For a typical power plant, the power consumption of the spray cooling system designed following these criteria will be below 1% of the total power output and water loss below 2.5%. Such a system as an alternative to devices like piped-in spray ponds and cooling towers has the advantage of flexibility in design ahd operation and future expansion. The system is also useful as an evaporator for sewage treatment plants. 7 refs. cited.
71) Aerodynamic Design of Cooling Tower Drift Eliminators Yao, S. C.; Schrock, V. E. Argonne Nat'l. Lab., IL ASME Paper, N. 75-WA/Pwr-5 for Meet. Nov. 30-Dec. 5, 1975,7 p.
A parametric study of the characteristics of inertial drift eliminators of wet cooling towers is presented for their blade shapes, orientation with respect to gravity, solidity ratios, blade sizes, approaching air speed, and drift spectrum. The behavior of drift eliminators is revealed by nondimensional parameters. A method for the optimum design of an eliminator considering minimum cost versus performance is developed. This methodology can be integrated into the optimum design of the entire cooling system. An example of the design approach is given. 18 re~s. cited.
72) Dynamic Plume Model for the Prediction of Atmospheric Effects Associated with Cooling Tower Operation Rao, K. S.; Lague, J. S.; Egan, B. A.; Chu, Y. H. Environ. Res. & Technol., Concord, MA Proc. Air Pollut. Control Assoc., 68th 1975, for Meet., Boston, MA, June 15-20, 1975, V. 1, Paper 75-04, 5,18 p.
A numerical method for predicting the convective rise of cumulus clouds in a quiescent atmosphere was adapted to model the behavior of a buoyant moist plume released at high vertical velocity into a crosswind. The model was successfully applied to assess the atmospheric effects (ground-level icing, fogging, and length of visible plume) associated with a number of cooling tower designs. A physically-realistic procedure for treating the merging of multiple plumes has been incorporated for applications to mechanical draft towers. 9 refs. cited.
73) Recycling cooling and Chilling Equipment Energy Prasad, Anil; Fitzgerald, John Appl. Eng. Corp., Elk Grove Village, IL SPE Tech. Cont, 33rd Annual Proc., Atlanta, GA, May 5-8,1975, pp. 8-10. Publ. by SPE, Greenwich, CT, 1975.
The authors discuss three different temperature considerations which should be taken into account when selecting cooling and chilling equipment. Water temperature levels of 80°F to 95°F are used in the

COOLING TOWER LITERATURE 281
cooling of hydraulic oil and air compressors. These higher water temperatures are usually supplied by an evaporative cooler (cooling tower). The second range of temperatures is from 40°F to 55°F. This coolant temperature is generally used for cooling molds, jacketed vessels, calenders and mills. This level of water temperature is supplied by refrigeration equipment. The usual coolant medium is water. The third area of temperature consideration is the low temperature range of coolants. This temperature range is from 40°F to OaF and lower. These molding temperatures are supplied by low temperature refrigeration equipment. For larger cooling system requirements, it may be more advantageous to consider a central system. One of the more practical central system designs is the energy conserving air cooled type. From energy and economics standpoints, this type of chilling provides two benefits; it conserves water (l00% recovery) and it recycles process energy to conserve heating fuel.
74) Initial Investigations of the Effects of Heat and Moisture Dissipation from a Large Natural·Draft Cooling Tower Peterman, William A.; Frey, Glen R.; Limbird, Arthur G. Bowling Green State Univ., OH Symp. on Atmos. Dittus. and Air Pollut., Prepr., Santa Barbara, CA, Sept. 9-13, 1974, pp. 420-425. Publ. by Am. Meteorol. Soc., Boston, MA,1974.
The paper is intended to provide an outline of the efforts underway to ascertain the effects of heat and moisture dissipation from a large natural draft cooling tower. The outline of the discU:'ssion is as follows: The general problem of climatic fluctuations is treated first. A detailed discussion of the soil environment is given. The purpose of this section is to show how the meteorological investigations will act as the key to understanding the total environmental change. Finally, a review of the problem of inadvertent weather modification is provided. 17 refs. cited.
75) Evaluation of Varying Meteorological Parameters on Cooling Tower Plume Behavior Tsai, Y. J.: Huang, C. H. Stone & Webster Eng. Corp., Boston,. MA Symp. on Atmos. Dittus. and Air Pollut., Prepr., Santa Barbara, CA, Sept. 9-13, 1974, pp. 408-411. Publ. by Am. Meteorol. Soc., Boston, MA,1974.
Cooling tower plume behavior is simulated by an integral method. The model offers an accurate and flexible simulation of the plume characteristics. The model allows investigation of environmental design considerations in conjunction with cooling system alternatives of electric generating plant, plant operating modes, and meteorological conditions, and to minimize the impact on the environment. 9 refs. cited.
76) Some Extra-High Capacity Heat Exchangers of Special Design Forgo, L. HOTERV, Des Br. for Ind. Power & Heat Supply, Budapest, Hungary Heat Exch. " Des. and Theory Sourcebook, Int. Cent. for Heat and Mass
282 COOLING TOWERS
Transfer, 5th Semin., Proc. pp. 101-119. Pub!. by Scripta Book Co., Washington, DC, 1974, Div. of McGraw-Hill, New York, NY.
Air cooled condensing plants, steam turbines with multiple reheating cycle are described and analyzed. Diagrams and plates illustrating design and plants are appended. 4 refs. cited.
77) Recycling of Cooling Water in Cable Manufacture Benenati, Samuel R. West. Electr. Co., Buffalo, NY Wire J., V. 8, N. 6, June 1975, pp. 61-65.
At Western Electric Company's Buffalo works, municipal water required for co.oling four cable jacketing lines has been recirculated and reused. Water consumption for this manufacturing operation was reduced by 95%. The recirculating system uses a unique injection, spraytype commercial cooling tower which is virtually maintenance-free. The cooling system has no moving parts, fans, wet decks, or electrical wiring. Cooling is accomplished by spraying and expanding water through numerous small nozzles. Insulation on the outside piping is not required to prevent freezing, because the design of the cooling unit permits the water to drain out when it is not in operation. FUrther reduced installation costs were achieved by the use of commercially available pump suction diffusers and triple-du ty check valves.
78) Stability of Hyperboloidal Shells Veronda, Daniel R.; Weingarten, Victor I. Hughes Airc~aft Co., Fullerton, CA ASCE J. Struct. Div., V. 101, N. 7, July 1975, pp. 1585-1602.
The paper presents an analytical and experimental investigation of buckling loads of hyperboloidal shells with different geometries subjected to the axisymmetric loadings of external pressure and axial compression. Sander's thin shell equations were used in conjunction with the finite element method to determine the bifurcation buckling load of the shell. Experimental data on the instability behavior of hyperboloidal shells subjected to combined loadings is presented. Molded PVC specimens were used in the experiments. Shell specimens were: (a) Clamped on both ends; and (b) clamped on one end and free on the other end. The experimental data were found to be in good agreement with the analysis for all types of loading conditions. 16 refs. cited.
79) Analysis of a Multi·Unit Cocurrent Crossflow Cooling Tower Hayashi, Yoshishige; Hirai, Eiji Kanazawa Univ., Japan Heat Transfer Jap. Res., y. 3, N. 4, Oct.-Dec. 1974, pp. 67-74.
An analysis of multi-unit cocurrent crossflow cooling towers is made. Towers were placed in series and the results obtained were compared with that of multi-Unit countercurrent crossflow cooling towers. The experimental data on the multi-unit cocurrent crossflow cooling tower were· analyzed in terms of enthalpy efficiency of single-unit, heat capacity ratio and number of transfer units. An outline of design calculations of multi-unit cocurrent crossflow cooling towers is presented. 4 refs. cited.

COOLING TOWER LITERATURE 283
80) Cooling Tower Design and Evaluation Parameters Kelly, G. M. Marley Co., Mission, KS ASME Paper, N. 75-IPWR-9 for Meet. May 19-20, 1975,8 p. CODEN: ASMSA4.
The paper discusses the parameters involved in the thermal design and evaluation of industrial cooling towers. By relating tower performance, size and costs to the previously published Rating Factor-Tower Unit system, the engineer gains a useful tool for selecting, optimizing and pricing various tower design conditions.
81) Successive Graphical Method of A Cross-Flow Cooling Tower Inazumi, H.; Kageyama, S. Shizuoka Univ., Hamamatsu, Japan Chern. Eng. Sci., V. 30, N. 7, July 1975, pp. 717-721.
A graphical method of the calculation of the mean enthalpy driving force in a cross-flow cooling tower is presented. In this method, the equilibrium relationship between the temperature and the enthalpy of saturated air is graphically represented and used in the calculation. The applicable range is wider than the conventional methods which use the equilibrium relation in a form of a first-order equation or an exponential expression for a limited range of the temperature. This method is educational since it is a visual, graphical method. An example of the calculation applied to the practical case is given. 5 refs. cited.
82) Optimization of Plant Cooling Water Systems Allman, W. B. DuPont, Wilmington, DE ASME Paper, N. 75-IPWR-7 for Meet. May 19-20, 1975,5 p.
This paper attempts to demonstrate to power design engineers the desirability of having an accurate computer model available when needed if they are to achieve realistic and workable optimized plant cooling water systems. Optimization guidelines and their limitations are discussed. The balance of the paper discusses the Computer Flow Study Diagram and the computer model and gives an example of their use in optimizing a cooling tower system.
83) Effect of Evaporation Losses in the Analysis of Counterflow Cooling Towers Nahavandi, Amir N.; Kershah, Rashid M.; Serico, Benjamin J. Newark ColI. of Eng., NJ Nucl. 'Eng. Des., V. 32, N. 1, 1975, pp. 29-36.
In Merkel's method for the thermal design of counterflow cooling towers, the variation of the water flow from the tower inlet to outlet (due to evaporation losses) is neglected. This does not lead to a conservative design. In the analysis, the water evaporation losses are included in the energy balance and a new technique for the thermal design of cooling towers is developed. A comparison of the present analysis with the Merkel solution indicates that the error in the Merkel method may reach 12%, depending on the design conditions. The present solution is recommended where more accurate results are needed. 8 refs. cited.
284 COOLING TOWERS
84) Cooling Tower Institute, Annual Meeting, 1974 Meeting Cool Tower Inst., Annu. Meet., Paper, New Orleans, LA, Jan. 28-30, 1974. Available from Cool Tower Inst., Houston, TX, 1974.
Proceedings from this conference includes 14 papers on recent developments in the design, operation, and economy of cooling towers. Topics include cooling tower fans, problems of waste heat utilization, the generation of visible plumes by wet/dry cooling towers, problems of airborne transmission of pathogenic organisms in cooling tower drift, cooling tower rebuilding, cooling tower consumed power and its relationship t9 powerplant output, cooling requirements for the nuclear industry, cooling water use by manufacturers, side stream filtration for cooling towers, evolution of nonpolluting microbicides, coordinated cooling water treatment programs, and new developments in cooling water treatment technology.
85) Buckling of Cooling-Tower Shells: Bifurcation Results Cole, Peter P.; Abel, John F.; Billington, David P. Lab H. Hossdorf, Basel, Switzerland ASCE J. Struct. Div., V. 101, N. 6, June 1975, pp. 1205-1222.
The paper describes studies of bifurcation buckling of hyperboloids used for large-scale cooling towers. Those studies include the effects of flexible supports, combined loadings from wind, dead weight, and temperature, shell cracking, different variations in the wind pressure distribution, and changes in the shell thickening. The paper gives comparisons between numerical and wind-tunnel results. The finite element formulation used is examined and results are presented for the tower at the Trojan Nuclear Plant on the Columbia River, Oregon. 26 refs. cited.
86) Buckling of Cooling-Tower Shells: State-of-the-Art Cole, Peter P.; Abel, John F.; Billington, David P. Lab H. Hossdorf, Basel, Switzerland ASCE J. Struct. Div., V. 101, N. 6, June 1975, pp. 1185-1203.
Various analytical, experimental, and numerical contributions to the buckling analyses of large hyperbolic cooling towers are summarized. Previously published results for axisymmetric pressures and asymmetric wind loadings of hyperboloids are compared to new bifurcation predictions by a finite element method. A limited series of wind-tunnel tests remain the only standard against which various analytical and numerical approaches can be judged. However, numerical stUdies seem promising for studying the effect of various design factors as variable thickness, flexible supports, and edge stiffenings. 28 refs. cited.
87) Cooling Blowdown in Cooling Towers Crits, G. J.;Glover, G. Cochrane Environ. Syst., King of Prussia, PA Water Wastes Eng., V. 12, N. 4, April 1975, 5 p. between pp. 45 and 52.
The authors describe how manageable discharge levels can be obtained by sidestream treatment and careful tower design. The permissible tower control limits based on old concepts and with high pH and new concepts requiring the use of organic additives or dispersant are listed. Examples are given.

COOLING TOWER LITERATURE 285
88) Performance Curves for Mechanical Draft Cooling Towers Hallett, G. F. Ceram Cooling Tower Co., Fort Worth, TX ASME Paper, N. 74-WA-PCT-3 for Meet. Nov. 17-22, 1974,6 p.
Both ASME PTC-23 and Cooling Tower Institute Bulletin ATP-I05 are being revised and both test codes have historically used performance curves as a means of evaluating cooling tower capacity. Techniques and methods are given for calculating performance curves for both counterflow and crossflow type cooling towers. These procedures can be used dUring bid evaluation to assess and predict tower performance at various operating conditions other than the design point. 12 refs. cited.
89) Reservoir Operation Through Objective Trade-Offs Croley, Thomas E. II Univ. of Iowa, Iowa City Water Resour. Bull., V. 10, N. 6, Dec. 1974, pp. 1123-1132.
Some of the problems that concern the proper methods for consideration of several different objectives in reservoir planning are discussed. Classical systems analysis approach to decision making for mUltiple objective problems is outlined and the inherent difficulties associated with multiple objectives and subjective estimates are identified. Techniques used in reservoir design and operation are reviewed. An alternate technique for considering noncommensurate, objectives, which relates the objectives in terms of real trade-off costs and eliminates the need for a priori estimates of objective worth is pres,!'lnted. The method is illustrated with three examples, including a reservpir operation problem and a cooling tower design problem. 31 refs. cited.
90) Effect of Wind Friction on Hyperbolic Cooling Towers Herzos, Max, A. M. Struct. Eng., V. 52, N. 11, Nov. 1974, pp. 417-420.
The paper stresses that the action of winds on the rough surfaces of cooling towers is often not accounted for. Designing cooling towers can result in their unsatisfactory behavior regardless of this fact. Wind forces acting on cooling towers are discussed and approximate analysis of cooling towers under dead load and wind is presented. 17 refs. cited.
91) Sea-Water Cooling Tower , Fukuda, Shozo; Aramaki, Mikio; Oda, Masao; Shoji, Ikuzo Nagasaki Tech. Inst., Japan Mitsubishi Heavy Ind. Tech. Rev., V. 11, N. 3, 1974, pp. 238-248.
A large capacity sea-water cooling tower is designed with a drift elimin~tor to drastically reduce the drift carry-over. The drift carry-over from the tower has in fact been reduced to only an order of 6 to 7 X 10 7 of the quantity of sea-water circulated for cooling, or is as low as 1/2000 or less as compared with 0.2% in the conventional fresh-water cooling tower. The present paper gives an outline of the service results of this cooling tower. 5 refs. cited.
92) Wet/Dry Cooling Tower: An Effective Plume Control Method Reisman, J. I.; Dolan, N. E. Ecodyne Corp., Santa Rosa, CA ASME Paper, N. 74-WA/HT-57 for Meet. Nov. 17-22, 1974, 13 p.

286 COOLING TOWERS
Under certain conditions, the exhaust air of conventional mechanical draft cooling towers may form a fog plume, causing visibility and icing problems to highways and equipment. In cases where this cannot be tolerated, a combination wet/dry cooling tower is shown to be effective fog plume control method. The paper describes the basic phenomena of cooling tower fog formation. The operation and performance characteristics of the wet/dry tower are discussed as well as a method of select wet/dry design criteria. 11 refs. cited.
93) Experimental Cooling Tower Rish, R. F. Univ. of Tasmania Australia Conf. on Heat and Mass Transfer, 1st Pap., Monash Univ., Melbourne, Aust., May 23-25, 1973, Sect 5, 2, pp. 1-14. Available from Dr. R. J. Batterham, CSIRO Oiv. of Chern. Eng., Clayton, Victoria, August 1973.
A new design of an experimental cooling tower is described. The tower can be used for instructing in the principles of evaporative cooling and for testing film flow packings. The tower is inexpensive to construct and the power required for water heating and air circulation is kept low. At the same time the tower is large enough to minimize errors due to end effects. Experimental results relate air friction and mass transfer coefficients for a range of spacings and configurations of packings. 7 refs. cited.
94) Thermal Loading of Thin-Shell Concrete Cooling Towers Larrabee, Richard D.; Billington, David P.; Abel, John F. Souza and Tru., Cambridge, MA ASCE J. Struct. Div., V. 100, N. 12, Dec. 1974, pp. 2367-2383.
The behavior of reinforced concrete cooling shells is investigated under the effect of axisymmetric operating thermal loads and nonaxisymmetric solar thermal loads. Analytical and finite element techniques are applied. Stress and displacement results are compared to field measurements on a 420-ft. high cooling tower. High flexural stresses due to operating thermal gradients are found to be relieved by meridional cracking of the shell, and the effect of this cracking is examined in relation to cooling-tower design. 7 refs. cited.
95) Axisymmetric Free Vibration and Transient Response of a Clamped Cylindrical Shell of Linear Varying Thickness Fisher, H. D. Combustion Eng. Inc., Windsor, CT Nucl. Eng. Des., V. 30, N. 2, Sept. 1974, pp. 278-285.
A variety of structural design problems in nuclear engineering require a knowledge of the dynamic response of variable thickness shells. Examples include natural draft cooling towers subjected to wind loading, and the core support barrel of a pressurized water reactor during a loss of coolant accident, where the maximum radial deflection due to hydrodynamic loadings is a critical design parameter. The paper investigates the free vibration and transient response of a circular cylindrical shell of linear varying thickness. Mode shapes and frequencies, calculated in the
COOLING TOWER LITERATURE 287
free vibration analysis, are used in a model solution for the transverse displacement and bending stress of the forced vibration problem. Numerical results are presented for two clamped cylinders subjected to a triangular pressure-time history. Application of analysis to constant thickness cylinders which are linearly thickened near a clamped support is discussed. 12 refs. cited.
96) Vibration of Cooling Towers Armitt, J. Cent. Electr. Res. Lab., Leatherhead, England Vib. Probl. in Ind., Int. Symp. Proc., Sess. Pap., Keswick, England, April 10-12,.1973, Sess 3, Pap. 311,19 p. Available from UK at Energy Auth., Windscale, Seascale, Cumberland, England, 1973.
Wind tunnel test methods were developed to determine wind induced stresses in cooling towers using aeroelastic models as part of a detailed model of a power station site. The turbulence and shear in the atmospheric wind are simulated. Tests on a model of Ferrybridge 'C' Power Station show that resonant stresses are significant at the design wind speed. These increase as the fourth power of wind speed and can be greatly enhanced by turbulent wakes of upstream structures. 6 refs. cited.
97) Wet Bulb Temperatures in Cooling Tower Design Hill, G. B. Heat Vent. Eng., J. Air Cond., V. 48, N. 564, July 1974, pp. 19-22,32.
This article examines the selection of cooling to~er design ambient air wet bulb temperatures in the light of recent developments in the air conditioning industry.
98) Wake and Gust Loading on Cooling Towers Sawyer, R. A. Salford, Univ., England Vib. Probl. in Ind., Int. Symp. Proc., Sess. Pap., Keswick, England, April 10-12, 1973, Sess. 3, Pap. 117, 19 p. Available from UK at Energy Auth., Windscale, Seascale, Cumberland, England, 1973.
An experiment was conducted in a low speed gust tunnel in which steady and unsteady pressure distributions over the surface of a model cooling tower were measured. Attention is concentrated on the spectra of pressure fluctuations at a section near the throat of the tower. The effects of boundary layer, wake and incident wake on the spectra of pressure fluctuations at points on the tower are demonstrated, and the effects of lateral turbulence identified by varying the amplitude of the input to the gust actuators. 10 refs. cited.
99) Air Side Design and Operating Problems in Cooling Towers Phelps, P. M. Phelps Eng. Co., Kentfield, CA ASMEPaper, N. 74-Pet-29 for Meet. Sept. 15-18, 1974,4p.
The size of a cooling tower is normally established by the amount of air that is needed for a specified cooling job. The tower fill, which minimizes air rate requirements generally minimizes overall tower costs as
288 COOLING TOWERS
well as for anyone basic type of tower. Such low air rate designs will usually result in comparatively less severe icing during winter months; however, fog discharge from the tower can be greater than from a high air rate design.
100) Treat Cooling-Tower Blowdown Boies, D. B.; Levin, J. E. Wapora Inc. Power, V. 118, N. 8, Aug. 1974, pp. 76-78. ,
To maintain environmental impact at a mmmlUm, cooling-tower systems must be designed to abate both thermal and chemical pollution in blowdown stream. The latter is accomplished by treating blowdown prior to discharge or reuse. Sedimentation and other methods prepare blowdown streams for discharge to the natural environment. Evaporation or reuse permits a closed cooling system.
101) Die Wichtigsten Parameter, Die Das Verhalten Des Nassen Kuehlturms Bestimmen (Most Important Parameters that Decide the Operation of Wet Cooling Towers) Vladea, I. Tech Hochsch, Timisoara, R'om Brennst-Waerme-Kraft, V. 26, N. 6, June 1974, pp. 244-249.
In effecting the desired cooling range, it is important that this range lies within the lowest possible water temperatures. Experimental studies showed that meeting this requirement depends on the design of the internal baffles. The paper gives experimental results obtained with flat and corrugated baffles (for countercurrent cooling) and with profiled rods (crosscurrent cooling). As a basis for comparison, a cooling tower with assumed operation at various air temperatures was used. 8 refs.' cited. (In Gennan).
102) Cooling Cascades for Wet/Dry Transfer Processes Berliner, Paul Ges fuer Kernforsch, Karlsruhe, Germany ASME Winter Annu. Meet., Heat Transfer Div. Symp., Pap., Detroit, MI, Nov. 11-15, 1973, pp. 119-126. Pub!. by ASME, HTD, V. 6, New York, 1973.
Natural draught will dominate as the prime mover of cooling towers where heated air fluxes of still unknown magnitude occur. The optimum height/diameter relation can be deduced from thenno- and aerodynamic principles. Both the uprise within a hyperbolic shell and the buoyancy and the diffusion into the ambient air influences the capcity. It is shown that large diameters are relatively more effective than large chimney heights. Also, vast air rates make high air inlet openings advisable. To elevate the circulating water to the large inlet heights embodies excessive pumping heads in counterflow cooling towers. These three factors stand against conventional design rules. They promote the presented concept of a perimetric cooling wall. The water can be distributed in cascades of limited height. The cooling cascades can be

COOLING TOWER LITERATURE 289
operated wet and/or dry by automatic control. The automatic operation includes a method of tJIrning the fill body of wet heat transfer out of the air flow in periods of dry heat transfer to reduce the pressure drop of the air. 3 refs. cited.
103) Dry Cooling Tower Power Plant Design Specifications and Performance Characteristics Larinoff, Michael W. Hudson Prod. Corp., Houston, TX ASME Winter Annu. Meet., Heat Transfer Div. Symp. Pap., Detroit, MI, Nov. 11-15, 1973, pp. 57-75. Publ. by ASME, HTD, V. 6, New York, 1973.
The paper discusses operating limitations imposed by the turbine exhaust element and the alternatives presently available to the electric utility industry. It also presents tools for estimating dry tower plot area, fan power and circulating pump power requirements. It shows the savings in fan power which can be expected with a decrease in turbinegenerator load and ambient air temperatures. It discusses expected maintenance costs and the owner's possible exposure with a large 1000 MW dry cooling tower system. The paper ends with an evaluation of the potential for lower dry tower system costs in the future. 12 refs. cited.
104) Combined Dry Tower-Cooling Pond Systems for Power Plant Cooling GUpta, Arun K.; Gorton, Robert L. Kansas State Univ., Manhattan , ASME Winter Annu. Meet., Heat Transfer Div. Symp:'Pap., Detroit, MI, Nov. 11-15, 1973, pp. 127-137. Publ. by ASME, HTD, V. 6, New York, 1973.
The paper presents economic study of a power plant cooling system. The system studied is comprised of 'a dry cooling section followed by a cooling pond. Cooling range is 27°F with 8.0 in. Hg condenser pressure and a base environmental condition of 98°F and 50°F dew point. Various ratios of dry tower to pond cooling are studied to determine least cost proportions for a range of summer design conditions and cost factors typical of current or expected conditions. Results are presented only for summer maximum design conditions. Combined system cooling is shown to be more economical at the specified design condition than either all-dry or all-pond systems for the majority of the cases considered. 11 refs. cited.
105) Dry Towers and Wet-Dry Towers for the Indirect Power Plant Cycle Hansen, E. P. Marley Co., Mission, KS ASME Winter Annu. Meet., Heat Transfer Div. Symp. Pap., Detroit, MI, Nov. 11-15, 1973, pp. 109-117. Publ. by ASME, HTD, V. 6, New York, 1973.
Dry towers for power plants are of three types. The direct system wherein steam is condensed directly in the dry tower; the indirect type wherein water is cooled in a dry tower and then used to condense steam in a direct contact condenser; and the indirect type wherein water
290 COOLING TOWERS
is cooled in a dry tower and then used to condense steam in a conventional surface condenser. A dry tower design of the indirect type for either a mixing condenser or a surface condenser is considered. Air side capacity control and recirculation are examined and supported with laboratory data. For sites where some water is available, the use of the Parallel Path Wet-Dry Cooling Tower is suggested. 5 refs. Cited.
106) Dry and Wet/Dry Cooling Towers for Power Plants Webb, Ralph L. (Ed.); Barry, Robert E. (Ed.) Trane Co., La Crosse, WI ASME Winter Annu. Meet., Heat Transfer Div. Symp. Pap., Detroit, MI, Nov. 11-15, 1973. Publ. by ASME, HTD, V. 6, New York, 1973, 153 p.
Thirteen papers by various authors are presented. Topics discussed include design optimization of the dry cooling tower; design concepts for combined wet/dry cooling systems; economic optimization of plant loading due to climatic variation on turbine design and operation; and practical design and operational requirements for power plant coding systems.
107) Periodic Cooling Towers for Electric Power Plants Robertson, M. W.; Glicksman, L. R. MIT, Cambridge, MA . ASME Winter Annu. Meet., Heat Transfer Div. Symp. Pap., Detroit, MI, Nov. 11-15, 1973, pp. 139-153. Publ. by ASME, HTD, V. 6, New York, 1973.
A periodic cooling tower was designed to operate at lower evaporation rates than conventional wet towers and with a capital savings over dry cooling towers. In this design discs of galvanized steel sheet metal rotate from the hot water to the cool air. A thin layer of oil floating on the water surface separates the water stream from the air stream and prevents any water carryover. Tests on a scale model of the periodic tower showed the amount of heat transfer due to evaporation to be less than four-tenths of one percent as compared to eighty percent for conventional wet towers. The cost per square foot of the periodic heat transfer is lower than for one conventional dry tower. Half of the total cost of a dry tower is heat transfer surface cost, thus this new design has the potential to significantly reduce the total cost of dry cooling towers. 9 refs. cited.
108) Plume Behavior and Potential Environmental Effects of Large Dry Cooling Towers Kearney, D. W.;Boyack, B. E. Gulf Gen. at Co., San Diego, CA ASME Winter Annu. Meet., Heat Transfer Div. Symp. Pap., Detroit, MI, Nov. 11-15, 1973, pp. 35-48. Pub!. by ASME, HTD, V. 6, New York, 1973.
The magnitude of the heat rejection of large modern power generating plants is so great that the problem of potential environmental effects due to dry cooling systems must be studied. The plumes from both natural-draft and mechanical-draft towers deSigned for IOOO-MW plants of several representative types are examined with respect to

COOLING TOWER LITERATURE 291
plume height and penetration of inversions. Based on the estimated plume behavior, numerical calculations on potential environmental impact are presented including effects such as cloud formation and precipitation, local winds and heating, fog dispersal, noise, aesthetics and land usage. It is found that no serious local environmental effects appear likely from large dry cooling towers. 23 refs. cited.
109) On the Minimum Size For Forced Draft Dry Cooling Towers for Power Generating Plants Johnson, B. M.; Dickinson, D. R. Battelle Mem. Inst., Richland, WA ASME Winter Annu. Meet., Heat Transfer Div. Symp. Pap., Detroit, MI, Nov. 11-15, 1973, pp. 25-34. Publ. by ASME, HTD, V. 6, New York, 1973.
A scaling law is derived relating the heat transfer and drag characteristics, frontal area, volume, surface area, power reqUirements, and performance for mechanical draft cooling towers and on air-cooled heat exchangers in general. Through a modified Reynolds analogy, connecting friction and heat transfer behavior, the power requirements and heat transfer performance are related. Size functions are developed, one of which is related to the frontal area of the heat exchanger and another to the total volume of the exchanger. Each of these has a unique minimum with respect to the air outlet temperature for particular values of the water outlet temperature, the entrance head loss, and relative friction and heat transfer characteristics of the exchanger surfiace. The influence of each parameter on the minimum frontal area and minimum size of the heat exchanger is determined. 6 refs. cited.
110) Design of Droplet Sampling Devices for Measurements in Cooling Towers Morton, V. M.; Foster, P. M. Cent. Electr. Res. Lab., Leatherhead, Surrey, England Atmos. Environ., V. 8, N. 4, April 1974, pp. 361-372.
The interpretation of measurements is discussed for the particular cases of collectors shaped like a circular cylinder, an aerofoil or a circular disc. It is shown through the trajectories of representative droplets that correction factors are needed to relate the numbers caught to the numbers present in the unobstructed flow. These factors are given in graphical form, and a practical application is discussed.
111) Some Water Droplet Measurements Inside Cooling Towers Martin, A.; Barber, F. R. Sci. Servo Dep., Nottingham, Ratcliffe-on-Soar, England Atmos. Environ., V. 8, N. 4, April 1974, pp. 325-336.
Drop size measurements were made on water sensitive papers exposed inside cooling towers at various levels. Results are given for samples taken under eliminators, over eliminators and high in towers. Design and operational factors which affect the values are discussed. Droplet removal efficiencies are given for conventional louvre eliminators and for louvre eliminators modified with plastic meshes.
292 COOLING TOWERS
112) Meteorology and Cooling Tower Operation Spurr, G. C.E.G.B. Headquarters, London, England Atmos. Environ., V. 8, N. 4, April 1974, pp. 321-324.
Climatic aspects were studied at several of the many cooling tower plants in the United Kingdom. The impact of their operation has been found to have a negligible effect on the local climate. A salt water tower plant was also operated for many years with negligible effects.
113) Research and Development Background to the Environmental Problems of Natural Draught Cooling Towers Gardner, B. R.; Lowe, H. J. Cent. Electr. Res. Lab., Leatherhead, Surrey, England Atmos. Environ., V. 8, N. 4, April 1974, pp. 313-320.
Significant droplet carry-over (drift) was detected at two new 2000 MW plants. More spray was found created in the larger installations and longer residence time in the larger towers increases droplet growth. However, the two recent occurrences were principally due to the use of eliminators which differed from the originally recommended designs in construction in one case, and in installation in the other.
114) Fans Key to Optimum Cooling-Tower Design Monroe, R. C. Hudson Prod. Corp., Houston, TX Oil Gas J., y. 72, N. 21, May 1974, pp. 52-56.
Questions most often asked of a fan engineer about axial-flow fans for today's wet cooling towers generally cover: performance; efficiency; corrosion resistance; and noise. This article reviews such fundamentals and gives new insight for optimum tower design.
115) Response of Hyperbolic Cooling Towers to Turbulent Wind Hashish, Mahmoud G.; Abu-Sitta, Salman H. Ain Shams Univ., Egypt ASCE J. Struct Div., V. 100, N. ST5, May 1974, Pap. 10542, pp. 1037-1051.
The paper outlines a general procedure for predicting the dynamic response, including resonance, of hyperbolic cooling towers to turbulent winds. Pressure spectra on the tower surface were measured in a boundary layer wind tunnel. Application to full-scale tower is examined. It is concluded that while the quasi-steady response increases with the wind velocity squared, the resonant response increases faster than wind velocity cubed. 10 refs. cited.
116) American Power Conference Proceedings, Volume 35, 1973 Ramsdell, Roger G. Jr.; Pinheiro, G.; Hays, T. C.; Krippene, B. C.; Clessuras, G. J.; McMackin, G. E.; Roma, Carlo; Mikol, W. W.; Yaworsky, Y. J.; Baker, J. M.; Dolhec, A. C.; Berman, P. A.; Giras, T. c.; Furlong, Dale A. Am. Power Conf. Proc., 35th Annu. Meet., Ill. Inst. of Techno!., Chicago, May 8-10, 1973. Available from lIT, Chicago, IL, 1973, 1268 p.
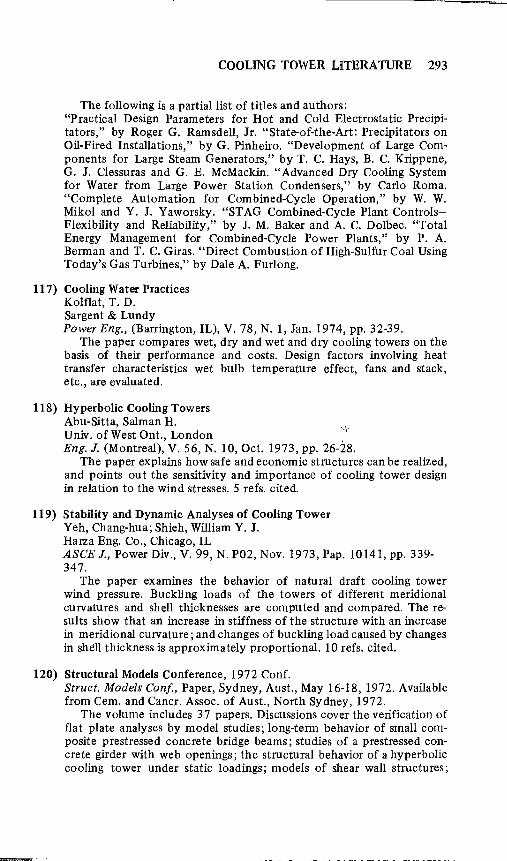
COOLING TOWER LITERATURE 293
The following is a partial list of titles and authors: "Practical Design Parameters for Hot and Cold Electrostatic Precipitators," by Roger G. Ramsdell, Jr. "State-of-the-Art: Precipitators on Oil-Fired Installations," by G. Pinheiro. "Development of Large Components for Large Steam Generators," by T. C. Hays, B. C. Krippene, G. J. Clessuras and G. E. McMackin. "Advanced Dry Cooling System for Water from Large Power Station Condensers," by Carlo Roma. "Complete Automation for Combined-Cycle Operation," by W. W. Mikol and Y. J. Yaworsky. "STAG Combined-Cycle Plant ControlsFlexibility and Reliability," by J. M. Baker and A. C. Dolbec. "Total Energy Management for Combined-Cycle Power Plants," by P. A. Berman and T. C. Giras. "Direct Combustion of High-Sulfur Coal Using Today's Gas Turbines," by Dale A. Furlong.
117) Cooling Water Practices Kolflat, T. D. Sargent & Lundy Power Eng., (Barrington, IL), V. 78, N. 1, Jan. 1974, pp. 32-39.
The paper compares wet, dry and wet and dry cooling towers on the basis of their performance and costs. Design factors involving heat transfer characteristics wet bulb temperature effect, fans and stack, etc., are evaluated.
118) Hyperbolic Cooling Towers Abu-Sitta, Salman H. Univ. of West Ont., London Eng. J. (Montreal), V. 56, N. 10, Oct. 1973, pp. 26-28.
The paper explains how safe and economic structures can be realized, and points out the sensitivity and importance of cooling tower design in relation to the wind stresses. 5 refs. cited.
119) Stability and Dynamic Analyses of Cooling Tower Yeh, Chang-hua; Shieh, William Y. J. Harza Eng. Co., Chicago, IL ASCE J., Power Div., V. 99, N. P02, Nov. 1973, Pap. 10141, pp. 339-347.
The paper examines the behavior of natural draft cooling tower wind pressure. BUckling loads of the towers of different meridional curvatures and shell thicknesses are computed and compared. The results show that an increase in stiffness of the structure with an increase in meridional curvature; and changes of buckling load caused by changes in shell thickness is approximately proportional. 10 refs. cited.
120) Structural Models Conference, 1972 Conf. Struct. Models Canf" Paper, Sydney, Aust., May 16-18, 1972. Available from Cern. and Cancr. Assoc. of Aust., North Sydney, 1972.
The volume includes 37 papers. Discussions cover the verification of flat plate analyses by model studies; long-term behavior of small composite prestressed concrete bridge beams; studies of a prestressed concrete girder with web openings; the structural behavior of a hyperbolic cooling tower under static loadings; models of shear wall structures;
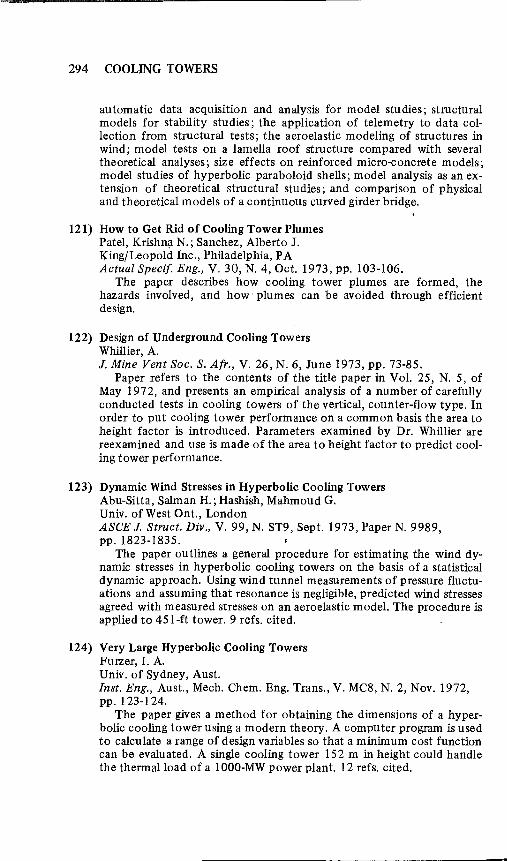
294 COOLING TOWERS
automatic data acquisition and analysis for model studies; structural models for stability studies; the application of telemetry to data collection from structural tests; the aeroelastic modeling of structures in wind; model tests on a lamella roof structure compared with several theoretical analyses; size effects on reinforced micro-concrete models; model studies of hyperbolic paraboloid shells; model analysis as an extension of theoretical structural studies; and comparison of physical and theoretical models of a continuous curved girder bridge.
121) How to Get Rid of Cooling Tower Plumes Patel, Krishn!l N.; Sanchez, Alberto J. King/Leopold Inc., Philadelphia, P A Actual Specif. Eng., V. 30, N. 4, Oct. 1973, pp. 103-106.
The paper describes how cooling tower plumes are formed, the hazards involved, and how' plumes can be avoided through efficient design.
122) Design of Underground Cooling Towers Whillier, A. J. Mine Vent Soc. S. Afr., V. 26, N. 6, June 1973, pp. 73-85.
Paper refers to the contents of the title paper in Vol. 25, N. 5, of May 1972, and presents an empirical analysis of a number of carefully conducted tests in cooling towers of the vertical, counter-flow type. In order to put cooling tower performance on a common basis the area to height factor is introduced. Parameters examined by Dr. Whillier are reexamined and use is made of the area to height factor to predict cooling tower performance.
123) Dynamic Wind Stresses in Hyperbolic Cooling Towers Abu-Sitta, Salman H.; Hashish, Mahmoud G. Univ. of West Ont., London ASCE J. Struct. Div., V. 99, N. ST9, Sept. 1973, Paper N. 9989, pp.1823-1835.
The paper outlines a general procedure for estimating the wind dynamic stresses in hyperbolic cooling towers on the basis of a statistical dynamic approach. Using wind tunnel measurements of pressure fluctuations and assuming that resonance is negligible, predicted wind stresses agreed with measured stresses on an aero elastic model. The procedure is applied to 45l-ft tower. 9 refs. cited.
124) Very Large Hyperbolic Cooling Towers Furzer, I. A. Univ. of Sydney, Aust. In st. Eng., Aust., Mech. Chern. Eng. Trans., V. MC8, N. 2, Nov. 1972, pp.123-l24.
The paper gives a method for obtaining the dimensions of a hyperbolic cooling tower using a modern theory. A computer program is used to calculate a range of design variables so that a minimum cost function can be evaluated. A single cooling tower 152m in height could handle the thermal load of a 1000-MW power plant. 12 refs. cited.
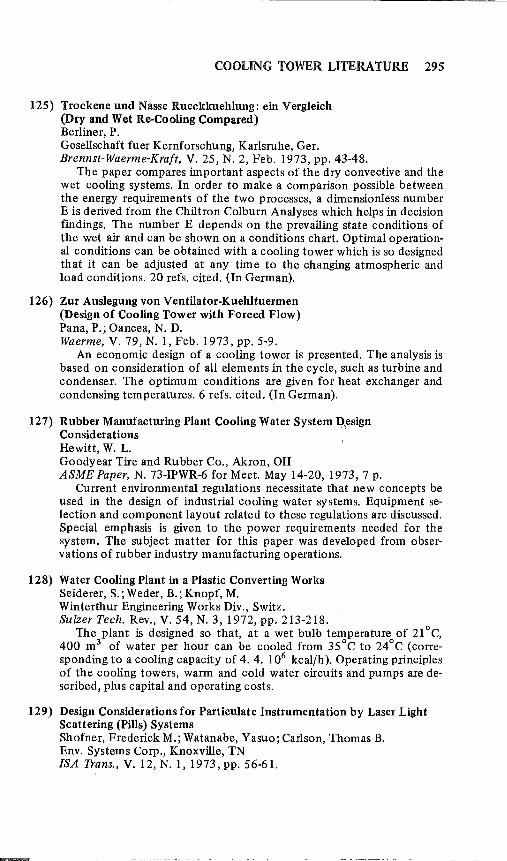
125)
126)
127)
128)
129)
COOLING TOWER LITERATURE 295
Trockene und Nasse Rueckkuehlung: ein Vergleich (Dry and Wet Re-Cooling Compared) Berliner, P. Gesellschaft fuer Kernforschung, Karlsruhe, Ger. Brennst-Waerme-Kraft, V. 25, N. 2, Feb. 1973, pp. 43-48.
The paper compares important aspects of the dry convective and the wet cooling systems. In order to make a comparison possible between the energy requirements of the two processes, a dimensionless number E is derived from the Chiltron Colburn Analyses which helps in decision findings. The number E depends on the prevailing state conditions of the wet air and can be shown on a conditions chart. Optimal operational conditions can be obtained with a cooling tower which is so designed that it can be adjusted at any time to the changing atmospheric and load conditions. 20 refs. cited. (In German).
Zur Auslegung von Ventilator-Kuehltuermen (Design of Cooling Tower with Forced Flow) Pana, P.; Oancea, N. D. Waerme, V. 79, N. 1, Feb. 1973, pp. 5-9.
An economic design of a cooling tower is presented. The analysis is based on consideration of all elements in the cycle, such as turbine and condenser. The optimum conditions are given for heat exchanger and condensing temperatures. 6 refs. cited. (In German).
Rubber Manufacturing Plant Cooling Water System D,esign Considerations " Hewitt, W. L. Goodyear Tire and Rubber Co., Akron, OH ASME Paper, N. 73-IPWR-6 for Meet. May 14-20, 1973, 7 p.
Current environmental regulation's necessitate that new concepts be used in the design of industrial cooling water systems. Equipment selection and component layout related to these regulations are discussed. Special emphasis is given to the power requirements needed for the system. The subject matter for this paper was developed from observations of rubber industry manufacturing operations.
Water Cooling Plant in a Plastic Converting Works Seiderer, S.; Weder, B.; Knopf, M. Winterthur Engineering Works Div., Switz. Sulzer Tech. Rev., V. 54, N. 3, 1972, pp. 213-218.
The plant is designed so that, at a wet bulb temperature of 21°C, 400 m3 of water per hour can be cooled from 35°C to 24°C (corresponding to a cooling capacity of 4. 4. 106 kcal/h). Operating principles of the cooling towers, warm and cold water circuits and pumps are described, plus capital and operating costs.
Design Considerations for Particulate Instrumentation by Laser Light Scattering (Pills) Systems Shofner, Frederick M.; Watanabe, Yasuo; Carlson, Thomas B. Env. Systems Corp., Knoxville, TN [SA Trans., V. 12, N. 1, 1973, pp. 56-61.
296 COOLING TOWERS
Basic electro-optical design and performance parameters are discussed for a laser light scattering system employing an external scattering volume and a pulsed junction diode laser. Experimental sensitivity, resolution, and calibration results are described. An exemplary particle size distribution for liquid droplets entrained in the efflux of and generated by breakup of the circulating water in a mechanical draft cooling tower is reported. 6 refs. cited.
130) How to Design Compact Mass Transfer Packing for Maximum Efficiency Egberongbe, S. A. Process Eng., Feb. 1973, pp. 82-83, 85.
This paper points out important criteria for an efficient mass transfer packing. Also described is a new PVC packing for use in water/air or water/gas applications such as'cooling towers. 4 refs. cited.
131) Ararat-A Computer Code for Thermal Design of Cooling Towers Mesarovic, Miodrag M. ENERGOPROJEKT, Belgrade, Yugoslavia Nucl. Eng. Des., V. 24, N. 1, Jan. 1973, pp. 57-70.
A computer program is pr'esented for thermal and hydraulic designs of cooling towers. Options are provided for evaluating cooling tower size and performance curves by applying a basic physical model of heat and mass transfer. The solution is conducted by multiple iteration. Iteration loops ine mutually inclusive in the model. Both film and sprayfilled cooling towers are considered with either induced or natural air circulation. Numerical solutions are presented for a number of natural draft cooling towers which serve present nuclear or conventional power plants. 8 refs. cited.
132) Shell Structures and Climatic Influences Mueller, R. K.;Mirza, S.;Doise, A. G.;Vellozzi, J. W.; Schnobrich, W. C.; Abel, J. F.; Billington, D. P.; Buchert, K. P.; Walser, A.; Gurfinkel, G.; Bandel, H.; Nash, W. A.; Simmonds, S. H.; Leonard, 1. W.; Lopez Palanco, R. Int. Assoc. for Shell Struct, lASS Calgary, Symp., Proc., Univ. of Calgary, Alta, July 3-6,1972,539 p. Available from P. G. Glockner lASS Cant Comm., Dep. Civ. Eng., Univ. of Calgary, Alta.
The following is a partial list of titles and authors of papers presented: "Some Questions in Connection with Unsolved Problems of the Investigation of Thermal Stresses by Means of Models," by R. K. Mueller. "Free Vibration of Shallow Spherical Sandwich Shells," by S. Mirza and A. G. Doise. "Brief Review of the American Standard Building Code Requirements for Minimum Design Wind Loads," by J. W. Vellozzi. "Seismic Analysis of Cooling Towers," by W. C. Schnobrich. "Stability Analysis of Cooling Towers: A Review of Current Methods," by J. F. Abel and D. P. Billington. "Preliminary Stability Analysis of Concrete Cooling Towers," by K. P. Buchert. "Structural Design of Hyperbolic Cooling Towers," by A. Walser and G. Gurfinkel. "Report for Session on Wind Effects," by H. Bandel: "Report for Session on Special Topics; Random Vibrations of Shallow Shells," by W. A. Nash. "Report

COOLING TOWER LITERATURE 297
for Session on Construction," by S. H. Simmonds. "Report for Session on Membrane Analysis and Inflatables; Inflatable Shells-A Review," by J. W. Leonard. "Report for Session on General Climatic Factors," by R. Lopez Palanco.
133) Einfluss der Ungleichfoermigkeit der Stroemung Auf die stoff-und Waermeuebertragungsverhaeltnisse in Kuehltuermen (Influence of Flow Nonuniformity on the Mass and Heat Transfer Conditions in Cooling Towers) Staudte, W. Lehrstuhl fuer Technische Thermodynamik und Waermeuebertragung, Luft Kaeltetech, V. 8, N: 6, Dec. 1972, pp. 315-318.
Based on locally nonuniform theoretical distribution of fluids in the range of the inserts it is shown, that not only the nonuniformity of the flow field of the cooling air, but also the nonuniformity of the water to be cooled have to be taken into account in evaluating experimental results and in design. 11 refs. cited. (In German).
134) Tour de Refroidissement a Sec Pour Centrale Thermique (Air-Cooled Cooling Tower for a Thermal Power Plant) Bodas, Janos Rev. Alum., N. 410, Sept. 1972, pp. 715-720.
A detailed description is provided of the design and operation of a Heller-type cooling tower that uses natural air as cooling medium. This design has been recently constructed in Soviet Armenia to serve as a 600-MW-thermal power plant. Attention is given to aluminum heat exchangers employed in the cooling columns of the tower. (In French).
135) Periodic Response of a Viscoelastic C.ooling Tower Lanshaar, H. L.; Boresi, A. P. Univ. of Illinois, Urbana Nucl. Eng. Des., V. 22, N. 1, 1972, pp. 75-94.
The periodic response of a linear viscoelastic cooling tower to a prescribed recurring sequence of pressure fluctuations and earth accelerations are analyzed. An approximate analysis, based on the bending theory of shells, is presented. The problem is reduced to a double sequence of boundary-value problems of linear ordinary differential equations. 19 refs. cited.
136) Methods of Calculation for Natural Draft Cooling Towers Keyes, R. E. Westin'ghouse Habford Co., Richland, WA AIChE Paper, N. 25, for Meet. Aug. 6-9, 1972,31 p.
The design of large natural draft cooling towers and analysis of their performance are complicated by the effects of variations in ambient air humidity. Often the effluent air from the tower is assumed to be at 100% relative humidity, to simplify calculations for design parameters. This study avoids the simplification, and proposes a procedure for determining the major design parameters for a natural draft tower. The theoretical and empirical relationships applicable to heat balance, heat transfer and transport, and tower draft and air resistance are given. 13 refs. cited.
298 COOLING TOWERS
137) Die Stufenschaltung bei der Kondensation in Luftgekuehlten Dampfkraftwerken (Multi-Stage Arrangement of Condensation in Air-Cooled Steam Power Stations) Kelp, F. Brennst-Waerme-Kraft, V. 24, N. 9, Sept. 1972, pp. 333-339.
In air-cooled power stations it becomes possible to reduce the cooling air quantity, compared with the usual one-stage design, by applying a multi-stage arrangement of the condensation, without incurring thermodynamic disadvantages. The savings in space obtained for the moving of the cooling air facilitate the application of the air cooling (in this case meaning' the dry-air cooling). This applies mainly to large unittype power stations as the multi-stage arrangement relates the conditions for optimization to a new thermodynamic starting basis. 16 refs. cited. (In German).
138) On the Minimum Size of Natural-Draft Dry Cooling Towers for Large Power Plants Moore, F. K. Cornell Univ., Ithaca, NY ASME Paper, N. 72-WA/HT-60 for Meet. Nov. 26-30, 1972, 11 p.
A simple scaling law is derived relating size, shape, drag coefficient and performance for natural-draft dry cooling towers. The tower is viewed as a gas/dynamic duct. The flow is analyzed by a perturbation theory for small temperature differences and flow Mach numbers. For a given drag, temperature performance, and duct area ratio, height is inversely proportional to the square of flow area. Adapting standard heatexchanger design relationships, and postulating a Reynold's number analogy connecting friction and heat transfer, drag and performance are related to each other. For the gas/dynamic scaling law a size function is developed which has a minimum at a particular air exit temperature, for a given water exit temperature. Technical requirements for minimum sizes are derived. 8 refs. cited.
139) Approaches to the Design of Hyperbolic Cooling Towers Against the Dynamic Action of Wind and Earthquake Isyumov, N.; Abu-Sitta, S. H.; Davenport, A. G. Univ. of Western Ontario, London Bull. Int. Assoc. Shell Spat. Struct., N. 48, March 1972, pp. 3-22.
Certain simplifications that allow the dynamic response to be reconciled with equivalent static loadings are examined. In earthquake loading the dominant effects are found to occur in the lowest mode for which no cross sectional distortion takes place. In wind loading the dynamic response is spread over several modes. The maximum dynamic tensile stresses at the windward base of the tower can be estimated using simple gust effect factors. 20 refs. cited.
140) The Design of Underground Cooling Towers. Whillier, A. Chamber of Mines of South Africa, Johannesburg J. Mine Vent. Soc. S. Afr., V. 25, N. 5, May 6, 1972, pp. 70-81; June, pp.85-94.
COOLING TOWER LITERATURE 299
Recommendations are provided for designing vertical cooling towers for use underground in mines. A method is given for predicting the entering and leaving water temperatures when a given amount of heat has to be dissipated. 4 refs. cited.
141) Design of Cross-Flow Cooling Towers and Ammonia Stripping Towers Wnek, Walter J.; Snow, Richard H. lIT Res. Inst., Chicago, IL Ind. Eng. Chern. Process Des. Dev., V. 11, N. 3, July 1972, pp. 343-349.
The paper presents a design method which avoids the numerical analysis previously required for cooling tower design. Approximate analytical solutions are obtained for the simultaneous equations of conservation of energy and mass. Results agree with examples from the literature obtained by a less general finite-difference method, and also with data from a pilot ammonia stripping tower. Equipment and operating cost correlations are presented. A method to optimize ammonia stripping tower design geometries is also presented. The design methods are applicable to other cross-flow stripping systems (for example, odor control). The possibility of using these towers for waste water treating is also explored. 19 refs. cited.
142) Analysis and Design of Hyperbolic Cooling Towers Gurfinkel, German; Walser, Adolf Univ. of Illinois, Urbana ASCE J. Power Div., V. 98, N. POI, June 1972, Pap:~8997, pp. 133-152.
The analysis and design of a hyperbolic cooling'tower for a nuclear power plant are reviewed. Analysis is performed using computer programs. Various loading conditions on the tower such as wind, earthquake, thermal, and self-weight, are considered and their effects are combined and compared. A number of wind-load distributions, used in Britain, Belgium, and the U.S., are taken for the analysis. Corresponding results are compared. 18 refs. cited.
143) Nonlinear Dynamic Analysis of Cooling Tower Yeh, Chang-hua Hana Engrs. Co., Chicago, IL ASCE J. Power Div., V. 98, N. POI, June 1972, Pap. 8983, pp. 49-63.
A finite element method is employed to study t1~e nonlinear dynamic effect of a strong wind gust on a cooling tower. Geometric nonlinearities associated with finite deformations of the structure are considered but the material is assumed to remain elastic. Load is applied in small increments and the equation of motion is solved by a step-by-step integration technique. It has been found that the cooling tower will collapse under a wind gust of maximum pressure 1.2 psi. 13 refs. cited.
144) Wet-Type Hyperbolic Cooling Towers Rogers, Paul Partner, Alfred A. Yee & Paul Rogers Inc., Los Angeles, CA Civ. Eng., (NY), V. 42, N. 5, May 1972, pp. 70-72.
The author describes key considerations in design. The hyperbolic shape is shown to be an advantageous structural solution.

300 COOLING TOWERS
145) power Plant Cycles for Dry Cooling Towers Leung, P.;Moore, R. E. Bechtel Corp., Los Angeles, CA ASCE J. Power Div., V. 97, N. P04, Dec. 1971, Pap. 8565, pp. 729-47.
Design considerations affecting turbine thermal cycles for steamelectric generating plants employing dry cooling towers are presented. Effects on major plant components, such as turbine exhaust end sizes, cycle parameters, and steam conditions, and the extent of feedwater heating within the regenerative cycle. Plant siting constraint considerations and general economic appraisals of fossil-fueled 11lld nuclearfueled cycles are summarized. 11 refs. cited.
146) Up Cooling Tower Capacity Without Adding New Cells Phelps, P. M. Phelps Engineering Co., Kentfield, CA Heat, Piping Air Cond., V. 43, N. 3, March 1971, pp. 82-4.
By combining narrow sections of thin wall, high performance packing in both crossflow and counterflow configurations tower performance can be upgraded. The design is also applicable to new cooling tower construction. On an economic basis it would be expected to have more potential in rebuilding and upgrading existing towers. Crossflow cooling sections are installed along the sides of the tower. A space is left below the crossflow packing, of sufficient height to pennit passage of a predetennined amount of ambient air to the inner portion of the tower, which is filled with counterflow packing.
; ~,
147) Cooling Towers with Turbine Drive of the Blower Berliner, P. HeizungLueftung-Haustech, V. 21, N. 6, June 1970, pp. 196-201.
The paper covers the design of cooling towers which have two fluid flow engines. One is a turbine and the other an axial fan that operates with one mutual shaft. The turbine takes advantage of the pressure gradient, which will be utilized with the application of spray nozzles for a regular spraying of the cooling water. Method of designing such cooling towers and the selection of reasonable operation areas is defined. (In Gennan).
148) Rugeley Dry Cooling Tower System Christopher, P. J.; Forster, V. T. English Electric Co., Ltd., Willans Works, Rugby, England [nst. Mech. Eng. Proc. (Part 1) Gen. Proc., V. 184, N. 11, 1969-0, pp. 197-221.
Studies showed that a new cooling system provided the most economic and practical solution for large steam turbines. The design uses the atmosphere as a heat sink for the turbine exhaust heat by a combination of a jet condenser, closed water circuit, heat exchangers cooled by air, and cooling tower. Although there is a water circuit to be filled initially, no further water is needed. This dry cooling tower system was first applied to a 120 MW turbine at the Rugeley Power Station. It was
COOLING TOWER LITERATURE 301
designed to dissipate nearly 600 million Btu of heat/hr, to produce a turbine exhaust vacuum of 28.7 in. of mercury when the turbine was in full load conditions to operate under all conditions of weather and turbine load, and to meet the normal requirements of availability and durability. The plant at Rugeley saves between 1.5 and 1.8 million gal. of water a day when compared with an equivalent 'wet' tower where makeup water is approximately 2% of circulating flow rate. The cooling tower system and its performance in service are described in some detail.
149) Free Vibration of Hyperbolic Cooling Towers Hashish, M. G.; Abu-Sitta, S. H. Univ. of Western Ontario, London ASCE J. Eng. Mech. Div., V. 97, N. EM2, April 1971, Pap. 8037, pp. 253-69.
The paper presents a modified finite difference technique for determining the natural frequencies and mode shapes of hyperbolic cooling tower shells. The influences of the meridional curvature and the boundary conditions on the vibration characteristics of the tower are investigated. In all cases, changes in frequency are found to be essentially due to changes in membrane energy. The paper shows that, for a fixed- free shell, the increased meridional curvature leads to an increase in the natural frequency. The lack of axial restraint results in a large reduction in the membrane energy. 12 refs. cited.
, .. \" 150) Reduction of Blowdown from Power Plant Cooling Tower Systems
Christiansen, P. B. Southern California Edison Co., Los Angeles, CA AIChE Workshop, Ind. Process Des Water Pollut. Contr., V. 2, Houston, TX, April 24-25,1969, pp. 85-8. .
Given are two examples which show different methods that are used to reduce the quantities of waste water from cooling tower operation. In one case, the treatment technique of an existing facility was modified to reduce waste water production. In the order case, a new plant design included facilities for the minimization of the requirements for waste water disposal.
151) Design of Cooling Towers Circulating Brackish Waters Deflon, J. G. Marley Co., San Gabriel, CA AIChE Workshop, Ind. Process Des Water Pollut. Contr., V. 2, Houston, TX, April 24-25, 1969, pp. 69-73.
Maintenance and costs of cooling towers circulating brackish water is naturally of considerable concern. Inadequate consideration of materials of construction and disregard of the simple rudiments of water control can be expensive. If the above suggestions for designing and operating such a unit are taken into consideration, maintenance should be little more than that of a standard tower employing fresh water makeup.
'"'
302
152)
153)
154)
COOLING TOWERS
Cooling Tower Fog: Control and Abatement Veldhuizen, H.; Ledbetter, J. International Nickel Co. of Canada, Ltd., Sudbury, Onto J. Air Pollut. Contr. Ass., V. 21, N. 1, Jan. 1971, pp. 21-4.
Fogs from cooling towers are causing an increasing number of visibility problems as well as icing of roads, sidewalks, and powerlines, during freezing weather. The paper summarizes a study aimed at ascertaining the best method of fog control at a refinery in Houston, Texas. The induced draft, counterflow cooling towers of concern have design capacities of 750 X 106 Btu/hr and 225 X 106 Btu/hr under local climatic conditions. Several methods of alleviating restricted visibility were considered and cost estimates were made for the most promising methods. 21 refs. cited.
System Costs Say Optimize Cooling Nicoli, L. G.; Jaske, R. T.; Witt, P. A. Battelle-Northwest, Richland, WA Hydrocarbon Process, V. 49, N. 10, Oct. Sec. 1 1970, pp. 97-100.
The increasing cost of heat rejection is aggravated by tougher competition for air and water use and more rigid controls. Imaginative design is needed to curb such costs: New technology and the computer can optimize plant systems. This paper reviews present day cooling tower technology.
Cooling Towers Supported on Columns Univ. of Western Ontario, London ASCE J. Struct. Div., V. 96, N. STl2, Dec. 1970, Pap. 7753, pp. 2575-88.
The paper discusses stresses due to the individual effects of forces, moments and deformations at the base of hyperboloidal cooling towers. With the assumption that the column- spacing is sufficiently small to permit taking an average stiffness per unit length, forces and moments in a loaded cooling tower, supported on columns, are calculated for different column stiffnesses and different load distributions in the circumferential direction. The paper indicates that all base displacements have finite values, membrane (not bending) stiffness of the column is important, and column effect is noticeable when bending moments are significant. 7 refs. cited.
155) Analysis of Hyperboloids of Revolution Krishna, Reddy, G. V. PSG ColI. of Technol., Coimbatore, India Indian Caner. J., V. 44, N. 3, March 1970, pp. 123-5.
The equilibrium equations of a hyperboloid of revolution used for cooling towers derived by using membrane theory under an arbitrary static normal load are reduced to a single partial differential equation with constant coefficients. The problem of finding displacements is reduced to a similar type of equation so that the solution for this problem becomes straightforward. 11 refs. cited.
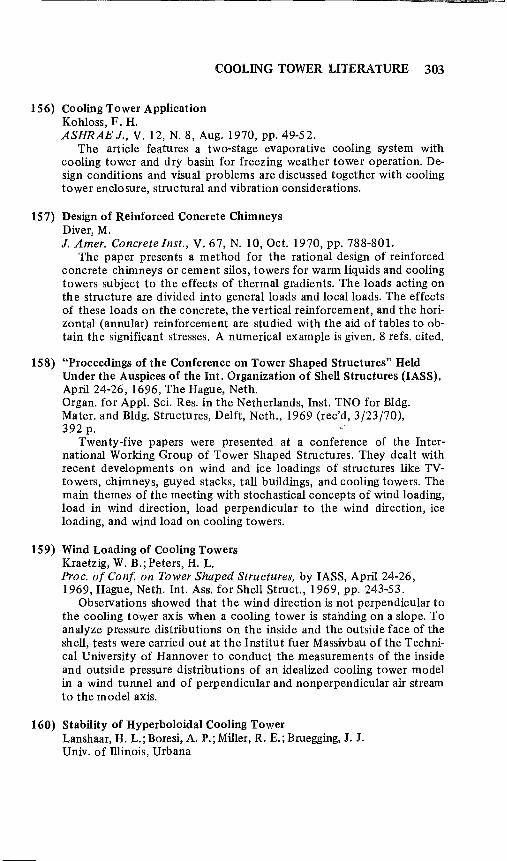
156) Cooling Tower Application Kohloss, F. H.
COOLING TOWER LITERATURE 303
ASHRAE J., V. 12, N. 8, Aug. 1970, pp. 49-52. The article features a two-stage evaporative cooling system with
cooling tower and dry basin for freezing weather tower operation. Design conditions and visual problems are discussed together with cooling tower enclosure, structural and vibration considerations.
157) Design of Reinforced Concrete Chimneys Diver, M. J. Amer. Concrete [nst., V. 67, N. 10, Oct. 1970, pp. 788-801.
The paper presents a method for the rational design of reinforced concrete chimneys or cement silos, towers for warm liquids and cooling towers subject to the effects of thermal gradients. The loads acting on the structure are divided into general loads and local loads. The effects of these loads on the concrete, the vertical reinforcement, and the horizontal (annular) reinforcement are studied with the aid of tables to obtain the significant stresses. A numerical example is given. 8 refs. cited.
158) "Proceedings of the Conference on Tower Shaped Structures" Held Under the Auspices of the Int. Organization of Shell Structures (lASS), April 24-26,1696, The Hague, Neth. Organ. for Appl. Sci. Res. in the Netherlands, Inst. TNO for Bldg. Mater. and Bldg. Structures, Delft, Neth., 1969 (rec'd, 3/23/70), 392 p. "
Twenty-five papers were presented at a conference of the International Working Group of Tower Shaped Structures. They dealt with recent developments on wind and ice loadings of structures like TVtowers, chimneys, guyed stacks, tall buildings, and cooling towers. The main themes of the meeting with stochastical concepts of wind loading, load in wind direction, load perpendicular to the wind direction, ice loading, and wind load on cooling towers.
159) Wind Loading of Cooling Towers Kraetzig, W. B.; Peters, H. L. Proc. of Conf. on Tower Shaped Structures, by lASS, April 24-26, 1969, Hague, Neth. Int. Ass. for Shell Struct., 1969, pp. 243-53.
Observations showed that the wind direction is not perpendicular to the cooling tower axis when a cooling tower is standing on a slope. To analyze pressure distributions on the inside and the outside face of the shell, tests were carried out at the Institut fuer Massivbau of the Technical University of Hannover to conduct the measurements of the inside and outside pressure distributions of an idealized cooling tower model in a wind tunnel and of perpendicular and nonperpendicular air stream to the model axis.
160) Stability of Hyperboloidal Cooling Tower Lanshaar, H. L.; Boresi, A. P.; Miller, R. E.; Bruegging, J. J. Univ. of Illinois, Urbana
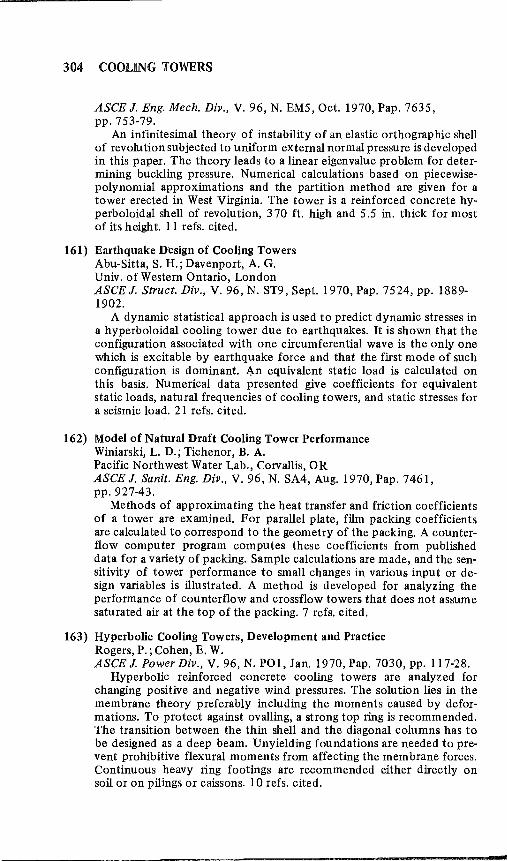
304 COOLING TOWERS
ASCE J. Eng. Mech. Div., V. 96, N. EM5, Oct. 1970, Pap. 7635, pp.753-79.
An infinitesimal theory of instability of an elastic orthographic shell of revolu tion subjected to uniform external normal pressure is developed in this paper. The theory leads to a linear eigenvalue problem for determining buckling pressure. Numerical calculations based on piecewisepolynomial approximations and the partition method are given for a tower erected in West Virginia. The tower is a reinforced concrete hyperboloidal shell of revolution, 370 ft. high and 5.5 in. thick for most of its height. 11 refs. cited.
161) Earthquake Design of Cooling Towers Abu-Sitta, S. H.; Davenport, A. G. Univ. of Western Ontario, London ASCE J. Struct. Div., V. 96, N. ST9, Sept. 1970, Pap. 7524, pp. 1889-1902.
A dynamic statistical approach is used to predict dynamic stresses in a hyperboloidal cooling tower due to earthquakes. It is shown that the configuration associated with one circumferential wave is the only one which is excitable by earthquake force and that the first mode of such configuration is dominant. ~n equivalent static load is calculated on this basis. Numerical data presented give coefficients for equivalent static loads, natural frequencies of cooling towers, and static stresses for a seismic load. 21 refs. cited.
162) Model of Natural Draft Cooling Tower Performance Winiarski, L. D.; Tichenor, B. A. Pacific Northwest Water Lab., Corvallis, OR ASCE J. Sanit. Eng. Div., V. 96, N. SA4, Aug. 1970, Pap. 7461, pp.927-43.
Methods of approximating the heat transfer and friction coefficients of a tower are examined. For parallel plate, film packing coefficients are calculated to ,correspond to the geometry of the packing. A counterflow computer program computes these coefficients from published data for a variety of packing. Sample calculations are made, and the sensitivity of tower performance to small changes in various input or design variables is illustrated. A method is developed for analyzing the performance of counterflow and crossflow towers that does not assume saturated air at the top of the packing. 7 refs. cited.
163) Hyperbolic Cooling Towers, Development and Practice Rogers, P.; Cohen, E. W. ASCE 1. Power Div., V. 96, N. POI, Jan. 1970, Pap. 7030, pp. 117-28.
Hyperbolic reinforced concrete cooling towers are analyzed for changing positive and negative wind pressures. The solution lies in the membrane theory preferably including the moments caused by deformations. To protect against ovalling, a strong top ring is recommended. The transition between the thin shell and the diagonal columns has to be designed as a deep beam. Unyielding foundations are needed to prevent prohibitive flexural moments from affecting the membrane forces. Continuous heavy ring footings are recommended either directly on soil or on pilings or caissons. 10 refs. cited.
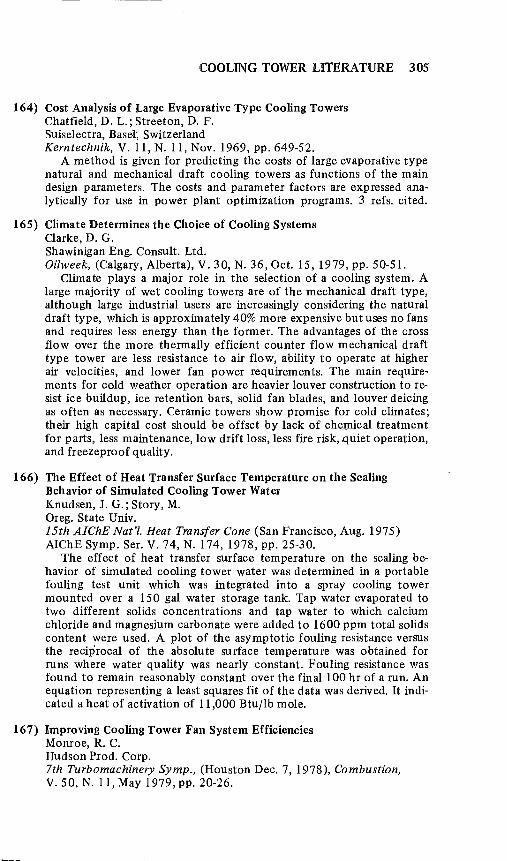
164)
165)
166)
167)
COOLING TOWER LITERATURE 305
Cost Analysis of Large Evaporative Type Cooling Towers Chatfield, D. L.; Street on, D. F. Suiselectra, Basel', Switzerland Kerntechnik, V. 11, N. 11, Nov. 1969, pp. 649-52.
A method is given for predicting the costs of large evaporative type natural and mechanical draft cooling towers as functions of the main design parameters. The costs and parameter factors are expressed analytically for use in power plant optimization programs. 3 refs. cited.
Climate Determines the Choice of Cooling Systems Oarke, D. G. Shawinigan Eng. Consult. Ltd. Oilweek, (Calgary, Alberta), V. 30, N. 36, Oct. 15, 1979, pp. 50-51.
Climate plays a major role in the selection of a cooling system. A large majority of wet cooling towers are of the mechanical draft type, although large industrial users are increasingly considering the natural draft type, which is approximately 40% more expensive but uses no fans and requires less energy than the former. The advantages of the cross flow over the more thermally efficient counter flow mechanical draft type tower are less resistance to air flow, ability to operate at higher air velocities, and lower fan power requirements. The main requirements for cold weather operation are heavier louver construction to resist ice buildup, ice retention bars, solid fan blades, and louver deicing as often as necessary. Ceramic towers show promise for cold climates; their high capital cost should be offset by lack of cheJ,Ilical treatment for parts, less maintenance, low drift loss, less fire risk, ,quiet operation, and freezeproof quality.
The Effect of Heat Transfer Surface Temperature on the Scaling Behavior of Simulated Cooling Tower Water Knudsen, J. G.; Story, M. Oreg. State Univ. 15th AIChE Nat'l. Heat Transfer Cone (San Francisco, Aug. 1975) AIChE Symp. Ser. V. 74, N. 174, 1978, pp. 25-30.
The effect of heat transfer surface temperature on the scaling behavior of simulated cooling tower water was determined in a portable fouling test unit which was integrated into a spray cooling tower mounted over a 150 gal water storage tank. Tap water evaporated to two different solids concentrations and tap water to which calcium chloride and magnesium carbonate were added to 1600 ppm total solids content were used. A plot of the asymptotic fouling resistance versus the reciprocal of the absolute surface temperature was obtained for runs where water quality was nearly constant. FOUling resistance was found to remain reasonably constant over the final 100 hr of a run. An equation representing a least squares fit of the data was derived. It indicated a heat of activation of 11,000 Btu/lb mole.
Improving Cooling Tower Fan System Efficiencies Monroe, R. C. Hudson Prod. Corp. 7th Turbomachinery Symp., (Houston Dec. 7, 1978), Combustion, V. 50, N. 11, May 1979, pp. 20-26.

306 COOLING TOWERS
A discussion of fan systems used in dry and wet cooling towers covers their general design, system efficiency, system losses due to design of the fan and its housing and to unwanted air movements, and a series of full-scale fan tests which demonstrated the contributions of various components to fan system efficiency.
168) Double Circuit Means Savings for Cooling Towers Bollain, J. A.; Yaninter, S. A. Yaninter S. A. Process Eng., (London), June 1978, pp. 100-1, 103.
A new technique for operating closed-circuit cooling systems to avoid the use of contaminated water is presented. The conventional tower packing is retained as a first stage, and the cooled recirculating water then flows around a tubular bundle located in the tank reservoir. In this double-circuit cooling· tower, the transfer of heat to air is carried out by the tower plastic core, which permits the use of large heatexchange surfaces at low cost. The double-circuit tower is compact and economical. It has the lowest energy consumption of the closed-circuit cooling processes. Procedures for calculating the appropriate values for the design variables are explained, and a numerical example is given.
169) Dry Cooling Towers That Match the Efficiency of Wet Ones Maschinenfabrik-Augsburg Nuernberg A. Chern. Eng., (New York), V. 85, N. 10, April 24, 1978, pp. 35-36.
Dry coolillg towers that match the efficiency of wet ones have been developed by Maschinenfabrik Augsburg-Nuernberg A. G. (M.A.N.), which is building a pilot plant to test its LRT design on one of its own power plants. M.A.N. expects the new technology to reach commercial stage in three to five years. They plan to license the know-how, but will not build LRT units. The design concept reverses the conventional configuration in dry coolings. Under the new scheme, air flows through heat-exchanger tubes while steam from the turbine (direct cooling) or cooling water (indirect cooling) flows through 1-3 mm spaces between the tubes, thus enabling efficiency to reach that of a wet-cooled plant. Normally, dry coolers cause a 3% decrease in power-generation capability. The design may also be used to reduce the height of conventional dry-cooled towers by up to 67%, at the expense of some efficiency.
170) The Effect of Condensation Upon Transfer Rates with Application to Flue-Gas Washing Plants and Cooling Towers Bettelheim, J.;Foster,P. M.;Kyte, W. S. Cent. Electr. Res. Lab. Trans. [nst. Chern. Eng., V. 58, N. 1, Jan. 1980, pp. 3-8.
The effect of condensation upon transfer rates with application to flue-gas washing plants and cooling towers are discussed. Theoretical models were developed for determining the rate of heat and mass transfer under conditions where fog formation prevails. Derived relationships are functions of the vapor and liquid equilibria and local heat and mass transfer of driving forces. They were used for a numerical study of the amount of fog formation as a function of the operational variables of a flue-gas washing plant in which the inlet gas temperature is typically

COOLING TOWER LITERATURE 307
150°C with a water content of 0.075 kg/kg. Although heat and mass transfer rates were relatively insensitive to the choice of the model, the amount of fog formation was not. The models neglect the effects of condensation within the boundary layer, thus underestimating fog formation by a factor of up to three. The amount of fog formed in flue-gas washing plants increased up to a maximum value with decreasing feedwater temperature over a narrow band of liquid-to-gas ratios.
171) A Computer Model of Cooling Tower Water Systems Noblett, J. G.; Wilde, K. A.; Micheletti, W. C. Electric Power Research Institute Radian Corp. 72nd AIChE Annu. Meet., (San Francisco), Nov. 25-29, 1979, Prepr. N. 47E, 17 p.
A computer model of cooling towers was developed under a research project sponsored by the Electric Power Research Institute. The twopart computer model consists of an equilibrium model, which is a general, multicomponent aqueous ionic equilibrium program, for describing the major inorganic chemical reactions within cooling tower systems, and a process model to perform the engineering calculations needed to describe the unit operations within the cooling tower system. The use of the computer program is illustrated for a system with sidestream softening to control dissolved calcium levels and acid addition to control calcium carbonate scale potential and with blowdown removed before the condenser. ,,',
172) Chromate versus Non-Chrome Treatment of Refinery Cooling Tower Effluents Tanis, J. N.; Keys, c.; Drew Chemical Corp.; Placid Refining Co. Drew Chem. Corp. Nat7. Pet. Refiners Assoc. Annu. Meet., (San Antonio, TX), Pap. N. AM-79-40, Mar. 25-27,1979,19 p.
Zinc chromate treatment of cooling water circulating at 2700 gpm at Placid Refining Co.'s 36,000 bbl/day refinery was replaced by treatment with 150 ppm of Drew Chemi,cal Corp.'s organic corrosion inhibitor because of current expansion projects involving a 20,000 bbl/day vacuum unit, a 40,000 gpm cooling water demand, and a maximum allowable chromate discharge of 1.6 Ib/day. Calcium hypochlorite was replaced by gaseous chlorination for microbiological control. Corrosion rates for mild steel under the treatment have been 2-4 mils/yr. An attempt, to treat the cooling water with an inorganic polyphosphate produced considerable fouling due to the local makeup water qUality. A comparison of traditional zinc-chromate technology combined with various chromium removal systems showed that the program was more economical.
173) A New (Colorimetric) Method for the Determination of Phosphonates in Boiler and Cooling Tower Waters Sloat, S. S.; Buck, M. Hach Chem. Co. Combustion, V. 51, N. 2, Aug. 1979, pp. 10-13.
308 COOLING TOWERS
A new method for determining phosphonates in boiler and cooling tower waters was presented at the 39th International Water Conference (1978) involving chelation of the phosphonate with iron, removal of excess iron and other metal ions, and addition of a strong reducing agent and 1, lO-phenanthrolin indicator. Concentration ranges available are 0-15 mg/l for aminotri (methylene phosphonic acid) with 1% error for field determinations and 0-3 mg/l with 2% error for laboratory determinations; 0-7 mg/l for hydroxy ethylene diphosphonic acid with 2% error; 0-16 mg/l ethylenediamine tetra (methylene phosphonic acid) with 3% error; and 0-15 mg/l of diethylenetriamine penta (methylene phosphonic acid) with 2% error. The method requires no boiling and works in the' presence of chomate, zinc, triazole, and most other substances found in boiler and cooling water. Substances which chelate iron will, however, interfere.
174) Protecting Cooling Towers from Overpressure Veazy, 1. A. Monsanto Agricultural Products Co. Chern. Eng. Prog., V. 75, N. 7, July 1979, pp. 73-77. (In English).
The installation of a vent on the top of a riser prevented damage to the cooling tower in Monsal1to Agricultural Products Co.'s Luling, LA, ammonia plant when an exchanger tube failed and high-pressure synthesis gas entered the return water header. The vent had been installed to provide further protection after a rupture disk on the exchanger had failed to blow during a previous accident. The earlier accident, on October 31, 1977, at this 1040 ton/day plant occurred when the incursion of high-pressure gas caused a water hammer that ruptured the distribution header in the tower. The planned safety systems did not prevent the large pressure surge or restrain the 3 m section of 61 cm dia header, which would have fallen except for the fortuitous presence of a vertical run of electrical conduit anchored to the west end of the tower.
175) A (Column) Internal for the Mist-Free Operation of Wet (Cross Flow) Cooling Towers Haellgren, K.; Schultz, M.; Harting, P. E. Brennst.-Waerme-Kraft, V. 30, N. 2, Feb. 1978, pp. 71-73.
A (column) internal for the mist-free operation of a wet cross flow cooling tower is described in this paper. The design is based on a Munter cross structure design and whose entire heat-exchange area can be used for straight wet operation at higher outdoor temperatures and which can be converted to combined wet-dry operation (both dry and evaporative cooling) to prevent the occurrence of a vapor plume at low outside temperatures. (In German).
176) The Reuse of Biologically Treated Wastewater as Cooling Tower Makeup Wykowski, J. C.; Delaunay, J.; Franco, R. J. Exxon Research & Engineering Co. Esso S.A.F. Esso Eng. (Eur.) Ltd. Nat'l. Assoc. Carras. Eng., 'Corros./78' Meet., (Houston, TX), Pap. N.80,March6-1O, 1978, 13 p.

COOLING TOWER LITERATURE 309
The reuse of biologically treated wastewater as cooling tower makeup was investigated by Esso S.A.F. and Exxon Research / Engineering Co. in a pilot plant at the Fog, Fr., refinery by measuring corrosion rates, heat transfer, and biological growth. Heat exchanger tube deposits at the end of each test were analyzed. Test facilities included a cooling tower/heat exchanger circuit fed with ammonia-containing wastewater pretreated via bacterial degradation of soluble organics. Only a zincchromate-phosphate corrosion inhibitor gave good general corrosion protection of carbon steel when added to the cooling water. Satisfactory biological control, giving a bacteria count of 50,000/ml or less, was achieved by shock chlorination with 30-50 mg/l of hypochlorite every other day with a chromate inhibitor. In another test, isothiazoline was effective in keeping bacteria counts under 50,000/ml for 24 hrs after its addition. With the zinc chromate phosphate inhibitor and good biological control, heat transfer rates were high and fairly constant. The major constituent of the deposits was iron. The seven-tube heat exchanger provided a good correlation between on-line data and heat exchanger tube analyses. Removal of 60-70% of the suspended solids and the more successful treatments met the makeup water criteria of less than 40 mg/l COD, 15 mg/l BOD, and under 40 mg/l of ammonia. Suspended solids in the biologically treated wastewater should be reduced to less than 10 mg/l.
177) Performance Predicted for Cooling Tower Calgon Corp. Oil Gas J., V. 77, N. 7,139, Feb. 12, 1979.
The paper provides an overall cooling system model called Dnimod. The model is applied to present and future cooling system requirements, and eliminates plant trials of treatment chemicals. At a midwest refinery petrochemical plant, oil leaks, tne use of four alternating water sources, and entrained solids were causing heat transfer losses and unscheduled shutdowns. In less than an hour, the model identified the best of the available water sources and blends, and recommended a treatment program for use before each water change. This enabled the refinery to increase heat transfer by 20%, eliminate unscheduled shutdowns, and with treatment, use the plant wastewater safely for all cooling water makeup.
178) A Study of a Fluidized Turbulent Bed Contactor with Application to Cooling Towers Purdue Dniv., Diss. (1977), 279 p. (In English). (Abstr.) Diss. Abstr. Int., V. 38, N. 10, Apr. 1978, pp. 4911B-4912B.
A study of a fluidized turbulent bed contact or with application to cooling towers was conducted to maximize cooling performance. Eleven fill materials were tested for fluidization, and seven were evaluated in cooling tests. Tower characteristic and power ratio were used as performance indexes. Small, large-density polypropylene spheres save large tower characteristic values, however, very low-density polystyrene foam was best with regard to input power cost. A moderate-density polypropylene sphere was the optimum fill. Column pressure drop was an important factor since conventional cooling towers operate at nearly negligible pressure drop. Liquid and gas flow rates, static film depth, and fill

310 COOLING TOWERS
bulk density were major determinants of pressure drop. Very low-density fill suffered from hydrodynamic and fluidization anomalies, and highdensity fill save excessive pressure drop. Spherical particles fluidized best, giving uniform operation. Staging the fill-in layers gave slight hydrodynamic advantages but no improvement in cooling performance.
179) An Innovative Approach to Controlling Salt-Water Cooling Tower System Problems Lendvai-Lintner, E.; Franco, R. J.; Beecher, J. S. Exxon Res. & Eng. Co. Drew Chern. Corp. Natl. Assoc. Carras Eng. 'Corros/78' Meet., (Houston Mar. 6-10, 1978), Pap. N. 85, 16 p.
To overcome severe corrosion and fouling problems faced after conversion of the once-through cooling water system at the Exxon Chemical Co.'s Bayway, NJ, plant to a cooling tower recirculating system, exhaustive studies were made by Drew Chemical Corp. to determine an optimum chemical treatment program. Field implementation of the program reduced carbon steel corrosion significantly, with 40-60% of the heat exchangers presently chemically cleaned on a semiannual
. basis. A complex combination of chemicals was developed, including polyphosphate, phosphonate· and zinc chloride (anticorrosion), iron chelating and dispersins age~ts (rems>val of iron oxide foulant), anionic polymer dispersants and nonionic polymer surfactants (preventing microbiological and sediment fouling), sodium hypochlorite (a general biocide), and a proprietary organosulfur-based biocide (destroying SUlfate-reducing bacteria). To reduce mechanical problems due to automatic chemicals injection some improvements are now being implemented which could raise equipment service factors ~reat1y.
180) Dynamics of a Vaporizing a (10-50 (mu) Water) Droplet in Laminar Entry Region of a Straight Channel (with Isothermal Walls, as in a Dry Cooling Tower) Bhatti, M_ S. Owens-Corning Fiberglas Corp. ASME-AIChE Heat Transfer Cant, (Aug. 15-17, 1977) (Abstr.) Mech. Eng. N. 77-HT-40, V. 99, N. 10, Oct. 1977, pp. 100-7.
181) Effect of Alkalinity on the Scaling of Simulated Cooling Tower Water Morse, R. W.; Knudsen, J. G. Oreg. State Univ. Can. J. Chem. Eng., V. 55, N. 3, June 1977, pp. 272-78.
182) Corrosion in Cooling Towers Carter Industrial Products Ltd. Carras. Prevo Control, V. 24, N. 4, Aug. 1977, p. 30.
183) (An Analysis of the) Energy Balance and Transfer in Wet Cooling Towers Klenke, W. Brennst-Waerme-Kraft, V. 29, N. 5, May 1977, pp. 198-206. (In German).
COOLING TOWER LITERATURE 311
184) (Petrosar Ltd. Will Use Reinforced Plastic Mortar (RPM) Pipe in a Cooling Tower) Petrosar Ltd. Can. Pet., V. 18, N. 3, May 1977, p. 11.
185) (An Experimental Study of the) Effect of Wind-Tunnel Walls on the Flow Past Circular Cylinders and Cooling Tower Models Guven, 0.; Farell, C.; Carrasque1, S.; Patel, V. C. Lab Nac Hidraulica Caracas Univ. Iowa ASME Winter Annu. Meet., (New York, Dec. 5-10, 1976), Pap. N. 76-WA/FE-20,Mech. Eng., V. 99, N. 2, Feb. 1977, pp. 130-38.
186) Steeling Cooling Towers Give Wood the Cold Shoulder Wigley, S. Process Eng., (London), Feb. 1977, pp. 45-46.
187) Cooling Tower Service
188)
189)
Carter Industrial Products Ltd.; Millington P. Carter Ind. Prod. Ltd. Processing, (London), V. 23, N. 1, Jan. 1977, p. 21.
Offsite Facilities/How to Prevent Cooling Tower Fog Campbell, J. C. Lilie Hoffman Cooling Towers Inc. Cooling Tower Inst. Meet., (Houston, Jan. 19-21,1976), Hydrocarbon Process, V. 55, N. 12, Dec. 1976, pp. 97-100.
Offsite Facilities/Cooling Tower Estimates Made Easy Uchiyama, T. . Toyo Eng. Corp. Hydrocarbon Process, V. 55, N. 12, Dec. 1976, pp. 93-96.
190) (Computer Models for an Economic) Analysis of Different Types of Dry-Wet Cooling Towers Cheng, M. S. Univ. Iowa fliss., (1976), 189 p. (Abstr.), Diss. Abstr. Int. B, V. 37, N.4,Nov. 1976,p. 2433B.
191) Sodium Molybdate as a Corrosion Inhibitor in Cooling Tower Water Robitaille, D. R. Climax MolybdenUm Co., MI Natl. Assoc. Corros. Eng. 'Corros/76' Meet. (Houston, Mar. 22-26, 1976) Mater Performance, V. IS, N. 11, Nov. 1976, pp. 40-44. (In English).
192) Cooling Tower Air Humidification for Makeup and Blowdown Reduction Phelps, P. M. Phelps Eng. Co. 3rd AIChE-EPA Natl., 'Complete Water Reuse' Conf. (Cinci. June 27-30,1976), Proc., 1976, pp. 391-94.

312 COOLING TOWERS
193) Water Cooling Tower Technology ... The Air/Water/Heat Rejection Machine Burger, R. Robert BUrger Assoc. Inc. 3rd AIChE-EPA Natl., 'Complete Water Reuse' Conf., (Cinci., June 27-30,1976), Proc., 1976, pp. 380-90.
194) RO (Reverse Osmosis) Treatment of Powerplant Cooling Tower Blowdown for Reuse Fang, H. H. P.; Chian, E. S. K. Univ. Ill, Urbana AIChE Natl. 'Meet., (1974), AIChE Symp. Ser. V. 71, N. lSI, 1975, pp.82-86.
195) Calculation and Measurement of Heat and Mass Transfer in Cooling Towers Kast, W., Quast, U. Tech Hochsch Darmstadt VDI~ VC Heat & Mass Transfer Comm. Meet., (Schliersee Apr. 5-6, 1976) (Ger Abstr), Chem-Ing-Tech, V. 48, N. 9, Sept. 1976, pp. 821-25.
196) Energy Optimization of Cooling Tower Blowdown Recovery Ahlgren, R. M. Aqua Chern. Inc. 2nd AIChE-EPA Natl. 'Complete Water Reuse' Conf., (Chic. May 4-8, 1975), Proe., 1975, pp. 515-19.
197) Cooling Tower Operations with Air/Water Interface and Energy Considera tions Burger, R. Robert Burger Assoc. Inc. 2nd AIChE-EPA Natl. 'Complete Water Reuse' Conf., (Chic. May 4-8, 1975), Proc., 1975, pp. 520-27.
198) Reuse of Wastewater Effluent as Cooling Tower Makeup Water Exxon Chemical Co.; Fleischman, M. Univ. Louisville 2nd AIChE-EPA Natl. 'Complete Water Reuse' Conf., (Chic. May 4-8, 1975), Proc., 1975, pp. 501-14.
199) A Spray System for Cooling Towers Von Allmen, F. American Air Filter Co. Power, V. 120, N. 6, June 1976, pp. 38-39.
200) Counter-Flow Evaporative Cooling Tower Performance Modeling and Verifica tion Savery, C. W. Drexel Univ. ASME Winter Annu. Meet., (Houston Nov. 30-Dec. 4, 1975) (Abstr.) Mech. Eng., V. 98, N. 5, May 1976, pp. 98-107. Pap. N. 75-WA/HT-43.
COOLING TOWER LITERATURE 313
201) Analysis of Large Dry Cooling Towers with Spine-Fin Heat Exchange Elements Moore, F. K. Cornell Univ. ASME Winter Annu. Meet., (Houston Nov. 30-Dec. 4, 1975), Mech. Eng., V. 98, N. 5, May 1976, pp. 94-107, Pap. N. 75-WAjHT-46.
202) (Application of Corrugated Plate Packing to Improve Heat Transfer in Evaporative Cooling Towers) Zemanek, J. Natl. Res. Inst. Eng., Prague 5th Czech. Comm. Ind. Chem.-Czech Chern. Soc.-Eur Fed Chern. Eng. IT (Chisa) Congr. (Prague Aug. 25-29, 1975) Chern Tech (Leipz), V. 28, N. 3, March 1976, pp. 180-86. (In German).
203) Sodium Molybdate as a Corrosion Inhibitor in Cooling Tower Water Robitaille, D. R. Climax Molybdenum Co., MI Natl. Assoc. Carras. Eng. 'Corrosf76' Meet., (Houston Mar. 22-26, 1976), Pap. N. 93, 8 p.
204) Comparison of Different Combinations of Wet and Dry Cooling Towers Cleve, H. H. von Gea Ges Luftkondensation ASME Winter Annu. Meet., (Houston Nov. 30-Dec. 4', 1975), Mech. Eng., V. 98, N. 2, Feb. 1976, pp. 76-87, Pap. N. 75-WAjPWR-IO.
205) Calcium Sulfate Solubility in Dynamic Cooling Tower Systems ... Zero Blowdown Klen, E. F.; Johnson, D. A. Nalco Chern. Co. Natl. Assoc. Carras Eng. 'Corrosf76' Meet., (Houston Mar. 22-26, 1976), Pap. N. 88, 14 p.
206) Energy Conservation in Caprolactam Recovery (by Using the Evaporative Capacity of Cooling Towers) Kiopekly, G. Am. Enka Co. 171st ACS Natl. (Centennial) Meet., (New York Apr. 4-9, 1976) Abstr. Paper Abstr. N. CELL-24.
207) Cooling Tower Blowdown and Makeup Caplan, F. Pollution Engineering, V. 8, N. 2, Feb. 1976, p. 36.
208) Automation Improves (Cooling Tower and Heat) Exchanger Cooling Fans Pyle, D. S. Oil Gas J., V. 74, N. 3, Jan. 19, 1976, pp. 56-57.
314 COOLING TOWERS
209) (The Nation's First Natural-Draft Cooling Tower Using Sea Water for Condenser Cooling) Atlantic City Electric Co. ; Research-Cottrell Inc. Environ. Sci. Technol., V. 9, N. 12, Nov. 1975, p. 1009.
210) Performance Curves for Mechanical Draft Cooling Towers Hallett, G. F. Ceramic Cooling Tower Co. ASME Winter Annu. Meet., (New York Nov. 17-22, 1974), Pap. N. 74-WA/PTC-3, J. Eng. Power, V. 97, N. 4, Oct. 1975, pp. 503~9.
211) Accuracy of an Analogy Between Heat and Mass Transfer and the Lewis Correlation for Conditioners and Cooling Towers Berman, L. D. Vses Teplotekh Inst. Moscow, USSR Kholod Tekh 1974, N. 2, pp. 34-7; Chern. Abstr. V. 81-15095. (In Russian).
212) Environmental Impact Assessment of Cooling Towers Williams M. D.; Bartlit, J. R. Sierra Club Natl. Water Resources Comm. Natl. Assoc. Corros Eng. 'Co~rosI75' Meet. (Toronto Apr. 14-18, 1975), Mater Performance, V. 14, N. 9, Sept. 1975, pp. 39-41.
213) Heat Transfer/Cooling Towers ... Fouling Measurement Techniques Heat Transfer Research Inc.; Ritter, R. B.; Fischer, P.; Suitor, J. W. Heat Transfer Res. Inc. Chem. Eng. Prog., V. 71, N. 7, July 1975, pp. 66-72.
214) Heat Transfer/Cooling Towers ... Blowdown Concentration by Electrodialysis McIlhenny, W. F.; Bearden, M. D.; Jordan, D. R. Dow Chern. U.S.A. Chem. Eng. Prog., V. 71, N. 7, July 1975, pp. 77-82.
215) Quick Calculation of Cooling Tower Blowdown and Makeup Caplan, F. Chem. Eng., (New York), V. 82, N. 14, July 7,1975, p. 110.
216) Facts on Water Use in Cooling Towers Sussman, S. Olin Corp. Cooling Tower [nst. Annu. Meet., (Houston Feb. 10, 1975), Hydrocarbon Process, V. 54, N. 7, July 1975, pp. 147-55.
217) Materials Problems in Salt Water Cooling Towers Walston, K. R. Exxon Res. & Eng. Co. Mater Performance, V. 14, N. 6, June 1975, pp. 22-26.

COOLING TOWER LITERATURE 315
218) Measurement and Characterization of (Wet) Cooling Tower Drift (Including a Particulate Sampler) Shofner, F. M.; Margetts, M. J.; Wilber, K. R. Environ. Syst. Corp. ASME Winter Annu. Meet., (New York Nov. 17-22, 1974) (Abstr.) Mech. Eng., V. 97, N. 4, Apr. 1975, pp. 56-59, Pap. N. 74-WAjHT-60.
219) Environmental Impact Assessment of Cooling Towers Bartlit, J. R.; Williams, M. D. Sierra Club Natl. Water Resources Comm. Natl. Assoc. Corros Eng. 'Corros/75' Meet., (Toronto Apr. 14-18, 1975), Pap. N. 147,7 p.
220) Performance Curves for Mechanical Draft Cooling Towers Hallett, G. F. Ceramic Cooling Tower Co. ASME Winter Annu. Meet., (New York Nov. 17-22, 1974) (Abstr.) Mech. Eng., V. 97, N. 5, May 1975, pp. 56-61, Pap. N. 74-WAjPTC-3.
221) Calculations for Industrial Water Cooling Towers Reverberi, A.; Chiarioni, M. G. Univ. Genoa Riv. Combust., V. 29, N. 1, Jan. 1975, pp. 15-20. (In Italian).
222) Cooling Towers ... Best Control of the Low Point oi,!he Camot Cycle Henriet, P.' Ind. Pet Monde Gaz-Chim., V. 43, N. 4, Apr. 1975, pp. 35-37. (In French).
223) (The Impact of Cooling Towers on Water, Land, and Air Environments) Bartlit, J. R.; Williams, M. D. Natl. Assoc. Corros Eng. 'Corrosj75' Meet., (Toronto Apr. 14-18,1975) (Abstr.) Can Chem. Process, V. 59, N. 2, Feb. 1975, pp. 30, 32-34.
224) Radial Air Distribution Functions in Water Cooling Towers Funer, I. A. Univ. Sydney Chem. Eng. Sci., V. 30, N. 3, Mar. 1975, pp. 349-51.
225) Heat Transfer Survey 1974jWinter Operation of Mechanical Draught Cooling Towers Cabral, B. F. A. Carter Ind. Prod. Ltd. Process Eng., (London), Spec. Issue 45,1974, p. 47.
226) Conservation of Energy in Cooling Towers Moran, D. Tower Performance Inc. 67th AIChE Annu. Meet., (Washington, D.C. Dec. 1-5, 1974), Pap. N.40D, 11 p.

316 COOLING TOWERS
227) Heat Rejection from Dry Cooling Towers with Fluidized Beds Andeen, B. R.; Glicksman, L. R. 67th AIChE Annu. Meet., (Washington, D.C. Dec. 1-5, 1974), Pap. N. 67A, 30 p.
228) Concrete Cooling Tower Maintenance Shell Composites Ltd.; Imperial Chemical Industries Ltd. Carras Prevo Control, V. 21, N. 5, Oct. 1974, p. 18.
229) Waste Heat Disposal in the Process Industry ... (Factors Governing the Selection of,an) Air Cooler and/or Water Cooling Tower Maze, R. W. Marley Co. ASME Pet Mech. Eng. Cant, (Sept. 15-18, 1974) (Abstr.), Mech. Eng., V. 96, N. 10, Oct. 1974, pp: 58-65, Pap. N. 74-PET-13.
230) Water Management Trends in Refinery Cooling Systems (Including the Economics of Cooling Tower Recycle Systems) Griffin, R. W. Nus Corp. ASME Pet Mech. Eng. Conf;, (Sept. 15-18,1974) (Abstr.), Mech. Eng., V. 96, N. 10, Oct. 1974, pp. 58-65, Pap. N. 74-PET-15.
231) (In) An Analysis of a Counterflow Spray Cooling Tower Hollands, K. G. T. Univ. Waterloo Int. J. Heat Mass Transfer, V. 17, N. 10, Oct. 1974, pp. 1227-39.
232) Ion Exchange Hollow Fibers (Potential for Reducing Waste Disposal Problems with Cooling Tower Blowdown Water) Klein, E.; Ward, R.; May, P.; Smith, J. K. Gulf South Res. Inst. 168th ACS Natl. Meet., (Atlantic City Sept. 8-13,1974) (Abstr.), Pap. Abstr. N. Inde-16.
233) The Cooling Tower Business Today Furlong, D. Environ. Sci. Technol., V. 8,N. 8,Aug.1974,pp. 712-16.
234) A Comparison of Evaporative Loss in Cooling Towers and in River Water Cooling Spangemacher, K. Brennst.-Waerme-Kraft, V. 25, N. 12, Dec. 1973, pp. 472-74. (In German).
235) A Mathematical Model for the Computer Simulation of Moist Plumes from Stacks and Cooling Towers Ting, H. T. Univ. Tex. Austin fliss. (1972), 214 p. (Abstr.), Diss. Abstr. Int. B, V. 34, N. 2, Aug. 1973, p. 686B.
COOLING TOWER LITERATURE 317
236) (The Temperature·Dependence of) the Evaporation Coefficient for Evaluating Cooling Towers Klenke, W. VDI Verfahrenstech Ges. 'Heat + Mass Transfer' Comm. Meet. (Bad Mergentheim Apr. 2-3 1972). Chern-lng-Tech, V. 45, N. 17, Sept. 1973, pp. 1075-82. Tech. Univ. Braunschweig. (In German).
237) The Case for Chromate in Cooling Tower Treatment Lane, R. W. Mater Prot. Performance, V. 12, N. 9, Sept. 1973, pp. 27-30. Ill. State Water Surv.
238) Calculation of Cooling in Liquid-Drop-Type Cooling Towers for Sea Water Containing Petroleum Products Aliev, N. D. Azerb Neft Khoz, 1972, N. 12, pp. 38-9. Chern. Abstr. V. 78-149466. (In Russian).
239) Method for the Calculation of Over-All Volumetric Enthalpy Transfer Coefficients in Cross-Flow Cooling Towers
240)
241)
Hirai, E.; Hayashi, Y. Kagaku Kogaku-1973, V. 37, N. 3, pp. 314-16. Chern. Abstr., V. 78-138342. (In Japanese). Dep. Chern. Eng. Kanazawa Univ., Kanazawa, Japan.
Volumetric Film Coefficients in Cross-Flow Cooling ,Towers Eliminator-Type Packing' Okubo, M.;Hirai, E.; Hayashi, Y. Kagaku Kogaku 1972, V. 36, N. 12, pp. 1346-9. Chern. Abstr. V. 78-74113. (In Japanese). Dep. Chern. Eng. Kanazawa Univ., Kanazawa, Japan. '
Reclaiming Cooling Tower Blowdown El Paso Natural Gas Co.; Fosberg, T. M. Ind. Water Eng., V. 9, N. 4,1972, pp. 35-37. (Abstr.). WaterPollut. Abstr. (United Kingdom), V. 45, N. 9, No. 2210, Sept. 1972.
242) Reuse of Refinery Wastewater in Cooling Towers Mobil Oil Corp.; Hart, J. A. Natl. Assoc. Corros Eng. 'Corros/73 , Int. Forum (Anaheim, CA Mar. 19-23, 1973), Pap. N. 89,19 p. Mobil Oil Corp'.
243) Evaporative Cooling Tower Performance Predictions Hammill, M:P.; Savery, C. W. ASME Winter Annu. Meet., (Nov. 26-30, 1972) (Abstr.), Mech. Eng., V. 95, N. 6, June 1973, pp. 59-62, Pap. N. 72-WAjHt-62. Drexel Univ.
244) Simultaneous Heat and Mass Transfer in Cooling Towers Wolfersdorff, W. D. B. von VDI- Verfahrenstech GesAnnu. Meet., (Cologne Oct. 3-5,1972). Chemlng-Tech, V. 45, N. 6,Mar. 1973, pp. 356-62. (In German). Tech Hochsch Aachen.
318 COOLING TOWERS
245) Accurate Performance Testing of Crossflow Cooling Towers Reisman, J. I.; Ovard, J. C. ASME Winter Annu. Meet., (Nov. 26-30, 1972) (Abstr.), Mech. Eng., V. 95, N. 5, May 1973, pp. 45-57, Pap. N. 72-WA/PTC-5. Ecodyne Cooling Prod. Co.
246) Wastewater Recycled for Use in (Mobil Oil Corp.'s East Chicago, Ind.) Refinery Cooling Towers Mobil Oil Corp., Hart, J. A. Oil Gas J., V. 71, N. 24, June II, 1973, pp. 92-96.
247) No Cheap Cure for Cooling Tower Noise Butler, P. Process Eng., (London), Dec. 1972, p. 69.
248) Environmental Aspects of Cooling Tower Operation. Accumulation and Escape of Dissolved and Undissolved Substances Resch, G.; Burgmann, F. Tech Mitt, V. 65, N. 5, May 1972, pp. 237-39. (In German). Ver Elektrizitaetswerke Westfalen.
249) Mechanical Draught Cooling Towers Nair, S. R. Chern. Eng. World, V. 7, N. 7, July 1972, pp. 101-4. Thennopak Eng. PVT Ltd.
250) Acoustical Aspects of Large (Wet-Type) Cooling Towers Boehm, O. Tech Mitt, V. 65, N. 5, May 1972, pp. 240-44. (In German). Mueller BBN G.M.B.H.
251) Fog and Ice Formation During Cooling Tower Operation Bach, H. Tech Mitt, V. 65, N. 5, May 1972, pp. 230-36. (In German). DTSCH Wetterdienst Wetteramt, Essen.
252) Potential Augmentation of (Downwind) Precipitation from Cooling Tower (Water Vapor) Effluents Changnon, S. A. Jr.; Huff, F. A. 7Ist AIChE Natl. Meet., (Dallas Feb. 20-23, 1972), Program (Abstr.), Pap. N. 30B. Ill. State Water Surv.
253) Biological Effects of Cooling Tower Blowdown (on Aquatic Life) Garton, R. R. 7Ist AIChE Natl. Meet., (Dallas Feb. 20-23,1972), Program (Abstr.), Pap. N. 32E. Pacific Northwest Water Lab.
COOLING TOWER LITERATURE 319
254) Thermal Cycle Arrangements for Power plants Employing Dry Cooling Towers Leung, P.; Miliaras, E.; Moore, R. E. J. Eng. Power, V. 94, N. 1, Jan. 1972, pp. 70-71.
255) Chemical Treatment for Cooling Tower and Related Systems (Consistent with Pollution Control) Bischof, A. E.; Goldstein, P. Mater Prot. Performance, V. 10, N. 12, Dec. 1971, pp. 26-28.
256) A Cooling Tower study Illinois Institute of Technology Res.; Sockham, J.; U. S. Air Pollution Control Office U.S. Dep. Commerce Nat. Tech. Inform. Servo PB, N. 201, Jan 1971, p. 216, 123 p.
257) Cooling Tower Blowdown and Boiler Blowdown as Waste Water Problems Schieber, J. R. AIChE Water Comm. Workshop. 'Ind. Process Design Water Pollut. ContI.' (San Francisco Mar. 3 I-Apr. 2,1970), Proc. 3, pp. 18-23.
258) Cooling Tower Fog, Control and Abatement Veldhuizen, H.; Ledbetter, J.
259)
260)
261)
262)
263)
J. Air Pollut. Contr. Ass., V. 21, N. 1, Jan. 1971, pp. 21-24.
Cooling Tower Plumes/Probabilities of Cooling System Fogging Decker, F. W. 68th AIChE Nat. Meet., (Houston Feb. 28-Mar. 4,1971), Program (AbstI.), Pap. N. 63D.
Cooling Tower Plumes/Bent Over Moist Plumes Csanady, G. T. 68th AIChE Nat. Meet., (Houston Feb. 28-Mar. 4, 1971), Program (AbstI.), Pap. N. 63C.
Cooling Tower Plumes/Plume Puncturing of Inversions Brown, D. 68th AIChE Nat. Meet., (Houston Feb. 28-Mar. 4,1971), Program (Abstr.), Pap. N. 63B.
Ecological Aspects of Air Coolers and Cooling Towers Macalliso, C. A. 68th AIChE Nat. Mee't., (Houston Feb. 28-Mar. 4, 1971), Program (Abstr.), Pap. N. 71C.
Cooling Tower Plumes/Environmental Aspects of Cooling Towers Colbaugh, W. C. 68th AIChE Nat. Meet., (Houston Feb. 28-Mar. 4, 1971), Program (Abstr.), Pap. N. 63A.
320 COOLING TOWERS
264) Behavior of Cooling Tower Plumes (During the 1968-69 and 1969-70 Winters) Frankenberg, T. T.; Singer, I. A.; Smith, M. E. 68th AIChE Nat. Meet., (Houston Feb. 28-Mar. 4, 1971), Program Pap. N. 37E.
265) The Prediction and Verification of Visible Plumes Behavior Associated with Cooling Tower Discharges Petrillo, J. L. 68th AIChE Nat. Meet., (Houston Feb. 28-Mar. 4,1971), Program Pap. N. 37D.,
266) Considerations Concerning Cooling Tower Plumes Hall, W. A. 68th AIChE Nat. Meet., (Houston Feb. 28-Mar. 4, 1971), Program Pap. N. 37B.
267) Predicting Cooling Tower Plume Behavior Hosler, C. L. 68th AIChE Nat. Meet., (Houston Feb. 28-Mar. 4, 1971), Program Pap. N. 37A.
268) Latent Heat ,Effects in Plumes from Cooling Towers Nielsen, H. 1.; Aynsley, E. 68th AIChE Nat. Meet., (Houston Feb. 28-Mar. 4, 1971), Program Pap. N. 37C (Abstr.).
269) The Use of Closely Spaced (Flat and Corrugated Sheet) Packing in Hyperbolic Cooling Towers Rish, R. F. Res. Results Servo MS (Available in Manuscript form) for ordering see ACS Single Article Announce, N. 17 (Sept. 15, 1971), N. 71-247, 20 p.
270) (Two New Methods for) Calculation of the Over-All Volumetric Enthalpy Transfer Coefficient in Cross-Flow Cooling Towers Hayashi, Y.;Hirai, E. Kagaku Kogaku, V. 34, N. 9, 1970, pp. 965-71 (Abstr.). J. Chern. Eng. Jap., V. 4, N. 1, Feb. 1971, p. 106.
271) Thermal Cycle Arrangements for Power Plants Employing Dry Cooling Towers Moore, R. E.; Leung, P. ASME Joint Power Generation Conf. (Pittsburgh) Sept. 27-30, 1970), Pap. N. 70-PWR-6. J. Eng. Power, V. 93, N. 2, Apr. 1971, pp. 257-64.
272) Operation and Maintenance of Cooling Towers Kuehmsted, A. M. Chern. Eng. (New York), V. 78, N. 10, May 3,1971, pp. 112-114-15.
COOLING TOWER LITERATURE 321
273) Developing Cooling Tower Recirculation Factors from Field Test Data Baker, D. R. 9Ist ASME Winter Annu. Meet. (Nov. 29-Dec. 3,1970), Pap. N. 70-WA/HT-22.
274) A Profile of Industrial Cooling Towers Ovard, J. C. I6Ist ACS Nat. Meet., (Los Angeles Mar. 28-Apr. 2, 1971), Abstr. Pap. Abstr. N. INDE-81.
275) The Use of Membrane Processes in Cooling Tower Operations Cecil, L. K. 68th AIChE Nat. Meet., (Houston Feb. 28-Mar. 4, 1971), Program Pap. N. 78G.
276) Cooling Tower Operating Problems/Solubility of Calcium Sulfate Glater, J. 68th AIChE Nat. Meet., (Houston Feb. 28-Mar. 4, 1971), Program Pap. N. 78F.
277) Simulation of Evaporation from a Cooling Lake with a Comparison to a Real Case and the Alternative Use of Cooling Towers Drew, H.; Jaske, R. T. 68th AIChE Nat. Meet., (Houston Feb. 28-Mar. 4, 1971), Program Pap. N. 78E.
278) Cooling Tower Drift Measurements Shofner, F. M.; Thomas, C. O. 68th AIChE Nat. Meet., (Houston Feb. 28-Mar. 4, 1971), Program Pap. N. 78D (Abstr.).
279) Use of a Computer in Test Data Reduction and Performance Prediction for Cross Flow Cooling Towers Park, J. E.; Vance, J. M. 68th AIChE Nat. Meet., (Houston Feb. 28-Mar. 4, 1971), Program Pap. N. 78C.
280) Evaluation of Counter-Flow Cooling Tower Cell Performance Wrinkle, R. B. 68th AIChE Nat. Meet., (Houston Feb. 28-Mar. 4, 1971), Program Pap. N. 78B.
281) Salt Water Cooling Tower Operation (in Relation to Ecology) Nester, D. B. 68th AIChE Nat. Meet., (Houston Feb. 28-Mar. 4,1971), Program Pap. N. 78A.
282) Increasing Cooling Tower Capacity Without Enlarging the Structure Phelps, P. M. 68th AIChE Nat. Meet., (Houston Feb. 28-Mar. 4,1971), Program Pap. N. 700.

322 COOLING TOWERS
283) Economics of Stainless Steel Cooling Towers for Industry 68th AIChE Nat. Meet., (Houston Feb. 28-Mar. 4, 1971), Program Pap. N. 70D.
284) Methods for Rejecting Waste Heat from Steam-Electric Power Plants (Including Natural and Mechanical Draft Evaporative Cooling Towers, and Dry Cooling Towers) Oleson, K. A. 68th AIChE Nat. Meet., (Houston Feb. 28-Mar. 4, 1971), Program Pap. N. 70A.
285) Legal Aspects of Salinity Caused by Cooling Towers ... The Colorado River Gindler, B. J.; Holburt, M. B. 68th AIChE Nat. Meet., (Houston Feb. 28-Mar. 4, 1971), Program Pap. N. 48D.
286) Cooling Tower Technology and the Law/Problems of Consumptive Withdrawals (from the Great Lakes) Stewart, B. F. 68th AIChE Nat. Meet., (Houston Feb. 28-Mar. 4,1971), Program Pap. N. 48C. .
287) The Cooling Tower as a Factor in Riparian Law Davis, C. 68th AIChENat. Meet., (Houston Feb. 28-Mar. 4,1971), Program Pap. N. 48B.
288) Cooling Tower Technology and the Law/The Cooling Tower ... Technology and Practical Interactions in Practice Moses, R. J. 68th AIChE Nat. Meet., (Houston Feb. 28-Mar. 4, 1971), Program Pap. N. 48A.
289) Plastic Cooling Tower Saves Space and Weight Whirlcool Inc. Chern. Eng., (New York), V. 78, N. 2, Jan. 25,1971, p. 48.
290) How To Do It/How to Estimate Cooling Tower Costs Kuong, J. F. Hydrocarbon Process, V. 48, N. 7, July 1969, pp. 200-202.
291) (Avoidance of Thermal Pollution by Using) Dry Type Cooling Towers for Steam Electric Generating Plants Rossie, J. P. 68th AIChE Nat. Meet., (Houston Feb. 28-Mar. 4, 1971), Program Pap. N. 26B.
292) (Use of Models to Study Noise from Cooling Towers) Boehm, A., Hubert Ver Deut Ing-Deut Phys Ges. 'Acoust. & Vibration Technol'MTG (Berlin Sept. 16-18,1970). (In German).

293) Cooling Towers for BP BP Chemicals UK Ltd.
COOLING TOWER LITERATURE 323
Eur. Chern. News, V. 16, N. 398, Sept. 19,1969, p. 42.
294) Performance Testing of Large Natural Draft Cooling Towers Morgenweck, F. E. Arner. Soc. Mech. Eng. Winter Ann. Mtg., (Dec. 1-5,1968), Pap. N.68-WA/PTC-4.
295) Process Control & Computers/ Automatic Cooling Tower Control Magna Corp.; Feitler, H.; Townsend, C. R. Chern. Eng. Progr., V. 65, N. 5, May 1969, pp. 63-67.
296) Automatic Cooling Tower Control System Minimizes Pollution Feitler, H.; Townsend, C. R. 61st AIChE Ann. Mtg., (Los Angeles Dec. 1-5, 1968), Program Pap. N. 47A.
297) Natural Draft Cooling Tower, Maximum Liquid Loading Furzer, I. A. Ind. Eng. Chern. Process Des Develop., V. 7, N. 4, Oct. 1968, pp. 561-65.
298) The Natural Draft Cooling Tower, An Approximate Solution Furzer, I. A. " Ind. Eng. Chern. Process Des Develop., V. 7, N. 4, oct. 1968, pp.555-60. '
299) Cooling Towers-2. Cooling Tower Blowdown Treatment Costs Glover, G. E. AIChE Water Comm. Workshop (Houston Apr. 24-26, 1969), AIChE Ind. Process Des Water Pollut. Contr. Workshop Proc., V. 2, 1970, pp. 74-8l.
300) Investigation of the Behavior of a (Semi-Industrial) Triclde Film, Countercurrent Cooling Tower Iorga, D.; J adaneantu, M.; Negru, D.; Oancea, N. D.; Barbu, V.; Vladea,1. Brennst.- Waerrne-Kraft, V. 22, N. 10, Oct. 1970, pp. 486-90.
301) (An AIChE) Cooling Tower Panel American Institute of Chemical Engin. AIChE Water Cornrn. Workshop, (Houston Apr. 24-25, 1969), AIChE Ind. Process Des Water Pollut. Contr. Workshop Proc., V. 2, 1970, pp. 93-99.
302) Cooling Towers-S. Problems in Replacing Chromate as a Corrosion Inhibitor for Open-Recirculating Cooling Waters Zecher, D. C. AIChE Water Comm. Workshop, (Houston Apr. 24-25,1969), AIChE Ind. Process Des Water Pollut. Contr. Workshop Proc., V. 2, 1970, pp. 89-92.
324 COOLING TOWERS
303) Cooling Towers-4. Reduction of Blowdown from Power Plant Cooling Tower Systems Southern California Edison Co.; Christiansen, P. B.; Colman, D. R. AIChE Water Comm. Workshop, (Houston Apr. 24-25, 1969), AIChE Ind. Process Des Water Pollut Contr. Workshop Proc., V. 2, 1970, pp. 85-88.
304) The Thermal Efficiency Factor of Cooling Towers Oancea, N. D.; Vladea, I. Brennst.-Waerme-Kraft, V. 22, N. 3, Mar. 1970, pp. 123-27.
305) Heat and Mass Transfer at Countercurrent Trickle Films in a Vertical Channel and a Cooling Tower Oancea, N. D.; Vladea, I. Ver. Deut. Ing. Chem. Eng. Ann. Mtg., (Bayreuth Sept. 30-0ct. 2, 1969), Chem-Ing-Tech, V. 2, N. 6. Mar. 1970, pp. 403-9.
306) Natural Draft Cooling Towers and How They Fit Into the Thermal Pollution Picture Jones, W. J. 67th AIChE Nat. Mtg., (Atlanta Feb. 15-18, 1970), Program Pap. N. 26 D.
307) Cooling Towers Use Plastics Billings, R. Y'I. Cooling To,wer Inst. Mtg., (New York June 26-28,1967) Oil Gas J., V. 65, N. 44, Oct. 30, 1967, pp. 145-47.
308) Chemical Considerations in Planning Pollution Induced Climate Modification in the Lake Michigan Basin. (Water-Vapor, Thermal, and Solids Pollution of the Atmosphere by Cooling Towers) Winchester, J. W. 67th AIChE Nat. Mtg., (Atlanta Feb. 15-18, 1970), Program Pap. N. 260.
309) Resistance Characteristics of Natural Draft Cooling Towers Mikyska, L. Brennst.-Waerme-Kraft, V. 21, N. 12, Dec. 1969, pp. 634-36.
310) Use Rotary Spray Cooler as Lab Cooling Tower Ghosh, M. K. Hydrocarbon Process, V. 47, N. 9, Sept. 1968, p. 302.
311) Laboratory Evaluation of Cooling Tower Corrosion Inhibitors Ziegenhorn, R. D.; Lane, R. W. Nat. Ass. Corros. Eng. N. Central Reg. Con[., (Chicago Sept. 30-Oct. 2, 1968), Pap. 12P.
312) For Steam Turbine Drives ... Are Dry Cooling Towers Economical Rabb, A. Hydrocarbon Process, V. 47, N. 2, Sect 1, Feb. 1968, pp. 122-24.
COOLING TOWER LITERATURE 325
313) Model Measurements on Cooling Towers Vogelsang 2nd Intern Heat Eng. Can! (Karl-Marx-Stadt, E. Ger. Sept. 26-29, 1966).
314) On the Problem of Heat and Mass Transfer in Cooling Towers with Film Systems Vladea, J. 2nd Intern. Heat Eng. Cant (Karl-Marx-Stadt, E. Ger. Sept. 26-29, 1966).
315) Water Cooling Tower Plumes Baker, K. G. Chern. Process Eng., V. 48, N. 1,1967, pp. 56-58.
316) Processing Notes/Diver Cleans Cooling Tower Mobil Oil Corp. Oil Gas J., V. 65, N. 38, Sept. 18, 1967, p. 106.
317) New Exchange Resin Could Reduce Cooling Tower Blowdown Rohm & Haas Co.; Downing, D. G.; Owens, D. L.; Printz, J. Cooling Tower Inst. Annu. Mtg. (1966) (Adapt.) Petro/Chern Engr., V. 39, N. 9, pp. 36-37.
318) Cooling Towers Not Unmixed Blessing in Pollution Cpntrol Forbes, M. C. . Cooling Tower Inst. Ann. Mtg., (Houston 1967) (Cond) Oil Gas J., V. 65, N. 17, Apr. 24, 1967, pp. 88-90.
319) Plastics for Refinery Water Cooling Towers Shell International Petroleum Co. Ltd.; Sherwood, P. W. Erdoel Kahle, V. 19, N. II, Nov. 1966, pp. 823-24.
320) Maintenance of (Wooden) Cooling Towers in Modern Refineries Sinclair Refining Co.; Gulf Oil Corp.; Sherwood, P. W. Erdoel Kahle, V 19, N. 8, Aug. 1966, pp. 591-92.
321) Selection of Materials and Coatings for Water Cooling Towers Nelson, J. A. Mater Protect, V. 5, N. 7, July 1966, pp. 27-29.· ,
322) Capacities of Cooling Towers Davis, D. S. Brit. Chern. Eng., V. 11, N. 5, May 1966, p. 360.
323) Three Ways to Improve Your Cooling-Tower Performance-3. The Economics of Treating Cooling Tower Water Keith, G. M. Cooling Tower Inst. Ann. Mtg., (Houston 1965) (Cond) Oil Gas J., V. 63, N. 29, July 19, 1965, p. 76.
326 COOLING TOWERS
324) Three Ways to Improve Your Cooling-Tower Performance-2. Rigid Vinyl for Cooling Towers Weyland, R. V. Cooling Tower Inst. Ann. Mtg., (Houston 1965) (Cond) Oil Gas J., V. 63, N. 29, July 19, 1965, pp. 75-76.
325) Combating Algal Growth in Recycle Water Cooling Towers With New Microcides Pommer, E. -H.; Distler, H. 16th Deut Ges Mineraloelwiss U Kohlechem Ann. Mtg. (Cologne Oct. 9, 1964), Erodel Kohle, V. 18~ N. 5, May 1965, pp. 381-86.
326) How to Solve Cooling Tower Problems Quicker Campbell, J. C. Petro/Chem Engr., V. 37, N. 3, Mar. 1965, pp. 23-27.
327) Eight Years Experience With Reuse and Biooxidation of Refinery Wastewater in Cooling Tower Systems at Sun Oil Co. S. Toledo Refinery Mohler, E. F. Jr.;Elkin, H. I:.;Kumnick, L. R. 37th Ohio Water Pollution Control Conf. Ann. Mtg., (Toledo June 12-14,1963) J. Water Pollution Control Federation, V. 36, N. 11, Nov. 1964, pp.1380-92.
328) Cooling Towers Used for Waste Treatment. Use of a Cooling Tower as a Triclding Filter in Pollution Control Smith, R. M. Cooling Tower lnst. Mtg. (1964) (Cond) Oil GasJ., V. 62, N. 37, Sept. 14,1964, pp. 115-16.
329) The Decay of Timber in Cooling Towers and Its Prevention Farbenfabriken Bayer, A. G. Kueheturm-Impraegnierung (Con d) Bitumen Teere Asphalte Peche, V. IS, N. 5, May 1964, pp. 233-34.
330) The Characteristics of Cooling Towers with Natural and Mechanical Draft Spangemacher, K. Brennstoff-Waerme-Kraft, V. 16, N. 5, May 1964, pp. 241-46.
331) Questions on Technology Dry vs. Wet Cooling Towers Nelson, W. L. Oil GasJ., V. 62, N. 23, June 8,1964, p. 164.
332) Experimental Studies on the Contribution of the Splash Zones in Countercurrent Cooling Water Towers Barbu, V.; Vladea, I. Univ. Timisoara Brennst.-Waerme-Kraft, V. 28, N. 5, May 1976, pp. 198-202. (In German).
- -------------
COOLING TOWER LITERATURE 327
333) The Natural Draught Cooling Tower Furzer, I. A. Brit. Chem. Eng., V. 13, N. 9, Sept. 1968, pp. 1287-90.
334) Cut Costs ... Balance Cooling Tower Fans in Place Blake, M. P. Hydrocarbon Process, V. 46, N. 6, June 1967, pp. 150-54.
335) Practical Tips on Cooling-Tower Sizing Maze, R. W. Hydrocarbon Process, V. 46, N. 2, Feb. 1967, pp. 123-26.
336) Control Cooling-Tower Blowdown Mapstone, G. E. Hydrocarbon Process, V. 46, N. 1, Jan. 1967, pp. 155-60.
337) Cooling Tower Steam Sterilization, Four Years' Progress McConomy, T. A. Mater Protect, V. 5, N. 9, Sept. 1966, pp. 51-53.
338) Reinforced Concrete Cooling Tower Sheathing Doganoff, I. Brennstoff-Waerme-Kraft, V. 18, N. 3, Mar. 1966, pp. 109-13.
339) Operating Characteristics of Natural-Draft Cooling T<,>wers Mikyska, L. Brennstoff-Waerme-Kraft, V. 18, N. 3, Mar. 1966, pp. 106-8.
340) The Latest Development in Cooling Tower Control Macht, W. A. . Nat. Gas Processors Assoc. South Reg. Mtg., (Tyler, TX 1965) Petro/Chem Engr., V. 38, N. 3, Mar. 1966, pp. 24-27.
341) Spray Technology and Its Application in the Chemical Industry ... Spray Towers and Their Design Viehweg, H.; Schubert, M. Chem. Tech., (Berlin), V. 17, N. 5, May 1965, pp. 269-76.
342) Symposium on Cooling Tower Materials and Water Treatment Comeaux, R. V.; Baech1er, R. H.; Willa, J. L.; Hatch, G. B.; Shema, B. F.; Kelly, B. J.; Sloan, L.; Terry, S. L. 149tlt Am. Chem. Soc. Natl. Mtg., (Detroit Apr. 4-9, 1965) Abstr. Papers, pp. 110-150.
343) Cooling Tower Design Calculations with an Electronic Computer Mikyska, L.; Reinisch, R. Brennstoff-Waerme-Kraft, V. 17, N. 2, Feb. 1965, pp. 61-63.
344) A Central System Controls pH in Seven Cooling Towers Hess, H.; La Gloria Oil & Gas Co. Hydrocarbon Process Petrol Refiner, V. 44, N. 2, Feb. 1965, pp. 182-83.
328 COOLING TOWERS
345) Some New Materials for Cooling Water Towers to Combat Corrosion and Wood Deterioration Baker, D. R. Natl. Assoc. Corrosion Engrs. N. Central Reg. Cont, (Kansas City Oct. 1963)Mater Protect, V. 3, N. 10, Oct. 1964, pp. 58-62.
346) A Method of Measuring the Progress of Wood Rot in Cooling Towers Bird, P. G.; Kaye, S. 20th Natl. Assoc. Corrosion Engrs. Ann. Cont, (Chicago Mar. 9-13, 1964) Mater Protect, V. 3, N. 10, Oct. 1964, pp. 46-50.
347) Effect of Maintenance on Cooling Tower Thermal Performance Willa, J. L. Natl. Assoc. Corrosion Engrs. N. Central Reg. Cont, (Kansas City Oct. 3, 1963)Mater Protect, V. 3, N. 10, Oct. 1964, pp. 35-36.
348) Microbiological Control to Prevent Corrosion in Recirculating Water Systems Trautenberg, G. A.; Askew, A. C. Jr. 20th Natl. Assoc. Corrosion Engrs. Ann. Cont, (Chicago Mar. 9-13, 1964) Mater Protect, V.3,N: 10,Oct.1964,pp.26-28,31.
349) Case History on Economics of Chemical Treatment of a Recirculating Water Cooling Tower Siebert, 0. W.; Engman, W. G. 20th Natl. Assoc. Corrosion Engrs. Ann. Cont, (Chicago Mar. 9-13, 1964) Mater Protect, V. 3, N. 10, Oct. 1964, pp. 20-22, 24-25.
350) A Simulated Cooling Tower for Evaluating Slime Control Song, P.; Wolfson, L. L. 20th Natl. Assoc. Corrosion Engrs. Ann. Cont, (Chicago Mar. 9-13, 1964) Mater Protect, V.3,N. 10,Oct.1964,pp. 14-17.
351) How to Control Fungi in Cooling Towers Brown, C. W. Cooling Tower Inst. Mtg., (New Orleans Jan. 18, 1964) Hydrocarbon Process Petrol Refiner, V. 43, N. 8, Aug. 1964, pp. 146-48.
352) HPI Handbook/Nomograph for Estimating Water Cooling Towers Petro/Chern. Engineer Petro/Chem Engr., V. 36, N. 5, May 1964, p. 36.
353) The Mollier I-X-Diagram for Evaluating Measurements on Cooling Towers Haeussler, W. Tech Hochschu1e Chemnitz Heat Techno1 Mtg. (Sept. 24-26, 1963) (Abstr) Brennstoff-Waerme-Kraft, V. 16, N. 2, Feb. 1964, p. 95.
COOLING TOWER LITERATURE 329
354) Wind Effects on the Operation of Natural-Draft Cooling Towers Zembaty, W. Tech Hochschule Chemnitz Heat Technol Mtg. (Sept. 24-26, 1963) (Abstr.) Brennstoff-Waerrne-Kraft, V. 16, N. 2, Feb. 1964, p. 95.
355) The Influence of Temperature Stratification on the Thermal Performance of a Natural Draft, Dry Cooling Tower Buxmann, J. Brennst.-Waerrne-Kraft, V. 29, N. 3, Mary. 1977, pp. 90-94. (In German).
356) An Analysis of Crossflow Cooling Towers. The Change in the Water Flow Rate is Considered
357)
358)
359)
360)
361)
Hayashi, Y.; Hirai, E.; Ito, N. Kanazawa Univ. 40th Soc. Chern. Eng. Jap. Annu. Meet., (Nagoya Apr. 1975) J. Chern. Eng. lap., V. 9, N. 6, Dec. 1976, pp. 458-63. (In English).
Aerodynamic Design of (Wet) Cooling Tower Drift Eliminators Schrock, V. E.; Yao, S. C. Argonne Natl. Lab. Univ. Calif., Berkeley ASME Winter Annu. Meet., (Houston Nov. 30-Dec. 5,1975), Pap. N.75-WA/PWR-5 " l. Eng. Power, V. 98, N. 4, Oct. 1976, pp. 450-56. (rn English).
Considerations Required for the Optimum Design of a Wet-Dry Cooling Tower with Respect to Minimizing (Cost and) Visible Vapor Vodicka, V.; Henning, H. Ba1cke Duerr A. G. Brennst.-Waerrne-Kraft, V. 28, N. 10, Oct. 1976, pp. 387-92. (In German).
Design Guidelines. Design of Cooling Towers Ibrahim, S. H. India Reg. Eng. ColI. Tiruchirapally Chern. Eng. World, V. 10, N. 6, June 1965, pp. 53.-59.
Heat Transfer/Cooling Towers ... Spray Cooling System Design Elgawhary, A. W. Bechtel Power Corp. Chern. Eng. Prog., V. 71, N. 7, July 1975, pp. 83-87.
Heat Transfer/Cooling Towers ... Cooling Tower Drift Elimination Burger, R. Robert Burger Assoc. Inc. Chern. Eng. Prog., V. 71, N. 7, July 1975, pp. 73-76.

330 COOLING TOWERS
362) Cooling Tower Design and Evaluation Parameters Kelly, G. M. Marley Co. ASME Ind. Power Conf., (Pittsburgh May 19-20, 1975) (Abstr.) Mech. Eng., V. 97, N. 8, Aug. 1975, pp. 74-76, Pap. N. 75-IPWR-9.
363) Chromate Recovery from Cooling Tower Blowdown by Ion Exchange Resin Yamamoto, D.; Yabe, K. Kurita Water Ind. Co. Ltd. Sekiyu Gaklmi Shi, V. 18, N. 4, Apr. 1975, pp. 284-90. (In Japanese).
364) A Successive Graphical Method of Design of a Cross-Flow Cooling Tower Kageyama, S.; Inazumi, H. Shizuoka Univ. Chern. Eng. Sci., V. 30, N. 7, July 1975, pp. 717-21.
365) The Role of the Cooling Tower Institute Sussman, S. Olin Corp. 79th AIChE Natl. Meet., (Houston Mar. 16-20, 1975) Pap. N. 58F, II p.
366) Air Side Design and Operating Problems in Cooling Towers Phelps, P. M. Phelps Eng. Co. ASME Pet. Mech. Eng. Conf. (Sept. 15-18,1974) (Abstr.) Mech. Eng., V. 96, N. 10, Oct. 1974, pp. 58-65, Pap. N. 74-PET-29.
367) Performance and Design of a Turbulent Bed (Contactor (TBC» Cooling Tower Hertwig, T. A.; Dengler, J. L.; Barile, R. G. Purdue Univ. AIChE Syrnp. Ser., V. 70, N. 138, 1974, pp. 154-62.
368) Cooling Tower Basin Design Friar, F. Chern. Eng., (New York), V. 81, N. IS, July 22,1974), pp. 122,124.
369) On the Minimum Size of Large Dry Cooling Towers with Combined Mechanical and Natural Draft Moore, F. K. J. Heat Transfer, V. 95, N. 3, Aug. 1973, pp. 383-89.
370) Cooling Tower Conserves Water with Wood Ecodyne Ltd. ; Gulf Oil Canada Ltd. Can. Pet., V. 14, N. 5, May 1973, pp. 44-47.
COOLING TOWER LITERATURE 331
371) Analysis of Multiunit Counter-Cross-Flow Cooling Tower Okubo, M.; Hirai, E.; Hayashi, Y. Kagaku Kogaku 1972, V. 36, N. 2, pp. 204-10, Chern. Abstr. V. 76-142735. (In Japanese). Dep. Chern. Eng. Kanazawa Univ., Kanazawa, Japan.
372) A Method for Designing Counterflow Water Cooling Towers Vojislav, A. Eur. Fed. Chern. Eng. Int. 'Chern. Eng. Servo Mankind' Congr. (Paris Sept. 3-9,1972) Chirn. Ind. Genie Chirn., V. 105, N. IS, JUne-July 1972, pp. C17-C57, Pap. N. 4.
373) Economic Aspects of Various (Cooling Tower) Condensation Processes Blanck, D. Tech. Mitt, V. 65, N. 5, May 1972, pp. 211-14. (In Gennan).
374) The Design of Cross-Flow Cooling Towers and Ammonia Stripping Towers Wnek, W. J.; Snow, R. H. Ind. Eng. Chern. Process Des Dev., V. 11, N. 3, July 1972), pp. 343-49.
375) Cooling Tower Plume Abatement Marley Co.; Hall, W. A.; Atlantic Richfield Co. Chern. Eng. Progr., V. 67, N. 7, July 1971, pp. 52-54',
376) Cooling Towers Boost Water Reuse Axsom, J. Environ. Sci. Technol., V. 5, N. 3, Mar. 1971, pp. 204-6.
377) Mechanical-Draught Cooling Towers Kunesch, A. M. lnst. Chern. Eng. London + Southeast Br. 'Ind. Cooling' Symp. (Dec. 10, 1970). Chern. Eng. (London), N. 253, Sept. 1971, pp. 337-42.
378) Salt-Water Cooling Tower Enjay Chemical Co.; Nester, D. M. Chern. Eng. Progr., V. 67, N. 7, July 1971, pp. 49-51.
379) The 'Uhermal and Functional Design of Natural-Draught Cooling Towers Hawkins, P. Inst. Chern. Eng. London + Southeast Br. 'Ind. Cooling' Symp (Dec. 10, 1970) Chern. Eng. (London), N. 253, Sept. 1971, pp. 328-33.
380) The Aerodynamic Resistance of Cooling Towers Konikowski, T.;Zembaty, W. Brennst.-Waerrne-Kraft, V. 23, N. 10, Oct. 1971, pp. 441-45.

332 COOLING TOWERS
381) Evaluation of Cooling Tower Tests Hiecke, R. Chern. Tech. (Leipzig), V. 23, N. 2, Feb. 1971, pp. 76-83.
382) Design of Cross-Flow Cooling Towers and Ammonia Stripping Towers Snow, R. H.;Wnek, W. J. Res. Results Servo Ms. (Manuscript), ACS Single Article Announce N. 4 (Feb. 26, 1971), N. 70-482, 28 p.
383) Internal Design of Cells for Cooling Towers Campbell, J. C;. 68th AIChE Nat. Meet., (Houston Feb. 28-Mar. 4,1971) Program Pap. N. 70B.
384) (Noise from Cooling Towers of Various Designs) Bublitz, D. Ver Deut Ing-Deut Phys Ges. 'Acoust & Vibration Technol'Mtg. (Berlin Sept. 16-18, 1970). (In German).
385) Natural Draft Cooling Towers Stenning, A. H.; Furzer, I. Ind. Eng. Chern. Process Des Develop., V. 8, N. 4, Oct. 1969, p. 599.
386) Mechanical Draught Cooling Towers Hill, G. B. Chern. Process Eng. Heat Transfer Surv., Aug. 1969, pp. 36-40.
387) Trends in Cooling Tower Construction Castleberry, J. R. Mater Protect, V. 8, N. 3, Mar. 1969, pp. 67-70.
388) Critical Considerations Regarding the Design of Cooling Towers, Taking Account of the Enthalpy Difference Alic, V. Hung. Sci. Machine Constr. Ass. Mtg., (Budapest Apr. 9-12,1968) (Ger. Abstr.).
389) Cooling Towers-3. Application of Air-Cooled Heat Exchangers Smith, E. G. AIChE Water Comm. Workshop; (Houston Apr. 24-25,1969), AIChE Ind. Process Des Water Pollut. Contr. Workshop Proc., V. 2, 1970, pp. 82-84.
390) Cooling Towers-I. Design of Cooling Towers Circulating Brackish Waters Deflon, J. G. AIChE Water Comm. Workshop, (Houston Apr. 24-25, 1969) AIChE Ind. Process Des Water Pollut. Contr. Workshop Proc., V. 2, 1970, pp. 69-73.
COOLING TOWER LITERATURE 333
391) Factors to Consider in Selecting a Cooling Tower Demonbrun, J. R. Chern. Eng., V. 75, N. 19, Sept. 9, 1968, pp. 106-16.
392) Cross Flow Cooling Tower Analysed Vouyoucalos, S. Brit. Chern. Eng., V. 13, N., July 1968, pp. 1004-6.
393) Productivity Costimating-43. What is Cost of Cooling Towers Nelson, W. L. Oil Gas J., V. 65, N. 47, Nov. 20, 1967, pp. 182, 187.
394) (The Design of Cooling Towers) Maschinenfabrik Ba1cke-Bochum; Spangenmacher, K. 2nd Intern. Heat Eng. Cant. (Karl-Marx-Stadt. E. Ger. Sept. 26-29, 1966).
395) Research into Evaporative Cooling in Cooling Towers Berman, L. D. 2nd Intern. Heat Eng. Canf. (Karl-Marx-Stadt E. Ger. Sept. 26-29, 1966) (Abstr.).
396) Costlier Cooling Towers Require a New Approach to Water-Systems Design Paige, P. M. .' Chern. Eng., V. 74, N. 14, July 3,1967, pp. 93-96, 98.
397) (A Review of Design Methods for Cooling Towers) Alic, F. 2nd Chisa Intern. Congr. (Marianske Lazne Sept. 12-19, 1965) Kern Ind. (Zagreb), V. 7-425 (1966) Brit. Chern. Eng., V. 11, N. 10, Oct. 1966, p. 1237.
398) (A New Design Method for Cooling Towers) Singham, J. R.; Spalding, D. B. 2nd Chisa Intern. Congr. (MarianskeLazne Sept. 12-19, 1965) Brit. Chern. Eng., V.11,N.10,Oct. 1966,p. 1237.

This page intentionally left blank

Abel, J. F. 284,286,296 Abiru, H. 267 Abu-Sitta, S. H. 292,293,294,298,
301,304 Ahlgren, R. M. 312 Alic, V. 332,333 Aliev, N. D. 317 Allman, W. B. 283 Andeen, B. R. 316 Aramaki, M. 285 Armitt, J. 287 Askew, A. C., Jr. 328 Axsom, I. 331 Aynsley, E. 320
Baden, F. 162 Baechler, R. H. 327 Baker, D. R. 321,328 Balcer, J. M. 292 Baker, K. G. 325 Bandel, H. 296 Barber, F. R. 291 Barbu, V. 323,325 Barile, R. G. 330 Barry, R. E. 290 Bartlit, J. R. 314,315 Bartz, J. A. ,85 Bauer, R. Q. 162 Bearden, M. D. 314 Beecher, J. S. 310 Benenati, S. 282 Berliner, P. 288,295,300 Berman, L. D. 314,333 Berman, P. A. 292 Bettelheim, J. 306 Bhatti, M. S. 310 Bhumralkar, C. M. 274
AUTHOR INDEX
Billings, R. W. 324 Billington, D. P. 284,286,296 Bird, J. L. 328 Bird, R. B. 58,123 Bischof, A. E. 319 Blake, M. P. 327 Blanck, D. 331 Bodas, J. 297 Boehm, A. H. 322 Boehm, O. 318 Boies, D. B. 288 ; Boresi, A. P. 297 Boyack, B. E. 290 Brooke, J. M. 261 Br'own, C. W. 328 Brown, D. A. 276,319 Bruckenstein, S. 277 Bruegging, J. J. 303 Bublitz, D. 332 Buchert, K. P. 296 Buck, M. 307 Burger, R. 11,264,266,276,312,329 Burgmann, F. 318 Butler,P.318 Buxmann, J. 329
Cabral, B. F. 162,315 Campbell, J. C. 311,326,332 Caplan, F. 313,314 Carlson, T. B. 295 Carrasquel, S. 311 Castleberry, J. R. 332 Cecil, L. K. 321 Chan, A. S. L. 267,271 Chan, J. 270 Changnon, S. A., Jr. 318 Chatfield, D. L. 305
335
336 COOLING TOWERS
Chaturvedi, S. 269 Cheng,M.·S.275,279,311 Cheremisinoff, N. P. 11,58,183 Cheremisinoff, P. N. 11,123,162,183 Chian, E. S. K. 312 Chiarioni, M. G. 315 Chilton, T. H. 34,58 Christiansen, P. B. 301 Christopher, P. J. 300 Chu, Y. H. 280 Clarke, D. G. 305 Clessuras, G. J. 292 Cohen, E. W. 304 Colbaugh, W. C. 319 Cole, P. P. 284 Comeaux, R. V. 327 Cooper, J. W. 214 Cooper, K. W. 265,268 Crits,G.J.284 Croley, T. E. 259,268,275,279,285 Croll, J. G. A. 265,278 Csanady, G. T. 319
Dabrowski, H. J. 2,77 Davenport, A. G. ,+98,304 Davis, C. 322 Davis, D. S. 325 Davis, E. J. 58 Decker, F. W. 319 Deflon, J. G. 301,332 Delaunay, J. 308 Demonbrun, J. R. 333 Dengler, J. L. 330 Dickinson, D. R. 291 Dicmas, J. J. 263 Distler, H. 326 Diver, M. 268,269,303 Doganoff, I. 327 Doise, A. G. 296 Dolan, N. E. 162,285 Dolhec, A. C. 292 Downing, D. G. 325 Drew, H. 321 Dropkin, D. 34 Duffey, J. G. 277
Egberongbe, S. A. 296 Elgawhary, A. W. 276,329 Elkin, H. F. 326 Engman, W. G. 328 Erth, R. A. 268
Fang, H. H. P. 312 Farrell, C. 272,274,311 Feitler, H. 323 Fischer, P. 314 Fisher, H. D. 286 Fitzgerald, J. 280 Fleischman, M. 312 Forbes, M. C. 325 Forgo, L. 281 Fornesi, R. 263 Forster, L. L. 270 Forster, V. T. 300 Fosberg, T. M. 317 Foster, P. M. 291,306 Franco, R. J. 308,310 Frankenberg, T. T. 320 Frey, G. R. 281 Friar, F. 330 Fukuda, S. 285 Furlong, D. A. 292,316 Furzer, I. A. 294,315,323,327,332
Gale, S. B. 277 Gardner, B. R. 273,292 Garton, R. R. 318 Geiss, H. 162 Ghosh, M. K. 324 Giaquinta, A. R. 259,268 Gilliland, E. R. 58 Gindler, B. J. 322 Giras, T. C. 292 Glater,J.321 Glicksman, L. R. 290,316 Glover, G. 284,323 Golay, M. W. 270 Goldstein, P. 319 Gorton, R. L. 289 Gottzmann, C. E. 85 Grier,J.C.265 Griffin, R. W. 316 Guild, D. A. 262 Gupta, A. K. 278,289 Gurfinkel, G. 296,299 Guven, O. 272,274,311 Guzy, J. G. 58
Haellgren, K. 308 Haeussler, W. 328 Haggerty, D. 275 Hall, W. A. 320,331 Hallett, G. E. 285,314,315 Hammill, M. P. 317
Hanna, J. P. 267 Hansen, E. P. 289 Harris, T. G., III 261 Hart, J. A. 317,318 Harting, P. E. 308 Haschke, D. 162 Hashish, M. G. 292,294,301 Hatch, G. B. 327 Hawkins, P. 331 Hayashi, Y. 282,317,320,329,331 Hays, T. C. 292 Henley, E. J. 34 Henning, H. 329 Henriet, P. 315 Herberholz, P. 259 Hertwig, T. A. 330 Herzos, M. 285 Hess, H. 327 Hewitt, W. L. 295 Hiecke, R. 332 Hill, G. B. 287,332 Hilpert, R. 161 Hirnmelblau, D. M. 34,58 Hirai, E. 282,317,320,329,331 Hofmann, P. 262 Holburt, M. B. 322 Holder, D. W. 266 Hollands, K. G. T. 316 Holzhauer, R. 11 Holzhueter, E. 271 Hosler, C. L. 320 Hougen, O. A. 58 Hsu, T.-D. 259 Huang, C. H. 281 Huff, F. A. 318 Hundernann, A. S. 264
Ibrahim, S. H. 329 Inazumi, H. 283,330 Iorga, D. 323 Isyumov, N. 298 Ito, N. 329 Ivins, V. S. 85
Jablonka, G. E. 85 Jadaneantu, M. 323 Jarvis, T. J. 260 Jaske, R. T. 302,321 Johnson, B. M. 291 Johnson, D. A. 269,313 Jones, T. V. 266
AUTHOR INDEX 337
Jones, W. J. 324 Jordan, D. R. 273,314
Kageyama, S. 283,330 Kast, W. 312 Kaye, S. 328 Kearney, D. W. 290 Keith, G. M. 325 Kelly, B. J. 327 Kelly, G. M. 283,330 Kelp, F. 298 Kamp, K. O. 265,278 Kern, D. Q. 58,123,161 Kershah, R. M. 283 Keyes, R. E. 297 Keys, C. 307 Kiopekly, G. 313 Klein, E. 276,316 Klein, G. 260 Klen, E. F. 265,269,313 Klenke, W. 310,317 Knopf, M. 295 Knudsen, J. G. 262,305,310 Knuesch, T. 11 Kohloss, F. H. 303 Kolflat, T. D. 11,85,293 Konikowski, T. 331 Kraetzig, W. B. 303 Krippene, B. C. 292 Krishna, R. G. V. 302 Kubal, D. 85 Kuehmsted, A. M. 320 Kumnick, L. R. 326 Kunesch, A. M. 331 Kuong, J. F. 322 Kyte, W. S. 306
Lague, J. S. 280 Lane, R. W. 317,324 Lanshaar, H. L. 297,303 Larinoff, M. W. 85,270,278,289 Larrabee, R. D. 286 Ledbetter, J. 302,319 Lee, J. W. 199 Lee, S. H. 262 Lefevre, M. 270,275 Lemrnens, P. 261 Lendvai-Lintner, E. 310 Leonard, J. W. 296 Leung,P.319,320 Levin, J. E. 288
338 COOLING TOWERS
Lichtenstein, J. 85 161 Lightfoot, E. N. 58,123 Limbird, A. G. 281 Lopez, P. R. 296 Lowe, H. J. 292
Macaluso, C. A. 319 Maisch, F. 274 Mapstone, G. E. 327 Margetts, M. J. 315 Martin, A. 29 Matson, J. V. 261 May, P. D. 276,316 Maze, R. W. 11,316,327 McAdams, W. H. 123 McCabe, W. L. 34,58 McChesney, H. R. 266 McConomy, T. A. 327 McDowell, D: W., Jr. 161 McGraw, M. G. 11 McHale, C. E. 85 McIlhenny, W. F. 273,314 McMackin, G. E. 292 Merkel, F. 123 ' Mesarovic, M. M.,296 Meystar, J. 265 Micheletti, W. C. 307 Mikol, W. W. 292 Miksad, R. W. 264 Mikyska, L. 324,327 Miles, H. B., III 276 Miliaras, E. 319 Miller, R. E. 303 Mirsky, G. R. 261 Mirza, S. 296 Misod, A. 271 Mitchell, S. W. W. 85 Mohler,E.F.,Jr. 326 Monjoie, M. 272 Monroe, R. C. 263,292,305 Moore, F. K. 298,313,330 Moore, R. E. 300,319,320 Moran, D. 315 Morgenweck, F. E. 323 Morse, R. W. 310 Morton, V. M. 291 Moses, R. J. 322 Moy, H. C. 277 Mueller, R. K. 296 Mungan, I. 260 Mussalli, U. G. 262
Nahavandi, A. N. 283 Nair, S. R. 318 Nakao, Y. 267 Narayanan, R. 278 Nash, W. A. 296 Negru, D. 323 Nelson, J. A. 325 Nelson, W. L. 333 Nester, D. B. 321 Nicoli, L. G. 302 Nielsen, H. J. 320 Niemann, H. J. 260 Noblett, J. G. 307
Oancea, N. D. 295,323,324 Oda, M. 285 Okubo, M. 317,331 Oleson, K. A. 85,322 O'Neill, P. S. 85 Ovard, J. C. 318,321 Owens, D. L. 325
Paige, P. M. 333 Pana, P. 295 Parekh, M. 123 Park, J. E. 263,321 Patel, K. N. 294 Patel, V. C. 268,272,275,279,311 Paterson, A. C. 268 Paul, G. T. 266 Perrinjaquet, M. 162 Perry, R. H. 34 Peterman, W. A. 281 Peters, H. L. 303 Petrillo, J. L. 320 Phelps,P.M.287,300,311,321330 Pinheiro, G. 292 ' Pludek, V. R. 199 Pommer, E. H. 326 Porter, R. W. 269 Prasad, A. 280 Printz, J. 325 Puckorius, P. R. 199 Pyle,D.S.313
Quast, U. 312
Rabb, A. 324 Ramsdell, R. G., Jr. 292 Rao, K. S. 280 Ratcliff, M. A. 264 Reed, C. E. 161
Reed, D. T. 269 Reinisch, R. 327 Reinschmidt, K. F. 278 Reisman, J. I. 285,318 Resch, G. 318 Reverberi, A. 315 Rish, R. F. 286,320 Ritter,R.B.314 Robertson, M. W. 290 Robitaille, D. R. 311 ,313 Roffman, A. 214 Rogers, P. 299 Roma, C. 292 Rossie, J. P. 322 Russell, C. M. B. 266
Sanchez, A. J. 294 Savery, C. W. 312,317 Sawyer, R. A. 287 Schieber, J. R. 319 Schnob rich, W. C. 296 Schrecker, G. O. 262 Schrock, V. E. 280,329 Schubert, M. 327 Schultz, M. 308 Schultz, S. L. 259 Seiderer, S. 295 Septhon, H. H. 260 Serico, B. J. 283 Seward, R. B. 267 Sheef, T. J. 85 Shell, G. L. 270 Shema,B.F.327 Sherwood, P. W. 325 Sherwood, T. K. 58,123,161 Shieh, W. Y. J. 293 Shofner, F. 295,315,321 Shoji, I. 285 Siebert, O. 328 Siekmann, H. 271 Simmonds, S. H. 296 Silvestri, G. J. 85 Simpson, W. M. 123 Singer, I. A. 320 Singh, M. P. 278 Singham, J. R. 333 Sloan, L. 327 Sloat, S. S. 307 Smith, E. C. 85,278 Smith, E. G. 332 Smith, J. C. 34,58
AUTHOR INDEX 339
Smith, J. K. 316 Smith, M. E. 320 Smith, R. M. 326 Snow,R.H. 299~31~32 Sobel, N. 272 Sockham, J. 319 Song, P. 328 Soo, S. L. 279 Spalding, D. B. 333 Spangemacher, K. 316,326 Spurr, G. 292 Staffin, H. K. 34 Staudt, W. 297 Stenning, A. H. 332 Stewart, B. F. 322 Stewart,W. E. 58,123 Story, M. 305 Strauss, S. 161,183 Streeton, D. F. 305 Suitor, J. W. 314 Sussman, S. 314,330
Taft,E.P.262 Tanis, J. N. 307 , Terry, S. L. 327 ' Thomas, C. O. 321 Tichenor, B. A. 304 Ting, H. T. 316 Townsend, C. R. 323 Trautenberg, G. A. 328 Treybal, R. E. 34,58 Troscinski, E. S. 162 Tsai, Y. J. 281
Uchiyama, T. 272,311
Vance, J. M. 263,321 Van Der Walt, N . .r. 85 Van Wie, N. H. 263 Veazey, J. A. 261,308 Veldhuizen, H. 302,319 Vellozzi, J. W. 296 Vermeulen, T. 260 Veronda, D. R. 282 Viehweg, H. 327 Vladea, I. 288,323,324,325,326 Vodicka, V. 214,274,329 Vogt,K.J.162 Vojislav, A. 331 Von Allmen, F. 312 von Cleve, H. H. 279,313
340 COOLING TOWERS
von Wolfersdorff, W. D. B. 317 Vouyoucalos, S. 333
Walser, A. 296,299 Walston, K. R. 314 Walther, J. 264 Ward, R. 316 Watanabe, Y. 295 Watson, R. G. 162 Wearmouth, J. W. 266 Weast, R. C. 34 Webb, R. L. 290 Webb, R. O. 262 Webster, D. J. 85 Weder, B. 295 Weingarten, V. I. 282 Wendt, R. C. 270 West, L. A. 85 Westbrook, G. 272,273 Weyland, R. V. 326 Whillier, A. 271,294,298 Wigley, S. 311 Wilber, K. R. 315 Wilde, K. A. 307 Willa, J. L. 327,328
Williams, M. D. 314,315 Winchester, J. W. 324 Winiarski, L. D. 304 Wirth, L., Jf. 272 Witt, P. A. 302 Wnek, W. J. 299,331,332 Woelfel, R. 264 Wolf, J.P. 267 Wolfson, L. L. 328 Wrinkle, R. B. 321 Wykowski, J. C. 308
Yabe, K. 330 Yamamoto, D. 330 Yaninter, S. A. 306 Yao, S. C. 280,329 Yaworsky, Y. J. 292 Yeh, C. 293,299 Young, R. A. 123,162,183
Zecher, D. C. 323 Zembaty, W. 331 Zemenek, J. 313 Zerna, W. 260 Ziegenhorn, R. D. 324
-------------~---~---
abstracts 259 acceptance testing 5 access 175 acetone in water 47 aco ustical aspects 318 adiabatic humidification 92 aerodynamic design 280,329 agricultural wastewater 260 air
-cooled cooling tower 297 humidity 145,311 inlet 5 movers 9 pollution 154 rate 127 saturation process 44 side design 287,330 vapor dynamics 269 -water mixtures 115 -water system 13
airborne contaminants 186 algal growth 326 alkalinity 194,310 ambient dry-bulb temperature 5 ambient wet-bulb temperature 5 American Power Conference
Proceegings 292 ammonia 83
stripping 299,332 analysis of hyperboloids 302 annual fixed charges 181 application 303 approach 107
to the wet-bulb 5 Arnold diffusion cell 55 asbestos fill packing 6 assisted-draught cooling tower 273
SUBJECT INDEX
atmospheric conditions 134 atmospheric effects 280 atmospheric precipitation 259 atmospheric spray tower 59,60,61 automation 313
baffles 88 Baltimore Aircoil Co, 77,79 basin design 330 bids evaluation 179 bifurcation results ',284 biological effects 3·18 biologically treated wastewater 308 black box technique 39 blowdown 5,146,149,261,284,288,
301,311,312,313,314,317,318, 319,323,324,327,330
blowthrough tower 76 boiler blowdown 319 brackish water 262,301,333 brine concentration 272 buckling of cooling-tower shells 284
cable manufacture 282 calcium carbonate 'scale 187 calcium sulfate 321
solubility 313 calculation of city water/sewer tax
costs 182 capability penalties 181 capacity 5,300,321,325 capital costs 182 capital investment 181 caprolactum recovery 313 carbonate hardness 194 Camot cycle 315 casing 5
341

342 COOLING TOWERS
cell 6 cellular film 6 centrifugal fan 166 characteristic curves 129 chemical composition 149 chemical passivation 189 chemical treating agents 197,319 chilling systems 268 chlorine 193 chromate 277,317,323
removal 267,276 chrome treatment 307 circuit design 266 circula ting pumps 163 circulation rate 146 classification of cooling towers 59 Clausius-Clapeyron equation 15 climate 305
modification 324 climatic influences 296 climatological data 131 cocurrent crossflow 282 coil shed towers 59,63,65 collapse 278 , combined wet/dry pooling 274 combustible construction 153 computer 323,327
code 296 model 307,311 simulation 274,316 test data 321
concentration cycles 6 concen tra tion gradient 47 concrete cooling tower maintenance
316 condensation 45 configurations 59 constants for heat capacity 23 construction 260 control system 323 convection 152 conversion factors 225 cooling tower
classifications 59 fill arrangements 90 market 2 operation 4,94 requisition 169,265 selection 134 subclassifications 59
Cooling Tower Institute 6,284,330 cooling water makeup 149
corrosion 186,310,311,313,323 control 188 detection 190
corrugated plate packing 313 cost 181,302,322,323,333
analysis 305 countercurrent cooling tower opera
tion 97,110 counterflow 6,69,321
tower 62,283,312,316 critical temperature 13 crossflow 6,69,283,318,320
mechanical draft towers 73 tower 63,299,308,317 tower cooling diagram 127
data required with bids 176 decay of timber 326 deck-filled towers 59,62 deck-stacks 174 defini tions in thermodynamics 18 degrees of superheat 15 delta temperature 6 design 260,264,269,276,281,283,
287,295,327,330,333 conditions, 6 considerations 82,108 elemen ts 73,74 overview 8 parameters 110 performance 178,268 practices 125,270 principles 87
dew point 25 diffusion 134
calc ula tio ns 111 (redistribution) deck 6,44,46,47 units 113
diffusional heat transfer 87 direct-contact transfer 43 direct dry-type cooling tower 80 discharge of cooling water 261 displacement analyses 267 distribution system 6,70,173,178 downwind measurements 262 draft 68 drawings and performance curves
179 drift 6,146,262,315
deposition model 264
eliminator 6,173,270,276,280, 329
measurement 321 drive shafts 167
and couplings 178 droplet measurements 291 droplet sampling devices 291 dry and wet recooling 295 dry bulb temperature 25 dry cooling 82,83,289,300,306,320,
324 towers 79,81,266,290
dry towers 289 dry-wet mechanical-draft cooling
tower 145,275,279,311 dynamic plume model 280
earthquake 298 design 304
ecological aspects 319 economic 183,259,268,275,316,322,
325,328 considera tions 181
effectiveness coefficient 135 efficiency 135,306 effluent 307,318
reduction 273 electric power plants 290 electrochemical removal 277 electrodialysis 273
water recovery 272 empirical approach to tower sizing
136 energy 280,310,312,313,315
and material balances 39 balance 35,36,37,96 penalties 1 81
enthalpies and humidities 115 enthalpy 20,38
changes 22,23 differenc~ 332 temperature diagram 126,133 transfer coefficients 317,320 values 24
environmental aspects 318 environmental conditions 157 environmental effects 290 environmental impact assessment
314,315 environmental problems 292 equilibrium curves 102,116
SUBJECT INDEX 343
equilibrium pressure 13 evaluation parameters 283 evaporation 108,321
coefficient 317 losses 283,316 water cooling 263,317
exhaust air 144 experimental cooling tower 286 extensive property 19
factory-assembled towers 74,75 fan 165,177,292,313
-assisted hyperbolic towers 75,77 configuration 167 system efficiencies 263,305
fill 89,172 arrangements 70,90 bypass 209,210 material 65 packing 7 packing factors 137 water distribution 212 zoning subsystem 211
film coefficients 317 packing 70,71 surface 88
fire hazard 1 53 first law of thermodynamics 38 fish protection 262 flexible coupled shaft 175 flow 89
allocations 210 variance 108
flowsheets 168,170 flue gas 154
washing 306 fluidized bed 316 fluidized turbulent bed contactor
309 fog 7,311,318,319
control 302 formation 143
forced draft 76,271,291 flow 295
fouling 43 measurement techniques 314
framework 172 freezing weather 142 friction factor 52 fungi 328
344 COOLING TOWERS
gas absorption 88 cooler 150 cooling operations 150,151 laws 16 -liquid contacting 87
gear reducers 167,174,178 geometric imperfections 278 geometries 67 graphical methods 283 ground
area 132,136 concentration 154,157 fog 145
guarantee 175 gust factors 278
hardware 174 heat 19
absorbed 105 and mass transfer 312,317 and mass transfer analogies
44,314 and moisture dissipation 281 balance 141' capacity 21 capacity curves 22 exchanger 43,281 exchanger design 43 load 7,127 load determination 104 of vaporization 24 rejection fluid 83 316 sink 3 ' transfer 35,68,314,315 transfer coefficient 45 transfer surface 305
Henry's law 51 high-impact polyethylene 200 historical developments 2 humid heat 26 humidification characteristics 112 humidity 91
charts 29,31,91 humid volume 26,29 hybrid cooling system 259 hydrogen evaluation 190 hyperbolic cooling towers 2 66 69
75,278,285,292,293,294,298, 299,301,304,320
hyperbolic natural-draft tower 61
hyperboloidal cooling tower 303 hyperboloidal shells 282
ice control 211 damage 207 formation 318 prevention 209 211
.. prevention syst;m de'sign 207 lCIng 142 immersion heater 143 induced draft 7 industrial water cooling 315 inhibitors 191 installation 138 instrumentation 168 integration procedures 113 ~nternal energy 20,36 mternal flow characteristics 266 inversion 157 ion exchanger 267276316 isothermal conditi;ns 44
kinetic energy 20,36
L:G ratio 126,134,135 lab cooling tower 324 laboratory simulation 272 Lake Michigan basin 324 Langelier and Ryznar equation 191 large cooling towers 268 latent heat effects 320 latent heat of vaporization 7 legal aspects 322 Legionnaire's disease 193 Lewis number 53,101,150
correlation 151,314 rela tionship 52
liquid drop type 317 film resistance 112 113 loading 323 '
literature 259 location of the tower 138 louvers 7,173 low heat load 210
maintenance 320 makeup 7,313,314
requirements 148 mass and heat transfer 297 mass transfer 35
coefficient 45,51 packing 296 theory 46
material 176 and coatings 325 and design 172 and energy balances 40
mechanical components 163 mechanical-draft cooling towers 59,
60,70,73,76,285,318 performance 142
mechanical equipment 174 membrane processes 321 meridional imperfections 265 meteorological parameters 281 meteorology 292 methods of calculation 297 mist-free operation 308 mode superposition 267 model 263
measurements 325 of natural draft cooling 304
modeling 312 molal absolute humidity 28 molar flux expression 51 molar heat of evolution 27 Mollier I-X diagram 328 motors 174,177 multicell mechanical-draft towers
145 multistage arrangement 298
natural-draft cooling towers 59,60, 65,78,269,275,281,323,324
natural-draft indirect-contact cooling towers 259
net effective volume 7 noise 166,114,261,322 noncarbonate hardness 194 nonlinear dynamic analysis 299 normal boiling point 14 nozzles 9 number of transfer units 52
operating costs 82,181,182 diagram 102
SUBJECT INDEX 345
line 116 principles 3 problems 287
operation 125,288 and maintenance 181
optimization 283 organic growths 186,192 outside installation 138 overpressure 261,308
packing coefficien ts 108 height specifications 112 material 88,112
partial saturation 17 particulate instrumentation 295 particulate sampler 315 partitions 173 passivation 189 performance 7,127,175,264,270,
271,279,289,309 curve 7,180,285,314,315 range 263 requirements 136
periodic cooling towers 290 pH 327 phosphate 198 phosphonates 307 plastic chemical resistance chart 201 plastic converting 295 plastic cooling towers 198,199,322,
324 plenum 7 p~ume 7,154,155,294,316,319,320,
325 abatement 331 and atmospheric air 143 behavior 281,290 control 285
pollutant discharge 277 pollution 269,324
control 325 pond systems 289 potential energy 20,36 power generating plants 291 power plants 275,277,289,290,298,
319,324 application 270 cooling 260,301 cooling towers 261
346 COOLING TOWERS
design 289 installation 68
power spray cooling 279 precipitation 318 pressure-temperature diagram 14 pretreatment of cooling water
systems 188 pretreatment procedures 190 preven tion of scale formation 188 Proceedings of the Conference on
Tower Shaped Structures 303 process conditions '130,133 process control 323 propeller fan 165 psychrometer 7 psychrometric chart 29,30,91,144 pump 163
intakes 263 pumping head 8 pumping systems 271 purchasing specifications 158 purge 5
radial air distribution 315 range 8 .
and gpm 107 variance 108
rating chart 130 recirculation 8,140
factors 321 problems 139 rates 149
recycling cooling 280,282 redwood fill 67 refinery cooling 307,316 refinery wastewater 317,326 reinforced concrete 327
chimneys 303 reinforced plastic mortar 311 reinforcing rings 267 relative humidity 144 reliability 181 reservoir operation 285 retention time 148 retrofit 264 reverse osmosis 312 rigid vinyl 326 ring water temperature 208 riparian law 322 riverwater cooling 316
rounded structures 272 rubber manufacturing 295
safety precautions 153 salinity and brine disposal 272 saltwater cooling towers 272,310,
314,321 saturated condition 16 saturated and stability index 191 scale formation 185,186 scaling 187,262,310 sealing 305 seawater cooling tower 285,314,317 sensible heat 3 service 311 sewer taxes savings 182 shape of cooling towers 278 sheeting 172 shell structures 296 size 298
factor with approach 109 sizing cooling towers 136 slime control 328 sodium molybdate 311,313 softening 261,269 source listing 259 specification guide 158 specific heat 22 speed reducers 167 spine-fin heat exchange 313 splash packing 70,71 splash zones 326 spray
cooling 269,270,276,324 system 312 technology 327
stability and dynamic analyses 293 stability class estimates 156 stack gases 156 staging 132 stainless steel 322 static pressure drop 8 steady-state conditions 39 steam
-electric power plants 322 sterilization 327 tables 215 turbine drives 324
Structural Models Conference 293 subclassifications of cooling towers
60
-- ----.~~~~~~~~~~~~~-~-----~~-
submergence depth pumps 164 sump 8 supporting columns 267 suspended matter 186,193
temperature gradient 108 temporary hardness 194 terminology 5 test procedures 5 testing 179 thermal cycle 319,320 thermal design 296 thermal efficiency 324 thermal loading 286 thermal performance 328,329 thermal pollution 1,322 thermal power plant 297 thermodynamics 259
models 279 thin-shell concrete 286 thin-shell finite element 271 topographical considerations 2 total dissolved solids 8 total hardness 194 tower
characteristics 127 coefficients 125 designs 77,136 orientation 140 packing 90 shells 260,264 sizing 113,136 specification 104
transfer rates 306 units 51
transport modeling 262 treatment of the lumber 173 trickle film 323,324 turbine 175,177
drive 300 turbulent diffusion 156 turbulent pllime zone 156 two-film theory 47
underground cooling towers 294,298
valves 168 vaporization process 14 vaporizing 310 vapor pressure 13
curve for water 14
SUBJECT INDEX 347
vapor system 13 vertical turbulence 155 vibration 175,286,287,301
analysis 267 viscoelastic cooling tower 297 vortex formation 164
wake and gust loading 287 wake formation 145 waste
disposal 316 heat 274,277,322 heat disposal 316 treatment 326
wastewater 318 effluent 312
water 262 analysis 194 chillers 265 consumption 149,314 contaminants 186 cost 182 distribution system 72 intakes 262 load 8 practices 293 ' rates 127 systems 307
. temperature 106 treatment 185,197,265
wet-bulb temperature 8,26,27,105, 106,130,132,287
determination 104 wet decking fill 277 wet-dry cooling tower 64,83,84,278,
279,285,290 wet-dry transfer 288 wet gas 15 wet peaking 270 wind 266,292,298,311
effects 260,329 friction 285 load 264,272,274,303 stresses 294 velocities 131
windage losses 146 winter operating modes 213 winter operation 141,207,315 wood 311,325
rot 328 work 19

MORE VALUABLE BOOKS
ENVIRONMENTAL POLLUTION AND CONTROLP. Aarne Vesilind
WATER TREATMENT PLANT DESIGN-Robert L. Sanks UNIT CONVERSIONS AND FORMULAS MANUAL-Nicholas P.
Cheremisinoff and Paul N. Cheremisinoff TREATMENT & DISPOSAL OF WASTEWATER SLUDGES
P. Aarne Vesilind RESOURCE RECOVERY PLANNING AND MANAGEMENT-Robert M.
Clark & James I. Gillean AUTOMATIC PROCESS CONTROL-Paul N. Cheremisinoff &
Harlan J. Perlis CHEMISTRY IN WATER REUSE-Vol. 1 & 2-William J. Cooper CHEMISTRY OF NATURAL WATERS-Samuel D. Faust & Osman M. Aly ORGANIC CHEMICALS MANUFACTURING HAZARDS-Alan S. Goldfarb ATMOSPHERIC POLLUTANTS IN NATURAL WATERS-
Steven J. Eisenreich . BIOGAS PRODUCTION AND UTILIZATION-Elizabeth C. Price &
Paul N. Cheremisinoff ECONOMIC ANALYSIS FOR FISHERIES MANAGEMENT PLANS
Lee G. Anderson COOLING TOWERS-Selection, Design & Practice-Nicholas P.
Cheremisinoff & Paul N. Cheremisinoff TRACE METALS IN THE ENVIRONMENT-Vol.1-6-lvan C. Smith
& Bonnie L. Carson FAST NEUTRON ACTIVATION ANALYSIS-John W. McKlveen SOLAR HEATING AND COOLING OF BUILDINGS-Richard S. Greeley ENVIRONMENTAL HEALTH CHEMISTRY-James D. McKinney ASBESTOS PARTICLE ATLAS-Walter C. McCrone CONTAMINANTS AND SEDIMENTS-Vol. 1 & 2-Robert A. Baker METHANE GENERATION & RECOVERY FROM LANDFILLS-EMCON
Associates COMPOST ENGINEERING PRINCIPLES AND PRACTICE-
R. Tim Haug ATMOSPHERIC SULFUR DEPOSITION-David S. Shriner SYNTHETIC FOSSIL FUEL TECHNOLOGY-K. E. Cowser PLASTIC-PACKED TRICKLING FILTERS-Erik Sarner SLUDGE-HEALTH RISKS OF LAND APPLICATION-Gabriel Bitton WASTEWATER ENGINEERING DESIGN FOR UNSEWERED AREAS-
Rein Laak
~tJ ANN ARBOR SCIENCE ~ PUBLISHERS INC TH[ BUTTERWORTH GROUP
ISBN 0-250-40407-9


