Cooperative Packet Recovery in Enterprise WLANs Mahanth Gowda Duke University Souvik Sen Hewlett Packard Laboratories Romit Roy Choudhury Duke University Sung-Ju Lee Hewlett Packard Laboratories Abstract —Cooperative packet recovery has been widely investigated in wireless networks, where corrupt copies of a packet are combined to recover the original packet. While previous work such as MRD (Multi Radio Diversity) and Soft apply combining to bits and bit-confidences, combining at the symbol level has been avoided. The reason is rooted in the prohibitive overhead of sharing raw symbol information between different APs of an enterprise WLAN. We present Epicenter that overcomes this constraint, and com- bines multiple copies of incorrectly received “symbols” to infer the actual transmitted symbol. Our core finding is that symbols need not be represented in full fidelity — coarse representation of symbols can preserve most of their diversity, while substantially lowering the overhead. We then develop a rate estimation algorithm that actually exploits symbol level combining. Our USRP/GNURadio testbed confirms the viability of our ideas, yielding 40% throughput gain over Soft, and 25-90% over 802.11. While the gains are modest, we believe that they are realistic, and available with minimal modifications to today’s EWLAN systems. I. INTRODUCTION Enterprise Wireless LANs (EWLANs) are composed of mul- tiple WiFi access points (APs) connected over a wired back- bone. When a client transmits a data packet to its associated AP, the broadcast nature of the wireless channel enables multiple other APs to overhear copies of this packet. In 2006, MRD [1] observed that when a reception fails at an AP, the retransmission of that packet is not always necessary. The packets overheard by other EWLAN APs can be forwarded to a common AP over the wired backbone, and these erroneous packets may be combined to recover the failed transmission. The core intuition is that the errors observed by each AP are likely to be diverse (due to diversity of link qualities), and hence, cooperative error recovery can be effective. While MRD showed that error correction can occur en- tirely at the MAC layer (using bit-level voting), later, Soft [2] demonstrated that physical layer (PHY) hints can be valuable to optimize MRD. Specifically, Soft showed that the PHY layer can estimate a confidence for every bit that it decodes, and this confidence should be leveraged to im- prove the combining process. While Soft attained consistent throughput gains over MRD, we believe additional gains are possible by combining packets at the PHY layer symbol level. The key insight is that PHY layer symbols capture the true diversity of the channel and combining them is more likely to yield the correct result. As an example, consider the scenario in Fig. 1(a), where a client has transmitted a symbol corresponding to the constellation point P 6 . The client’s associated AP did not receive this symbol correctly, Fig. 1. (a) The red circles depict the 4 copies of the corrupt symbols, received by 4 different APs. The expectation is that the (weighted) centroid of these symbols – denoted by the oval – falls in the box of the transmitted symbol (P 6 in this case). (b) Example of a higher density constellation – symbols represented by mapping to the closest point on this constellation. but has gathered 4 erroneous symbols from 4 different APs (including itself). Now, by computing some function on these symbols (e.g., centroid), and mapping the result (the black oval) to the nearest constellation point (P 6 ), the actual transmitted symbol can be recovered. If the same operation were to be performed on bits (by first mapping the 4 symbols to P 2 , P 3 , P 9 , and P 15 ), then some channel information would get lost early, resulting in higher decoding error. Symbol level combining is not a new idea and has been known for decades – maximal ratio combining (MRC) and its variants have extensively studied them in the past [3]. How- ever, these schemes are primarily confined to single devices with multiple antennas, where gathering the symbols from the antennas is trivial. Symbol combining in EWLANs has been far less explored, primarily because of its prohibitive bandwidth requirement [2], [4]. In other words, each AP will be required to forward its overheard symbols over the wired backbone; given each symbol in full fidelity is 4 bytes, they can easily overwhelm a Gbps Ethernet. This paper asks: what if symbols are forwarded at a coarser granularity to reduce overhead; will the diversity combining gains reduce dramatically when using such symbols? We find that the tradeoff between diversity combining and granularity favors practical systems, i.e., gains are modest even when the symbols are forwarded at coarse granularity. Fig. 1(b) shows one simple way of coarse-grained represen- tation – a 25 point constellation. When the APs map their received symbols to one of these constellation points and forward them to the common AP, diversity combining is noticeably better compared to a 16 point constellation. As we will see later, additional changes in the structure of the constellation can further improve the combining accuracy,
Transcript
Cooperative Packet Recovery in Enterprise WLANsMahanth GowdaDuke University
Souvik SenHewlett Packard Laboratories
Romit Roy ChoudhuryDuke University
Sung-Ju LeeHewlett Packard Laboratories
Abstract—Cooperative packet recovery has been widelyinvestigated in wireless networks, where corrupt copies ofa packet are combined to recover the original packet. Whileprevious work such as MRD (Multi Radio Diversity) and Softapply combining to bits and bit-confidences, combining atthe symbol level has been avoided. The reason is rooted inthe prohibitive overhead of sharing raw symbol informationbetween different APs of an enterprise WLAN.
We present Epicenter that overcomes this constraint, and com-bines multiple copies of incorrectly received “symbols” to inferthe actual transmitted symbol. Our core finding is that symbolsneed not be represented in full fidelity — coarse representation ofsymbols can preserve most of their diversity, while substantiallylowering the overhead. We then develop a rate estimationalgorithm that actually exploits symbol level combining. OurUSRP/GNURadio testbed confirms the viability of our ideas,yielding 40% throughput gain over Soft, and 25-90% over 802.11.While the gains are modest, we believe that they are realistic, andavailable with minimal modifications to today’s EWLAN systems.
I. INTRODUCTION
Enterprise Wireless LANs (EWLANs) are composed of mul-tiple WiFi access points (APs) connected over a wired back-bone. When a client transmits a data packet to its associatedAP, the broadcast nature of the wireless channel enablesmultiple other APs to overhear copies of this packet. In 2006,MRD [1] observed that when a reception fails at an AP, theretransmission of that packet is not always necessary. Thepackets overheard by other EWLAN APs can be forwarded toa common AP over the wired backbone, and these erroneouspackets may be combined to recover the failed transmission.The core intuition is that the errors observed by each AP arelikely to be diverse (due to diversity of link qualities), andhence, cooperative error recovery can be effective.
While MRD showed that error correction can occur en-tirely at the MAC layer (using bit-level voting), later, Soft[2] demonstrated that physical layer (PHY) hints can bevaluable to optimize MRD. Specifically, Soft showed that thePHY layer can estimate a confidence for every bit that itdecodes, and this confidence should be leveraged to im-prove the combining process. While Soft attained consistentthroughput gains over MRD, we believe additional gainsare possible by combining packets at the PHY layer symbollevel. The key insight is that PHY layer symbols capture thetrue diversity of the channel and combining them is morelikely to yield the correct result. As an example, considerthe scenario in Fig. 1(a), where a client has transmitteda symbol corresponding to the constellation point P6. Theclient’s associated AP did not receive this symbol correctly,
Fig. 1. (a) The red circles depict the 4 copies of the corrupt symbols,received by 4 different APs. The expectation is that the (weighted) centroidof these symbols – denoted by the oval – falls in the box of the transmittedsymbol (P6 in this case). (b) Example of a higher density constellation –symbols represented by mapping to the closest point on this constellation.
but has gathered 4 erroneous symbols from 4 different APs(including itself). Now, by computing some function onthese symbols (e.g., centroid), and mapping the result (theblack oval) to the nearest constellation point (P6), the actualtransmitted symbol can be recovered. If the same operationwere to be performed on bits (by first mapping the 4 symbolsto P2, P3, P9, and P15), then some channel informationwould get lost early, resulting in higher decoding error.Symbol level combining is not a new idea and has beenknown for decades – maximal ratio combining (MRC) and itsvariants have extensively studied them in the past [3]. How-ever, these schemes are primarily confined to single deviceswith multiple antennas, where gathering the symbols fromthe antennas is trivial. Symbol combining in EWLANs hasbeen far less explored, primarily because of its prohibitivebandwidth requirement [2], [4]. In other words, each AP willbe required to forward its overheard symbols over the wiredbackbone; given each symbol in full fidelity is 4 bytes, theycan easily overwhelm a Gbps Ethernet. This paper asks:what if symbols are forwarded at a coarser granularity toreduce overhead; will the diversity combining gains reducedramatically when using such symbols?
We find that the tradeoff between diversity combining andgranularity favors practical systems, i.e., gains are modesteven when the symbols are forwarded at coarse granularity.Fig. 1(b) shows one simple way of coarse-grained represen-tation – a 25 point constellation. When the APs map theirreceived symbols to one of these constellation points andforward them to the common AP, diversity combining isnoticeably better compared to a 16 point constellation. Aswe will see later, additional changes in the structure of theconstellation can further improve the combining accuracy,
making EWLANs amenable to cooperative packet recovery.
Of course, reducing the symbol overhead alone is not suf-ficient. Rate estimation in diversity combining systems hasassumed that received symbols follow a Gaussian distribu-tion. This property is no longer preserved if one uses, say,the 25 point constellation representation. Moreover, channelqualities at different APs are significantly different comparedto MRC where multiple antennas are on the same AP. Tothis end, Epicenter develops a rate selection algorithm thatcaptures the channel quality and virtually replays it acrossvarious modulation/decoding schemes to converge on theoptimal rate. Since the optimal algorithm proves to be CPUintensive, Epicenter designs a lookup heuristic that performsclose to the optimal.
Epicenter addresses additional questions such as (1) howmany symbols are best for combining, (2) which sym-bols should be discarded, and (3) how to mitigate in-terference. We implement Epicenter on a prototype ofUSRP/GNURadios and perform trace-based simulations. Weshow consistent gains for the upload scenario, and somebenefits in the download case as well. For example, an APneed not retransmit many times to a client – the clientcan cache prior corrupt packets and combine them withthe newly received packet to correct errors. The gains aremodest in general, and sizable when the channel quality isweak.
Our overall contributions are summarized as follows:(1) We identify the viability of symbol combining inEWLAN settings. The overhead of forwarding symbols overthe wire is alleviated by representing symbols on a modifiedconstellation.
(2) We design a rate estimation algorithm that exploitssymbol combining. The proposed algorithm is provablyoptimal; however, to reduce complexity, we propose a simpleyet effective heuristic.
(3) We implement and evaluate our system, Epicenter, on aUSRP/GNURadio testbed, and compare it against Soft and802.11. Results show Epicenter supports 1 to 2 notch higherbitrates than Soft for OFDM based WiFi networks, leadingto 1.2x −1.8x improvement in throughput. When comparedto 802.11 (which does not exploit cooperative combining),the improvements are naturally higher.
II. BACKGROUND AND OVERVIEW
We provide some background on PHY layer (de)modulationof symbols and (de)coding, followed by Epicenter’s overview.
A. Symbols and Bits
The PHY layer at the transmitter translates a string of bitsinto a string of symbols, a method called modulation, whereeach symbol represents one or more bits. These predefinedsymbols are represented as complex numbers and they canbe organized in a grid structure, called the constellationdiagram. Fig. 2(a) shows a 16QAM constellation diagram,
Fig. 2. Symbol constellation for 16QAM: (a) Each symbol corresponds to4 bits. (b) Symbols received after suffering channel-induced errors.
where each symbol represents 4 bits. If a packet contains thebit string, say “1011”, the transmitter uses the correspondingx and y axes values, also called < I ,Q > values, to regulatethe amplitudes and phases of the carrier signal [5], [6]. Thesignal is then transmitted by the radio hardware.When the signal arrives at the receiver, it applies a number ofoperations (such as synchronization, channel equalization,etc.), to recover the < I ,Q > values. However, since thechannel distorts the signal, the received < I ,Q > values aredispersed from the transmitted values (green points in Fig.2(b)). The receiver attempts to map these received I/Q valuesto the correct transmitted symbol, which is one of the 16constellation points in 16QAM. For this, it simply picks theclosest constellation point. If this constellation point is thesame as the transmitted symbol (corresponding to “1011”in this example), the transmission is successful; otherwise,it is corrupt. This overall process is called demodulation.
B. Epicenter: High Level Overview
Fig. 3 sketches the architectural overview of Epicenter. Awireless client in an EWLAN associates to a specific APas prescribed by 802.11. It then transmits a data packetat a rate selected by a rate control algorithm. This packetmight be overheard by a number of APs in the vicinity.These APs transfer the overheard < I ,Q > values over thewired backbone to the designated AP. To ensure that thedesignated AP can compute the CRC and send back theACK in real-time, the other APs forward the symbols inbatches, even before the client has completed transmission.The designated AP combines batches of symbols (detailedlater), and demodulates them into a string of bits. When allthe bits have been generated, they are passed through thedecoding algorithm for error correction. If the CRC passes,an ACK is transmitted back; otherwise the client retransmitsthe packet (potentially with suitable rate adjustments). Ofcourse, transmitting full precision < I ,Q > values could betoo voluminous to be sent over the Ethernet backbone –Epicenter must design for this constraint.
A natural question is should one care about upload trans-missions in EWLANs? We argue that upload traffic is increas-ing at a rapid pace due to a variety of factors, includingcloud computing, cloud storage, P2P file access, machine-to-machine traffic, video conferencing, online gaming, etc.
Fig. 3. Batches of (optimized) I/Q symbols transferred from different APsto the designated AP, which are in turn combined towards packet recovery.
In addition, mobile devices such as phones and tablets areequipped with a number of sensors (cameras, accelerom-eters, microphones, etc.), and they stream large quantitiesof data into the Internet [7]. Recent studies suggest rapidinflation in upload traffic in the next few years, warrantingreconsideration of traditional designs that favor download.
Of course, symbol combining may be applicable to downlinkscenarios as well. A client can cache packets from failedretransmissions and combine them, reducing the number ofretransmissions from the AP. This might be effective whencommunicating to clients at the edge of the transmissionrange, or when channel conditions are poor.
III. EPICENTER: SYSTEM DESIGN
We present the 3 building blocks underlying Epicenter,namely, (1) the symbol combining scheme, (2) low fidelitysymbol representation, and (3) rate selection.
A. Symbol Combining Scheme
A client’s transmission is composed of a sequence of sym-bols. The AP associated to this client receives these symbols,as well as multiple copies of each symbol forwarded byother APs. All these symbols are stored in a matrix whereinthe i th row corresponds to the i th AP, and the j th columncorresponds to the j th symbol in the packet. The AP’s taskis to combine the elements of each column in this matrix torecover the correct symbol (i.e., the one transmitted). A naïvecombining approach is the centroid algorithm. However,given that the symbols were overheard by different APs,each AP affected by diverse channel conditions, computinga basic centroid may not be ideal. Thus, Epicenter APsalso transmit their respective channel state information(CSI), which are then translated to weights for the centroidalgorithm. An AP with a strong channel – indicating higherconfidence in the position of the symbol – is weighed pro-portionally in the centroid algorithm. An AP that was weakor heavily interfered, could be ignored. The final centroidposition is mapped to the closest constellation point, andthe corresponding bits are extracted. In the example inFig. 1(a), symbol combining yields P6, which in 16Q AMcorresponds to bits “0111”.
B. Forwarding Symbols over Wire
If all APs were to communicate raw symbols for combining(32 bits per symbol), the bandwidth requirement wouldamount to several Gbps [2], [4]. On the other hand, com-bining at the bit level (e.g., 4 bits per symbol for 16QAM)reduces the bandwidth significantly, but also offsets thecombining gains. Our hypothesis is that there is a sweetspot in this tradeoff – symbols represented by just a fewmore bits can still offer most of the combining benefits. Thekey intuition is that every additional bit available to representsymbols, increases the constellation state space exponentially(e.g., 4 bits offer a 16 point constellation, 5 bits offer 32,and 6 bits offer 64). Representing in an exponentially denserconstellation implies more channel information retained,which ultimately results in better recovery.
To verify this, we designed an experiment to measure thedegradation in diversity combining when symbols are repre-sented with fewer bits. Our experiment includes AP positionsmimicking real deployments, and a client transmitting to anAP using 16QAM. We compare the following schemes:
Name Description802.11 does not perform combiningBit Level Combine (Bits) symbols represented by 4 bitsFull Fidelity Combine (Optimal) symbols represented by 32 bits25-point Const. (4+ Bits) symbols rep. by 4.6 bits on avg.36-point Const. (5+ Bits) symbols rep. by 5.4 bits on avg.
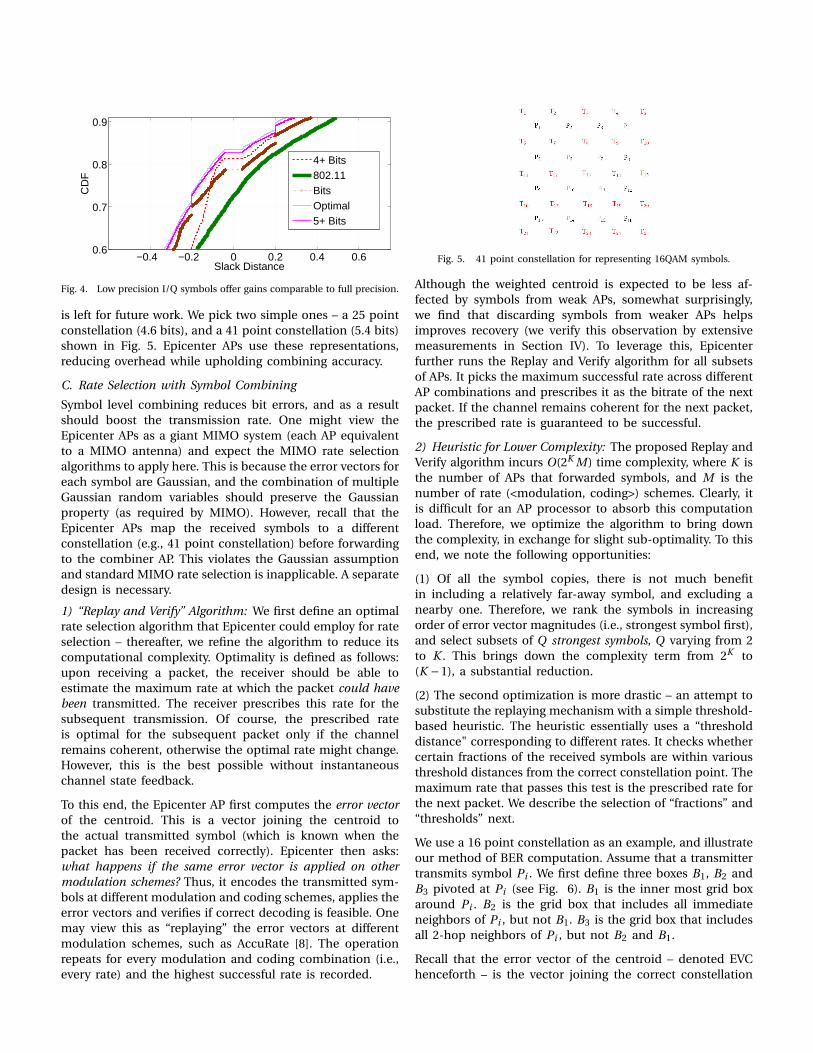
To quantify diversity combining (i.e., whether the centroidfalls in a good position), we use a metric called SlackDis-tance defined as: distance from the centroid to the correctconstellation point minus the distance from the centroid tothe closest incorrect constellation point. A negative SlackDis-tance indicates that the centroid will be demodulated cor-rectly; a positive SlackDistance indicates error. Fig. 4 showsthe distribution of SlackDistance – observe that Opti malmaintains a consistent gap over Bi t s, emphasizing the valuein symbol level combining. More importantly, we find that4+Bi t s makes 5% less symbol errors than Bi t s (see Y whenX=0), and 5+Bi t s is almost overlapping with Opti mal . Notethat 5% reduction in symbol errors can be significant – thedecoding algorithm can correct many more packets if errorsare lowered by 5%. Thus, Fig. 4 suggests that combiningsymbols is more effective than combining bits, so long as itis slightly more fine-grained than the latter.
A natural question is how can symbols be represented infractional bits such as 4.6 and 5.4?. We observe that this canbe achieved on average, if multiple symbols are representedtogether (e.g., 10 symbols represented by 46 bits). For this,a dictionary can be created for every permutation of the10 symbols, and the total number of permutations shouldprecisely be 246. This implies that each permutation is 46bits long, proving that the average number of bits per symbolis indeed 4.6. This form of representing symbols in blocksallows us fractional bits, which in turns helps us generateany constellation diagram for representing symbols. Theoptimal choice of the constellation is a study by itself, and
−0.4 −0.2 0 0.2 0.4 0.60.6
0.7
0.8
0.9
Slack Distance
CD
F
4+ Bits802.11BitsOptimal5+ Bits
Fig. 4. Low precision I/Q symbols offer gains comparable to full precision.
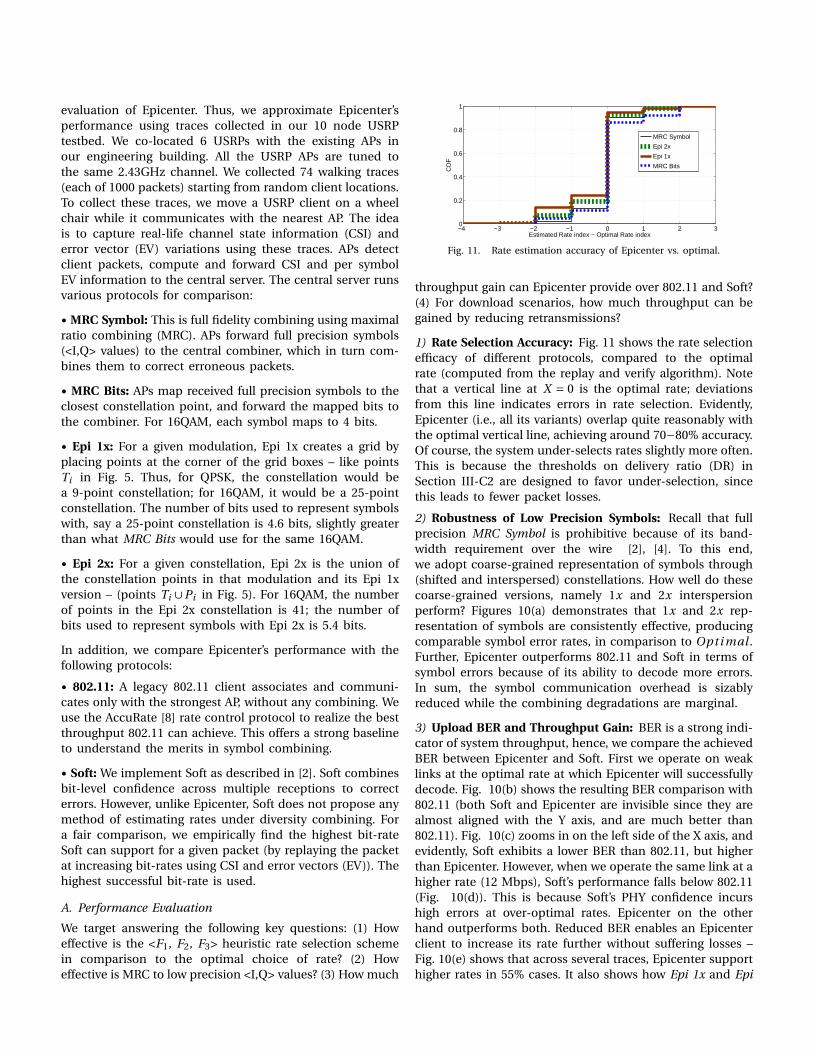
is left for future work. We pick two simple ones – a 25 pointconstellation (4.6 bits), and a 41 point constellation (5.4 bits)shown in Fig. 5. Epicenter APs use these representations,reducing overhead while upholding combining accuracy.
C. Rate Selection with Symbol Combining
Symbol level combining reduces bit errors, and as a resultshould boost the transmission rate. One might view theEpicenter APs as a giant MIMO system (each AP equivalentto a MIMO antenna) and expect the MIMO rate selectionalgorithms to apply here. This is because the error vectors foreach symbol are Gaussian, and the combination of multipleGaussian random variables should preserve the Gaussianproperty (as required by MIMO). However, recall that theEpicenter APs map the received symbols to a differentconstellation (e.g., 41 point constellation) before forwardingto the combiner AP. This violates the Gaussian assumptionand standard MIMO rate selection is inapplicable. A separatedesign is necessary.
1) “Replay and Verify” Algorithm: We first define an optimalrate selection algorithm that Epicenter could employ for rateselection – thereafter, we refine the algorithm to reduce itscomputational complexity. Optimality is defined as follows:upon receiving a packet, the receiver should be able toestimate the maximum rate at which the packet could havebeen transmitted. The receiver prescribes this rate for thesubsequent transmission. Of course, the prescribed rateis optimal for the subsequent packet only if the channelremains coherent, otherwise the optimal rate might change.However, this is the best possible without instantaneouschannel state feedback.
To this end, the Epicenter AP first computes the error vectorof the centroid. This is a vector joining the centroid tothe actual transmitted symbol (which is known when thepacket has been received correctly). Epicenter then asks:what happens if the same error vector is applied on othermodulation schemes? Thus, it encodes the transmitted sym-bols at different modulation and coding schemes, applies theerror vectors and verifies if correct decoding is feasible. Onemay view this as “replaying” the error vectors at differentmodulation schemes, such as AccuRate [8]. The operationrepeats for every modulation and coding combination (i.e.,every rate) and the highest successful rate is recorded.
Fig. 5. 41 point constellation for representing 16QAM symbols.
Although the weighted centroid is expected to be less af-fected by symbols from weak APs, somewhat surprisingly,we find that discarding symbols from weaker APs helpsimproves recovery (we verify this observation by extensivemeasurements in Section IV). To leverage this, Epicenterfurther runs the Replay and Verify algorithm for all subsetsof APs. It picks the maximum successful rate across differentAP combinations and prescribes it as the bitrate of the nextpacket. If the channel remains coherent for the next packet,the prescribed rate is guaranteed to be successful.
2) Heuristic for Lower Complexity: The proposed Replay andVerify algorithm incurs O(2K M) time complexity, where K isthe number of APs that forwarded symbols, and M is thenumber of rate (<modulation, coding>) schemes. Clearly, itis difficult for an AP processor to absorb this computationload. Therefore, we optimize the algorithm to bring downthe complexity, in exchange for slight sub-optimality. To thisend, we note the following opportunities:
(1) Of all the symbol copies, there is not much benefitin including a relatively far-away symbol, and excluding anearby one. Therefore, we rank the symbols in increasingorder of error vector magnitudes (i.e., strongest symbol first),and select subsets of Q strongest symbols, Q varying from 2to K . This brings down the complexity term from 2K to(K −1), a substantial reduction.
(2) The second optimization is more drastic – an attempt tosubstitute the replaying mechanism with a simple threshold-based heuristic. The heuristic essentially uses a “thresholddistance" corresponding to different rates. It checks whethercertain fractions of the received symbols are within variousthreshold distances from the correct constellation point. Themaximum rate that passes this test is the prescribed rate forthe next packet. We describe the selection of “fractions” and“thresholds” next.
We use a 16 point constellation as an example, and illustrateour method of BER computation. Assume that a transmittertransmits symbol Pi . We first define three boxes B1, B2 andB3 pivoted at Pi (see Fig. 6). B1 is the inner most grid boxaround Pi . B2 is the grid box that includes all immediateneighbors of Pi , but not B1. B3 is the grid box that includesall 2-hop neighbors of Pi , but not B2 and B1.
Recall that the error vector of the centroid – denoted EVChenceforth – is the vector joining the correct constellation
Fig. 6. Bit errors depend on the degree of dispersion.
point to the centroid. Consider the distribution of the EVCderived from a received packet. We can estimate the BERof a packet from the EVC distribution as follows. Let F1
denote the fraction of centroids that fall within B1, withrespect to the transmitted point Pi . Similarly, let F2 and F3
denote the fractions of centroids falling within B2 and B3
respectively. Clearly, F1 fraction of symbols will be receivedwith zero bit errors. A fraction F2 of symbols will encounter1.5 bit errors on average, because adjacent symbols in aconstellation differ by 1 bit and diagonally adjacent onesdiffer by 2 bits (see Fig. 2). Similarly, a fraction F3 symbolswill incur 3 bit errors approximately. Thus, the effective BERcan be estimated as F1 ∗0+F2 ∗1.5+F3 ∗3.1
Observe that this effective BER is statistical in nature (i.e.,on average). If we simulate multiple packets whose EVCs aredrawn from these fractions (F1, F2 and F3), some of thesepackets will be correctly decoded, while others will fail. Thisimplies that, for that given rate, we can estimate the deliveryratio (DR) for each <F1, F2 and F3> tuple. Put differently, foreach received packet, the Epicenter AP can create a record asfollows: [Rate r , F1, F2, F3, DR]. For another packet, anothersuch record will get created. Over time, for packets receivedat different rates, Epicenter creates one table per rate. Thisper-rate table has records of the form [F1, F2, F3, DR]. Eachtable has many records, each record corresponding to aunique value of <F1, F2, F3> measured from the past. Theseper-rate tables are generated when Epicenter is installed.Tables can be built completely offline also, by simulatingvarious distributions of Fi . For a reasonable precision, thetable will only occupy a few (1-20) MBs of memory.
In the steady state, when a packet arrives at rate r1, theEpicenter AP computes the packet’s <F1, F2, F3> tuple fromthe EVCs. Now, the AP looks up the table for rate r1, andobtains the delivery ratio, DR1. The throughput of the nextpacket, if transmitted at the same rate r1 is expected to ber1 ×DR1. Now, Epicenter must compute the throughput ifthis packet was transmitted at a higher rate, say r2. For this,it needs to first determine what <F1, F2, F3> would havebeen, had this packet been transmitted at rate r2. Fig. 7explains this operation with a visual example.
1We intend to clarify that use of three boxes and fractions is a heuristic– one can use less or more boxes to regulate the tradeoff between BERestimation accuracy and complexity.
Fig. 7. Red dots denote EVC distribution (a) Boxes and Fractions at alower rate r1 (b) Boxes and Fractions at a higher rate r2.
Observe that from the packet at rate r1 (sparser constellationgrid as shown in Fig. 7(a)), 10 centroids are in box B1, 6 inbox B2, and 4 in B3, implying that <F1 = 10
20 , F2 = 620 , F3 = 4
20 >.Now, for the same centroids, if we apply the next higherrate r2 (i.e., denser constellation grid as shown in Fig. 7(b)),fewer centroids fall inside box B1. To be precise, 5 centroidsnow fall within B1, 8 in box B2, and 7 in B3, implying thatfor r2, <F1 = 5
20 , F2 = 820 , F3 = 7
20 >. Thus, Epicenter usesthis < 5
20 , 820 , 7
20 > tuple as the key to lookup the table forrate r2, and obtains the corresponding delivery ratio, DR2.The throughput, if the packet was sent at r2, would havebeen r2 ×DR2. The exact same operation repeats for everyrate, and the corresponding throughputs computed. Finally,Epicenter selects the rate that offers maximum throughput,and prescribes it back to the client. Algorithm 1 showsthe pseudocode for the rate estimation engine. Clearly,table lookups is a lightweight operation and needs to beperformed once for each rate, and yet, the rate selected canbe quite close to the optimal.
Algorithm 1 Rate Estimation Algorithm
1: maxT hr oug hput ← 02: sel ectedRate ← 13: Input: EVar r ay : An array of Error Vectors computed from
the previous packet4: Input: Table: Table indexed by i , where i is the i th rate.
Table(i ) holds <F 1, F 2, F 3, DR> for rate i5: for all rate r in the list of supported rates do6: Determine sizes B1, B2 and B3 corresponding to the
modulation scheme used in r .7: Determine fractions F1, F2 and F3 among EVar r ay that
lie within B1,B2 and B3 respectievly.8: Find a closest match to <F1,F2,F3> in Table(r )9: Let the corresponding Delivery Ratio from the match
is DRr
10: thr oug hput ← r ∗DRr
11: if thr oug hput > maxT hr oug hput then12: maxT hr oug hput ← thr oug hput13: sel ectedRate ← r ate
3) Selection of APs for Packet Combining: As mentionedearlier, symbol combining can be improved when a certainsubset of all the overhearing APs is used (i.e., symbols fromcertain weak APs ignored). For this, we rank all the N APs
Fig. 8. The flow of operations with Epicenter. Observe that error vectorsare “computed” from symbols upon packet success, but “estimated” fromCSI upon failure.
in decreasing order of signal strength, select the top k APs,and compute the best rate for this combination. We vary thevalue from k = 2 to N , indicating that the above pseudo-codeis invoked (N −1) times. The maximum of all these rates isprescribed for the next packet, and the corresponding valueof k, say kmax is recorded. When the next packet indeedarrives, the top kmax strong APs are used for combining.
3 > thresholdsfor each modulation scheme and shares it with all APs.When the next packet arrives, the designated AP gathersall the symbol copies from other APs, and applies theweighted centroid algorithm for cooperative demodulation.This process is pipelined (i.e., APs start forwarding symbolseven before the full packet has been received). Once allthe symbols are demodulated, the buffered bits are passedthrough the decoder, followed by a CRC check.
If the CRC check is successful, the AP immediately knowsthe precise error vectors for all symbol copies. Thus, it canexecute the < F∗
1 ,F∗2 ,F∗
3 > heuristic test for all rates higherthan the rate at which this packet was received. If rate R+is prescribed by the heuristic, the Epicenter AP includes R+in an ACK and sends it back to the client. However, if thepacket failed the CRC, the AP does not send an ACK asper 802.11 specifications. Instead, it uses the channel stateinformation (CSI) forwarded by each AP to estimate the errorvectors, and runs the < F∗
1 ,F∗2 ,F∗
3 > heuristic using them.2
The prescribed rate in this case is communicated back tothe client in a subsequent download packet to that client.The client adapts its rate for the next transmission.
E. Point of Discussion
Nearby APs are often allocated to orthogonal channels,implying that not many APs may overhear a client’s trans-mission. Will diversity combining be really beneficial?
2Observe that the channel state information is a complex numberand indicative of the error vector, when added with a Gaussian noisecomponent.
−0.4 −0.2 0 0.2 0.40.6
0.7
0.8
0.9
SlackDistance
CD
F
5 AP4 AP3 AP2 AP
Fig. 9. SlackDistance: difference between the EV of correct constellationpoint and the minimum of EV of incorrect constellation points.
This is a valid concern and we tested the efficacy of symbol-based combining against varying number of symbol copies.To design the experiment, we placed 6 APs in locations thatmimic the actual AP placement in our building. We thenplaced the client at arbitrary positions, associated it to thestrongest AP (as prescribed by 802.11), and characterizedthe best bitrate to that AP (i.e., the bitrate that supports> 90% delivery ratio). Let’s call this bitrate R. The client thentransmitted a batch of packets at this bitrate. The traces werecollected and used to test the sensitivity to the “number ofsymbol copies”.
We use Sl ackDi st ance, defined in Section III-B, to un-derstand the results of the above experiment. Recall thata negative value of Sl ackDi st ance implies correct de-modulation. Since we know the transmitted packet, weprecisely know the correct constellation points, and hence,Sl ackDi st ance could be computed. Fig. 9 shows the distri-bution of Sl ackDi st ance for increasing number of symbolcopies (at bitrate QPSK). Evidently, even with 2 copies,around 80% of the symbols are decoded correctly, and moresymbols offer diminishing returns. This suggests promisewith Epicenter – we discuss this in more detail and translatethese results to throughput in Section IV.
As an aside, MRD [1] suggested that APs could be instru-mented with a passive radio on other channels, solely forthe purpose of overhearing. If this is feasible (perhaps giventhat WiFi radios will become even cheaper), then greaterdiversity gains may be extracted. We are also investigatingwhether combining symbols from signals leaked from adja-cent channels would be effective.
IV. EPICENTER IMPLEMENTATION
Epicenter builds on the OFDM codebase for theUSRP/GNURadio platform. We implement an 802.11a/g-like transceiver that uses interleaving, puncturing, andsoft input soft output viterbi decoding (SOVA) [9] (usedto implement Soft [2] for purposes of comparison). Thebandwidth in our testbed experiment is fixed at 2MHz. OurOFDM implementation uses 1024 point FFT, 394 occupiedsubcarriers, 8 pilot tones, and a cyclic prefix of length 256.
Experiment Design: The high latency incurred in procuringRF samples from the USRP front end prohibits real-time
evaluation of Epicenter. Thus, we approximate Epicenter’sperformance using traces collected in our 10 node USRPtestbed. We co-located 6 USRPs with the existing APs inour engineering building. All the USRP APs are tuned tothe same 2.43GHz channel. We collected 74 walking traces(each of 1000 packets) starting from random client locations.To collect these traces, we move a USRP client on a wheelchair while it communicates with the nearest AP. The ideais to capture real-life channel state information (CSI) anderror vector (EV) variations using these traces. APs detectclient packets, compute and forward CSI and per symbolEV information to the central server. The central server runsvarious protocols for comparison:
• MRC Symbol: This is full fidelity combining using maximalratio combining (MRC). APs forward full precision symbols(<I,Q> values) to the central combiner, which in turn com-bines them to correct erroneous packets.
• MRC Bits: APs map received full precision symbols to theclosest constellation point, and forward the mapped bits tothe combiner. For 16QAM, each symbol maps to 4 bits.
• Epi 1x: For a given modulation, Epi 1x creates a grid byplacing points at the corner of the grid boxes – like pointsTi in Fig. 5. Thus, for QPSK, the constellation would bea 9-point constellation; for 16QAM, it would be a 25-pointconstellation. The number of bits used to represent symbolswith, say a 25-point constellation is 4.6 bits, slightly greaterthan what MRC Bits would use for the same 16QAM.
• Epi 2x: For a given constellation, Epi 2x is the union ofthe constellation points in that modulation and its Epi 1xversion – (points Ti ∪Pi in Fig. 5). For 16QAM, the numberof points in the Epi 2x constellation is 41; the number ofbits used to represent symbols with Epi 2x is 5.4 bits.
In addition, we compare Epicenter’s performance with thefollowing protocols:
• 802.11: A legacy 802.11 client associates and communi-cates only with the strongest AP, without any combining. Weuse the AccuRate [8] rate control protocol to realize the bestthroughput 802.11 can achieve. This offers a strong baselineto understand the merits in symbol combining.
• Soft: We implement Soft as described in [2]. Soft combinesbit-level confidence across multiple receptions to correcterrors. However, unlike Epicenter, Soft does not propose anymethod of estimating rates under diversity combining. Fora fair comparison, we empirically find the highest bit-rateSoft can support for a given packet (by replaying the packetat increasing bit-rates using CSI and error vectors (EV)). Thehighest successful bit-rate is used.
A. Performance Evaluation
We target answering the following key questions: (1) Howeffective is the <F1, F2, F3> heuristic rate selection schemein comparison to the optimal choice of rate? (2) Howeffective is MRC to low precision <I,Q> values? (3) How much
−4 −3 −2 −1 0 1 2 30
0.2
0.4
0.6
0.8
1
Estimated Rate index − Optimal Rate index
CD
F
MRC Symbol
Epi 2x
Epi 1x
MRC Bits
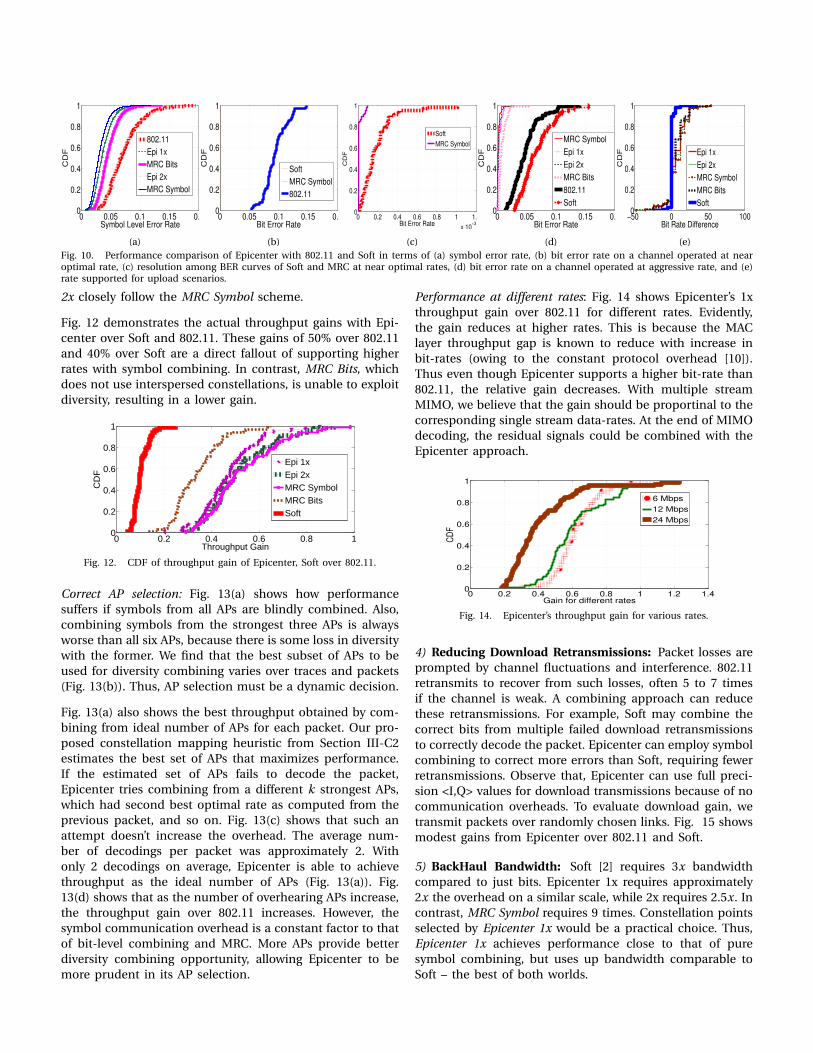
Fig. 11. Rate estimation accuracy of Epicenter vs. optimal.
throughput gain can Epicenter provide over 802.11 and Soft?(4) For download scenarios, how much throughput can begained by reducing retransmissions?
1) Rate Selection Accuracy: Fig. 11 shows the rate selectionefficacy of different protocols, compared to the optimalrate (computed from the replay and verify algorithm). Notethat a vertical line at X = 0 is the optimal rate; deviationsfrom this line indicates errors in rate selection. Evidently,Epicenter (i.e., all its variants) overlap quite reasonably withthe optimal vertical line, achieving around 70−80% accuracy.Of course, the system under-selects rates slightly more often.This is because the thresholds on delivery ratio (DR) inSection III-C2 are designed to favor under-selection, sincethis leads to fewer packet losses.
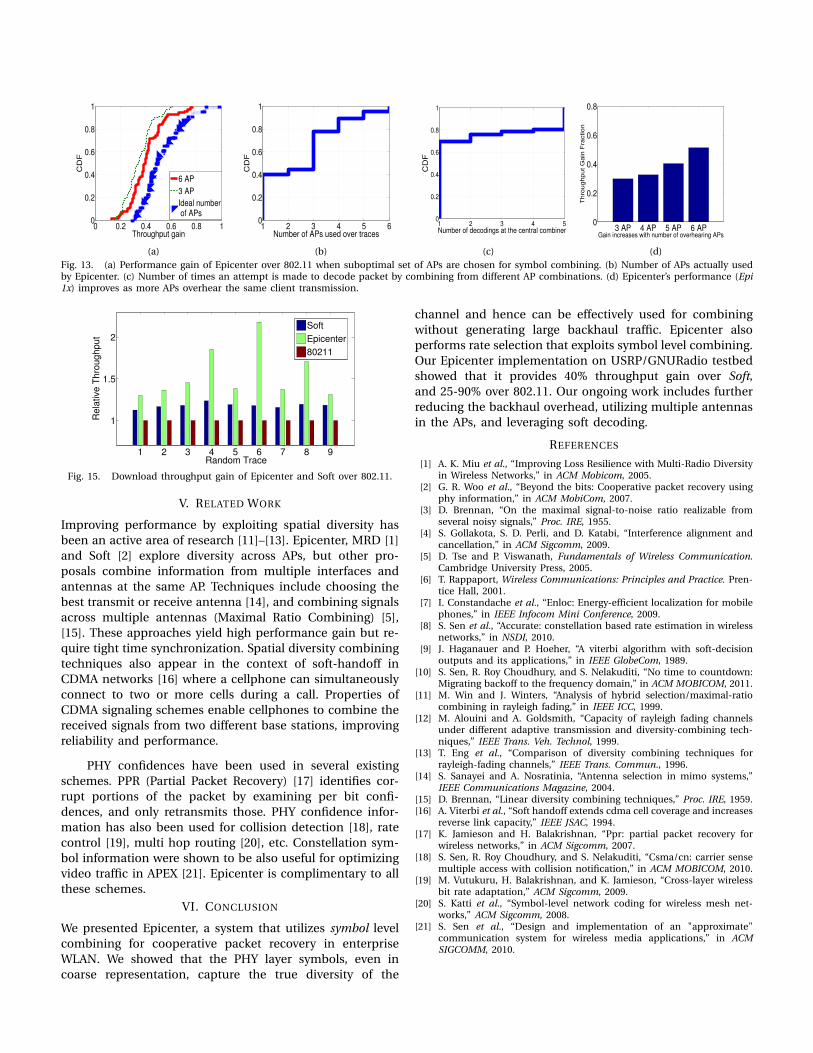
2) Robustness of Low Precision Symbols: Recall that fullprecision MRC Symbol is prohibitive because of its band-width requirement over the wire [2], [4]. To this end,we adopt coarse-grained representation of symbols through(shifted and interspersed) constellations. How well do thesecoarse-grained versions, namely 1x and 2x interspersionperform? Figures 10(a) demonstrates that 1x and 2x rep-resentation of symbols are consistently effective, producingcomparable symbol error rates, in comparison to Opti mal .Further, Epicenter outperforms 802.11 and Soft in terms ofsymbol errors because of its ability to decode more errors.In sum, the symbol communication overhead is sizablyreduced while the combining degradations are marginal.
3) Upload BER and Throughput Gain: BER is a strong indi-cator of system throughput, hence, we compare the achievedBER between Epicenter and Soft. First we operate on weaklinks at the optimal rate at which Epicenter will successfullydecode. Fig. 10(b) shows the resulting BER comparison with802.11 (both Soft and Epicenter are invisible since they arealmost aligned with the Y axis, and are much better than802.11). Fig. 10(c) zooms in on the left side of the X axis, andevidently, Soft exhibits a lower BER than 802.11, but higherthan Epicenter. However, when we operate the same link at ahigher rate (12 Mbps), Soft’s performance falls below 802.11(Fig. 10(d)). This is because Soft’s PHY confidence incurshigh errors at over-optimal rates. Epicenter on the otherhand outperforms both. Reduced BER enables an Epicenterclient to increase its rate further without suffering losses –Fig. 10(e) shows that across several traces, Epicenter supporthigher rates in 55% cases. It also shows how Epi 1x and Epi
0 0.05 0.1 0.15 0.20
0.2
0.4
0.6
0.8
1
Symbol Level Error Rate
CD
F
802.11
Epi 1x
MRC Bits
Epi 2x
MRC Symbol
(a)
0 0.05 0.1 0.15 0.20
0.2
0.4
0.6
0.8
1
Bit Error Rate
CD
F
Soft
MRC Symbol
802.11
(b)
0 0.2 0.4 0.6 0.8 1 1.2
x 10−3
0
0.2
0.4
0.6
0.8
1
Bit Error Rate
CD
F
Soft
MRC Symbol
(c)
0 0.05 0.1 0.15 0.20
0.2
0.4
0.6
0.8
1
Bit Error Rate
CD
F
MRC Symbol
Epi 1x
Epi 2x
MRC Bits
802.11
Soft
(d)
−50 0 50 1000
0.2
0.4
0.6
0.8
1
Bit Rate Difference
CD
F
Epi 1x
Epi 2x
MRC Symbol
MRC Bits
Soft
(e)Fig. 10. Performance comparison of Epicenter with 802.11 and Soft in terms of (a) symbol error rate, (b) bit error rate on a channel operated at nearoptimal rate, (c) resolution among BER curves of Soft and MRC at near optimal rates, (d) bit error rate on a channel operated at aggressive rate, and (e)rate supported for upload scenarios.
2x closely follow the MRC Symbol scheme.
Fig. 12 demonstrates the actual throughput gains with Epi-center over Soft and 802.11. These gains of 50% over 802.11and 40% over Soft are a direct fallout of supporting higherrates with symbol combining. In contrast, MRC Bits, whichdoes not use interspersed constellations, is unable to exploitdiversity, resulting in a lower gain.
0 0.2 0.4 0.6 0.8 10
0.2
0.4
0.6
0.8
1
Throughput Gain
CD
F
Epi 1xEpi 2xMRC SymbolMRC BitsSoft
Fig. 12. CDF of throughput gain of Epicenter, Soft over 802.11.
Correct AP selection: Fig. 13(a) shows how performancesuffers if symbols from all APs are blindly combined. Also,combining symbols from the strongest three APs is alwaysworse than all six APs, because there is some loss in diversitywith the former. We find that the best subset of APs to beused for diversity combining varies over traces and packets(Fig. 13(b)). Thus, AP selection must be a dynamic decision.
Fig. 13(a) also shows the best throughput obtained by com-bining from ideal number of APs for each packet. Our pro-posed constellation mapping heuristic from Section III-C2estimates the best set of APs that maximizes performance.If the estimated set of APs fails to decode the packet,Epicenter tries combining from a different k strongest APs,which had second best optimal rate as computed from theprevious packet, and so on. Fig. 13(c) shows that such anattempt doesn’t increase the overhead. The average num-ber of decodings per packet was approximately 2. Withonly 2 decodings on average, Epicenter is able to achievethroughput as the ideal number of APs (Fig. 13(a)). Fig.13(d) shows that as the number of overhearing APs increase,the throughput gain over 802.11 increases. However, thesymbol communication overhead is a constant factor to thatof bit-level combining and MRC. More APs provide betterdiversity combining opportunity, allowing Epicenter to bemore prudent in its AP selection.
Performance at different rates: Fig. 14 shows Epicenter’s 1xthroughput gain over 802.11 for different rates. Evidently,the gain reduces at higher rates. This is because the MAClayer throughput gap is known to reduce with increase inbit-rates (owing to the constant protocol overhead [10]).Thus even though Epicenter supports a higher bit-rate than802.11, the relative gain decreases. With multiple streamMIMO, we believe that the gain should be proportinal to thecorresponding single stream data-rates. At the end of MIMOdecoding, the residual signals could be combined with theEpicenter approach.
0 0.2 0.4 0.6 0.8 1 1.2 1.40
0.2
0.4
0.6
0.8
1
Gain for different rates
CD
F
6 Mbps
12 Mbps
24 Mbps
Fig. 14. Epicenter’s throughput gain for various rates.
4) Reducing Download Retransmissions: Packet losses areprompted by channel fluctuations and interference. 802.11retransmits to recover from such losses, often 5 to 7 timesif the channel is weak. A combining approach can reducethese retransmissions. For example, Soft may combine thecorrect bits from multiple failed download retransmissionsto correctly decode the packet. Epicenter can employ symbolcombining to correct more errors than Soft, requiring fewerretransmissions. Observe that, Epicenter can use full preci-sion <I,Q> values for download transmissions because of nocommunication overheads. To evaluate download gain, wetransmit packets over randomly chosen links. Fig. 15 showsmodest gains from Epicenter over 802.11 and Soft.
5) BackHaul Bandwidth: Soft [2] requires 3x bandwidthcompared to just bits. Epicenter 1x requires approximately2x the overhead on a similar scale, while 2x requires 2.5x. Incontrast, MRC Symbol requires 9 times. Constellation pointsselected by Epicenter 1x would be a practical choice. Thus,Epicenter 1x achieves performance close to that of puresymbol combining, but uses up bandwidth comparable toSoft – the best of both worlds.
0 0.2 0.4 0.6 0.8 10
0.2
0.4
0.6
0.8
1
Throughput gain
CD
F
6 AP
3 AP
Ideal number of APs
(a)
1 2 3 4 5 60
0.2
0.4
0.6
0.8
1
Number of APs used over traces
CD
F(b)
1 2 3 4 50
0.2
0.4
0.6
0.8
1
Number of decodings at the central combiner
CD
F
(c)
3 AP 4 AP 5 AP 6 AP0
0.2
0.4
0.6
0.8
Gain increases with number of overhearing APs
Thro
ughput G
ain
Fra
ction
(d)Fig. 13. (a) Performance gain of Epicenter over 802.11 when suboptimal set of APs are chosen for symbol combining. (b) Number of APs actually usedby Epicenter. (c) Number of times an attempt is made to decode packet by combining from different AP combinations. (d) Epicenter’s performance (Epi1x) improves as more APs overhear the same client transmission.
1 2 3 4 5 6 7 8 9
1
1.5
2
Random Trace
Rela
tive T
hro
ughput
Soft
Epicenter
80211
Fig. 15. Download throughput gain of Epicenter and Soft over 802.11.
V. RELATED WORK
Improving performance by exploiting spatial diversity hasbeen an active area of research [11]–[13]. Epicenter, MRD [1]and Soft [2] explore diversity across APs, but other pro-posals combine information from multiple interfaces andantennas at the same AP. Techniques include choosing thebest transmit or receive antenna [14], and combining signalsacross multiple antennas (Maximal Ratio Combining) [5],[15]. These approaches yield high performance gain but re-quire tight time synchronization. Spatial diversity combiningtechniques also appear in the context of soft-handoff inCDMA networks [16] where a cellphone can simultaneouslyconnect to two or more cells during a call. Properties ofCDMA signaling schemes enable cellphones to combine thereceived signals from two different base stations, improvingreliability and performance.
PHY confidences have been used in several existingschemes. PPR (Partial Packet Recovery) [17] identifies cor-rupt portions of the packet by examining per bit confi-dences, and only retransmits those. PHY confidence infor-mation has also been used for collision detection [18], ratecontrol [19], multi hop routing [20], etc. Constellation sym-bol information were shown to be also useful for optimizingvideo traffic in APEX [21]. Epicenter is complimentary to allthese schemes.
VI. CONCLUSION
We presented Epicenter, a system that utilizes symbol levelcombining for cooperative packet recovery in enterpriseWLAN. We showed that the PHY layer symbols, even incoarse representation, capture the true diversity of the
channel and hence can be effectively used for combiningwithout generating large backhaul traffic. Epicenter alsoperforms rate selection that exploits symbol level combining.Our Epicenter implementation on USRP/GNURadio testbedshowed that it provides 40% throughput gain over Soft,and 25-90% over 802.11. Our ongoing work includes furtherreducing the backhaul overhead, utilizing multiple antennasin the APs, and leveraging soft decoding.
REFERENCES
[1] A. K. Miu et al., “Improving Loss Resilience with Multi-Radio Diversityin Wireless Networks,” in ACM Mobicom, 2005.
[2] G. R. Woo et al., “Beyond the bits: Cooperative packet recovery usingphy information,” in ACM MobiCom, 2007.
[3] D. Brennan, “On the maximal signal-to-noise ratio realizable fromseveral noisy signals,” Proc. IRE, 1955.
[4] S. Gollakota, S. D. Perli, and D. Katabi, “Interference alignment andcancellation,” in ACM Sigcomm, 2009.
[5] D. Tse and P. Viswanath, Fundamentals of Wireless Communication.Cambridge University Press, 2005.
[6] T. Rappaport, Wireless Communications: Principles and Practice. Pren-tice Hall, 2001.
[7] I. Constandache et al., “Enloc: Energy-efficient localization for mobilephones,” in IEEE Infocom Mini Conference, 2009.
[8] S. Sen et al., “Accurate: constellation based rate estimation in wirelessnetworks,” in NSDI, 2010.
[9] J. Haganauer and P. Hoeher, “A viterbi algorithm with soft-decisionoutputs and its applications,” in IEEE GlobeCom, 1989.
[10] S. Sen, R. Roy Choudhury, and S. Nelakuditi, “No time to countdown:Migrating backoff to the frequency domain,” in ACM MOBICOM, 2011.
[11] M. Win and J. Winters, “Analysis of hybrid selection/maximal-ratiocombining in rayleigh fading,” in IEEE ICC, 1999.
[12] M. Alouini and A. Goldsmith, “Capacity of rayleigh fading channelsunder different adaptive transmission and diversity-combining tech-niques,” IEEE Trans. Veh. Technol, 1999.
[13] T. Eng et al., “Comparison of diversity combining techniques forrayleigh-fading channels,” IEEE Trans. Commun., 1996.
[14] S. Sanayei and A. Nosratinia, “Antenna selection in mimo systems,”IEEE Communications Magazine, 2004.
[15] D. Brennan, “Linear diversity combining techniques,” Proc. IRE, 1959.[16] A. Viterbi et al., “Soft handoff extends cdma cell coverage and increases
reverse link capacity,” IEEE JSAC, 1994.[17] K. Jamieson and H. Balakrishnan, “Ppr: partial packet recovery for
wireless networks,” in ACM Sigcomm, 2007.[18] S. Sen, R. Roy Choudhury, and S. Nelakuditi, “Csma/cn: carrier sense
multiple access with collision notification,” in ACM MOBICOM, 2010.[19] M. Vutukuru, H. Balakrishnan, and K. Jamieson, “Cross-layer wireless
bit rate adaptation,” ACM Sigcomm, 2009.[20] S. Katti et al., “Symbol-level network coding for wireless mesh net-
works,” ACM Sigcomm, 2008.[21] S. Sen et al., “Design and implementation of an "approximate"
communication system for wireless media applications,” in ACMSIGCOMM, 2010.