72
COOPERATIVE STATISTICS 2013 Service Report 75 Rural Business-Cooperative Programs United States Department of Agriculture Rural Development

COOPERATIVE STATISTICS2013
Service Report 75
Rural Business-Cooperative Programs
United StatesDepartment ofAgriculture
Rural Development
The U.S. Department of Agriculture (USDA) prohibits discrimination against its customers. If you believe you experienced discrimination when obtaining services from USDA, participating in a USDA program, or participating in a program that receives financial assistance from USDA, you may file a complaint with USDA. Information about how to file a discrimination complaint is available from the Office of the As-sistant Secretary for Civil Rights.
To file a complaint of discrimination, complete, sign and mail a program discrimination complaint form, available at any USDA office location or online at www.ascr.usda.gov, or write to:
USDAOffice of the Assistant Secretary for Civil Rights1400 Independence Avenue, S.W.Washington, D.C. 20250-9410
Or call toll free at (866) 632-9992 (voice) to obtain additional information, the appropriate office or to re-quest documents. Individuals who are deaf, hard of hearing or have speech disabilities may contact USDA through the Federal Relay service at (800) 877-8339 or (800) 845-6136 (in Spanish). USDA is an equal opportunity provider, employer and lender.
Persons with disabilities who require alternative means for communication of program information (e.g., Braille, large print, audiotape, etc.) should contact USDA’s TARGET Center at (202) 720-2600 (voice and TDD).

Cooperative Statistics, 2013 i
ABSTRACT
A survey of 2,186 U.S. farmer, rancher, and fishery cooperatives ending their business year during cal-endar year 2013 showed a record business volume and net income before taxes. Gross business volume was $246 billion, while net business volume was $209 billion and net income before taxes totaled $6.2 billion. These cooperatives had almost $83 bil-lion in assets, $48 billion of liabilities, and $35 bil-lion in equity. Cooperatives were a major employer in rural areas, with 136,000 full-time workers and 55,000 part-time or seasonal employees. Business
volume by commodity is reported for all coopera-tives. Number of cooperatives, cooperative mem-berships, and number of employees are classified according to whether the business is a marketing, supply, or service cooperative. Trends in coopera-tive numbers, memberships, employees, business size, sales volume, net income, assets, liabilities, and net worth are reported. Keywords: cooperatives, statistics, business vol-ume, employees, memberships, balance sheet, income statement, financial ratios.
COOPERATIVE STATISTICS, 2013E. Eldon Eversull and Sarah Ali Rural DevelopmentU.S. Department of AgricultureSTOP 32561400 Independence Ave., S.W.Washington, DC 20250 3256
Service Report 75November 2014

ii Cooperative Statistics, 2013
PREFACE
Cooperative statistics are collected annually to provide information on the progress and trends among the Nation’s farmer, rancher, and fishery cooperatives. These statistics are used for research, technical assistance, education, planning, and public policy. The collection, analysis, and dissemination of cooperative statistics by the United States De-partment of Agriculture (USDA) are authorized by the Cooperative Marketing Act of 1926.
This report provides aggregate information on the number, membership, business volume, net income, basic balance sheet items, and full-time and part-time and seasonal employees of cooperatives for business years ending in calendar year 2013. Coop-eratives are classified by principal product marketed and major function. Both gross (includes inter-coop-erative business) and net (excludes inter-cooperative business) dollar volumes are reported.
Statistics for 2013 were compiled on a State and national basis. The information was collected by a
mail survey of all organizations identified by USDA Rural Development’s Cooperative Programs as farmer, rancher, or fishery cooperatives. Information was requested for the 2013 business year.
USDA’s Cooperative Programs conducts an an-nual census to gain accurate information for assis-tance purposes. Information obtained from individ-ual cooperatives is combined with data from other cooperatives to maintain confidentiality.
Statistics for all cooperatives were derived by estimating data for non-respondents and combining this information with respondent data. Data from respondents and other sources accounted for 90 per-cent of the total gross sales of farmer, rancher, and fishery cooperatives in 2013.
USDA depends on the response to its annual sur-vey to develop a detailed and comprehensive set of statistics on cooperatives. The time and effort taken by cooperative staff members to provide informa-tion, and the timeliness with which it is furnished, are greatly appreciated by USDA.
.
Cooperative Statistics, 2013 iii
ABSTRACT i PREFACE iiHIGHLIGHTS iv COOPERATIVE STATISTICS, 2013 1 I–DEFINITION OF A COOPERATIVE 1
Classification of Cooperatives 1Organizational Membership Structures 1
II–2013 STATISTICS 3
Number of Cooperatives 4Memberships 12Employees 12Business Size 14Business Volume 14Balance Sheet 19Income Statement 23Selected Financial Ratios 29
BIBLIOGRAPHY 32APPENDIX TABLES 33APPENDIX FIGURES 60
CONTENTS

iv Cooperative Statistics, 2013
2013 2012 Difference % ChangeNumber of cooperatives (number) 2,186 2,236 -50 -2.24Memberships (millions) 2.0 2.1 -0.14 -6.53Gross business volume (billion $) 246.1 237.8 8.34 3.51Net business volume (billion $) 208.6 202.6 5.95 2.94Net income before taxes (billion $) 6.2 6.1 0.05 0.76Total assets (billion $) 82.6 83.4 -0.81 -0.97Net worth (billion $) 34.6 30.2 4.48 14.87Full-time employees (thousand) 136.2 129.4 6.74 5.21
HIGHLIGHTS
There are 2,186 U.S. farmer, rancher, and fishery cooperatives, according to the 2013 survey of mar-keting, supply, and service cooperatives conducted by USDA Rural Development’s Cooperative Pro-grams. This was the highest ever business volume and net income, before taxes, for U.S. agriculture cooperatives, surpassing the previous records set in 2012. U.S. crop production and livestock sales both increased 6 percent in 2013, and production input sales increased 2 percent. Many products had sales declines though, with cotton decreasing the most (-38 percent). Livestock, vegetables, and dairy all had at least a 3-percent gain in U.S. sales. Overall the farm economy saw U.S. sales decline for many crops and production inputs.
• Total gross business volume (includes inter-cooperative business) handled by coopera-tives was $246 billion; net business (ex-cludes inter-cooperative business) was $209 billion. Both are records, exceeding 2012 by $8 billion and $6 billion, respectively.
• Net income before taxes (NIBT) was $6.2 billion, which includes inter-cooperative dividends and refunds of $1.2 billion. This exceeds the 2012 record NIBT by $46 mil-lion, while dividends and refunds exceeded the prior record set in 2009 ($898 million) by $300 million.
• Cooperative memberships were 2 million, down 140,000 from 2012.
• Cooperatives employed 136,000 full-time and 55,000 part-time and seasonal employ-ees. Full-time employee numbers were
up 7,000 from 2012, while part-time and seasonal employee numbers were down by 1,300.
• Gross value of products marketed by coop-eratives was $145 billion, with a net value (after eliminating duplication from inter-cooperative business) of $136 billion. Both gross and net marketings were up about 2 percent from 2012. Grain and oilseed mar-ketings were up over $2.5 billion, while dairy product marketings increased about $1.4 billion.
• Gross value of supplies handled by coopera-tives was $96 billion, with a net value of $67 billion. Net supply sales were up almost $2.5 billion primarily due to strong energy and feed ingredient prices. Petroleum and feed both had increases of about $1 billion in net sales.
• Receipts for services related to market-ing farm products and supplies, plus other income, totaled $5.6 billion, up about $860 million from 2012.
• Cooperatives had about $83 billion in com-bined assets, down about 1 percent from the 2012 record high of $83.4 billion. Net assets, after eliminating inter-cooperative invest-ments, were $77 billion. Inter-cooperative investments included those in CoBank.
• Total liabilities decreased $5.3 billion, to $48 billion.
• Net worth, or member and patron equity, was $35 billion. Member and patron equity financed 42 percent of total assets, up from 36 percent in 2012.
Table A: Comparison of 2013 and 2012 Cooperative Statistics

Cooperative Statistics, 2013 1
Cooperative Statistics, 2013E. Eldon Eversull and Sarah Ali
I. DEFINITION OF A COOPERATIVE
USDA considers four major criteria in identifying farmer, rancher, and fishery cooperatives:
(1) Membership is limited to persons producing agricultural and aquacultural products and to associations of such producers;
(2) Cooperative members are limited to one vote, regardless of the amount of stock or member-ship capital owned, or the cooperative does not pay dividends on stock or membership capital in excess of 8 percent a year or the legal rate in the State, whichever is higher;
(3) Business conducted with non-members may not exceed the value of business conducted with members;
(4) The cooperative operates for the mutual inter-est of members by providing member benefits on the basis of patronage.
These criteria may result in larger or smaller numbers of farmer, rancher, and fishery coopera-tives than found in lists or directories of State agen-cies or cooperative councils. Year-to-year compari-sons with specific commodity groups reflect any differences in lists and classifications in State and Federal data.
Classification of Cooperatives
Cooperative Programs classifies each cooperative under one of the following major functions: market-ing, supply, or service. For example, fertilizer coop-eratives are classified as supply cooperatives, wool pools are classified as marketing cooperatives, and transportation cooperatives are classified as service cooperatives.
Marketing cooperatives derive most of their total dollar volume from the sale of members’ products. Those cooperatives are further classified into 1 of 13 commodities or commodity groups, depending
upon which accounts for most of its business vol-ume. Cooperative Programs may reclassify a co-operative into a different commodity category if its primary business volume changes significantly.
Supply cooperatives derive most of their busi-ness volume from the sale of production supplies, machinery and equipment, and building materials. Many also handle farm, ranch, and home items, such as heating oil, lawn and garden supplies and equipment, and food.
Service cooperatives provide specialized services related to the business operations of farmers, ranch-ers, or cooperatives, such as trucking, storing, or drying.
Many cooperatives handle multiple commodi-ties and provide marketing and supply services, as well as the facilities and equipment used to perform these services. These associations are classified ac-cording to the predominant commodity or function, as indicated by business volume.
Prior year data has been revised in this report. Some revisions correct errors; others are due to new information. For instance, 82 cooperatives that had not responded in 2012 included with their 2013 sur-veys annual reports that also had 2012 information.
Organizational Membership Structures
Cooperative Programs further classifies marketing, supply, and service cooperatives into three organi-zational structures according to membership. The membership structures used are centralized, feder-ated, and mixed.
Centralized CooperativesOf the 2,186 cooperatives in 2013, 2,130 were
centralized organizations, mostly local cooperatives with individual farmer, rancher, or fishery members. Centralized cooperatives usually serve a local area or community, county, or several counties. Most usually perform a limited number of initial market-ing functions. Most supply sales are at the retail level. A few centralized cooperatives, principally regionals, operate over multistate areas and provide

2 Cooperative Statistics, 2013
Percentages are based on 2.0 million total memberships.1 Includes dry bean and pea, bioenergy, wool and mohair, rice, sugar, fishery, and other product marketing cooperatives.
Service 1.9%Other marketing1 2.3%
Supply 65.0%
Grain & Oilseed 20.3%
Dairy 2.3%
Livestock & Poultry 3.7%
Cotton ginning 1.3%Cotton 1.3%
Tobacco 0.7%
Fruit & Vegetable 1.1%
0
200
400
600
800
1,000
1,200
1,400
1,600
1,800
2,000
2004 2005 2006 2007 2008 2009 2010 2011 2012 2013
Marketing
Supply
Service
Number
Figure 2: Distribution of Memberships, by Type of Cooperative, 2013
Figure 1: Cooperatives in the United States, 2004-2013

Cooperative Statistics, 2013 3
Major business activity Cooperatives Memberships Number Thousands
Bean and pea (dry edible) 5 1.8Cotton 12 25.1Cotton ginning 148 24.8Dairy 127 46.3Fish 39 5.5Fruit and vegetable 145 20.8Grain and oilseed1 490 400.3Livestock 91 71.7Nut 18 9.9Poultry2 12 0.6Rice 12 10.8Sugar3 27 9.5Tobacco 5 13.8Wool and mohair 41 9.5Other marketing4 23 5.1Total marketing 1,195 655.3 Artificial insemination 12 52.4Total supplies 871 1,284.3 Other services5 98 36.5Rice dryers 4 0.2Storage 6 0.1Transportation 12 0.4Total service 120 37.2
Total 2,186 1,976.7 1 Cooperatives primarily handling grain and oilseed, excluding cottonseed. 2 Cooperatives primarily handling eggs, turkeys, ratite, squab, and related products.3 Cooperatives primarily handling sugar beets, sugar-cane, honey, and related products.4 Cooperatives primarily handling forest products, hay, hops, seed marketed for growers, nursery stock, bio-energy, coffee, and other farm products not classified separately. Also includes manufactured food products and resale items marketed by cooperatives.5 Cooperatives primarily providing grading, testing, auc-tions, hulling, seed development, crop scouting, farmer markets, and other services.
more vertically integrated services, such as process-ing products or manufacturing feed.
Bargaining associations also have centralized organizational structures. They derive all or most of their business volume from negotiating with dis-tributors, processors, and other buyers and sellers over price, quantity, grade, terms of sale, and other
factors involved in marketing products. Only a few bargain to purchase supplies. While the primary function of such an association is to bring buyers and sellers together to contract for the sale of mem-bers’ products, many bargaining associations now perform additional functions.
For example, dairy bargaining associations at one time only negotiated price. Now, many perform ad-ditional functions, such as physically handling part of the milk for spot sales. Like other dairy market-ing cooperatives, these cooperatives represent their members at Federal or State milk marketing order hearings.
Federated CooperativesThe 37 federated cooperatives—two or more mem-ber associations organized to market products, purchase production supplies, or perform bargaining functions—often operate at points quite distant from their headquarters. Members are usually local co-operatives, although some are interregional associa-tions with regional cooperative members.
Mixed CooperativesThe 19 mixed cooperatives have individual farmer, rancher, or fishery members and autonomous cooperative members. These cooperatives use a combination of centralized and federated structures. They serve large geographic areas, with members in many States, and provide a variety of integrated services.
II. 2013 STATISTICS
Cooperatives’ total gross business volume for 2013 was $246 billion. Net business volume was $209 billion, while net income before taxes (NIBT) was $6.2 billion. This was the highest business volume and net income before taxes ever recorded for U.S. agriculture cooperatives, exceeding records set in 2012.
Cooperative sales increases were driven by increased sales in the overall farm economy. U.S. crop production and livestock sales both increased 6 percent in 2013 and production input (farm supply) sales increased 2 percent. Many products had sales
Table 1: Number of cooperatives and mem-berships, by major business activity, 2013

4 Cooperative Statistics, 2013
SupplyFunction Marketing & service Total
State Number Alabama 9 39 48Arkansas 11 21 32California 75 37 112Colorado 12 15 27Florida 22 8 30Georgia 7 7 14Hawaii 7 6 13Idaho 15 8 23Illinois 72 37 109Indiana 9 24 33Iowa 64 29 93Kansas 57 32 89Kentucky 7 19 26Louisiana 11 23 34Maryland 5 9 14Massachusetts 3 5 8Michigan 22 21 43Minnesota 94 100 194Mississippi 18 33 51Missouri 22 38 60Montana 19 25 44Nebraska 32 19 51New York 42 13 55North Carolina 8 4 12North Dakota 69 77 146Ohio 30 11 41Oklahoma 33 20 53Oregon 19 13 32Pennsylvania 21 15 36South Dakota 37 34 71Tennessee 3 58 61Texas 144 37 181Utah 5 7 12Virginia 15 38 53Washington 37 23 60West Virginia 5 9 14Wisconsin 67 58 125Wyoming 5 5 10Other States1 62 14 76 United States 1,195 991 2,186
1 Includes States with fewer than 3 cooperatives for any func-tion. States with at least three cooperatives were: Alaska, 5; Connecticut, 6; Delaware, 3; Maine, 22; New Jersey, 11; New Mexico, 9; South Carolina, 3; and Vermont, 3.
declines though, with cotton decreasing the most (-38 percent). Livestock, vegetables, and dairy all had at least a 3-percent gain in U.S. sales. Overall, the farm economy saw U.S. sales decline for many crops and production inputs.
Cooperative marketing sales were led by at least a 3-percent sales gain for grain and oilseed and dairy cooperatives, which was a $4 billion increase. Supply sales grew by 4 percent over 2012, with pe-troleum leading the gain with an increase of almost $2 billion, and feed grew by $1 billion. Crop pro-tectants grew $500 million while fertilizer and seed both had declines in sales of less than 1 percent.
In 2013, agricultural cooperatives had 2 million members, with $83 billion in assets and a record $35 billion in equity. Cooperatives remained a ma-jor employer in rural areas, using 136,000 full-time workers.
Number of Cooperatives The 2013 survey counted 2,186 marketing, supply, and service1 cooperatives, compared with 2,236 in 2012. Of the 2,186 cooperatives, 1,195 primarily marketed products, 871 primarily handled produc-tion supplies, and 120 provided services related to marketing or purchasing activities (table 1, appen-dix figure 1). Revisions have been made to the 2012 data and prior years.
The proportion of marketing, supply, and service cooperatives to the total number of cooperatives remained virtually unchanged from 2012. About 55 percent of cooperatives are marketing cooperatives, 40 percent are supply cooperatives, and 5 percent are service cooperatives (figure 1 and appendix table 1).
There was a net decrease of 50 associations (2 percent) from 2012 to 2013, largely reflecting a con-tinuing trend involving merger, acquisition, or dis-solution. The largest decrease was 45 farm supply cooperatives, while dairy cooperatives decreased by 6.
Table 2: Number of cooperatives, by major function and State, 2013
1 Services include trucking, storage, crop drying, livestock shipping, and similar services affecting the form, quality, or location of products and sup-plies. They do not include credit, electric, tele-phone, or other such services not directly related to marketing or supply activities.

Cooperative Statistics, 2013 5
FISHMaine 15 0.6 73.04 73.04Other States 24 4.8 111.49 111.49United States 39 5.5 184.53 184.53 FRUIT AND VEGETABLE Arizona 3 0.8 78.88 36.43California 33 11.2 2,876.68 2,087.07Florida 14 9.6 847.54 246.60Hawaii 4 0.2 7.71 7.71Michigan 10 1.5 869.86 759.55Minnesota 4 0.2 0.64 0.64New Jersey 4 0.4 197.33 122.14New York 8 0.6 76.63 76.48Oregon 10 0.9 643.75 625.65Pennsylvania 3 0.3 435.56 435.56Texas 3 0.0 90.21 77.75Washington 9 2.5 853.68 839.51Other States 40 3.6 933.67 441.80Foreign7 0 0.1 244.41 133.44United States 145 31.8 8,156.56 5,890.32 GRAIN AND OILSEED8 Colorado 7 3.8 283.02 282.97Illinois 66 48.8 6,119.34 6,119.09Indiana 5 3.5 933.52 933.52Iowa 55 61.4 11,360.48 11,190.91Kansas 57 67.7 4,488.08 4,482.35Minnesota 54 35.6 12,003.45 11,969.84Mississippi 3 2.4 567.68 567.68Missouri 14 11.9 1,988.93 1,471.93Montana 4 0.8 1,079.54 1,079.54 Nebraska 29 49.9 6,013.25 6,006.53
Table 3: Number1 of cooperatives, memberships,2 and gross and net sales by State, 20133
Head- quartered Member- Business volumeState in State ships Gross4 Net5
Number Thousands $MillionsBEAN AND PEA, DRY EDIBLE United States 5 1.8 247.12 243.04 COTTON6 Texas 4 12.7 875.52 875.52Other States 8 12.4 1,744.64 1,740.70United States 12 25.1 2,620.16 2,616.21 COTTON GINNING6 Alabama 3 0.1 5.49 5.49Arizona 4 0.1 25.91 25.91Arkansas 3 1.8 36.87 18.21California 12 0.5 76.91 34.65Louisiana 3 0.2 18.24 10.62Mississippi 9 0.3 11.09 9.12Oklahoma 10 4.2 4.50 4.48Texas 99 17.3 230.84 226.63Other States 5 0.5 49.27 35.20United States 148 25.0 459.13 370.31 DAIRY Idaho 3 0.1 472.17 472.17Illinois 3 1.9 1,877.42 1,876.47Iowa 3 2.4 1,741.64 1,690.58Minnesota 22 6.3 3,827.42 3,760.75New Mexico 4 0.1 850.11 436.56New York 29 3.1 2,824.61 2,465.69Pennsylvania 10 2.3 1,597.69 1,406.91Wisconsin 22 14.9 5,744.05 5,473.53Other States 31 18.9 23,793.90 22,601.22United States 127 50.0 42,729.00 40,183.89
Head- quartered Member- Business volumeState in State ships Gross4 Net5
Number Thousands $Millions
1 Includes centralized and federated cooperatives and those with mixed organizational structures. Headquartered in the State listed. 2 Includes voting farmer-members, but not nonvoting patrons. (Duplication in these membership figures occurs because many farmers belong to more than one cooperative.) Member-ships include members of cooperatives not headquartered in the State listed. Totals may not add due to rounding. 3 Data covering operations of cooperatives for fiscal years ended in 2013. States listed are those with more than two cooperatives or where disclosure was not a problem.4 Gross business volume includes sales between cooperatives.
Gross sales include sales of cooperatives not headquartered in the State listed. Totals may not add due to rounding. 5 Net business volume excludes sales between cooperatives. Net sales include sales of cooperatives not headquartered in the State listed. Totals may not add due to rounding. 6 Cottonseed sales of meal are included in feed sales, whereas oil sales are included in other marketing sales.7 Includes memberships, marketing, and sales in other coun-tries.8 Excludes oilseed meal and oil. Oilseed meal is included in feed sales, whereas oil sales are included in other marketing sales.
Continued next page

6 Cooperative Statistics, 2013
Head- quartered Member- Business volumeState in State ships Gross4 Net5
Number Thousands $Millions
Head- quartered Member- Business volumeState in State ships Gross4 Net5
Number Thousands $MillionsGRAIN AND OILSEED (continued)North Dakota 56 22.2 5,902.76 5,902.66Ohio 24 24.3 2,869.38 2,869.33Oklahoma 20 14.5 360.13 360.13South Dakota 37 26.4 5,098.91 5,098.79Texas 27 10.3 1,061.29 1,061.29Washington 13 8.2 1,718.45 1,718.45Other States 19 17.6 5,114.35 5,093.02Foreign7 0 0.0 44.15 44.15United States 490 409.3 67,006.70 66,252.16 LIVESTOCK North Dakota 5 0.6 23.57 23.57West Virginia 4 0.2 2.14 2.14Wisconsin 37 45.3 505.28 505.28Other States 45 25.8 2,814.30 2,814.30United States 91 71.9 3,345.30 3,345.30 NUT California 9 4.4 1,264.80 1,262.17Other States 9 5.9 72.11 72.11Foreign7 0 0.1 0.00 0.00United States 18 10.4 1,336.90 1,334.28 POULTRY9 California 4 0.1 202.86 202.86Other States 8 0.5 524.06 524.06United States 12 0.6 726.92 726.92 RICE California 3 0.8 292.38 292.38Texas 4 0.5 66.04 66.04Other States 5 9.4 1,373.96 1,373.96United States 12 10.8 1,732.39 1,732.39 SUGAR10 Idaho 5 0.5 839.06 6.83Louisiana 4 1.4 863.25 863.25Minnesota 3 2.5 4,069.96 2,338.43Wyoming 3 0.6 21.06 21.06Other States 12 5.1 2,908.83 2,796.95
SUGAR (continued)Foreign7 0 0.1 3.67 3.67United States 27 10.2 8,705.83 6,030.19 TOBACCO Tennessee 2 5.8 21.22 21.22Other States 3 8.0 115.72 115.72United States 5 13.8 136.94 136.94 OTHER MARKETING11 Minnesota 7 4.0 1,944.12 1,841.05Other States 57 10.7 5,272.18 4,922.80United States 64 14.7 7,216.29 6,763.86 TOTAL MARKETING Alabama 9 2.7 502.94 502.94Alaska 5 3.0 12.64 12.64Arizona 9 1.3 999.82 915.57Arkansas 11 12.5 2,095.35 2,037.13California 75 19.9 10,997.06 10,064.99Colorado 12 5.7 802.86 802.81Florida 22 10.2 1,708.32 1,096.57Georgia 7 2.6 558.31 516.41Hawaii 7 0.5 8.75 8.75Idaho 15 3.8 1,589.59 757.35Illinois 72 52.2 8,148.31 8,147.11Indiana 9 6.4 1,977.33 1,945.93Iowa 64 66.9 14,725.47 14,467.33Kansas 57 69.6 5,587.02 5,549.70Kentucky 7 12.9 573.43 559.63Louisiana 11 5.0 1,888.18 1,873.44Maine 20 1.5 154.50 153.94Massachusetts 3 0.4 458.25 247.82Michigan 22 8.9 3,342.28 3,153.50Minnesota 94 49.7 22,824.27 20,888.58Mississippi 18 6.5 1,176.22 1,170.25Missouri 22 17.5 5,917.93 5,393.94Montana 19 1.7 1,251.48 1,250.55Nebraska 32 52.7 7,787.80 7,779.84New Jersey 9 1.6 297.10 197.60New Mexico 8 0.7 877.84 464.18New York 42 4.1 3,214.43 2,855.36North Carolina 8 2.0 668.44 631.42North Dakota 69 25.9 7,275.17 7,262.46Ohio 30 27.8 3,724.98 3,674.48Oklahoma 33 22.8 823.18 788.76Oregon 19 7.1 3,481.31 3,395.42Pennsylvania 21 3.6 2,044.26 1,853.48South Dakota 37 27.8 5,793.30 5,779.74
9 Includes eggs, turkeys, ratite, squab, and related products.10 Includes sugar, sugarcane, sugar beets, honey, maple syrup, molasses, and sorghum.11 Includes forest products, hay, hops, seed marketed for grow-ers, nursery stock, biofuels, coffee, wool and mohair, and other marketings not classified separately. Also includes manufac-tured food products and resale items marketed by coopera-tives.
(continued)
Table 3: Number1 of cooperatives, memberships,2 and gross and net sales by State, 20133

Cooperative Statistics, 2013 7
TOTAL MARKETING (continued)Tennessee 3 7.6 216.15 170.37Texas 144 44.4 4,940.95 4,335.85Utah 5 2.6 256.80 224.25Vermont 3 1.1 623.35 623.35Virginia 15 3.7 606.93 548.69Washington 37 12.1 4,552.66 4,525.91West Virginia 5 1.0 20.15 17.76Wisconsin 67 65.9 8,308.69 7,618.16Wyoming 5 0.9 99.87 99.87Other States 13 3.7 1,225.85 1,125.51Foreign7 0 0.4 464.28 320.99United States 1,195 680.9 144,603.77 135,810.32 SUPPLIES PROVIDED CROP PROTECTANTS12 Alabama 136.69 47.76Arkansas 370.47 133.46California 56.13 41.48Colorado 42.29 29.52Florida 66.61 23.21Georgia 134.07 38.16Idaho 53.93 12.79Illinois 1,201.41 849.72Indiana 385.64 259.57Iowa 2,206.59 1,612.63Kansas 374.65 271.78Kentucky 94.76 77.50Louisiana 166.09 61.36Maryland 19.01 14.16Massachusetts 1.09 0.26Michigan 57.23 31.48Minnesota 807.35 517.89Mississippi 221.36 51.91Missouri 267.78 198.74Montana 360.57 164.28Nebraska 767.52 507.85New York 58.61 21.16North Dakota 494.05 336.54Ohio 276.41 180.78Oklahoma 62.19 39.84Oregon 476.61 285.82Pennsylvania 143.28 82.31
Head- quartered Member- Business volumeState in State ships Gross4 Net5
Number Thousands $Millions
Head- quartered Member- Business volumeState in State ships Gross4 Net5
Number Thousands $MillionsCROP PROTECTANTS (continued)South Dakota 606.34 358.63Tennessee 188.56 171.65Texas 144.62 99.82Utah 19.59 16.34Virginia 39.56 32.96Washington 624.91 407.01West Virginia 2.20 1.90Wisconsin 535.92 272.10Wyoming 2.96 1.74Other States 118.97 77.74United States 11,586.03 7,331.87 FEED12 Alabama 90.00 53.01Arkansas 66.42 59.80California 624.69 463.67Colorado 141.14 119.29Florida 150.32 118.99Georgia 92.41 69.94Idaho 735.59 524.63Illinois 670.89 531.82Indiana 312.08 260.00Iowa 2,886.45 2,499.46Kansas 366.97 296.90Kentucky 120.65 100.07Louisiana 126.67 95.88Maryland 82.21 67.90Massachusetts 8.50 7.32Michigan 234.71 188.17Minnesota 1,933.89 1,597.34Mississippi 239.89 192.86Missouri 464.23 359.87Montana 104.11 23.23Nebraska 562.58 426.71New York 127.71 104.22North Dakota 217.29 165.25Ohio 427.36 377.47Oklahoma 214.51 147.33Oregon 292.10 172.05Pennsylvania 188.76 144.87South Dakota 523.85 342.61Tennessee 336.43 314.60Texas 758.81 575.48Utah 169.17 161.00Virginia 245.59 222.36Washington 252.30 128.17
12 Headquartered in State and membership values are not col-lected for individual supply products; rather, they are collected for total supplies.
(continued)
Continued next page
Table 3: Number1 of cooperatives, memberships,2 and gross and net sales by State, 20133

8 Cooperative Statistics, 2013
Head- quartered Member- Business volumeState in State ships Gross4 Net5
Number Thousands $Millions
Head- quartered Member- Business volumeState in State ships Gross4 Net5
Number Thousands $MillionsFEED (continued)West Virginia 373.45 267.43Wisconsin 652.95 557.58Wyoming 15.80 13.61Other States 970.76 695.15Foreign7 401.82 271.47United States 16,183.07 12,717.49 FERTILIZER12 Alabama 109.67 105.21Arkansas 142.45 132.91California 228.56 228.56Colorado 98.19 88.35Florida 78.05 46.95Georgia 92.20 76.49Idaho 1.11 1.11Illinois 1,893.43 1,380.10Indiana 710.58 659.96Iowa 3,334.32 2,458.74Kansas 660.78 654.50Kentucky 264.77 223.74Louisiana 35.65 29.74Maryland 47.98 41.23Massachusetts 18.05 7.97Michigan 122.86 117.82Minnesota 1,418.32 1,199.23Mississippi 35.18 34.98Missouri 771.26 589.74Montana 493.22 282.85Nebraska 1,385.74 1,161.24New York 59.75 27.66North Dakota 608.92 603.26Ohio 711.26 609.45Oklahoma 160.54 141.61Oregon 630.03 419.67Pennsylvania 116.58 62.40South Dakota 875.76 661.72Tennessee 362.26 358.16Texas 134.60 133.13Utah 42.83 42.80Virginia 184.65 158.08Washington 650.74 439.74West Virginia 15.09 12.72Wisconsin 880.52 611.41Wyoming 10.38 10.38Other States 268.19 201.49Foreign7 2.00 0.90United States 17,656.49 14,016.01
PETROLEUM12, 13 Alabama 11.86 11.86Arkansas 208.98 198.34California 4.34 4.34Colorado 1,054.58 556.77Florida 6.61 4.09Georgia 730.86 238.80Idaho 863.95 412.87Illinois 3,880.49 2,643.47Indiana 2,755.66 1,339.56Iowa 2,589.35 1,878.58Kansas 2,287.87 1,501.21Kentucky 252.57 148.48Louisiana 15.96 15.46Maryland 163.65 124.46Massachusetts 0.06 0.06Michigan 1,004.73 445.00Minnesota 2,208.82 1,747.64Mississippi 19.14 14.96Missouri 2,615.31 1,873.45Montana 1,226.65 882.66Nebraska 2,141.23 1,466.25New York 3.88 2.37North Dakota 2,237.86 1,760.09Ohio 723.39 524.69Oklahoma 1,575.28 810.58Oregon 975.81 614.94Pennsylvania 14.97 11.13South Dakota 1,356.38 837.11Tennessee 971.18 496.29Texas 361.42 321.44Utah 685.73 214.34Virginia 1,176.38 577.99Washington 958.40 637.64West Virginia 31.04 25.59Wisconsin 1,832.59 1,300.80Wyoming 803.71 467.62Other States 94.34 80.86Foreign7 678.69 205.29United States 38,523.72 24,397.08 SEED12 Alabama 46.10 32.11Arkansas 66.15 43.64California 27.29 15.38Colorado 26.75 11.59Florida 4.86 3.22
(continued)
13 Includes all types of petroleum products and lubricants as well as bioenergy fuels such as ethanol and biodiesel.
Table 3: Number1 of cooperatives, memberships,2 and gross and net sales by State, 20133

Cooperative Statistics, 2013 9
Head- quartered Member- Business volumeState in State ships Gross4 Net5
Number Thousands $Millions
Head- quartered Member- Business volumeState in State ships Gross4 Net5
Number Thousands $MillionsSEED (continued)Georgia 25.95 17.56Idaho 25.42 15.58Illinois 763.46 455.54Indiana 258.05 135.79Iowa 779.41 416.27Kansas 210.88 115.75Kentucky 68.14 50.94Louisiana 33.56 20.79Maryland 13.79 10.48Massachusetts 2.53 2.39Michigan 35.31 17.71Minnesota 666.21 377.61Mississippi 47.88 25.71Missouri 164.65 115.82Montana 43.30 39.06Nebraska 296.68 192.36New York 15.58 2.93North Dakota 351.73 197.13Ohio 236.06 140.65Oklahoma 17.71 14.11Oregon 56.79 53.90Pennsylvania 10.19 5.80South Dakota 432.15 244.09Tennessee 187.93 147.90Texas 69.36 47.72Utah 7.32 5.22Virginia 48.04 41.58Washington 92.26 87.77West Virginia 6.40 5.15Wisconsin 339.97 202.47Wyoming 3.36 1.90Other States 60.89 43.57United States 5,542.11 3,357.18 OTHER SUPPLIES12, 14 Alabama 58.89 52.18Arkansas 100.30 67.87California 258.35 242.35Colorado 92.38 77.28Florida 71.11 44.44Georgia 79.85 37.85Idaho 74.53 50.68Illinois 313.31 209.17Indiana 115.83 80.90
OTHER SUPPLIES (continued)Iowa 453.81 367.67Kansas 145.95 116.12Kentucky 123.06 87.60Louisiana 42.45 25.74Maryland 31.93 27.33Massachusetts 7.97 7.76Michigan 118.98 95.73Minnesota 470.32 411.51Mississippi 66.93 49.94Missouri 137.50 91.65Montana 119.23 108.68Nebraska 188.17 160.75New York 151.95 140.37North Dakota 551.37 514.47Ohio 118.90 85.51Oklahoma 71.65 54.74Oregon 307.23 298.91Pennsylvania 30.35 22.16South Dakota 194.67 175.08Tennessee 286.84 259.19Texas 144.84 121.91Utah 127.45 104.07Virginia 226.44 196.80Washington 286.52 233.39West Virginia 30.52 26.86Wisconsin 485.17 449.25Wyoming 65.98 61.86Other States 261.38 181.14Foreign7 29.61 16.65United States 6,441.72 5,355.54 SUPPLY Alabama 38 25.2 453.22 302.14Arkansas 21 24.7 954.76 636.02California 14 13.7 1,199.37 995.78Colorado 13 14.8 1,455.32 882.79Florida 6 9.4 377.56 240.90Georgia 5 10.9 1,155.34 478.81Idaho 6 8.2 1,754.52 1,017.66Illinois 36 61.7 8,722.99 6,069.82Indiana 22 35.7 4,537.83 2,735.79Iowa 28 38.2 12,249.93 9,233.35Kansas 31 26.0 4,047.10 2,956.26Kentucky 19 156.5 923.95 688.34Louisiana 18 5.3 420.39 248.96Maryland 9 34.9 358.56 285.56Massachusetts 3 3.0 38.21 25.76
14 Includes building materials, containers and packaging supplies, machinery and equipment, meats and groceries, automotive supplies, hardware, chicks, and other supplies not separately classified.
(continued)
Continued next page
Table 3: Number1 of cooperatives, memberships,2 and gross and net sales by State, 20133

10 Cooperative Statistics, 2013
Table 3: Number1 of cooperatives, memberships,2 and gross and net sales by State, 20133
Head- quartered Member- Business volumeState in State ships Gross4 Net5
Number Thousands $Millions
Head- quartered Member- Business volumeState in State ships Gross4 Net5
Number Thousands $MillionsSUPPLY (continued)Michigan 17 30.4 1,573.82 895.90Minnesota 96 83.3 7,504.91 5,851.22Mississippi 29 28.5 630.38 370.37Missouri 38 79.3 4,420.74 3,229.27Montana 24 18.4 2,347.07 1,500.75Nebraska 19 17.0 5,341.94 3,915.17New York 5 1.4 417.50 298.71North Dakota 75 54.4 4,461.22 3,576.74Ohio 9 11.9 2,493.38 1,918.55Oklahoma 20 16.0 2,101.89 1,208.21Oregon 11 24.4 2,738.57 1,845.28Pennsylvania 6 4.4 504.13 328.67South Dakota 34 39.4 3,989.15 2,619.24Tennessee 58 64.3 2,333.19 1,747.78Texas 29 28.3 1,613.64 1,299.49Utah 6 8.6 1,052.09 543.78Virginia 34 120.5 1,920.65 1,229.77Washington 19 14.3 2,865.15 1,933.72West Virginia 9 60.6 458.70 339.65Wisconsin 49 67.2 4,727.12 3,393.60Wyoming 4 3.4 902.20 557.11Other States 11 34.6 1,774.54 1,279.95Foreign7 0 0.0 1,112.12 494.30United States 871 1,278.7 95,933.14 67,175.16 SERVICE AND ALL OTHER INCOME15 California 23 0.8 369.83 369.83Minnesota 4 0.0 940.06 940.06Mississippi 4 14.1 51.55 51.55North Carolina 3 0.1 5.66 5.66Pennsylvania 9 0.2 6.06 6.06Texas 8 0.2 308.93 308.93Wisconsin 9 0.2 219.40 219.40Other States 60 1.6 3,670.47 3,670.47 United States 120 17.1 5,571.97 5,571.97
TOTAL Alabama 48 27.9 976.85 825.78Alaska 5 3.0 319.96 217.41Arizona 9 1.8 1,143.65 1,022.27Arkansas 32 37.2 3,198.44 2,821.48California 112 34.4 12,566.25 11,430.59
TOTAL (continued)Colorado 27 20.5 2,320.06 1,747.48Connecticut 6 0.4 565.37 558.22Delaware 3 8.4 190.13 145.27Florida 30 19.6 2,209.13 1,460.73Georgia 14 13.4 1,718.20 999.78Hawaii 13 0.6 27.46 23.12Idaho 23 12.1 3,396.48 1,827.38Illinois 109 113.9 17,288.09 14,633.73Indiana 33 42.1 6,689.70 4,856.26Iowa 93 105.1 27,638.30 24,363.59Kansas 89 95.6 9,935.74 8,807.58Kentucky 26 169.4 1,508.75 1,259.35Louisiana 34 10.6 2,294.78 2,108.61Maine 22 5.4 225.46 220.22Maryland 14 36.1 835.22 677.64Massachusetts 8 3.9 512.87 290.00Michigan 43 39.4 4,976.30 4,109.60Minnesota 194 133.1 31,269.25 27,679.86Mississippi 51 49.0 1,858.15 1,592.17Missouri 60 96.8 10,589.82 8,874.36Montana 44 20.1 3,628.50 2,781.25Nebraska 51 69.7 13,492.86 12,058.13New Jersey 11 1.7 392.64 255.53New Mexico 9 0.9 954.04 521.26New York 55 5.7 3,672.25 3,194.39North Carolina 12 22.1 1,035.63 902.59North Dakota 146 80.3 11,960.96 11,063.78Ohio 41 39.8 6,388.95 5,763.62Oklahoma 53 38.8 2,993.74 2,065.64Oregon 32 31.7 6,252.64 5,273.46Pennsylvania 36 8.1 2,554.44 2,188.20South Carolina 3 2.8 250.25 210.69South Dakota 71 67.3 9,948.35 8,564.88Tennessee 61 71.8 2,618.80 1,987.61Texas 181 72.9 6,863.53 5,944.27Utah 12 11.2 1,329.04 788.18Vermont 3 1.1 689.86 677.35Virginia 53 124.3 2,589.08 1,839.96Washington 60 26.5 7,508.33 6,550.14West Virginia 14 61.6 479.39 357.93Wisconsin 125 133.3 13,255.21 11,231.16Wyoming 10 4.3 1,011.59 666.49Other States 5 0.7 407.99 303.17Foreign7 0 0.4 1,576.40 815.29United States 2,186 1,976.7 246,108.89 208,557.4615 Includes cooperatives providing services such as livestock
shipping, storing, grinding, and drying. Sales include charges for services related to marketing or purchasing, but not in-cluded in the volume reported for those activities, plus other income.
(continued)

Cooperative Statistics, 2013 11
Cooperatives are added to the list every year, usu-ally based on press releases from the cooperative or news items, but this probably leads to under-count-ing. Some cooperatives had been dropped from the list earlier but were added back when USDA was informed that they were still in operation. Most drops occur when two or more cooperatives merge their operations. It is much easier to drop a coopera-tive from the list than to add one, because undeliv-ered mail is usually returned. If a new address is not found, the cooperative is dropped.
Cooperative numbers based on function (market-ing, supply, or service) and State are shown in table 2. Texas had the most marketing cooperatives with 144, while Minnesota was second with 94. Minne-sota had the most supply and service cooperatives with 100, followed by North Dakota with 77.
Many cooperatives operate branches to better serve their members. Most branches are owned by the cooperative, but some are leased. A number of the branches are formerly independent cooperatives that served a local community. For economic or oth-er reasons, many were acquired by, or merged with, other cooperatives and are operated as branches that serve members and patrons at outlying locations.
Commodity 2013 2012 2011 2010 2009 ThousandsBean & pea (dry edible) 0.2 0.2 0.2 0.2 0.2Cotton 4.4 2.3 2.2 1.8 1.4Cotton ginning 1.1 1.1 1.1 1.1 1.1Dairy 21.0 21.0 20.7 18.9 24.9Fish 0.7 0.7 0.7 0.7 0.7Fruit and vegetable 14.2 13.2 13.5 13.3 13.6Grain and oilseed 23.5 21.6 24.9 22.4 20.4Livestock 0.5 0.6 0.6 0.6 0.7Nut 1.3 1.1 1.1 0.3 0.3Poultry 1.7 1.7 2.0 2.0 1.7Rice 2.5 2.3 2.5 2.4 2.5Sugar 6.9 5.9 5.7 5.5 5.7Other marketing 0.5 0.6 0.7 0.7 1.9Total marketing 78.4 72.3 75.7 70.1 75.2 Total supplies 56.6 56.0 53.8 57.6 46.1 Total services 1.2 1.2 1.3 1.3 1.3 Total 136.2 129.4 130.8 129.0 122.5
Table 4: Cooperatives’ number of full-time employees, 2013-2009
0
0.5
1
1.5
2
2004 2005 2006 2007 2008 2009 2010 2011 2012 2013
Million
Service
Supply
Marketing
Figure 3: Cooperative Memberships by Function, 2004-2013

12 Cooperative Statistics, 2013
Grain and oilseed and supply cooperatives oper-ated over 5,000 branches—2,267 and 2,797 respec-tively. Grain and oilseed cooperatives averaged almost 5 branches per cooperative while supply cooperatives averaged about 3.
Memberships
Memberships in marketing, supply, and service cooperatives were an estimated 2 million in 2013, down 140,000 from 2012 (table 3). There were membership increases in 2011, but generally mem-berships have been declining, as has the number of U.S. farms. About 65 percent of the memberships were in supply cooperatives, while 20 percent of the memberships were in grain and oilseed coopera-tives (appendix table 2, figure 2). Dairy coopera-tive memberships were only 2 percent of the total, but dairy cooperatives accounted for 19 percent, or $40 billion, of cooperatives’ net business volume in 2013.
Memberships in coopera-tives dropped from 2.6 mil-lion in 2004 to 2.0 million in 2013 (figure 3). The long term decline largely reflects the decreasing number of farms, farmers, and ranchers in the United States (appen-dix figure 2). Many farmers and ranchers are members of more than one coopera-tive, and each membership is counted. Consequently, the number of memberships has long exceeded the number of farms, but now they are slightly less. Duplication in membership cannot be elimi-nated with current reporting methods.
Member classification depends on the type of co-operative used and may not be related to the member’s product(s) marketed or sup-plies purchased. For example, a member may market only
one of the products handled by the cooperative; another may use a cooperative classified in the mar-keting group to purchase one or more supply items. Therefore, a member’s business with a cooperative may not be in the group that represents the coop-erative’s major business volume (the criterion for classifying cooperatives in this report). The mem-bership, however, will be included arbitrarily in that classification.
During the past decade, membership in market-ing and supply cooperatives both declined about 330,000. Service cooperatives increased member-ships by about 15,000 during the same time period.
Employees
Cooperatives had an estimated 136,000 full-time employees in 2013, an increase of about 7,000 from 2012 (table 4). With sales increasing over the last 3 years, it appears that some cooperatives have added employees. Cotton and grain and oilseed coopera-
Principal product(s) Total Part-time & marketed employees Full-time seasonalor major function 2013 2012 2013 2012 2013 2012 Products marketed Thousands Bean & pea (dry edible) 0.2 0.2 0.2 0.2 0.0 0.0Cotton 4.6 2.5 4.4 2.3 0.2 0.2Cotton ginning 3.5 3.6 1.1 1.1 2.4 2.5Dairy 22.0 22.0 21.0 21.0 1.1 1.0Fish 0.9 0.9 0.7 0.7 0.2 0.2Fruit and vegetable 30.5 29.3 14.2 13.2 16.3 16.1Grain and oilseed 33.2 32.3 23.5 21.6 9.7 10.7Livestock and poultry 3.3 3.7 2.3 2.3 1.1 1.4Rice 2.7 2.6 2.5 2.3 0.2 0.3Sugar 11.8 11.1 6.9 5.9 4.9 5.2Other marketing2 2.7 2.8 1.8 1.7 0.9 1.1 Total marketing 115.5 111.1 78.4 72.3 37.1 38.8 Total supplies 73.6 72.6 56.6 56.0 17.0 16.6 Total services 2.0 2.0 1.2 1.2 0.8 0.8 Total 191.1 185.6 136.2 129.4 54.9 56.2
1 Totals may not add due to rounding.2 Includes nut, bioenergy, tobacco, wool, and other product marketing cooperatives.
Table 5: Full-time and part-time and seasonal employees of cooperatives, by cooperative type, 2013-20121

Cooperative Statistics, 2013 13
tives both added about 2,000 full-time employees, and sugar and fruit and vegetable cooperatives both added about 1,000.
In 2013, cooperatives employed an estimated 191,000 full-time and part-time and seasonal em-ployees (table 5), about 5,000 more employees than in 2012. Among marketing cooperatives, grain and oilseed had the most employees (33,200), followed by those co-ops that primarily handle fruits and vegetables (30,500) and dairy (22,000).
By type, marketing cooperatives had 115,500 full-time and part-time and seasonal employees (60 percent of total); supply cooperatives had 73,600 (39 percent); and service cooperatives had 2,000 (1 percent).
Figure 4 shows the number of full-time and part-time and seasonal employees by type of coopera-tive for 2013. Supply, grain and oilseed, fruit and vegetable, and dairy cooperatives used the most employees; fish cooperatives had the fewest. Dairy, rice, cotton, and dry bean and pea cooperatives had
the smallest proportion of part-time and seasonal employees to total employees. Cotton ginning and fruit and vegetable cooperatives had more than half of their employees as part-time and seasonal em-ployees, while about 42 percent of sugar coopera-tives employees were part-time and seasonal.
Cooperatives used 55,000 part-time and seasonal employees in 2013, down around 1,400, or 2 per-cent, from 2012. Grain and oilseed cooperatives decreased their use of part-time and seasonal em-ployees in 2013 by more than 1,000.
In 2013, marketing cooperatives reported hav-ing 37,000 part-time and seasonal employees, or 68 percent of the total across all categories. Marketing cooperatives averaged 31 part-time and seasonal employees per operation. Fruit and vegetable coop-eratives, with 16,300, accounted for about 30 per-cent of all part-time and seasonal employees used by cooperatives. Supply cooperatives had 17,000 part-time and seasonal employees, an average of 20 per cooperative.
0 10 20 30 40 50 60 70 80
Supply
Grain and oilseed
Fruit and vegetable
Dairy
Sugar
Cotton
Cotton ginning
Livestock and poultry
Rice
Service
Fish
1,000 Employees
1 Includes dry bean and pea, nut, bioenergy, tobacco, wool and mohair, and other product marketing cooperatives.
-time and seasonal
Other marketing1
Full-time
Part
Figure 4: Full-Time and Part-Time and Seasonal Employees, by Cooperative Type, 2013

14 Cooperative Statistics, 2013
Cooperatives Dollar volume Memberships2 Sales volume Percent Gross3 Percent Number Percentgroup (million $) Number of total (billion $) of total (1,000) of total Less than 5.0 726 33.2 1.18 0.5 172 8.7 5 - 9.9 264 12.1 1.92 0.8 137 6.9 10 - 14.9 162 7.4 1.99 0.8 87 4.4 15 - 24.9 201 9.2 4.00 1.6 150 7.6 25 - 49.9 259 11.8 9.06 3.7 217 11.0 50 - 99.9 193 8.8 13.51 5.5 177 9.0 100 - 199.9 134 6.1 18.74 7.6 169 8.6 200 - 499.9 135 6.2 31.48 12.8 329 16.6 500 - 999.9 79 3.6 30.97 12.6 146 7.41,000 and more 33 1.5 133.26 54.1 392 19.8Total4 2,186 100.0 246.11 100.0 1,977 100.0
1 Business volume includes revenues from marketing plus the value of products bargained for or handled on a commission basis, supply sales, service receipts, and other income.2 Includes number of farmers, ranchers, and fishermen eligible to vote for directors. Does not in-clude memberships held by other cooperatives, such as local cooperative memberships in regional cooperatives.3 Includes inter-cooperative business volume. 4 Total may not add due to rounding
Table 6: Cooperatives and memberships, by gross business volume, 20131
In 2013, 53 percent of all cooperatives reported a business volume of less than $15 million. How-ever, they accounted for around 2 percent of the total gross dol-lar volume (figure 6). About 11 percent of cooperatives reported a business volume of at least $200 million, but they accounted for almost 80 percent of the total sales.
Business Volume
Total gross business volume of the 2,186 marketing, supply, and service coop-eratives for 2013 was $246 billion (table 7),
up about $8 billion from $238 billion in 2012. His-torically, gross business volume fell from a record $128 billion in 1996 to $112 billion in 2002. How-ever, this has not been a steady decline. Some years saw increases to $120 billion, while other years fell to $115 billion or less (appendix table 3, appendix figure 4). The historical high in 1996 was almost matched in 2006, then was eclipsed in 2007 through 2013.
Grain and oilseed cooperatives had a gain of more than $2.5 billion while dairy cooperatives had an increase of almost $1.4 billion. Continued strong grain prices, higher dairy prices and strong energy prices were the main causes of grain, dairy, and sup-ply sales increases. Petroleum products led the sup-ply sales gain, with an increase of $1.7 billion. Feed sales increased by $1 billion, and crop protectants by almost $500 million.
Total net business volume of cooperatives in 2013 was up almost $3 billion from 2012 (net sales equal gross sales minus sales between coopera-tives). The net volume for 2013 was $209 billion, compared to $203 billion in 2012. The net sales
Most types of marketing cooperatives operated with more employees than did supply cooperatives. For example, sugar cooperatives averaged 437 em-ployees; cotton, 385; rice, 225; and supply coopera-tives, 86 (figure 5).
Business Size
As measured by annual gross business volume, most cooperatives are relatively small and serve local areas. Some actively seek regional, national, and even international markets to increase business volume. Although few in number, larger coopera-tives account for much of cooperatives’ business volume. They have grown in size partly from merg-ers, consolidations, and acquisitions. From 2004 to 2013, there were 859 fewer cooperatives with less than $25 million in sales, while there were 181 cooperatives that moved up into the sales group of more than $25 million in sales. The sales group of $200 million to $499.9 million had the most growth, increasing from 44 cooperatives in 2004 to 135 in 2013 (table 6).

Cooperative Statistics, 2013 15
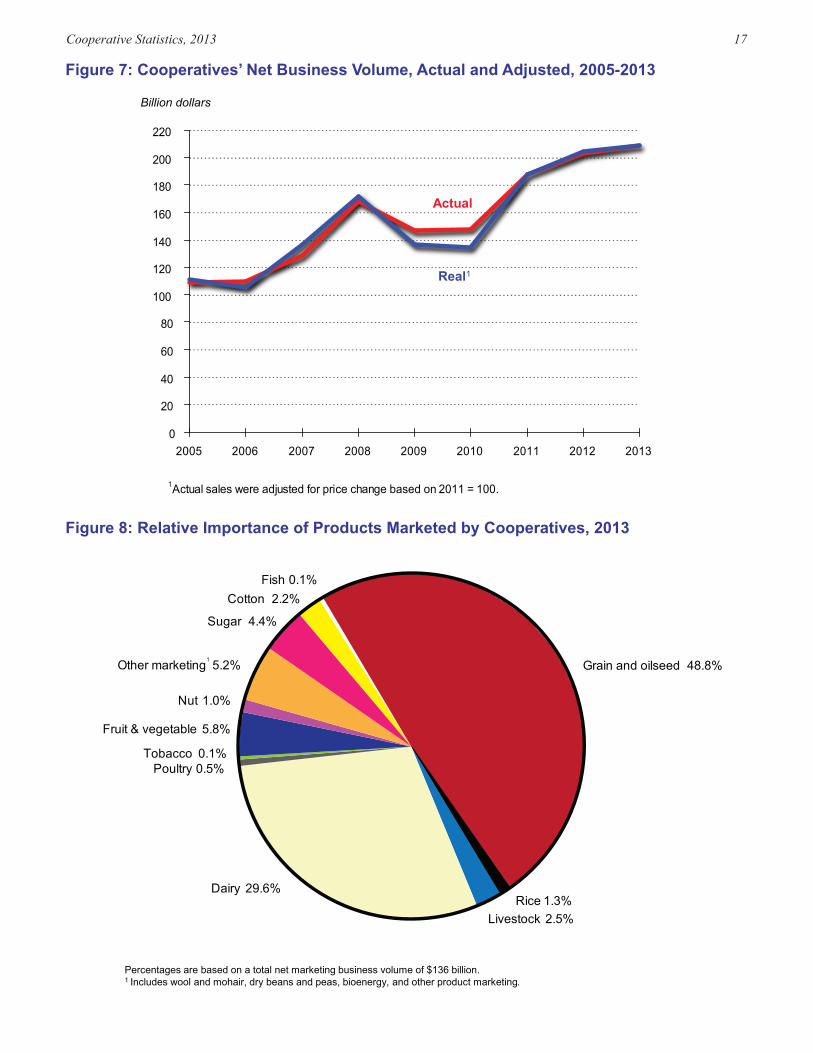
breakdown was $136 billion from products mar-keted, $67 billion from supply sales, and $6 billion from services performed and other income sources. The $209 billion was the highest total ever (ap-pendix table 4, appendix figure 5). There have been a number of fluctuations in net business volume during the past two decades. Net volume dropped to around $100 billion in 1999 and stayed there until the current upward trend started in 2003, then soared, due to increased grain and oilseed prices and energy costs, from 2007 through 2013. Adjusted for inflation2 (where 2011 = 100), net business vol-ume was $111 billion in 2005 and increased to $172 billion in 2008, before falling to around $136 billion in both 2009 and 2010. It then increased to $187 billion in 2011 and $209 billion in 2013 (figure 7).
There was no difference between actual and real net business volume in 2013 because the prices paid for production inputs index was 110 and was almost equal to the prices received for farm products index of 109.
Net volume of products marketed increased 2 percent from 2012. Net marketing business volume accounted for 65 percent of net cooperative sales in 2013, the same as 2012.
Figure 8 illustrates the leading products marketed by cooperatives based on net marketing business volume. Grain and oilseed led with 49 percent of sales, followed by dairy with 30 percent, and sugar and fruit and vegetable, both with 4 percent.
Net supply volume of $67 billion was almost $2.5 billion higher than 2012 and accounted for 32 percent of the total net business volume. The lead-ing production goods handled by cooperatives in terms of supply net business volume were petro-leum at 36 percent, fertilizer at 21 percent, and feed at 19 percent (Figure 9). Petroleum sales increased by more than $1 billion, while feed sales grew by almost $900 million.
Receipts for services provided by marketing, supply, and service cooperatives, plus other income, increased by almost $900 million, to $5.6 billion.
Commodity Gross volume Net volume 2013 2012 2013 2012Products marketed Billion $ Bean & pea (dry edible) .247 .176 .243 .172Cotton 3.079 3.176 2.987 3.089Dairy 42.729 41.378 40.184 39.739Fish .185 .189 .185 .189Fruit & vegetable 8.157 8.014 5.890 5.751Grain & oilseed2 67.007 64.454 66.252 63.710Livestock 3.345 4.020 3.345 4.020Nut 1.337 1.105 1.334 1.103Poultry3 .727 1.454 .727 1.454Rice 1.732 1.553 1.732 1.553Sugar 8.706 8.533 6.030 5.996Tobacco .137 .120 .137 .120Wool and mohair .005 .005 .005 .005Other marketing4 7.211 6.681 6.759 6.273Total marketing 144.604 140.859 135.810 133.175 Supplies purchased: Crop protectants 11.586 11.124 7.332 7.194Feed 16.183 15.109 12.717 11.841Fertilizer 17.656 17.758 14.016 14.186Petroleum 38.524 36.804 24.397 23.357Seed 5.542 5.595 3.357 3.266Other supplies5 6.442 5.810 5.356 4.869Total supplies 95.933 92.199 67.175 64.712 Services and all other income6 5.572 4.715 5.572 4.715 Total business 246.109 237.773 208.557 202.603
1 Gross includes and net excludes inter-cooperative business. Totals may not add due to rounding.2 Excludes cottonseed. Cottonseed oil is included in other mar-ketings whereas cottonseed meal is included in feed.3 Includes eggs, turkeys, ratite, squab, and related products.4 Includes cotton ginning, coffee, forest products, hay, hops, seed marketed for growers, nursery stock, ethanol, other farm products not separately classified, and sales of products not received directly from member patrons. Also includes manu-factured food products and resale items marketed by coopera-tives.5 Includes artificial insemination, building materials, containers and packaging supplies, machinery and equipment, meats and groceries, automotive supplies, hardware, chicks, and other supplies not separately classified.6 Includes trucking, storage, grinding, application, locker plants, and other related items. Services include charges related to marketing or purchasing, but not included in the volume reported for those activities, plus other income and extraordinary items.
2 Marketing sales were deflated by the index of pro-ducer prices received for “all farm products” (2011 = 100). Supply sales and service receipts and other income were deflated by the index of prices paid by farmers for “production items,” excluding interest, taxes, and wages (2011 = 100).
Table 7: Cooperatives’ gross and net busi-ness volumes by commodity, 2013 & 20121

16 Cooperative Statistics, 2013
0 50 100 150 200 250 300 350 400 450
Sugar
Cotton
Rice
Fruit and vegetable
Dairy
Poultry
Nut
Supplies
Grain and oilseed
Cotton ginning
Fish
Service
Number
-
-
Full time
Part time and seasonal
0
10
20
30
40
50
60
70
Less than 5.0 5 - 9.9 10 - 14.9 15 - 99.9 100 - 499.9 500 and more
Gross business volume ( Million dollars )
Percent
Cooperatives
Dollar volume
Figure 5: Average Full-Time and Part-Time and Seasonal Employees, 2013
Figure 6: Distribution of Cooperatives and Volume, by Size, 2013
Cooperative Statistics, 2013 17
0
20
40
60
80
100
120
140
160
180
200
220
2005 2006 2007 2008 2009 2010 2011 2012 2013
1 Actual sales were adjusted for price change based on 2011 = 100.
Billion dollars
Actual
Real1
Fruit & vegetable 5.8%
Tobacco 0.1%
Nut 1.0%
Sugar 4.4%
Cotton 2.2%
Poultry 0.5%
Grain and oilseed 48.8%
Rice 1.3%Livestock 2.5%
Dairy 29.6%
Fish 0.1%
Percentages are based on a total net marketing business volume of $136 billion.1 Includes wool and mohair, dry beans and peas, bioenergy, and other product marketing.
Other marketing 5.2%1
Figure 7: Cooperatives’ Net Business Volume, Actual and Adjusted, 2005-2013
Figure 8: Relative Importance of Products Marketed by Cooperatives, 2013

18 Cooperative Statistics, 2013
Fertilizer 20.9%
Seed 5.0%
Petroleum 36.3%
Crop protectants 10.9%
Feed 18.9%
Percentages are based on a total net supply business volume of $67 billion.1 Includes building materials, tires, batteries and accessories, equipment, animal health products, pet food, semen, hardware, food, clothing,
and other.
Other supplies 8.0%1
0
10
20
30
40
50
60
70
2004 2005 2006 2007 2008 2009 2010 2011 2012 2013
Grain & oilseed
Sugar
Billion dollars
Milk & milkproducts
Fruit & vegetable
Figure 9: Relative Importance of Supplies Handled by Cooperatives, 2013
Figure 10: Cooperatives’ Net Sales of Selected Commodities, 2004-2013

Cooperative Statistics, 2013 19
Service receipts and other income represented al-most 3 percent of total net business volume.
Marketing sales of four major commodity groups—grain and oilseed, dairy, fruit and vegeta-ble, and sugar—were up from 81 percent of market-ing sales in 2004 to 87 percent in 2013 (figure 10). Grain and oilseed sales increased by $43 billion, mainly due to price increases. Dairy sales increased by $12 billion, while sugar sales grew by over $2 billion. Net volume among commodity groups was highest in 2013 for grain and oilseed at $66 bil-lion (compared to $23 billion in 2004), followed by dairy with $40 billion.
Feed and fertilizer are important farm inputs for supply cooperatives (figure 11), but petroleum was especially important in 2013, accounting for $10 billion more in sales than either feed or fertilizer. The combination of petroleum, feed, and fertilizer sales accounted for 76 percent of cooperatives’ total
supply sales in 2013 and 71 percent in 2004.
Gross and net business vol-umes by State are presented in table 3. Sales are allocated to the State in which the product marketed was originated and the supplies were sold. Min-nesota led all States with more than $31 billion in gross busi-ness volume and almost $28 billion in net business volume. Iowa was second with almost $28 billion in gross business volume and more than $24 bil-lion in net cooperative business volume.
Balance Sheet
The balance sheet of a coopera-tive states its financial position at the end of a 12-month fiscal year. The balance sheet repre-sents the cooperative’s assets, liabilities, member equity, and their mutual relationships. Combined assets for all coop-eratives in 2013 were just short
of the record $83 billion in 2012— only about $800 million lower in 2013, at almost $83 billion (table 8). Total assets of cooperatives, excluding inter-cooperative investments, decreased by $1.3 billion from 2012, to $78 billion in 2013. Cooperatives’ total assets grew from $46 billion in 2004 to $83 billion in 2013 (appendix table 5 and figure 12).
In 2004, 10 percent, or $4.7 billion, of total as-sets was invested in other cooperatives, including CoBank. In 2013, these investments were $5.2 bil-lion, up $500 million from 2004. This represented 6.3 percent of total assets, 4 points lower than a decade ago.
Of the $83 billion in total assets, marketing cooperatives accounted for $43 billion, about $700 million more than in 2012. Grain and oilseed cooperatives had about $19 billion in assets, more than double the assets of dairy cooperatives ($8.9 billion) and almost four times the assets of fruit
Principal product(s) Assets Investments Investments inmarketed and of own in other Total other co-ops as major function Co-ops2 operations co-ops3 assets percent of total
Products No. Billion $ Percent marketedCotton 12 .961 .010 .971 1.1Cotton ginning 148 .428 .071 .499 14.3Dairy 127 8.741 .169 8.911 1.9Fish 39 .082 .000 .082 0.0Fruit & vegetable 145 4.959 .100 5.060 2.0Grain & oilseed 490 17.635 1.660 19.295 8.6Livestock & poultry 103 .736 .015 .751 2.0Rice 12 .969 .015 .984 1.5Sugar 27 4.059 .036 4.094 0.9Other marketing4 92 1.624 .024 1.648 1.4Total marketing 1,195 40.194 2.101 42.295 5.0 Total supplies 871 36.750 3.102 39.852 7.8 Total services 120 .377 .034 .411 8.3 Total 2,186 77.322 5.236 82.558 6.3
1 Totals may not add due to rounding.2 Many cooperatives have multi-product and multi-functional operations. Most are classified according to predominant commodity or function as indicated by business volume.3 Also includes investments in CoBank.4 Includes dry edible bean and pea, nuts, tobacco, wool, and other marketing.
Table 8: Combined assets of cooperatives, 20131

20 Cooperative Statistics, 2013
and vegetable cooperatives ($5.1 billion). All three of these types of marketing cooperatives have less combined assets than supply cooperatives ($40 bil-lion).
Table 9 compares common-size balance sheets for six sizes of cooperatives (for all types and sizes, see appendix table 6). Common-size balance sheets present all accounts as a percentage of total assets, allowing comparison between different sizes and types of cooperatives.
Current AssetsCurrent assets are generally comprised of cash and cash equivalents, accounts and notes (with short-term maturities) receivable, inventories, and prepaid expenses. Current assets were about 62 percent for all sizes of cooperatives, down from 63 percent in 2012. Smaller cooperatives—especially service, most sugar, bioenergy, and cotton ginning coopera-tives—had smaller levels of current assets. Grain and oilseed, livestock, dry bean and pea, and larger cooperatives tended to have higher levels of current assets.
Investments and Other AssetsInvestments were most often in other cooperatives and CoBank. “Other assets” is a catch-all category in this study and contains a wide variety of items. Investments ranged from 9 percent of all assets for small cooperatives up to 13 percent for coopera-tives with sales of $5 million to $15 million. The largest cooperatives accounted for 4 percent of investments. Investments were larger for supply cooperatives than most marketing cooperatives.
All but the largest (intra-state) supply coopera-tives generally purchase their inputs from (inter-state) regional supply cooperatives, hence the large investments in other cooperatives. Large dairy, smaller fresh fruit and vegetable, service (except fresh fruit and vegetable service), cotton, fish, poul-try, nut, tobacco, rice, sugar, and most livestock cooperatives all had low investments levels—often less than 4 percent of all assets.
Property, Plant, and EquipmentNet property, plant, and equipment (net PP&E) are tangible assets used by a cooperative’s operations. PP&E averaged between 24 and 31 percent of total assets for all sizes of cooperatives. Biofuels, medi-
0
5
10
15
20
25
2004 2005 2006 2007 2008 2009 2010 2011 2012 2013
Fertilizer
Seed
Billion dollars
Petroleum
Cropprotectants
Feed
Figure 11: Cooperatives’ Net Sales of Selected Supplies, 2004-2013

Cooperative Statistics, 2013 21
Cooperative sales size All ≥ $500 From $100 to From $15 to From $5 to < $5 sizes million $500 million $100 million $15 million million
Balance sheet Percent of total assetsCurrent assets 60.61 61.76 58.61 60.14 55.94 52.26Other assets 8.70 10.03 8.41 3.16 7.14 7.43Investments 6.24 3.73 8.78 12.26 13.11 9.26PP&E1 (net) 24.44 24.48 24.20 24.44 23.81 31.05Total assets 100.00 100.00 100.00 100.00 100.00 100.00 Current liabilities 41.95 42.22 42.15 42.22 36.01 30.41Total liabilities 58.15 61.37 55.52 50.88 45.09 43.13Allocated equity 26.08 26.57 21.67 28.42 36.87 41.62Retained earnings 15.78 12.05 22.81 20.74 18.04 15.25Total equity 41.86 38.63 44.48 49.16 54.91 56.87Total equity and liabilities 100.00 100.00 100.00 100.00 100.00 100.00
Income statement Percent of total salesTotal sales 100.00 100.00 100.00 100.00 100.00 100.00Cost of goods sold 91.49 92.09 90.96 89.60 86.03 85.21Gross margin 8.51 7.91 9.04 10.40 13.97 14.79 Service and other income 1.47 0.88 1.87 3.29 6.51 15.69Gross revenue 9.98 8.79 10.91 13.70 20.48 30.48
Expenses Wages 3.76 3.17 4.38 5.51 8.02 12.22Depreciation 0.92 0.79 1.10 1.26 1.68 2.36Interest 0.40 0.40 0.39 0.38 0.57 0.69Other 3.16 2.66 3.53 4.78 7.50 13.29Total expenses 8.24 7.02 9.40 11.93 17.78 28.57 Net operating margins 1.74 1.77 1.51 1.77 2.70 1.91Patronage income 0.50 0.19 1.01 1.37 1.72 1.63Non-operating income 0.32 0.27 0.42 0.43 0.42 0.11Net income before taxes 2.56 2.23 2.94 3.57 4.84 4.31Taxes 0.25 0.21 0.37 0.32 0.25 0.11Net income 2.31 2.02 2.57 3.25 4.59 4.21
Ratios Percent or number Current 1.45 1.46 1.39 1.42 1.55 1.72Debt-to-asset 0.58 0.61 0.56 0.51 0.45 0.43Debt-to-equity 1.39 1.59 1.25 1.03 0.82 0.76Retained-earnings-to-equity 37.69 31.21 51.27 42.18 32.86 26.81Equity-to-assets 41.86 38.63 44.48 49.16 54.91 56.87Adjusted-equity-to-assets 72.10 66.85 76.89 85.08 85.82 81.72Return-on-assets 8.61 8.51 8.51 9.20 9.58 7.10Return-on-member-equity 25.76 24.64 30.29 26.64 22.01 14.34 Extra value index +2 9.51 9.42 9.15 10.67 10.23 6.24Extra value index +5 7.34 7.41 6.84 8.12 7.65 3.79Extra value index +10 3.74 4.07 3.00 3.87 3.36 -0.30
1 Property, plant, and equipment
Table 9: Common size analysis by cooperative size, 2013

22 Cooperative Statistics, 2013
Principal product(s) marketed and Total Total Net major function Co-ops assets liabilities worth Products marketed No. Billion dollars
Cotton 12 .97 .55 .42Cotton ginning 148 .50 .21 .29Dairy 127 8.91 6.01 2.90Fish 39 .08 .05 .03Fruit & vegetable 145 5.06 2.63 2.43Grain & oilseed 490 19.30 11.60 7.69Livestock & poultry 103 .75 .49 .26Rice 12 .98 .40 .58Sugar 27 4.09 2.12 1.97Other marketing2 92 1.65 .74 .90Total marketing 1,195 42.30 24.80 17.49 Total supplies 871 39.85 22.97 16.88 Total services 120 .41 .15 .26 Total 2,186 82.56 47.92 34.64
1 Totals may not add due to rounding.2 Includes dry edible bean and pea, nut, bioenergy, tobacco, wool, cottonseed, and other marketing.
Principal product(s) Patron-marketed and Income Net agemajor before operating in- function Co-ops taxes margins come2
Products No. Million dollarsmarketed
Cotton 12 -83.3 -84.8 1.4Cotton ginning 148 68.0 42.2 25.8Dairy 127 312.7 277.3 35.4Fish 39 9.7 9.7 .0Fruit & vegetable 145 600.0 593.0 6.9Grain & oilseed 490 1,188.7 787.2 401.5Livestock & poultry 103 17.2 13.8 3.4Rice 12 111.2 110.2 1.1Sugar 27 239.3 237.6 1.7Other marketing3 92 116.3 113.7 2.6Total marketing 1,195 2,579.8 2,100.0 479.8 Total supplies 871 3,529.1 2,785.6 743.6 Total services 120 43.2 42.2 1.0 Total 2,186 6,152.1 4,927.7 1,224.4 1 Adjusted for losses and before taxes. Before-tax income is used in this table because historically, after-tax net income was not collected. Totals may not add due to rounding.2 Includes patronage refunds from CoBank.3 Includes dry edible bean and pea, nut, bioenergy, tobacco, wool, cottonseed, and other marketing.um and large sugar, smaller cotton ginning, smaller
fresh fruit and vegetable, small nut, small fish, and service (except dairy, cotton, and fresh fruit and vegetable) cooperatives all had PP&E of at least 40 percent of their assets.
Current Liabilities Current liabilities are all obligations that will be paid with the use of current assets and are usually paid within 1 year. Current liabilities are comprised of notes payable to banks and/or other trade credi-tors, accounts payable, current maturities of long-term debt, income taxes, other accrued liabilities (payroll, property taxes, interest, and other), patron-age dividends payable, and miscellaneous or other current liabilities. Current liabilities were at least 30 percent of total assets and grew to 42 percent for larger cooperatives. Product marketing cooperatives tended to have higher levels of current liabilities than supply and service cooperatives.
Total Liabilities Total liabilities include current liabilities plus long-term liabilities, which are primarily long-term debt. In the aggregate, all types and sizes of cooperatives had some long-term debt. Smaller cooperatives all had at least 9 percent of their assets financed through long-term debt. Generally, the largest co-operatives used the most debt, financing 21 percent of their assets through borrowing. Nut, large dairy, large fruit and vegetable, small fish, storage, hull-ing, and farmer market cooperatives all financed about 20 percent or more of their assets with long-term debt.
Total liabilities were $48 billion, down $5 billion from 2012 (table 10). Cooperatives’ total liabilities grew fairly steadily from $26 billion in 2004 to $53 billion in 2012. Total liabilities financed 58 percent
Table 10: Combined balance sheet data of cooperatives, 20131
Table 11: Cooperatives’ net income before taxes, 20131

Cooperative Statistics, 2013 23
of total assets in 2013, about 6 points lower than in 2012.
Allocated (or Member) Equities Allocated (or member) equities represent member ownership of each cooperative. Comparing allo-cated equities to total assets determines the percent of the cooperative’s assets owned by members. Al-located equity comprised just 26 percent of owner-ship of all sizes of cooperatives, up 3 points from 2012. The very largest cooperatives had the smallest percentages of both retained earnings and overall equity.
Net worth, or member and patron equity, was $35 billion, up over $4 billion from 2012. The propor-tion of total assets financed by member and patron equity was 42 percent, up 6 percentage points from 2012. Net worth for all marketing cooperatives was $17 billion, up over $2 billion from 2012. Market-ing cooperatives accounted for 51 percent of coop-eratives’ combined net worth, up almost 2 points from 2012. Net worth for supply cooperatives also totaled $17 billion, representing 49 percent of
the total. For marketing cooperatives, the highest percentage of total assets represented by net worth (figure 13) was 64 percent, by service cooperatives. Dairy cooperatives ranked lowest at 33 percent.
Income Statement
The income statement shows the net results of a cooperative’s operations. Because most manag-ers’ performance is judged by net income, members attach great importance to the income statement. Table 9 presents a common-size income statement for all cooperatives, based on six sizes. Each item in a common-size income statement is represented as a percentage of total sales or service. Common-size income statements by cooperative type and size are presented in appendix table 6.
Total (Net) SalesTotal (net) sales are all sales less discounts, returns, and allowances from gross sales. Service coopera-tives do not have a total sales value: the first income statement item for these cooperatives is service.
0
10
20
30
40
50
60
70
80
90
2004 2005 2006 2007 2008 2009 2010 2011 2012 2013
Liabilities
Net worth
Assets
Billion Dollars
Figure 12: Cooperatives’ Assets, Liabilities, and Net Worth, 2004-2013

24 Cooperative Statistics, 2013
Cost of Goods SoldCost of goods sold (COGS) includes the beginning inventory plus purchases and freight costs, minus purchase returns and allowances, purchase dis-counts, and ending inventory. COGS, therefore, was the purchase price of the supplies sold or products marketed. For all sizes of cooperatives, COGS was 91 percent of net sales. COGS can be much lower for cooperatives that process products or provide technical services.
Artificial insemination cooperatives, processed and fresh fruit and vegetable cooperatives, smaller cotton ginning, larger fish, smaller nut, larger rice, and larger sugar cooperatives have a lower COGS. Grain and oilseed, livestock marketing, large poul-try, small rice, small sugar, and most dairy coopera-tives have a COGS in excess of 90 percent, while large livestock marketing cooperatives that operate mainly as auctions have a COGS of 99 percent.
Gross MarginsThe excess of net sales over the cost of goods sold is the gross margin or gross margin percentage. A
small change in the gross margin can substantially impact net operating margins. A cooperative man-ager must maintain a gross margin near industry averages. Thus, least-cost sources of supplies need to be developed and marketing cooperatives need to pay market rates on the products they purchase.
Cooperatives are often characterized as business-es that provide goods and services “at cost.” How-ever, a cooperative cannot operate at cost on a daily basis. Cooperatives need adequate gross margins to be profitable and to afford to finance essential future-directed discretionary expenditures, such as expansion and advertising.
Gross margin equals net sales less cost of goods sold, so cooperatives with higher COGS had lower gross margins. The COGS was about 1 point higher for the very largest cooperatives than for the other sizes. As discussed earlier, those cooperatives with a low COGS would have high gross margins.
Service and Other Operating IncomeService and other operating income is derived from any service cooperatives provide. Some coopera-
0 10 20 30 40 50 60 70
Service
Rice
Cotton ginning
Sugar
Fruit & vegetable
Cotton
Supply
Fish
Grain & oilseed
Livestock & poultry
Dairy
1 Includes dry bean and pea, nut, bioenergy, tobacco, wool and mohair, and other product marketing cooperatives.
Percent
Other marketing1
Figure 13: Percentage of Assets Financed by Net Worth, by Cooperative Type, 2013

Cooperative Statistics, 2013 25
tives only provide services. Service-only co-ops include: rice driers, storage, transportation, auc-tions, hulling, seed development, locker plants, pest management, scouting, farmer markets, and miscel-laneous services. Service income is important to marketing and supply cooperatives. They provide hauling, storage, grading, delivery, custom applica-tion, recordkeeping, and drying, to name some of the most common services. Other operating income is generated from sales activities and includes in-come from providing financing for sales.
For service cooperatives, service is 100 percent on their income statement. By cooperative size, service income is most important for smaller coop-eratives (16 percent of sales) and diminishes as size increases to cooperatives with over $500 million in sales (1 percent of sales). Many of the cotton gin-ning cooperatives have a significant amount of ser-vice income; hence service income ranges from 24 percent to 81 percent of sales for these cooperatives.
Operating ExpensesThere are only four categories for expenses in table 9: wages, depreciation, interest, and “all other.”
Wages includes salaries and wages, payroll taxes, employee insurance, unemployment compensa-tion, and pension expense. The “all other” account includes administrative expenses, which are over-head costs and indirectly related to a cooperative’s revenue. These include professional services, office supplies, telephone, meetings and travel, donations, dues and subscriptions, directors’ fees and expense, and annual meetings. The “all other” category also includes general expenses, which are directly re-lated to revenue, such as advertising and promotion; auto and truck delivery; insurance; property, busi-ness, and other taxes and licenses; rent and lease expenses; plant supplies and repairs; repairs and maintenance; utilities; miscellaneous; bad debts; and other expenses.
Wage expenses were the highest for smaller cooperatives and fell as cooperative size increased, from 12 percent for the smallest cooperatives, to 3 percent for the largest. Wage expenses were higher for service cooperatives because they are gener-ally small and lack other sales to spread out wage costs. Artificial insemination cooperatives had wage expenses that were more than 41 percent of sales;
0.0
1.0
2.0
3.0
4.0
5.0
6.0
7.0
2004 2005 2006 2007 2008 2009 2010 2011 2012 2013
Billion dollars
1 Includes dividends and patronage refunds from other cooperatives and CoBank.
Net operatingmargins
Incomefrom othercooperatives1
Net incomebefore taxes
Figure 14: Cooperatives’ Net Income Before Taxes, 2004-2013

26 Cooperative Statistics, 2013
those of smaller cotton ginning cooperatives aver-aged almost 33 percent of sales. Dairy, grain and oilseed, larger and mid-sized livestock marketing (auctions), bioenergy, large nut, smaller rice, and small sugar cooperatives had lower wage expenses relative to sales.
Depreciation expenses did not change much with cooperative size, ranging from 2 percent for the smallest cooperatives to 1 percent for the larg-est cooperatives. Smaller cotton ginning coopera-tives, small nut, and service cooperatives (except dairy, livestock, fruit and vegetable, and cotton) had depreciation expenses of at least 5 percent of sales. Most livestock cooperatives had little PP&E, so depreciation expenses were less than 1 percent. Large cotton, most dairy, small and mid-size fruit and vegetable, grain and oilseed, large supply, small fish, small rice, large nut, and small sugar coopera-tives also had depreciation expenses of less than 1 percent.
Interest expenses were relatively minor for all sizes of cooperatives, comprising less than 1 percent of total sales. Cotton service, small cotton ginning, farmer markets, and small nut cooperatives had interest expenses greater than 2 percent of sales.
Other expenses fell as cooperatives grew larger. This account is the difference between total expens-es and the sum of wages, depreciation, and interest, so it can be overstated when these three accounts are estimated for the few cooperatives that did not break out individual expenses on the survey or in their annual report. As a result, other expenses in this report may be larger than expected.
Net Operating MarginsNet operating margins is calculated by taking gross margins minus total expenses before taxes, and not counting patronage refunds from other cooperatives. So, it is income generated by a cooperative’s own operations. Net operating margins for all coopera-tives in 2013 was $4.9 billion, excluding inter-cooperative dividends and refunds (table 11). Net operating margins was about $300 million lower than in 2012.
Net operating margins as a percent of net sales was 2 percent for all cooperatives by size (table 9). Most service cooperatives (except livestock), arti-
State Herds Cows DHI Cows Number PercentageAlabama 20 3,315 100Arizona 18 47,665 97Arkansas 16 2,301 100California 702 913,104 100Colorado 30 38,175 76Connecticut 76 12,507 100Delaware 26 3,728 100Florida 23 26,976 60Georgia 90 25,988 62Idaho 136 203,914 97Illinois 330 46,192 99Indiana 285 49,021 91Iowa 640 124,079 99Kansas 134 16,906 82Kentucky 227 27,950 93Louisiana 30 4,462 78Maine 110 13,200 89Maryland 258 32,045 99Massachusetts 67 5,656 97Michigan 595 186,825 93Minnesota 1,704 240,857 99Mississippi 26 5,753 100Missouri 250 31,943 100Montana 21 4,616 86Nebraska 88 24,488 99Nevada 10 7,242 100New Hampshire 70 9,786 100New Jersey 41 3,377 100New Mexico 12 38,900 83New York 1,618 325,469 92North Carolina 108 20,976 78North Dakota 21 6,496 100Ohio 710 112,069 96Oklahoma 51 6,826 96Oregon 149 50,081 100Pennsylvania 3,651 316,682 95Rhode Island 8 433 100South Carolina 36 7,448 96South Dakota 91 37,018 98Tennessee 104 14,597 94Texas 98 114,377 85Utah 102 32,504 85Vermont 309 51,608 97Virginia 319 55,364 91Washington 158 80,364 100West Virginia 28 2,989 100Wisconsin 4,161 689,694 99Wyoming 1 613 100United States 17,758 4,076,579 96
Table 12: Number, participation, and level of activity of dairy herd improvement associations, by State, January 31, 2013

Cooperative Statistics, 2013 27
ficial insemination, large processed and fresh fruit and vegetable, smaller to large supply, larger fish, cotton ginning, nut, and dry bean and pea coopera-tives had net operating margins of at least 3 percent. Dairy, small fresh fruit and vegetable, large cotton, large poultry, smaller grain, small supply, livestock, livestock service, small fish, and small sugar mar-keting cooperatives had net operating margins of less than 1 percent.
Patronage IncomePatronage refunds received (usually income from other cooperatives) results from business activi-ties with other cooperatives, generally regionals, or CoBank, a cooperative bank. The patronage refund from regionals was based on business volume and consisted of cash refunds and equity stock. Stock was usually revolved back to the local cooperative on a set schedule. Many cooperatives that borrowed funds from CoBank received both cash and non-cash patronage income. The non-cash patronage from CoBank was from investment in the bank, which was usually required in proportion to the funds borrowed.
Patronage refunds received from other coopera-tives, including CoBank, totaled $1.2 billion, up 33 percent from $900 million in 2012 (appendix figure 6). In 2004, refunds from other cooperatives were $330 million or about one-fourth of the refunds in 2013. In 2013, refunds were almost 20 percent of net income before taxes.
Patronage refunds were a little less than 2 percent of sales for the smallest cooperatives, and fell to 0.2 percent for the largest (table 9). All cotton gin-ning cooperatives had patronage refunds of almost 2 percent of sales. All but the largest cotton gin-ning (sales in excess of $10 million) had patronage income of almost 4 percent of sales. Livestock, fish, large poultry, bioenergy, nut, rice, tobacco, wool, sugar, storage, milk service, and hulling coopera-tives received virtually no patronage refunds (0.1 percent of sales).
Non-Operating IncomeNon-operating income is income not generated by sales. It could be interest from investments. It also could come from the sale of PP&E, rentals, and
State Cooperatives Members Revenue Number Million $ Alabama 22 516,139 1,189Alaska 17 238,351 743Arizona 15 233,683 510Arkansas 19 510,356 1,005California 5 38,861 71Colorado 23 615,796 1,395Delaware 1 84,430 133Florida 15 855,053 2,095Georgia 43 1,840,847 3,912Hawaii 1 36,408 188Idaho 11 88,759 157Illinois 26 288,407 712Indiana 40 539,560 1,322Iowa 37 219,674 603Kansas 29 288,448 751Kentucky 25 785,425 2,032Louisiana 10 385,708 662Maine 3 15,146 10Maryland 2 206,067 522Michigan 11 324,253 485Minnesota 44 764,643 1,484Mississippi 26 754,266 1,817Missouri 46 717,932 1,302Montana 27 189,078 339Nebraska 33 239,438 750Nevada 6 48,227 161New Hampshire 1 78,885 114New Jersey 1 11,571 18New Mexico 16 210,614 488New York 4 18,073 24North Carolina 27 996,509 1,865North Dakota 20 165,575 611Ohio 25 382,965 875Oklahoma 27 487,318 1,063Oregon 17 206,730 382Pennsylvania 15 217,268 318South Carolina 22 733,237 1,653South Dakota 30 153,884 388Tennessee 22 930,131 2,338Texas 69 1,986,535 4,185Utah 5 46,600 111Vermont 2 48,611 83Virginia 13 607,992 1,421Washington 13 149,539 304West Virginia 1 6,663 13Wisconsin 24 263,509 490Wyoming 11 106,149 414United States 902 18,633,313 41,508 1 Distribution cooperatives plus generating and transmission cooperatives equals the total number of cooperatives.
Table 13: Number1, participation, and level of activity of rural electric cooperatives, by State, December 2012

28 Cooperative Statistics, 2013
extraordinary items. Sometimes PP&E are sold to generate income, but usually these types of assets are fully depreciated. When sold, if the market value is greater than the book value, income is generated. In some cases, disposal of a fully depre-ciated asset may mean a loss. Rental income from unused facilities or equipment provides income flows. Sales of extraordinary items might generate either a gain or a loss. A gain could result from a fire loss where the insurance settlement was greater than the book value. A loss might occur from flood damage for which the cooperative had no coverage. For all sizes of cooperatives, non-operating income averaged less than 0.5 percent of sales.
Net Income Before TaxesNet income before taxes (NIBT) was $6.2 billion, an increase less than of 1 percent from $6.1 billion in 2012. Net income in 2013 was over 2.5 times the NIBT of $2.3 billion in 2004 (appendix table 7 and figure 14).
Marketing cooperatives’ NIBT of $2.6 billion was up 4 percent from the $2.5 billion generated in 2012. Dairy, fruit and vegetable, and rice were the only major types of marketing cooperatives with an increase in net income before taxes.
Total NIBT of supply cooperatives was $3.5 bil-lion in 2013, down $100 million from $3.6 billion in 2012 (figure 15). Supply cooperatives accounted for 57 percent of cooperatives’ NIBT in 2013, down from the almost 59 percent in 2012 (appendix figure 7).
Losses totaled $213 million in 2013, a 25-percent decrease from 2012. Cotton cooperatives accounted for 59 percent of the losses in 2013, while dairy cooperatives had 58 percent of the losses in 2012 (appendix figure 8). The number of cooperatives with losses declined 1 percent, from 225 to 222.
Income TaxesCooperatives paid income taxes on earnings not allocated to members (retained earnings) and on
-500 0 500 1,000 1,500 2,000 2,500 3,000 3,500 4,000
Cotton
Livestock and poultry
Service
Rice
Other marketing
Sugar
Dairy
Fruit and vegetable
Grain and oilseed
Supply
Million dollars
1 Includes dividends and patronage refunds from other cooperatives and CoBank.
Income from other cooperatives1
Net operating margins
Figure 15: Before Taxes Net Income or Loss, by Type of Cooperative, 2013

Cooperative Statistics, 2013 29
dividend payments. The board of each cooperative determined what amounts of income were allocated to retained earnings and to members. Non-member business has an impact on retained earnings because cooperatives can allocate the earnings to non-mem-bers or retain the income. Cooperatives paid $600 million in income taxes.
Net IncomeNet income after taxes (net operating margins plus patronage refunds and non-operating income, minus taxes) was the highest for smaller cooperatives (4.6 percent) and fell to 2 percent for the largest cooperatives. The following co-op sectors had net incomes of greater than 5 percent: cotton service, most cotton ginning, larger processed and fresh fruit and vegetable, small artificial insemination, middle supply, small nut, large sugar, rice drier, small transportation, storage, hulling, and fresh fruit and vegetable service cooperatives.
Cotton, livestock service, larger dairy, small sup-ply, small grain and oilseed, most livestock, smaller fish, small rice, wool, and large poultry coopera-tives had net income relative to sales of less than 1 percent.
Selected Financial Ratios
Financial ratios express relationships between items in the balance sheet and income statements of a business operation. They help in analyzing a coop-erative’s economic and financial situation. Ratios can indicate problem areas, serve as guidelines for planning, and aid in formulating actions. However, ratio interpretation is largely subjective.
Nine financial ratios were used to measure coop-erative performance or financial condition: current, debt-to-asset, debt-to-equity, retained earnings-to-total-equity, equity-to-assets, adjusted equity-to-assets, return-on-assets, return-on-member equity, and extra value index.
The formulas for these ratios are:• Current = current assets / current liabilities;• Debt-to-asset = debt / total assets (debt = all
liabilities);• Debt-to-equity = (debt / total assets) / (equity
/ total assets);
• Retained-earnings-to-total-equity = retained earnings / total equity;
• Equity-to-assets = total equity / total assets;• Adjusted equity-to-assets = total equity /
(total assets - current liabilities);• Return-on-assets-before-interest-and-taxes =
(NIBT + interest expense) / total assets;• Return-on-member-equity = net income / al-
located equity; • Extra value index = net income after taxes –
(total equity * (LIBOR3 12 month maturity December average + X%)) / (total assets - current liabilities), where X=2 is a basic premium for risk; X=5 is a moderate level of risk, and X=10 is a high level of risk.
Liquidity Ratio The current ratio is a liquidity ratio—a measure of the cooperative’s ability to meet short-term obliga-tions. It focuses on the cooperative’s ability to re-main solvent. However, this ratio does not consider the degree of liquidity of each of the current asset components. If the current assets of a cooperative were mainly cash, they would be much more liquid than if comprised mainly of inventory.
If the ratio is less than one, current liabilities ex-ceed current assets and the cooperative’s liquidity is threatened. Improvements can be achieved by sell-ing additional capital stock, borrowing additional long-term debt or disposing of unproductive fixed assets and retaining proceeds. Current liabilities may also be reduced by retaining a greater portion of allocated savings (reducing the cash portion).
A high current ratio is a favorable condition fi-nancially because it indicates the ability to pay cur-rent liabilities from the conversion of current assets into cash. Operationally, this same high ratio tends to increase operating freedom and reduce the prob-ability of bill-paying difficulty from write-downs of accounts receivable or inventory. The current ratios of six sizes of cooperatives are shown in table 9 (for all types and sizes, see appendix table 6). By size, the ratio is always less than, or equal to, 1.7, meaning current assets exceed current liabilities by 1.7 times or less.
3London Interbank Offered Rate
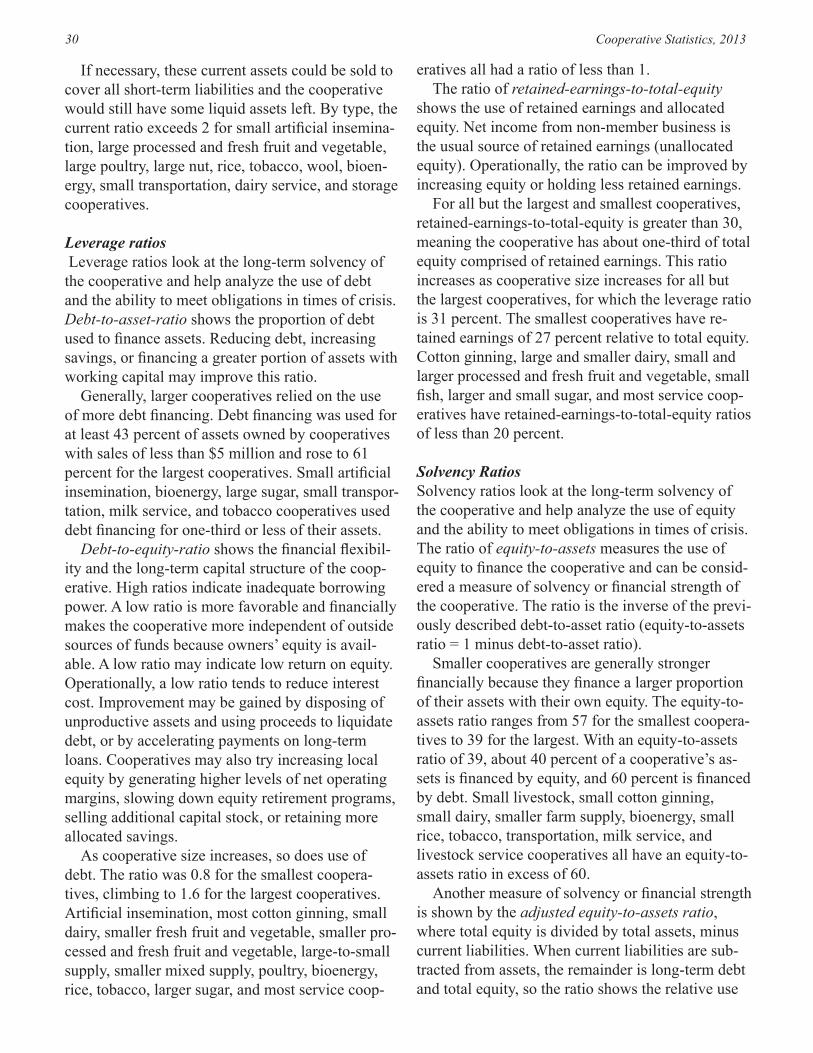
30 Cooperative Statistics, 2013
If necessary, these current assets could be sold to cover all short-term liabilities and the cooperative would still have some liquid assets left. By type, the current ratio exceeds 2 for small artificial insemina-tion, large processed and fresh fruit and vegetable, large poultry, large nut, rice, tobacco, wool, bioen-ergy, small transportation, dairy service, and storage cooperatives.
Leverage ratios Leverage ratios look at the long-term solvency of the cooperative and help analyze the use of debt and the ability to meet obligations in times of crisis. Debt-to-asset-ratio shows the proportion of debt used to finance assets. Reducing debt, increasing savings, or financing a greater portion of assets with working capital may improve this ratio.
Generally, larger cooperatives relied on the use of more debt financing. Debt financing was used for at least 43 percent of assets owned by cooperatives with sales of less than $5 million and rose to 61 percent for the largest cooperatives. Small artificial insemination, bioenergy, large sugar, small transpor-tation, milk service, and tobacco cooperatives used debt financing for one-third or less of their assets.
Debt-to-equity-ratio shows the financial flexibil-ity and the long-term capital structure of the coop-erative. High ratios indicate inadequate borrowing power. A low ratio is more favorable and financially makes the cooperative more independent of outside sources of funds because owners’ equity is avail-able. A low ratio may indicate low return on equity. Operationally, a low ratio tends to reduce interest cost. Improvement may be gained by disposing of unproductive assets and using proceeds to liquidate debt, or by accelerating payments on long-term loans. Cooperatives may also try increasing local equity by generating higher levels of net operating margins, slowing down equity retirement programs, selling additional capital stock, or retaining more allocated savings.
As cooperative size increases, so does use of debt. The ratio was 0.8 for the smallest coopera-tives, climbing to 1.6 for the largest cooperatives. Artificial insemination, most cotton ginning, small dairy, smaller fresh fruit and vegetable, smaller pro-cessed and fresh fruit and vegetable, large-to-small supply, smaller mixed supply, poultry, bioenergy, rice, tobacco, larger sugar, and most service coop-
eratives all had a ratio of less than 1. The ratio of retained-earnings-to-total-equity
shows the use of retained earnings and allocated equity. Net income from non-member business is the usual source of retained earnings (unallocated equity). Operationally, the ratio can be improved by increasing equity or holding less retained earnings.
For all but the largest and smallest cooperatives, retained-earnings-to-total-equity is greater than 30, meaning the cooperative has about one-third of total equity comprised of retained earnings. This ratio increases as cooperative size increases for all but the largest cooperatives, for which the leverage ratio is 31 percent. The smallest cooperatives have re-tained earnings of 27 percent relative to total equity. Cotton ginning, large and smaller dairy, small and larger processed and fresh fruit and vegetable, small fish, larger and small sugar, and most service coop-eratives have retained-earnings-to-total-equity ratios of less than 20 percent.
Solvency Ratios Solvency ratios look at the long-term solvency of the cooperative and help analyze the use of equity and the ability to meet obligations in times of crisis. The ratio of equity-to-assets measures the use of equity to finance the cooperative and can be consid-ered a measure of solvency or financial strength of the cooperative. The ratio is the inverse of the previ-ously described debt-to-asset ratio (equity-to-assets ratio = 1 minus debt-to-asset ratio).
Smaller cooperatives are generally stronger financially because they finance a larger proportion of their assets with their own equity. The equity-to-assets ratio ranges from 57 for the smallest coopera-tives to 39 for the largest. With an equity-to-assets ratio of 39, about 40 percent of a cooperative’s as-sets is financed by equity, and 60 percent is financed by debt. Small livestock, small cotton ginning, small dairy, smaller farm supply, bioenergy, small rice, tobacco, transportation, milk service, and livestock service cooperatives all have an equity-to-assets ratio in excess of 60.
Another measure of solvency or financial strength is shown by the adjusted equity-to-assets ratio, where total equity is divided by total assets, minus current liabilities. When current liabilities are sub-tracted from assets, the remainder is long-term debt and total equity, so the ratio shows the relative use

Cooperative Statistics, 2013 31
of long-term debt and equity to finance the coop-erative. A higher ratio indicates higher solvency or a greater use of equity to finance operations. Op-erationally, reducing long-term debt or increasing equity strengthens this ratio.
Small cooperatives have an adjusted equity-to-assets ratio of 82, but this ratio falls to 67 for the largest cooperatives, indicating that larger coopera-tives use more long-term debt. Smaller dairy, small fresh fruit and vegetable, small fresh and processed fruit and vegetable, smaller supply, smaller mixed supply, smaller livestock, bioenergy, small rice, larger sugar, small transportation, cotton service, milk service, and livestock service cooperatives have an adjusted equity-to-assets ratio of at least 85.
Profitability Ratios Profitability ratios indicate the efficiency of the cooperative’s operations. Because a cooperative is owned by its user-members, many common in-dustry profitability ratios have little meaning. For instance, profitability ratios measuring the return on common or preferred stock of similar investor-oriented firms are not appropriate because there is seldom an open market for cooperative stock.
Return-on-assets-before-interest-and-taxes measures the rate of return on total investment. This ratio is a measure of performance. It is not sensitive to the leverage position of the cooperative. Al-though some assets were financed through debt, the ratio measures return to both members and lenders.
Operationally, a high ratio tends to reduce in-terest cost and indicates a comparatively high rate of return on assets employed. This ratio rose from 7 for the smallest cooperatives to almost 9 for middle-size cooperatives, and almost 9 for the largest cooperatives. It is at least 15 for most cotton ginning, small sugar, rice drier, smaller fish, large fresh and processed fruit and vegetable, and hulling cooperatives.
Return-on-member-equity represents members’ investment in their cooperative. It is an important measure of profitability. This ratio is sensitive to the amount of debt capital in the cooperative, and it is best used in conjunction with other measures, such as the return on assets. Financially, a high ratio is favorable and tends to decrease financial leverage. However, a high ratio may also be a symptom of
insufficient investment. A high ratio tends to reduce interest cost over time but may occur when both total debt and interest costs are high.
By size of cooperative, the highest return-on-member-equity was over 30 percent for coopera-tives with $100 million to $500 million in sales. The smallest cooperatives have higher proportions of member equity, and thus a lower ratio of 14. Small nut, large supply, middle livestock, small fish, large and small sugar, and hulling have a 45-percent or greater return-on-member-equity ratio.
Extra-Value IndexThe extra-value index (EVI) can help members evaluate their cooperative’s performance, because it provides a value for the opportunity cost of using equity capital [Liebrand]. A cooperative’s equity capital is not openly traded in a stock market as that of an investor-oriented firm, so it is hard for coop-erative members to determine if management is in-creasing or decreasing the value of the cooperative. The EVI attempts to put a value on the opportunity cost of equity capital through the use of an interest charge on the equivalent to the amount the money (member equity capital) could have earned if used elsewhere. In other words, EVI evaluates coopera-tive performance by subtracting the opportunity cost of equity capital from the profitability ratio.
If the EVI is positive, cooperative management has created value for members because the coopera-tive’s operations are covering the opportunity cost of member’s equity capital. The converse is true if the EVI index is negative—member’s investment in the cooperative is being diminished because the opportunity cost of member’s equity capital is not being covered.
There are three values shown for EVI in table 9. The EVI+2 represents a basic rate by adding 200 basis points to the London Inter-Bank Offered Rate (LIBOR) 12-month maturity December average, which was 0.58 for December 2013. The basic LI-BOR+2 rate represented in table 9 as EVI+2 (2.58) reflects the rate that banks in the United States might make loans to firms with better-than-average credit ratings. EVI+5 (5.58) represents a moder-ate premium for risk or LIBOR rate plus 500 basis points, while EVI +10 (10.58) is a higher premium for risk as it is LIBOR rate plus 1,000 basis points.

32 Cooperative Statistics, 2013
Smaller cooperatives, which generally have a larger proportion of equity relative to assets, have a lower EVI. For EVI+2, small cooperatives gener-ated 6.2 cents of extra value for each $1 of member equity investment. For the higher risk of EVI+10, smaller cooperatives had a negative return of 0.3 cents.
For EVI+2, rice drier, middle livestock, large cotton ginning, smaller fish, small sugar, and hull-ing cooperatives all had EVIs of at least 20 cents (Appendix Table 6). The EVI used in these tables was the same for all cooperatives. The LIBOR rate is a proxy for a cooperative’s cost of capital, since the cooperative would know this value, and it could be plugged into the formula to generate its indi-vidual EVI.
Other Service Cooperatives
Dairy Herd Improvement AssociationsDairy Herd Improvement Associations (DHIA) had 17,836 memberships in 2013 (Table 12), down from 18,579 in 2012. The DHIA tested nearly 4,092,281million cows in 2013, down from 4,133,140 million in 2012. Wisconsin (4,161), Pennsylvania (3,651), Minnesota (1,704), and New York (1,618) combined accounted for 38 percent of total members. About 913,104 (22.3 percent) of
the cows tested were in California, down from 22.9 percent in 2012.
Rural Electric CooperativesThe number of rural electric cooperatives increased from 860 to 902 from 2011 to 2012. The top three States with the most number of rural electric co-operatives were Texas (69), Minnesota (44), and Georgia (43). Revenue and the number of members for rural electric cooperatives also increased from 2011 to 2012. Revenue in 2011 was $40,314,000 and increased in to 2012 $41,508,000. The number of members in 2011 was 19,005,000 and decreased in 2012 to 18,633,313.
BIBLIOGRAPHY
Ali, Sarah and E. Eldon Eversull, Cooperative Statistics, 2012, U.S. Department of Agriculture, Rural Development, Service Report 74, November 2013.
Liebrand, Carolyn Betts, Financial Profile of Dairy Cooperatives, 2007, U.S. Department of Ag-riculture, Rural Development, Research Report 219, April 2010.

Cooperative Statistics, 2013 33
APPENDIX TABLES
Major business activity 2013 2012 2011 2010 2009 Products marketed: NumberBean and pea (dry edible) 5 5 5 5 6Cotton 12 12 12 12 12Cotton ginning 148 151 153 160 166Dairy 127 133 131 138 140Fish 39 39 38 37 35Fruit and vegetable 145 144 144 137 144Grain and oilseed1 490 488 525 515 548Livestock 91 87 86 81 79Nut 18 19 18 17 16Poultry2 12 11 10 10 10Rice 12 12 12 12 14Sugar3 27 27 26 27 31Tobacco 5 6 6 8 9Wool and mohair 41 43 45 54 57Other marketing 23 23 26 25 26Total marketing 1,195 1,200 1,237 1,238 1,293 Total supplies 871 916 934 973 990 Total services 120 120 123 116 123 Total 2,186 2,236 2,294 2,327 2,406
1 Cooperatives primarily handling grain and oilseed, excluding cottonseed. 2 Cooperatives primarily handling eggs, turkeys, ratite, squab, and related products.3 Cooperatives primarily handling sugar beets, sugarcane, honey, and related products.
Appendix Table 1: Number of cooperatives, by major business activity, 2013-2009

34 Cooperative Statistics, 2013
Major business activity 2013 2012 2011 2010 2009
Products marketed: Thousands
Bean and pea (dry edible) 1.8 1.9 1.8 1.8 1.7Cotton 25.1 18.8 25.4 28.2 29.2Cotton ginning 24.8 25.4 26.6 25.7 25.8Dairy 46.3 45.1 48.5 44.2 48.8Fish 5.5 5.4 5.4 5.4 5.3Fruit and vegetable 20.8 21.0 22.0 22.1 22.3Grain and oilseed1 400.3 400.5 584.7 416.9 428.2Livestock 71.7 70.8 73.7 75.4 73.3Nut 9.9 9.7 9.7 15.6 15.2Poultry2 0.6 0.5 0.5 0.5 0.5Rice 10.8 10.7 10.9 11.6 11.6Sugar3 9.5 8.8 8.7 9.4 10.9Tobacco 13.8 18.8 11.9 65.0 65.1Wool and mohair 9.5 9.5 9.6 9.6 9.9Other marketing 5.1 4.8 6.5 5.4 6.5Total marketing 655.3 651.9 845.9 736.6 754.2 Total supplies 1,284.3 1,426.4 1,397.6 1,462.6 1,447.5 Total services 37.2 36.5 35.6 35.2 35.4 Total 1,976.7 2,114.8 2,279.1 2,234.4 2,237.1
1 Cooperatives primarily handling grain and oilseed, excluding cottonseed. 2 Cooperatives primarily handling eggs, turkeys, ratite, squab, and related products.3 Cooperatives primarily handling sugar beets, sugarcane, honey, and related products.
Appendix Table 2: Cooperative memberships, by major business activity, 2013-2009

Cooperative Statistics, 2013 35
Major business activity 2013 2012 2011 2010 2009 Products marketed: Billion $Bean and pea (dry edible) 0.2 0.2 0.2 0.2 0.2Cotton 3.1 3.2 4.1 2.4 2.4Dairy 42.7 41.4 42.3 34.3 30.5Fish 0.2 0.2 0.3 0.2 0.2Fruit and vegetable 8.2 8.0 7.8 7.7 7.5Grain and oilseed1 67.0 64.5 56.1 41.0 44.4Livestock 3.3 4.0 4.4 3.6 3.1Nut 1.3 1.1 0.9 0.9 0.8Poultry2 0.7 1.5 1.3 1.2 1.2Rice 1.7 1.6 1.6 1.5 1.7Sugar3 8.7 8.5 5.7 5.0 4.6Tobacco 0.1 0.1 0.3 0.2 0.2Other marketings4 7.2 6.7 6.3 4.8 4.8Total marketing 144.6 140.9 131.1 103.0 101.4 Supplies purchased: Crop protectants 11.6 11.1 9.7 8.1 8.2Feed 16.2 15.1 13.4 10.8 11.1Fertilizer 17.7 17.8 14.9 11.1 12.6Petroleum 38.5 36.8 31.2 24.5 23.3Seed 5.5 5.6 4.9 4.3 3.9Other supplies 6.4 5.8 7.2 5.0 4.8Total supplies 95.9 92.2 81.4 63.8 63.9 Services and all other income 5.6 4.7 4.4 4.9 4.9 Total 246.1 237.8 217.0 171.8 170.3
1 Cooperatives primarily handling grains and oilseeds, excluding cottonseed. 2 Cooperatives primarily handling eggs, turkeys, ratite, squab, and related products.3 Cooperatives primarily handling sugar beets, sugarcane, honey, and related products.4 Includes wool and mohair and other marketing.
Appendix Table 3: Cooperative’s gross business volume, by type of cooperative, 2013-2009

36 Cooperative Statistics, 2013
Major business activity 2013 2012 2011 2010 2009 Products marketed: Billion dollarsBean and pea (dry edible) 0.2 0.2 0.2 0.2 0.2Cotton 3.0 3.1 4.0 2.3 2.2Dairy 40.2 39.7 40.7 31.1 27.6Fish 0.2 0.2 0.3 0.2 0.2Fruit and vegetable 5.9 5.8 5.6 5.5 5.4Grain and oilseed1 66.3 63.7 55.3 40.5 43.8Livestock 3.3 4.0 4.2 3.6 3.0Nut 1.3 1.1 0.9 0.9 0.1Poultry2 0.7 1.5 1.3 1.2 1.2Rice 1.7 1.6 1.6 1.5 1.7Sugar3 6.0 6.0 4.8 4.1 3.8Tobacco 0.1 0.1 0.3 0.2 0.2Other marketing4 6.8 6.3 5.9 4.5 4.5Total marketing 135.8 133.2 124.8 95.8 93.9 Supplies purchased: Crop protectants 7.3 7.2 6.6 5.6 5.8Feed 12.7 11.8 10.5 8.6 8.8Fertilizer 14.0 14.2 11.9 9.4 10.8Petroleum 24.4 23.4 20.3 16.5 15.8Seed 3.4 3.3 2.9 2.6 2.5Other supplies 5.4 4.9 5.6 4.4 4.2Total supplies 67.2 64.7 57.8 47.1 47.9 Services and all other income 5.6 4.7 4.4 4.9 4.9 Total 208.6 202.6 187.1 147.8 146.7
1 Cooperatives primarily handling grains and oilseeds, excluding cottonseed. 2 Cooperatives primarily handling eggs, turkeys, ratite, squab, and related products.3 Cooperatives primarily handling sugar beets, sugarcane, honey, and related products.4 Includes wool and mohair and other marketing.
Appendix Table 4: Cooperatives’ net business volume, by type of cooperative, 2013-2009

Cooperative Statistics, 2013 37
Assets Investments from own in other Total Total Net Year operations cooperatives1 assets liabilities worth Billion dollars2004 41.18 4.73 45.91 26.21 19.702005 42.70 4.33 47.04 27.67 19.372006 44.15 3.57 47.72 28.07 19.652007 53.75 4.20 57.95 36.70 21.252008 65.98 4.28 70.26 47.06 23.202009 57.20 4.03 61.23 37.41 23.832010 60.53 4.37 64.89 38.99 25.902011 75.01 4.41 79.41 51.30 28.112012 78.60 4.76 83.36 53.21 30.152013 77.32 5.24 82.56 47.92 34.64 Percent of total assets 2004 89.7 10.3 100.0 57.1 42.92005 90.8 9.2 100.0 58.8 41.22006 92.5 7.5 100.0 58.8 41.22007 92.8 7.2 100.0 63.3 36.72008 93.9 6.1 100.0 67.0 33.02009 93.4 6.6 100.0 61.1 38.92010 93.3 6.7 100.0 60.1 39.92011 94.5 5.5 100.0 64.6 35.42012 94.3 5.7 100.0 63.8 36.22013 93.7 6.3 100.0 58.0 42.0 1 Includes investments in other cooperatives and CoBank, where applicable.
Appendix Table 5: Combined balance sheet data for cooperatives, 2004-2013

38 Cooperative Statistics, 2013
Type of cooperative Artificial Cotton Cotton insemination marketing servicesCooperative sales size ≥ $15 < $15 ≥ $100 < $100 million million million million all sizesBalance sheet Percent of total assets Current assets 53.42 64.19 70.65 74.34 53.57Other assets 17.74 4.12 7.17 0.78 7.91Investments 6.80 12.40 1.12 0.62 11.24PP&E1 (net) 22.05 19.29 21.05 24.26 27.28Total assets 100.00 100.00 100.00 100.00 100.00 Current liabilities 30.40 18.75 46.48 62.23 45.43Total liabilities 44.41 31.93 54.46 70.27 51.30Allocated equity 29.20 59.75 26.09 5.65 50.12Retained earnings 26.39 8.31 19.44 24.08 -1.42Total equity 55.59 68.07 45.54 29.73 48.70Total equity and liabilities 100.00 100.00 100.00 100.00 100.00
Income statement Percent of total sales Percent of serviceTotal sales 100.00 100.00 100.00 100.00 Cost of goods sold 35.25 30.73 95.60 89.47 Gross margin 64.75 69.27 4.40 10.53 Service and other income 6.79 4.26 1.85 0.35 100.00Gross revenue 71.54 73.54 6.25 10.88 100.00Expenses Wages 41.12 45.58 3.18 2.32 26.18Depreciation 3.60 2.50 0.58 1.31 4.29Interest 0.37 0.00 0.86 1.25 3.56Other 22.30 19.66 4.48 3.85 49.86Total expenses 67.39 67.75 9.10 8.73 83.89 Net operating margins 4.15 5.79 -2.85 2.15 16.11Patronage income 0.10 0.30 0.04 0.06 0.61Non-operating income 0.78 0.89 -0.17 0.52 1.21Net income before taxes 5.03 6.98 -2.97 2.72 17.92Taxes 0.73 0.32 0.03 0.01 0.00Net income 4.31 6.66 -3.00 2.72 17.92
Ratios Percent or numberCurrent 1.76 3.42 1.52 1.19 1.18Debt-to-asset 0.44 0.32 0.54 0.70 0.51Debt-to-equity 0.80 0.47 1.20 2.36 1.05Retained-earnings-to-equity 47.48 12.21 42.70 81.01 -2.91Equity-to-assets 55.59 68.07 45.54 29.73 48.70Adjusted-equity-to-assets 79.88 83.77 85.07 78.71 89.24Return-on-assets 6.75 10.45 -7.66 7.71 8.75Return-on-member-equity 18.40 16.67 -41.74 93.39 14.56 Extra value index +2 5.66 10.10 -20.35 11.93 11.07Extra value index +5 3.26 7.59 -20.35 9.57 8.40Extra value index +10 -0.73 3.40 -20.35 5.63 3.93
1(Property, plant, and equipment) (continued next page)
Appendix table 6: Common size analysis, by cooperative type and size, 2013

Cooperative Statistics, 2013 39
Type of cooperative Cotton ginning
Cooperative sales size > $10 $5 to $1 to < $1 million $10 million $5 million millionBalance sheet Percent of total assets Current assets 48.88 36.64 38.96 38.35Other assets 0.77 1.16 6.06 11.72Investments 13.69 18.49 11.89 6.86PP&E1 (net) 36.67 43.72 43.09 43.07Total assets 100.00 100.00 100.00 100.00 Current liabilities 39.93 26.49 24.90 27.90Total liabilities 51.07 38.72 40.96 43.72Allocated equity 38.43 50.02 48.64 50.15Retained earnings 10.50 11.26 10.39 6.13Total equity 48.93 61.28 59.04 56.28Total equity and liabilities 100.00 100.00 100.00 100.00
Income statement Percent of total salesTotal sales 100.00 100.00 100.00 100.00Cost of goods sold 82.08 77.45 80.75 76.62Gross margin 17.92 22.55 19.25 23.38 Service and other income 23.73 29.87 41.73 80.95Gross revenue 41.65 52.42 60.98 104.33Expenses Wages 8.64 15.04 17.27 32.72Depreciation 3.03 4.89 5.40 10.75Interest 1.00 0.64 1.12 2.72Other 19.37 23.31 31.67 52.12Total expenses 32.04 43.88 55.46 98.30 Net operating margins 9.61 8.54 5.52 6.02Patronage income 1.55 3.70 7.92 11.64Non-operating income 0.60 0.29 1.64 4.10Net income before taxes 11.76 12.53 15.08 21.76Taxes 0.04 0.25 0.24 -0.03Net income 11.72 12.28 14.84 21.79
Ratios Percent or numberCurrent 1.22 1.38 1.56 1.37Debt-to-asset 0.51 0.39 0.41 0.44Debt-to-equity 1.04 0.63 0.69 0.78Retained-earnings-to-equity 21.46 18.38 17.60 10.89Equity-to-assets 48.93 61.28 59.04 56.28Adjusted-equity-to-assets 81.46 83.37 78.61 78.06Return-on-assets 18.92 16.23 14.98 12.50Return-on-member-equity 45.22 30.25 28.20 22.19 Extra value index +2 26.83 18.44 16.24 13.42Extra value index +5 24.39 15.94 13.88 11.08Extra value index +10 20.31 11.77 9.95 7.18
Appendix table 6: Common size analysis, by cooperative type and size, 2013, (continued)

40 Cooperative Statistics, 2013
Type of cooperative Dairy and dairy products
Cooperative sales size ≥ $1 $300 to $50 to $20 to billion $1 billion $200 million $50 million
Balance sheet Percent of total assetsCurrent assets 51.36 55.49 61.56 77.92Other assets 22.73 2.39 3.85 8.25Investments 0.98 2.64 8.97 4.20PP&E1 (net) 24.94 39.47 25.63 9.63Total assets 100.00 100.00 100.00 100.00 Current liabilities 48.18 34.67 49.57 39.86Total liabilities 71.03 61.24 60.96 47.45Allocated equity 24.67 32.06 27.72 50.31Retained earnings 4.30 6.70 11.32 2.24Total equity 28.97 38.76 39.04 52.55Total equity and liabilities 100.00 100.00 100.00 100.00
Income statement Percent of total salesTotal sales 100.00 100.00 100.00 100.00Cost of goods sold 90.84 91.45 94.62 95.77Gross margin 5.76 8.55 5.38 4.23 Service and other income 0.18 0.59 0.71 5.58Gross revenue 5.94 9.14 6.08 9.81Expenses Wages 2.78 3.14 2.29 5.30Depreciation 0.67 0.77 0.48 0.56Interest 0.24 0.25 0.06 0.11Other 1.80 4.16 2.74 2.99Total expenses 5.49 8.32 5.57 8.96 Net operating margins 0.45 0.81 0.51 0.85Patronage income 0.07 0.04 0.28 0.29Non-operating income -0.54 0.16 0.15 0.72Net income before taxes -0.02 1.01 0.93 1.86Taxes 0.02 0.07 0.01 0.20Net income 0.00 0.95 0.93 1.67
Ratios Percent or number Current 1.07 1.60 1.24 1.95Debt-to-asset 0.71 0.61 0.61 0.47Debt-to-equity 2.45 1.58 1.56 0.90Retained-earnings-to-equity 14.84 17.30 28.99 4.27Equity-to-assets 28.97 38.76 39.04 52.55Adjusted-equity-to-assets 55.91 59.34 77.41 87.38Return-on-assets 1.02 5.01 6.23 6.79Return-on-member-equity -0.03 11.73 21.01 11.42 Extra value index +2 -1.46 4.22 9.55 7.30Extra value index +5 -3.13 2.44 7.23 4.68Extra value index +10 -5.93 -0.52 3.36 0.31
(continued next page)
Appendix table 6: Common size analysis, by cooperative type and size, 2013, (continued)

Cooperative Statistics, 2013 41
Type of cooperative Dairy and dairy products
Cooperative sales size $10 to $5 to $1 to Less than $20 million $10 million $5 million $1 million Balance sheet Percent of total assetsCurrent assets 64.87 57.02 66.23 62.27Other assets 4.44 8.80 9.53 11.65Investments 15.36 23.25 7.04 0.00PP&E1 (net) 15.33 10.92 17.20 26.09Total assets 100.00 100.00 100.00 100.00 Current liabilities 49.72 34.60 46.37 51.64Total liabilities 57.64 36.11 59.53 65.95Allocated equity 31.80 52.62 31.60 44.76Retained earnings 10.56 11.26 8.87 -10.71Total equity 42.36 63.89 40.47 34.05Total equity and liabilities 100.00 100.00 100.00 100.00
Income statement Percent of total salesTotal sales 100.00 100.00 100.00 100.00Cost of goods sold 94.75 92.97 93.08 94.29Gross margin 5.25 7.03 6.92 5.71 Service and other income 1.24 1.30 2.18 9.24Gross revenue 6.49 8.33 9.10 14.95Expenses Wages 1.82 2.97 3.46 5.23Depreciation 0.32 0.37 0.48 1.15Interest 0.16 0.06 0.28 0.59Other 3.71 4.41 3.89 7.75Total expenses 6.01 7.82 8.11 14.73 Net operating margins 0.47 0.50 0.99 0.22Patronage income 0.39 1.03 0.21 0.01Non-operating income 0.16 0.42 0.11 0.53Net income before taxes 1.03 1.96 1.31 0.76Taxes 0.00 0.02 0.05 0.00Net income 1.03 1.93 1.26 0.76
Ratios Percent or numberCurrent 1.30 1.65 1.43 1.21Debt-to-asset 0.58 0.36 0.60 0.66Debt-to-equity 1.36 0.57 1.47 1.94Retained-earnings-to-equity 24.93 17.63 21.93 -31.45Equity-to-assets 42.36 63.89 40.47 34.05Adjusted-equity-to-assets 84.25 97.69 75.46 70.41Return-on-assets 8.41 9.47 8.09 4.28Return-on-member-equity 22.87 17.22 20.31 5.39 Extra value index +2 12.29 11.34 10.02 3.17Extra value index +5 9.77 8.41 7.75 1.06Extra value index +10 5.55 3.52 3.98 -2.46
Appendix table 6: Common size analysis, by cooperative type and size, 2013, (continued)

42 Cooperative Statistics, 2013
Type of cooperative Fruit and vegetable (fresh sales only)
Cooperative sales size ≥ $50 $20 to $10 to $5 to $1 to Less than million $50 million $20 million $10 million $5 million $1 million Balance sheet Percent of total assetsCurrent assets 52.51 54.57 50.21 52.59 63.11 45.54Other assets 6.99 6.38 5.77 13.79 9.55 8.77Investments 3.43 5.03 3.78 7.07 0.01 0.00PP&E1 (net) 37.08 34.03 40.24 26.56 27.34 45.69Total assets 100.00 100.00 100.00 100.00 100.00 100.00 Current liabilities 36.48 39.69 30.91 36.31 45.74 32.04Total liabilities 60.41 53.44 47.55 50.65 62.77 41.22Allocated equity 22.12 23.86 35.42 37.19 26.46 15.09Retained earnings 17.48 22.69 17.03 12.16 10.77 43.69Total equity 39.59 46.56 52.45 49.35 37.23 58.78Total equity and liabilities 100.00 100.00 100.00 100.00 100.00 100.00
Income statement Percent of total salesTotal sales 100.00 100.00 100.00 100.00 100.00 100.00Cost of goods sold 78.70 71.76 80.77 77.55 85.94 86.30Gross margin 21.30 28.24 19.23 22.45 14.06 13.70 Service and other income 2.42 5.53 6.38 1.12 23.54 18.56Gross revenue 23.72 33.77 25.61 23.57 37.60 32.25Expenses Wages 10.43 12.68 11.88 8.18 16.60 15.84Depreciation 1.73 1.63 1.35 1.30 2.18 2.16Interest 0.37 0.32 1.50 0.59 0.97 0.54Other 9.24 16.90 9.79 14.42 17.26 14.44Total expenses 21.76 31.54 24.53 24.48 37.01 32.98 Net operating margins 1.95 2.22 1.08 -0.91 0.59 -0.73Patronage income 0.13 0.00 0.99 0.34 0.02 0.00Non-operating income 0.19 0.40 0.41 0.44 1.66 4.25Net income before taxes 2.27 2.63 2.48 -0.13 2.26 3.53Taxes 0.29 0.27 0.17 0.02 0.03 0.00Net income 1.98 2.36 2.32 -0.15 2.23 3.53
Ratios Percent or numberCurrent 1.44 1.37 1.62 1.45 1.38 1.42Debt-to-asset 0.60 0.53 0.48 0.51 0.63 0.41Debt-to-equity 1.53 1.15 0.91 1.03 1.69 0.70Retained-earnings-to-equity 44.14 48.74 32.47 24.63 28.93 74.33Equity-to-assets 39.59 46.56 52.45 49.35 37.23 58.78Adjusted-equity-to-assets 62.34 77.20 75.91 77.49 68.61 86.49Return-on-assets 6.75 6.98 12.32 0.87 3.19 5.78Return-on-member-equity 22.93 23.37 20.21 -0.77 8.31 33.23 Extra value index +2 6.38 7.26 8.40 -2.45 2.28 5.15Extra value index +5 4.51 4.94 6.12 -4.77 0.22 2.55Extra value index +10 1.39 1.08 2.33 -8.65 -3.21 -1.77
(continued next page)
Appendix table 6: Common size analysis, by cooperative type and size, 2013, (continued)

Cooperative Statistics, 2013 43
Type of cooperative Fruit and vegetable (processed and fresh sales)
Cooperative sales size ≥ $500 $250 $50 $10 Less than million to $500 million to $200 million to $50 million $6 million Balance sheet Percent of total assetsCurrent assets 53.77 69.03 69.25 45.98 78.32Other assets 16.03 5.25 6.18 1.48 0.52Investments 0.93 1.38 1.56 25.52 7.36PP&E1 (net) 29.26 24.35 23.02 27.02 13.80Total assets 100.00 100.00 100.00 100.00 100.00 Current liabilities 17.26 46.20 57.35 32.01 58.20Total liabilities 42.95 71.09 64.13 45.01 62.72Allocated equity 55.25 13.95 23.83 51.78 26.18Retained earnings 1.80 14.96 12.04 3.21 11.10Total equity 57.05 28.91 35.87 54.99 37.28Total equity and liabilities 100.00 100.00 100.00 100.00 100.00
Income statement Percent of total salesTotal sales 100.00 100.00 100.00 100.00 100.00Cost of goods sold 76.78 74.32 87.04 75.76 80.65Gross margin 23.22 25.68 12.96 24.24 19.35 Service and other income 3.98 0.00 1.26 1.67 9.15Gross revenue 27.21 25.68 14.22 25.92 28.50Expenses Wages 8.35 13.21 5.76 10.21 13.85Depreciation 2.38 1.80 0.70 1.68 0.89Interest 0.71 0.98 0.34 0.45 0.54Other 5.76 6.74 6.16 13.36 11.80Total expenses 17.20 22.73 12.96 25.70 27.08 Net operating margins 10.01 2.95 1.26 0.21 1.42Patronage income 0.04 0.04 0.04 0.19 0.15Non-operating income 1.29 0.21 -0.02 0.85 0.12Net income before taxes 11.33 3.20 1.29 1.25 1.69Taxes 0.56 0.67 0.10 0.17 0.20Net income 10.77 2.53 1.19 1.08 1.48
Ratios Percent or numberCurrent 3.12 1.49 1.21 1.44 1.35Debt-to-asset 0.43 0.71 0.64 0.45 0.63Debt-to-equity 0.75 2.46 1.79 0.82 1.68Retained-earnings-to-equity 3.15 51.74 33.56 5.83 29.78Equity-to-assets 57.05 28.91 35.87 54.99 37.28Adjusted-equity-to-assets 68.95 53.74 84.10 80.88 89.18Return-on-assets 18.11 6.31 5.53 2.36 4.11Return-on-member-equity 29.32 27.40 16.94 2.90 10.45 Extra value index +2 17.80 5.72 7.29 0.12 4.24Extra value index +5 15.73 4.11 4.77 -2.30 1.57Extra value index +10 12.28 1.42 0.57 -6.35 -2.89
Appendix table 6: Common size analysis, by cooperative type and size, 2013, (continued)

44 Cooperative Statistics, 2013
Type of cooperative Supply (with 100% supply sales)
Cooperative sales size ≥ $500 $100 to $50 to $30 to $25 to $20 to million $400 million $100 million $50 million $30 million $25 millionBalance sheet Percent of total assetsCurrent assets 60.97 55.23 51.97 57.24 48.47 51.77Other assets 6.30 11.55 3.37 3.05 3.87 2.44Investments 12.77 11.65 21.27 17.05 21.65 21.89PP&E1 (net) 19.97 21.57 23.39 22.66 26.01 23.91Total assets 100.00 100.00 100.00 100.00 100.00 100.00 Current liabilities 35.55 35.10 31.61 36.64 34.52 30.38Total liabilities 51.08 48.82 37.72 45.24 40.44 35.98Allocated equity 18.82 27.07 31.47 35.45 37.49 37.30Retained earnings 30.09 24.11 30.81 19.31 22.07 27.73Total equity 48.92 51.18 62.28 54.76 59.56 65.02Total equity and liabilities 100.00 100.00 100.00 100.00 100.00 100.00
Income statement Percent of total salesTotal sales 100.00 100.00 100.00 100.00 100.00 100.00Cost of goods sold 93.73 86.01 86.45 86.18 84.96 86.69Gross margin 6.27 13.99 13.55 13.82 15.04 13.31 Service and other income 0.47 1.34 2.10 1.54 1.30 4.32Gross revenue 6.74 15.33 15.64 15.36 16.34 17.63Expenses Wages 2.07 6.43 6.72 6.87 6.96 7.55Depreciation 0.73 1.29 1.27 1.52 1.55 1.63Interest 0.31 0.36 0.22 0.38 0.28 0.38Other 1.20 4.34 5.31 4.66 5.26 5.13Total expenses 4.31 12.41 13.53 13.43 14.05 14.69 Net operating margins 2.43 2.92 2.12 1.93 2.29 2.94Patronage income 0.48 1.96 2.76 2.78 3.22 3.37Non-operating income 0.26 0.43 0.65 1.30 0.78 0.64Net income before taxes 3.17 5.31 5.52 6.02 6.30 6.94Taxes 0.62 1.13 0.86 0.51 0.68 0.76Net income 2.55 4.18 4.66 5.50 5.62 6.18
Ratios Percent or numberCurrent 1.71 1.57 1.64 1.56 1.40 1.70Debt-to-asset 0.51 0.49 0.38 0.45 0.40 0.35Debt-to-equity 1.04 0.95 0.61 0.83 0.68 0.54Retained-earnings-to-equity 61.52 47.11 49.47 35.26 37.05 42.64Equity-to-assets 48.92 51.18 62.28 54.76 59.56 65.02Adjusted-equity-to-assets 75.90 78.86 91.06 86.42 90.96 93.40Return-on-assets 13.27 14.11 13.48 11.99 12.85 13.94Return-on-member-equity 51.67 38.37 34.75 29.09 29.31 31.57 Extra value index +2 13.13 13.97 13.64 14.05 14.43 14.50Extra value index +5 10.86 11.60 10.91 11.45 11.70 11.70Extra value index +10 7.06 7.66 6.36 7.13 7.16 7.03 (continued next page)
Appendix table 6: Common size analysis, by cooperative type and size, 2013, (continued)

Cooperative Statistics, 2013 45
Type of cooperative Supply (with 100% supply sales)
Cooperative sales size $15 to $10 to $5 to $1 to Less than $20 million $15 million $10 million $5 million $1 million Balance sheet Percent of total assetsCurrent assets 51.83 55.75 55.54 58.55 58.83Other assets 2.33 1.46 4.29 6.41 8.95Investments 24.64 21.55 17.63 15.52 10.16PP&E1 (net) 21.20 21.25 22.55 19.51 22.07Total assets 100.00 100.00 100.00 100.00 100.00 Current liabilities 30.88 31.58 28.84 29.50 30.64Total liabilities 36.90 36.32 37.38 38.26 38.47Allocated equity 37.10 38.41 37.74 38.57 47.50Retained earnings 25.99 25.28 24.88 23.17 14.04Total equity 63.10 63.68 62.62 61.74 61.53Total equity and liabilities 100.00 100.00 100.00 100.00 100.00 Income statement Percent of total salesTotal sales 100.00 100.00 100.00 100.00 100.00Cost of goods sold 86.79 86.27 85.48 85.22 83.99Gross margin 13.21 13.73 14.52 14.78 16.01 Service and other income 1.36 2.56 2.90 3.29 8.42Gross revenue 14.58 16.29 17.42 18.07 24.43Expenses Wages 6.97 8.08 8.66 9.93 15.23Depreciation 1.30 1.36 1.32 1.30 1.63Interest 0.23 0.28 0.47 0.50 0.85Other 4.59 5.21 5.39 5.81 9.91Total expenses 13.09 14.92 15.84 17.53 27.62 Net operating margins 1.49 1.37 1.57 0.53 -3.18Patronage income 3.31 2.86 2.05 1.72 0.54Non-operating income 0.59 0.37 0.39 0.66 1.75Net income before taxes 5.39 4.60 4.02 2.91 -0.89Taxes 0.75 0.46 0.31 0.15 0.14Net income 4.64 4.14 3.71 2.76 -1.04
Ratios Percent or numberCurrent 1.68 1.77 1.93 1.98 1.92Debt-to-asset 0.37 0.36 0.37 0.38 0.38Debt-to-equity 0.58 0.57 0.60 0.62 0.63Retained-earnings-to-equity 41.20 39.69 39.74 37.53 22.81Equity-to-assets 63.10 63.68 62.62 61.74 61.53Adjusted-equity-to-assets 91.28 93.08 88.00 87.58 88.72Return-on-assets 11.70 9.87 8.95 6.17 -0.06Return-on-member-equity 26.04 21.83 19.58 12.95 -2.85 Extra value index +2 11.62 9.85 8.11 4.83 -4.24Extra value index +5 8.88 7.06 5.47 2.20 -6.90Extra value index +10 4.32 2.40 1.07 -2.18 -11.34
Appendix table 6: Common size analysis, by cooperative type and size, 2013, (continued)

46 Cooperative Statistics, 2013
Type of cooperative Mixed supply (with 99% to 50% supply sales)
Cooperative sales size $300 to $100 to $50 to $30 to $850 million $300 million $100 million $50 million Balance sheet Percent of total assetsCurrent assets 54.74 55.39 59.09 57.13Other assets 2.16 4.00 1.26 3.84Investments 19.08 19.17 16.03 15.76PP&E1 (net) 24.02 21.44 23.62 23.28Total assets 100.00 100.00 100.00 100.00 Current liabilities 34.13 36.34 40.61 42.21Total liabilities 45.66 45.88 48.78 52.33Allocated equity 25.75 22.83 28.03 25.06Retained earnings 28.59 31.29 23.19 22.61Total equity 54.34 54.12 51.22 47.67Total equity and liabilities 100.00 100.00 100.00 100.00
Income statement Percent of total salesTotal sales 100.00 100.00 100.00 100.00Cost of goods sold 91.26 89.87 88.93 91.28Gross margin 8.74 10.13 11.07 8.72 Service and other income 2.28 2.97 2.36 2.49Gross revenue 11.03 13.10 13.43 11.21Expenses Wages 4.79 5.66 5.99 4.91Depreciation 1.29 1.31 1.22 1.09Interest 0.31 0.33 0.33 0.51Other 3.29 4.26 4.37 3.94Total expenses 9.68 11.55 11.91 10.45 Net operating margins 1.35 1.55 1.52 0.76Patronage income 2.19 2.46 2.07 1.80Non-operating income 0.78 0.51 0.44 0.35Net income before taxes 4.32 4.52 4.03 2.90Taxes 0.59 0.73 0.43 0.15Net income 3.73 3.78 3.60 2.76
Ratios Percent or numberCurrent 1.60 1.52 1.46 1.35Debt-to-asset 0.46 0.46 0.49 0.52Debt-to-equity 0.84 0.85 0.95 1.10Retained-earnings-to-equity 52.61 57.81 45.28 47.43Equity-to-assets 54.34 54.12 51.22 47.67Adjusted-equity-to-assets 82.50 85.01 86.25 82.49Return-on-assets 10.85 11.34 11.25 9.12Return-on-member-equity 33.91 38.81 33.12 29.43 Extra value index +2 11.13 11.73 13.41 10.63Extra value index +5 8.66 9.18 10.82 8.16Extra value index +10 4.53 4.93 6.51 4.04 (continued next page)
Appendix table 6: Common size analysis, by cooperative type and size, 2013, (continued)
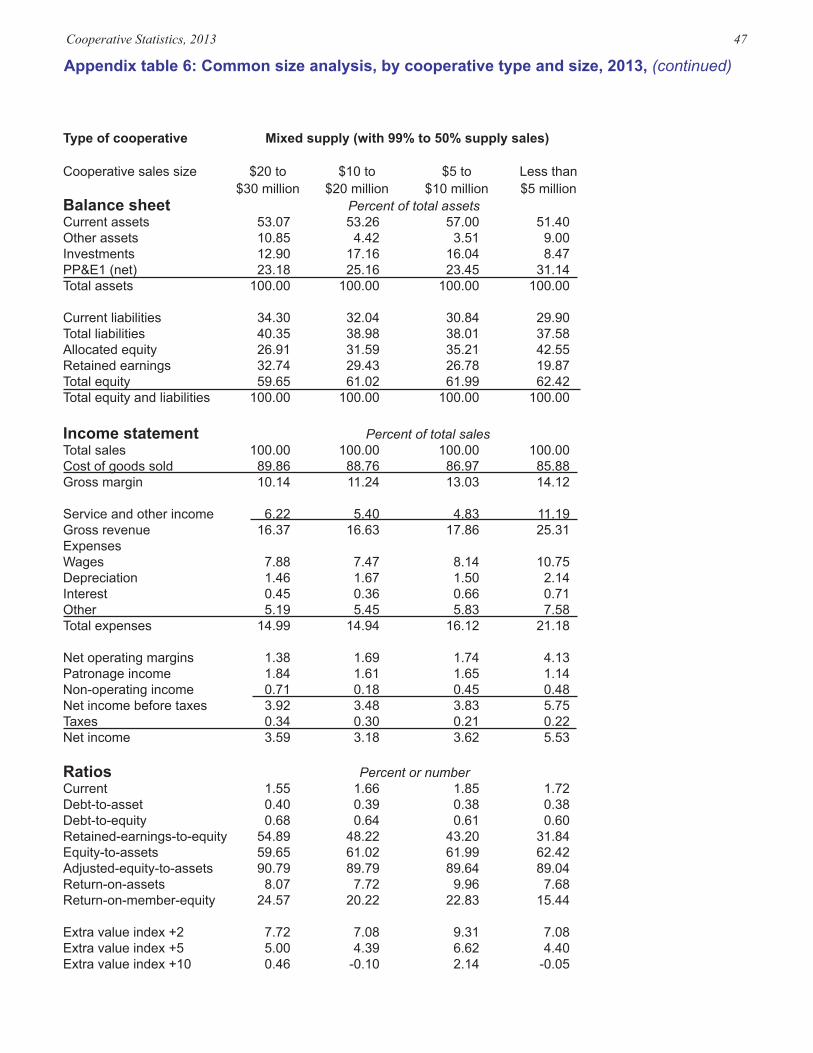
Cooperative Statistics, 2013 47
Type of cooperative Mixed supply (with 99% to 50% supply sales)
Cooperative sales size $20 to $10 to $5 to Less than $30 million $20 million $10 million $5 millionBalance sheet Percent of total assetsCurrent assets 53.07 53.26 57.00 51.40Other assets 10.85 4.42 3.51 9.00Investments 12.90 17.16 16.04 8.47PP&E1 (net) 23.18 25.16 23.45 31.14Total assets 100.00 100.00 100.00 100.00 Current liabilities 34.30 32.04 30.84 29.90Total liabilities 40.35 38.98 38.01 37.58Allocated equity 26.91 31.59 35.21 42.55Retained earnings 32.74 29.43 26.78 19.87Total equity 59.65 61.02 61.99 62.42Total equity and liabilities 100.00 100.00 100.00 100.00 Income statement Percent of total salesTotal sales 100.00 100.00 100.00 100.00Cost of goods sold 89.86 88.76 86.97 85.88Gross margin 10.14 11.24 13.03 14.12 Service and other income 6.22 5.40 4.83 11.19Gross revenue 16.37 16.63 17.86 25.31Expenses Wages 7.88 7.47 8.14 10.75Depreciation 1.46 1.67 1.50 2.14Interest 0.45 0.36 0.66 0.71Other 5.19 5.45 5.83 7.58Total expenses 14.99 14.94 16.12 21.18 Net operating margins 1.38 1.69 1.74 4.13Patronage income 1.84 1.61 1.65 1.14Non-operating income 0.71 0.18 0.45 0.48Net income before taxes 3.92 3.48 3.83 5.75Taxes 0.34 0.30 0.21 0.22Net income 3.59 3.18 3.62 5.53
Ratios Percent or numberCurrent 1.55 1.66 1.85 1.72Debt-to-asset 0.40 0.39 0.38 0.38Debt-to-equity 0.68 0.64 0.61 0.60Retained-earnings-to-equity 54.89 48.22 43.20 31.84Equity-to-assets 59.65 61.02 61.99 62.42Adjusted-equity-to-assets 90.79 89.79 89.64 89.04Return-on-assets 8.07 7.72 9.96 7.68Return-on-member-equity 24.57 20.22 22.83 15.44 Extra value index +2 7.72 7.08 9.31 7.08Extra value index +5 5.00 4.39 6.62 4.40Extra value index +10 0.46 -0.10 2.14 -0.05
Appendix table 6: Common size analysis, by cooperative type and size, 2013, (continued)
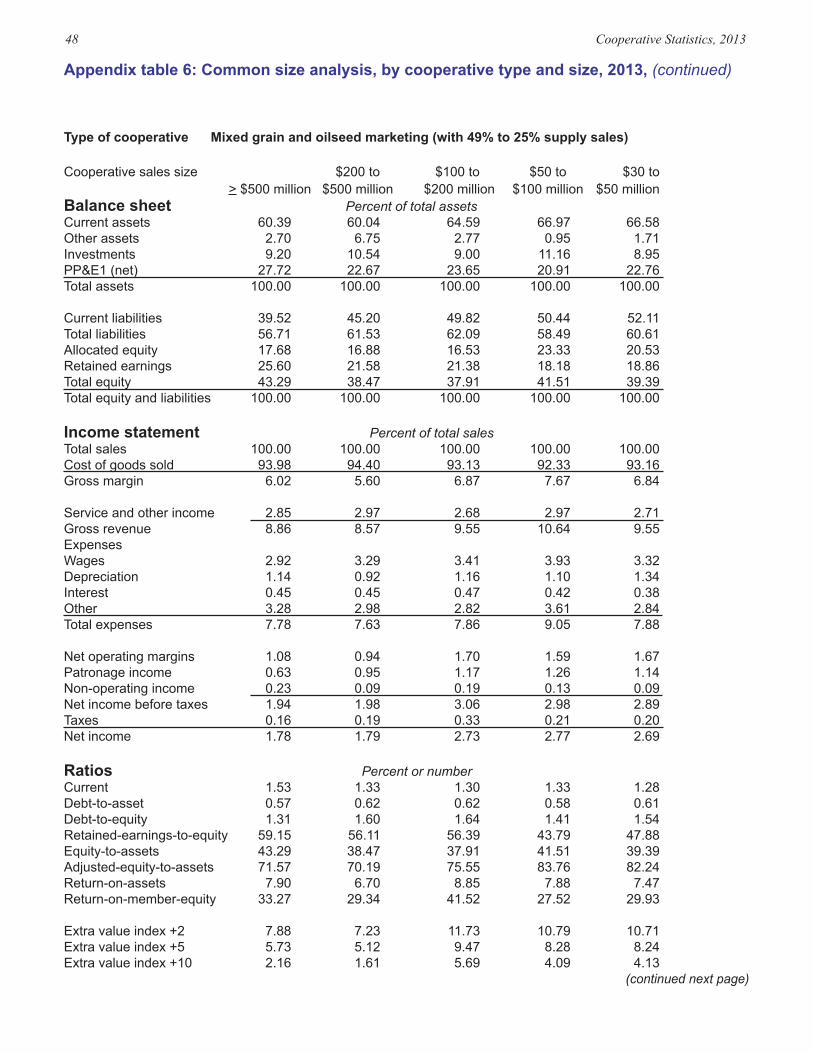
48 Cooperative Statistics, 2013
Type of cooperative Mixed grain and oilseed marketing (with 49% to 25% supply sales)
Cooperative sales size $200 to $100 to $50 to $30 to > $500 million $500 million $200 million $100 million $50 millionBalance sheet Percent of total assetsCurrent assets 60.39 60.04 64.59 66.97 66.58Other assets 2.70 6.75 2.77 0.95 1.71Investments 9.20 10.54 9.00 11.16 8.95PP&E1 (net) 27.72 22.67 23.65 20.91 22.76Total assets 100.00 100.00 100.00 100.00 100.00 Current liabilities 39.52 45.20 49.82 50.44 52.11Total liabilities 56.71 61.53 62.09 58.49 60.61Allocated equity 17.68 16.88 16.53 23.33 20.53Retained earnings 25.60 21.58 21.38 18.18 18.86Total equity 43.29 38.47 37.91 41.51 39.39Total equity and liabilities 100.00 100.00 100.00 100.00 100.00 Income statement Percent of total salesTotal sales 100.00 100.00 100.00 100.00 100.00Cost of goods sold 93.98 94.40 93.13 92.33 93.16Gross margin 6.02 5.60 6.87 7.67 6.84 Service and other income 2.85 2.97 2.68 2.97 2.71Gross revenue 8.86 8.57 9.55 10.64 9.55Expenses Wages 2.92 3.29 3.41 3.93 3.32Depreciation 1.14 0.92 1.16 1.10 1.34Interest 0.45 0.45 0.47 0.42 0.38Other 3.28 2.98 2.82 3.61 2.84Total expenses 7.78 7.63 7.86 9.05 7.88 Net operating margins 1.08 0.94 1.70 1.59 1.67Patronage income 0.63 0.95 1.17 1.26 1.14Non-operating income 0.23 0.09 0.19 0.13 0.09Net income before taxes 1.94 1.98 3.06 2.98 2.89Taxes 0.16 0.19 0.33 0.21 0.20Net income 1.78 1.79 2.73 2.77 2.69
Ratios Percent or numberCurrent 1.53 1.33 1.30 1.33 1.28Debt-to-asset 0.57 0.62 0.62 0.58 0.61Debt-to-equity 1.31 1.60 1.64 1.41 1.54Retained-earnings-to-equity 59.15 56.11 56.39 43.79 47.88Equity-to-assets 43.29 38.47 37.91 41.51 39.39Adjusted-equity-to-assets 71.57 70.19 75.55 83.76 82.24Return-on-assets 7.90 6.70 8.85 7.88 7.47Return-on-member-equity 33.27 29.34 41.52 27.52 29.93 Extra value index +2 7.88 7.23 11.73 10.79 10.71Extra value index +5 5.73 5.12 9.47 8.28 8.24Extra value index +10 2.16 1.61 5.69 4.09 4.13 (continued next page)
Appendix table 6: Common size analysis, by cooperative type and size, 2013, (continued)

Cooperative Statistics, 2013 49
Type of cooperative Mixed grain and oilseed marketing (with 49% to 25% supply sales)
Cooperative sales size $20 to $15 to $10 to $5 to Less than $30 million $20 million $15 million $10 million $5 millionBalance sheet Percent of total assetsCurrent assets 63.98 64.85 63.39 65.22 62.37Other assets 5.85 2.32 2.14 6.66 11.39Investments 8.95 7.34 11.92 7.63 2.34PP&E1 (net) 21.22 25.49 22.55 20.48 23.90Total assets 100.00 100.00 100.00 100.00 100.00 Current liabilities 47.32 47.63 38.72 44.23 44.00Total liabilities 56.37 53.07 47.59 52.13 58.04Allocated equity 21.69 25.39 25.87 27.95 30.01Retained earnings 21.94 21.53 26.54 19.92 11.95Total equity 43.63 46.93 52.41 47.87 41.96Total equity and liabilities 100.00 100.00 100.00 100.00 100.00 Income statement Percent of total salesTotal sales 100.00 100.00 100.00 100.00 100.00Cost of goods sold 92.51 92.60 93.63 92.26 90.85Gross margin 7.49 7.40 6.37 7.74 9.15 Service and other income 2.88 3.32 2.68 5.67 3.81Gross revenue 10.37 10.72 9.05 13.41 12.95Expenses Wages 3.91 4.19 4.07 5.17 6.71Depreciation 1.45 1.33 1.03 1.28 1.25Interest 0.52 0.41 0.39 0.49 0.63Other 2.83 3.45 3.21 5.13 3.79Total expenses 8.71 9.38 8.70 12.07 12.39 Net operating margins 1.67 1.34 0.35 1.35 0.57Patronage income 0.99 0.70 0.94 0.61 0.08Non-operating income 0.43 0.06 0.10 -0.21 0.54Net income before taxes 3.09 2.11 1.39 1.75 1.19Taxes 0.30 0.10 0.05 0.05 0.01Net income 2.79 2.01 1.33 1.69 1.18
Ratios Percent or numberCurrent 1.35 1.36 1.64 1.47 1.42Debt-to-asset 0.56 0.53 0.48 0.52 0.58Debt-to-equity 1.29 1.13 0.91 1.09 1.38Retained-earnings-to-equity 50.28 45.89 50.64 41.62 28.49Equity-to-assets 43.63 46.93 52.41 47.87 41.96Adjusted-equity-to-assets 82.82 89.62 85.54 85.84 74.94Return-on-assets 8.23 6.94 5.28 5.23 3.53Return-on-member-equity 29.26 21.77 15.31 14.16 7.64 Extra value index +2 9.91 8.25 4.26 4.88 2.16Extra value index +5 7.43 5.56 1.69 2.31 -0.09Extra value index +10 3.29 1.08 -2.58 -1.98 -3.83
Appendix table 6: Common size analysis, by cooperative type and size, 2013, (continued)

50 Cooperative Statistics, 2013
Type of cooperative Grain and oilseed marketing (with less than 25% supply sales)
Cooperative sales size ≥$500 $200 $100 $50 $30 million to $500 million to $200 million to $100 million to $50 millionBalance sheet Percent of total assetsCurrent assets 62.14 65.97 65.85 66.44 68.08Other assets 2.54 1.96 3.41 1.18 1.49Investments 8.87 6.78 6.97 6.63 4.31PP&E1 (net) 26.45 25.29 23.76 25.75 26.12Total assets 100.00 100.00 100.00 100.00 100.00 Current liabilities 43.36 53.22 51.82 49.85 51.34Total liabilities 59.18 64.24 61.61 60.13 62.58Allocated equity 19.62 16.75 20.47 19.67 13.63Retained earnings 21.20 19.01 17.92 20.20 23.78Total equity 40.82 35.76 38.39 39.87 37.42Total equity and liabilities 100.00 100.00 100.00 100.00 100.00
Income statement Percent of total salesTotal sales 100.00 100.00 100.00 100.00 100.00Cost of goods sold 93.52 95.01 95.47 95.29 95.96Gross margin 6.48 4.99 4.53 4.71 4.04 Service and other income 1.49 1.92 2.04 1.99 1.85Gross revenue 7.97 6.90 6.57 6.70 5.90Expenses Wages 3.03 2.12 2.12 1.99 1.89Depreciation 0.86 0.88 0.78 0.89 0.94Interest 0.44 0.35 0.28 0.38 0.36Other 2.53 2.22 1.88 2.05 1.98Total expenses 6.86 5.57 5.06 5.32 5.16 Net operating margins 1.11 1.33 1.52 1.38 0.73Patronage income 0.55 0.56 0.46 0.44 0.27Non-operating income 0.01 0.11 0.12 0.11 0.18Net income before taxes 1.68 2.00 2.09 1.93 1.19Taxes 0.17 0.11 0.15 0.11 0.15Net income 1.51 1.89 1.95 1.82 1.03
Ratios Percent or numberCurrent 1.43 1.24 1.27 1.33 1.33Debt-to-asset 0.59 0.64 0.62 0.60 0.63Debt-to-equity 1.45 1.80 1.61 1.51 1.67Retained-earnings-to-equity 51.94 53.16 46.67 50.67 63.56Equity-to-assets 40.82 35.76 38.39 39.87 37.42Adjusted-equity-to-assets 72.08 76.46 79.67 79.51 76.90Return-on-assets 7.78 6.79 6.94 7.06 4.82Return-on-member-equity 28.20 32.47 27.79 28.17 23.59 Extra value index +2 7.91 9.66 9.75 9.00 4.63Extra value index +5 5.75 7.36 7.36 6.61 2.32Extra value index +10 2.14 3.54 3.38 2.64 -1.53
Appendix table 6: Common size analysis, by cooperative type and size, 2013, (continued)

Cooperative Statistics, 2013 51
Type of cooperative Grain and oilseed marketing (with less than 25% supply sales)
Cooperative sales size $20 to $15 to $10 to $5 to Less than $30 million $20 million $15 million $10 million $5 millionBalance sheet Percent of total assetsCurrent assets 67.25 60.65 68.65 69.89 61.48Other assets 2.02 2.97 0.23 6.15 5.71Investments 5.56 4.04 7.01 4.81 6.81PP&E1 (net) 25.16 32.34 24.12 19.15 26.01Total assets 100.00 100.00 100.00 100.00 100.00 Current liabilities 51.22 43.99 42.03 44.37 44.51Total liabilities 61.05 56.18 50.30 53.20 58.68Allocated equity 18.76 19.25 34.02 21.53 26.69Retained earnings 20.19 24.57 15.68 25.26 14.62Total equity 38.95 43.82 49.70 46.80 41.32Total equity and liabilities 100.00 100.00 100.00 100.00 100.00
Income statement Percent of total salesTotal sales 100.00 100.00 100.00 100.00 100.00Cost of goods sold 94.82 95.59 92.64 94.61 90.62Gross margin 5.18 4.41 7.36 5.39 9.38 Service and other income 2.53 2.63 2.18 2.66 7.02Gross revenue 7.71 7.04 9.54 8.05 16.40Expenses Wages 2.26 2.30 2.73 3.15 5.92Depreciation 1.01 0.89 0.91 0.86 1.80Interest 0.43 0.67 0.33 0.30 0.74Other 2.27 2.10 3.69 2.65 7.92Total expenses 5.97 5.96 7.66 6.97 16.38 Net operating margins 1.75 1.08 1.87 1.09 0.02Patronage income 0.48 0.19 0.45 0.19 0.29Non-operating income 0.33 0.16 0.75 0.04 0.03Net income before taxes 2.55 1.42 3.07 1.32 0.34Taxes 0.22 0.07 0.06 0.14 0.02Net income 2.33 1.35 3.01 1.19 0.33
Ratios Percent or numberCurrent 1.31 1.38 1.63 1.58 1.38Debt-to-asset 0.61 0.56 0.50 0.53 0.59Debt-to-equity 1.57 1.28 1.01 1.14 1.42Retained-earnings-to-equity 51.84 56.07 31.54 53.99 35.40Equity-to-assets 38.95 43.82 49.70 46.80 41.32Adjusted-equity-to-assets 79.86 78.24 85.73 84.11 74.46Return-on-assets 7.18 6.10 8.82 4.39 2.38Return-on-member-equity 29.94 20.34 22.94 14.85 2.67 Extra value index +2 9.45 4.97 11.25 3.58 -0.64Extra value index +5 7.06 2.63 8.68 1.05 -2.87Extra value index +10 3.07 -1.29 4.39 -3.15 -6.59
Appendix table 6: Common size analysis, by cooperative type and size, 2013, (continued)

52 Cooperative Statistics, 2013
Type of cooperative Fish marketing Poultry marketing
Cooperative sales size ≥ $10 $5 to $1 to Less than ≥ $50 < $50 million $10 million $5 million $1 million million million Balance sheet Percent of total assetsCurrent assets 59.66 65.76 57.35 46.66 68.99 60.05Other assets 8.89 9.09 0.03 0.48 0.88 14.00Investments 0.01 0.00 0.00 0.10 1.20 0.37PP&E1 (net) 31.44 25.15 42.62 52.76 28.94 25.58Total assets 100.00 100.00 100.00 100.00 100.00 100.00 Current liabilities 45.42 58.32 45.14 35.44 30.87 34.37Total liabilities 58.09 63.93 59.35 60.49 43.70 43.84Allocated equity 30.43 17.35 28.66 37.98 20.20 26.86Retained earnings 11.48 18.72 11.99 1.53 36.10 29.30Total equity 41.91 36.07 40.65 39.51 56.30 56.16Total equity and liabilities 100.00 100.00 100.00 100.00 100.00 100.00
Income statement Percent of total salesTotal sales 100.00 100.00 100.00 100.00 100.00 100.00Cost of goods sold 75.34 80.94 82.13 87.13 90.96 79.43Gross margin 24.66 19.06 17.87 12.87 9.04 20.57 Service and other income 3.08 0.98 0.73 3.21 0.00 3.00Gross revenue 27.74 20.04 18.60 16.09 9.04 23.58Expenses Wages 12.85 2.70 8.39 6.94 5.89 8.91Depreciation 1.63 0.50 0.64 0.89 1.08 1.39Interest 0.63 0.19 0.35 0.47 0.38 0.21Other 7.80 13.39 8.57 7.73 2.55 11.59Total expenses 22.90 16.78 17.95 16.03 9.90 22.10 Net operating margins 4.83 3.26 0.65 0.05 -0.86 1.48Patronage income 0.00 0.00 0.02 0.09 0.03 0.17Non-operating income 0.10 0.07 0.08 0.00 0.41 0.12Net income before taxes 4.93 3.32 0.75 0.14 -0.43 1.76Taxes 0.02 0.03 -0.07 0.00 -0.16 0.07Net income 4.92 3.30 0.82 0.14 -0.27 1.70
Ratios Percent or numberCurrent 1.31 1.13 1.27 1.32 2.23 1.75Debt-to-asset 0.58 0.64 0.59 0.60 0.44 0.44Debt-to-equity 1.39 1.77 1.46 1.53 0.78 0.78Retained-earnings-to-equity 27.39 51.90 29.49 3.87 64.12 52.17Equity-to-assets 41.91 36.07 40.65 39.51 56.30 56.16Adjusted-equity-to-assets 76.78 86.53 74.10 61.20 81.44 85.56Return-on-assets 13.49 19.61 6.73 1.51 -0.17 3.96Return-on-member-equity 39.21 106.04 17.54 0.92 -4.57 12.67 Extra value index +2 19.88 41.91 7.25 -1.04 -3.44 2.98Extra value index +5 17.58 39.31 5.03 -2.88 -5.88 0.41Extra value index +10 13.74 34.98 1.33 -5.94 -9.95 -3.87 (continued next page)
Appendix table 6: Common size analysis, by cooperative type and size, 2013, (continued)

Cooperative Statistics, 2013 53
Type of cooperative Livestock marketing
Cooperative sales size ≥ $250 $50 to $10 to $5 to $1 to Less than million $110 million to $50 million to $10 million to $5 million $1 million Balance sheet Percent of total assetsCurrent assets 89.30 91.46 78.79 54.28 56.37 62.20Other assets 0.95 1.76 8.28 9.66 10.49 13.80Investments 3.77 1.23 0.00 0.00 2.61 0.00PP&E1 (net) 5.99 5.54 12.93 36.05 30.52 24.01Total assets 100.00 100.00 100.00 100.00 100.00 100.00 Current liabilities 73.61 74.34 70.88 35.37 51.98 54.35Total liabilities 77.75 81.11 79.09 38.95 57.88 63.71Allocated equity 9.55 13.94 48.83 15.35 28.67 28.18Retained earnings 12.69 4.96 -27.92 45.69 13.45 8.11Total equity 22.25 18.89 20.91 61.05 42.12 36.29Total equity and liabilities 100.00 100.00 100.00 100.00 100.00 100.00 Income statement Percent of total salesTotal sales 100.00 100.00 100.00 100.00 100.00 100.00Cost of goods sold 99.18 96.33 97.83 94.63 92.94 88.98Gross margin 0.82 3.67 2.17 5.37 7.06 11.02 Service and other income 1.15 2.22 3.55 1.36 3.48 9.76Gross revenue 1.97 5.90 5.72 6.73 10.53 20.79Expenses Wages 1.08 1.33 2.69 2.78 3.31 11.16Depreciation 0.06 0.22 0.55 0.75 0.76 1.04Interest 0.11 0.36 0.59 0.16 0.36 0.37Other 0.57 1.33 1.87 1.62 5.25 10.56Total expenses 1.82 3.25 5.70 5.30 9.68 23.13 Net operating margins 0.15 2.65 0.02 1.43 0.85 -2.35Patronage income 0.12 0.01 0.00 0.00 0.00 0.00Non-operating income 0.04 0.08 0.18 0.00 0.01 0.95Net income before taxes 0.30 2.74 0.20 1.43 0.87 -1.39Taxes 0.01 0.01 0.02 0.31 0.00 0.13Net income 0.29 2.73 0.19 1.13 0.87 -1.52
Ratios Percent or numberCurrent 1.21 1.23 1.11 1.53 1.08 1.14Debt-to-asset 0.78 0.81 0.79 0.39 0.58 0.64Debt-to-equity 3.50 4.29 3.78 0.64 1.37 1.76Retained-earnings-to-equity 57.06 26.24 -133.54 74.85 31.94 22.35Equity-to-assets 22.25 18.89 20.91 61.05 42.12 36.29Adjusted-equity-to-assets 84.29 73.64 71.81 94.46 87.71 79.51Return-on-assets 4.05 7.54 2.30 13.17 5.50 -1.14Return-on-member-equity 29.83 47.62 1.10 60.87 13.51 -6.03 Extra value index +2 8.62 23.97 -0.01 12.02 5.80 -5.78Extra value index +5 6.09 21.76 -2.16 9.19 3.17 -8.16Extra value index +10 1.88 18.07 -5.75 4.47 -1.22 -12.14
Appendix table 6: Common size analysis, by cooperative type and size, 2013, (continued)

54 Cooperative Statistics, 2013
Type of cooperative Dry bean and Nut marketing Biofuels pea marketingCooperative sales size ≥ $10 < $10 All sizes million million All sizesBalance sheet Percent of total assetsCurrent assets 79.13 52.89 39.43 40.59Other assets 0.58 2.50 2.14 13.66Investments 3.15 1.11 0.33 0.86PP&E1 (net) 17.14 43.50 58.09 44.89Total assets 100.00 100.00 100.00 100.00 Current liabilities 67.51 29.88 23.04 19.29Total liabilities 74.10 65.31 62.26 27.75Allocated equity 21.70 17.34 33.62 53.72Retained earnings 4.20 17.35 4.12 18.53Total equity 25.90 34.69 37.74 72.25Total equity and liabilities 100.00 100.00 100.00 100.00
Income statement Percent of total salesTotal sales 100.00 100.00 100.00 100.00Cost of goods sold 89.62 82.27 68.53 87.12Gross margin 10.38 17.73 31.47 12.88 Service and other income 1.17 0.21 43.66 0.00Gross revenue 11.55 17.94 75.12 12.88Expenses Wages 3.78 2.45 21.33 1.36Depreciation 1.26 0.69 12.09 2.90Interest 0.49 0.06 2.32 0.20Other 2.78 11.13 22.32 5.96Total expenses 8.31 14.33 58.06 10.41 Net operating margins 3.24 3.61 17.06 2.47Patronage income 0.55 0.02 0.02 0.00Non-operating income 0.02 0.00 0.41 1.47Net income before taxes 3.81 3.63 17.49 3.94Taxes 0.11 0.13 0.45 0.18Net income 3.70 3.50 17.04 3.76
Ratios Percent or numberCurrent 1.17 1.77 1.71 2.10Debt-to-asset 0.74 0.65 0.62 0.28Debt-to-equity 2.86 1.88 1.65 0.38Retained-earnings-to-equity 16.21 50.02 10.91 25.65Equity-to-assets 25.90 34.69 37.74 72.25Adjusted-equity-to-assets 79.69 49.47 49.04 89.52Return-on-assets 6.57 11.33 12.76 10.31Return-on-member-equity 26.10 61.93 32.64 17.42 Extra value index +2 15.37 14.04 13.00 9.29Extra value index +5 12.98 12.55 11.53 6.60Extra value index +10 9.00 10.08 9.07 2.12 (continued next page)
Appendix table 6: Common size analysis, by cooperative type and size, 2013, (continued)

Cooperative Statistics, 2013 55
Type of cooperative Rice marketing Tobacco Wool marketing marketingCooperative sales size ≥ $50 < $20 million million All sizes All sizes Balance sheet Percent of total assetsCurrent assets 62.65 61.71 46.10 45.16Other assets 5.67 18.87 47.27 36.76Investments 1.53 0.61 0.00 0.42PP&E1 (net) 30.15 18.81 6.63 17.66Total assets 100.00 100.00 100.00 100.00 Current liabilities 27.46 25.29 15.43 21.23Total liabilities 41.10 34.36 22.96 40.13Allocated equity 34.15 45.15 50.62 41.53Retained earnings 24.75 20.50 26.41 18.34Total equity 58.90 65.64 77.04 59.87Total equity and liabilities 100.00 100.00 100.00 100.00
Income statement Percent of total salesTotal sales 100.00 100.00 100.00 100.00Cost of goods sold 77.92 95.65 90.23 79.43Gross margin 22.08 4.35 9.77 20.57 Service and other income 1.00 4.15 0.46 3.60Gross revenue 23.08 8.49 10.23 24.17Expenses Wages 9.64 2.42 3.48 7.63Depreciation 1.72 0.30 0.38 0.89Interest 0.53 0.06 0.72 0.04Other 10.48 5.05 3.44 15.76Total expenses 22.36 7.83 8.02 24.31 Net operating margins 0.71 0.66 2.21 -0.14Patronage income 0.05 0.02 0.00 0.00Non-operating income 4.38 0.04 1.67 0.01Net income before taxes 5.14 0.72 3.89 -0.13Taxes 1.73 -0.19 0.04 0.00Net income 3.41 0.91 3.85 -0.13
Ratios Percent or numberCurrent 2.28 2.44 2.99 2.13Debt-to-asset 0.41 0.34 0.23 0.40Debt-to-equity 0.70 0.52 0.30 0.67Retained-earnings-to-equity 42.02 31.22 34.29 30.64Equity-to-assets 58.90 65.64 77.04 59.87Adjusted-equity-to-assets 81.19 87.87 91.09 76.01Return-on-assets 12.52 5.49 3.10 -0.07Return-on-member-equity 22.04 14.15 5.12 -0.23 Extra value index +2 8.28 6.29 0.71 -2.08Extra value index +5 5.84 3.65 -2.02 -4.36Extra value index +10 1.78 -0.74 -6.57 -8.16
Appendix table 6: Common size analysis, by cooperative type and size, 2013, (continued)

56 Cooperative Statistics, 2013
Type of cooperative Sugar marketing
Cooperative sales size ≥ $300 $100 to $30 to Less than million $300 million $100 million $20 million Balance sheet Percent of total assetsCurrent assets 46.67 18.74 42.84 61.85Other assets 12.97 61.21 0.75 15.12Investments 0.83 0.30 5.04 0.00PP&E1 (net) 39.53 19.75 51.37 23.03Total assets 100.00 100.00 100.00 100.00 Current liabilities 38.51 15.31 33.87 48.91Total liabilities 57.63 26.95 49.22 59.28Allocated equity 41.09 12.29 46.45 26.24Retained earnings 1.28 60.76 4.33 14.48Total equity 42.37 73.05 50.78 40.72Total equity and liabilities 100.00 100.00 100.00 100.00 Income statement Percent of total salesTotal sales 100.00 100.00 100.00 100.00Cost of goods sold 82.37 79.28 76.79 91.42Gross margin 17.63 20.72 23.21 8.58 Service and other income 0.86 0.01 0.31 5.17Gross revenue 18.49 20.73 23.51 13.74Expenses Wages 6.00 9.08 5.90 0.73Depreciation 1.67 2.12 1.72 0.11Interest 0.38 0.37 0.92 0.05Other 8.42 7.75 13.05 11.49Total expenses 16.48 19.31 21.59 12.37 Net operating margins 2.01 1.42 1.92 1.37Patronage income 0.01 0.05 0.12 0.00Non-operating income -0.31 12.98 0.28 0.00Net income before taxes 1.71 14.46 2.32 1.37Taxes 0.13 1.35 0.15 0.00Net income 1.58 13.10 2.17 1.37
Ratios Percent or numberCurrent 1.21 1.22 1.26 1.26Debt-to-asset 0.58 0.27 0.49 0.59Debt-to-equity 1.36 0.37 0.97 1.46Retained-earnings-to-equity 3.02 83.17 8.53 35.56Equity-to-assets 42.37 73.05 50.78 40.72Adjusted-equity-to-assets 68.90 86.26 76.78 79.71Return-on-assets 5.08 13.84 5.63 30.05Return-on-member-equity 9.33 99.56 8.11 110.74 Extra value index +2 4.46 12.22 3.71 54.83Extra value index +5 2.39 9.64 1.41 52.44Extra value index +10 -1.05 5.32 -2.43 48.45
(continued next page)
Appendix table 6: Common size analysis, by cooperative type and size, 2013, (continued)

Cooperative Statistics, 2013 57
Type of cooperative Rice drier Transportation Storage
Cooperative sales size ≥ $1 < $ 1 All sizes million million All sizesBalance sheet Percent of total assetsCurrent assets 36.71 44.84 48.00 32.51Other assets 6.72 1.57 0.95 0.02Investments 0.18 2.01 2.18 0.00PP&E1 (net) 56.39 51.58 48.87 67.47Total assets 100.00 100.00 100.00 100.00 Current liabilities 21.91 29.98 10.74 10.11Total liabilities 35.30 40.61 11.77 44.60Allocated equity 59.07 44.04 52.57 39.56Retained earnings 5.63 15.35 35.66 15.84Total equity 64.70 59.39 88.23 55.40Total equity and liabilities 100.00 100.00 100.00 100.00
Income statement Percent of serviceService and other income 100.00 100.00 100.00 100.00Gross revenue 100.00 100.00 100.00 100.00Expenses Wages 23.35 31.10 34.87 14.66Depreciation 8.53 6.79 12.09 11.25Interest 1.25 0.26 0.20 0.00Other 35.78 59.31 48.26 38.66Total expenses 68.92 97.47 95.42 64.58 Net operating margins 31.08 2.53 4.58 35.42Patronage income 0.15 0.42 0.33 0.00Non-operating income 0.17 0.18 1.39 0.18Net income before taxes 31.40 3.12 6.31 35.60Taxes -0.11 0.23 0.00 1.54Net income 31.52 2.89 6.31 34.06 Ratios Percent or numberCurrent 1.68 1.50 4.47 3.21Debt-to-asset 0.35 0.41 0.12 0.45Debt-to-equity 0.55 0.68 0.13 0.80Retained-earnings-to-equity 8.70 25.85 40.42 28.60Equity-to-assets 64.70 59.39 88.23 55.40Adjusted-equity-to-assets 82.86 84.82 98.84 61.64Return-on-assets 20.18 8.30 4.80 14.18Return-on-member-equity 32.97 16.11 8.84 34.30 Extra value index +2 22.81 7.94 2.66 13.51Extra value index +5 20.32 5.40 -0.31 11.66Extra value index +10 16.18 1.16 -5.25 8.57
Appendix table 6: Common size analysis, by cooperative type and size, 2013, (continued)

58 Cooperative Statistics, 2013
Type of cooperative Hulling Dairy Livestock Fresh Fruit & Farmer Service Service Veg. Service MarketsCooperative sales size All sizes All sizes All sizes All sizes All sizesBalance sheet Percent of total assetsCurrent assets 35.90 96.02 16.93 57.03 24.76Other assets 2.82 3.98 0.00 6.05 6.76Investments 0.01 0.00 0.00 8.46 0.03PP&E1 (net) 61.27 0.00 83.06 28.46 68.45Total assets 100.00 100.00 100.00 100.00 100.00 Current liabilities 22.19 24.82 -2.05 34.66 17.68Total liabilities 44.92 24.82 35.71 54.74 42.93Allocated equity 48.09 70.60 64.27 32.03 13.93Retained earnings 6.98 4.57 0.02 13.24 43.14Total equity 55.08 75.18 64.29 45.26 57.07Total equity and liabilities 100.00 100.00 100.00 100.00 100.00
Income statement Percent of serviceService and other income 100.00 100.00 100.00 100.00 100.00Gross revenue 100.00 100.00 100.00 100.00 100.00Expenses Wages 11.76 34.01 43.46 34.62 32.62Depreciation 5.56 0.00 1.89 3.94 5.66Interest 1.13 0.22 1.23 0.59 3.68Other 35.08 61.79 75.82 51.88 55.33Total expenses 53.51 96.03 122.40 91.03 97.29 Net operating margins 46.49 3.97 -22.40 8.97 2.71Patronage income 0.00 0.00 0.00 0.09 0.73Non-operating income 1.04 0.41 0.00 1.89 0.47Net income before taxes 47.52 4.38 -22.40 10.95 3.92Taxes 0.10 3.86 0.45 0.02 0.42Net income 47.43 0.52 -22.85 10.92 3.49
Ratios Percent or numberCurrent 1.62 3.87 -8.24 1.65 1.40Debt-to-asset 0.45 0.25 0.36 0.55 0.43Debt-to-equity 0.82 0.33 0.56 1.21 0.75Retained-earnings-to-equity 12.68 6.09 0.03 29.24 75.59Equity-to-assets 55.08 75.18 64.29 45.26 57.07Adjusted-equity-to-assets 70.78 100.00 63.00 69.27 69.33Return-on-assets 34.09 1.08 -3.44 10.55 4.84Return-on-member-equity 69.09 0.17 -5.77 31.20 15.98 Extra value index +2 40.88 -2.42 -5.26 13.51 0.92Extra value index +5 38.76 -5.42 -7.15 11.43 -1.16Extra value index +10 35.22 -10.42 -10.30 7.96 -4.63
Appendix table 6: Common size analysis, by cooperative type and size, 2013, (continued)
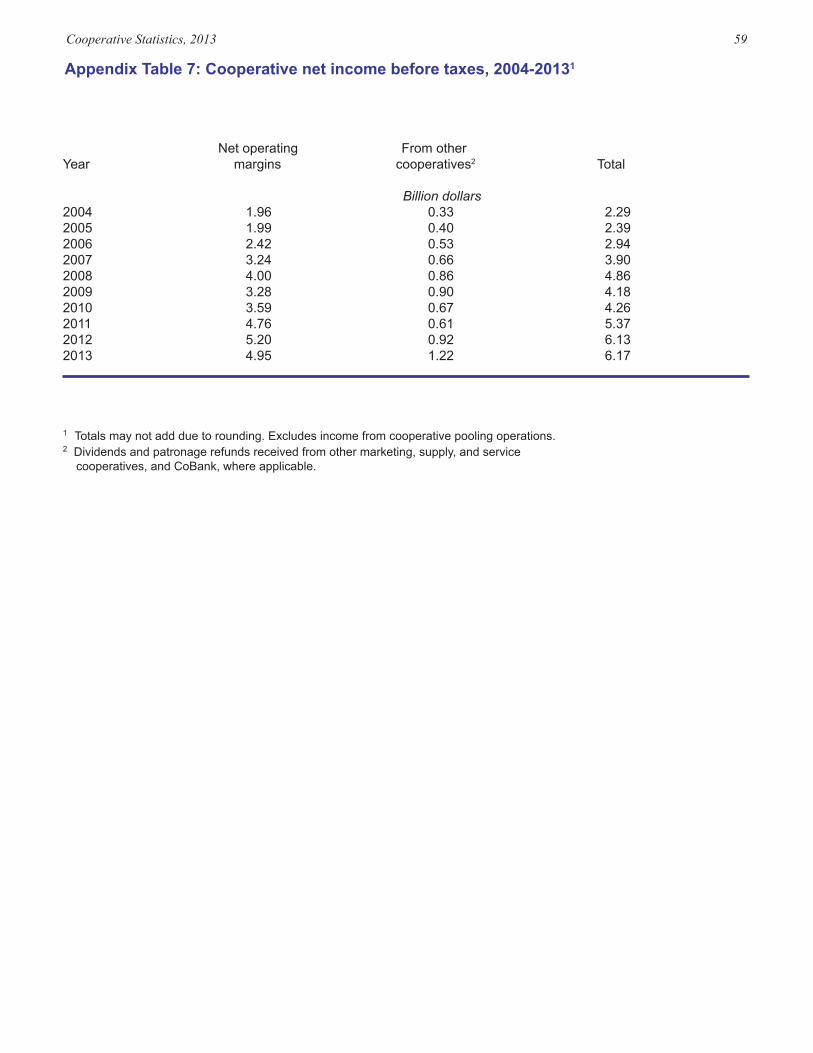
Cooperative Statistics, 2013 59
Net operating From otherYear margins cooperatives2 Total Billion dollars2004 1.96 0.33 2.292005 1.99 0.40 2.392006 2.42 0.53 2.942007 3.24 0.66 3.902008 4.00 0.86 4.862009 3.28 0.90 4.182010 3.59 0.67 4.262011 4.76 0.61 5.372012 5.20 0.92 6.132013 4.95 1.22 6.17
1 Totals may not add due to rounding. Excludes income from cooperative pooling operations.2 Dividends and patronage refunds received from other marketing, supply, and service cooperatives, and CoBank, where applicable.
Appendix Table 7: Cooperative net income before taxes, 2004-20131

60 Cooperative Statistics, 2013
APPENDIX FIGURES
Supply 39.8%
Livestock & poultry 4.7%
Grain & oilseed 22.4%
Fruit & vegetable 6.6%
Cotton ginning 6.8%
Dairy 5.8%
Service 5.5%
Percentages are based on a total of 2,186 cooperatives.1 Includes dry bean and pea, nut, wool and mohair, tobacco, rice, sugar, fishery, and other product marketing cooperatives.
Other marketing 8.3%1
Appendix Figure 1: Distribution of Cooperatives by Type, 2013

Cooperative Statistics, 2013 61
0
1
2
3
4
5
6
7
1979 1981 1983 1985 1987 1989 1991 1993 1995 1997 1999 2001 2003 2005 2007 2009 2011 2013
Memberships
Farms
Million
Other marketing 5.7%
Supply 41.6%
Service 0.9%
Cotton 3.2%
Fruit & vegetable 10.4%
1Livestock & poultry 1.7%
Sugar 5.0%
Grain & oilseed 17.3%
Dairy 15.4%
Rice 1.8%
Percentages are based on a total of 136,000 full-time employees1 Includes dry bean and pea, nut, wool and mohair, tobacco, fishery, and other product marketing cooperatives.
Appendix Figure 2: U.S. Farms and Cooperative Memberships, 1979-2013
Appendix Figure 3: Distribution of Full-Time Employees by Cooperative Type, 2013

62 Cooperative Statistics, 2013
0
25
50
75
100
125
150
175
200
225
250
1979 1981 1983 1985 1987 1989 1991 1993 1995 1997 1999 2001 2003 2005 2007 2009 2011 2013
Billion dollars
Gross1
Net2
2 Excludes inter-cooperative business
1 Includes inter-cooperative business
0
25
50
75
100
125
150
175
200
225
1979 1982 1985 1988 1991 1994 1997 2000 2003 2006 2009 20121 Total includes value of related services and other income.
Billion dollars
Total1
Supply
Marketing
Appendix Figure 4: Cooperatives’ Gross and Net Business Volumes, 1979-2013
Appendix Figure 5: Cooperatives’ Net Business Volume, 1979-2013

Cooperative Statistics, 2013 63
0
1
2
3
4
5
6
2004 2005 2006 2007 2008 2009 2010 2011 2012 2013
1 Includes other cooperatives and CoBank.
Billion dollars
Investments
Refunds
-10 0 10 20 30 40 50 60 70
Supply
Grain and oilseed
Fruit and vegetable
Dairy
Sugar
Rice
Cotton ginning
Service
Livestock and poultry
Cotton
Percent of total
Percentage based on net income before taxes of $6.2 billion. 1 Includes dry bean and pea, nut, bioenergy, wool and mohair, tobacco, fishery, and other product marketing cooperatives.
Other marketing1
Appendix Figure 6: Cooperatives’ Investments in Other Cooperatives and Patronage Refunds Received From Other Cooperatives,1 2003-2013
Appendix Figure 7: Distribution of Net Income Before Taxes, 2013

64 Cooperative Statistics, 2013
0 10 20 30 40 50 60 70
Cotton
Supply
Livestock & poultry
Grain & oilseed
Cotton ginning
Dairy
Fruit & vegetable
Service
Sugar
Rice
Percent of total Percentage based on before taxes losses of $212.8 million. 1 Includes dry bean and pea, nut, bioenergy, wool and mohair, tobacco, fishery, and other product marketing cooperatives.
Other marketing1
Appendix Figure 8: Distribution of Losses by Cooperative Type, 2013

Cooperative Statistics, 2013 65


