39
Coordinated Interaction Presentation to the Competition Commission of India US Chamber of Commerce October 27, 2010
| Date post: | 31-Dec-2015 |
| Category: |
Documents |
| Upload: | justin-richard |
| View: | 116 times |
| Download: | 1 times |
Coordinated Interaction
Presentation to the Competition Commission of India
US Chamber of CommerceOctober 27, 2010
Coordinated Interaction
• Definition: Firms recognize their interdependence and jointly coordinate on a less competitive outcome– Implicit (no communication) – Explicit (communication, typically illegal in the US)
• For coordination to work, for each firm, the benefits of achieving the coordinated outcome must exceed the costs
When Are the Costs to Coordination High?
• If “price” and product quality have many dimensions– Agreement must be complex– Explicit communication may be necessary, which brings
substantial antitrust risk• If complex pricing structures are necessary to
address a complex economic environment– Structures may need to be simplified to make coordination
feasible, but the firms lose substantial profits– Change in pricing structure can bring antitrust risk
When Are the Benefits to Coordination Small?
• If cheating is likely to occur– Firms have disagreements over what outcome to
coordinate on– Coordination feasibly can cover only a limited number of
the dimensions of “price” and product quality– Cheating is hard to detect– Cheating is hard to punish
• If non-participant firms can defeat an attempted price increase through supply response
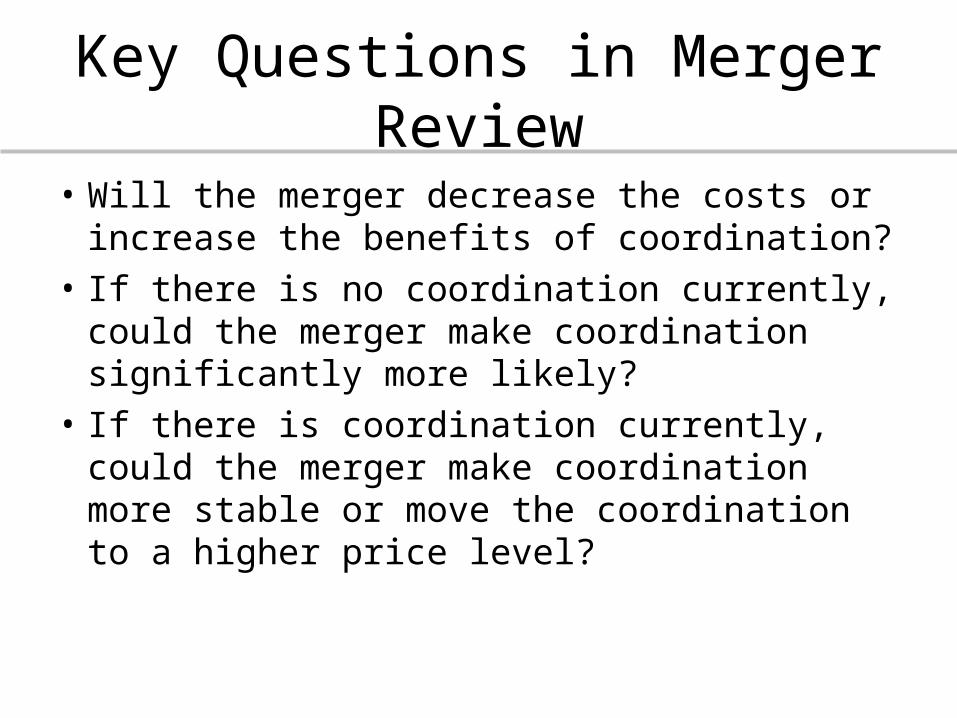
• Will the merger decrease the costs or increase the benefits of coordination?
• If there is no coordination currently, could the merger make coordination significantly more likely?
• If there is coordination currently, could the merger make coordination more stable or move the coordination to a higher price level?
Key Questions in Merger Review
Case Study #1
Would the Costs of Coordinating or the Difficulty in Detecting Cheating
Prevent Coordination?
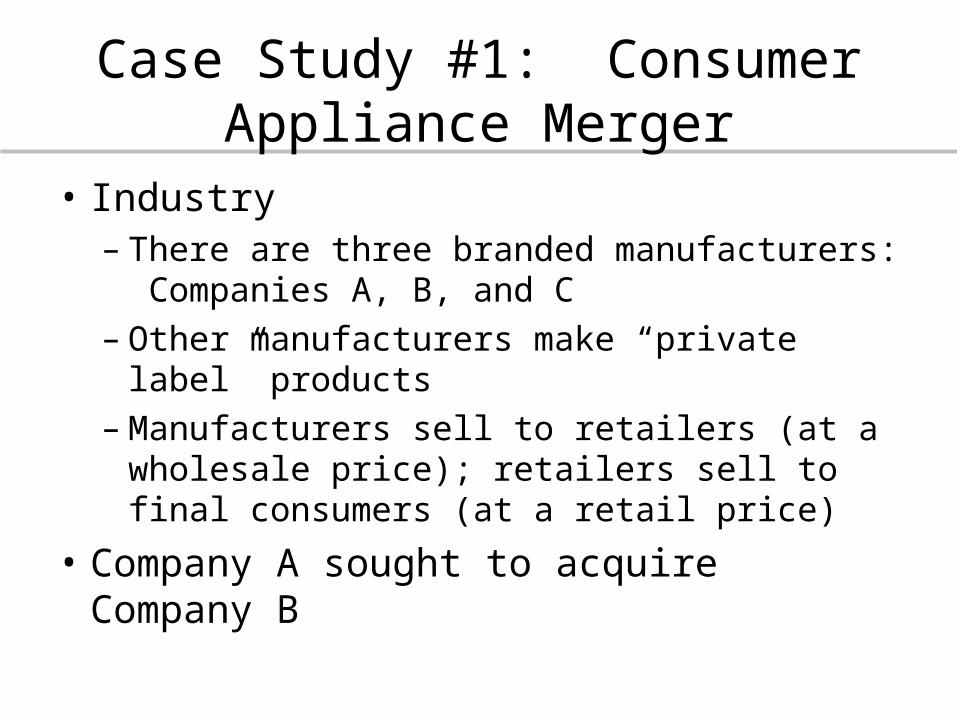
Case Study #1: Consumer Appliance Merger
• Industry– There are three branded manufacturers:
Companies A, B, and C– Other manufacturers make “private label”
products– Manufacturers sell to retailers (at a wholesale
price); retailers sell to final consumers (at a retail price)
• Company A sought to acquire Company B
FTC’s Concern
• With only two major branded manufacturers remaining after the merger, coordination between them would become more likely
• Non-branded manufacturers would not be able to constrain a post-merger coordinated wholesale price increase by the branded manufacturers
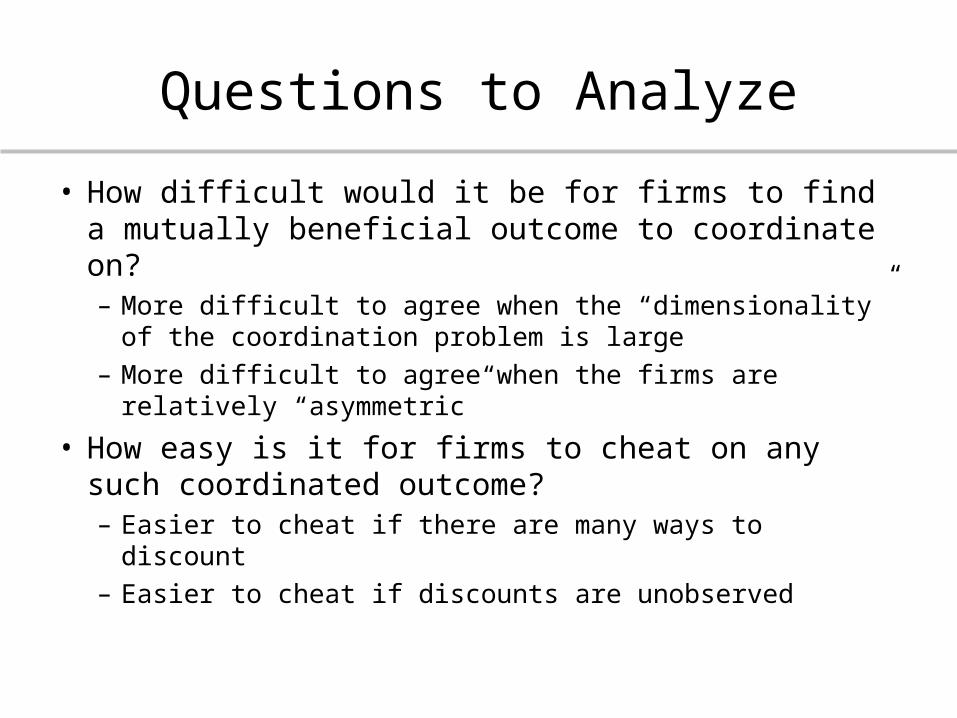
• How difficult would it be for firms to find a mutually beneficial outcome to coordinate on? – More difficult to agree when the “dimensionality” of the
coordination problem is large– More difficult to agree when the firms are relatively
“asymmetric”• How easy is it for firms to cheat on any such
coordinated outcome?– Easier to cheat if there are many ways to discount– Easier to cheat if discounts are unobserved
Questions to Analyze
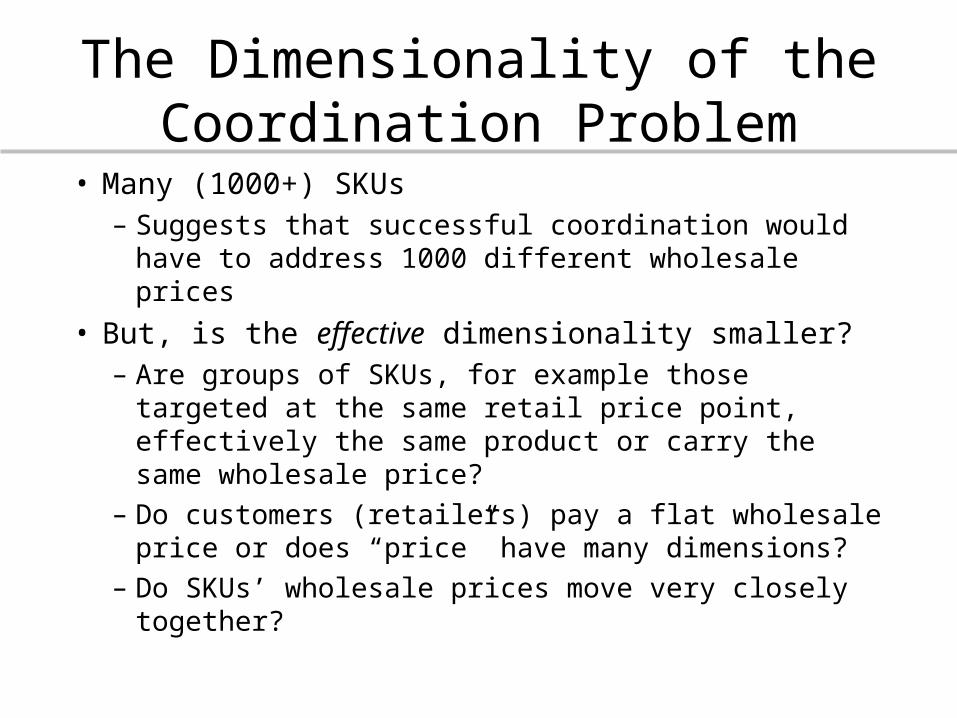
• Many (1000+) SKUs– Suggests that successful coordination would have to
address 1000 different wholesale prices• But, is the effective dimensionality smaller?
– Are groups of SKUs, for example those targeted at the same retail price point, effectively the same product or carry the same wholesale price?
– Do customers (retailers) pay a flat wholesale price or does “price” have many dimensions?
– Do SKUs’ wholesale prices move very closely together?
The Dimensionality of the Coordination Problem
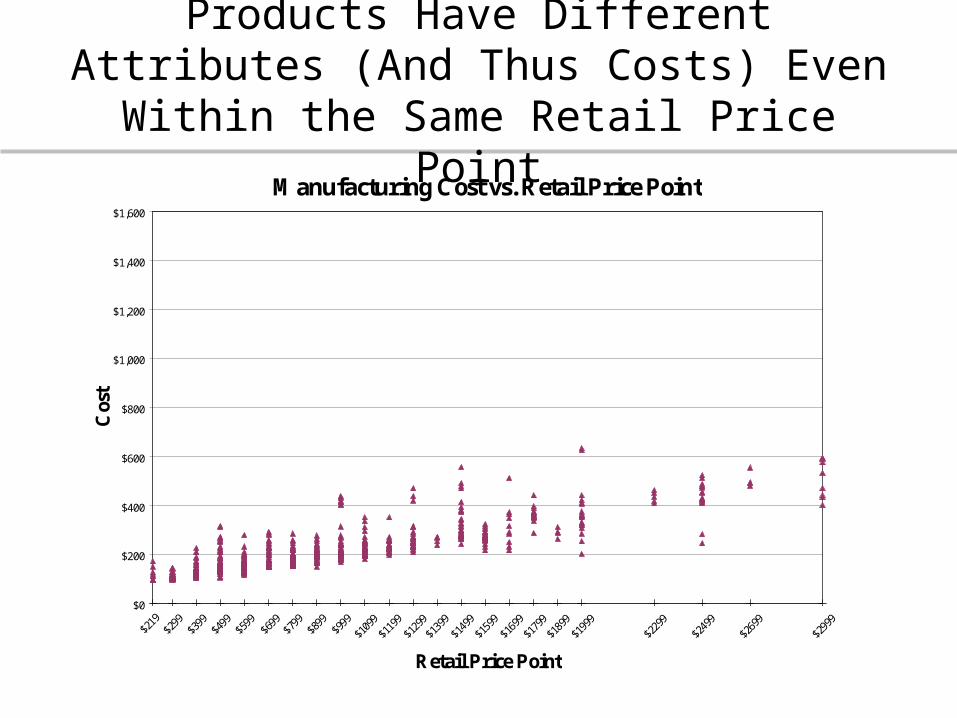
Products Have Different Attributes (And Thus Costs) Even Within the Same Retail Price Point
Manufacturing Cost vs. Retail Price Point
$219
$299
$399
$499
$599
$699
$799
$899
$999
$109
9
$1199
$129
9
$139
9
$149
9
$159
9
$169
9
$179
9
$189
9
$199
9
$229
9
$249
9
$269
9
$299
9$0
$200
$400
$600
$800
$1,000
$1,200
$1,400
$1,600
Retail Price Point
Cos
t
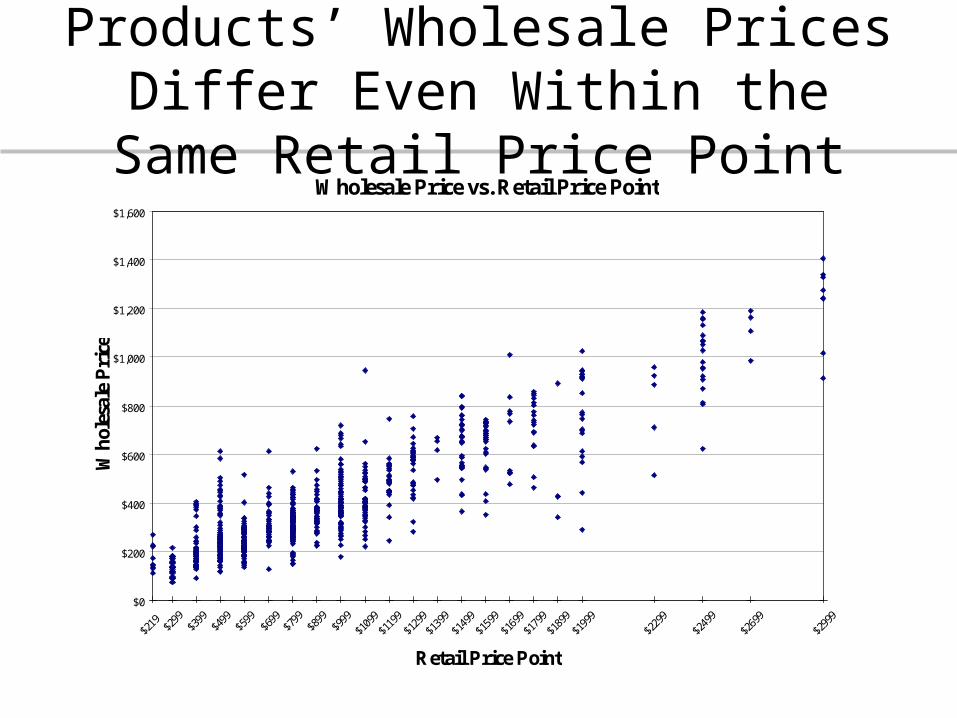
Products’ Wholesale Prices Differ Even Within the Same Retail Price Point
Wholesale Price vs. Retail Price Point
$219 $2
99$3
99$4
99$5
99$6
99$7
99$8
99$9
99
$109
9
$1199
$129
9
$139
9
$149
9
$159
9
$169
9
$179
9
$189
9
$199
9
$229
9
$249
9
$269
9
$299
9$0
$200
$400
$600
$800
$1,000
$1,200
$1,400
$1,600
Retail Price Point
Wh
oles
ale
Pri
ce
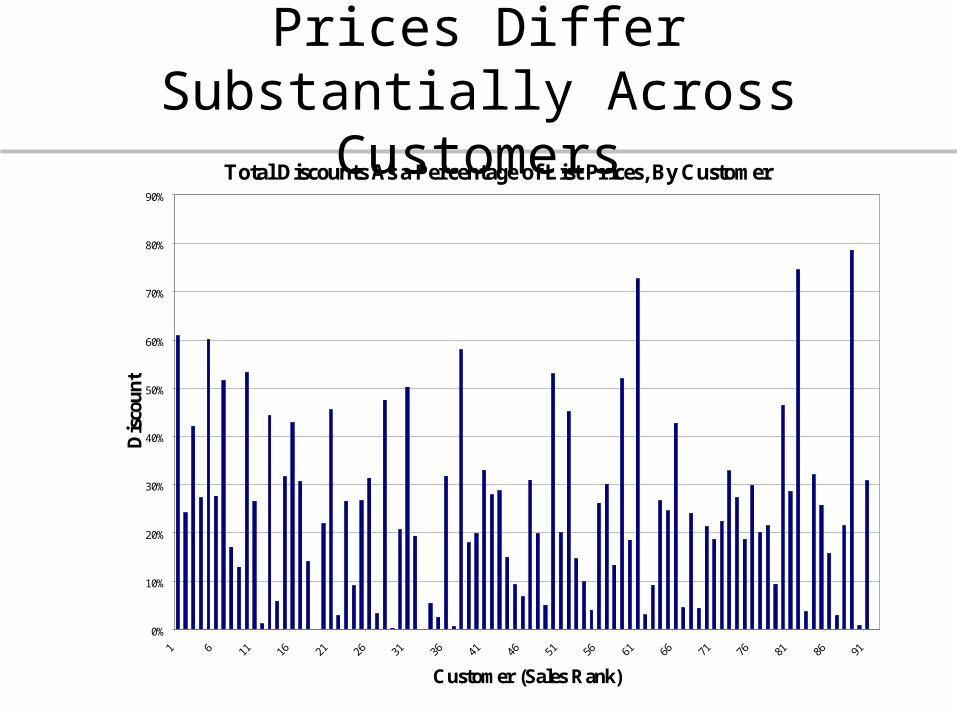
Prices Differ Substantially Across Customers
Total Discounts As a Percentage of List Prices, By Customer
0%
10%
20%
30%
40%
50%
60%
70%
80%
90%
1 6 11 16 21 26 31 36 41 46 51 56 61 66 71 76 81 86 91
Customer (Sales Rank)
Dis
cou
nt
“Price” Has Many Dimensions and Discounts are Unobservable
• Many types of discounts– On-invoice discounts– Volume rebates– “Push money”– Floor sample discounts– Point of purchase discounts– Over and above advertising discounts– Warranty allowances– Upfront money– Dealer relations– Other
• Substantial differences across customers in the types and amounts of discounts received
• Discounts are individually negotiated and not observable
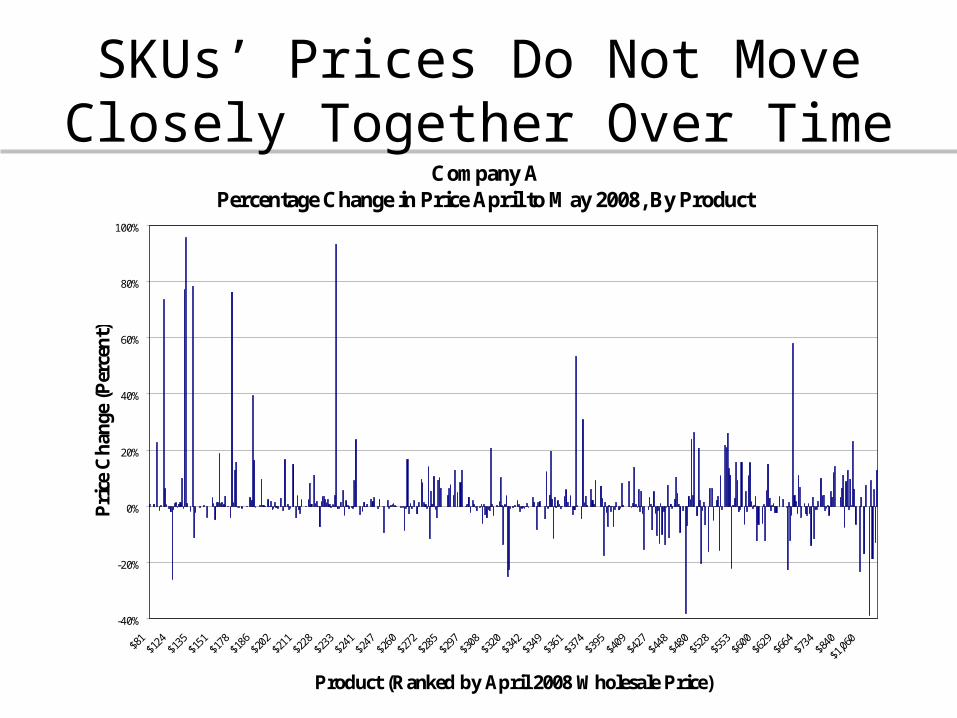
SKUs’ Prices Do Not Move Closely Together Over Time
Company APercentage Change in Price April to May 2008, By Product
-40%
-20%
0%
20%
40%
60%
80%
100%
$81$12
4$13
5$15
1$17
8$18
6$20
2$21
1$22
8$23
3$24
1$24
7$26
0$27
2$28
5$29
7$30
8$32
0$34
2$34
9$36
1$37
4$39
5$40
9$42
7$44
8$48
0$52
8$55
3$60
0$62
9$66
4$73
4$84
0
$1,060
Product (Ranked by April 2008 Wholesale Price)
Pri
ce C
han
ge (
Per
cen
t)
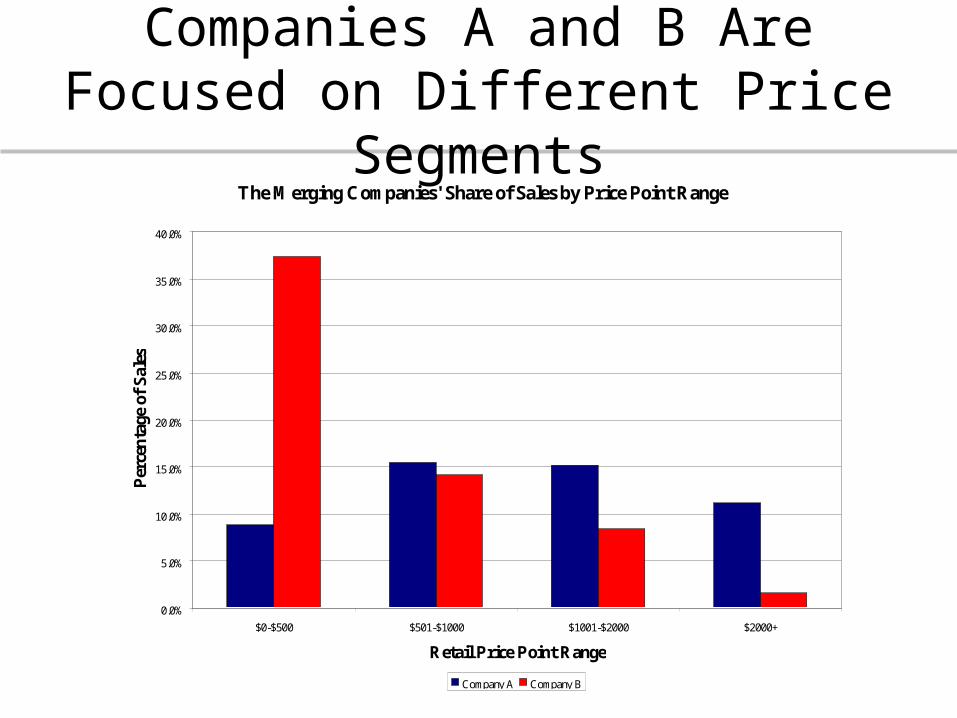
Companies A and B Are Focused on Different Price Segments
The Merging Companies' Share of Sales by Price Point Range
0.0%
5.0%
10.0%
15.0%
20.0%
25.0%
30.0%
35.0%
40.0%
$0-$500 $501-$1000 $1001-$2000 $2000+
Retail Price Point Range
Per
cen
tage
of
Sal
es
Company A Company B
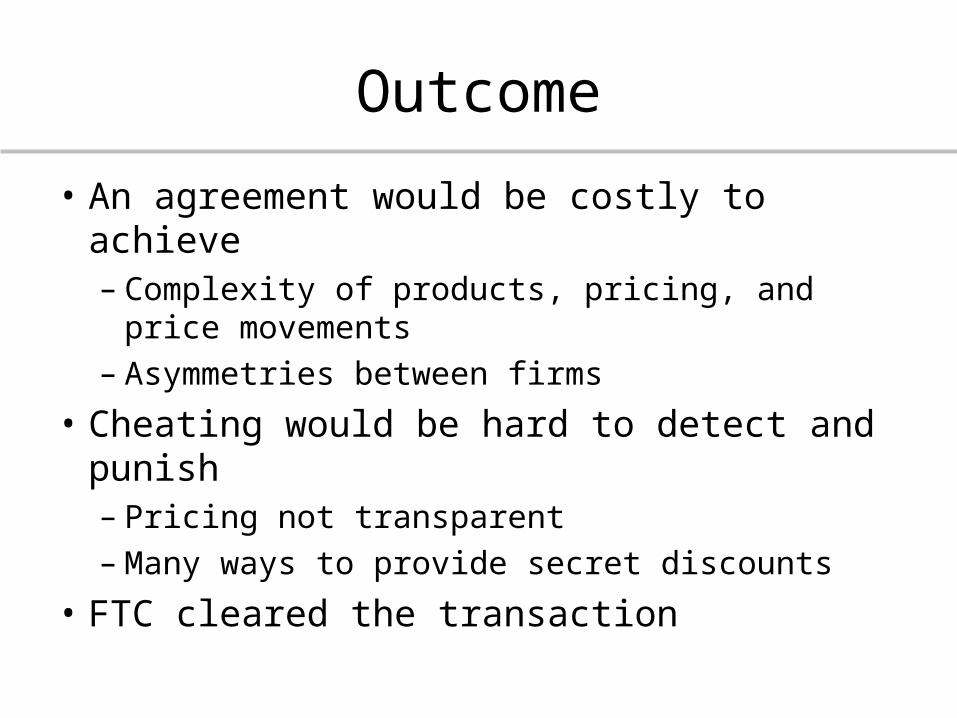
Outcome
• An agreement would be costly to achieve– Complexity of products, pricing, and price
movements– Asymmetries between firms
• Cheating would be hard to detect and punish– Pricing not transparent– Many ways to provide secret discounts
• FTC cleared the transaction
Case Study #2
Does the Merger Eliminate, or Create, a Maverick?
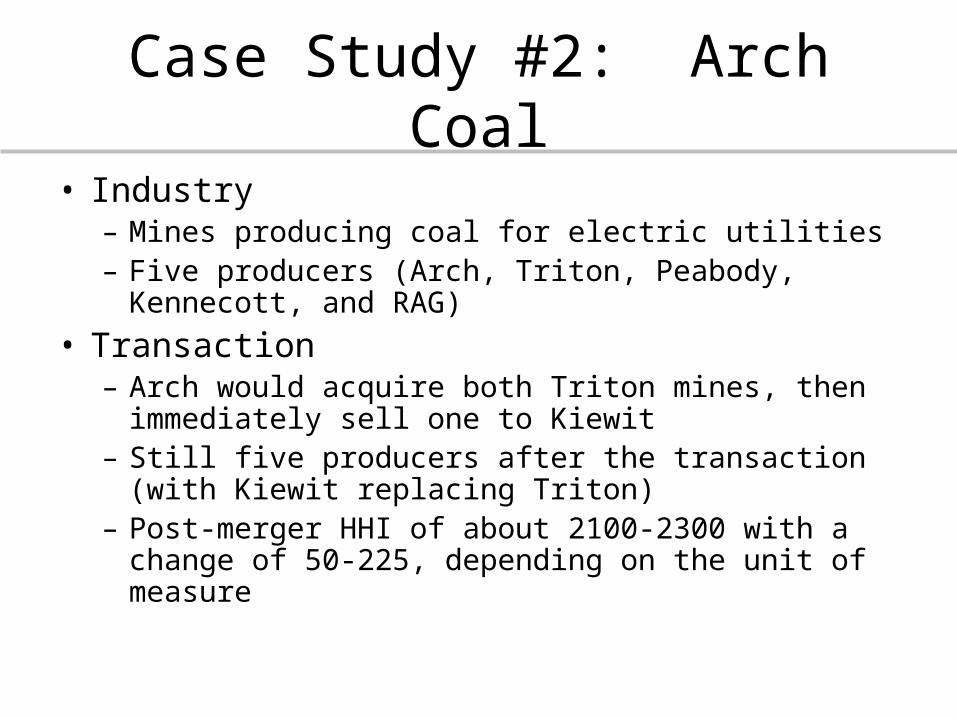
Case Study #2: Arch Coal• Industry
– Mines producing coal for electric utilities– Five producers (Arch, Triton, Peabody, Kennecott, and
RAG)• Transaction
– Arch would acquire both Triton mines, then immediately sell one to Kiewit
– Still five producers after the transaction (with Kiewit replacing Triton)
– Post-merger HHI of about 2100-2300 with a change of 50-225, depending on the unit of measure
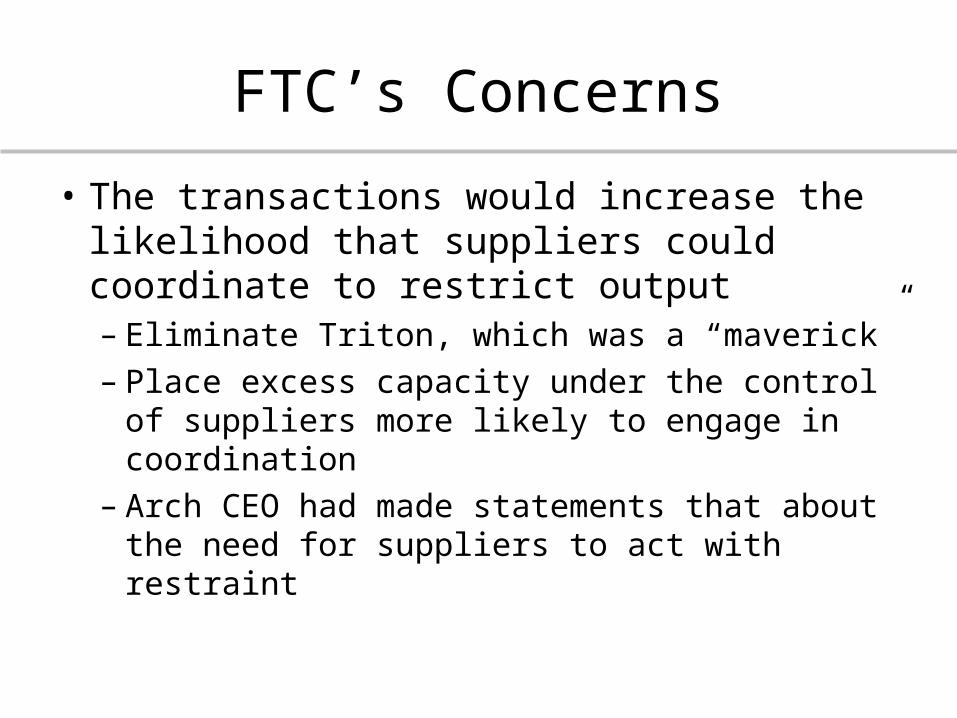
FTC’s Concerns
• The transactions would increase the likelihood that suppliers could coordinate to restrict output– Eliminate Triton, which was a “maverick”– Place excess capacity under the control of
suppliers more likely to engage in coordination– Arch CEO had made statements that about the
need for suppliers to act with restraint
Questions to Analyze
• Were industry conditions conducive to coordination?
• Was Triton a “maverick”?• Would Kiewit be any less of a maverick than
Triton?
Pre-Merger Industry Conditions• Some industry conditions not conducive to coordination
– Product not homogenous across suppliers– Suppliers’ cost structures differed– Price not transparent (sealed bidding)– Prevalence of long-term contracts
• But, others were conducive– Some information on mine production available (but not
current and not completely reliable)– Low elasticity of demand– Prices easily adjusted for product differences (reduces
dimensionality of the coordination problem)– Barriers to entry
Pre-Merger Industry Conditions
• No history of coordination and the industry was seen as competitive– Arch had previously restricted its production in
times of “over-supply” (i.e., low prices)– But, competitors had not followed in this strategy
Court concluded that coordination was feasible, but had not occurred historically and would not be easy
Triton
• High cost mine• Sold at a high price when demand exceeded
other supply from other mines• Did not bid aggressively for long-term
contracts • Not undercutting as a maverick would
Court found that Triton was not a maverick
Kiewit and RAG
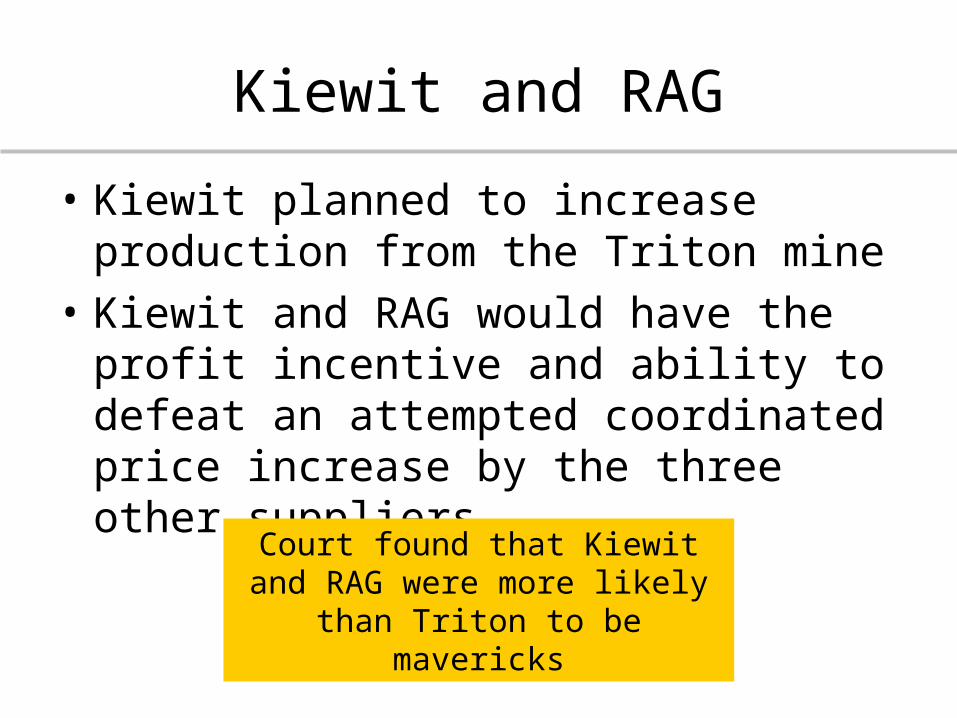
• Kiewit planned to increase production from the Triton mine
• Kiewit and RAG would have the profit incentive and ability to defeat an attempted coordinated price increase by the three other suppliers
Court found that Kiewit and RAG were more likely than Triton to be
mavericks
Outcome
• Court found that the transactions would not lead to an increase in the likelihood of coordination
• Conditions not very conducive for coordination
• Triton was not a maverick• Kiewit and RAG would have the incentive and
ability to constrain a coordination attempt by the other three suppliers
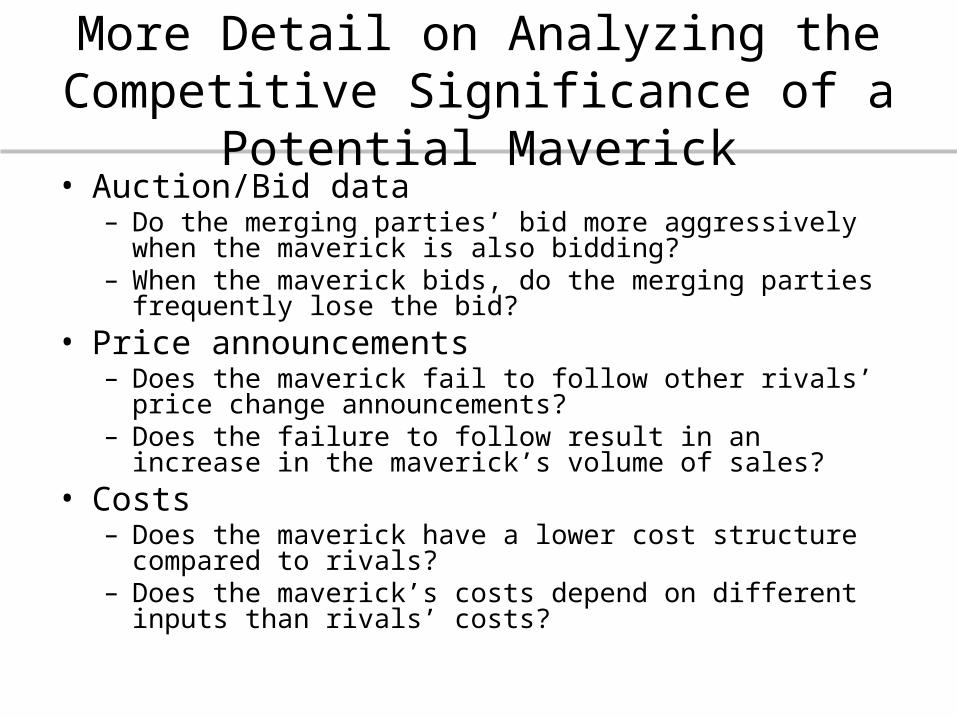
More Detail on Analyzing the Competitive Significance of a Potential Maverick
• Auction/Bid data– Do the merging parties’ bid more aggressively when the maverick
is also bidding?– When the maverick bids, do the merging parties frequently lose
the bid?• Price announcements
– Does the maverick fail to follow other rivals’ price change announcements?
– Does the failure to follow result in an increase in the maverick’s volume of sales?
• Costs– Does the maverick have a lower cost structure compared to rivals?– Does the maverick’s costs depend on different inputs than rivals’
costs?
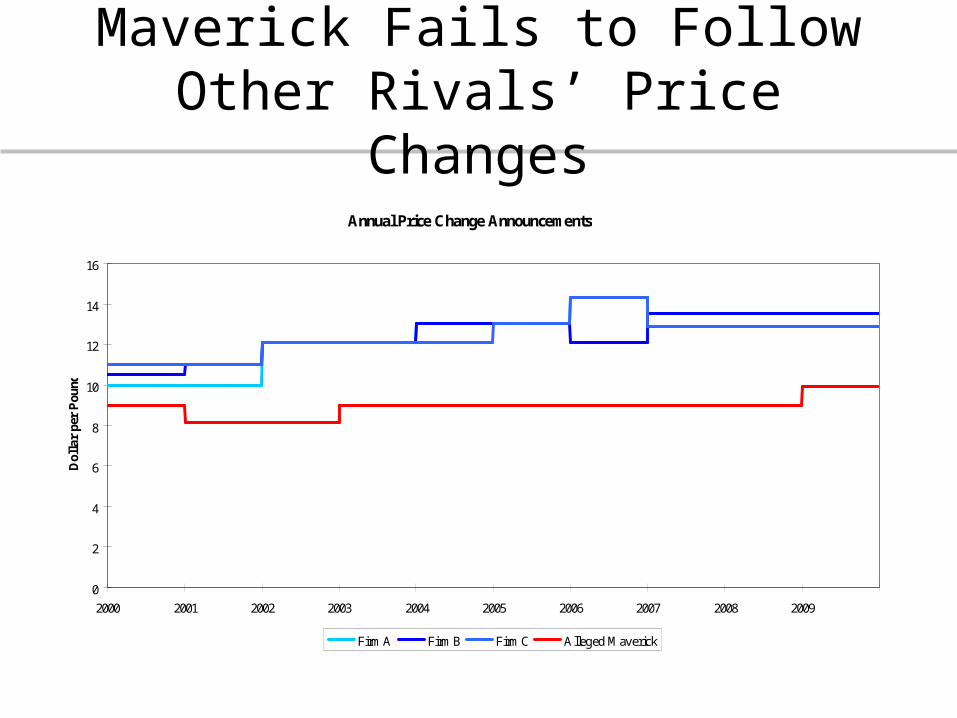
Annual Price Change Announcements
0
2
4
6
8
10
12
14
16
2000 2001 2002 2003 2004 2005 2006 2007 2008 2009
Dol
lar
per
Pou
nd
Firm A Firm B Firm C Alleged Maverick
Maverick Fails to Follow Other Rivals’ Price Changes
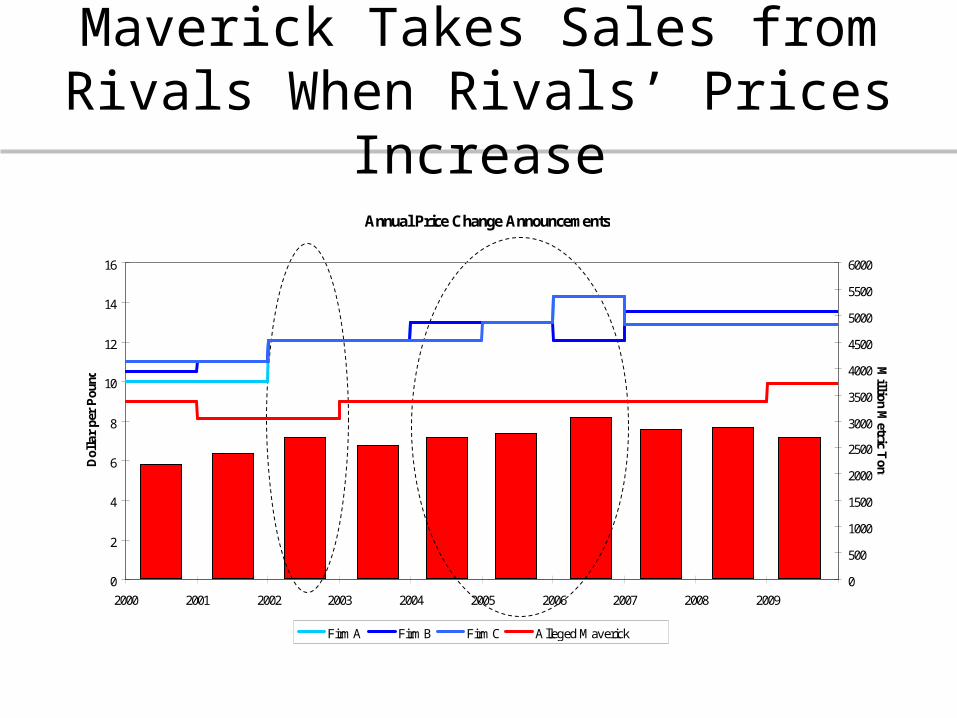
Annual Price Change Announcements
0
2
4
6
8
10
12
14
16
2000 2001 2002 2003 2004 2005 2006 2007 2008 2009
Dol
lar
per
Pou
nd
0
500
1000
1500
2000
2500
3000
3500
4000
4500
5000
5500
6000
Million M
etric Tons
Firm A Firm B Firm C Alleged Maverick
Maverick Takes Sales from Rivals When Rivals’ Prices Increase
0
2
4
6
8
10
12
14
16
0 2 4 6 8 10 12 14
Months
Pri
ce
0
2
4
6
8
10
12
14
16
0 2 4 6 8 10 12 14
Months
Pri
ce
0
2
4
6
8
10
12
14
16
0 2 4 6 8 10 12 14
Months
Pri
ce
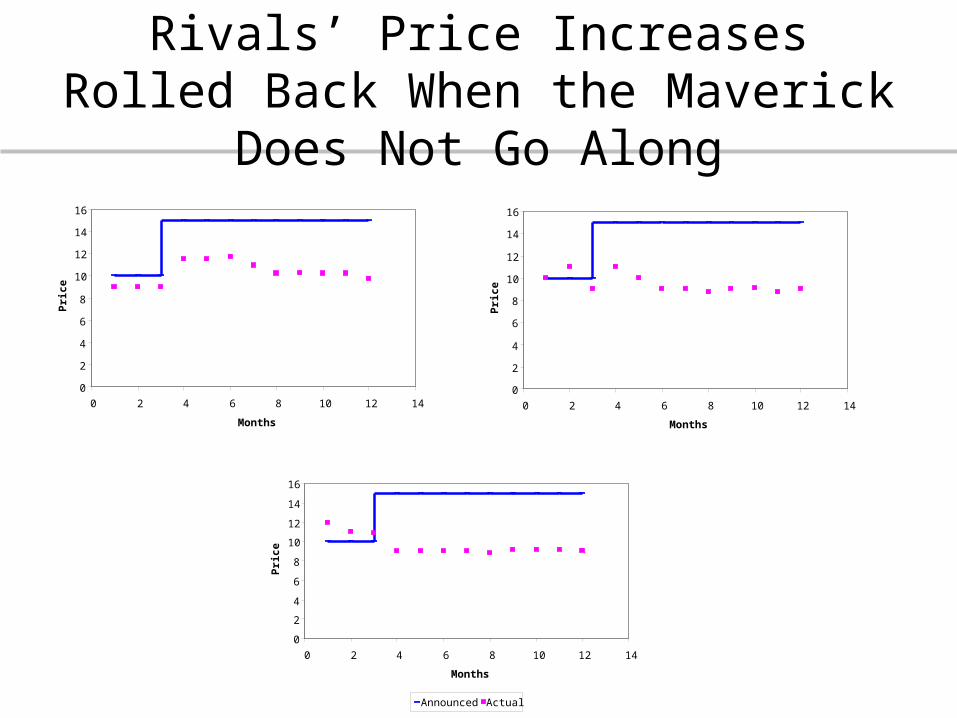
Announced Actual
Rivals’ Price Increases Rolled Back When the Maverick Does Not Go Along
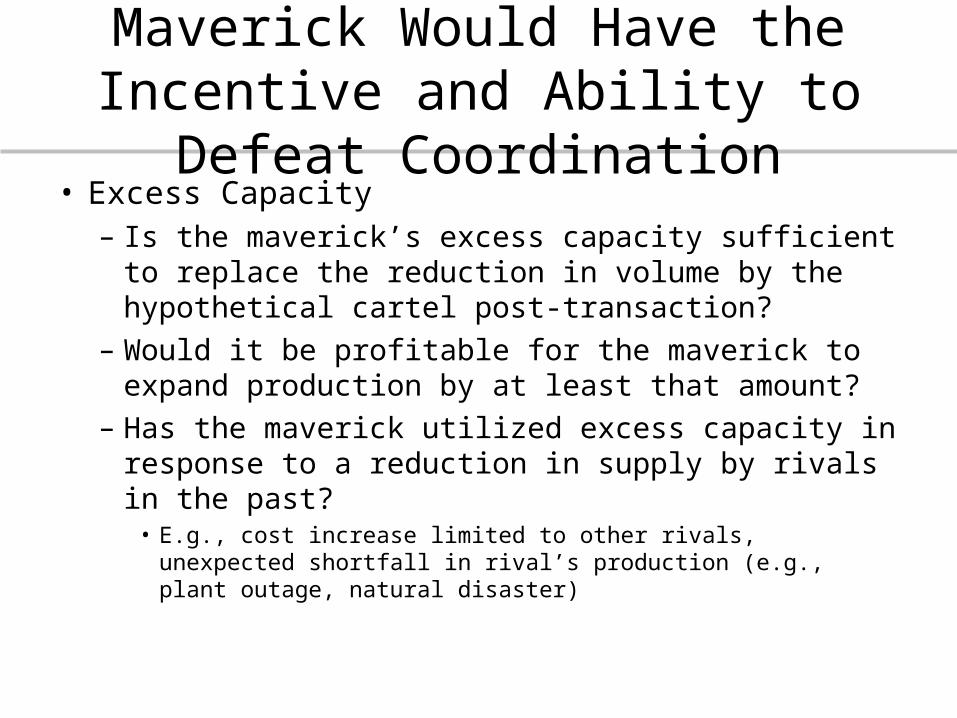
Maverick Would Have the Incentive and Ability to Defeat Coordination
• Excess Capacity– Is the maverick’s excess capacity sufficient to replace
the reduction in volume by the hypothetical cartel post-transaction?
– Would it be profitable for the maverick to expand production by at least that amount?
– Has the maverick utilized excess capacity in response to a reduction in supply by rivals in the past?
• E.g., cost increase limited to other rivals, unexpected shortfall in rival’s production (e.g., plant outage, natural disaster)
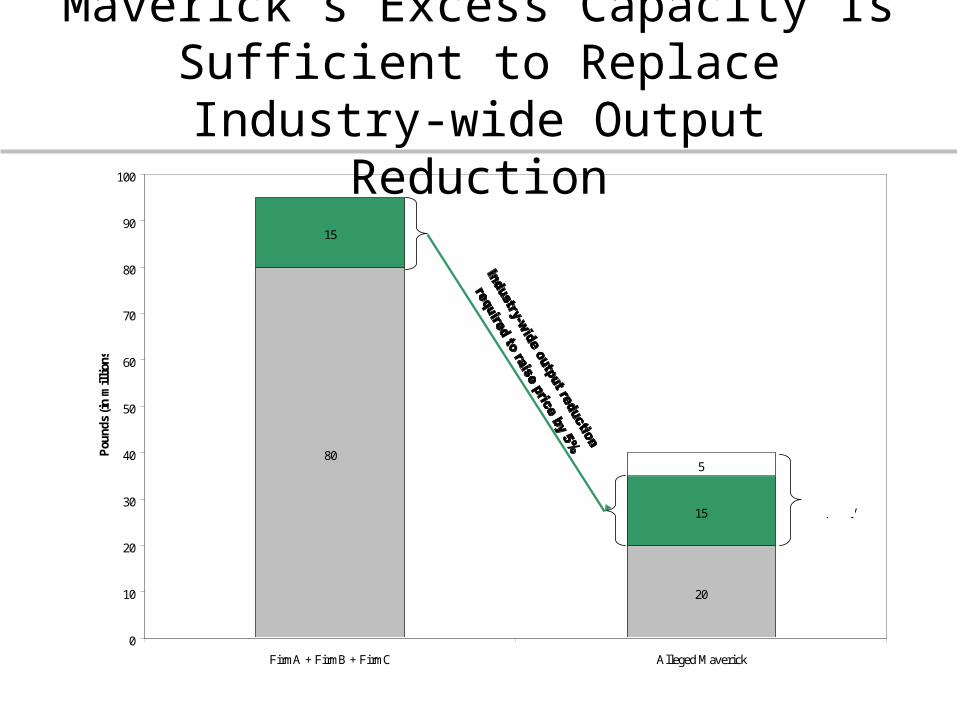
80
20
15
15
5
0
10
20
30
40
50
60
70
80
90
100
FirmA + FirmB + FirmC Alleged Maverick
Pou
nds
(in
mil
lion
s)
Excess Capacity
Maverick’s Excess Capacity Is Sufficient to Replace Industry-wide Output Reduction
Case Study #3
Does the Merger Change the Industry Structure to Make Coordination More
Likely?
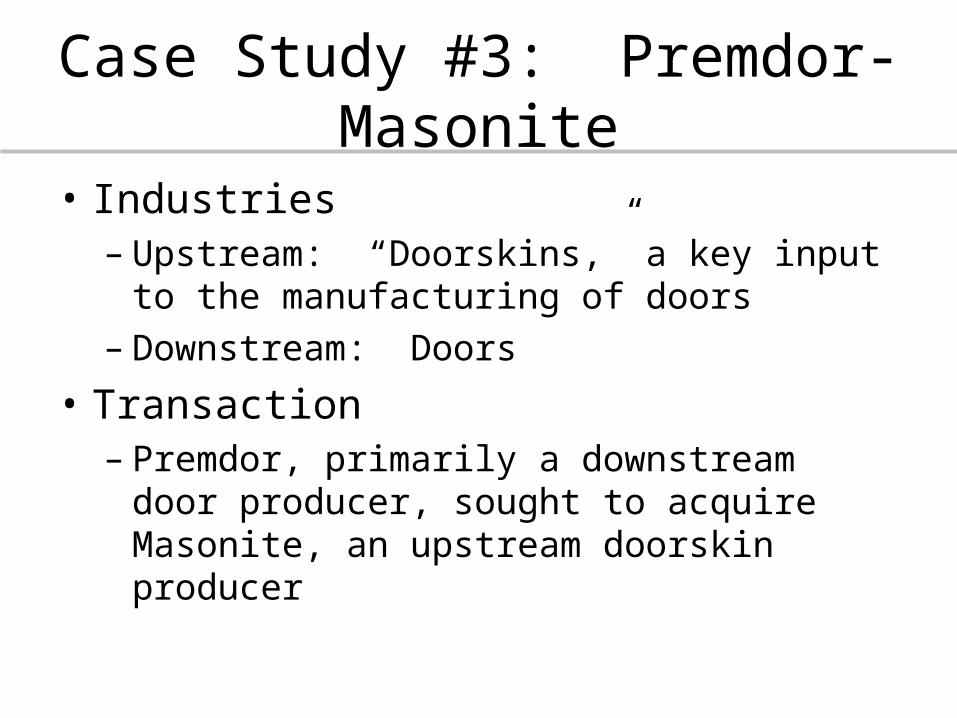
Case Study #3: Premdor-Masonite
• Industries– Upstream: “Doorskins,” a key input to the
manufacturing of doors– Downstream: Doors
• Transaction– Premdor, primarily a downstream door producer,
sought to acquire Masonite, an upstream doorskin producer
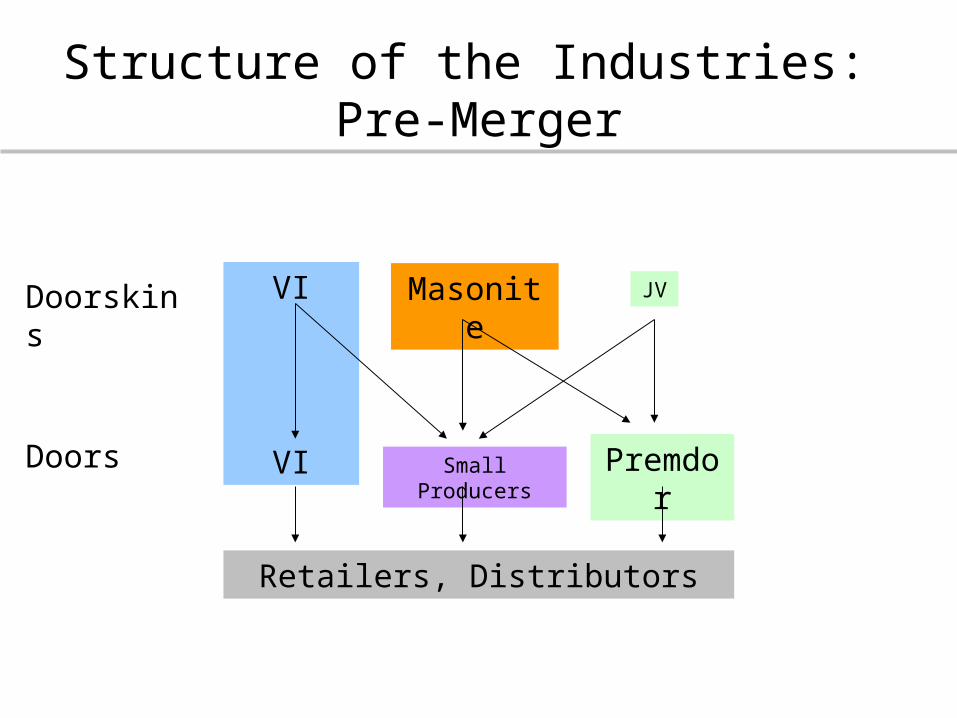
Structure of the Industries: Pre-Merger
VI
VI
Masonite
Small Producers Premdor
Retailers, Distributors
JVDoorskins
Doors
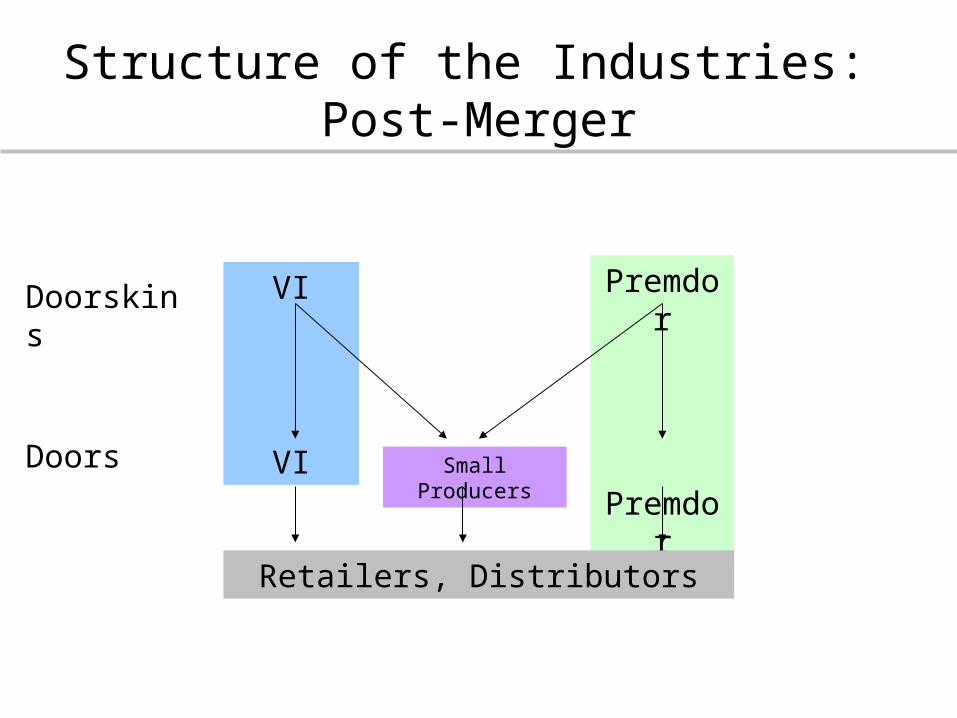
Structure of the Industries: Post-Merger
VI
VI Small Producers
Premdor
Premdor
Retailers, Distributors
Doorskins
Doors
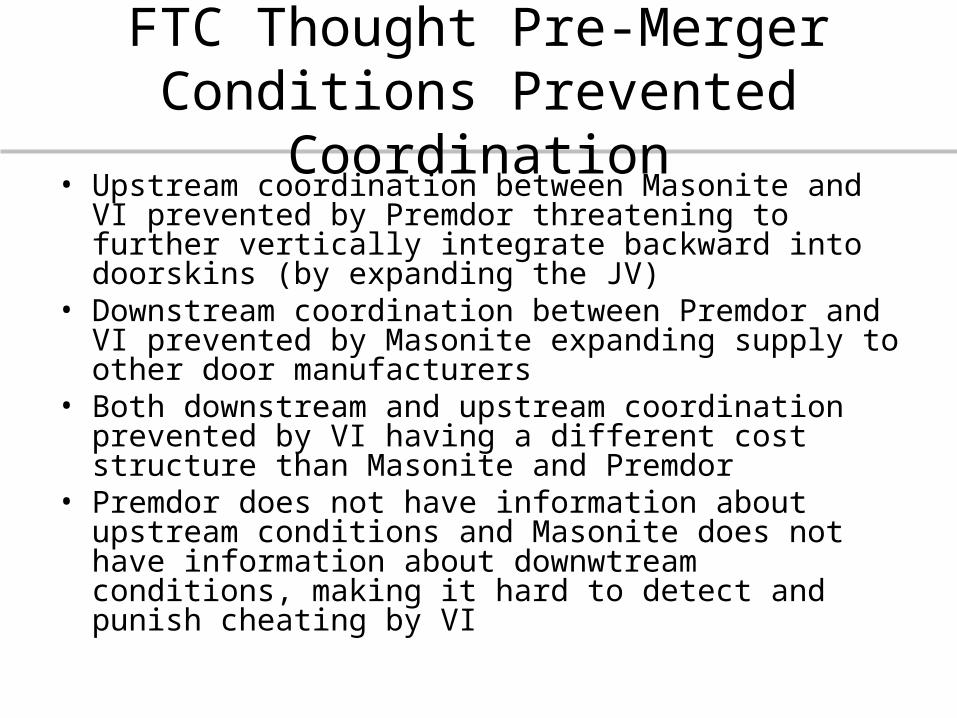
FTC Thought Pre-Merger Conditions Prevented Coordination
• Upstream coordination between Masonite and VI prevented by Premdor threatening to further vertically integrate backward into doorskins (by expanding the JV)
• Downstream coordination between Premdor and VI prevented by Masonite expanding supply to other door manufacturers
• Both downstream and upstream coordination prevented by VI having a different cost structure than Masonite and Premdor
• Premdor does not have information about upstream conditions and Masonite does not have information about downwtream conditions, making it hard to detect and punish cheating by VI
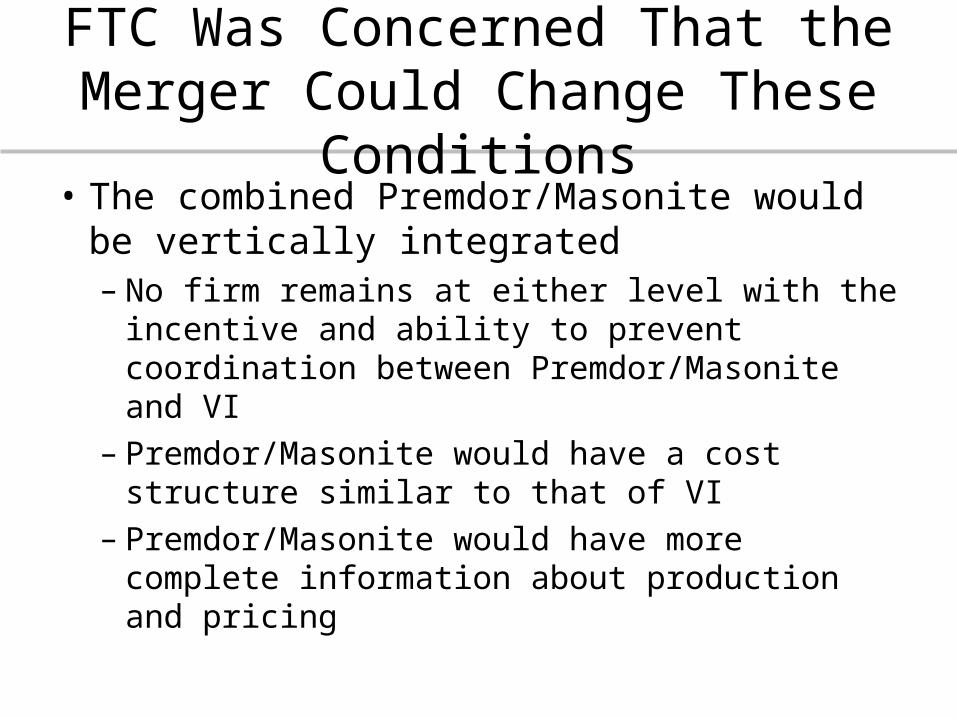
FTC Was Concerned That the Merger Could Change These Conditions
• The combined Premdor/Masonite would be vertically integrated– No firm remains at either level with the incentive
and ability to prevent coordination between Premdor/Masonite and VI
– Premdor/Masonite would have a cost structure similar to that of VI
– Premdor/Masonite would have more complete information about production and pricing
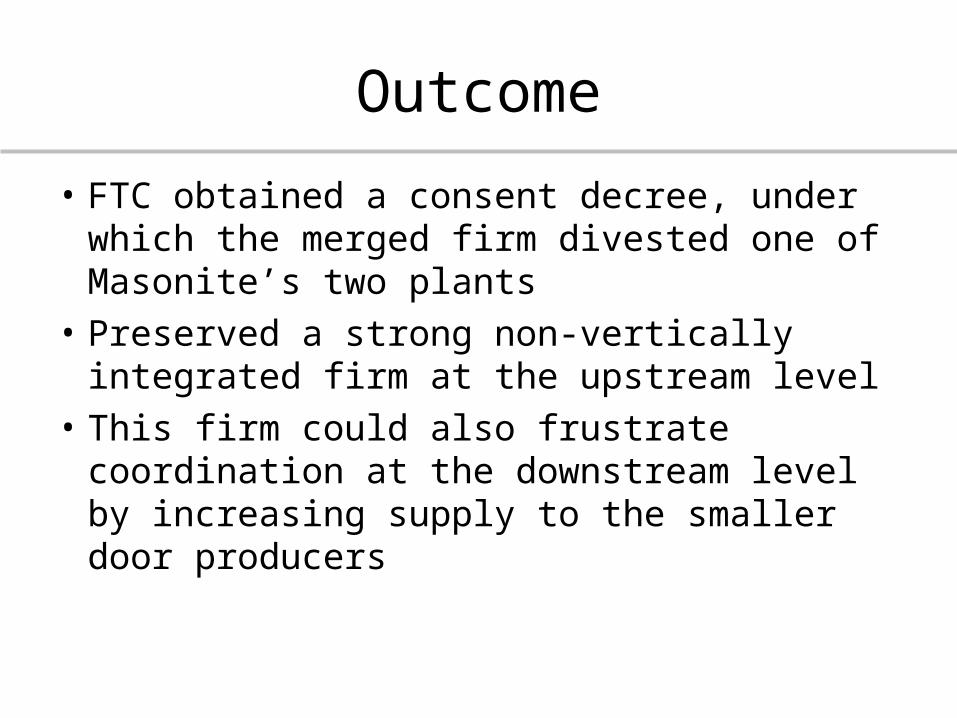
Outcome
• FTC obtained a consent decree, under which the merged firm divested one of Masonite’s two plants
• Preserved a strong non-vertically integrated firm at the upstream level
• This firm could also frustrate coordination at the downstream level by increasing supply to the smaller door producers
![Cyprus Interaction Lab - Inside This Issue: Greetings …...Research Centre in Interactive media, Smart systems and Emerging technologies [ RISE ] 2015-2016; Coordinated by the Municipality](https://static.documents.pub/doc/80x56/5fa2cb1073dafd584d564e70/cyprus-interaction-lab-inside-this-issue-greetings-research-centre-in-interactive.jpg)


![Coordinated 3D Interaction in Tablet- and HMD-Based Hybrid ...gogo/papers/Wang_sui2014.pdfphysical interfaces are inspired by Hybrid User Interface (HUI) systems [13]. A common example](https://static.documents.pub/doc/80x56/6001b725a0863c3b0c1beb1a/coordinated-3d-interaction-in-tablet-and-hmd-based-hybrid-gogopaperswang.jpg)