The First State of the Carbon Cycle Report (SOCCR) The North American Carbon Budget and Implications for the Global Carbon Cycle CHAPTER 3 29 The North American Carbon Budget Past and Present Coordinating Lead Author: Stephen Pacala, Princeton Univ. Lead Authors: Richard A. Birdsey, USDA Forest Service; Scott D. Bridgham, Univ. Oreg.; RichardT. Conant, Colo. State Univ.; Kenneth Davis,The Pa. State Univ.; Burke Hales, Oreg. State Univ.; Richard A. Houghton,Woods Hole Research Center; Jennifer C. Jenkins, Univ. Vt.; Mark Johnston, Saskatchewan Research Council; Gregg Marland, ORNL and Mid Sweden Univ. (Östersund); Keith Paustian, Colo. State Univ. Contributing Authors: John Caspersen, Univ.Toronto; Robert Socolow, Princeton Univ.; Richard S. J.Tol, Hamburg Univ. KEY FINDINGS Fossil-fuel carbon emissions in the United States, Canada, and Mexico totaled 1856 million tons per year in 2003 (plus or minus 10%). This represents 27% of global fossil-fuel emissions. Approximately 30% of North American fossil-fuel emissions are offset by a natural sink estimated at 505 million tons of carbon per year (plus or minus 50%) for the period including 2003 caused by a variety of factors, including forest regrowth, wildfire suppression, and agricultural soil conservation. In 2003, North America emitted a net of 1351 million tons of carbon per year (plus or minus 25%) to the atmosphere. North American carbon dioxide emissions from fossil fuel have increased at an average rate of approximately 1% per year for the last 30 years. Growth in emissions accompanies the historical growth in the industrial economy and Gross Domestic Product (GDP) of North America. However, at least in the United States and Canada, the rate of emissions growth is less than the growth in GDP, reflecting a decrease in the carbon intensity of these economies. Fossil-fuel emissions from North America are expected to continue to grow, but more slowly than GDP. Historically, the plants and soils of the United States and Canada were sources for atmospheric carbon dioxide, primarily as a consequence of the expansion of croplands into forests and grasslands. In recent decades these regions have shifted from source to sink as forests recover from agricultural abandonment, fire suppression is practiced, and logging is reduced, and as a result, these regions are now accumulating carbon. In Mexico, emissions of carbon continue to increase due to net deforestation. The future of the North American carbon sink is highly uncertain. The contribution of recovering forests to this sink is likely to decline as these forests mature, but we do not know how much of the sink is due to fertilization of the ecosystems by nitrogen in air pollution and by increasing carbon dioxide concentrations in the atmosphere, nor do we understand the impact of ozone in the lower atmosphere or how the sink will change as the climate changes. Increases in decomposition and wildfire caused by climate change could, in principle, convert the sink into a source. The current magnitude of the North American sink offers the possibility that significant mitigation of fossil- fuel emissions could be accomplished by managing forests, rangelands, and croplands to increase the carbon stored in them. However, the range of uncertainty in these estimates is at least as large as the estimated values themselves. Current trends towards lower carbon intensity of United States’ and Canadian economies increase the likelihood that a portfolio of carbon management technologies will be able to reduce the 1% annual growth in fossil-fuel emissions. This same portfolio might be insufficient if carbon emissions were to begin rising at the approximately 3% growth rate of GDP. • • • • • • • • • •
Transcript
The First State of the Carbon Cycle Report (SOCCR) The North American Carbon Budget and Implications for the Global Carbon Cycle
CH
APT
ER3
PB 29
TheNorthAmericanCarbonBudgetPastandPresent
Coordinating Lead Author: StephenPacala,PrincetonUniv.Lead Authors: RichardA.Birdsey,USDAForestService;ScottD.Bridgham,Univ.Oreg.;RichardT.Conant,Colo.StateUniv.;KennethDavis,ThePa.StateUniv.;BurkeHales,Oreg.StateUniv.;RichardA.Houghton,WoodsHoleResearchCenter;JenniferC.Jenkins,Univ.Vt.;MarkJohnston,SaskatchewanResearchCouncil;GreggMarland,ORNLandMidSwedenUniv.(Östersund);KeithPaustian,Colo.StateUniv.Contributing Authors: JohnCaspersen,Univ.Toronto;RobertSocolow,PrincetonUniv.;RichardS.J.Tol,HamburgUniv.
Fossil-fuel carbon emissions in the United States, Canada, and Mexico totaled 1856 million metric tons of carbon (Mt C) per year in 2003 and have increased at an average rate of approximately 1% per year for the last 30 years (United States = 1582, Canada = 164, Mexico = 110 Mt C per year, see Figure 3.1)1. This represents 27% of global emissions, from a continent with 7% of the global population and 25% of global GDP (EIA, 2005).
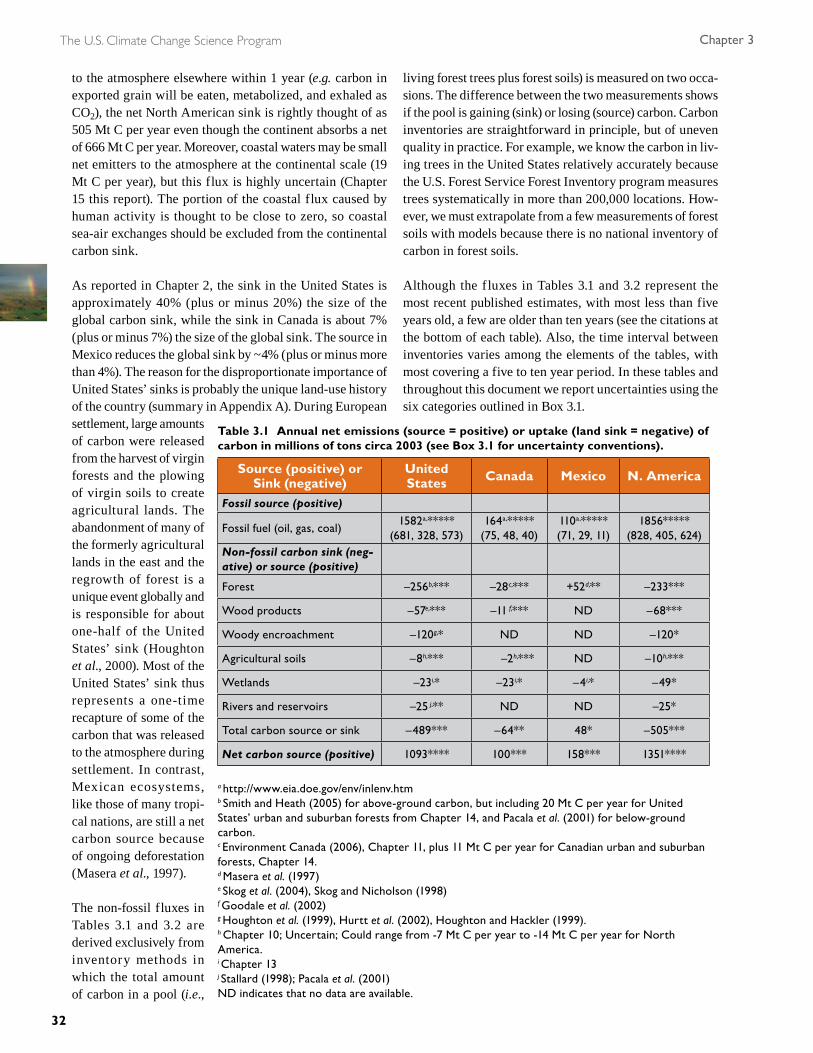
The United States is the world’s largest emitter in absolute terms (EIA, 2005). The United States’ per capita emissions are also among the largest in the world (5.4 t C per year), but the carbon in-tensity of its economy (emissions per unit GDP) at 0.15 metric tons of emitted carbon per dollar of GDP is close to the world’s average of 0.14 t C/$ (EIA, 2005). Total United States’ emissions have grown at close to the North American average rate of about 1.0% per year over the past 30 years, but the United States’ per capita emissions have been roughly constant, while the carbon intensity of the United States’ economy has decreased at a rate of about 2% per year (see Figures 3.1 to 3.4).
Absolute emissions grew at 1% per year even though per capita emissions were roughly constant simply because of population growth at an average rate of 1%. The constancy of United States’ per capita values masks faster than 1% growth in some sectors (e.g., transpor-tation) that was balanced by slower growth in others (e.g., increased manufacturing en-ergy efficiency) (Figures 3.2, 3.3, and 3.4).
Historical decreases in United States’ car-bon intensity began early in the twentieth century and continue despite the approxi-mate stabilization of per capita emissions (Figure 3.2). Why has the United States’ carbon intensity declined? This question is the subject of extensive literature on the so-called structural decomposition of the energy system and on the relationship between GDP and the environment (i.e., Environmental Kuznets Curves; Grossman and Krueger, 1995; Selden and Song, 1994). See, for example, Greening et al. (1997, 1998), Casler and Rose (1998), Golove and Schipper (1998), Rothman (1998), Suri and
1 Uncertainty estimates for the numerical data presented in this chapter can be found in Tables 3.1 through 3.3.
Chapman (1998), Greening et al. (1999), Ang and Zhang (2000), Greening et al. (2001), Davis et al. (2002), Kahn (2003), Greening (2004), Lindmark (2004), Aldy (2005), and Lenzen et al. (2006).
Possible causes of the decline in United States’ carbon inten-sity include: structural changes in the economy, technologi-cal improvements in energy efficiency, behavioral changes by consumers and producers, the growth of renewable and nuclear energy, and the displacement of oil consumption
The First State of the Carbon Cycle Report (SOCCR) The North American Carbon Budget and Implications for the Global Carbon Cycle
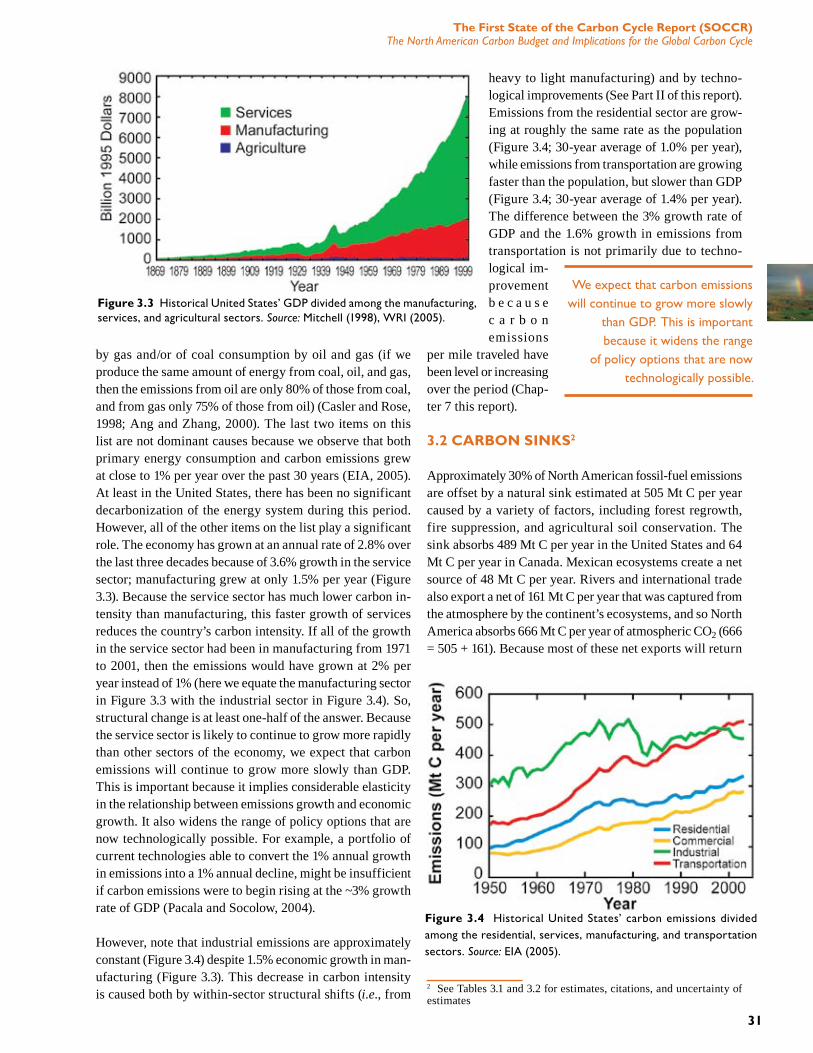
by gas and/or of coal consumption by oil and gas (if we produce the same amount of energy from coal, oil, and gas, then the emissions from oil are only 80% of those from coal, and from gas only 75% of those from oil) (Casler and Rose, 1998; Ang and Zhang, 2000). The last two items on this list are not dominant causes because we observe that both primary energy consumption and carbon emissions grew at close to 1% per year over the past 30 years (EIA, 2005). At least in the United States, there has been no significant decarbonization of the energy system during this period. However, all of the other items on the list play a significant role. The economy has grown at an annual rate of 2.8% over the last three decades because of 3.6% growth in the service sector; manufacturing grew at only 1.5% per year (Figure 3.3). Because the service sector has much lower carbon in-tensity than manufacturing, this faster growth of services reduces the country’s carbon intensity. If all of the growth in the service sector had been in manufacturing from 1971 to 2001, then the emissions would have grown at 2% per year instead of 1% (here we equate the manufacturing sector in Figure 3.3 with the industrial sector in Figure 3.4). So, structural change is at least one-half of the answer. Because the service sector is likely to continue to grow more rapidly than other sectors of the economy, we expect that carbon emissions will continue to grow more slowly than GDP. This is important because it implies considerable elasticity in the relationship between emissions growth and economic growth. It also widens the range of policy options that are now technologically possible. For example, a portfolio of current technologies able to convert the 1% annual growth in emissions into a 1% annual decline, might be insufficient if carbon emissions were to begin rising at the ~3% growth rate of GDP (Pacala and Socolow, 2004).
However, note that industrial emissions are approximately constant (Figure 3.4) despite 1.5% economic growth in man-ufacturing (Figure 3.3). This decrease in carbon intensity is caused both by within-sector structural shifts (i.e., from
heavy to light manufacturing) and by techno-logical improvements (See Part II of this report). Emissions from the residential sector are grow-ing at roughly the same rate as the population (Figure 3.4; 30-year average of 1.0% per year), while emissions from transportation are growing faster than the population, but slower than GDP (Figure 3.4; 30-year average of 1.4% per year). The difference between the 3% growth rate of GDP and the 1.6% growth in emissions from transportation is not primarily due to techno-logical im-provement b e c a u s e c a r b o n emissions
per mile traveled have been level or increasing over the period (Chap-ter 7 this report).
3.2 CARBON SINKS2
Approximately 30% of North American fossil-fuel emissions are offset by a natural sink estimated at 505 Mt C per year caused by a variety of factors, including forest regrowth, fire suppression, and agricultural soil conservation. The sink absorbs 489 Mt C per year in the United States and 64 Mt C per year in Canada. Mexican ecosystems create a net source of 48 Mt C per year. Rivers and international trade also export a net of 161 Mt C per year that was captured from the atmosphere by the continent’s ecosystems, and so North America absorbs 666 Mt C per year of atmospheric CO2 (666 = 505 + 161). Because most of these net exports will return
2 See Tables 3.1 and 3.2 for estimates, citations, and uncertainty of estimates
to the atmosphere elsewhere within 1 year (e.g. carbon in exported grain will be eaten, metabolized, and exhaled as CO2), the net North American sink is rightly thought of as 505 Mt C per year even though the continent absorbs a net of 666 Mt C per year. Moreover, coastal waters may be small net emitters to the atmosphere at the continental scale (19 Mt C per year), but this flux is highly uncertain (Chapter 15 this report). The portion of the coastal flux caused by human activity is thought to be close to zero, so coastal sea-air exchanges should be excluded from the continental carbon sink.
As reported in Chapter 2, the sink in the United States is approximately 40% (plus or minus 20%) the size of the global carbon sink, while the sink in Canada is about 7% (plus or minus 7%) the size of the global sink. The source in Mexico reduces the global sink by ~4% (plus or minus more than 4%). The reason for the disproportionate importance of United States’ sinks is probably the unique land-use history of the country (summary in Appendix A). During European settlement, large amounts of carbon were released from the harvest of virgin forests and the plowing of virgin soils to create agricultural lands. The abandonment of many of the formerly agricultural lands in the east and the regrowth of forest is a unique event globally and is responsible for about one-half of the United States’ sink (Houghton et al., 2000). Most of the United States’ sink thus represents a one-time recapture of some of the carbon that was released to the atmosphere during settlement. In contrast, Mexican ecosystems, like those of many tropi-cal nations, are still a net carbon source because of ongoing deforestation (Masera et al., 1997).
The non-fossil fluxes in Tables 3.1 and 3.2 are derived exclusively from inventory methods in which the total amount of carbon in a pool (i.e.,
living forest trees plus forest soils) is measured on two occa-sions. The difference between the two measurements shows if the pool is gaining (sink) or losing (source) carbon. Carbon inventories are straightforward in principle, but of uneven quality in practice. For example, we know the carbon in liv-ing trees in the United States relatively accurately because the U.S. Forest Service Forest Inventory program measures trees systematically in more than 200,000 locations. How-ever, we must extrapolate from a few measurements of forest soils with models because there is no national inventory of carbon in forest soils.
Although the f luxes in Tables 3.1 and 3.2 represent the most recent published estimates, with most less than five years old, a few are older than ten years (see the citations at the bottom of each table). Also, the time interval between inventories varies among the elements of the tables, with most covering a five to ten year period. In these tables and throughout this document we report uncertainties using the six categories outlined in Box 3.1.
Table 3.1 Annual net emissions (source = positive) or uptake (land sink = negative) of carbon in millions of tons circa 2003 (see Box 3.1 for uncertainty conventions).
Non-fossil carbon sink (neg-ative) or source (positive)
Forest –256b,*** –28c,*** +52d,** –233***
Woodproducts –57e,*** –11 f,*** ND –68***
Woodyencroachment –120g,* ND ND –120*
Agriculturalsoils –8h,*** –2h,*** ND –10h,***
Wetlands –23i,* –23i,* –4i,* –49*
Riversandreservoirs –25 j,** ND ND –25*
Totalcarbonsourceorsink –489*** –64** 48* –505***
Net carbon source (positive) 1093**** 100*** 158*** 1351****
32 3332 33
The First State of the Carbon Cycle Report (SOCCR) The North American Carbon Budget and Implications for the Global Carbon Cycle
In addition to inventory methods, it is also possible to esti-mate carbon sources and sinks by measuring carbon dioxide (CO2) in the atmosphere. For example, if air exits the border of a continent with more CO2 than it contained when it entered, then there must be a net source of CO2 somewhere inside the continent. We do not include estimates obtained in this way because they are still highly uncertain at continental scales. Pacala et al. (2001) found that atmosphere- and in-ventory-based methods gave consistent estimates of United States’ ecosystem sources and sinks but that the range of uncertainty from the former was considerably larger than the range from the latter. For example, by far the largest published estimate for the North American carbon sink was produced by an analysis of atmospheric data by Fan et al. (1998) (-1700 Mt C per year). The appropriate inven-tory-based estimate to compare this to is our -666 Mt C per year of net absorption (atmospheric estimates include net horizontal exports by rivers and trade), and this number is well within the wide uncertainty limits in Fan et al. (1998). The allure of estimates from atmospheric data is that they do not risk missing critical uninventoried carbon pools. But in practice, they are still far less accurate at continental scales than a careful inventory (Pacala et al., 2001). Using today’s technology, it should be possible to complete a comprehensive invento-ry of the sink at national scales with the same accuracy as the United States’ forest inventory currently achieves for above-ground carbon in forests (25%, Smith and Heath, 2005). Moreover, this inventory would provide disaggregated information about the sink’s causes and geo-graphic distribution. In contrast, estimates
from atmospheric methods rely on the accuracy of atmospheric models, and estimates obtained from different models vary by 100% or more at the scale of the United States, Can-ada, or Mexico (Gurney et al., 2004). Nonetheless, extensions of the atmo-spheric sampling network should improve the accura-
cy of atmospheric methods and might allow them to achieve the accuracy of inventories at regional and whole-country scales. In addition, atmospheric methods will continue to provide an independent check on inventories to make sure that no large flux is missed, and atmospheric methods will remain the only viable method to assess interannual varia-tion in the continental flux of carbon.
The current magnitude of the North American sink (docu-mented in Tables 3.1 and 3.2) offers the possibility that significant carbon mitigation could be accomplished by managing forests, rangelands, and croplands to increase the carbon stored in them. However, many of the estimates in Tables 3.1 and 3.2 are highly uncertain; for some, the range of uncertainty is larger than the value reported. The largest contributors to the uncertainty in the United States’ sink are the amount of carbon stored on rangelands because of the encroachment of woody vegetation and the lack of com-prehensive and continuous inventory of Alaskan lands. A carbon inventory of these lands would do more to constrain the size of the United States’ sink than would any other measurement program of similar cost. Also, we still lack
Table 3.2 Annual net horizontal transfers of carbon in millions of tons (see Box 3.1 for uncertainty conventions).
Net horizontal transfer: imports exceed exports = positive; exports
comprehensive United States’ inventories of carbon in soils, woody debris, wetlands, rivers, and reservoirs. Finally, we lack estimates of any kind for five significant components of the carbon budget in Canada and six in Mexico (see Tables 3.1 and 3.2).
The cause and future of the North American carbon sink is also highly uncertain. Although we can document the ac-cumulation of carbon in ecosystems and wood products, we do not know how much of the sink is due to fertilization of the ecosystems by the nitrogen in air pollution and by the added CO2 in the atmosphere. We do not fully understand the impact of tropospheric ozone, nor do we understand precisely how the sink will change as the climate changes. Research is mixed about the importance of nitrogen and CO2 fertilization (Casperson et al., 2000; Oren et al., 2001; Hungate et al., 2003; Luo, 2006; Körner et al., 2005). If these factors are weak, then, all else being equal, we expect the North American sink to decline over time as ecosystems complete their recovery from past exploitation (Hurtt et al., 2002). However, if these factors are strong, then the sink could grow in the future. Similarly, global warming is expected to lengthen the growing season in most parts of North America, which should increase the sink (but see Goetz et al., 2005). But warming is also expected to increase forest fire and the rate of decomposition of dead organic matter, which should decrease the sink and might convert it into a source (Gillett et al., 2004; Flannigan et al., 2005; Schaphoff et al., 2006; Westerling et al., 2006). The relative strength of the various opposing factors is still difficult to predict. Experimental manipulations of climate, atmospheric CO2, tropospheric ozone, and nitrogen, at the largest pos-sible scale, will be required to reduce uncertainty about the future of the carbon sink.
In what follows, we provide additional detail about the ele-ments in Tables 3.1 and 3.2.
3.2.1 ForestsBased on U.S. Forest Service inventories, forest ecosystem carbon stocks in the United States, excluding soil carbon, have increased since 1953. The rate of increase has recently
slowed because of increasing harvest and declining growth in some areas with maturing forests. The current average annual increase in carbon in trees is 146 Mt C per year (Smith and Heath, 2005, uncertainty ****) plus 20 Mt C per year from urban and suburban trees (the midpoint of the range in Chapter 14, uncertainty ***). The total estimate of the carbon sink in forested ecosystems is -256 Mt C per year and includes a sink of 90 Mt C per year (uncertainty **) from the accumulation of nonliving carbon in the soil (-90-146-20 = -256) (Pacala et al., 2001; Goodale et al., 2002). Although the magnitude of the forest soil sink has always been uncertain, it is now possible to measure the total above-and below-ground sink in a few square kilometers by monitoring the atmospheric CO2 that flows into and out of the site over the course of a year. Note that these spatially intensive methods, appropriate for monitoring the sink over a few square kilometers, are unrelated to the spatially exten-sive methods described above, which attempt to constrain the sink at continental scales. As described in Appendix B, these studies are producing data that, so far, confirm the estimates of inventories and show that most of the forest sink is above-ground.
According to Canada’s Greenhouse Gas Inventory (Envi-ronment Canada 2006, Chapter 11 this report), managed forests in Canada (comprising 83% of the total forest area) sequestered an average of 17 Mt C per year in trees and soils between 1990 and 2004 (uncertainty **). In addition, Chapter 14 estimates a sink of 11 (2-20) Mt C per year in urban and suburban trees of Canada (uncertainty ***) that were not included in the Environment Canada (2006) ac-counting. The total estimate for the Canadian forest sink is thus 28 Mt C per year (Table 3.1).
The two published carbon inventories for Mexican forests (Masera et al., 1997 and Cairns et al., 2000) both report substantial losses of forest carbon, primarily because of deforestation in the tropical south. However, both of these studies rely on calculations of carbon loss from remote imagery, rather than direct measurements, and both report results for a period that ended more than 10 years ago. Thus, in addition to being highly uncertain, the estimates for Mexican forests in Table 3.1 are not recent. Chapter 14 estimates a small urban forest sink of 2 (0-3) Mt C per year in Mexico. Whether the small urban forest sink would have been detected in changes in remote imagery and included in the Mexican inventories is uncertain, and accordingly is not included in Table 3.1.
3.2.2 Wood ProductsWood products create a carbon sink because they accumu-late both in use (e.g., furniture, house frames, etc.) and in landfills. The wood products sink is estimated at -57 Mt C per year in the United States (Skog and Nicholson, 1998) and
34 3534 35
The First State of the Carbon Cycle Report (SOCCR) The North American Carbon Budget and Implications for the Global Carbon Cycle
-11 Mt C per year in Canada (Goodale et al., 2002, Chapter 11 this report). We know of no estimates for Mexico.
3.2.3 Woody EncroachmentWoody encroachment is the invasion of woody plants into grasslands or the invasion of trees into shrublands. It is caused by a combination of fire suppression and grazing. Fire inside the United States has been reduced by more than 95% from the pre-settlement level of approximately 80 mil-lion hectares burned per year, and this favors shrubs and trees in competition with grasses (Houghton et al., 2000). Field studies show that woody encroachment both increases the amount of living plant carbon and decreases the amount of dead carbon in the soil (Guo and Gifford, 2002; Jackson et al., 2002). Although the total gains and losses are ultimately of similar magnitude (Jackson et al., 2002), the losses oc-cur within approximately a decade after the woody plants invade (Guo and Gifford, 2002), while the gains occur over a period of up to a century or more. Thus, the net source or sink depends on the distribution of times since woody plants invaded, and this is not known. Estimates for the size of the current United States’ woody encroachment sink (Houghton et al., 1999, Houghton and Hackler, 2000; and Hurtt et al., 2002) all rely on methods that do not account for the initial rapid loss of carbon from soil when grasslands were converted to shrublands or forest. The estimate of -120 Mt C per year in Table 3.1 is from Houghton et al. (1999), but is similar to the estimates from the other two studies (-120 and -130 Mt C per year). No estimates are currently available for Canada or Mexico. Note the error estimate of more than 100% in Table 3.1. A comprehensive set of mea-surements of woody encroachment would reduce the error in the national and continental carbon budgets more than any other inventory.
3.2.4 Agricultural LandsSoils in croplands and grazing lands have been historically depleted of carbon by humans and their animals, especially
if the land was converted from forest to non-forest use. Harvest or consumption by animals re-duces the input of organic mat-ter to the soil, while tillage and manure inputs increase the rate of decomposition. Changes in cropland management, such as the adoption of no-till agriculture (Chapter 10 this report), have reversed the losses of carbon on some croplands, but the losses continue on the remaining lands. The net is a small sink of -2 Mt C per year for agricultural soils in Canada and, for the United
States, is a sink of between -5 and -12 Mt C per year.
3.2.5 WetlandsPeatlands are wetlands that have accumulated deep soil carbon depos-its because plant pro-ductivity has exceeded decomposition over thousands of years. Thus, wetlands form the largest carbon pool of any North American ecosystem (Table 3.3). If drained for development, this soil carbon pool is rapidly lost. Canada’s extensive frozen and unfrozen wetlands create a net sink of -23 Mt C per year, with from -6 to -11 Mt C per year of that sink in areas underlain by permafrost (Chapters 12 and 13, this report). Drainage of peatlands in the conterminous United States has created a source of 6 Mt C per year, but other wetlands, including those in Alaska, are a sink of -29 Mt C per year for a net United States wetland sink of -23 Mt C per year (Chapter 13, this report). The very large pool of peat in northern wetlands is vulnerable to climate change and could add more than 100 ppm to the atmosphere (1 ppm ≈ 2.1 billion tons of carbon [Gt C]) during this century, if released, because of global warming (see the model result in Cox et al., 2000 for an example).
T h e c a r b o n s i n k d u e t o sedimentation in wetlands is est imated to be 4 Mt C per year in Canada and 22 Mt C per year in the United States,
Table 3.3 Carbon stocks in North America in billions of tons, (see Box 3.1 for uncertainty conventions).
a Goodaleet al. (2002)b Chapter10c Chapter13d Maseraet al. (1997)
but this estimate is highly uncertain (Chapter 13 this report). Another important priority for research is to better constrain carbon sequestration due to sedimentation in wetlands, lakes, reservoirs, and rivers.
The focus on this chapter is on CO2; we do not include es-timates for other greenhouse gases. However, wetlands are naturally an important source of methane (CH4). Methane emissions effectively cancel out the positive benefits of any carbon storage, such as peat in Canada, and make United States’ wetlands a source of warming on a decadal time scale (Chapter 13 this report). Moreover, if wetlands become warmer and remain wet with future climate change, they have the potential to emit large amounts of CH4. This is prob-ably the single most important consideration, and unknown, in the role of wetlands and future climate change.
3.2.6 Rivers and ReservoirsOrganic sediments accumulate in artificial lakes and in alluvium (deposited by streams and rivers) and colluvium (deposited by wind or gravity) and represent a carbon sink. Pacala et al. (2001) extended an analysis of reservoir sedimentation (Stallard, 1998) to an inventory of the 68,000 reservoirs in the United States and also estimated net carbon burial in alluvium and colluvium. Table 3.1 includes the mid-point of their estimated range of 10 to 40 Mt C per year in the coterminous United States. This analysis has also recently been repeated and produced an estimate of 17 Mt C per year (E. Sundquist, personal communication; unreferenced). We know of no similar analysis for Canada or Mexico.
3.2.7 Exports Minus Imports of Wood and Agricultural Products
The United States imports more wood products (14 Mt C per year) than it exports and exports more agricul-tural products (35 Mt C per year) than it imports (Pacala et al., 2001). The
large imbalance in agricultural products is primarily because of exported grains and oil seeds. Canada and Mexico are net wood exporters, with Canada at -74 Mt C per year (Environ-ment Canada, 2005) and Mexico at -1 Mt C per year (Masera et al., 1997). The North American export of 61 Mt C per year accounts correctly for the large net transfer of lumber and wood products from Canada to the United States. We know of no analysis of the Canadian or Mexican export-import balance for agricultural products.
3.2.8 River ExportRivers in the coterminous United States were estimated to export 30-40 Mt C per year to the oceans in the form of dissolved and particulate organic carbon and inorganic carbon derived from the atmosphere (Pacala et al., 2001). An additional 12-20 Mt C per year of inorganic carbon is also exported by rivers but is derived from carbonate min-erals. We know of no corresponding estimates for Alaska, Canada, or Mexico.
3.2.9 Coastal WatersChapter 15 summarizes the complexity and large uncer-tainty of the sea-air flux of CO2 in North American coastal waters. It is important to understand that the source in Mexican coastal waters is not caused by humans and would have been present in pre-industrial times. It is simply the result of the purely physical upwelling of carbon-rich deep waters and is a natural part of the oceanic carbon cycle. It is not yet known how much of the absorption of carbon by United States’ and Canadian coastal waters is natural and how much is caused by nutrient additions to the coastal zone by humans. Accordingly, it is essentially impossible to cur-rently assess the potential or costs of carbon management in coastal waters of North America.
3.3 SUMMARY
Fossil-fuel emissions currently dominate the net carbon bal-ance in the United States, Canada, and Mexico (Figure 3.1, Tables 3.1 and 3.2). In 2003, fossil-fuel consumption in the United States emitted 1582 Mt C per year to the atmosphere (confidence ****, see definition of confidence categories in Table 3.1 footnote). This source was partially balanced by a flow of 489 Mt C per year from the atmosphere to land caused by net ecosystem sinks in the United States (***). Canadian fossil-fuel consumption transfered 164 Mt C per year to the atmosphere in 2003 (****), but net ecological sinks capture 64 Mt C per year (**). Mexican fossil-fuel emissions of 110 Mt C per year (****) were supplemented by a net ecosystem source of 48 Mt C per year (*) from tropical deforestation. Each of the three countries has always been a net source of CO2 emissions to the atmosphere for the past three centuries (Houghton et al., 1999, 2000; Houghton and Hackler, 2000; Hurtt et al., 2002).
The First State of the Carbon Cycle Report (SOCCR) The North American Carbon Budget and Implications for the Global Carbon Cycle
APP
END
IX A
167
Although the lands of the New World were inhabited before the arrival of Europeans, the changes since ar-rival have been enormous, especially during the last two centuries. Peak United States emissions from land-use change occurred late in the nineteenth century, and the last few decades have experienced a carbon sink (Houghton et al., 1999; Hurtt et al., 2002). In Canada, peak emissions occurred nearly a century later than in the United States, and current data show that land-use change causes a net carbon sink (Environ-ment Canada, 2005). In Mexico, the emis-sions of carbon continue to increase from net deforestation. All three countries may be in different stages of the same develop-ment pattern (Figure 3.2)
The largest changes in land use and the largest emissions of carbon came from the expansion of croplands. In addition to the carbon lost from trees, soils lose 25-30% of their initial carbon content (to a depth of 1 m) when cultivated. In the United States, croplands increased from about 0.25 million hectares (ha) in 1700 to 236 million ha in 1990 (Houghton et al., 1999; Houghton and Hackler, 2000). The most rapid expansion (and the largest emissions) occurred between 1800 and 1900, and since 1920, there has been little net change in cropland area. Pastures ex-panded nearly as much, from 0.01 million to 231 million ha, most of the increase
Historical Overview of the Development of United States, Canadian, and Mexican Ecosystem Sources and Sinks for Atmospheric Carbon
Coordinating Lead Author: Stephen Pacala, Princeton Univ.
Lead Authors: Richard A Birdsey, USDA Forest Service; Scott D. Bridgham, Univ. Oreg.; Richard T. Conant, Colo. State Univ.; Kenneth Davis, The Pa. State Univ.; Burke Hales, Oreg. State Univ.; Richard A. Houghton, Woods Hole Research Center; Jennifer C. Jenkins, Univ. Vt.; Mark Johnston, Saskatchewan Research Council; Gregg Marland, ORNL and Mid Sweden Univ. (Östersund); Keith Paustian, Colo. State Univ.;
Contributing Authors: John Casperson, Univ. Toronto; Robert Socolow, Princeton Univ.; Richard S. J. Tol, Hamburg Univ.
taking place between 1850 and 1950. As most pastures were derived from grasslands, the associated changes in carbon stocks were modest.
The total area of forests and woodlands in the United States declined as a result of agricultural expansion by
The U.S. Climate Change Science Program Appendix A
168
160 million ha (38%), but this net change obscures the dy-namics of forest loss and recovery, especially in the eastern part of the United States. After 1920, forest areas increased by 14 million ha nationwide as farmlands continued to be abandoned in the northeast, southeast, and north central re-gions. Nevertheless, another 4 million ha of forest were lost in other regions, and the net recovery of 10 million ha offset only 6% of the net loss (Houghton and Hackler, 2000).
Between 1938 and 2002, the total area of forestland in the conterminous United States decreased slightly, by 3 million ha (Smith et al., 2004). This small change is the net result of much larger shifts among land-use classes (Birdsey and Lewis, 2003). Gains of forestland, primarily from cropland and pasture, were about 50 million ha for this period. Losses of forestland to cropland, pasture, and developed use were about 53 million ha for the same period. Gains of forestland were primarily in the Eastern United States, whereas losses to cropland and pasture were predominantly in the South, and losses to developed use were spread around all regions of the United States.
In the United States, harvest of industrial wood (timber) gen-erally followed the periods of major agricultural clearing in each region. In the last few decades, total volume harvested increased until a recent leveling took place (Smith et al., 2004). The volume harvested in the Pacific Coast and Rocky Mountain regions has declined sharply, whereas harvest in the South increased and in the North, stayed level. Fuel wood harvest peaked between 1860 and 1880, after which fossil fuels became the dominant type of fuel (Houghton and Hackler, 2000).
The arrival of Europeans reduced the area annually burned, but a federal program of fire protection was not established until early in the twentieth century. Fire exclusion had begun earlier in California and in parts of the central, mountain, and Pacific regions. However, neither the extent nor the tim-ing of early fire exclusion is well known. After about 1920, the Cooperative Fire Protection Program gradually reduced the areas annually burned by wildfires (Houghton et al., 1999, 2000). The reduction in wildfires led to an increase in carbon storage in forests. How long this “recovery” will last is unclear. There is some evidence that fires are becom-ing more widespread again, especially in Canada and the western United States. Fire exclusion and suppression are also thought to have led to woody encroachment, especially in the southwestern and western United States. The extent and rate of this process is poorly documented, however, and estimates of a carbon sink are very uncertain. Gains in carbon above-ground may be offset by losses below-ground in some systems, and the spread of exotic annual grasses into semiarid deserts and shrublands may be converting the recent sink to a source (Bradley et al., in preparation).
The consequence of this land-use history is that United States’ forests, at present, are recovering from agricultural abandonment, fire suppression, and reduced logging (in some regions), and as a result, are accumulating carbon (Birdsey and Heath, 1995; Houghton et al., 1999; Caspersen et al., 2000; Pacala et al., 2001). The magnitude of the sink is uncertain, and whether any of it has been enhanced by environmental change (CO2 fertilization, nitrogen deposi-tion, and changes in climate) is unclear. Understanding the mechanisms responsible for the current sink is important for predicting its future behavior (Hurtt et al., 2002).
In the mid-1980s, Mexico lost approximately 668,000 ha of closed forests annually, about 75% of them tropical forests (Masera et al., 1997). Most deforestation was for pastures. Another 136,000 ha of forest suffered major perturbations, and the net flux of carbon from deforestation, logging, fires, degradation, and the establishment of plantations was 52.3 million tons of carbon per year, about 40% of the country’s estimated annual emissions of carbon. A later study found the deforestation rate for tropical Mexico to be about 12% higher (1.9% per year) (Cairns et al., 2000).
The First State of the Carbon Cycle Report (SOCCR) The North American Carbon Budget and Implications for the Global Carbon Cycle
APP
END
IX B
169
Eddy-Covariance Measurements Now Confirm Estimates of Carbon Sinks from Forest Inventories
Coordinating Lead Author: Stephen Pacala, Princeton Univ.
Lead Authors: Richard A Birdsey, USDA Forest Service; Scott D. Bridgham, Univ. Oreg.; Richard T. Conant, Colo. State Univ.; Kenneth Davis, The Pa. State Univ.; Burke Hales, Oreg. State Univ.; Richard A. Houghton, Woods Hole Research Center; Jennifer C. Jenkins, Univ. Vt.; Mark Johnston, Saskatchewan Research Council; Gregg Marland, ORNL and Mid Sweden Univ. (Östersund); Keith Paustian, Colo. State Univ.;
Contributing Authors: John Casperson, Univ. Toronto; Robert Socolow, Princeton Univ.; Richard S. J. Tol, Hamburg Univ.
Long-term, tower-based, eddy-covariance measure-ments (e.g., Wofsy et al., 1993) represent an independent approach to measuring ecosystem-atmosphere carbon dioxide (CO2) exchange. The method describes fluxes over areas of approximately 1 km2 (Horst and Weil, 1994), measures hour-by-hour ecosys-tem carbon fluxes, and can be integrated over time scales of years. A network of more than 200 sites now exists globally (Baldocchi et al., 2001); more than 50 of these are in North America. None of these sites ex-isted in 1990, so these represent a relatively new source of informa-tion about the terrestrial carbon cycle. An increasing number of these measurement sites include concurrent carbon inventory measurements.
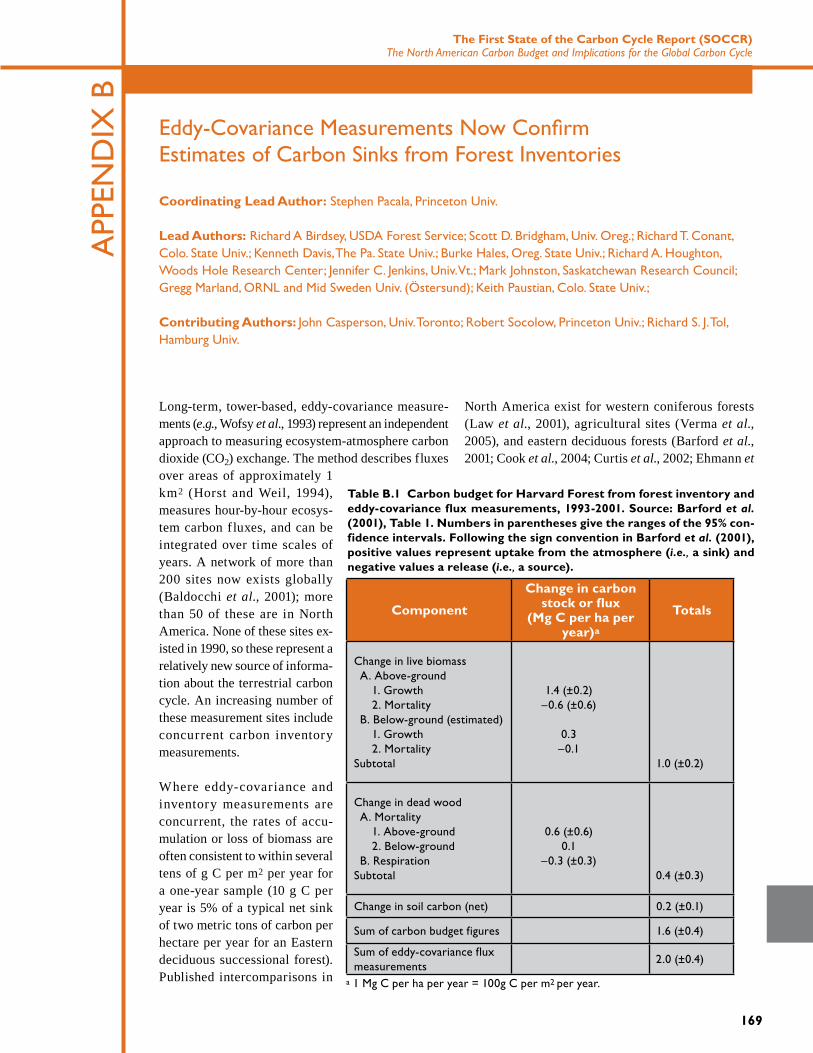
Where eddy-covariance and inventory measurements are concurrent, the rates of accu-mulation or loss of biomass are often consistent to within several tens of g C per m2 per year for a one-year sample (10 g C per year is 5% of a typical net sink of two metric tons of carbon per hectare per year for an Eastern deciduous successional forest). Published intercomparisons in
North America exist for western coniferous forests (Law et al., 2001), agricultural sites (Verma et al., 2005), and eastern deciduous forests (Barford et al., 2001; Cook et al., 2004; Curtis et al., 2002; Ehmann et
Component
Change in carbon stock or flux
(Mg C per ha per year)a
Totals
Change in live biomassA. Above-ground
1. Growth2. Mortality
B. Below-ground (estimated)1. Growth2. Mortality
Subtotal
1.4 (±0.2)–0.6 (±0.6)
0.3–0.1
1.0 (±0.2)
Change in dead woodA. Mortality
1. Above-ground2. Below-ground
B. RespirationSubtotal
0.6 (±0.6)0.1
–0.3 (±0.3)0.4 (±0.3)
Change in soil carbon (net) 0.2 (±0.1)
Sum of carbon budget figures 1.6 (±0.4)
Sum of eddy-covariance flux measurements
2.0 (±0.4)
Table B.1 Carbon budget for Harvard Forest from forest inventory and eddy-covariance flux measurements, 1993-2001. Source: Barford et al. (2001), Table 1. Numbers in parentheses give the ranges of the 95% con-fidence intervals. Following the sign convention in Barford et al. (2001), positive values represent uptake from the atmosphere (i.e., a sink) and negative values a release (i.e., a source).
a 1 Mg C per ha per year = 100g C per m2 per year.
The U.S. Climate Change Science Program Appendix B
170
al., 2002; Gough et al., in review). Multiyear studies at two sites (Barford et al., 2001; Gough et al., in review) show that 5- to 10-year averages converge toward inventory measure-ments. Table B.1 from Barford et al. (2001) shows the results of nearly a decade of concurrent measurements in an eastern deciduous forest.
This concurrence between eddy-covariance flux measure-ments and ecosystem carbon inventories is relevant because it provides independent validation of the inventory measure-ments used to estimate long-term trends in carbon stocks. The eddy-covariance data are also valuable because the assembly of global eddy-covariance data provides indepen-dent support for net storage of carbon by many terrestrial ecosystems and the substantial year-to-year variability in this net sink. The existence of the eddy-covariance data also makes the sites suitable for co-locating mechanistic studies of interannual and shorter, time-scale processes governing the terrestrial carbon cycle. Chronosequences show trends consistent with inventory assessments of forest growth, and comparisons across space and plant functional types are beginning to show broad consistency. These results show a consistency across a mixture of observational methods with complementary characteristics, which should facilitate the development of an increasingly complete understanding of continental carbon dynamics (Canadell et al., 2000).