29
Copernicus Climate Change Service Climate Change Anca Brookshaw, ECMWF
C o p e r n i c u s C l i m a t e C h a n g e S e r v i c e
Climate Change
Anca Brookshaw, ECMWF
Climate Change
Climate Change
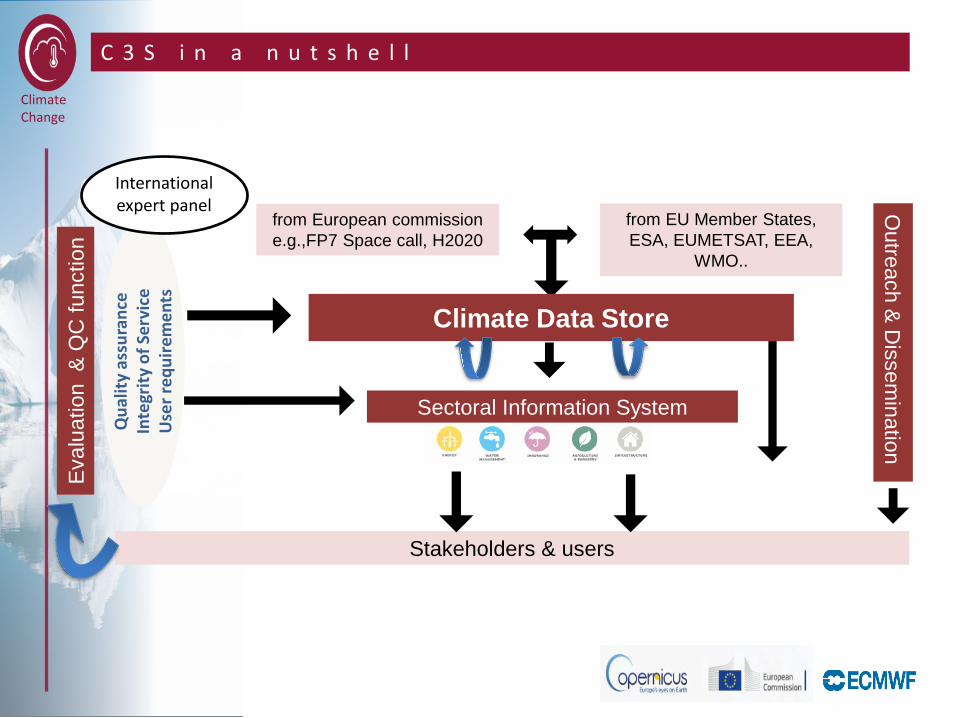
C 3 S i n a n u t s h e l l
Eva
luat
ion
& Q
C fu
nctio
n O
utreach & D
issemination
from European commission e.g.,FP7 Space call, H2020
from EU Member States, ESA, EUMETSAT, EEA,
WMO..
Climate Data Store
Sectoral Information System
Stakeholders & users
Qua
lity
assu
ranc
e In
tegr
ity o
f Ser
vice
U
ser r
equi
rem
ents
International expert panel
Climate Change
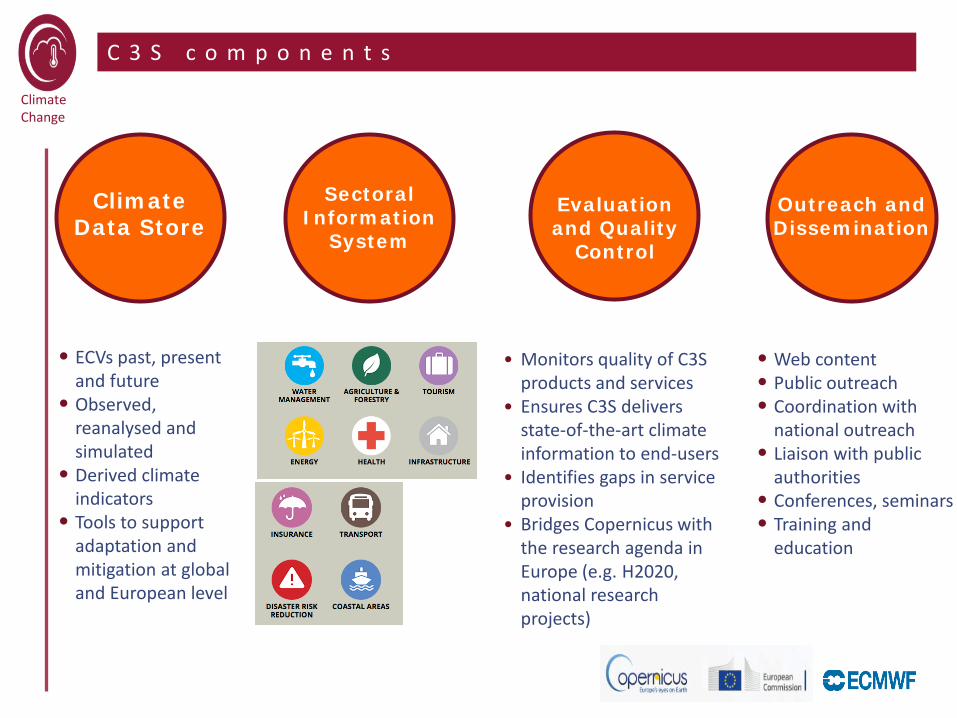
C 3 S c o m p o n e n t s
4
Climate Data Store
Sectoral Information
System Evaluation
and Quality Control
Outreach and Dissemination
• ECVs past, present and future
• Observed, reanalysed and simulated
• Derived climate indicators
• Tools to support adaptation and mitigation at global and European level
• Monitors quality of C3S products and services
• Ensures C3S delivers state-of-the-art climate information to end-users
• Identifies gaps in service provision
• Bridges Copernicus with the research agenda in Europe (e.g. H2020, national research projects)
• Web content • Public outreach • Coordination with
national outreach • Liaison with public
authorities • Conferences, seminars • Training and
education
Climate Change
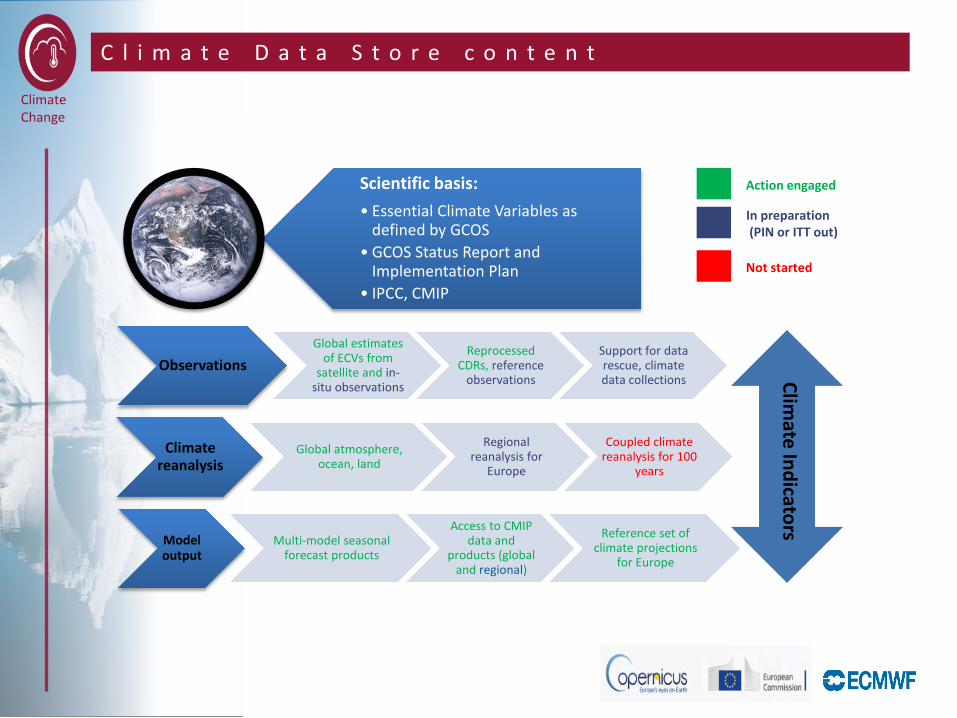
C l i m a t e D a t a S t o r e c o n t e n t
Scientific basis: • Essential Climate Variables as
defined by GCOS • GCOS Status Report and
Implementation Plan • IPCC, CMIP
Observations Global estimates
of ECVs from satellite and in-
situ observations
Reprocessed CDRs, reference
observations
Support for data rescue, climate data collections
Climate reanalysis
Global atmosphere, ocean, land
Regional reanalysis for
Europe
Coupled climate reanalysis for 100
years
Model output
Multi-model seasonal forecast products
Access to CMIP data and
products (global and regional)
Reference set of climate projections
for Europe
Climate Indicators
Action engaged
In preparation (PIN or ITT out)
Not started
Climate Change
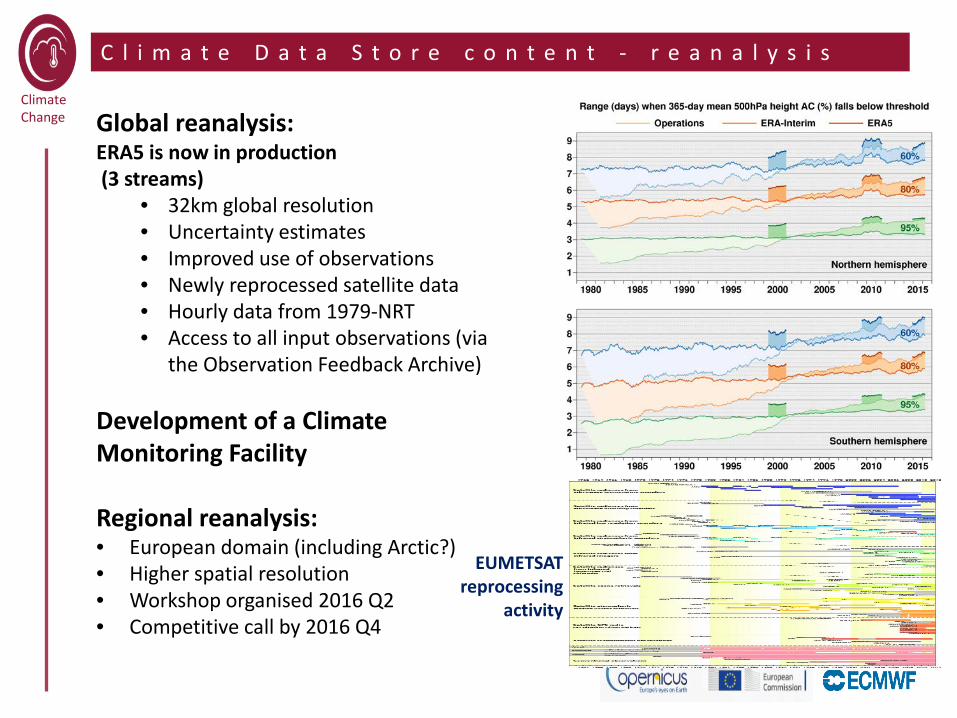
C l i m a t e D a t a S t o r e c o n t e n t - r e a n a l y s i s
Global reanalysis: ERA5 is now in production (3 streams)
• 32km global resolution • Uncertainty estimates • Improved use of observations • Newly reprocessed satellite data • Hourly data from 1979-NRT • Access to all input observations (via
the Observation Feedback Archive)
Development of a Climate Monitoring Facility Regional reanalysis: • European domain (including Arctic?) • Higher spatial resolution • Workshop organised 2016 Q2 • Competitive call by 2016 Q4
EUMETSAT reprocessing
activity
Climate Change
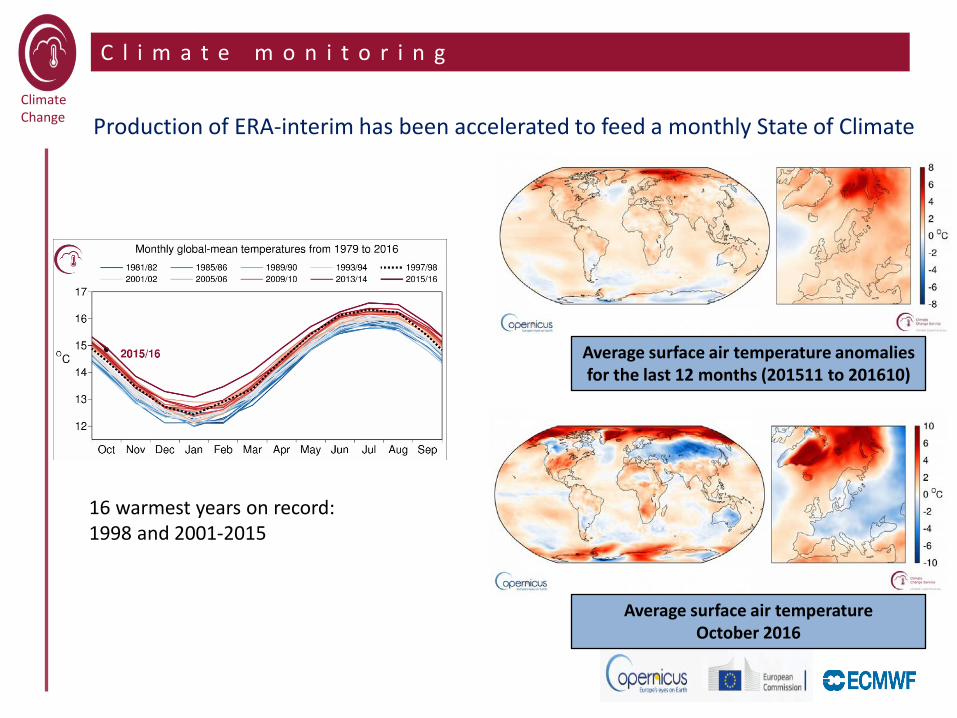
C l i m a t e m o n i t o r i n g
16 warmest years on record: 1998 and 2001-2015
Production of ERA-interim has been accelerated to feed a monthly State of Climate
Average surface air temperature anomalies for the last 12 months (201511 to 201610)
Average surface air temperature October 2016
Climate Change
C 3 S s e a s o n a l f o r e c a s t s
Aim: to generate seasonal forecast products based on the best information available, to an operational schedule, and make them publicly available.
C3S seasonal service will be based on a multi-system framework.
• Five European forecast systems have been selected: – three for immediate use (2016; core providers): ECMWF, Met Office,
Météo France – two for later use, following further development (2017; additional
providers): Centro Euro-Mediterraneo sui Cambiamenti Climatici (CMCC), Deutscher Wetterdienst (DWD)
Interest in collaboration expressed by NCEP and JMA; terms and timings to be discussed.
• Evaluation and quality control (EQC) function
Climate Change
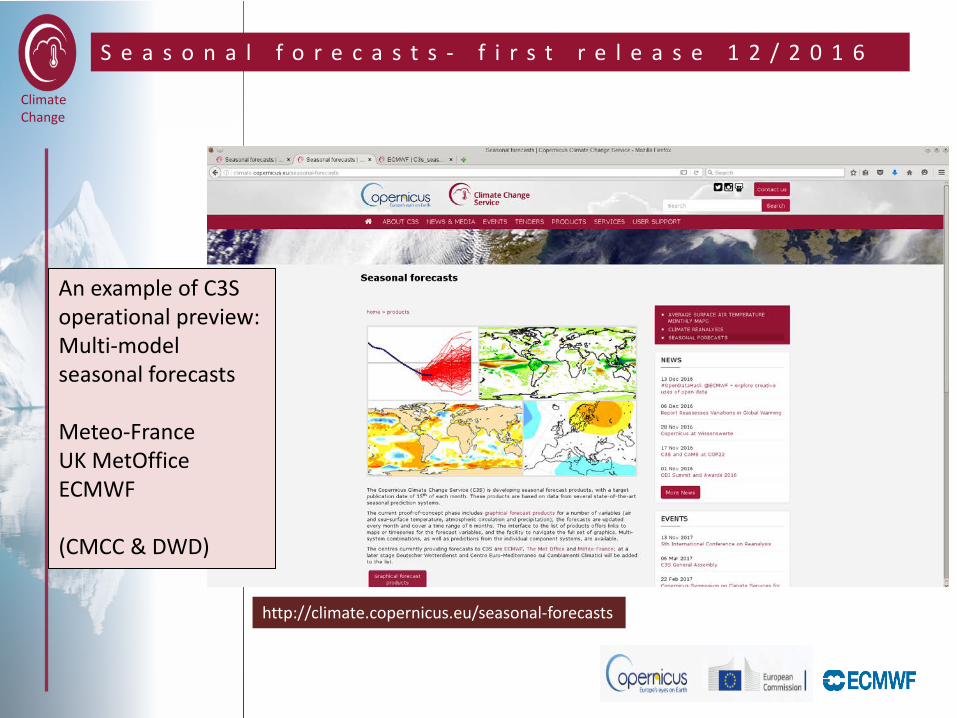
S e a s o n a l f o r e c a s t s - f i r s t r e l e a s e 1 2 / 2 0 1 6
http://climate.copernicus.eu/seasonal-forecasts
An example of C3S operational preview: Multi-model seasonal forecasts Meteo-France UK MetOffice ECMWF (CMCC & DWD)

Climate Change
S e a s o n a l f o r e c a s t s - g r a p h i c a l p r o d u c t s
Variables: • sea-level pressure • geopotential height • precipitation • air temperature
Type of plots: • maps:
• global • pre-defined regions
• time series
Publication schedule: • monthly updates • published on each 15th
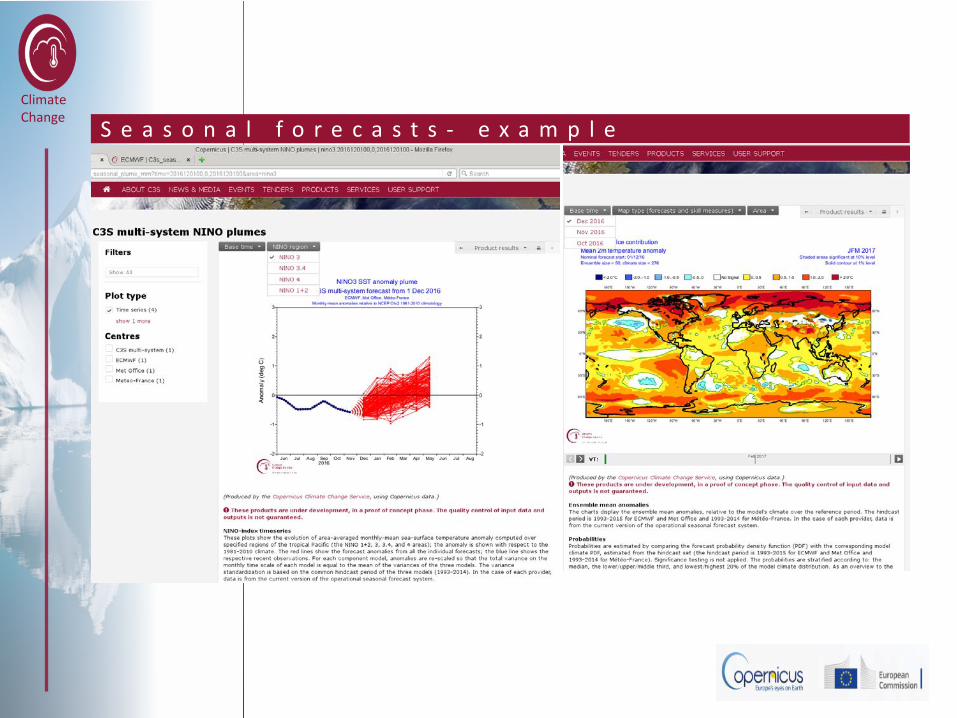
Climate Change S e a s o n a l f o r e c a s t s - e x a m p l e
Climate Change
S e a s o n a l f o r e c a s t – d a t a p r o d u c t s
• Original data: 1 deg gridded data sets for many variables (atmosphere, ocean; high temporal resolution: 6h - 24h)
• Processed data, starting with all data represented in the graphs and requests from SIS projects
• Forecasts from individual systems and multi-system combinations
• Information on (average) skill will accompany forecast products wherever possible.
Preliminary date service expected in Q2 2017.

Climate Change
S e a s o n a l f o r e c a s t s - v a r i a b l e s
From the ocean model: every 24h: Sea-level (without tides) Depth of 28 deg isotherm Depth of 26 deg isotherm Depth of 20 deg isotherm
Mixed layer depth Surface salinity Zonal surface current Meridional surface current
From the atmosphere model: every 6 hours: 2 metre temperature (or nearest equivalent) 2 metre dewpoint temperature 10 metre u wind 10 metre v wind mean sea level pressure total cloud cover skin temperature every 24 hours: sea-ice concentration sea surface temperature volumetric soil moisture level 1 volumetric soil moisture level 2 volumetric soil moisture level 3 volumetric soil moisture level 4 (or total soil moisture) surface temperature snow depth (water equivalent) snow density Tmax and Tmin at 2 metres Max 10m wind gust
every 24 hours, accumulated: large scale precipitation convective precipitation (or total precipitation) snow fall surface sensible heat flux surface latent heat flux surface solar radiation downwards surface thermal radiation downwards surface solar radiation surface thermal radiation top solar radiation top thermal radiation east-west surface stress north-south surface stress evaporation every 12 hours: geopotential temperature specific humidity vorticity/divergence or u/v wind components at 925, 850, 700, 500, 400, 300, 200, 100, 50, 30, 10 hPa
Climate Change
T e c h n i c a l d e s c r i p t i o n
Proof of concept phase (core providers only) – spatial resolution of data: 1 deg or original grid – temporal resolution of data: daily or sub-daily – forecasts and reforecasts (1993-2015) – data delivery by 12Z on 10th day of month (product release on 15th
day of month)
Pre-operational (all providers) – spatial resolution of data: 1 deg or original grid – temporal resolution of data: daily or sub-daily – ocean data: on a grid to be agreed – forecasts and reforecasts (1993-2015) – data delivery by 12Z on 6th day of month (product release on 10th
day of month)
Climate Change
S e a s o n a l f o r e c a s t s - e v a l u a t i o n
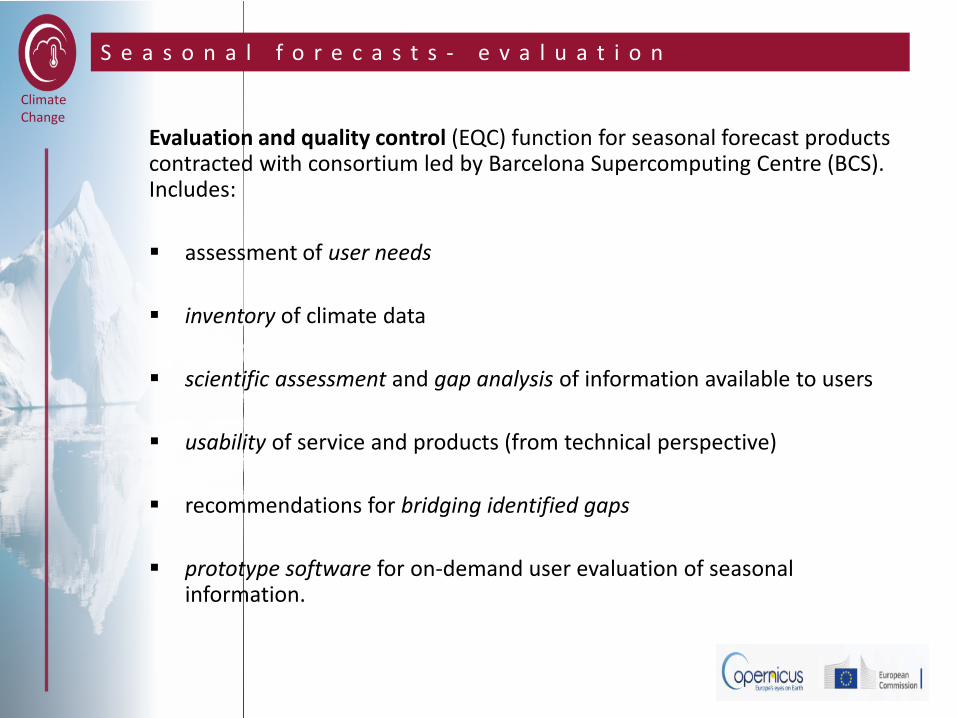
Evaluation and quality control (EQC) function for seasonal forecast products contracted with consortium led by Barcelona Supercomputing Centre (BCS). Includes:
assessment of user needs
inventory of climate data
scientific assessment and gap analysis of information available to users
usability of service and products (from technical perspective)
recommendations for bridging identified gaps
prototype software for on-demand user evaluation of seasonal
information.
Climate Change
C l i m a t e p r o j e c t i o n s
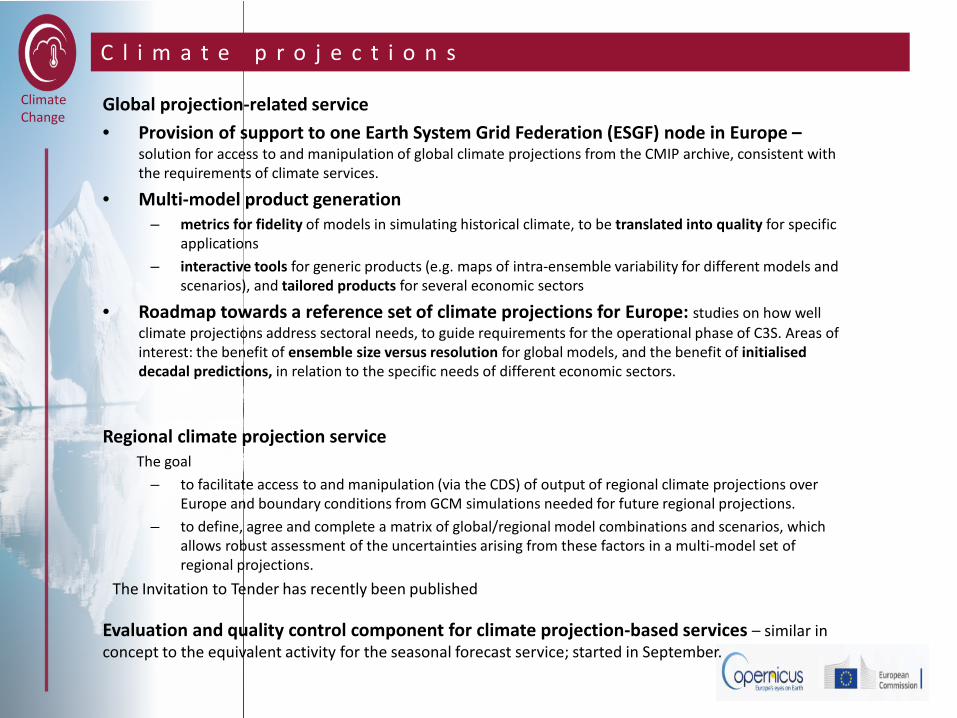
Global projection-related service • Provision of support to one Earth System Grid Federation (ESGF) node in Europe –
solution for access to and manipulation of global climate projections from the CMIP archive, consistent with the requirements of climate services.
• Multi-model product generation – metrics for fidelity of models in simulating historical climate, to be translated into quality for specific
applications – interactive tools for generic products (e.g. maps of intra-ensemble variability for different models and
scenarios), and tailored products for several economic sectors
• Roadmap towards a reference set of climate projections for Europe: studies on how well climate projections address sectoral needs, to guide requirements for the operational phase of C3S. Areas of interest: the benefit of ensemble size versus resolution for global models, and the benefit of initialised decadal predictions, in relation to the specific needs of different economic sectors.
Regional climate projection service The goal
– to facilitate access to and manipulation (via the CDS) of output of regional climate projections over Europe and boundary conditions from GCM simulations needed for future regional projections.
– to define, agree and complete a matrix of global/regional model combinations and scenarios, which allows robust assessment of the uncertainties arising from these factors in a multi-model set of regional projections.
The Invitation to Tender has recently been published
Evaluation and quality control component for climate projection-based services – similar in concept to the equivalent activity for the seasonal forecast service; started in September.
Climate Change
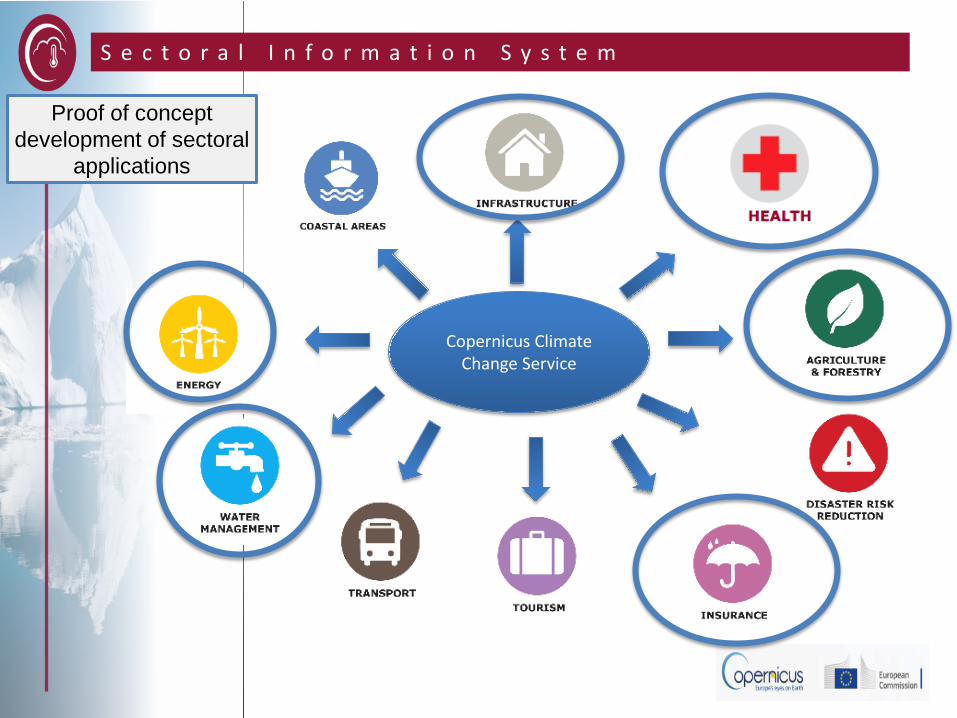
S e c t o r a l I n f o r m a t i o n S y s t e m
18
Proof of concept development of sectoral
applications
Copernicus Climate Change Service

Climate Change
S e c t o r a l I n f o r m a t i o n S y s t e m
19
Seven proof of concept SIS contracts have been awarded: • SIS water management:
• SWICCA (Service for Water Indicators in Climate Change adaptation) – lead SMHI (Sweden)
• EDgE (End-to-End demonstrator for improved decision making in the water sector in Europe) – Lead CEH (UK)
• SIS energy:
• CLIM4ENERGY (Climate for Energy) – Lead CEA (France)
• ECEM (European Climatic Energy Mixes) – Lead UEA (UK)
• SIS others:
• AgriCLASS (Agriculture Climate Advisory Services) – Lead Telespazio – Vega (UK)
• WISC (Windstorm Information Service) – Lead CGI (UK)
• URBAN-SIS (touching health, infrastructure,..) – Lead SMHI (Sweden)
• No noticeable delays in the deliverables (…so far).
• Quality of the output generally high.
Climate Change
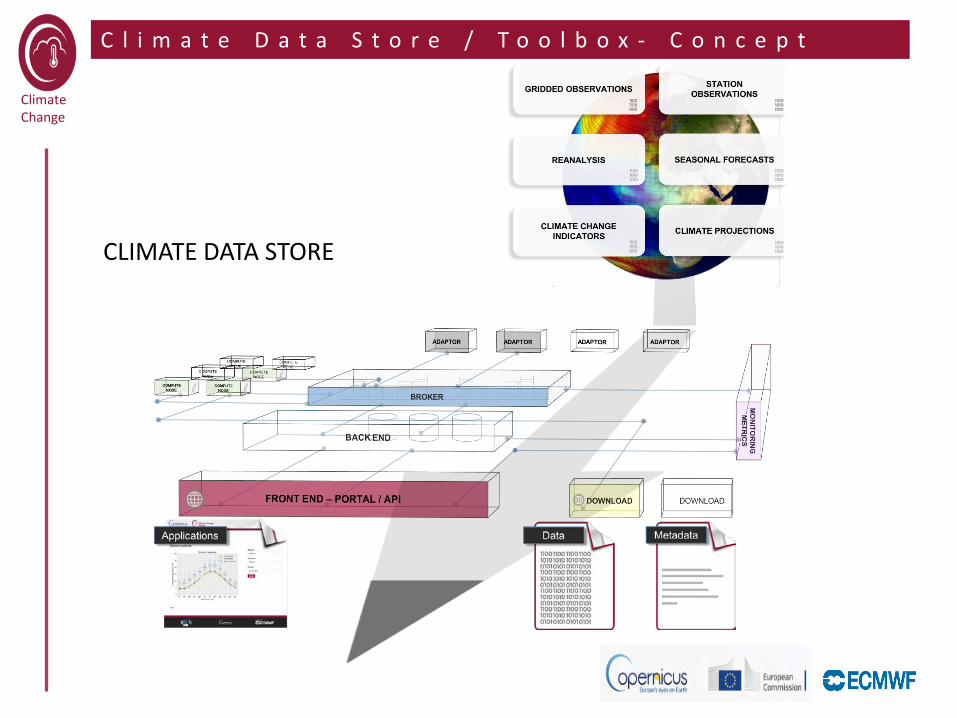
CLIMATE DATA STORE
C l i m a t e D a t a S t o r e / T o o l b o x - C o n c e p t
Climate Change
C l i m a t e D a t a S t o r e / T o o l b o x - C o n c e p t
Cloud Hosting
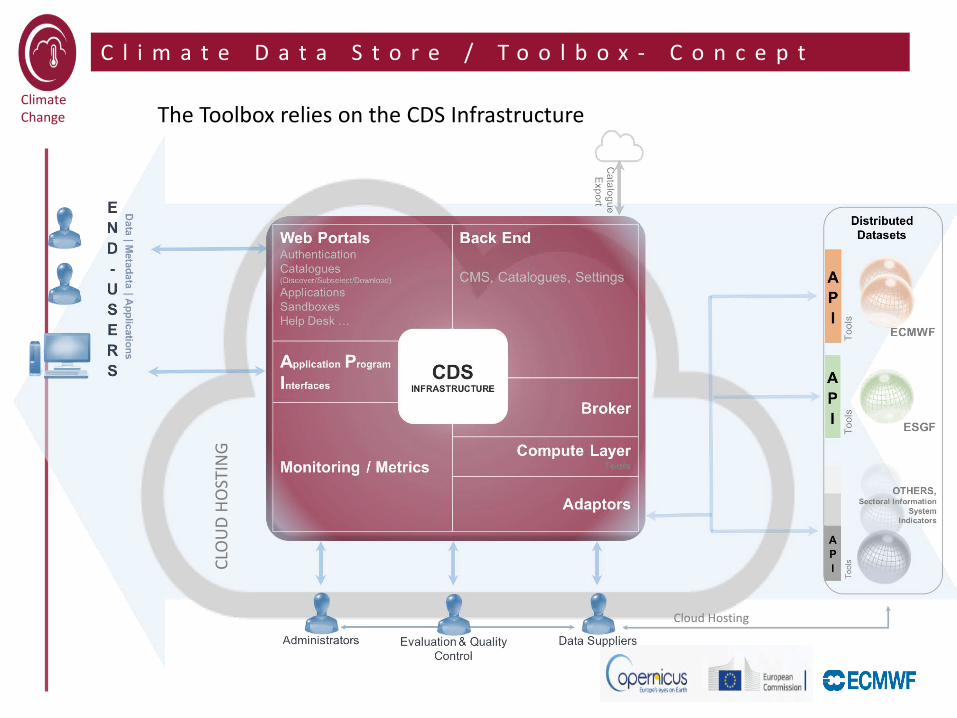
The Toolbox relies on the CDS Infrastructure
CLO
UD
HOST
ING
Climate Change • Climate Data Store / Toolbox
• Concept
C l i m a t e D a t a S t o r e / T o o l b o x - C o n c e p t
Climate Change
C l i m a t e D a t a S t o r e / T o o l b o x - C h a l l e n g e s
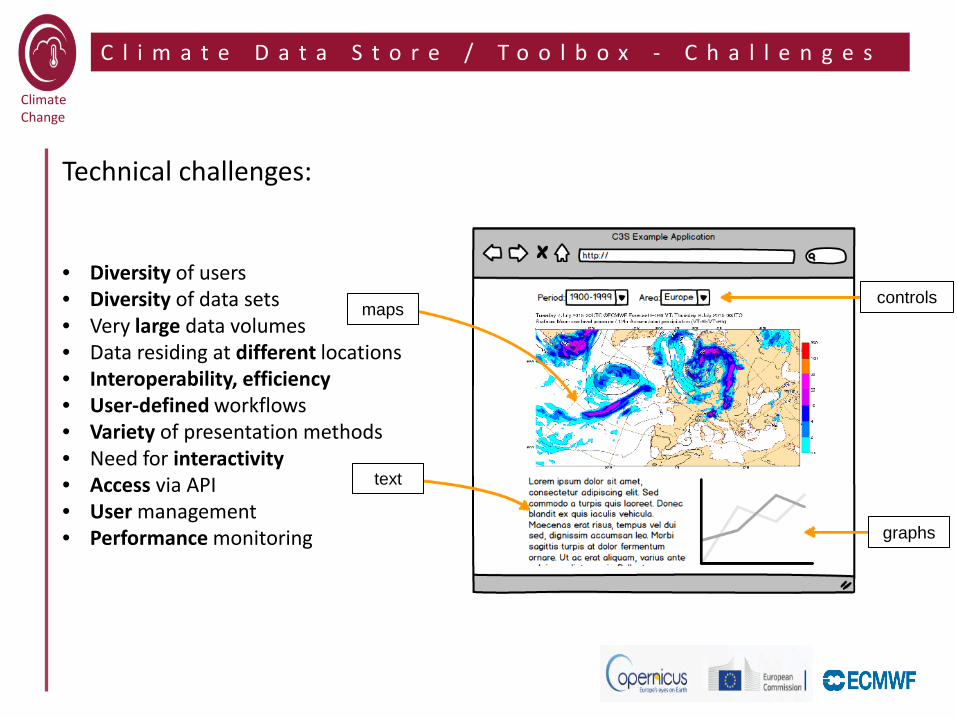
Technical challenges: • Diversity of users • Diversity of data sets • Very large data volumes • Data residing at different locations • Interoperability, efficiency • User-defined workflows • Variety of presentation methods • Need for interactivity • Access via API • User management • Performance monitoring
maps
text
controls
graphs

Climate Change
C l i m a t e D a t a S t o r e / T o o l b o x - W e b P o r t a l
Content Management System (articles, news, events, …)
Catalogue of products ISO19115, for interoperability with INSPIRE, GEOSS, WMO Information System, …
Toolbox
Catalogue of analytics tools that can be invoked on the data and products of the CDS
Describes algorithms and methods, input and output data, possible parameterization
Users’ settings Profiles, preferences, licenses, …
Users’ requests
Current and past users requests: data retrievals and computations Request management: monitor, cancel, download results
Climate Change
C l i m a t e D a t a S t o r e / T o o l b o x
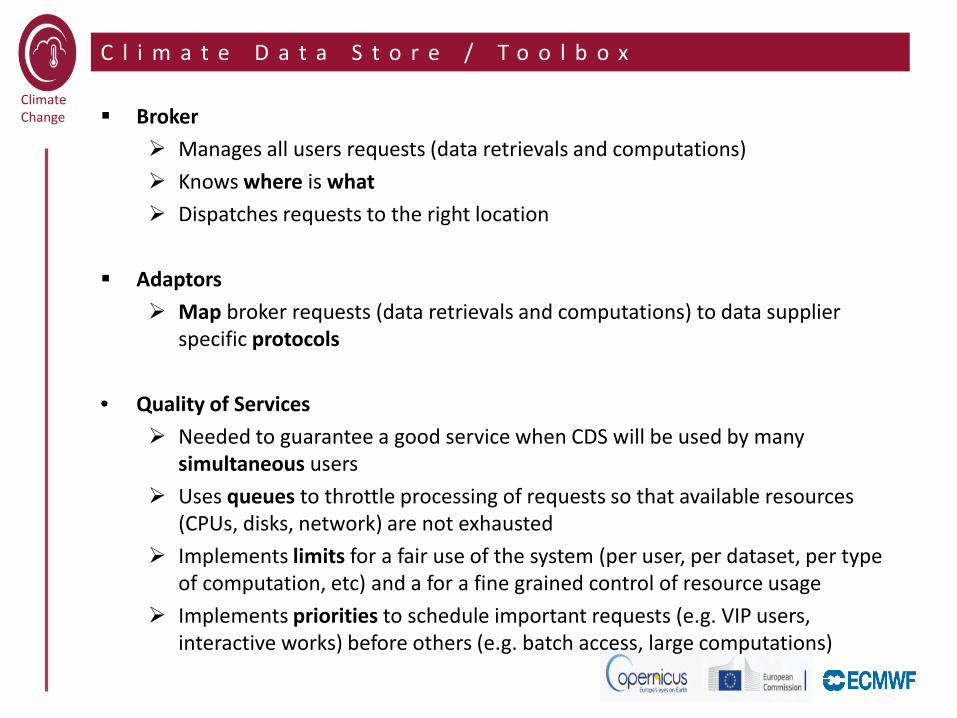
Broker Manages all users requests (data retrievals and computations) Knows where is what Dispatches requests to the right location
Adaptors
Map broker requests (data retrievals and computations) to data supplier specific protocols
• Quality of Services Needed to guarantee a good service when CDS will be used by many
simultaneous users Uses queues to throttle processing of requests so that available resources
(CPUs, disks, network) are not exhausted Implements limits for a fair use of the system (per user, per dataset, per type
of computation, etc) and a for a fine grained control of resource usage Implements priorities to schedule important requests (e.g. VIP users,
interactive works) before others (e.g. batch access, large computations)

Climate Change
C l i m a t e D a t a S t o r e T o o l b o x
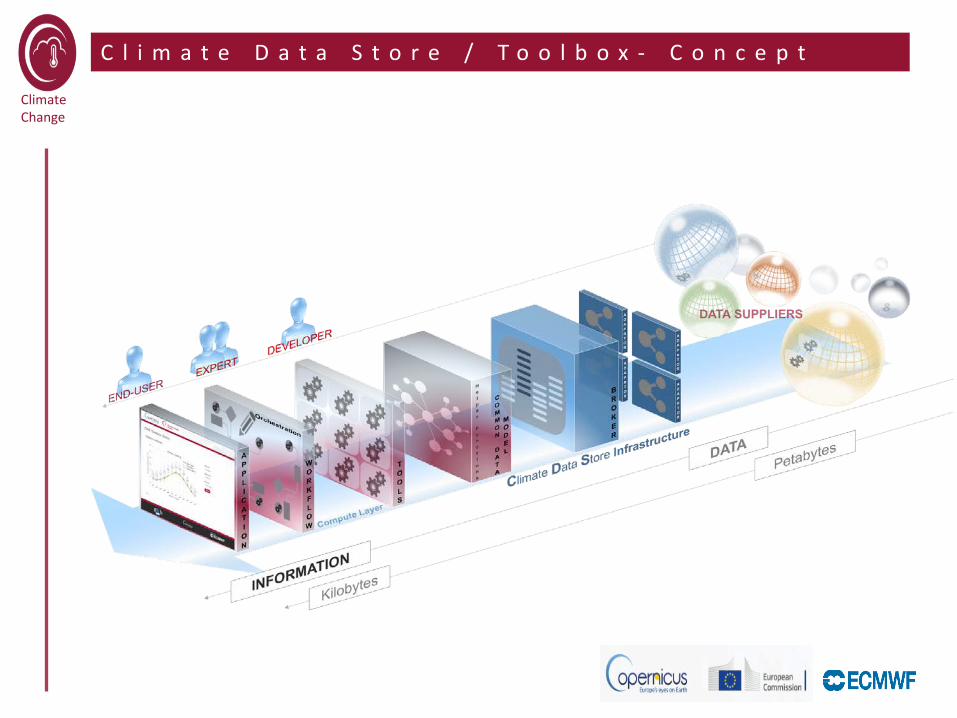
The Toolbox will be composed of: Tools that perform basic operations on data, such as the computation of
statistics, sub-setting, averaging, value at points, etc. Workflows that combine tools by chaining them so that the output of some
tools is used as input to others Applications that make use of workflows and selected data and products of
the CDS, to build interactive web-pages allowing end-users to interact with the CDS
A Toolbox Compute layer: When possible tools will be executed next to the data (at the data suppliers) Otherwise, computations will be performed in a dedicated compute layer Use of cloud technologies will be considered Compute layer will also hold intermediate results
Climate Change
C l i m a t e D a t a S t o r e / T o o l b o x
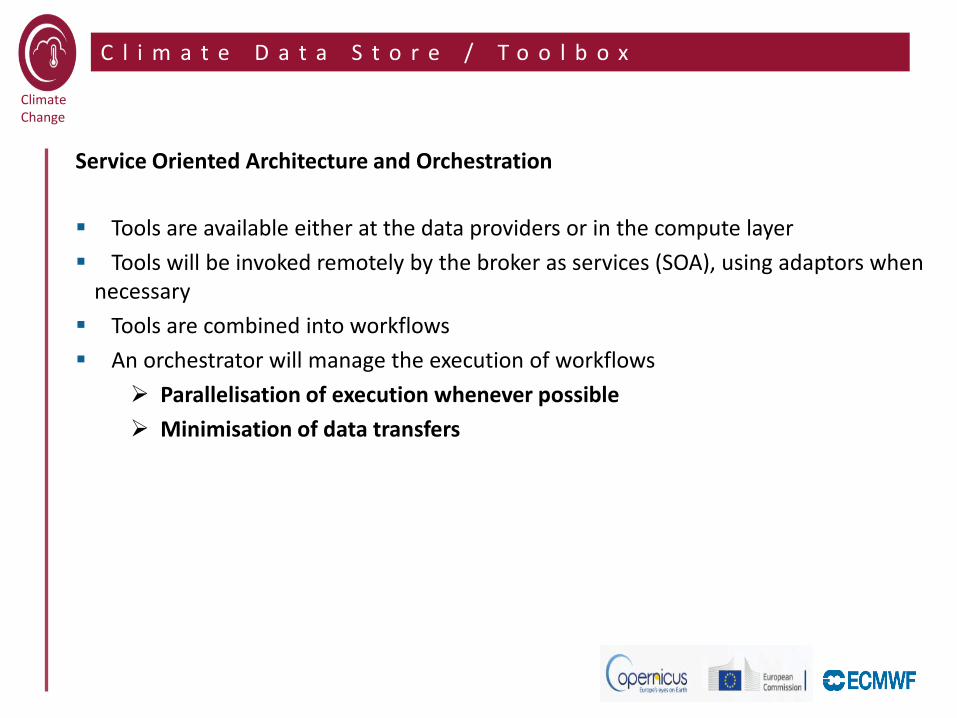
Service Oriented Architecture and Orchestration
Tools are available either at the data providers or in the compute layer Tools will be invoked remotely by the broker as services (SOA), using adaptors when
necessary Tools are combined into workflows An orchestrator will manage the execution of workflows
Parallelisation of execution whenever possible Minimisation of data transfers
Climate Change
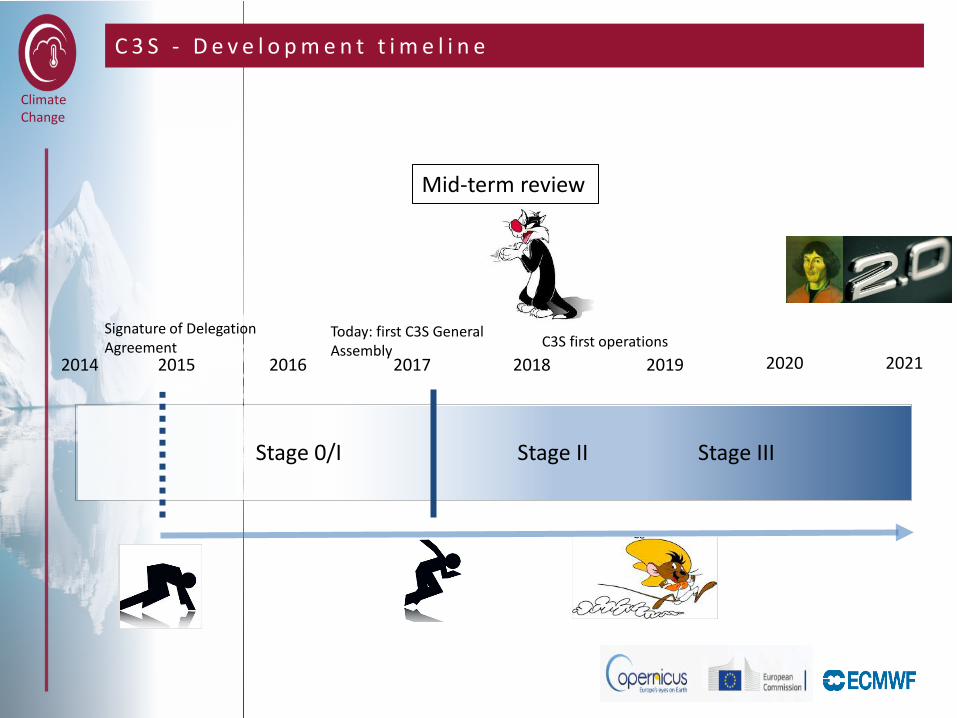
C 3 S - D e v e l o p m e n t t i m e l i n e
Stage 0/I Stage II Stage III
2014 2015 2016 2017 2018 2019 2020 2021
Mid-term review
Signature of Delegation Agreement
Today: first C3S General Assembly C3S first operations

Climate Change
C l i m a t e D a t a S t o r e / T o o l b o x - T i m e l i n e
KO Sprint 0 Sprints 1-6 Sprints 7-13 6
Sep
16
04 O
ct 1
6
SC1 End
30
Sep
17
5 Se
p 16
Initial Product Backlog
Development Environment
Roadmap Release 0.1
Roadmap Release 1.0
Q1 Review
v0.1 Review
v1.0 Review
4 weeks 6 x 4 weeks 6 x 4 weeks
Review Meetings (at ECMWF)
04 M
ar 1
7
We are here

Climate Change
C l i m a t e D a t a S t o r e / T o o l b o x
Development and environment tools Programming languages: Python and Javascript Virtualisation technology: Docker / OpenStack (From infrastructure) Scientific Python packages: NumPy, SciPy, Pandas Climate community software tools: Metview, Magics, CDO, NCL,
NCO,GDAL, .. Web Framework: React, D3 Software quality: pycodestyle, pyflakes, mypy


